the Creative Commons Attribution 4.0 License.
the Creative Commons Attribution 4.0 License.
 | 24 Jan 2018
Wind and wave dataset for Matara, Sri Lanka
Yao Luo
Dongxiao Wang
Tilak Priyadarshana Gamage
Fenghua Zhou
Charith Madusanka Widanage
Taiwei Liu
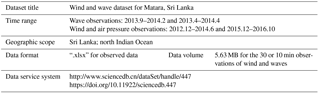
We present a continuous in situ hydro-meteorology observational dataset from a set of instruments first deployed in December 2012 in the south of Sri Lanka, facing toward the north Indian Ocean. In these waters, simultaneous records of wind and wave data are sparse due to difficulties in deploying measurement instruments, although the area hosts one of the busiest shipping lanes in the world. This study describes the survey, deployment, and measurements of wind and waves, with the aim of offering future users of the dataset the most comprehensive and as much information as possible. This dataset advances our understanding of the nearshore hydrodynamic processes and wave climate, including sea waves and swells, in the north Indian Ocean. Moreover, it is a valuable resource for ocean model parameterization and validation. The archived dataset (Table 1) is examined in detail, including wave data at two locations with water depths of 20 and 10 m comprising synchronous time series of wind, ocean astronomical tide, air pressure, etc. In addition, we use these wave observations to evaluate the ERA-Interim reanalysis product. Based on Buoy 2 data, the swells are the main component of waves year-round, although monsoons can markedly alter the proportion between swell and wind sea. The dataset (Luo et al., 2017) is publicly available from Science Data Bank (https://doi.org/10.11922/sciencedb.447).
- Article
(1847 KB) - Full-text XML
- BibTeX
- EndNote


Ocean observational data are difficult to obtain but are needed for model validation and data assimilation. Specifically, wind and wave observational data are of great importance for the study of ocean surface mixing, local air–sea interactions, coastal hydrodynamic characteristics, sediment movement, monsoon studies, and ocean engineering.
In this study, wind and wave observational datasets were simultaneously collected in a nearshore area off Matara, Sri Lanka. Matara is the southernmost city of the Indian Peninsula and is bordered by the northern Indian Ocean. The northern Indian Ocean is an important area for studying swells in the global wave climate, which persistently form in the southern oceans owing to the absence of land barriers (Alves, 2006). In addition, Sri Lanka is a good observation point for the southern Asian monsoon. Many wind and wave observations have been made in the Bay of Bengal (Glejin et al., 2013a; Nayak et al., 2013) and Arabian Sea (Aboobacker et al., 2011a; Glejin et al., 2013b); however, investigations of wind and waves in the waters south of Sri Lanka, which hosts one of the busiest shipping lanes in the world, are scarce.
Although datasets from reanalysis projects (Semedo et al., 2010) and models (Sabique et al., 2012; Bhaskaran et al., 2014; Murty et al., 2014) are increasingly common, in situ observations (Rapizo et al., 2015) remain the most important reflections of the “true” ocean and atmosphere state. Therefore, most major developments in the marine and atmospheric sciences have been closely related to the development of in situ observations.
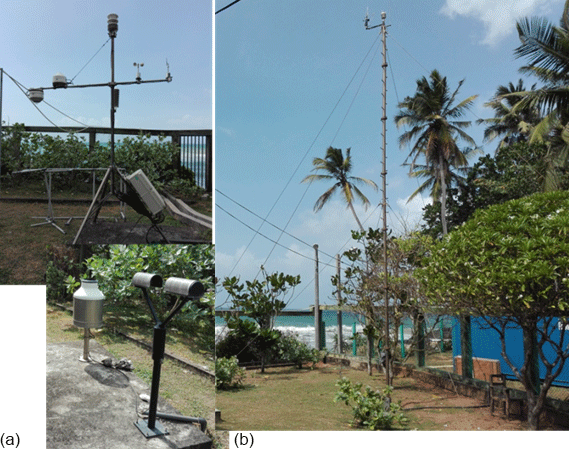
The wind and wave dataset (Table 2) presented herein was collected from an automated weather station (AWS) and wave buoys in the south of Sri Lanka (see Fig. 1 for locations). Construction of the observation system, which includes a 25 m meteorological tower and an acoustic sounder, began in 2011 and is ongoing. To date, a variety of marine atmospheric parameters have been measured, including temperature, air pressure, rainfall, wind, wave, and tide. Data from this observational system will be available for monsoon, air–sea interactions, and coastal dynamics research.
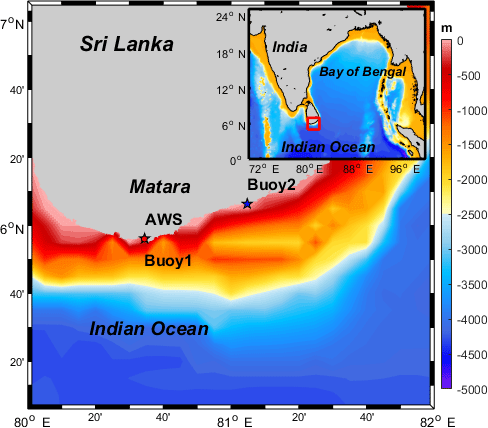
Figure 1Observation deployment locations and topography (m). The distance between AWS and Buoy1 is less than 1000 m.
The wind and wave dataset for Matara, Sri Lanka, consists of data obtained mainly from two different observation systems: the AWS and wave buoys.
Table 2 shows the details of the dataset and Fig. 1 shows the locations of the instruments. After rigorous quality control, the time series of wind, air pressure, and surface waves from the AWS, Buoy 1, and Buoy 2 were used to generate datasets with temporal resolutions of 30 min, 10 min, and 1 h, respectively. At the data collection stage, 24 elements were measured. It was necessary to rigorously control data quality for all elements. The main technical processes involved in generating the dataset are as follows:
-
calibration of all sensors,
-
transfer of a data in real time to a storage facility (to reduce or remove manual intervention),
-
error detection,
-
deviation testing and removal of records that deviate by > 3 standard deviations from the data mean.
To coincide with this publication, and in addition to the accompanying archived dataset spanning 2012–2016, unrestricted access is now available from a live online data repository located at http://www.sciencedb.cn/dataSet/handle/447. Contact details are provided to external organizations (to which the authors have no affiliation) to request additional wave spectra, tidal and wind parameters, or other elements of real-time observations after October 2016.
2.1 Data collection methods
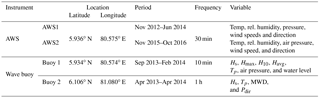
The data collected in southern Sri Lanka were taken from an integrated observation system that included the wave buoys (Buoy 1 and Buoy 2) and the AWSs (AWS1 and AWS2) (for details, see Fig. 2 and Table 2).
Buoy 1, which was anchored at the bottom of the sea at a depth of 20 m in September 2013, was operated normally and continuously to collect water level and wave data for about 5 months. Buoy 1 measured many types of non-directional wave parameters, as well as air pressure at the sea surface and water level. It was powered with a cable and accepted wave information with a pressure sensor, which was developed at the South China Sea Institute of Oceanology. Pressure data were recorded continuously at a rate of 1 Hz over 5 min. The data for every 10 min are processed as one record. At the location of Buoy 1, a new buoy will be installed in the near future.
Buoy 2, which measured both wave and water level for 1 year from April 2013 to April 2014, consists of two instruments, a self-contained wave buoy at a depth of 10 m and a water level gauge. To measure the waves, the instrument was set to a frequency of 2 Hz with a sampling period of 15 min. In addition, 15 min sampling was carried out at 1 h intervals. For water level measurements, sample recording was performed at 10 min intervals. Tide level was computed using the 10 min average of the pressure height data.
The seaside AWS (AWS1, Fig. 2) was installed in December 2012 and can measure meteorological parameters, including wind speed and direction, air temperature, air humidity, and air pressure at an elevation of 12 m. In December 2015, the AWS was upgraded and moved approximately 5 m, with all sensors installed at an elevation of 1.5 m (AWS2). The sampling frequency and parameters were based on AWS1, with the addition of a shortwave radiation sensor. AWS2 is still working and is planned to remain in operation indefinitely.
Since AWS1 and AWS2 collected wind speed at heights of 12 and 1.5 m, respectively, wind speed from the buoy (Wz) was transformed into wind speed at a 10 m elevation (W10) using the Prandtl 1∕7 law approximation (Streeter et al., 1998) with the equation
where z is the wind measurement height of the buoy.
2.2 Parameter descriptions
The dataset includes wind and wave data in Excel files. For Buoy 1, wave parameters were obtained directly using the zero-crossing method. The main wave parameters for Buoy 2 were obtained by calculating the wave spectrum.
The significant wave height (Hs, SWH) is given as
where mn is the nth moment of spectral density, Tm and Tz are the mean wave period and zero-crossing wave period, respectively.
The energy-averaged mean wave direction αm was determined as
where S(f) and α(f) are the directional distributions.
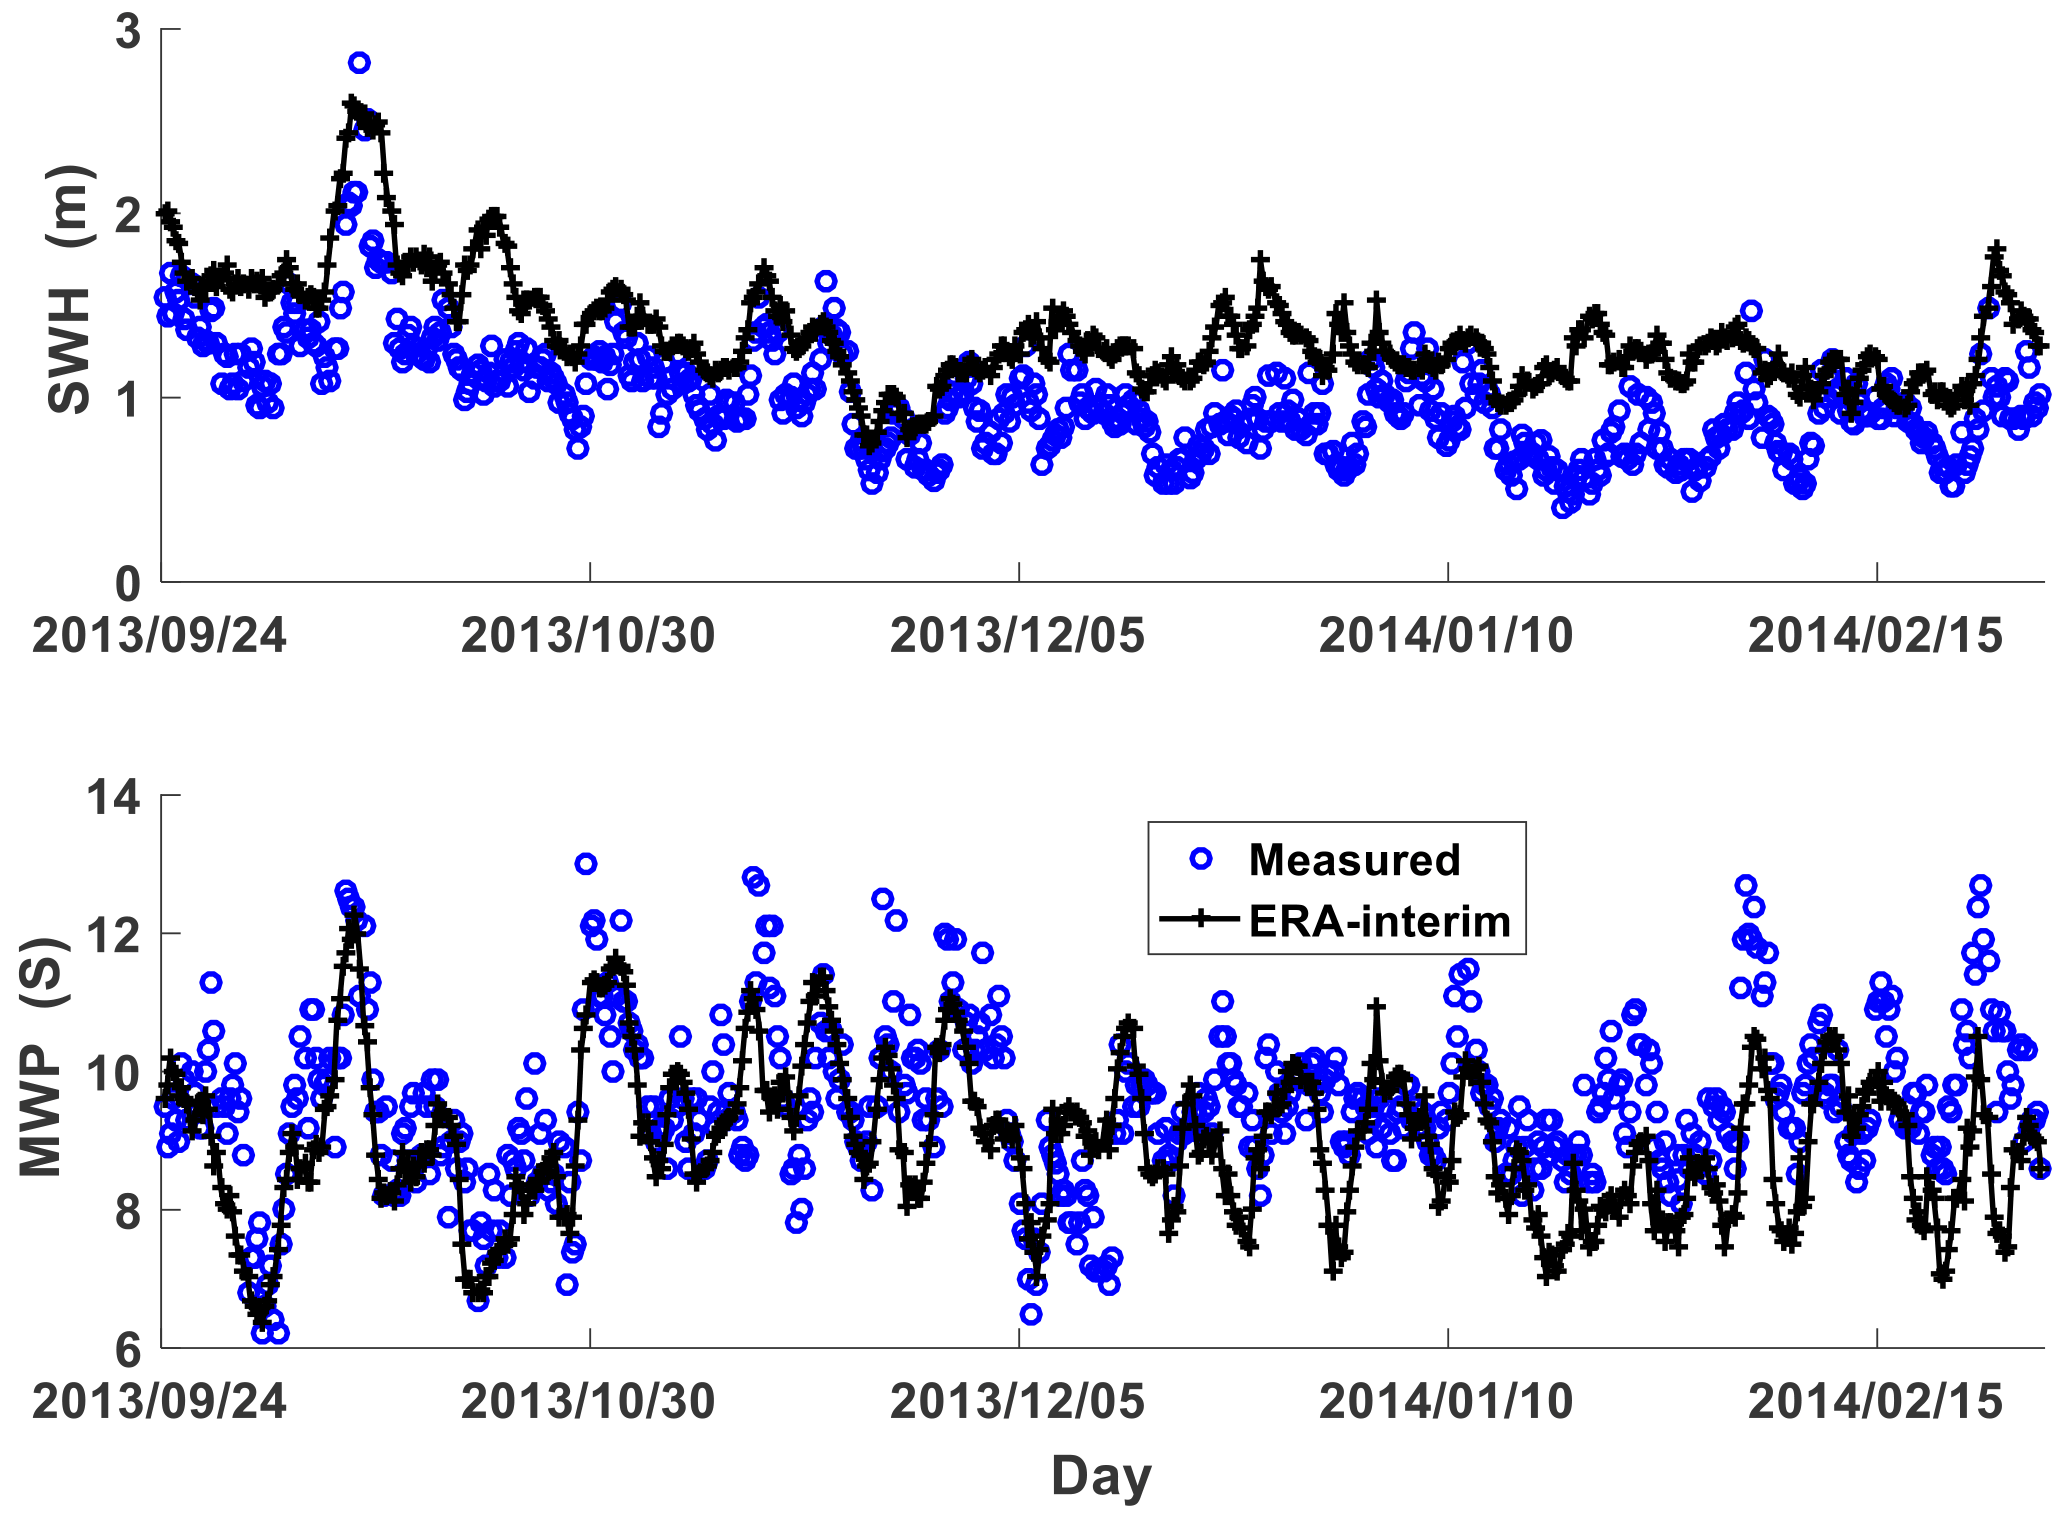
Figure 3Time series of significant wave height (SWH) and mean wave period (MWD) for 24 September 2013–28 February 2014 (Buoy 1).
To study the impact of climate change on oceans, long-term datasets are needed; however, the lengths of continuous wave records are usually only a few to tens of years. An important use of observational wave and wind data is model validation and assimilation. The ERA-Interim is based on the global atmospheric reanalysis product of the European Centre for Medium-Range Weather Forecasts and is available from 1979 onwards (Dee et al., 2011). It comprises long-term and continuous grid data and is useful for wave extreme values, long-term variability of wave climate, and monsoon studies. Relative to the ERA-40 system, ERA-Interim incorporates many important Integrated Forecast System improvements, such as model resolution and physics changes, the use of four-dimensional variational (4D-Var) assimilation, and various other changes in the analysis methodology (Dee and Uppala, 2008, 2009). Furthermore, a reduction in the root-mean-square error (RMSE) of Hs against buoy data makes it smaller than that in ERA-40 (Bidlot et al., 2007). By comparison with observation data, the accuracy of ERA-Interim reanalysis data can be assessed, providing the basis to quantify the monthly, inter-annual, and decadal variability of wind and wave climate.
Extensive inter-comparison and evaluation of wind stress estimates from the reanalysis data set (ERA-Interim) against available in situ observations have been performed for the tropical Indian Ocean (Kumar et al., 2011). The verification of Hs in the reanalysis dataset has been performed only for the Arabian Sea and Bay of Bengal (Shanas and Sanil Kumar, 2014; Shanas and Kumar, 2015). In the present study, the nearest available ERA-Interim Hs data were compared to the data measured from situ buoy data (Figs. 3, 4 and 5). The comparison of the reanalysis and measured Hs data shows a general mean correlation (correlation coefficient = 0.747) with a general mean RMSE of 0.435 m during both years. For the mean wave period (MWP), the mean correlation coefficient and mean RMSE are 0.618 and 1.084; therefore, there are significant errors in the measurements, especially for MWD. These could be caused by the complicated near-shore geometry and/or by the resolution of the large-scale ERA-Interim model, which is so low that it cannot describe changes in complex seabed terrain.
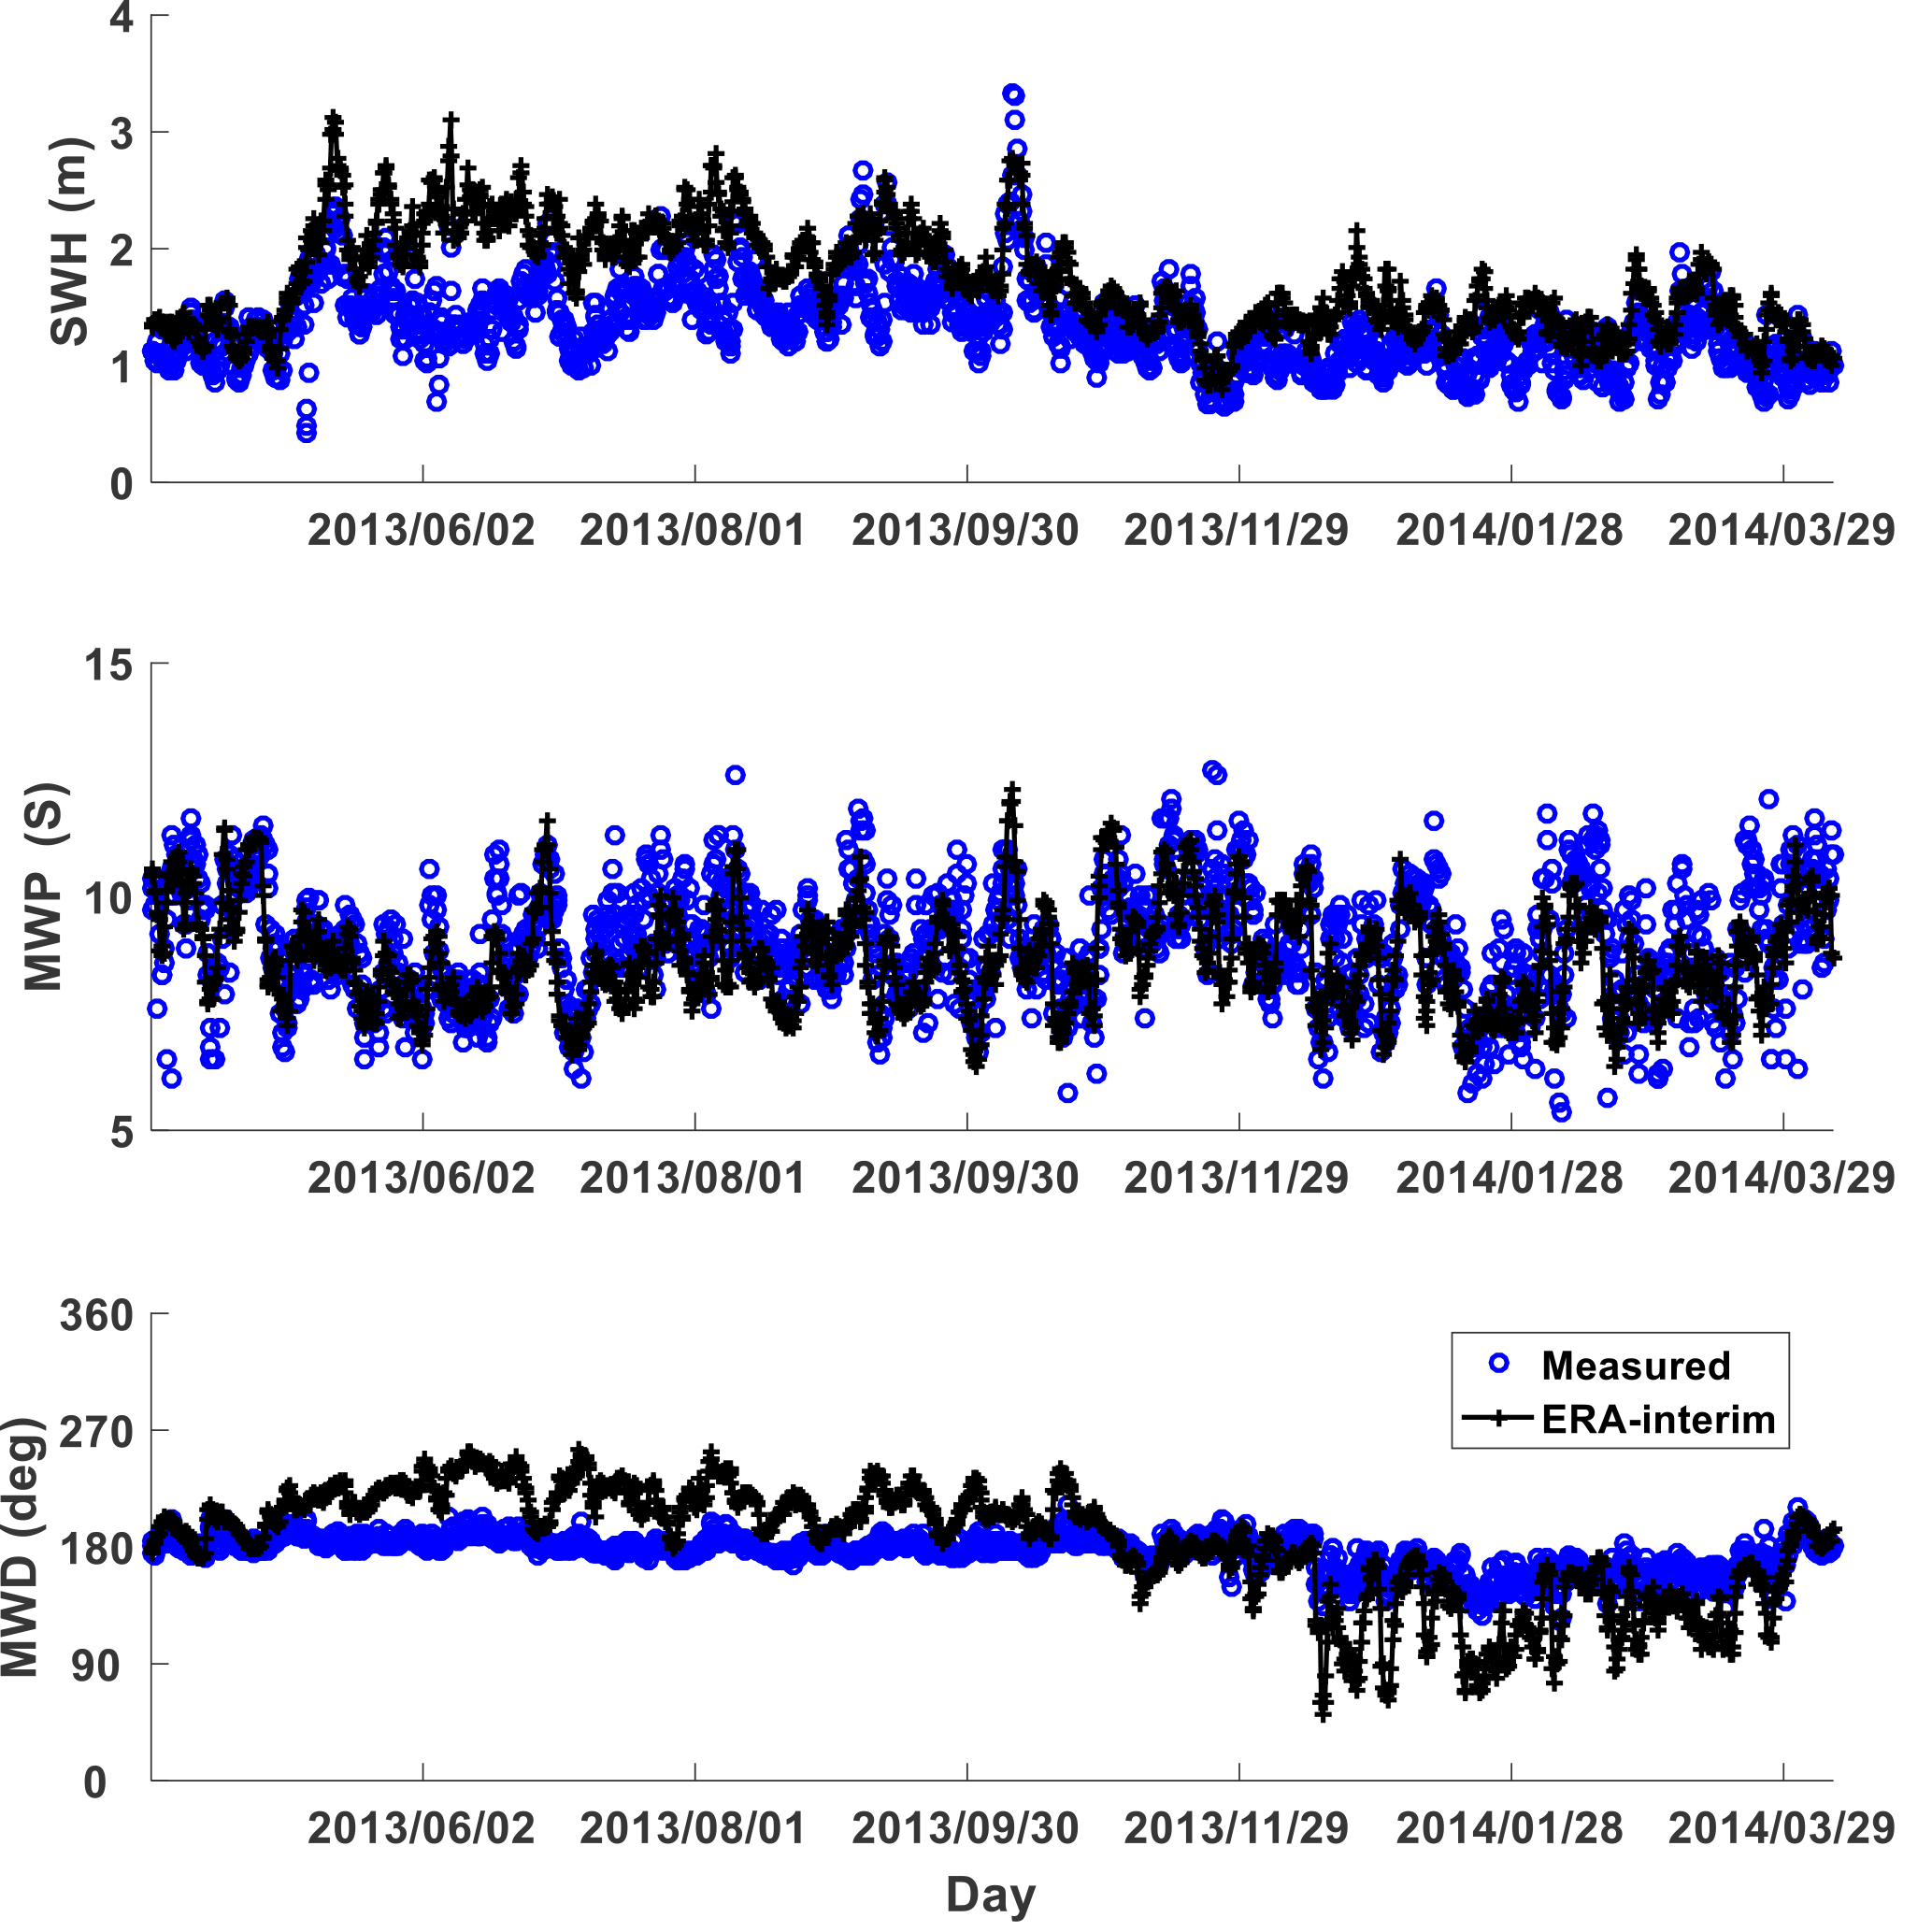
Figure 4Time series of significant wave height (SWH), mean wave period (MWP), and mean wave direction (MWD) for 3 April 2013–9 April 2014 (Buoy 2).
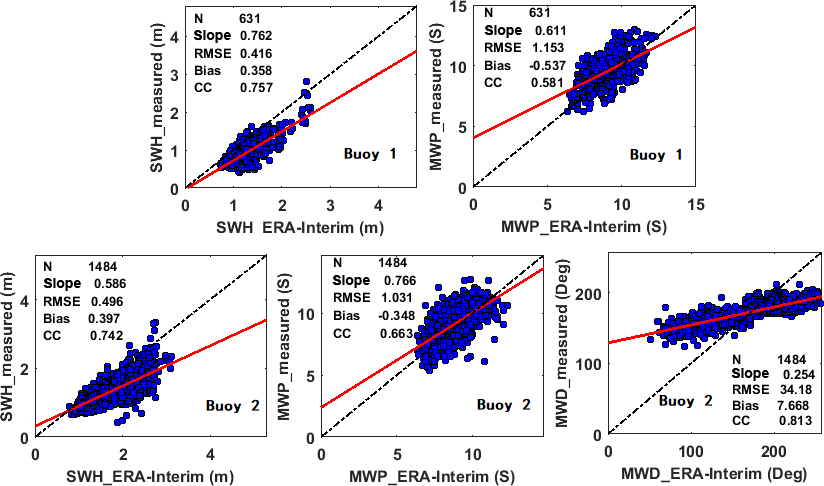
Figure 5Scatter plots of SWH and MWP from the ERA-Interim. The displayed statistics are N, number of samples; Slope, slope of least-squares regression; RMSE, root-mean-square error; Bias, bias; and CC, Pearson's correlation coefficient.
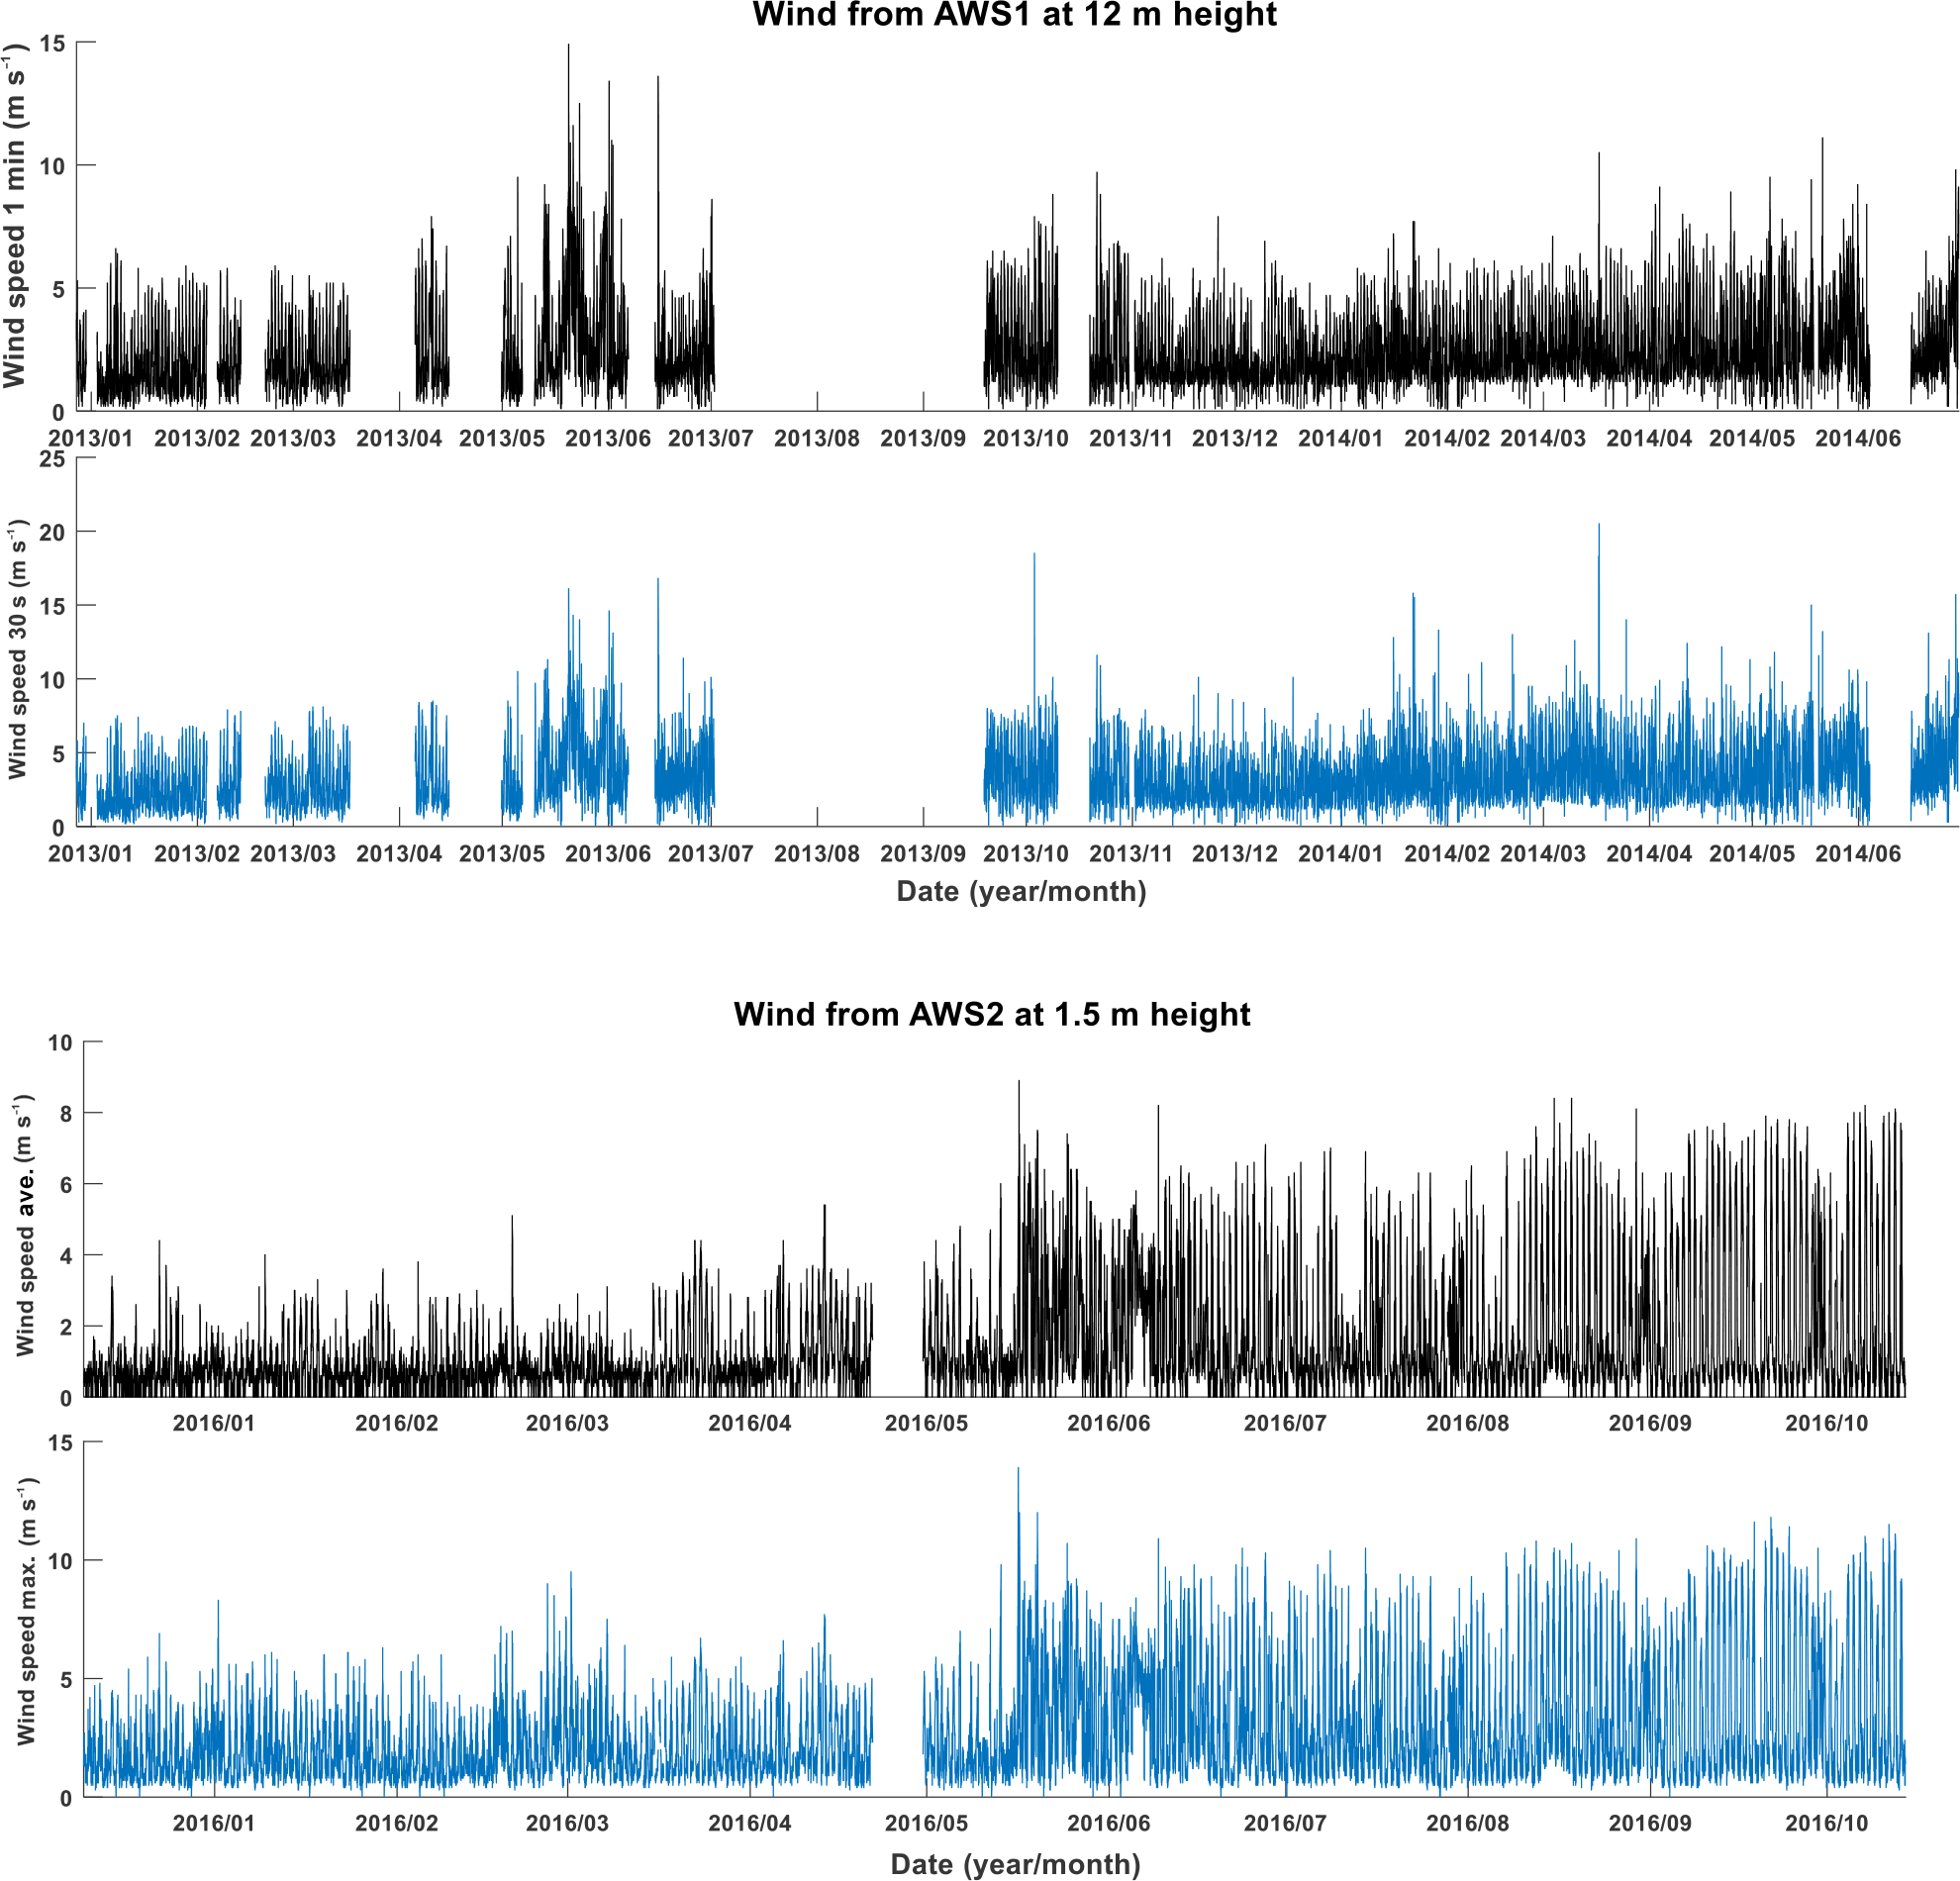
The wind is mainly controlled by northeast (NE) and southwest (SW) monsoons in the area. The wind speed and wind direction were measured at AWS1 and AWS2 (see Fig. 6 for the time series of wind speed). The maximum measured wind was 8.9 m s−1 and a maximum gust 13.9 m s−1. The wind sensors of AWS1 and AWS2 are located at heights of 12 and 1.5 m, respectively. Due to its high position, the coastal orography had no apparent impact on AWS1. However, for AWS2, the wind speed was small during NE monsoons and was clearly effected by the landform of the land to the north (see Fig. 1). During SW monsoons, the wind originated from sea and the effect was weak for AWS2. This explains the significantly lower wind speed during the winter months than the summer months (see Table 3). The monthly mean wind speed was the highest in September 2016 and lowest in December 2015 (Table 3).
Table 3Monthly average values for the averaged wind speed and maximum wind speed from AWS2 (WSA: averaged wind speed; WSM: maximum wind speed; num: the number of effective data points).
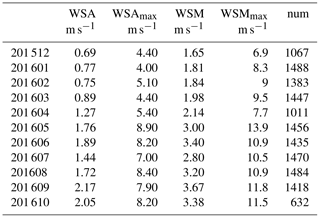

Figure 7Wave rose of significant wave height for Buoy 2. South waves accounted for 69.12 % of the total.
The data set was deposited in Science Data Bank, whose DOI is https://doi.org/10.11922/sciencedb.447. It can be downloaded publicly from http://www.sciencedb.cn/dataSet/handle/447.
The integrated rate of wave data in Buoy 2 is high (96.38 %); therefore, we investigated the characteristics of the wind sea and swell using the data from Buoy 2. The frequency range of the measured wave spectra was 0.026–0.3 Hz. The frequency associated with the peak energy is indicative of the dominant wave system over the region at that time. The wind sea and swell parameters were separated by frequency. Figure 8 shows the time series Hs, wind sea Hs, and swell Hs. Waves in the Indian Ocean vary in response to prevailing wind systems according to the month, and include inter-Monsoon-1 (IM1), SW monsoon (May–September), inter-Monsoon-2 (IM2) (October–November), and NE monsoon (December–February).
Table 4 shows the monthly dominance of swell and wind sea on wave energy. Swells are predominant (> 50 % in height) throughout the year. The maximum swell dominance is 77.6 %, which occurs in November. The role of wind seas is significant in January and May with a percentage dominance greater than 40 %, and the maximum wind seas dominance is 42.4 % in May. Annually, 66.1 % of the waves are dominated by swells. Even though swells are predominant year-round, wind seas contribute sufficiently to the resultant waves during the SW (35.18 %) and NE (36.7 %) monsoon seasons. During the inter-monsoon periods, wind weakening and wind sea strengthening are reduced accordingly. Waves from the south accounted for 69.12 % of all waves annually (Fig. 7), mainly driven by swells, which predominate throughout the year. As a result, the wave climate in this area is controlled mainly by long swells.
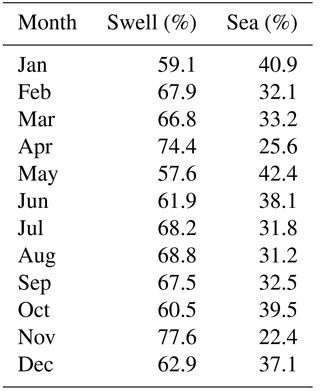
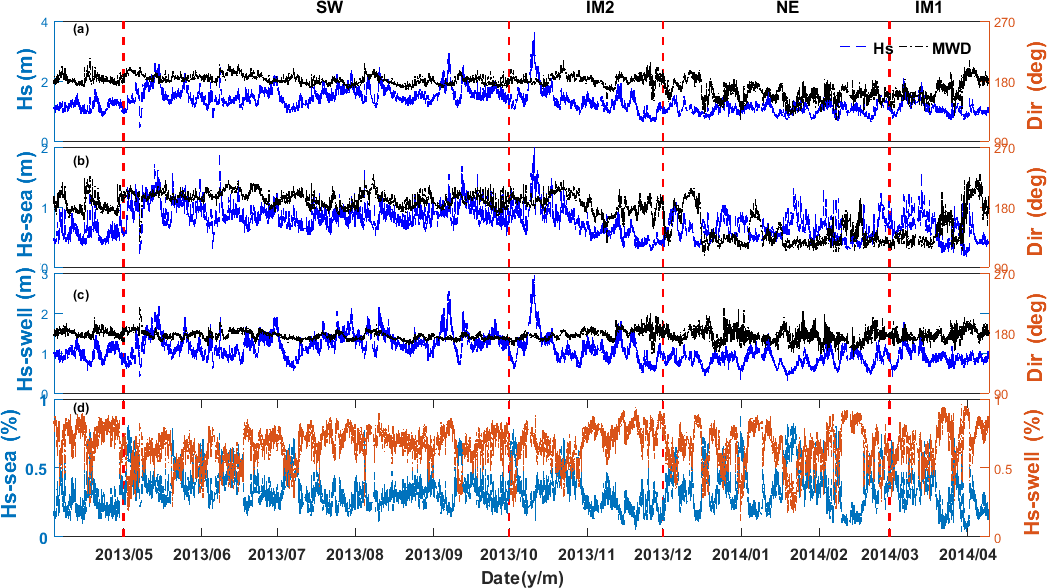
Figure 8Time series of (a) Hs, (b) mean wave direction for Hs, (c) wind sea and swell, and (d) the percentage dominance of wind sea and swell (Buoy 2).
From Fig. 8b, the wind sea directions are SW and NE. In the NE monsoon period, the wind sea Hs is less than that during the SW monsoon period. Regarding swells, the wave direction throughout the year is predominantly south, although there are some small fluctuations after the SW monsoons. However, as with wind sea, the Hs is greater in the SW monsoon period. These phenomena originate from a mixture of the geographic location of Buoy 2 and prevailing wind systems. Buoy 2 is almost completely unsheltered from the south. In the SW monsoon season, except for long waves from the Southern Ocean, strong winds and sufficient fetch allow swells to grow and evolve in the northern Indian Ocean. However, because Buoy 2 is located in the nearshore zone with a short fetch, wind sea during the NE monsoon season is weaker. The NE monsoon has an inhibitory effect on swells from the south; therefore, there are small fluctuations in wave direction, and Hs is reduced during the NE monsoon season.
The unique geographic location of Sri Lanka to the south of the Indian Peninsula yields a different wave climate from those in the Bay of Bengal (Glejin et al., 2013a, b) and Arabian Sea (Aboobacker et al., 2011a, b), which are also located in the northern Indian Ocean and experience the same prevailing wind systems. Compared with the above two water bodies, swells have a larger impact on wind sea.
YL and DW designed the study and wrote the manuscript. YL, FZ, TPG, CMW, and TL performed the data collection, quality control, generation, and validation.
The authors declare that they have no conflict of interest.
We thank the China-Sri Lanka Joint Center for Education and Research for
providing the hydro-meteorology observations. We also gratefully acknowledge
the European Centre for Medium-Range Weather Forecasts Science Team for
providing the ERA-Interim dataset. The work is supported by the Major State
Research Development Program of China (2016YFC1402603) and the International
Partnership Program of the Chinese Academy of Sciences (grant
no. 131551KYSB20160002).
Edited by:
Giuseppe M. R. Manzella
Reviewed by: two anonymous referees
Aboobacker, V. M., Rashmi, R., Vethamony, P., and Menon, H. B.: On the dominance of pre-existing swells over wind seas along the west coast of India, Cont. Shelf Res., 31, 1701–1712, 2011a.
Aboobacker, V. M., Vethamony, P., and Rashmi, R.: “Shamal” swells in the Arabian Sea and their influence along the west coast of India, Geophys. Res. Lett., 38, 1–7, 2011b.
Alves, J. H. G. M.: Numerical modeling of ocean swell contributions to the global wind-wave climate, Ocean Model., 11, 98–122, 2006.
Bhaskaran, P. K., Gayathri, R., Murty, P. L. N., Bonthu, S. R., and Sen, D.: A numerical study of coastal inundation and its validation for thane, cyclone in the Bay of Bengal, Coast. Eng., 83, 108–118, 2014.
Bidlot, J., Janssen, P., and Abdalla, S.: A revised formulation of ocean wave dissipation and its model impact, in: Technical Report Memorandum 509, ECMWF, 2007.
Dee, D. P. and Uppala, S. M.: Variational bias correction in ERAInterim, Technical Memorandum No. 575, ECMWF: Reading, UK, available at: https://www.ecmwf.int/sites/default/files/elibrary/2008/8936-variational-bias-correction-era-interim.pdf, 2008.
Dee, D. P. and Uppala, S.: Variational bias correction of satellite radiance data in the era-interim reanalysis, Q. J. Roy. Meteor. Soc., 135, 1830–1841, 2009.
Dee, D. P., Uppala, S. M., Simmons, A. J., Berrisford, P., Poli, P., Kobayashi, S., Andrae, U., Balmaseda, M. A., Balsamo, G.,Bauer, P., Bechtold, P., Beljaars, A. C. M., van de Berg, L., Bidlot, J., Bormann, N., Delsol, C., Dragani, R., Fuentes, M., Geer, A. J., Haimberger, L., Healy, S. B., Hersbach, H., Hólm, E. V., Isaksen, L., Kållberg, P., Köhler, M., Matricardia, M., McNally, A. P., Monge-Sanz, B. M., Morcrette, J.-J., Park, B.-K., Peubey, C., de Rosnay, P., Tavolato, C., Thépaut, J.-N., and Vitart, F: The era-interim reanalysis: configuration and performance of the data assimilation system, Q. J. Roy. Meteor. Soc., 137, 553–597, 2011.
Glejin, J., Kumar, V. S., and Nair, T. M. B.: Monsoon and cyclone induced wave climate over the near shore waters off Puduchery, south western Bay of Bengal, Ocean Eng., 72, 277–286, 2013a.
Glejin, J., Sanil Kumar, V., Balakrishnan Nair, T. M., and Singh, J.: Influence of winds on temporally varying short and long period gravity waves in the near shore regions of the eastern Arabian Sea, Ocean Sci., 9, 343–353, https://doi.org/10.5194/os-9-343-2013, 2013b.
Kumar, B. P., Vialard, J., Lengaigne, M., Murty, V. S. N., and McPhaden, M. J.: TropFlux: air-sea fluxes for the global tropical oceans-description and evaluation, Clim. Dynam., 38, 1521–1543, 2011.
Luo, Y., Wang, D., Priyadarshana Gamage, T., Zhou, F., Widanage, C. M., and Liu, T.: A wind & wave dataset at Matara, Sri Lanka, Science Data Bank, https://doi.org/10.11922/sciencedb.447, 2017.
Murty, P. L. N., Sandhya, K. G., Bhaskaran, P. K., Jose, F., Gayathri, R., Nair, T. M. B., Srinivasa Kumar, T., and Shenoi, S. S. C.: A coupled hydrodynamic modeling system for PHAILIN cyclone in the Bay of Bengal, Coast. Eng., 93, 93, 71–81, 2014.
Nayak, S., Bhaskaran, P. K., Venkatesan, R., and Dasgupta, S.: Modulation of local wind-waves at Kalpakkam from remote forcing effects of southern ocean swells, Ocean Eng., 64, 23–35, 2013.
Rapizo, H., Babanin, A. V., Schulz, E., Hemer, M. A., and Durrant, T. H.: Observation of wind-waves from a moored buoy in the southern ocean, Ocean Dynam., 65, 1275–1288, 2015.
Sabique, L., Annapurnaiah, K., Nair, T. M. B., and Srinivas, K.: Contribution of southern Indian Ocean swells on the wave heights in the northern Indian Ocean – a modeling study, Ocean Eng., 43, 113–120, 2012.
Semedo, A., Sušelj, K., Rutgersson, A., and Sterl, A.: A global view on the wind sea and swell climate and variability from ERA-40, J. Climate, 24, 1461–1479, 2010.
Shanas, P. R. and Kumar, V. S.: Trends in surface wind speed and significant wave height as revealed by ERA-Interim wind wave hindcast in the Central Bay of Bengal, Int. J. Climatol., 35, 2654–2663, https://doi.org/10.1002/joc.4164, 2015.
Shanas, P. R. and Sanil Kumar, V.: Temporal variations in the wind and wave climate at a location in the eastern Arabian Sea based on ERA-Interim reanalysis data, Nat. Hazards Earth Syst. Sci., 14, 1371–1381, https://doi.org/10.5194/nhess-14-1371-2014, 2014.
Streeter, V. L., Wylie, E. B., and Bedford, K. W.: Fluid Mechanics, McGraw-Hill, Singapore, 1998.