the Creative Commons Attribution 4.0 License.
the Creative Commons Attribution 4.0 License.
 | 02 Apr 2026
NortheastChinaSoybeanYield20m: an annual soybean yield dataset at 20 m in Northeast China from 2019 to 2023
Jingyuan Xu
Xin Du
Taifeng Dong
Qiangzi Li
Yuan Zhang
Hongyan Wang
Jing Xiao
Jiashu Zhang
Yunqi Shen
Yong Dong
Accurate monitoring of crop yield is critical for ensuring food security. While various yield datasets covering Northeast China exist, they were produced at a coarse spatial resolution and remain inadequate for capturing small-scale spatial heterogeneity. Current yield estimation methods, such as machine learning models and the assimilation of remotely sensed biophysical variables into crop growth models, are heavily reliant on ground observations and are computationally expensive. To address these limitations, we propose a hybrid framework that couples the World Food Studies Simulation Model (WOFOST) and a Gated Recurrent Unit (GRU) model to generate a high-resolution (20 m) soybean yield dataset in Northeast China from 2019 to 2023 (NortheastChinaSoybeanYield20m). First, to generate a comprehensive training dataset, WOFOST was employed to simulate diverse soybean growth scenarios by accounting for variations in climate, crop varieties, soil types and agro-management practices. The GRU model was then trained to establish the relationships between model-simulated leaf area index (LAI) and soybean yield. The trained model was applied to estimate soybean yield in Northeast China using two stage-averaged LAI variables derived from Sentinel-2, which were validated as a feasible alternative to time-series LAI. The accuracy of estimates was evaluated using in situ measurements and government statistical data. The overall root mean squared error (RMSE) was 287.44 and 272.36 kg ha−1 at the field and regional scales, respectively. The model exhibited consistent interannual stability, with mean relative errors (MREs) averaging 11.46 % and 7.94 % at the municipal and provincial scales, respectively. The dataset effectively captured spatiotemporal yield variability, offering potential for optimizing soybean production, guiding precision agriculture practices, and informing agricultural policy. The NortheastChinaSoybeanYield20m dataset is publicly available at https://doi.org/10.5281/zenodo.14263103 (Xu et al., 2024).
- Article
(20689 KB) - Full-text XML
- BibTeX
- EndNote


Soybean is a crucial crop for both food and oil production, providing more than a quarter of the world's edible protein (Graham and Vance, 2003). Global demand for soybean is projected to increase by 46 % by 2050, driven by rapid population growth (Falcon et al., 2022). As a major traded agricultural commodity, soybean production in key exporting nations has wide-reaching effects on international markets, and can significantly influence agricultural economies worldwide (Qiao et al., 2023). Notably, China is the world's largest consumer of soybeans (FAOSTAT, 2022), and its soybean demand relies heavily on international trade (Zhao et al., 2023a). Consequently, accurate monitoring of soybean yield is vital for promoting sustainable agriculture, ensuring food security, and maintaining economic stability from regional to global scales. Moreover, effective yield monitoring and mapping support farmers by informing field management practices, bolstering agricultural insurance and enhancing poverty alleviation initiatives (Zhuo et al., 2022).
Remote sensing data provide time-series observations for crop yield estimation across multiple scales (e.g., field, regional and national) (Dong et al., 2020; Hunt et al., 2019; Zhao et al., 2023b). Current methodologies for yield estimation can be broadly categorized as data-driven or knowledge-driven approaches.
Data-driven methods leverage satellite-derived variables such as leaf area index (LAI), fraction of absorbed photosynthetically active radiation (FAPAR), and vegetation indices (VIs) to establish linear or nonlinear relationships with measured crop yield (Ang et al., 2022; Xie et al., 2019). Machine learning algorithms such as Random Forest (RF) and Artificial Neural Networks (ANN), due to their ability to process large datasets and model complex nonlinear interactions, have been widely applied in crop yield estimation (Pang et al., 2022; Tian et al., 2021; Yildirim et al., 2022). These methods can extract effective information from multi-source structured or unstructured data without manual intervention. However, they are heavily reliant on extensive ground-truth training data, which is challenging to collect over large areas and at high temporal frequency (Cao et al., 2021). Additionally, these models often overlook the impacts of environmental factors on crop growth, such as the influence of early-season soil moisture on root establishment or the effect of high temperatures during flowering on pod set, and lack interpretability, as they cannot explain the causal relationship between input features and outputs, leading to poor spatial-temporal generalization (Gevaert, 2022).
In contrast, knowledge-driven crop growth models simulate crop development from sowing to harvest based on agronomic mechanisms (Kaur and Singh, 2020). Common model types include light-use efficiency models (e.g., SAFY, Duchemin et al., 2008), soil-driven models (e.g., AquaCrop, Steduto et al., 2009), and atmospheric-driven models (e.g., WOFOST, Diepen et al., 1989). These models integrate environmental factors (e.g., climate conditions and soil characteristics) with crop physiological processes (Gaso et al., 2024). Climate variables like temperature, precipitation, and solar radiation are critical in regulating essential physiological processes such as photosynthesis, respiration and transpiration, which influence the rate and duration of crop growth stages (Misaal et al., 2023). Climate anomalies during specific growth stages may disrupt biochemical processes, ultimately affecting yield formation. Similarly, soil properties influence crop productivity by regulating water retention, aeration, and nutrient uptake (Muhuri et al., 2023). Despite their mechanistic rigor, applications of crop models over large areas are typically constrained by (1) insufficient spatial-temporal input data, and (2) parameter uncertainty, which can propagate errors into yield estimation (Dokoohaki et al., 2021). To overcome these challenges, data assimilation techniques that integrate remote sensing observations (e.g., LAI) into crop growth models have been developed to enhance spatial representativeness (Cao et al., 2025; Huang et al., 2024). However, high-resolution remote sensing data drastically increases computational cost, limiting the scalability of these approaches for regional or national mapping efforts (Huang et al., 2019).
Given the limitations above, integrating data-driven and knowledge-driven models has emerged as a critical strategy to enhance spatial-temporal generalization and mitigate sparse training data challenges in crop yield estimation. Hybrid frameworks coupling crop growth models with machine learning algorithms, such as those proposed and evaluated by Ren et al. (2023b) and Xie and Huang (2021), are gaining traction. These approaches utilize simulated outputs from crop growth models (e.g., meteorological, soil, crop physiological, and management factors) as inputs for machine learning, reducing reliance on limited ground observations. Many studies have demonstrated that hybrid methods can enhance yield estimation due to three benefits (Feng et al., 2020; Gaso et al., 2024; Ko et al., 2024). First, simulations from crop growth models can provide biophysical constraints to machine learning, ensuring agronomic plausibility. Second, the crop growth models generate synthetic training datasets to address data scarcity. Finally, machine learning improves the computational efficiency compared to traditional data assimilation techniques (Xie and Huang, 2021). However, existing studies generally extract input features (e.g., LAI and soil moisture) across the entire growth cycle or on coarse temporal scales, increasing computational costs of model calculation and obscuring stage-specific physiological responses (Pinke and Lövei, 2017; Wang et al., 2015). Additionally, while deep learning models, such as Long Short-Term Memory (LSTM) and GRU models excel at modelling temporal dependencies, their integration into hybrid frameworks has not been widely explored.
Although several recent soybean yield products have become available at national or regional scales, publicly available high-resolution soybean yield datasets for Northeast China remain limited, especially for applications requiring field-to-regional consistency and annual 20 m mapping. To address this, we developed a hybrid model coupling the WOFOST crop growth model with a GRU deep learning method to estimate soybean yield in Northeast China. The objectives include: (1) design a hybrid framework integrating WOFOST simulations with GRU-based feature extraction; (2) generate a high-resolution (20 m) soybean yield dataset in Northeast China (NortheastChinaSoybeanYield20m) from 2019 to 2023; (3) evaluate the accuracy of the dataset across field, municipal, and provincial scales using in situ and statistical benchmarks. The WOFOST model first simulated soybean growth using multi-parameter combinations (varying climate, soil, crop varieties and management conditions) to train the GRU model. The stage-based Sentinel-2 data, capturing soybean growth development, were then input into the GRU model to estimate yield. This approach prioritizes stage-specific physiological dynamics while balancing computational efficiency and spatial granularity, providing a critical advancement for scalable agricultural monitoring.
2.1 Study areas
The study was conducted in Northeast China (38°40′ to 53°34′ N, 115°05′ to 135°02′ E), encompassing Heilongjiang, Jilin, Liaoning provinces, as well as the eastern parts of the Inner Mongolia Autonomous Region (IMAR) (Fig. 1). The study area includes 40 cities and spans approximately 1.24×10⁶ km2. The region is characterized by a continental monsoon climate, with an annual accumulated temperature (≥10 °C) ranging from 2200 to 3600 °C (Pu et al., 2019), and a frost-free period of 140 to 170 d (Tan et al., 2014). The average annual precipitation exhibits a strong east-west gradient, decreasing from 1000 mm in the east to 350 mm in the west (Zhao et al., 2011). The predominant soil types include brown coniferous forest soil, dark brown forest soil, forest steppe chernozem and meadow grassland chernozem soil (Pu et al., 2019). Soybean is one of the three main crops in the region, primarily cultivated in the northern parts of the Songliao plain in rotation with maize. Notably, this region contributes around 64 % of China's total annual soybean production (National Bureau of Statistics of China (NBSC), 2023). Approximately 97 % of the soybean area in the region is rainfed (Guo et al., 2022; Yu et al., 2020), with the growing season typically spanning from May to late September (Zhao et al., 2021).
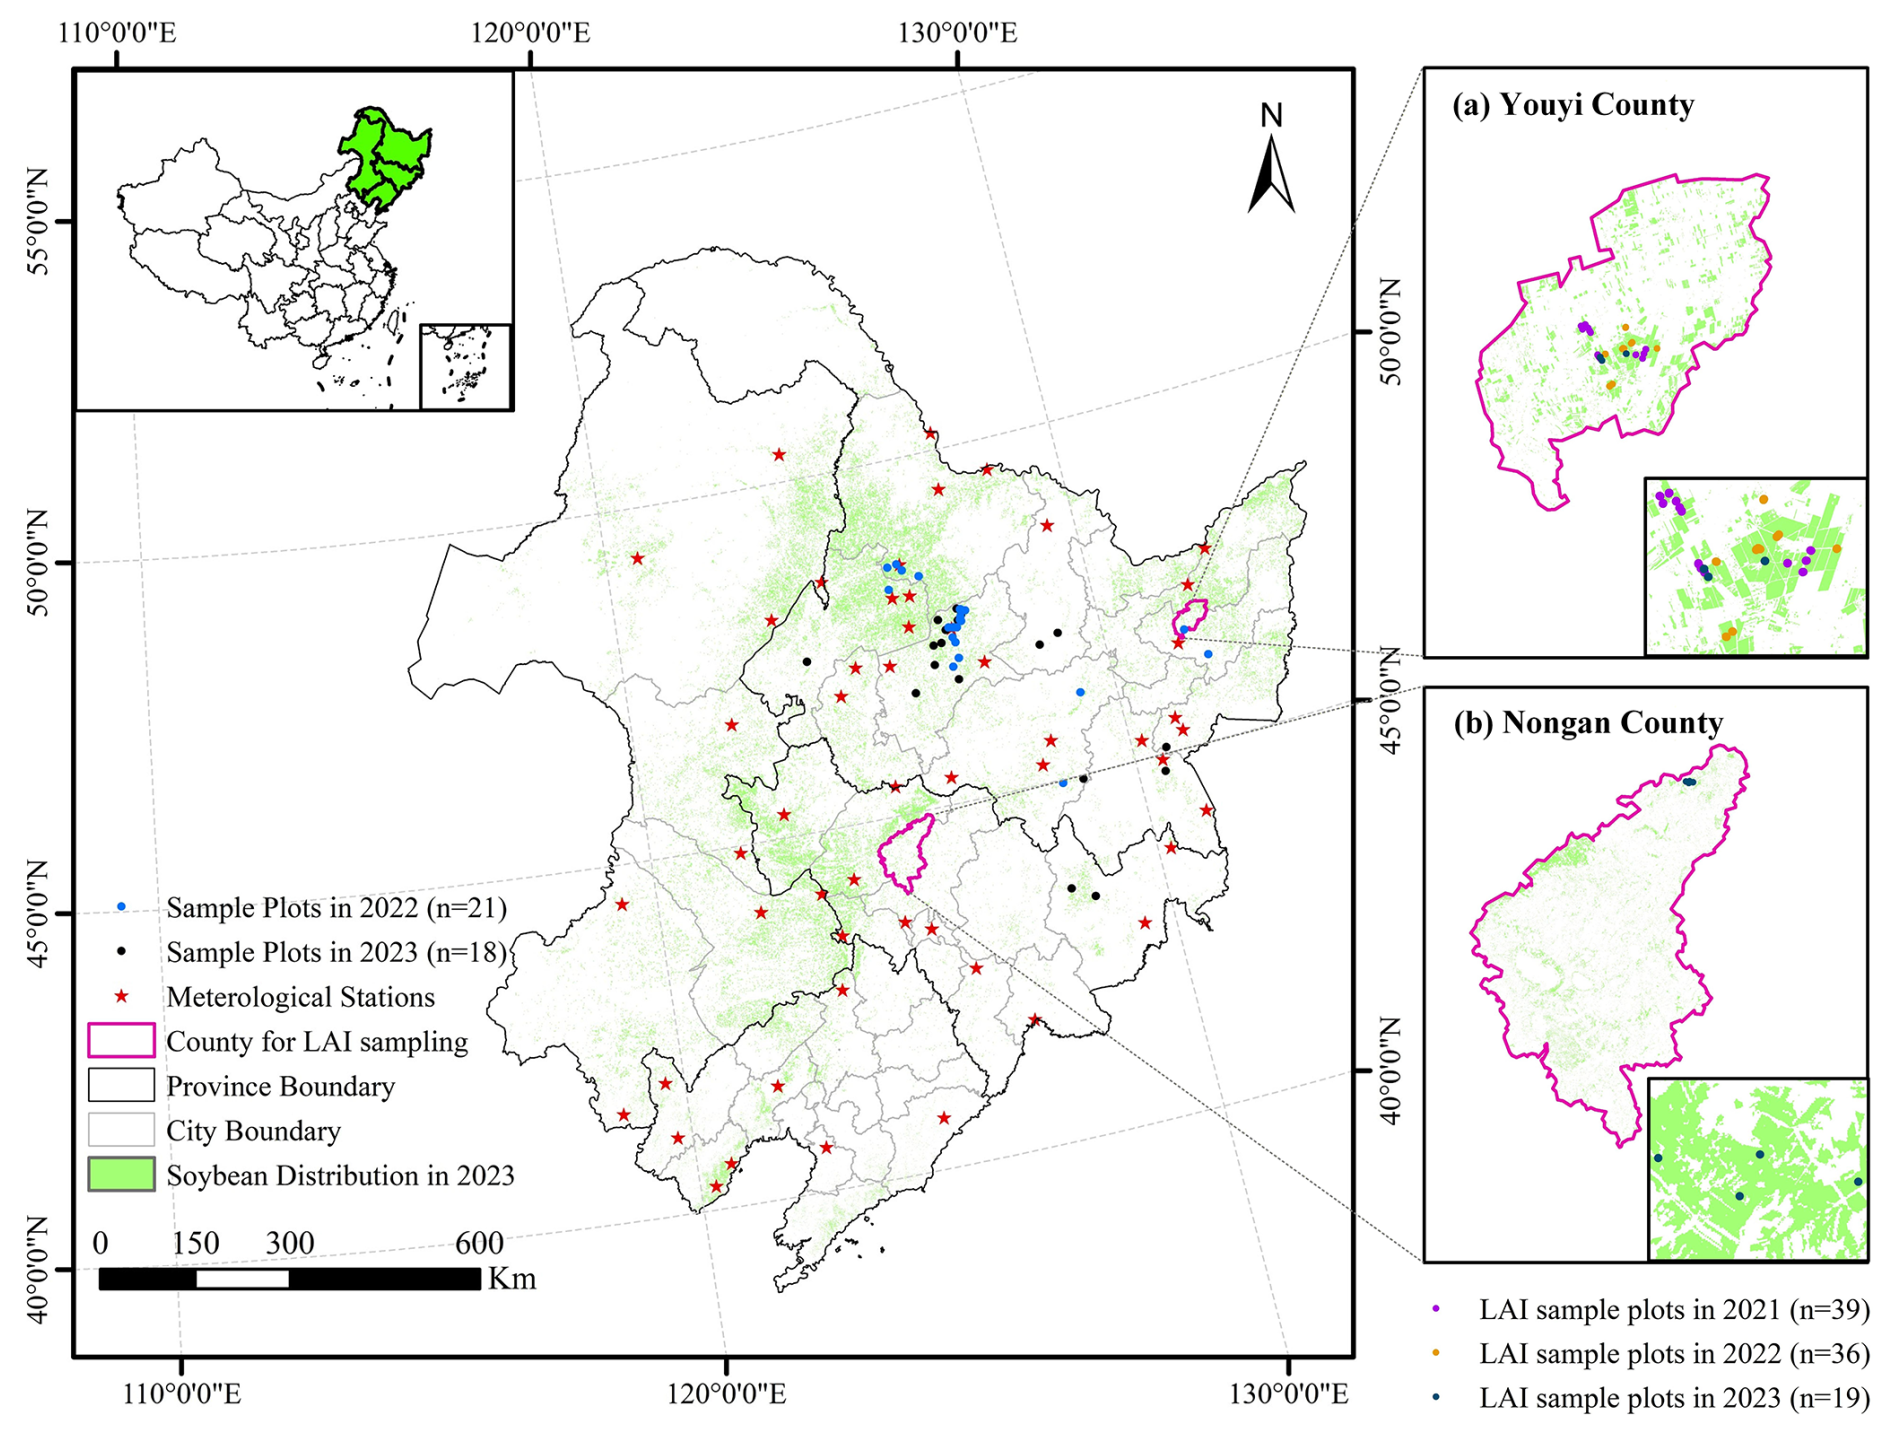
Figure 1Location of the study area, distribution of sample plots in 2022 and 2023, LAI sampling counties and selected meteorological stations. (a) and (b) display the detailed distribution of LAI sampling plots in Youyi and Nongan counties, respectively. The soybean distribution map was derived from Zhao et al. (2022), generated using a moment-preserving segmentation method with an overall accuracy exceeding 90 % for soybean in 2023 (see Sect. 2.2.5 for details).
2.2 Data collections
2.2.1 In situ measurement data
Due to limitations in resources and personnel, in situ measurements were not available during the earlier years (from 2019 to 2021). Field-scale yield data were separately collected through field investigation in September 2022 and 2023. In each year, a total of 21 and 18 sample plots were selected, respectively (Fig. 1). Within each sample plot that was around 100 m × 100 m in area, nine quadrats with area of 1 m × 1 m were selected randomly for destructive sampling of yield in soybean. The central location of each quadrat was recorded using a GPS device with an accuracy of 1 m. The harvested beans were then oven-dried for about 72 h in Hailun Agricultural Ecology Experimental Station, Chinese Academy of Sciences to determine the dry weight. Finally, the average yield for the selected nine quadrats represented the soybean yield of the sample plot. In addition, soybean planting dates for different regions were collected through field surveys, providing agro-management data for this study.
Field-measured soybean LAI data were obtained from the Common Application Support Platform for Land Observation Satellites of China's Civil Space Infrastructure (CAPLOS, https://caplos.aircas.ac.cn/#/Home, last access: 3 March 2024), an open data portal providing in situ biophysical variables (e.g., LAI and vegetation cover) for validating remote sensing products and refining retrieval algorithms. Sampling was conducted on 100 m × 100 m plots. LAI were collected with a LICOR LAI-2200 plant canopy analyzer following a standardized protocol: a reference reading of incoming solar radiation was taken above the canopy, followed by six beneath-canopy readings of transmitting radiation collected approximately 5 cm above ground at each plot. The raw readings underwent rigorous quality control to remove outliers, missing or duplicate values. After processing, 94 LAI observations from Youyi County and Nongan County were retained, spanning three soybean growing seasons from 2021 to 2023. Sampling dates (day-of-year, DOY) were: (a) Youyi County, DOY of 174, 197, and 235 in 2021; DOY of 180, 207, 221, and 246 in 2022; and DOY of 173, 190, and 245 in 2023. (b) Nongan County, DOY of 182, 221, 236, 251, and 264 in 2023.
2.2.2 Meteorological data
In this study, two different climate datasets were used.
The meteorological station data used in this study came from the meteorological stations of the National Meteorological Information Center (http://data.cma.cn, last access: 5 March 2024). There are 238 meteorological stations within the study area. Among them, 51 meteorological stations located within a 1 km buffer zone of the soybean cultivation areas were selected (Fig. 1). The meteorological datasets generally include insolation duration (h), minimum temperature (°C), maximum temperature (°C), daily average temperature (°C), average water vapor pressure (kPa), average wind speed (m s−1), precipitation (mm) and snow-depth (cm). Observed data from 1980 to 2021 of the 51 selected stations were collected. Missing values and outliers in the data were filtered out. The data were then directly used for setting input climate parameters of the WOFOST model to drive simulations.
The climate reanalysis data were obtained from the ERA5-Land Daily Aggregated – ECMWF Climate Reanalysis Product. The data were only used to calculate soybean phenology for preparation of yield estimation. It was a global climate reanalysis product that provides continuous climate data at a resolution of 0.1° × 0.1° (e.g., air temperature and atmospheric pressure) starting from 1950. The daily aggregated air temperature data at 2 m above the surface of land measured in kelvin (K) during the soybean growth periods from 2019 to 2023 were collected in this study from the Google Earth Engine (http://earthengine.google.com, last access: 5 March 2024). The product was resampled to 20 m using a bilinear interpolation model to match with the resolution of satellite imagery data.
2.2.3 Soil data
Soil data were obtained from the 1:1 000 000 Chinese soil database, established by the Institute of Soil Science, Chinese Academy of Sciences (Shi et al., 2004). The dataset consisted of two parts: soil spatial data (digital soil maps) and soil attribute data. In this study, the 1:1 000 000 soil spatial data was obtained. The spatial database was developed by digitizing, mosaicking, and reassembling sheets from the 1:1 000 000 Soil Map of the People's Republic of China (National Soil Survey Office, 1995), with the Genetic Soil Classification of China (GSCC) soil families as the fundamental mapping units. The final dataset includes 909 soil types and over 94 000 polygons. The dataset was utilized to determine the dominant soil types within the study area, serving as the basis for assigning soil parameter settings according to the literature.
2.2.4 Satellite imagery data
Two satellite datasets were used: (1) Sentinel-2 Multi-Spectral Instrument (MSI) Level-2A Surface reflectance product (10–60 m spatial resolution, 5 d revisit), and (2) the Moderate Resolution Imaging Spectroradiometer (MODIS) Leaf Area Index (LAI) / Fraction of Photosynthetically Active Radiation (FPAR) Level 4 product (MCD15A3H, v061, 500 m spatial resolution, 4 d period) to generate yield maps. All data spanning soybean growth periods (2019–2023) were accessed and pre-processed via Google Earth Engine (GEE, http://earthengine.google.com, last access: 11 April 2024).
The MSI aboard Sentinel-2A/B satellites provides 10 m (visible and near-infrared bands), 20 m (red-edge and shortwave infrared bands) and 60 m (atmospheric bands) bands at 5 d revisit. The Level-2A data, which are geometrically and atmospherically corrected via Sen2Cor, were masked for clouds and shadows using the Quality Assurance (QA) band. The 60 m bands were excluded due to their low spatial resolution and limited relevance for yield estimation and the 10 m (B2: Blue, B3: Green, B4: Red, B8: Near-Infrared) and 20 m (B5–B7: Red-edge, B8A: Near-Infrared, B11–B12: Shortwave Infrared) bands were retained. To harmonize spatial resolution, the 10 m bands were resampled to 20 m using a bilinear interpolation model. The number of available Sentinel-2 images per pixel during different soybean growth stages from 2019 to 2023 is presented in Fig. A1.
The MODIS MCD15A3H (Collection 6.1, Level 4) provides 4 d composite LAI and FAPAR at 500 m derived from Terra and Aqua satellite sensors. LAI/FAPAR are primarily inverted via a 3D radiative transfer model-based look-up-table (LUT) algorithm (Myneni et al., 2021). When the primary algorithm fails, they are estimated using an empirical NDVI-LAI model. The LAI data were similarly reprojected to WGS-84 to ensure spatial alignment with Sentinel-2 imagery. These coarse-resolution LAI data were used to generate 500 m yield maps. The coarse-resolution yield maps were then used to bias-correct the 20 m Sentinel-2 yield maps, improving their regional consistency. Details about the bias correction are present in Sect. 3.3.2.
2.2.5 Crop distribution data
The soybean distribution maps for the study area (2019–2023) were obtained from Zhao et al. (2022), which employed a novel methodology for crop type identification. The study proposed an optimal identification feature (OIF) knowledge graph coupled with a moment-preserving segmentation method to classify crop types without ground-truth data. The method achieved overall accuracy above 90 % and producer's accuracy exceeding 93 % for maize, soybean and rice, with a Kappa coefficient greater than 0.90.
2.2.6 Statistical data
Crop yield records (1980–2022) were obtained from the Statistical Yearbooks published by the Statistics Bureau of Heilongjiang (http://tjj.hlj.gov.cn, last access: 12 March 2024), Jilin (http://tjj.jl.gov.cn, last access: 12 March 2024), Liaoning (https://tjj.ln.gov.cn, last access: 12 March 2024) and Inner Mongolia Autonomous Region (https://tj.nmg.gov.cn, last access: 12 March 2024) to validate the crop yield estimates. Because the 2022 Statistical Yearbook was not fully released at the time of analysis, yield records for that year cover only a subset of cities. The statistical data served two main purposes: model simulation validation and regional-scale accuracy evaluation in this study. To ensure that the soybean growth dataset captures the full range of production conditions – including multi-year meteorological variations, various soil types, multiple soybean varieties, and diverse management practices – yield records from 1980 to 2022, along with published data and field observations, were used to evaluate the plausibility of the simulated yields. For the spatial validation, regionally aggregated statistical yield data (2019–2022) were applied to evaluate the accuracy of the hybrid framework at municipal and provincial scales.
Our proposed hybrid model leverages both the data-mining advantages of machine learning and the mechanistic advantages of crop growth models. Figure 2 presents the flowchart of the hybrid methodology for soybean yield estimation. The workflow contains two main steps. The first step is hybrid model construction, which includes generating a simulated training dataset with the WOFOST model under varying climate, soil, cultivar, and management conditions, and then training a GRU model to capture the relationship between simulated LAI and soybean yield. The second step is soybean yield estimation using remote sensing data, where LAI derived from MODIS and Sentinel-2 is used as input to generate soybean yield maps at multiple spatial scales.
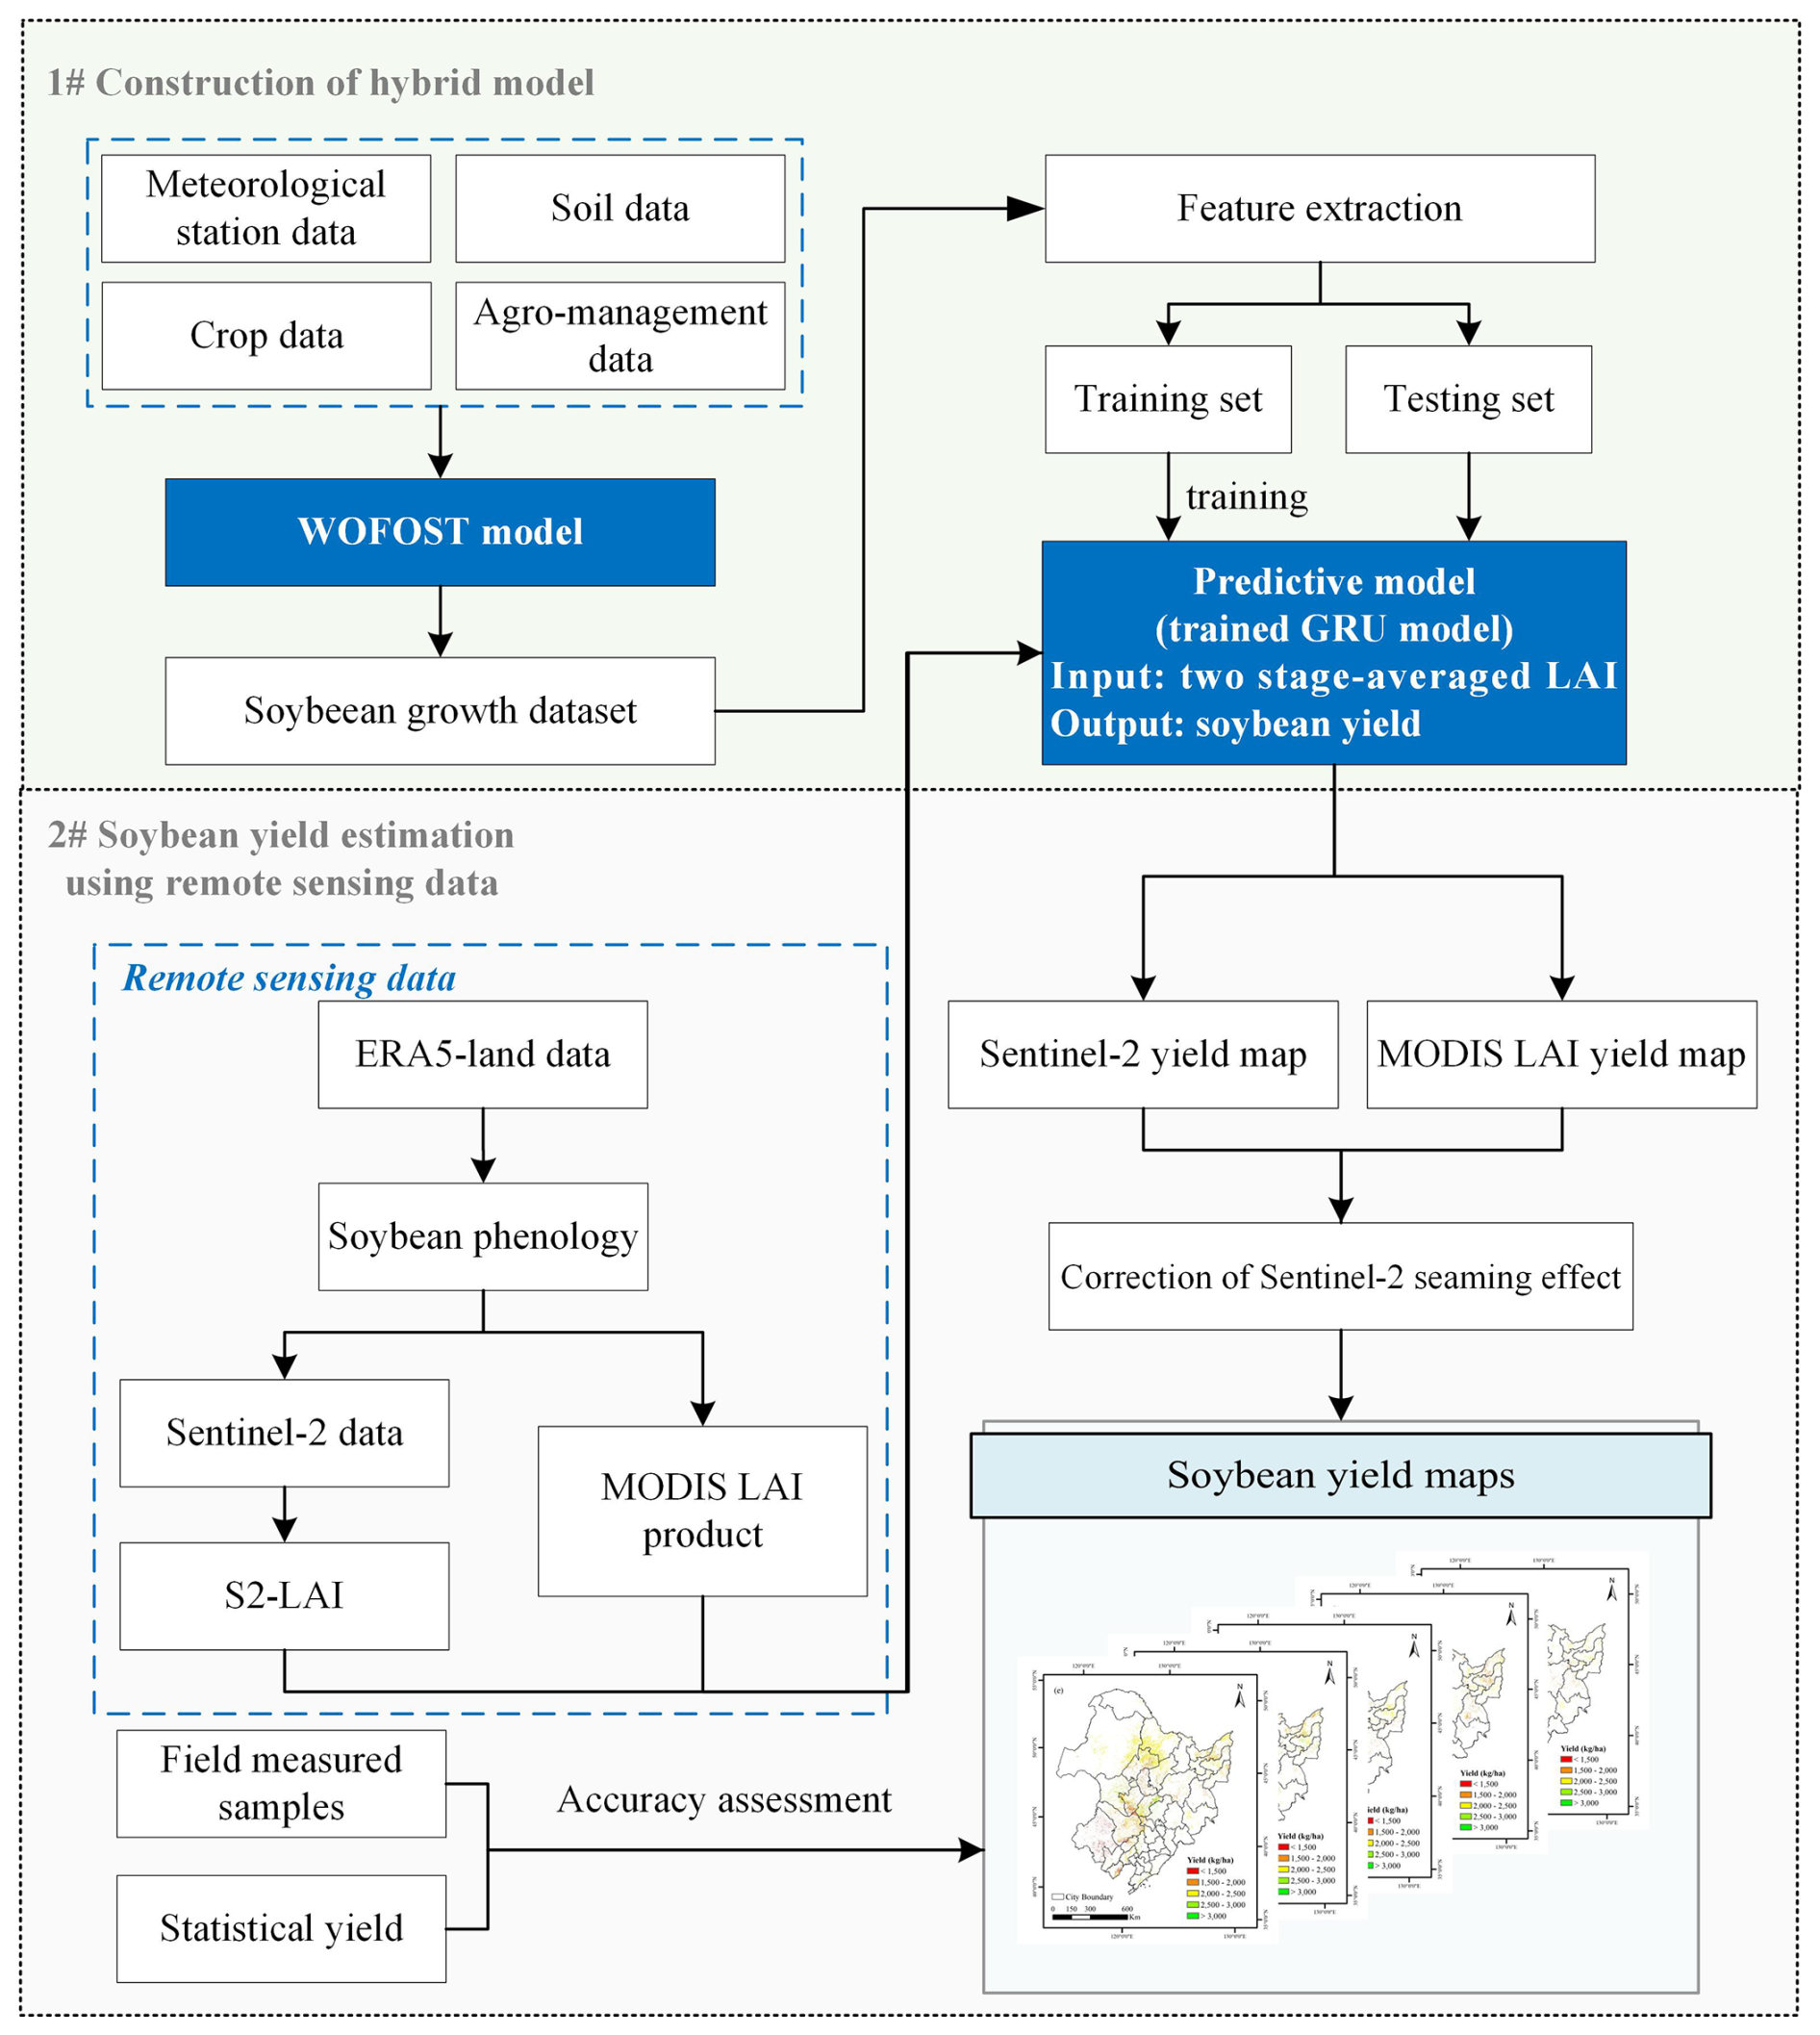
Figure 2The flowchart of the overall yield estimation methodology in this study.
3.1 Construction of soybean growth dataset
The soybean growth dataset used in this study was a knowledge-based dataset derived from a crop growth model based on multi-parameter combinations. The dataset provided a quantitative description of yield formation by simulating soybean development under diverse agricultural production scenarios including variations in meteorology (temperature, precipitation, solar radiation), soil types (texture, organic matter), crop varieties (phenology, thermal requirements) and agro-management practices (sowing date).
To generate the dataset, we employed the World Food Studies Simulation Model (WOFOST) (Diepen et al., 1989), implemented via the Python Crop Simulation Environment framework (PCSE, v5.5). The WOFOST model is well-suited for large-scale simulations and has been extensively validated (Huang et al., 2015). Given that soybean cultivation in the study area is predominantly rainfed, we adopted the water-limited mode (Wofost72_WLP_CWB) for simulations. Driven by daily weather data, soil profiles, and cultivar parameters, the water-limited model simulated CO2-driven photosynthesis, water deficits, and biomass partitioning, outputting daily LAI, daily biomass accumulation, and final grain yield. Crop development is modelled through development stages (DVS): 0 for emergence, 1 for anthesis and 2 for maturity (Diepen et al., 1989). This dataset mechanistically captures yield-limiting processes (e.g., drought during critical growth phases) while enabling scalable scenario analysis across Northeast China's rainfed soybean systems.
3.1.1 Preparation of model input parameters
To ensure the biological realism and representativeness of the synthetic dataset generated for model training, we adopted a careful, literature- and observation-informed parameterization and performed multiple checks in this study. We compiled soybean-specific model parameters from established sources relevant to Northeast China, including peer-reviewed studies, publicly available field reports, agronomic databases, and WOFOST defaults adapted to the regional context. Parameters were delineated into four groups:
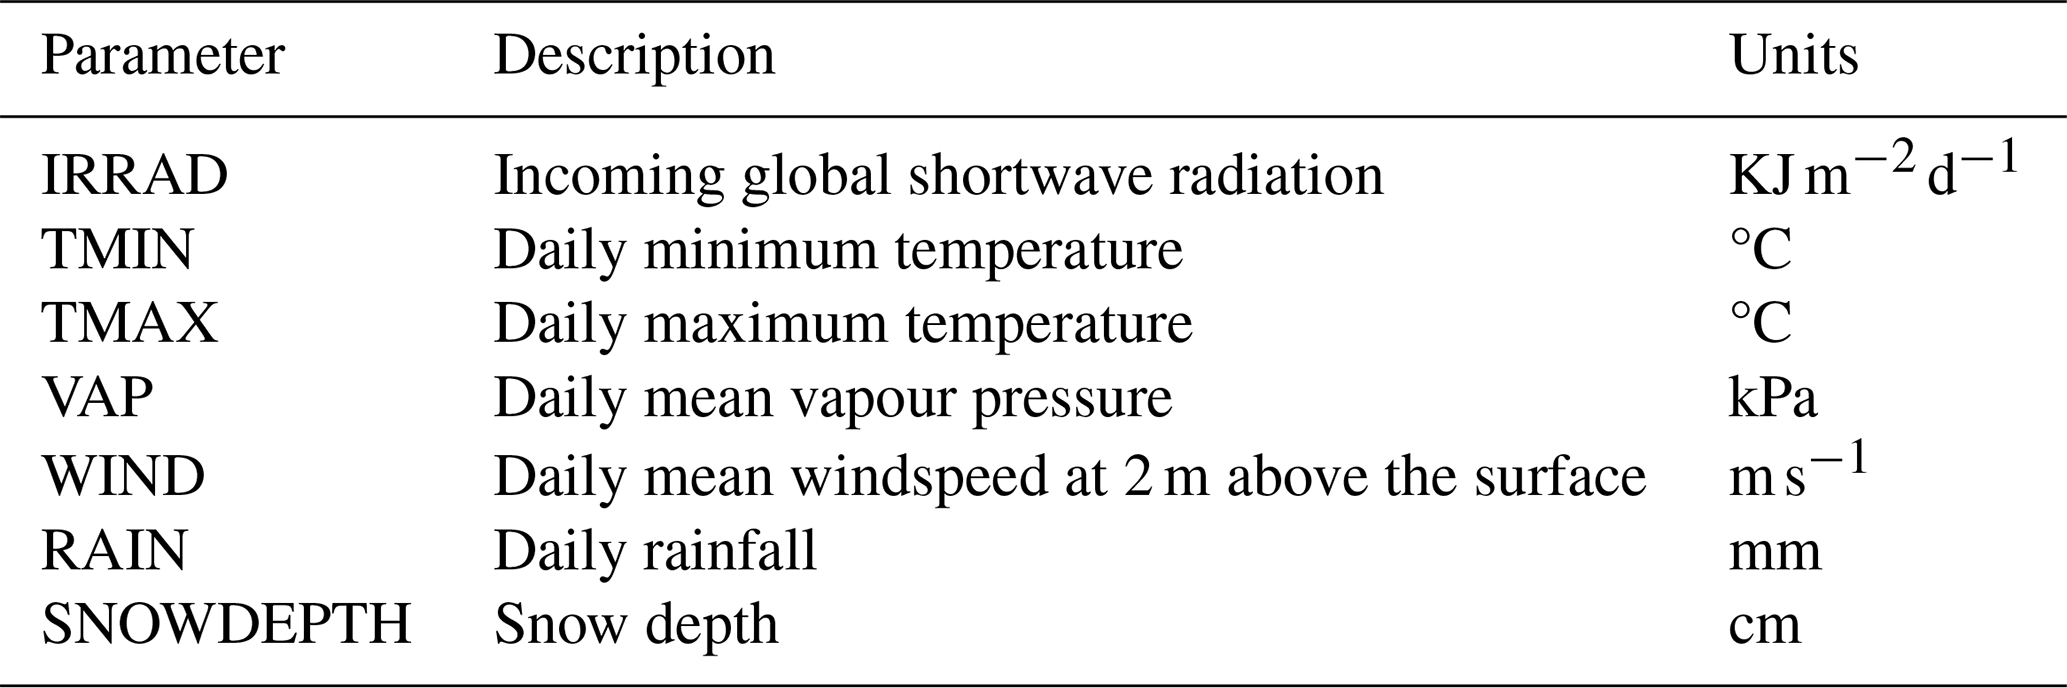
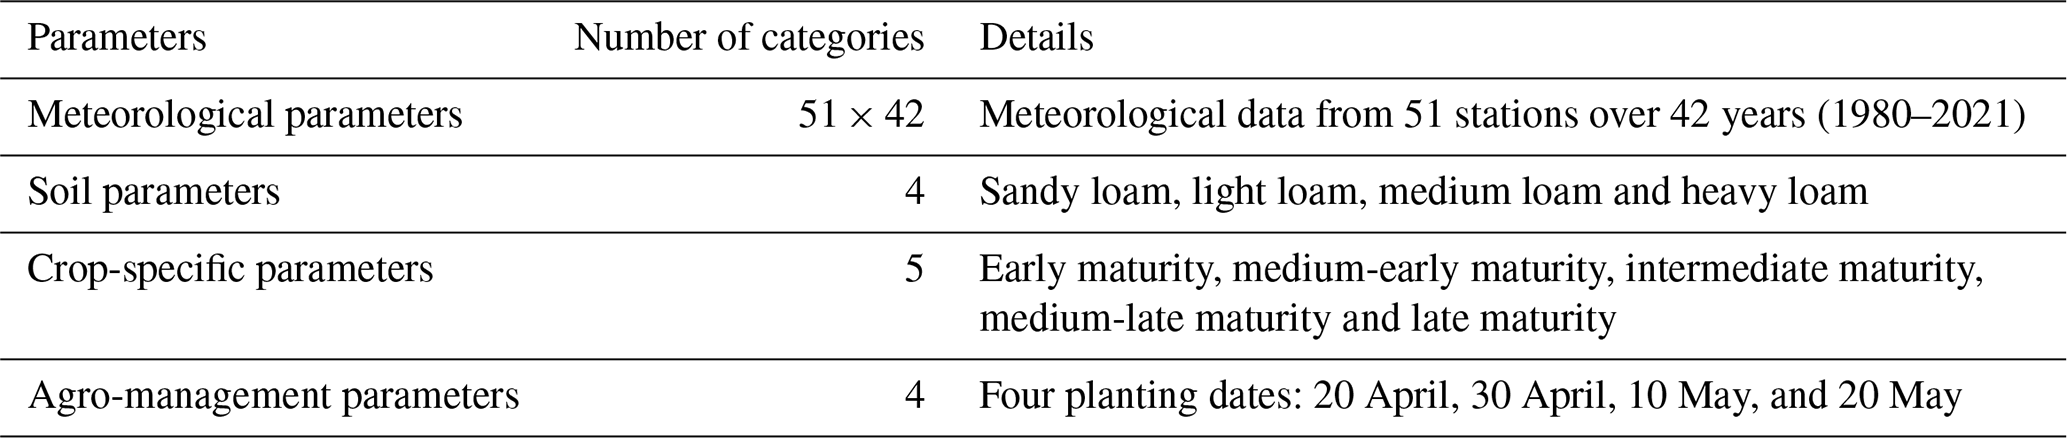
Meteorological parameters
The meteorological parameters required by WOFOST are shown in Table 1. To capture the climatic diversity of soybean growing areas across the study area, we compiled daily meteorological data (e.g., temperature, precipitation, and solar radiation) from 51 representative weather stations spanning 42 years (1980–2021). The collected data were pre-processed into the model's required input format (e.g., daily time steps, unit conversions) to ensure model compatibility and to generate a synthetic climate input dataset capturing climatic variability across the soybean growing areas.
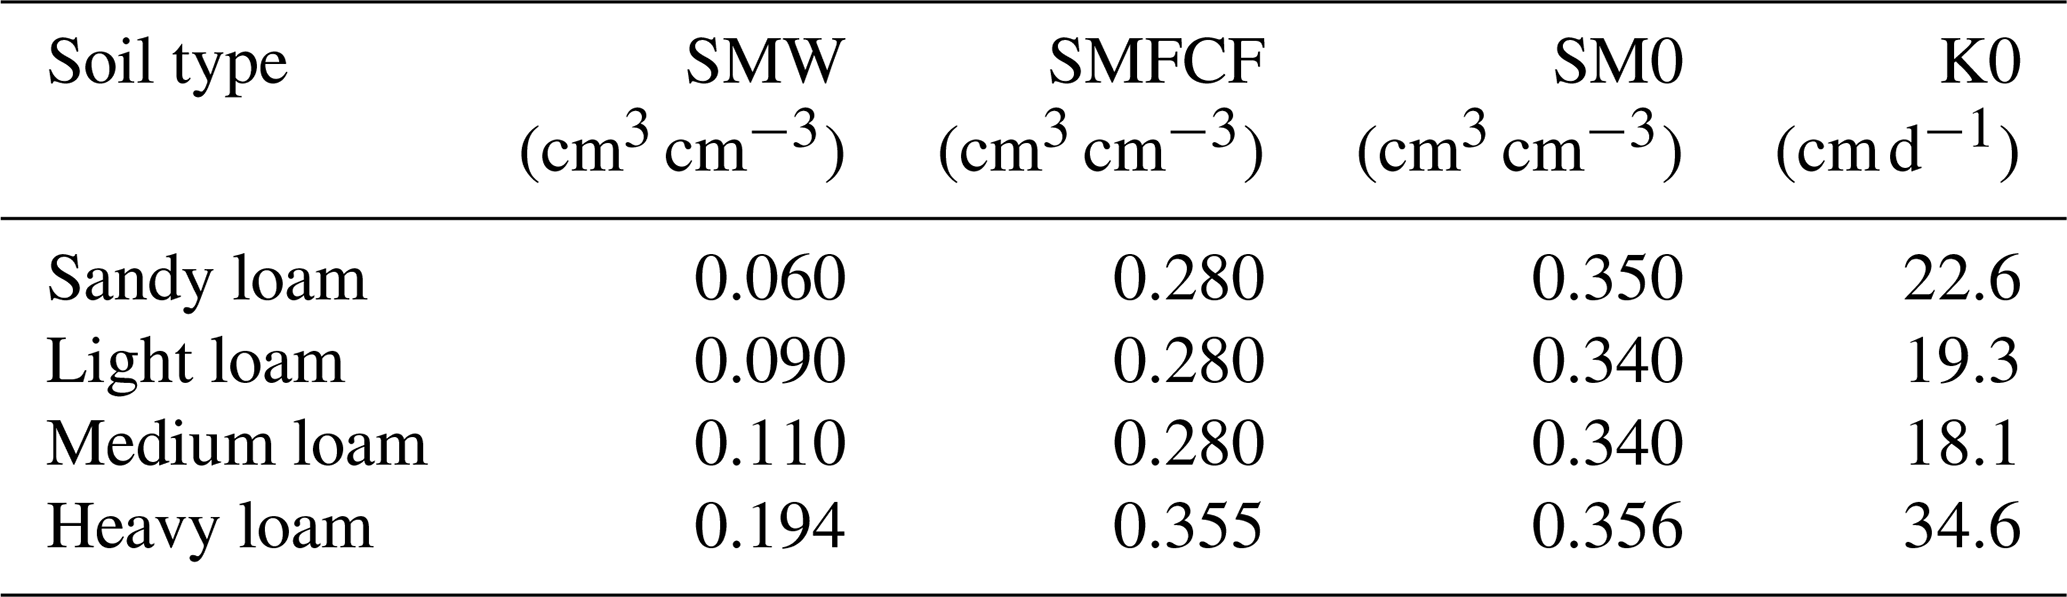
Soil parameters
The soil parameters in WOFOST mainly include soil moisture content at wilting point (SMW), field capacity (SMFCF) and saturation (SM0) as well as hydraulic conductivity of saturated soil (K0). Based on the 1:1 000 000 Chinese soil database, the study area predominantly comprises loam soil that is further classified into sandy, light, medium and heavy loam. The parameters for sandy, loam and medium loam were sourced from Du et al. (2025), while the parameters for heavy loam came from Sun et al. (2022). All soil parameter values, summarized in Table 2, were integrated into the model to evaluate the influence of soil variability on soybean yield (Du et al., 2025; Sun et al., 2022).
Crop-specific parameters
In this study, phenological and physiological parameters were sourced from studies conducted in the same agro-climatic zone and on soybean varieties with comparable growth characteristics to those in this study, ensuring the regional applicability and biological relevance of the adopted values. The soybeans were classified into five types including early, medium-early, intermediate, medium-late and late maturity following the classification by Qu et al. (2024). In the WOFOST model, soybean phenology is governed by temperature-driven parameters: the minimum (TBASEM) and maximum (TEFFMX) threshold temperature for emergence, and accumulated thermal time (TSUMEM: sowing to emergence; TSUM1: emergence to anthesis; TSUM2: anthesis to maturity). These thermal parameters are cultivar-sensitive and were set based on historical meteorological data and regional phenological observations reported in Qu et al. (2024). Remaining crop parameters (e.g., SLATB: specific leaf area) were assigned default values or optimal values from Sun et al. (2022). Full parameter specifications are provided in Table A1.
Agro-management parameters
Planting date is a major agro-management factor for soybean in the study area. Differences in planting date can significantly impact on soybean growth development, pod count, and biomass accumulation (Urda et al., 2024). Four planting dates (20 April, 30 April, 10 May, and 20 May), reflecting the typical planting window (late April to late May) of the study area were set for model simulation according to Mei et al. (2024) which also focused on soybean cultivation in a similar study area.
3.1.2 Crop simulations using multi-parameter combinations
Following parameter preparation, the four parameter categories, including meteorological (51 stations × 42 years), soil (four types), crop-specific (five varieties) and agro-management (four planting dates), were systematically combined to create 171 360 unique parameter combinations (Table 3). These parameter combinations were executed in the WOFOST simulations, yielding a dataset of 171 360 simulations that quantify yield responses to diverse agricultural production conditions.
3.2 Development of the Gated Recurrent Unit (GRU) model
The Gated Recurrent Unit (GRU) model, a streamlined variant of recurrent neural networks (RNNs), was trained using the simulated soybean growth dataset for large-scale soybean yield estimation. Unlike LSTM (Long Short-Term Memory), the GRU simplifies gating mechanisms to two adaptive gates, update and reset gates (Cho et al., 2014). The update gate retains the past information for future calculations. The reset gate aims to remove irrelevant historical context for simplifying the new candidate hidden states. Using the two gates together is beneficial for balancing long-term dependency capture and computational efficiency (Peng and Yili, 2023; Zhang et al., 2022). This design mitigates vanishing gradient issues while accelerating model training, making GRU particularly effective for time-series yield estimation (Gopi and Karthikeyan, 2023; Ren et al., 2023b).
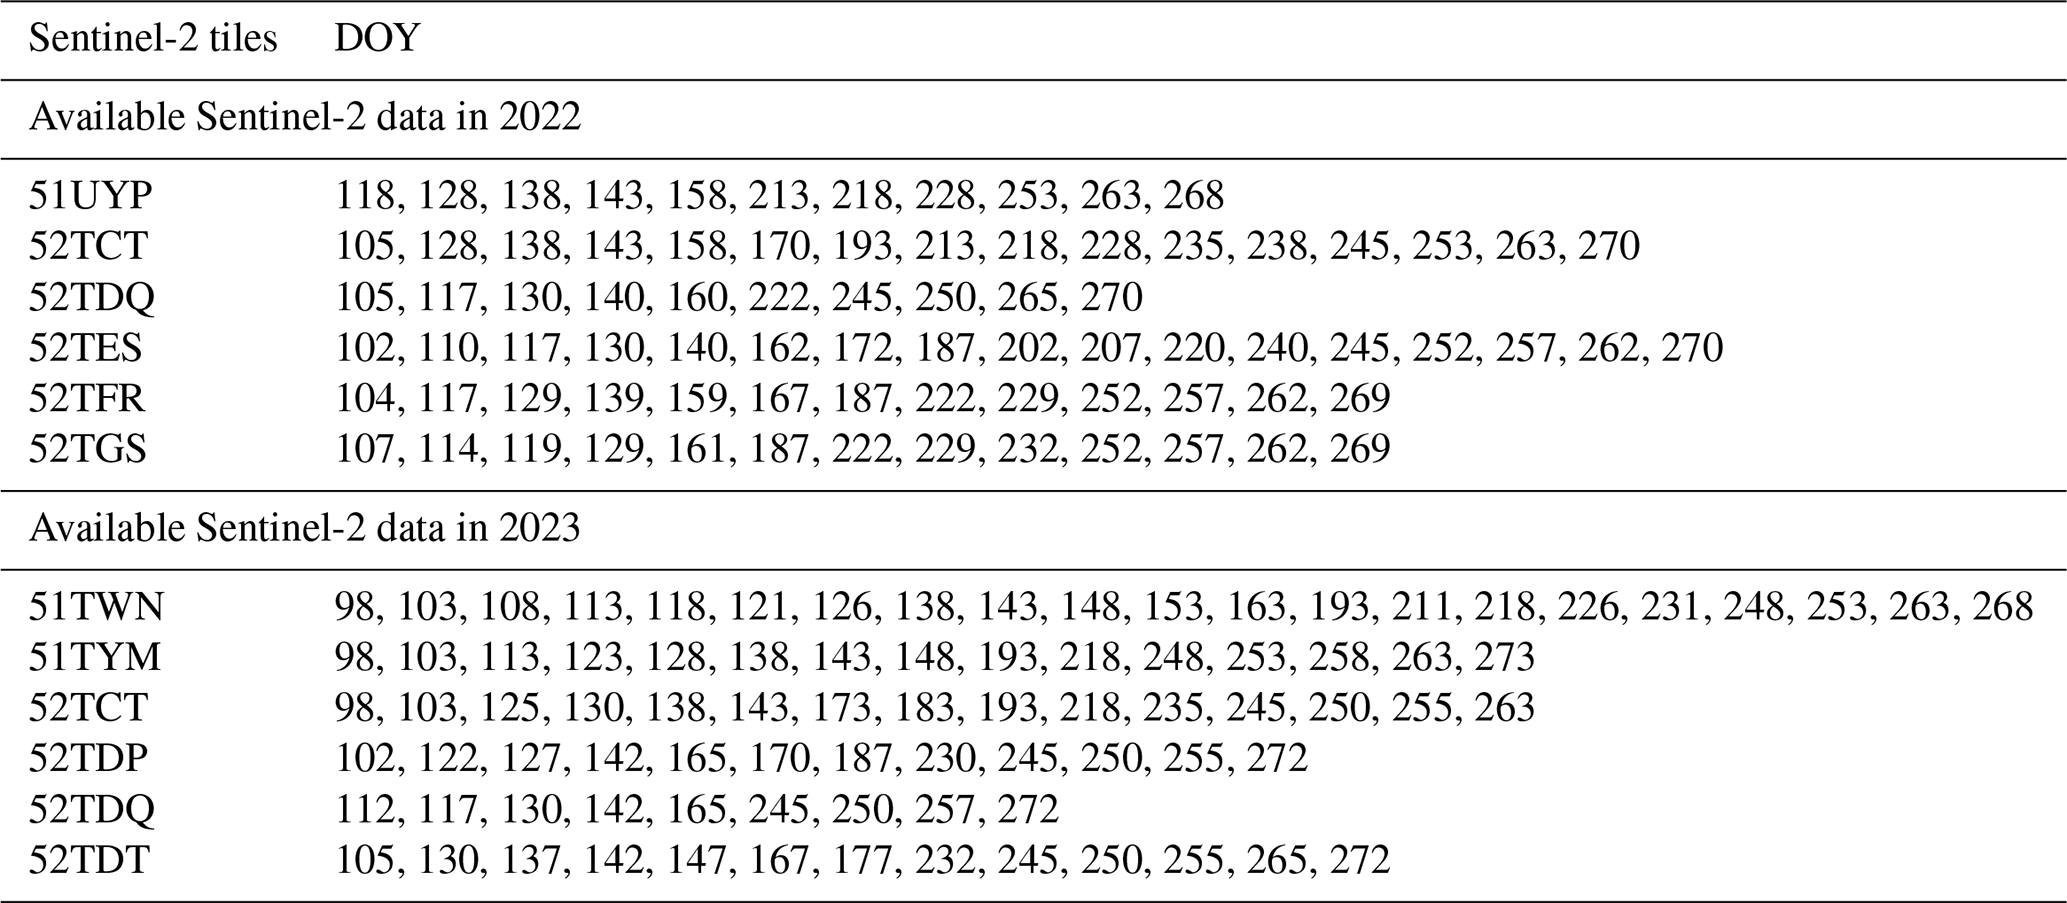
Trained on the simulated dataset, the GRU model, constructed based on TensorFlow 2.6, linked simulated inputs to yield outputs. For field scale yield estimation, we first identified all available Sentinel-2 observation dates for each sample plot based on its corresponding Sentinel-2 tiles in 2022 and 2023 (Table 4), and computed the development stage value (DVS) for each date (Sect. 3.3.1). As LAI is a key biophysical indicator of soybean photosynthetic capacity and productivity (Ko et al., 2024; Shi et al., 2025), we extracted LAI values at the corresponding DVS from the soybean growth dataset to construct DVS-aligned LAI time series. These DVS-aligned LAI served as inputs to the GRU model, with simulated yield used as the target variable.
However, the spatiotemporal variability of Sentinel-2 image availability across regions posed challenges for regional-scale yield modelling, as constructing separate GRU models for each date combination demands considerable computational and storage resources. Accounting for the computational efficiency of the model in large areas, two stage-averaged LAI, LAImean1 (mean value of LAI during vegetative growth: emergence to flowering) and LAImean2 (mean value of LAI during reproductive growth: flowering to maturity), were calculated as inputs, while simulated yields acted as outputs. Recent studies have shown that phenology-based feature construction and stage-specific summaries from Sentinel-2 time series can provide an efficient and informative alternative to full-season sequences for crop yield prediction (Gaso et al., 2024; Radočaj et al., 2025). To evaluate the effectiveness of the two stage-averaged LAI in soybean yield estimation, we applied the GRU model trained by the two stage-averaged LAI to yield estimation at the field scale for comparison with the model based on DVS-aligned LAI time series, and further extended its application to the regional scale.
The simulated soybean growth dataset was partitioned using 10-fold cross-validation, with hyperparameters (e.g. learning rate and batch size) optimized using a grid search to achieve minimal root mean squared error (RMSE, Eq. 7) (Açikkar, 2024). Once trained, the GRU model took Sentinel-2-derived LAI as inputs to generate 20 m yield maps.
3.3 Generation of NortheastChinaSoybeanYield20m
3.3.1 Determination of soybean phenology
Soybean phenology in the study area exhibits significant spatial variability due to climatic and varietal differences (Gaso et al., 2024; Xin et al., 2023). To address this, soybean phenology maps were generated from daily thermal time by integrating thermal zone divisions using the same method as Wang et al. (2022) and regionally adapted cultivars (Qu et al., 2024) (Fig. A2). Soybean phenology (including emergence, anthesis and maturity) was calculated using daily aggregated air temperature data from ERA5-Land dataset and a thermal time model (Te) (Eq. 1). The DVS of soybean was then calculated as Eq. (2).
where Tmean is daily mean temperature, Tbase (8 °C) and Tmax (37 °C) represent the minimum and the maximum temperature for soybean development, respectively (Boote et al., 1997; Choi et al., 2016). TSUMi represents thermal time requirement for completing a specific developmental stage. Soybean growth proceeds from a growth stage to the next stage when accumulated Te reached the threshold of accumulated temperature required for growth according to the setting of crop parameters of WOFOST model (Table A1).
Based on field surveys and the literature, the soybean planting dates were fixed at 5 May for Heilongjiang Province and Inner Mongolia Autonomous Region, and 1 May for Jilin and Liaoning Province (Huang and Liu, 2024), with emergence constrained to before 1 June (Mei et al., 2024), and maturity to before 1 October (Huang and Liu, 2024). Under the constraints of Te (Table A1) and the agro-management settings, phenological dates (emergence, anthesis and maturity) were computed for each Sentinel-2 pixel (2019–2023). Finally, the phenological maps were clustered into 10 phenology classes using the K-means clustering method (Jain and Dubes, 1988), aligning with Sentinel-2's revisit cycle to optimize imagery selection for yield estimation.
3.3.2 Model estimation of soybean yield
The red-edge normalized difference vegetation index (NDVIRE) (Gitelson and Merzlyak, 1994) was employed for LAI mapping (Eq. 3).
where B8A (near-infrared) and B5 (red-edge) are Sentinel-2 bands.
The soybean LAI was estimated from NDVIRE using a linear regression (Eq. 4) which has been shown to provide robust transferability across crop types and regions (R2=0.732, RMSE=0.69) (Pasqualotto et al., 2019). To verify the applicability of the method for soybean, we paired cloud-free Sentinel-2 images (±2 d of sampling) with ground-measured LAI and re-estimated LAI via the NDVIRE regression, achieving a similar accuracy (R2=0.81, RMSE=0.89, Fig. A3). While performance was strong overall, a modest overestimation was observed for LAI<3, likely due to local soil-background effects not present in the original European calibration.
DVS-aligned LAI values derived from available Sentinel-2 data (Table 4) were first used as input to the GRU model for yield estimation at field scale. Meanwhile, averaged LAI values during the vegetative (LAImean1) and reproductive (LAImean2) growth stages were calculated and used as model inputs for estimation at both field and regional scales. For pixels with missing values during these stages, LAI values were replaced by the average of eight neighbouring pixels. Final 20 m yield maps were masked using soybean distribution maps to exclude non-soybean areas. To ensure consistency across all data sources, both the WOFOST outputs and our field measurements, which were originally reported as dry matter, as well as the yield records used for comparison, were converted to the 13 % moisture content according to Mulvaney and Devkota (2020):
For large area estimation, a total of 194 Sentinel-2 tiles were required to fully cover the study area. Affected by cloud cover, the frequency of available data varied across each tile. Therefore, the yield maps often exhibited discontinuities along the edges of different tiles (“seaming effects”). This seaming effect could obscure real yield variations. To address this issue, a bias correction method proposed by Azzari et al. (2017) was applied. The overall framework was to use yield estimation based on MODIS LAI to correct the yield estimation from Sentinel-2. MCD15A3H generally provided more continuous estimation results of LAI due to its higher temporal resolution (4 d composites) and broader coverage. Yield maps were generated from the trained GRU model, with MCD15A3 LAI products as inputs. Sentinel-2 yield maps were adjusted by adding the difference between MODIS-derived mean yield and initial Sentinel-2 mean yield for each tile. This process minimized seams while preserving fine-scale yield variability within tiles.
3.4 Accuracy evaluation
The accuracy of soybean yield estimation was evaluated on multiple scales. For field scale, in situ yield data in 2022 and 2023 were used for assessment. For regional scale, the average soybean yield for each city and province was separately calculated for each year, and compared with the statistical data. Accuracy evaluation was based on the coefficient of determination (R2, Eq. 6), the root mean squared error (RMSE, Eq. 7) and mean relative error (MRE, Eq. 8).
where yo,i and ym,i represent the actual yield (observed or statistical yield) and model estimated yield, respectively; is the mean value of the actual yield.
4.1 Simulations of the WOFOST model
Since LAI was used as the input feature, the accuracy of WOFOST-simulated LAI directly influenced the reliability of the GRU model for soybean yield prediction. To validate simulated LAI, field-measured LAI from 2021 to 2023 were compared with the mean LAI curve calculated from 5000 randomly selected simulated LAI curves from the soybean growth dataset (Fig. 3). The results showed that simulated LAI trends aligned closely with observed field variations, capturing 88 % of the field-measured sample sites (n=83) within the simulated range. This demonstrated robust agreement between model outputs and ground truth, confirming the WOFOST simulations' ability to represent realistic LAI dynamics for GRU training.
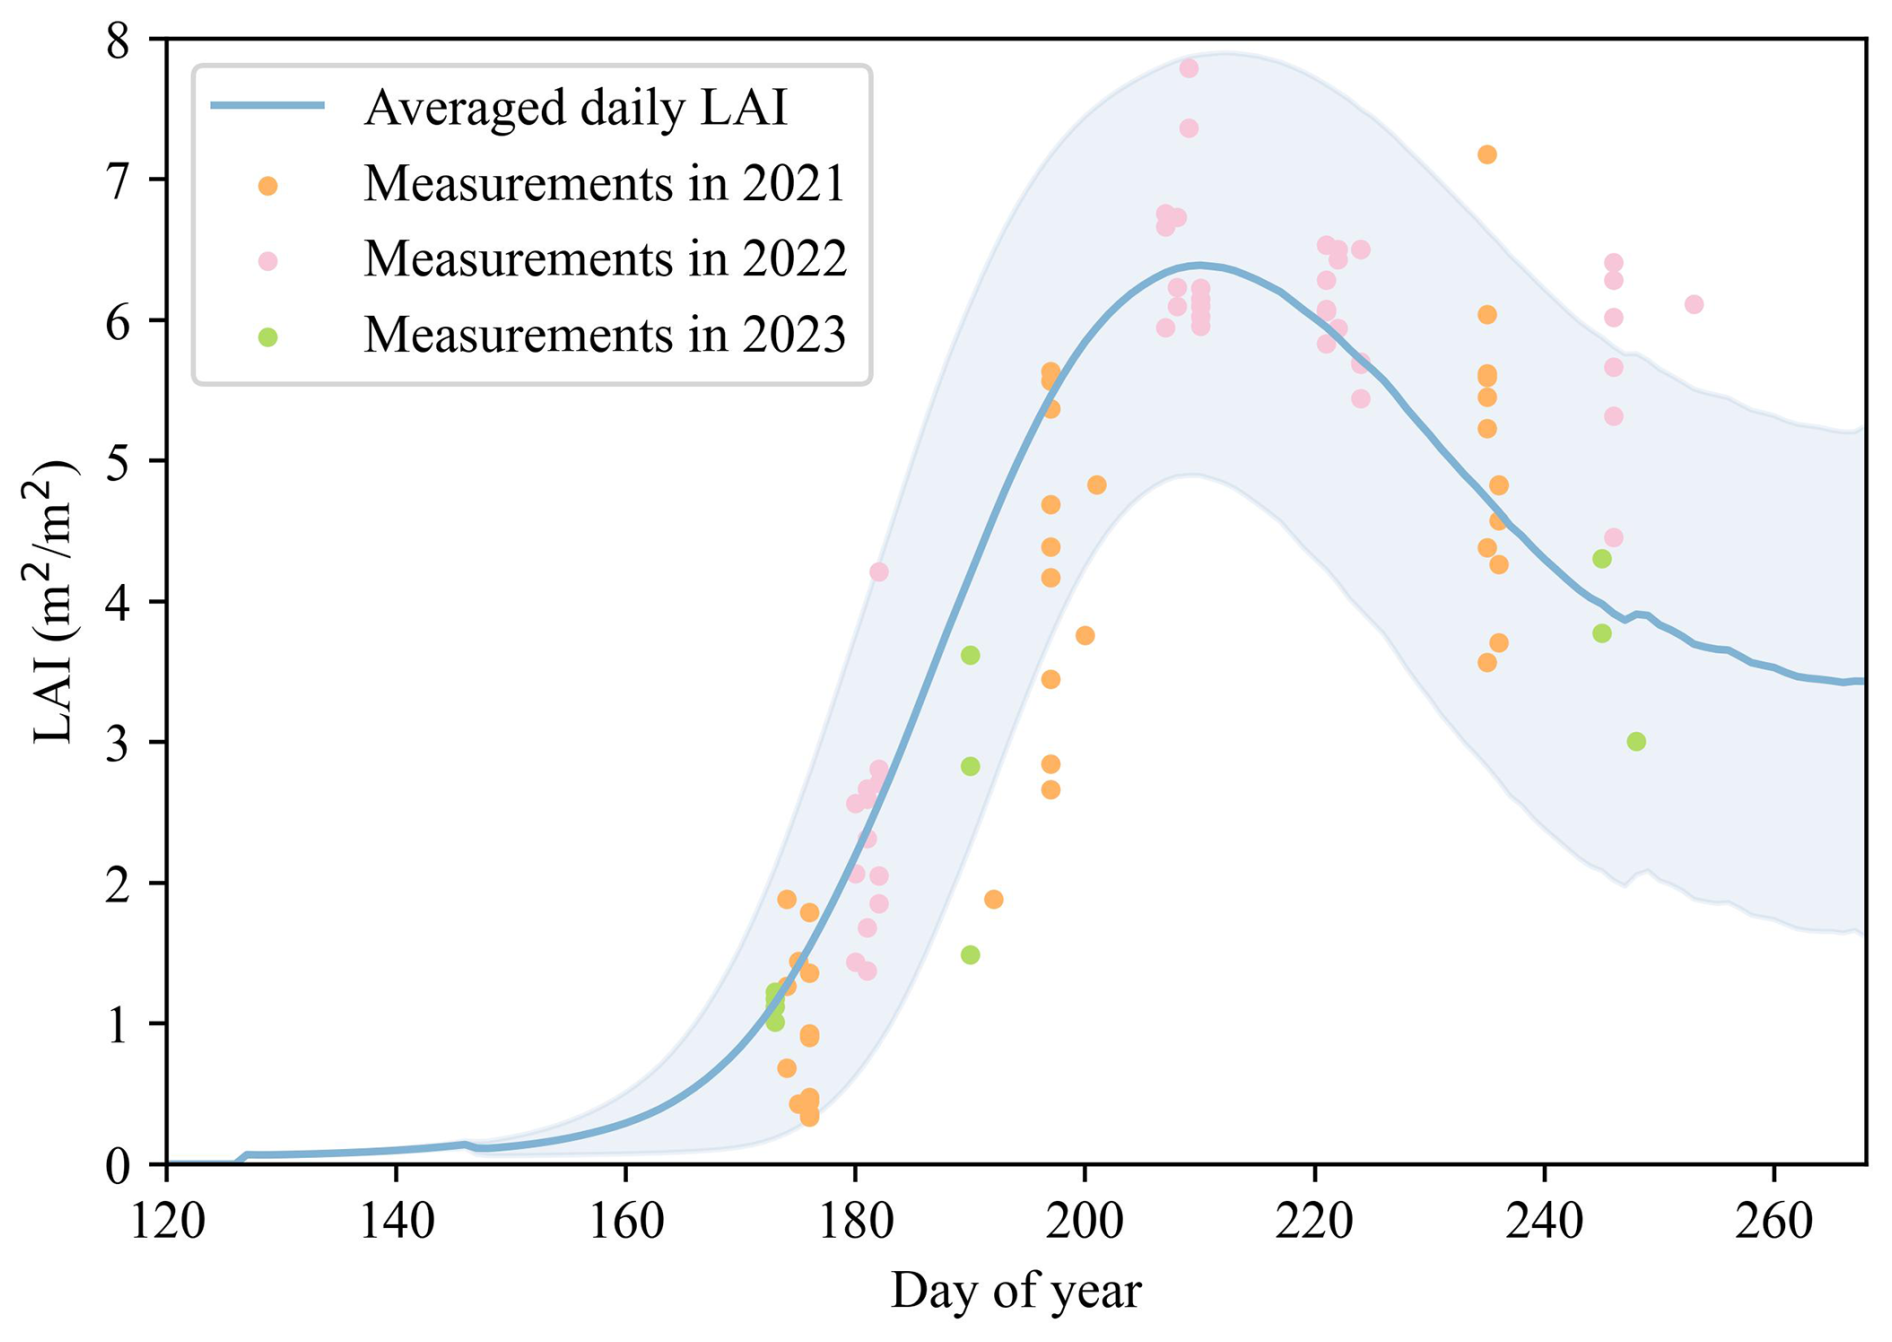
Figure 3Comparison of averaged daily LAI randomly selected from model simulations (n=5000) with field-measured LAI in 2021 (n=38), 2022 (n=46) and 2023 (n=10). The shading represents one standard deviation, indicating the uncertainty in LAI simulation.
Figure 4a displays the histogram distribution of simulated soybean yields, revealing an approximately normal distribution (mean=2675.66 kg ha−1). The soybean growth dataset effectively captured a wide range of production conditions, spanning low to high yield extremes. Figure 4b shows a box plot comparing the simulated yield with historical statistics from 1980 to 2022, published yield data from literature, and field measurements from 2022 and 2023. The simulated dataset exhibited the widest value range, demonstrating the comprehensiveness of the multi-scenario knowledge base and the robustness of the simulation outcomes.
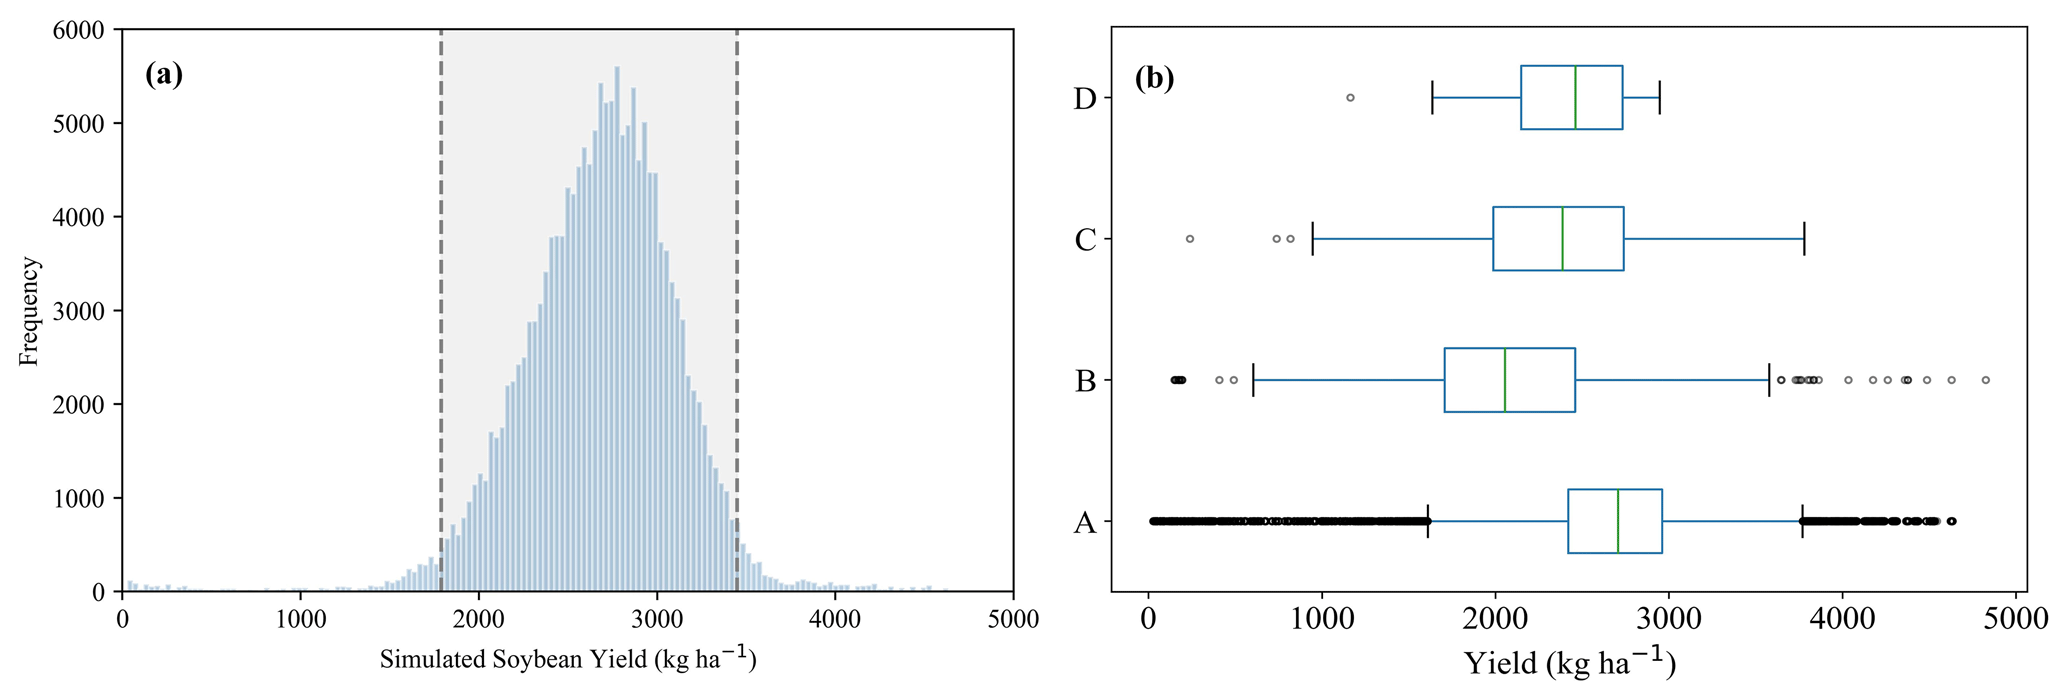
Figure 4(a) Histogram statistics of simulated soybean yield where the gray area in the histogram represents 95 % confidence intervals; (b) distribution of simulated soybean yield compared with other datasets where A represents simulated yield in this study (n=171 360), B represents statistical yield from 1980 to 2022 (n=961), C represents specific measurements from the literature (Chen et al., 2011; Fan et al., 2012; Liu et al., 2005, 2008; Liu and Herbert, 2002; Wang et al., 2020, 2024; Zheng and Zhang, 2021) (n=138) and D represents measurements in 2022 and 2023 collected in this study (n=39).
4.2 Yield estimation at field scale
The field scale performance of GRU models using full DVS-aligned LAI and two stage-averaged LAI was validated against in situ measurements from 2022 and 2023 (Fig. 5). The estimated yields exhibited strong agreement with observed yield, with R2>0.65 (p<0.01) in all scenarios. Validation results (Figs. 5 and A4) showed that the DVS-aligned GRU model achieved slightly better accuracy (RMSE=224.81 kg ha−1, MRE=7.50 %), while the stage-averaged model remained competitive (RMSE=287.44 kg ha−1, MRE=10.02 %). The difference in MRE was around 3 % across both years, suggesting that the simplified approach using two stage-averaged LAI was a feasible alternative for yield estimation.
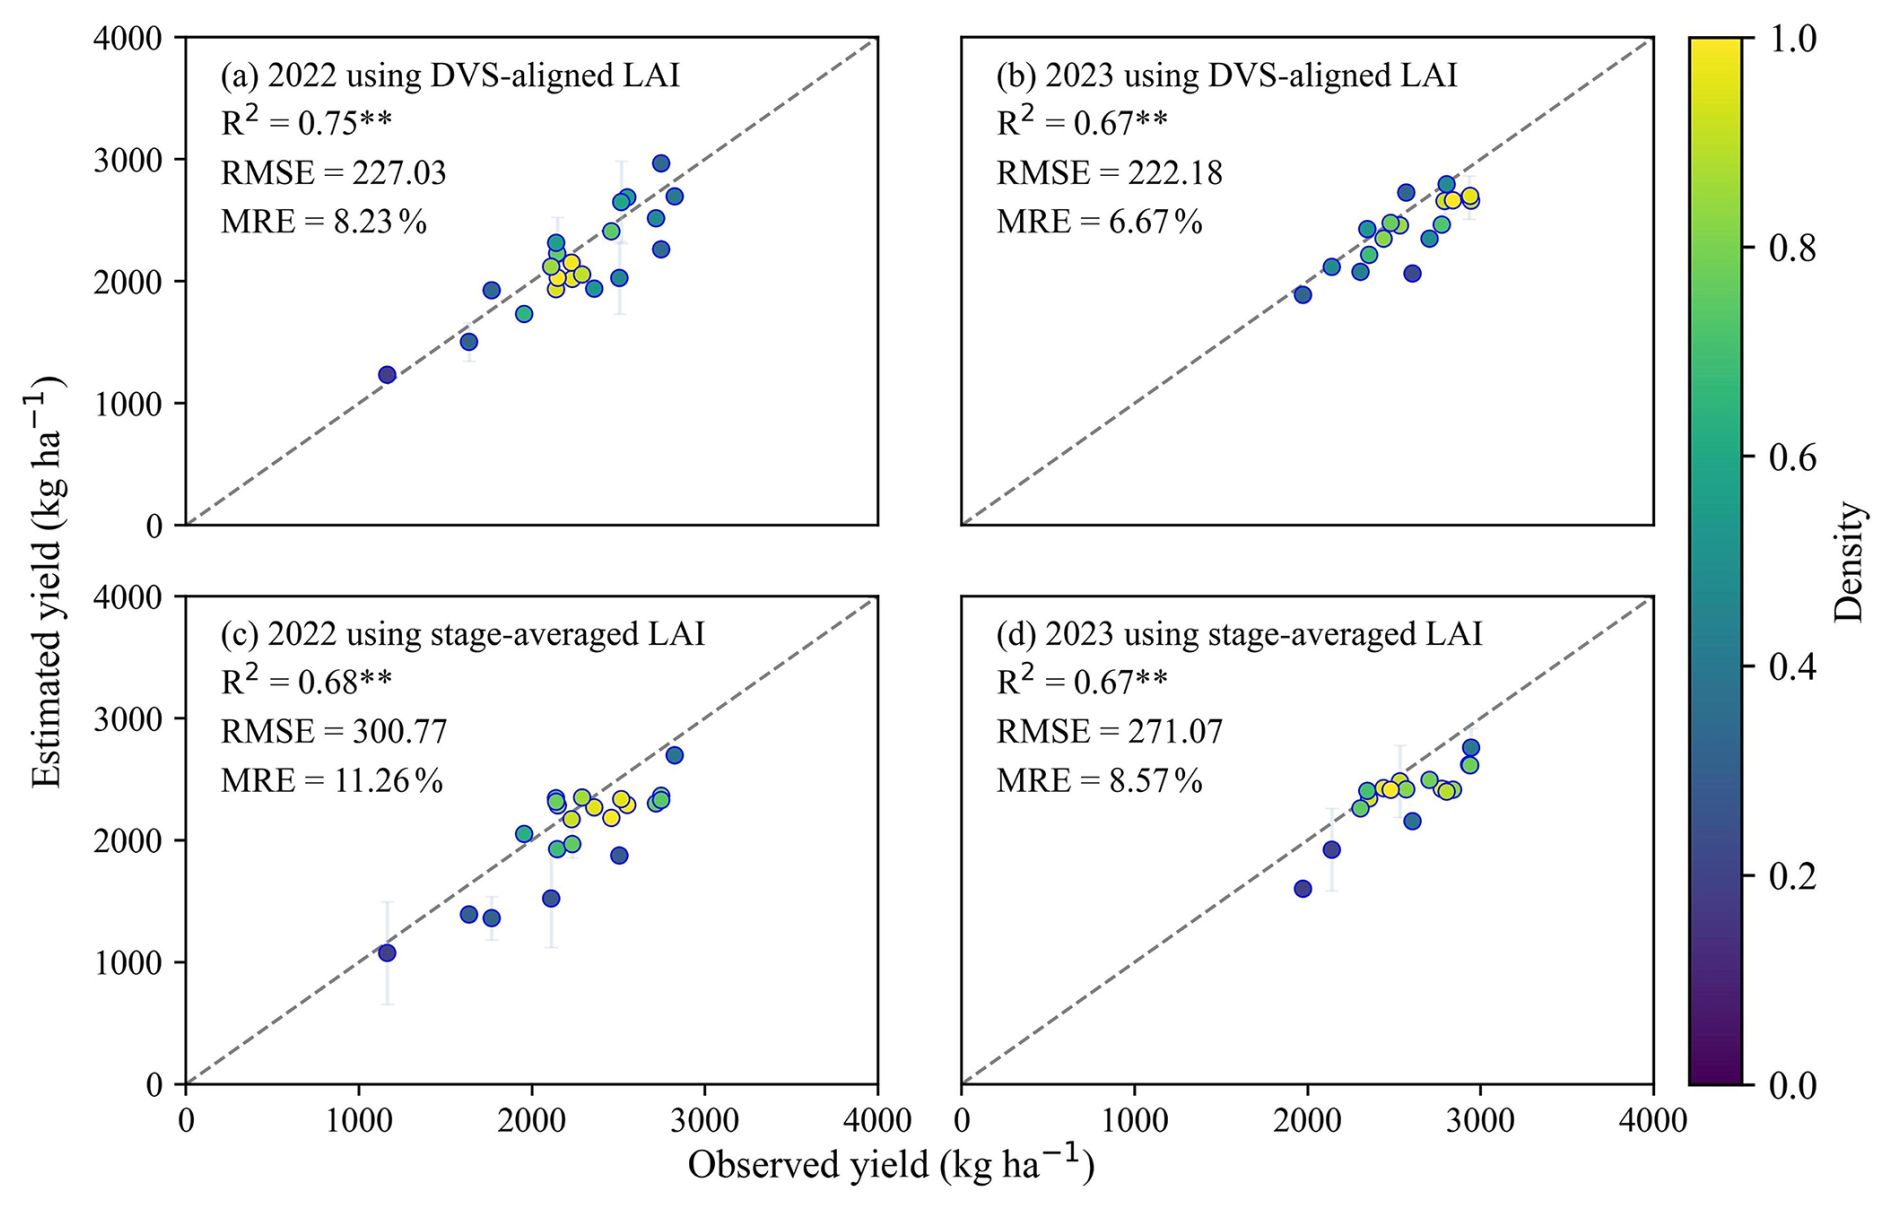
Figure 5Scatterplots between estimated and observed soybean yield for 2022 and 2023. (a) and (b) show results for 2022 and 2023, respectively, using the full DVS-aligned LAI; (c) and (d) show results for 2022 and 2023, respectively, using two stage-averaged LAI. Error bars represent one standard deviation indicating the uncertainty of yield estimates. The dashed line represents the 1:1 line. ** denotes statistical significance at p<0.01.
4.3 Yield estimation at regional scale
4.3.1 Variability of accuracy through years
The performance of the GRU model at regional scale using the two stage-averaged LAI was validated at the municipal scale (2019 to 2022) by aggregating yield maps to match statistical data (Fig. 6). Compared to the field-scale validation, the municipal-scale estimates exhibited greater uncertainty, likely reflecting increased heterogeneity of soybean yields over larger areas. The estimates maintained stable interannual performance, with correlation between estimated and statistical yields consistently exceeding 0.60 (p<0.01). The overall accuracy pooled across 2019–2022 at the municipal scale achieved R2=0.62 (p<0.01), RMSE=272.36 kg ha−1, and MRE=12.08 % (Fig. 12a). Annual accuracy metrics ranged from 221.69 to 310.66 kg ha−1 for RMSE and from 8.24 % to 14.40 % for MRE, with 2022 achieving the highest accuracy (MRE<10 %, Fig. 6d).
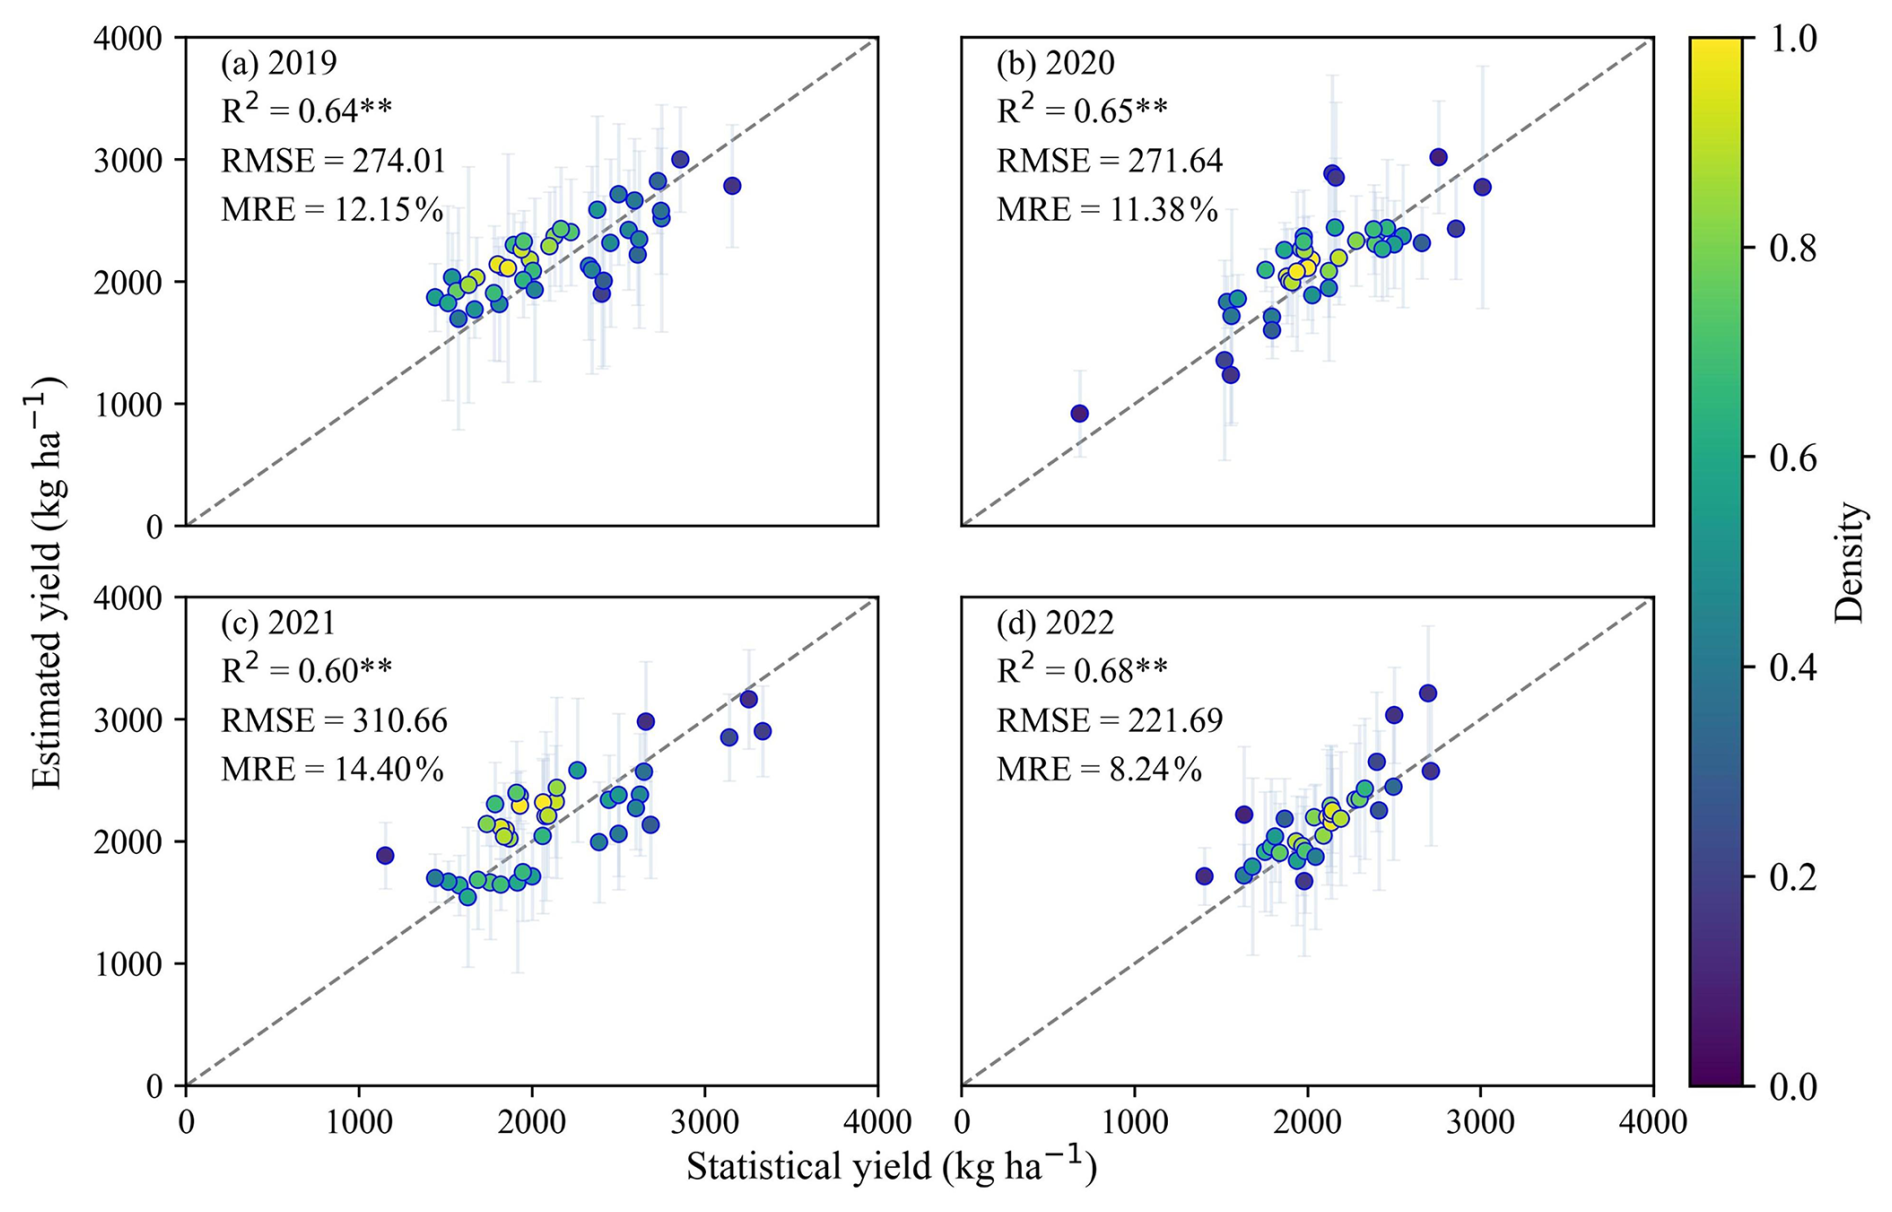
Figure 6Scatterplots between estimated soybean yield from Sentinel-2 and municipal statistical yields for 2019–2022 (excluding 2023 for which no statistical data was available at the time of analysis). Error bars represent one standard deviation indicating the uncertainty of yield estimates. The dashed line represents the 1:1 line. ** denotes statistical significance at p<0.01.
For temporal performance at the municipal scale, the RMSE between estimated and statistical yields from 2019 to 2022 remained below 500 kg ha−1, with 80 % of cities exhibiting RMSE under 350 kg ha−1 (Fig. 7a). Spatially, large errors were concentrated in the northern part of Northeast China especially for the Greater Khingan Mountains area, while the flatter region, central regions of Northeast China, showed smaller deviations. The spatial distribution pattern of MRE closely mirrored that of RMSE (Fig. 7b), with an average value of 11.46 % across all cities over the four-year period. These findings underscore the model's robust capacity to capture interannual variability of soybean yield.
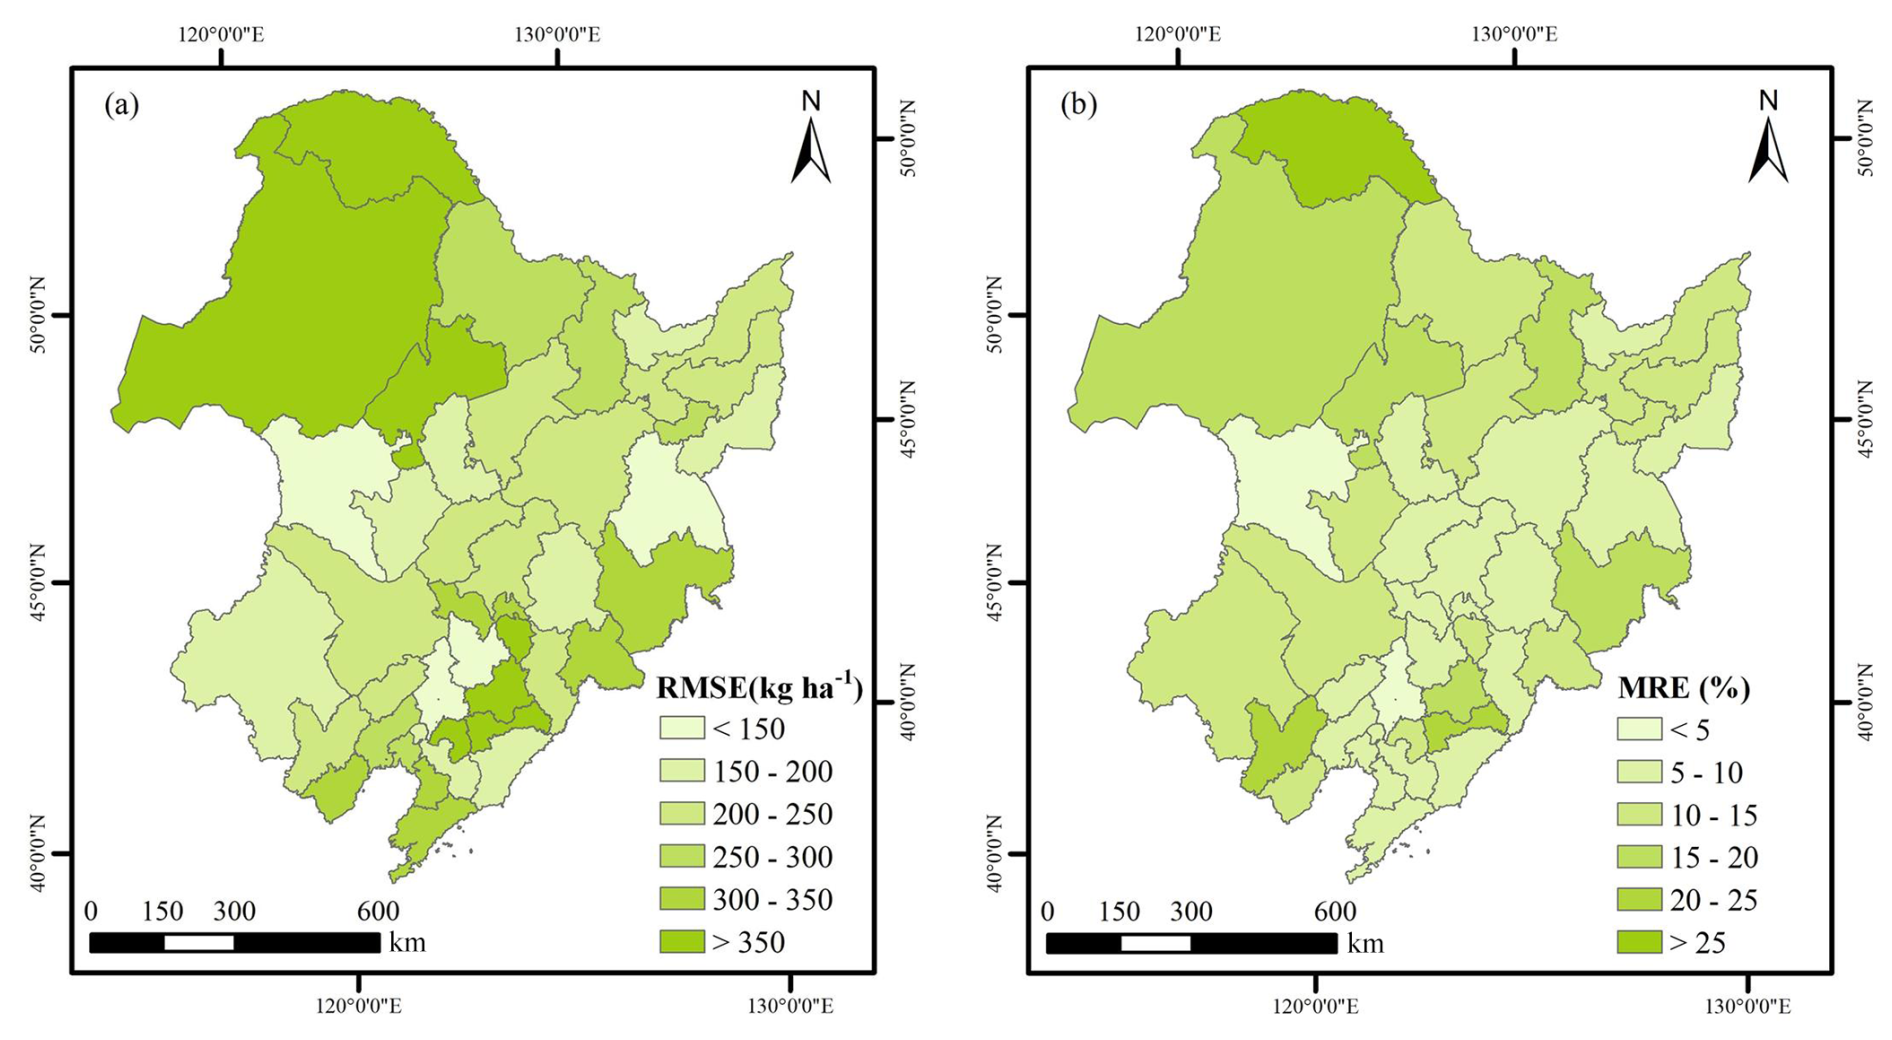
Figure 7Spatial patterns of the mean value of the root mean squared error (RMSE) and mean relative error (MRE) between model estimated yields from Sentinel-2 and statistical yields from 2019 to 2022 (excluding 2023 for which no statistical data was available at the time of analysis), (a) and (b), respectively. For years from 2019 to 2021, a total of 40 cities were calculated. For 2022, 32 cities were calculated due to missing statistics.
4.3.2 Spatial-temporal dynamics of soybean yield
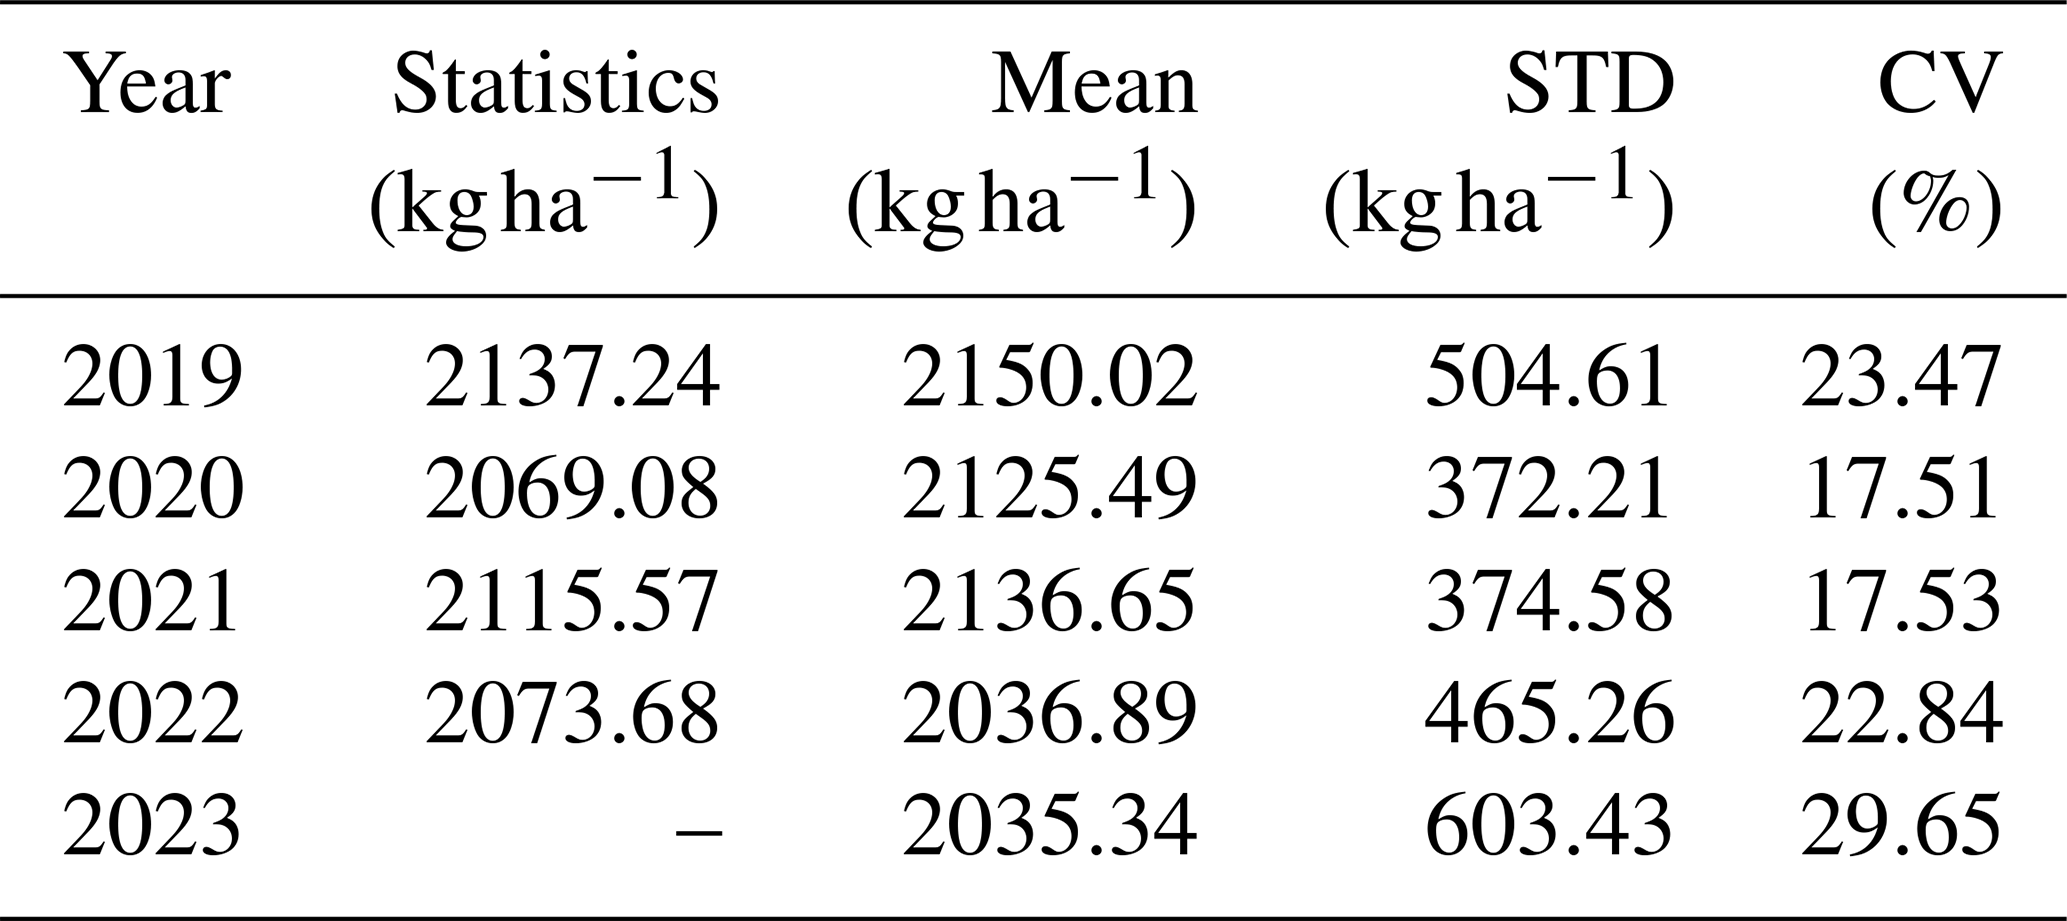
To examine spatial patterns of soybean yield across Northeast China, yield distribution maps for 2019–2023 were generated (Fig. 8a–e). After bias correction with estimated yield derived from MODIS LAI products, the Sentinel-2 striping artifacts were markedly reduced (Fig. 8 vs. uncorrected estimates in Fig. A5), resulting in seamless 20 m yield surfaces with strong spatial continuity. Detailed yield estimates are shown in Fig. 9. Across five-year estimates, soybean yield in Northeast China predominantly ranged between 1500 and 2500 kg ha−1, with higher yields concentrated in the central plains, a region characterized by flat terrain and favourable agroclimatic conditions. The predicted yields are consistent with the municipal-scale statistical data (Table 5). Spatial variability, quantified by the coefficient of variation (CV), ranged from 17.51 % to 29.65 % over the study period, reflecting both interannual and intra-annual heterogeneity in soybean productivity (Table 5).
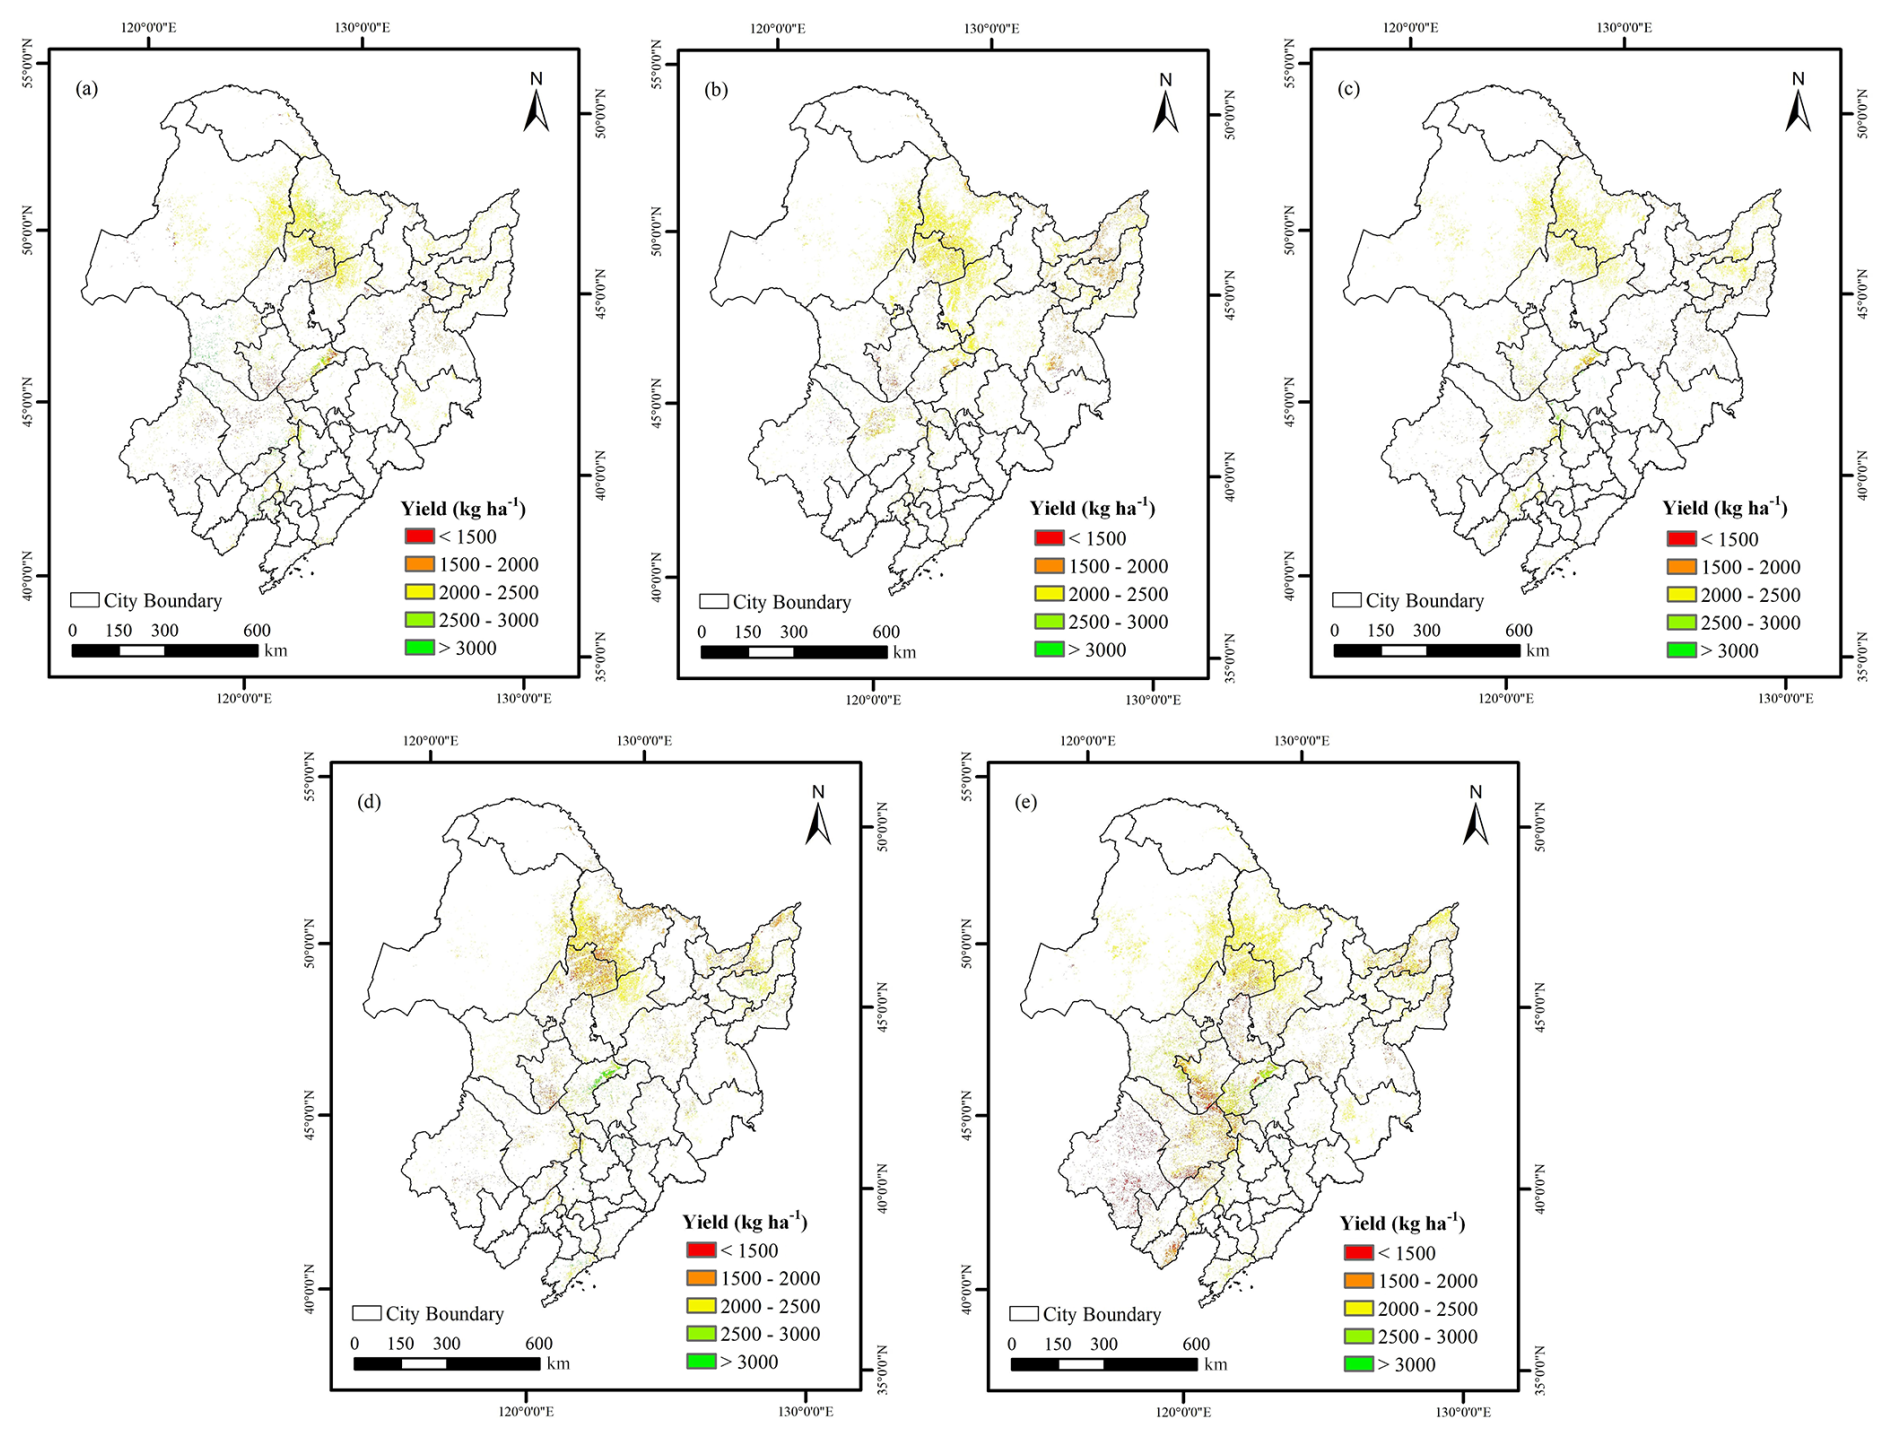
Figure 8Spatial distribution of annual soybean yield derived from Sentinel-2 after calibration in Northeast China from 2019 to 2023. (a)–(e) correspond to the years 2019, 2020, 2021, 2022, and 2023, respectively.
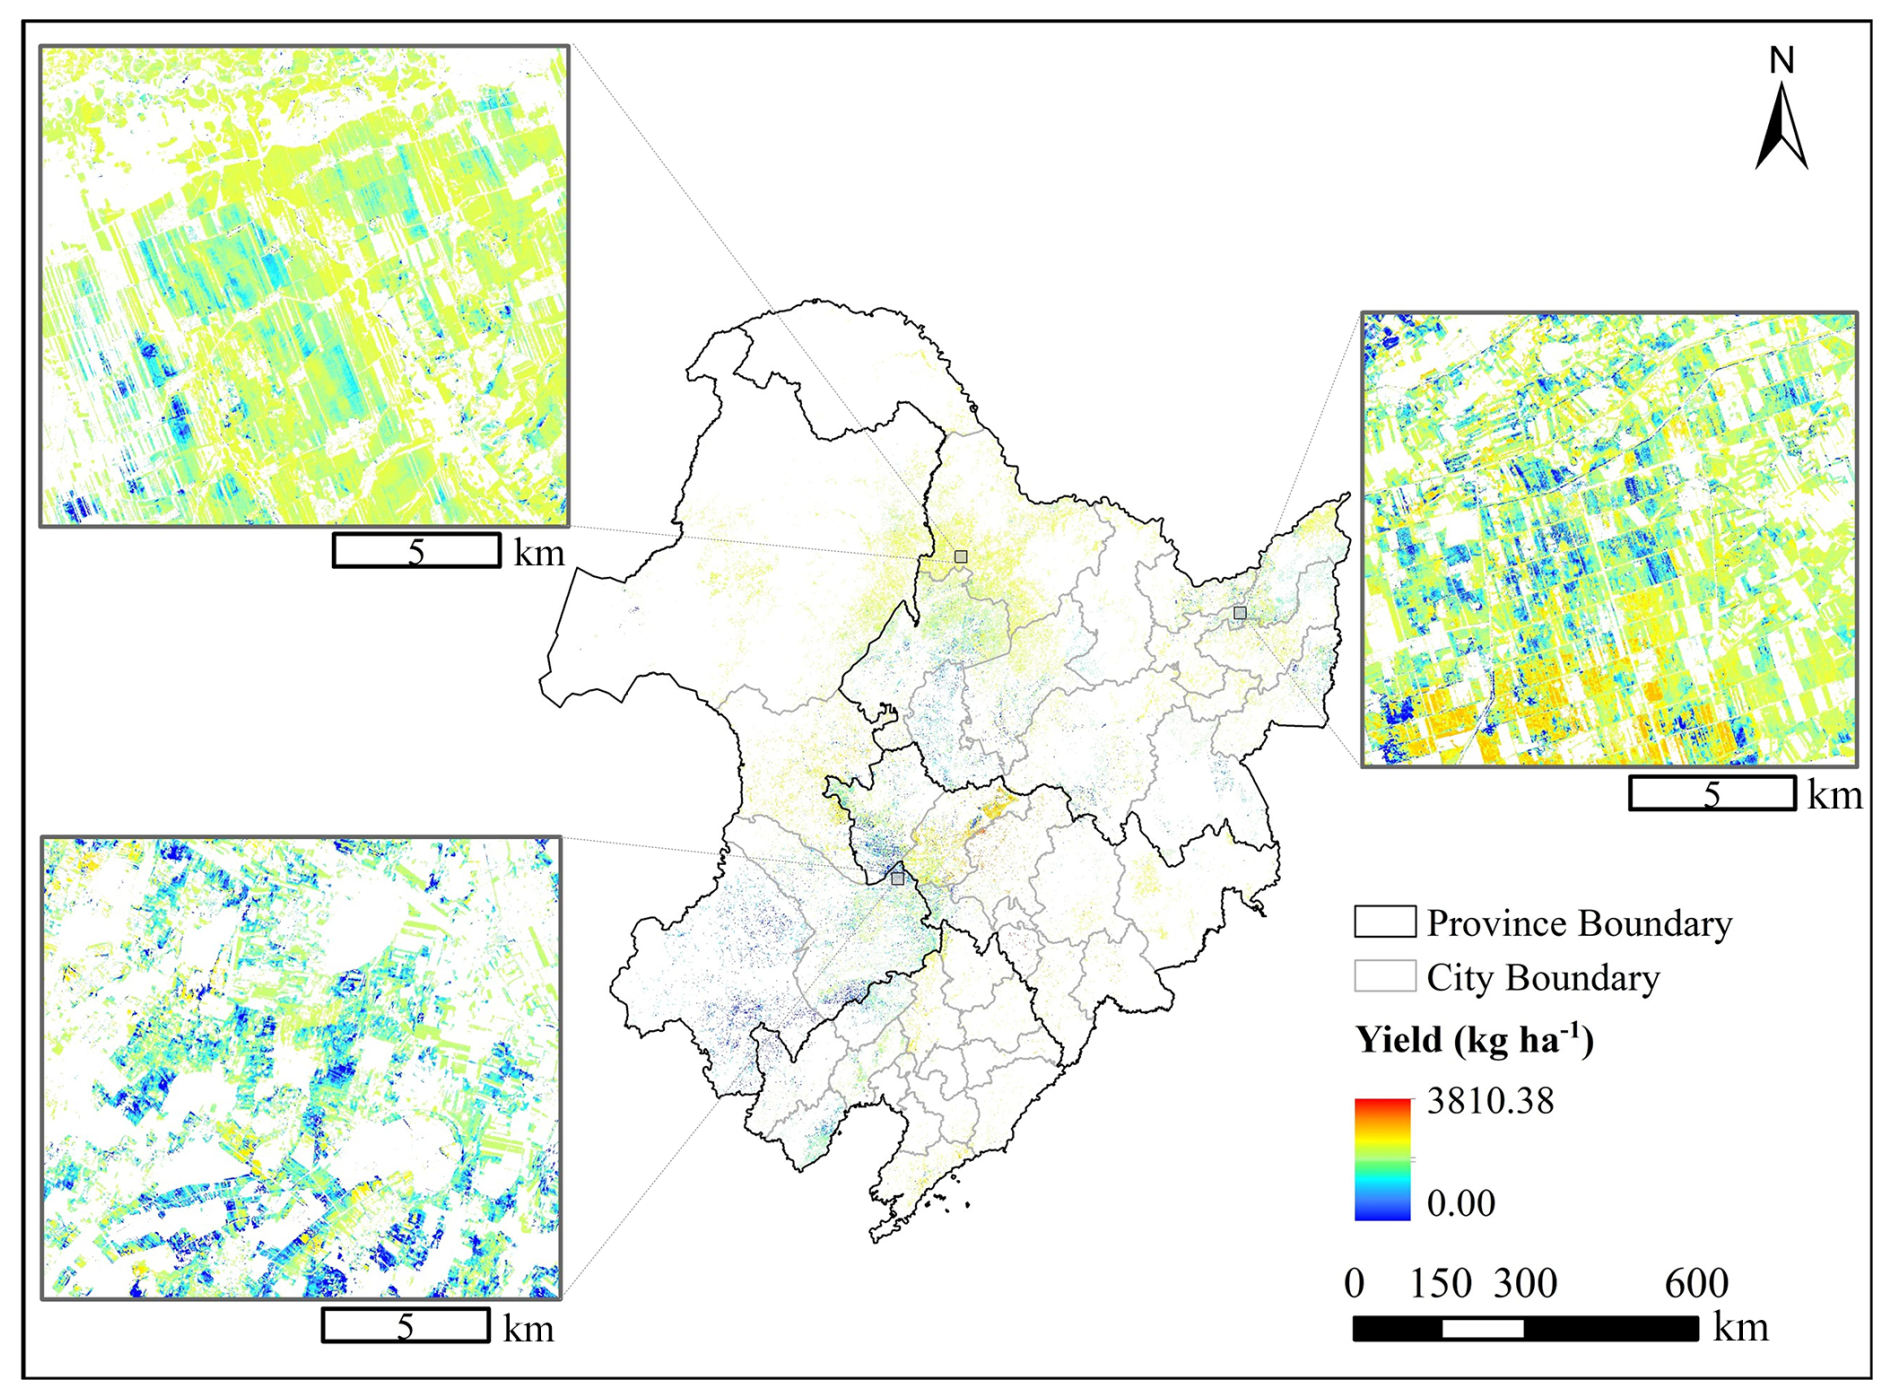
Figure 9An example of a yield estimate for 2023 used to showcase detailed local estimates.
Table 5Mean values of statistical soybean yield at municipal scale in Northeast China compared with mean values, standard deviation (STD) and coefficient of variation (CV) for estimated soybean yield in Northeast China. The statistical data was not available for 2023 at the time of analysis.
We further analysed the spatial-temporal variation of soybean yield at the provincial scale (Fig. 10). On average, provincial-scale estimates achieved a MRE of 7.94 % (Fig. 10b), with the highest accuracy observed in 2022 (Fig. 10b), mirroring municipal-level results (Fig. 6d). Over 2019–2022, Liaoning Province consistently exhibited the highest yields, whereas Heilongjiang Province, despite having the largest soybean planting area, recorded the lowest yields (Fig. 10a). This disparity is likely due to Heilongjiang's cooler climate, where later planting dates result in a shorter soybean growing period. Across the four provinces, yields remained relatively stable, except in Jilin Province, which showed the greatest interannual fluctuation exhibiting distinct decline followed by recovery. These results underscore the capacity of the proposed hybrid framework to capture spatial-temporal variations in soybean production.
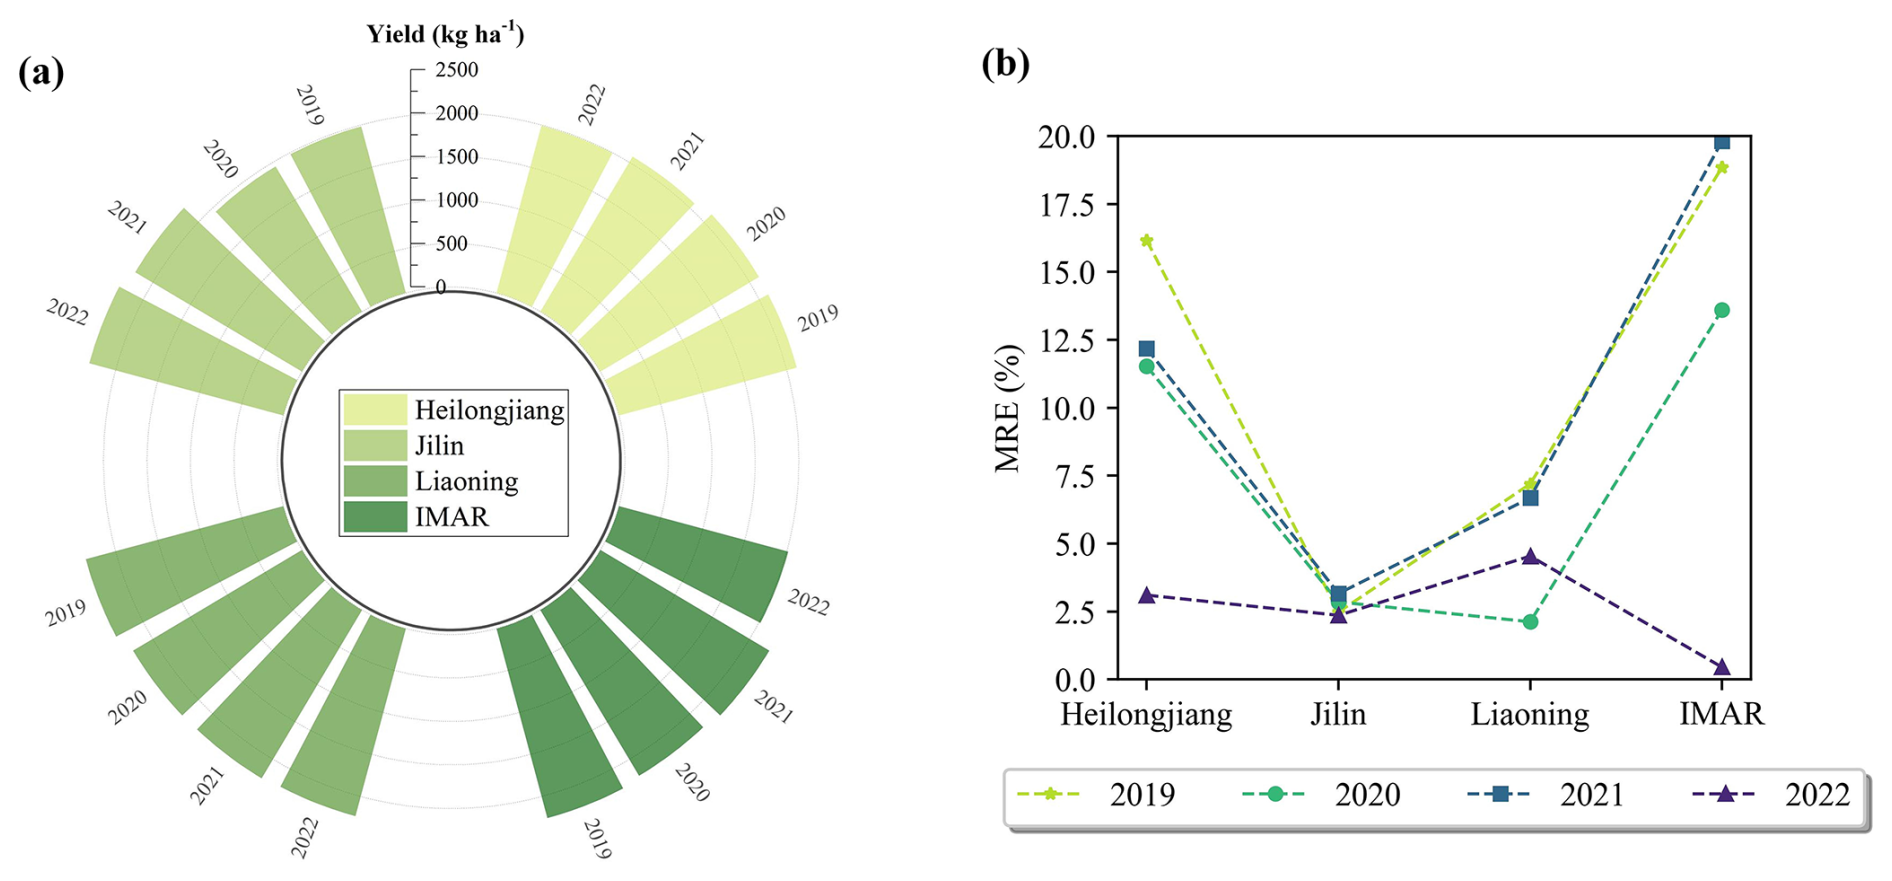
Figure 10Accuracy of the soybean yield estimation at provincial scale in Northeast China from 2019 to 2022. (a) shows changes in estimated yield for each province over time; (b) shows the mean relative error (MRE) of results compared with statistical yield for each province.
5.1 Selection of model input features
In this study, two stage-averaged LAI (LAImean1 and LAImean2) were selected as alternative input features to DVS-aligned LAI for soybean yield estimation. Although full LAI sequences yielded higher accuracy at local scale (Figs. 5 and A4), their regional application was limited by (a) strong spatiotemporal heterogeneity of Sentinel-2 image availability (Fig. A1), which required constructing a specific time-series input for each site individually, and (b) substantial computational and data-management costs related to model training and maintenance for many different sequence-patterns. The two stage-averaged LAI features provide a computationally efficient solution for regional yield mapping, while full time-series inputs offer modest accuracy gains that are best exploited at local scales or where dense, regular observations are available.
For further analysis, we systematically evaluated a broad set of candidate features derived from LAI, transpiration (TRA), and surface soil moisture (SM) extracted from the simulated soybean growth dataset. To develop a unified model suitable for long-term and large-scale soybean yield estimation, we employed statistical summaries of these features rather than time-series features tied to specific image acquisition dates (as done by Du et al., 2025). For each variable, four statistical descriptors – including mean, maximum, median, and cumulative sum – were calculated separately for the vegetative growth stage, the reproductive growth stage, and the whole growing season, following the approach of Ren et al. (2023b).
As shown in Fig. 11, LAI-derived features exhibited consistently strong correlations with simulated yield (r=0.54 to 0.88), reflecting the role of LAI as a critical proxy for canopy development, light interception, and biomass accumulation (Cao et al., 2025; Shi et al., 2025). Multispectral LAI retrieval therefore effectively characterizes both canopy structure and physiological status, supporting its dominant predictive power in our feature set.
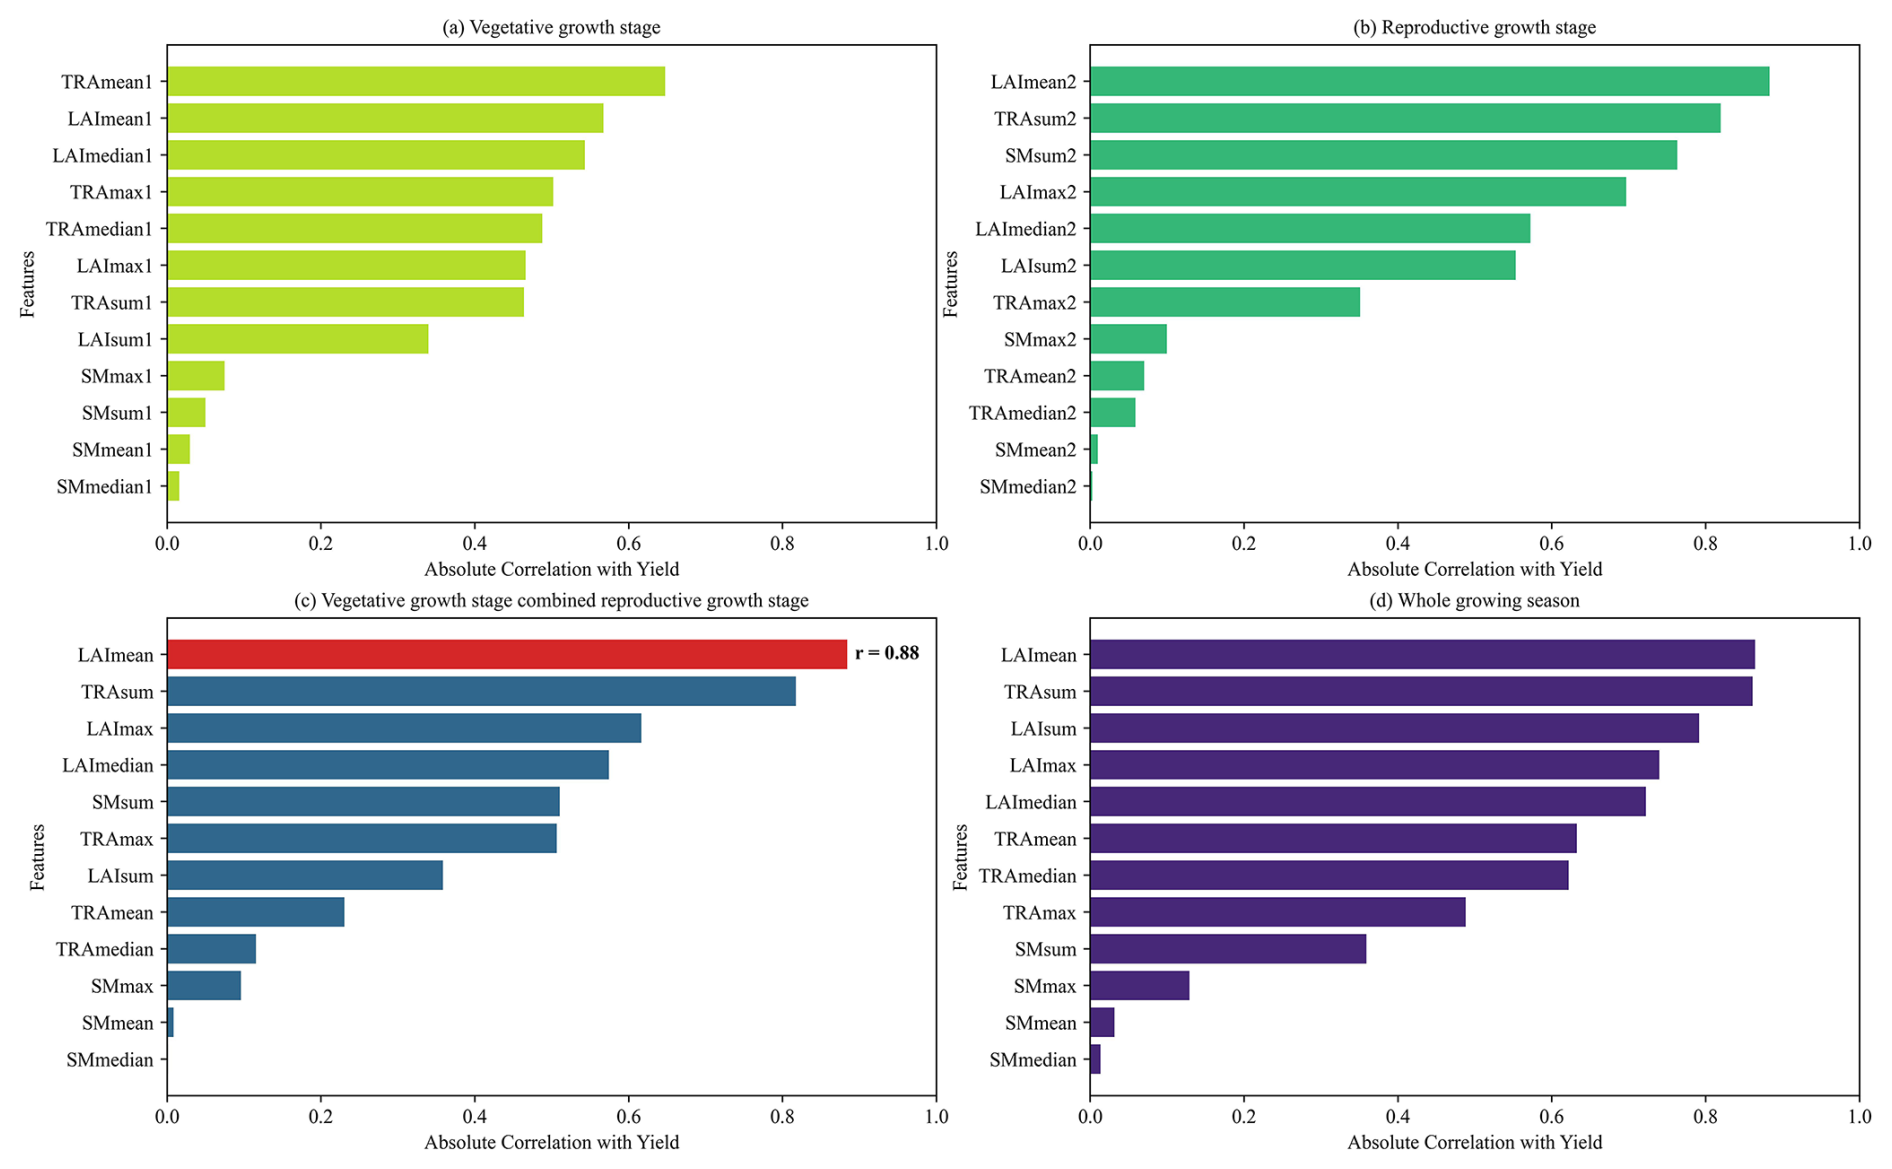
Figure 11The absolute Pearson correlation coefficients between each candidate feature and simulated soybean yield, grouped by growth stages: (a) vegetative growth stage; (b) reproductive growth stage; (c) vegetative growth stage combined reproductive growth stage and (d) whole growing season, respectively.
Notably, the two stage-averaged LAI (LAImean1 and LAImean2) exhibited stronger correlations with yield than features derived from either single phenological stage or the entire growing season, which is consistent with Ren et al. (2023b). Conceptually, LAImean1 captures vegetative vigor (establishment and biomass accumulation, Kodadinne Narayana et al., 2024), while LAImean2 reflects reproductive canopy status. These two features jointly summarize the two most yield-informative phases and mitigate the redundancy present in full sequences. Among the candidate features, mean-based features outperformed maximum, median, and cumulative counterparts. This is likely due to their lower sensitivity to extreme values and day-to-day fluctuations, making them a more stable and representative indicator of canopy conditions across the two growth periods.
While some TRA-based features (e.g., TRAsum) showed relatively high correlation with yield, they were excluded owing to practical constraints. Current TRA retrieval methods primarily rely on thermal-infrared remote sensing, which typically has coarse spatial and temporal resolution (Anderson et al., 2024; Hou et al., 2018) limiting its utility for high-resolution, regional mapping. Similarly, SM-related features showed weak or inconsistent correlations with yield across growth stages in our simulations, indicating a limited direct influence on soybean yield formation under modelled conditions.
In summary, to optimize model inputs for efficient, large-scale applications, and to facilitate the generation of a soybean yield dataset, the two stage-averaged LAI features (LAImean1 and LAImean2) were selected. This selection balances physiological relevance and temporal specificity with strong predictive performance and practical feasibility, enabling competitive yield estimation using only two interpretable, remotely sensed retrievable predictors.
5.2 The complementarity between MODIS and Sentinel-2
This study generated soybean yield estimates using both MODIS LAI (500 m) products and Sentinel-2-derived LAI (20 m) data. Over 2019–2022, the MODIS-based estimates achieved an overall R2 of 0.58 (p<0.01), an RMSE of 272.36 kg ha−1 and a MRE of 12.08 % (Fig. 12b), slightly lower than the Sentinel-2-based results (Fig. 12a). The uncertainty of MODIS-based estimates was higher than that of the Sentinel-2-based estimates, likely reflecting MODIS's coarser resolution. However, the Sentinel-2-based estimates exhibit inherent seaming effects caused by cloud-affected tile edges. We additionally used MODIS LAI to bias-correct Sentinel-2 yield maps, effectively minimizing the striping (“seaming”) effects in the 20 m products (Fig. 9), while preserving pixel-level detail through tile-based calibration. Despite differences in spatial resolution, both MODIS and Sentinel-2 satellite data demonstrated comparable ability to capture spatiotemporal variation in soybean yield (Fig. 13), achieving correlations with statistical data >0.55 and overall errors <13 % across all years.
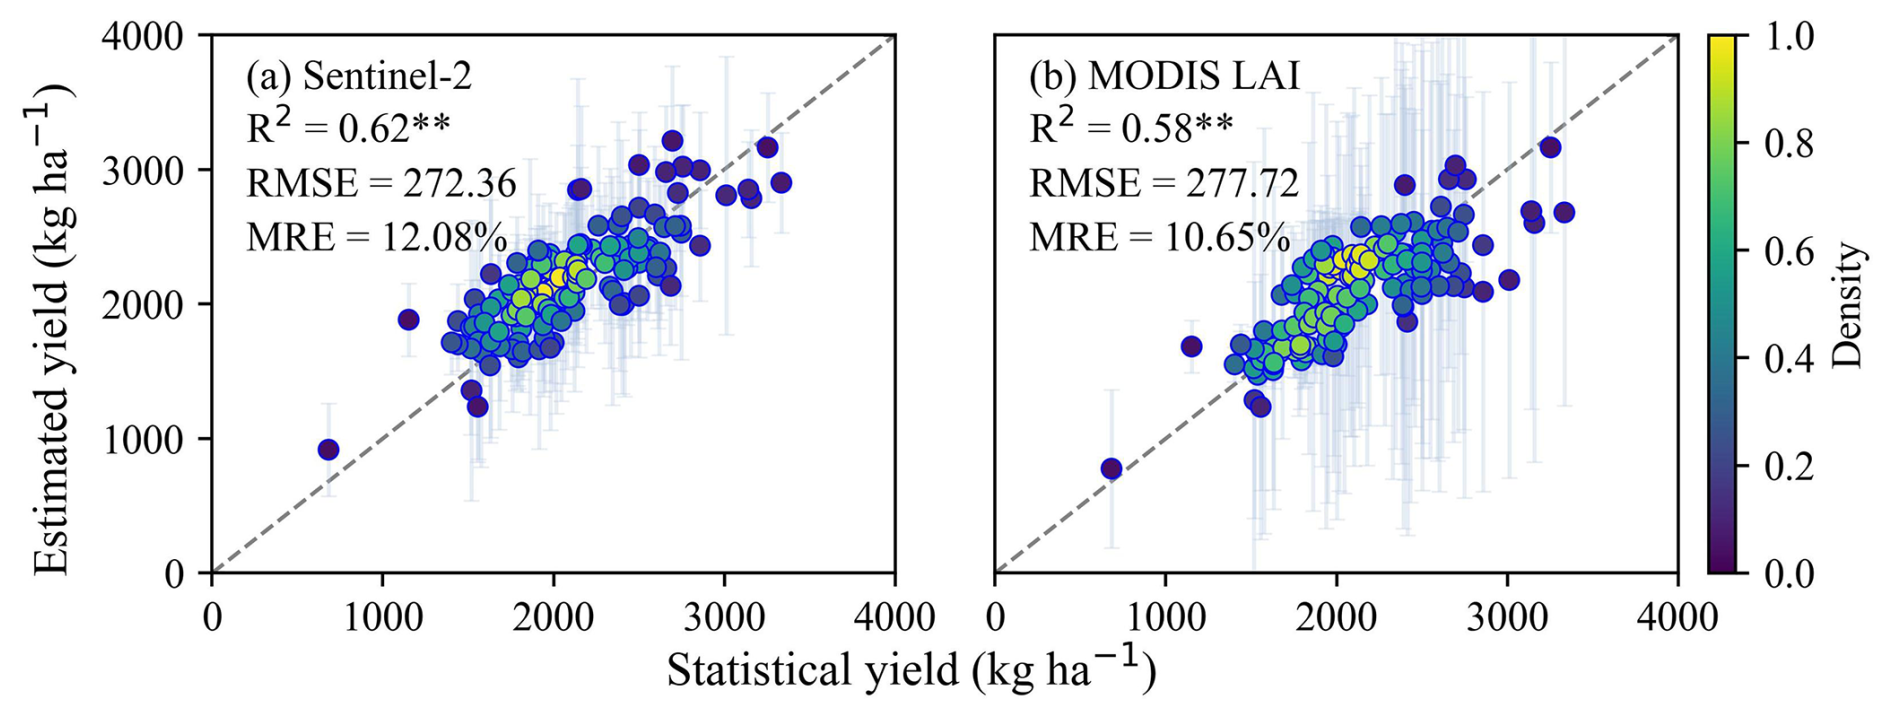
Figure 12Comparison between estimated and statistical yield for 2019–2022 using Sentinel-2 (a) and MODIS LAI (b), respectively (excluding 2023 for which no statistical data was reported at the time of analysis). Error bars represent one standard deviation indicating the uncertainty of yield estimation. The dashed line represents the 1:1 line. ** denotes statistical significance at p<0.01.
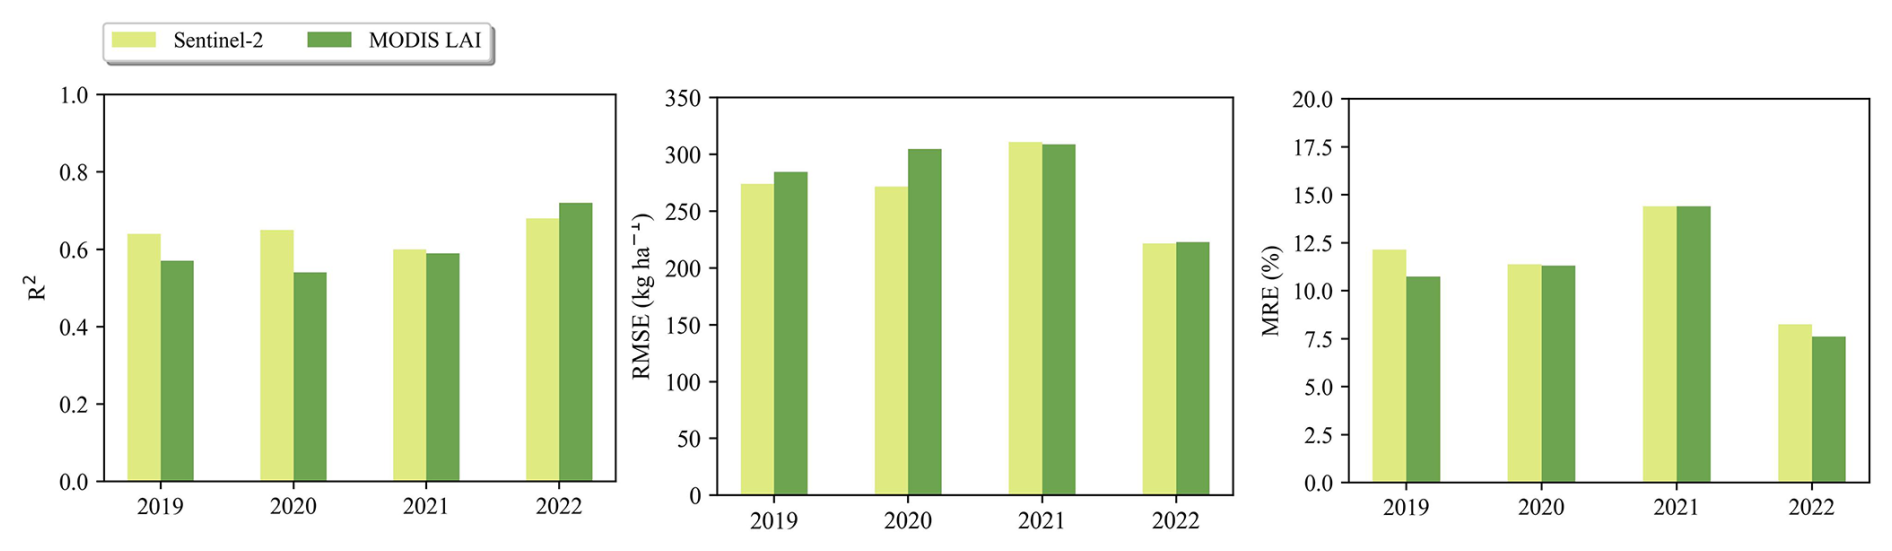
Figure 13Comparison of accuracy evaluation results for soybean yield estimation in 2019–2022 (excluding 2023, for which no statistical data was reported at the time of analysis) using Sentinel-2 and MODIS LAI data, respectively.
In practical applications, balancing both temporal and spatial resolution is critical for achieving robust yield prediction results (Azzari et al., 2017). Figure 14 compares the Sentinel-2 yield maps and the MODIS LAI yield maps within a 10 km grid under different soybean coverage. Thanks to 4 d revisit, MODIS LAI provides more cloud-free observations during the critical growth stages, improving the reliability of two stage-averaged LAI (LAImean1 and LAImean2). Its coarser spatial resolution also accelerates spatial processing over large areas. However, Sentinel-2's finer spatial resolution more effectively resolves intra-field yield heterogeneity (Fig. 14). MODIS-derived maps occasionally underestimated yields due to mixed pixels containing non-crop features (e.g., infrastructure), whereas Sentinel-2 minimized such errors.
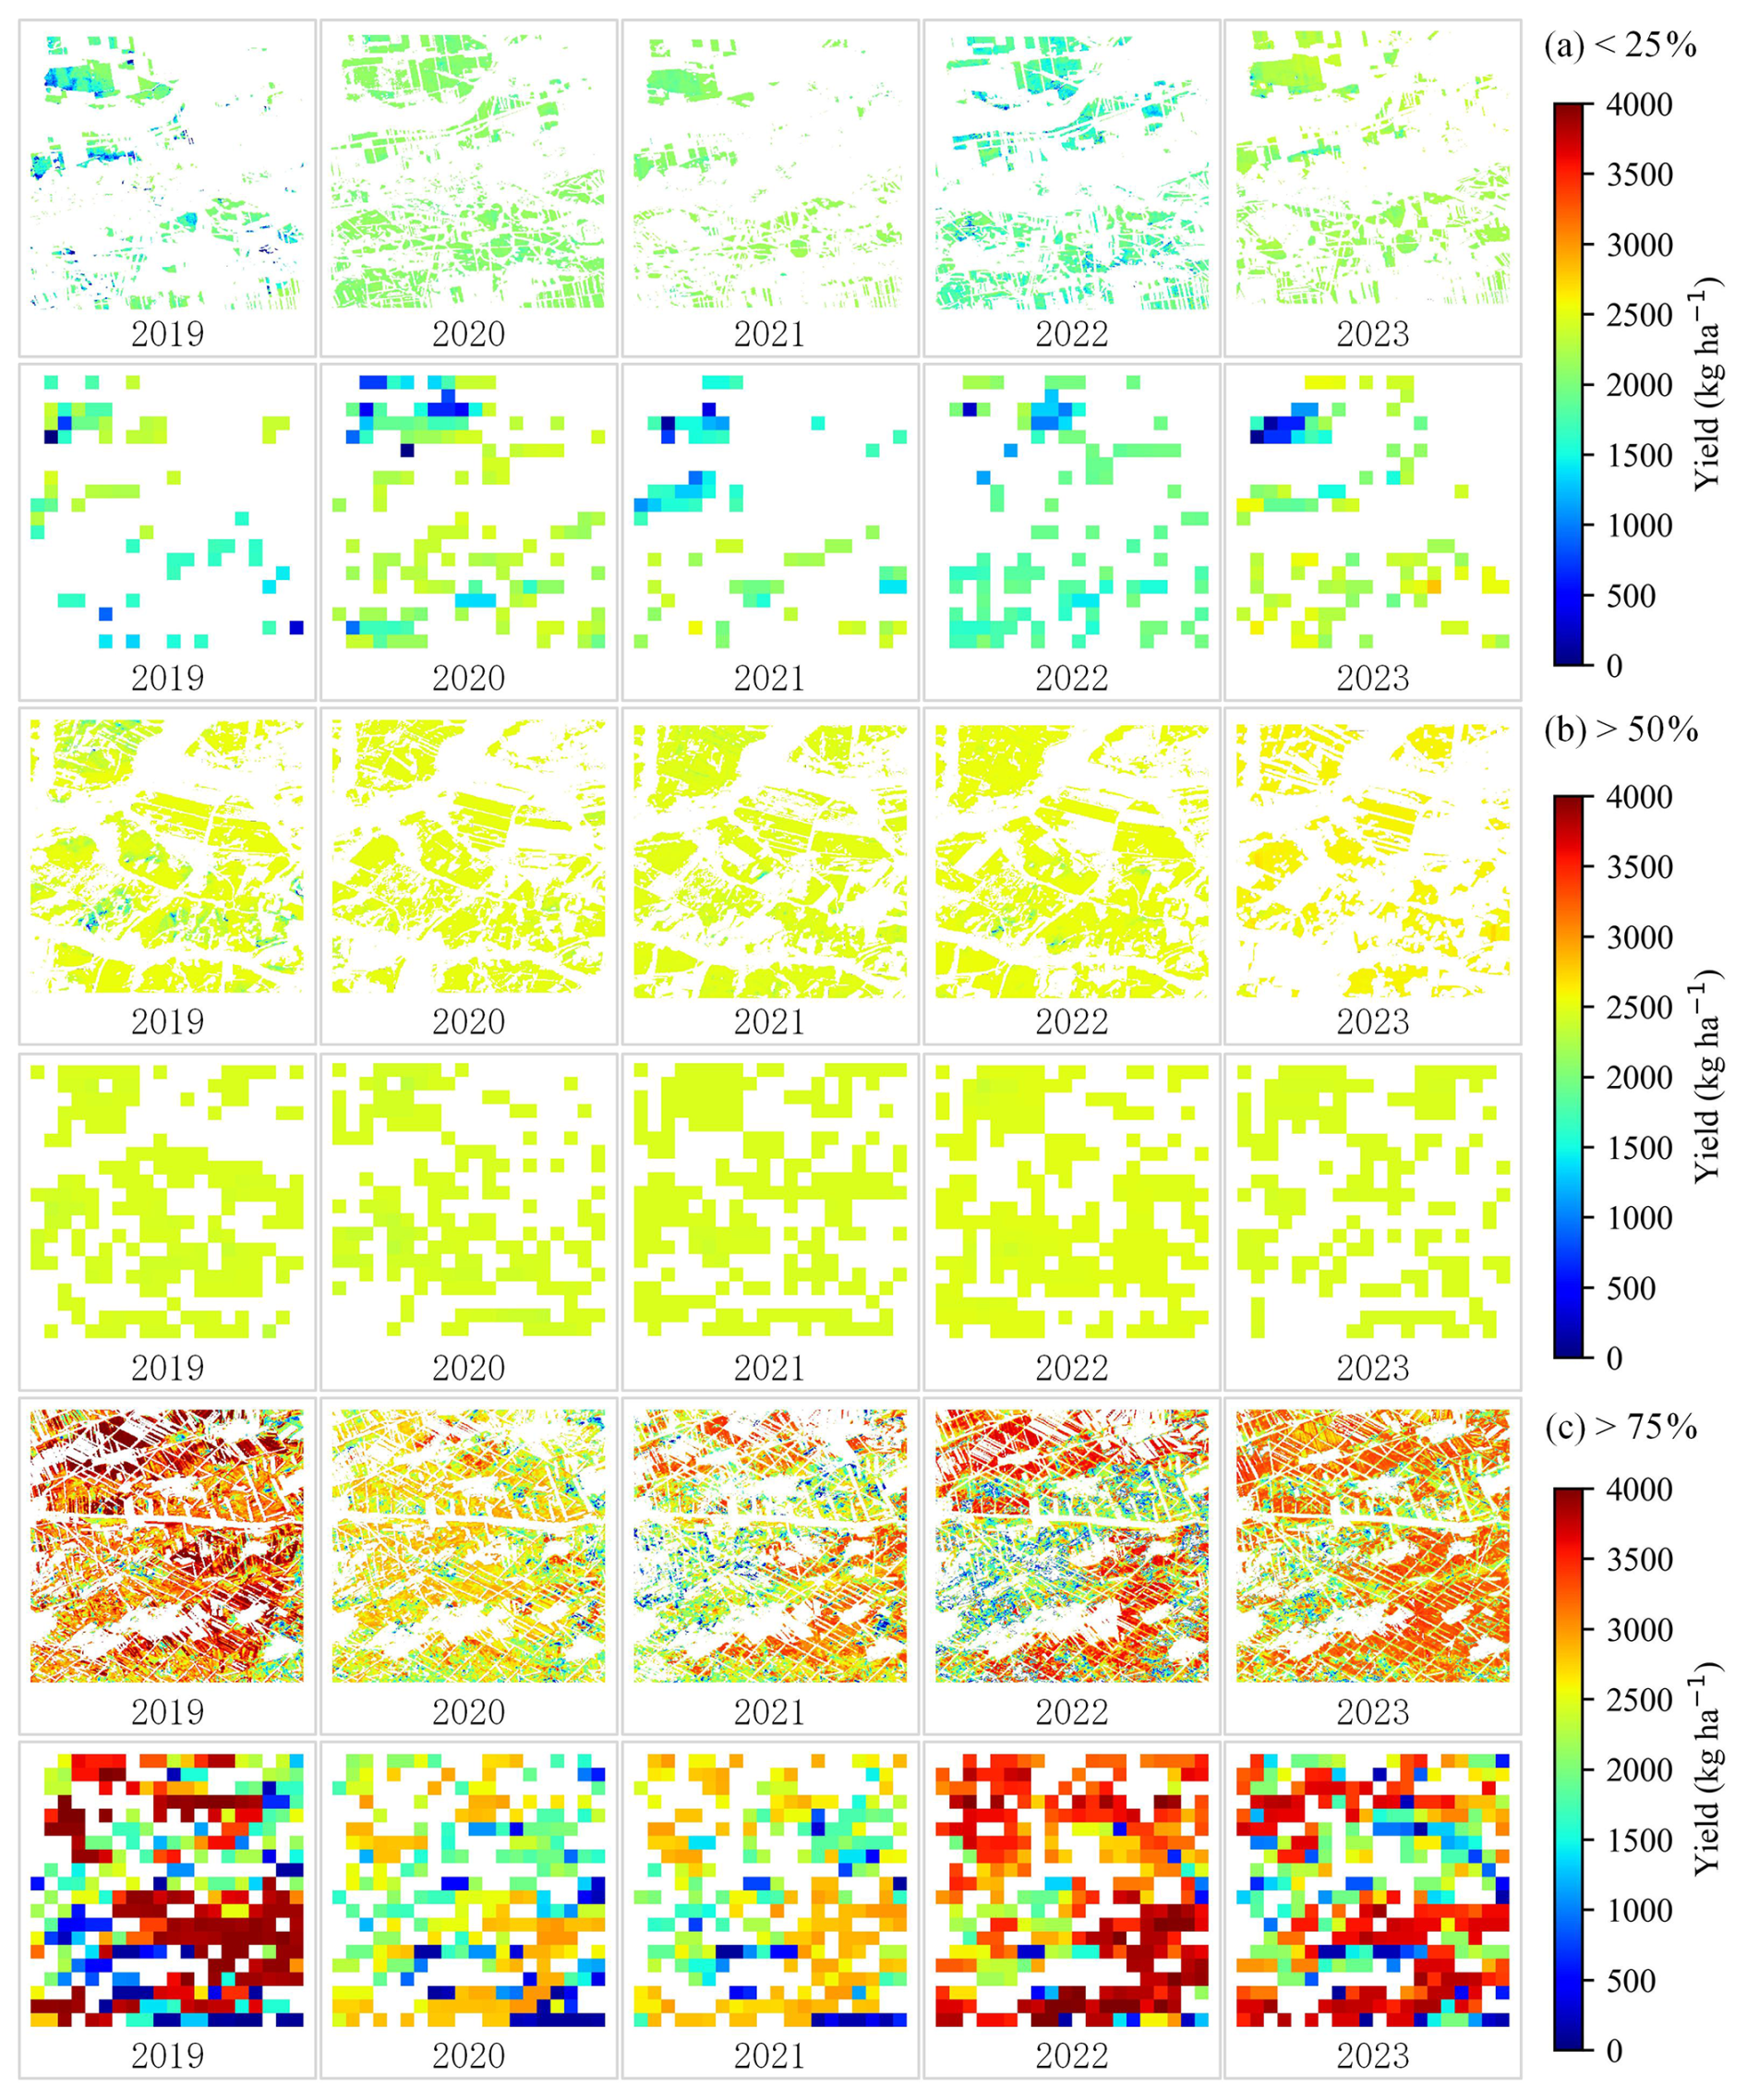
Figure 14Comparisons of soybean yield estimation within a 10 km grid under different soybean coverage using Sentinel-2 (20 m) and MODIS LAI (500 m) data, where (a), (b), (c) represent soybean coverage of less than 25 %, more than 50 % and more than 75 %, respectively.
While this study prioritized high-resolution mapping (using MODIS solely for Sentinel-2 seam correction), combining high-spatial-resolution data (e.g., Sentinel-2 or UAV imagery) with high temporal frequency satellites (e.g., geostationary sensors or radar) could provide an optimal data source for crop-yield modelling (Gao and Anderson, 2019; He et al., 2018).
5.3 Advancements in this study
Accurate monitoring of soybean yield is crucial for food policy decision-making and security assessment. While previous studies have primarily explored the impact of environmental factors such as climate on soybean productivity (Guo et al., 2022; Zhao et al., 2023a), few efforts have focused on producing high-resolution soybean yield datasets for China's major soybean-producing regions. To address this gap, our study produced the NortheastChinaSoybeanYield20m dataset, a 20 m resolution dataset generated through a hybrid framework integrating the mechanistic WOFOST crop growth model and a GRU deep learning algorithm. Unlike purely data-driven approaches that rely on extensive ground data, our approach leveraged both data mining capabilities and mechanistic modelling, which improves the model's interpretability and enhances its potential for transferability across regions. The integration of the WOFOST model ensured the simulation of diverse production conditions under varying climate, soil, crop variety and management conditions, providing a robust synthetic training dataset for the GRU network. This combination allowed the model to perform well, even in areas with limited observational data, therefore overcoming common limitations related to data scarcity and high computational costs. Accuracy assessments using both in situ and statistical yield data confirmed that the generated NortheastChinaSoybeanYield20m dataset delivered reliable yield estimates across field and regional scales (Figs. 5 and 6). The results also verified the model's stability across time and space, reinforcing its potential for large-scale agricultural monitoring and strategic planning.
When compared to previous studies using integrated remote sensing data and a process-based model to estimate soybean yield, for instance, Baup et al. (2015) reported estimation errors ranging from 2 % to 18 %, our method achieved comparable levels of accuracy. It also outperformed existing field-scale studies (e.g., RMSE=400.946 kg ha−1 in Ren et al., 2023a, and MRE of 29.73 % in Du et al., 2014) and municipal-scale models (e.g., MRE=16 % in Von Bloh et al., 2023). Furthermore, the NortheastChinaSoybeanYield20m dataset showed improved performance relative to similar high-resolution soybean yield products from other countries (e.g., annual 30 m soybean yield mapping in Brazil, with R2 values between 0.31 and 0.71 and RMSEs ranging from 275 to 740 kg ha−1) (Song et al., 2022).
Although studies based on UAV and RGB data have demonstrated even higher soybean yield estimation accuracy (Li et al., 2021, 2024), such methods are often constrained by high costs and limited spatial coverage, making them impractical for large-scale applications. In contrast, the method developed in this study offers a well-balanced solution that combines computational efficiency, high spatial resolution, and strong predictive accuracy. Our approach offers a scalable and practical solution for producing high-resolution, large-scale crop yield datasets.
5.4 Limitations and future developments
In this study, a soybean growth dataset was developed by simulating various combinations of input parameters within the WOFOST model. These diverse parameter combinations were designed to reflect different environmental and management conditions, ultimately serving as training data for the yield estimation model. One advantage of the model is its scalability: it can be readily applied to other regions and countries that lack sufficient ground observation data, such as parts of Africa and India, thus offering a promising tool for global agricultural monitoring.
However, the validation results revealed some notable limitations. Specifically, the model exhibited a tendency to produce high uncertainty in low- or high- yielding areas, introducing error into the overall yield estimation (Figs. 5 and 6). This pattern suggests a systematic bias in the model's predictions, particularly in regions with extreme yield values. Additionally, spatial analysis showed that estimation errors were more pronounced in the northern region, which is characterized by complex terrain, compared to the relatively flat central region (Fig. 7). These discrepancies highlight the need to refine parameterization for extreme yield conditions and integrate higher-resolution environmental drivers (e.g., terrain, localized weather).
First, the estimation errors may be attributed to the inherent limitations of the WOFOST model. As a process-based model, WOFOST simplifies its calculations for simulating physiological processes, which can hinder its ability to fully replicate the complex realities of soybean in the field. Factors such as pest infestations, diseases, and abiotic stresses are either oversimplified or excluded (Gaso et al., 2024). These omissions can lead to systematic simulation errors, particularly under stress conditions that significantly affect crop yield. Moreover, the parameterization of the WOFOST model in this study purely relied on values from literature and existing datasets rather than site-specific optimization against independent observations. As a result, local variability because of farming practices, soil properties, and environmental conditions may not have been adequately captured. This lack of local optimization likely resulted in higher estimation error, especially in complex landscapes with sparse ground observations. For future studies, the use of targeted field-measured and remotely sensed products (e.g., surface soil moisture, solar-induced chlorophyll fluorescence (SIF), LiDAR-based biomass, and leaf chlorophyll content), integration of advanced data assimilation approaches (e.g., assimilating SIF or leaf chlorophyll content) and model sensitivity analyses will further increase biological realism. Moreover, given the spatial variability in soybean growth within the study area, constructing ecological zones based on factors like climate, elevation, and management practices might provide a more targeted model approach. For instance, Huang et al. (2023) defined ecological zones using Theissen polygons derived from meteorological station locations. This zoning strategy could enhance the representativeness of the training data and reduce yield estimation uncertainties.
Second, the estimation errors may stem from the overfitting of the GRU model. The GRU was trained on the simulated soybean growth dataset, a large number of simulations that included all available combinations (e.g., all meteorological data), which introduced a significant amount of redundant information. The redundancy not only potentially reduced the dataset's representativeness, but also increased the computational burden during model training. As a result, the trained GRU model may have become overly tuned to specific temporal patterns in certain years, limiting its ability to generalize to other time periods or regions with different growth conditions. This overfitting effect might result in large yield estimation errors across different years and regions, particularly in areas where soybean yields deviated significantly from the norm. To address these issues, refining the structure and composition of the training dataset, and removing redundant information would enhance the diversity and quality of the training inputs. One potential approach to reduce redundancy is through spatiotemporal clustering of environmental variables (e.g., meteorological station data), which could filter out stations with highly similar information. Moreover, monitoring the validation error throughout the training process, and implementing regularization techniques (e.g., L2 weight regularization) could help to prevent overfitting and improve the GRU model's generalization capability, leading to improved soybean estimation across varying conditions.
Third, using the two stage-averaged LAI introduces additional sources of uncertainty in yield estimation. Excessive temporal aggregation inevitably obscures growth dynamics. Different growth trajectories can produce similar stage-based LAI yet correspond to different yields, increasing the risk of non-unique relationships between LAI and spatial yield patterns. This simplification also limits the modelling capacity of GRU architectures, which are specifically designed to exploit sequential dependencies in time series inputs. Future work could explore hybrid approaches that combine stage-based summaries with higher-frequency or full-season time series of vegetation indicators to improve both interpretability and yield prediction robustness. In addition, future model extensions could consider architectures specifically designed for irregular or missing sequential observations, such as GRU-D or Transformer-based approaches (Che et al., 2018; Chen et al., 2022b). These models may provide a more flexible way to capture temporal dependencies under non-uniform observation intervals and could further improve the robustness of soybean yield estimation in data-sparse conditions. On the other hand, errors in LAI retrieval from remote sensing data also contributed uncertainty to yield predictions. The published LAI–NDVIRE relationship is broadly transferable because red-edge-based VIs are less sensitive than traditional VIs (e.g., NDVI, CIgreen and EVI) to variations in canopy structure, phenology, and site locations (Dong et al., 2019; Nguy-Robertson et al., 2014; Viña et al., 2011). Red-edge-based VIs (e.g., NDVIRE) also mitigate soil-background influences. Nevertheless, the modest overestimation we observe at low LAI indicates that residual soil-background differences between our Northeast China sites and the original Spanish and Italian calibration plots can still bias the regression under sparse canopies. Directly applying the published LAI–NDVIRE regression without regional re-calibration may therefore propagate bias into yield estimates. Integrating agronomic knowledge with remote sensing mechanisms has emerged as a promising way to reduce uncertainty and improve model reliability (Chen et al., 2022a; Hu et al., 2024). In future work, coupling radiative transfer models such as PROSAIL (Jacquemoud et al., 2009) with a crop growth model would allow the direct use of satellite reflectance and is expected to reduce bias from site-specific LAI regressions and further improve model accuracy (Ntakos et al., 2024).
Finally, the combination of IoT, blockchain, and precision agriculture with machine learning and biophysical models can offer a powerful framework for sustainable agricultural monitoring, addressing challenges in data heterogeneity, model scalability, and decision-making processes. These technologies can facilitate real-time data collection, ensure data security and transparency. Precision agriculture techniques, combined with advanced sensing technologies, can effectively improve the accuracy and timeliness of input data, addressing current limitations in model calibration, validation and prediction.
The soybean yield dataset for Northeast China (NortheastChinaSoybeanYield20m) during the 2019–2023 period is available at https://doi.org/10.5281/zenodo.14263103 (Xu et al., 2024).
This study generated a high-resolution (20 m) soybean yield dataset for Northeast China from 2019 to 2023 (NortheastChinaSoybeanYield20m) using a hybrid framework that couples the WOFOST crop growth model with a GRU deep learning algorithm. The framework leveraged a comprehensive soybean growth dataset simulated by WOFOST, which accounted for diverse production conditions, including variations in climate, crop varieties, soil types and agro-management practices. This approach effectively reduces reliance on ground observation data, thereby demonstrating enhanced spatiotemporal generalization capability.
The dataset was generated using multisource remote sensing data, with Sentinel-2-derived, two stage-averaged LAI as the primary input. Yield estimation showed robust performance at both field and municipal scales, achieving RMSE values of 287.44 and 272.36 kg ha−1, respectively. To address spatial discontinuities in Sentinel-2 data, corrections using MODIS LAI-derived yield maps effectively mitigated seam effects, achieving complementary benefits in temporal and spatial resolution. The final dataset exhibits high temporal stability and spatial continuity, with MREs averaging 11.46 % at the municipal scale and 7.94 % at the provincial scale.
The NortheastChinaSoybeanYield20m dataset successfully captures fine-scale spatiotemporal variations in soybean yield, offering potential for optimizing production strategies, guiding precision agriculture, enhancing food security, and informing policy.
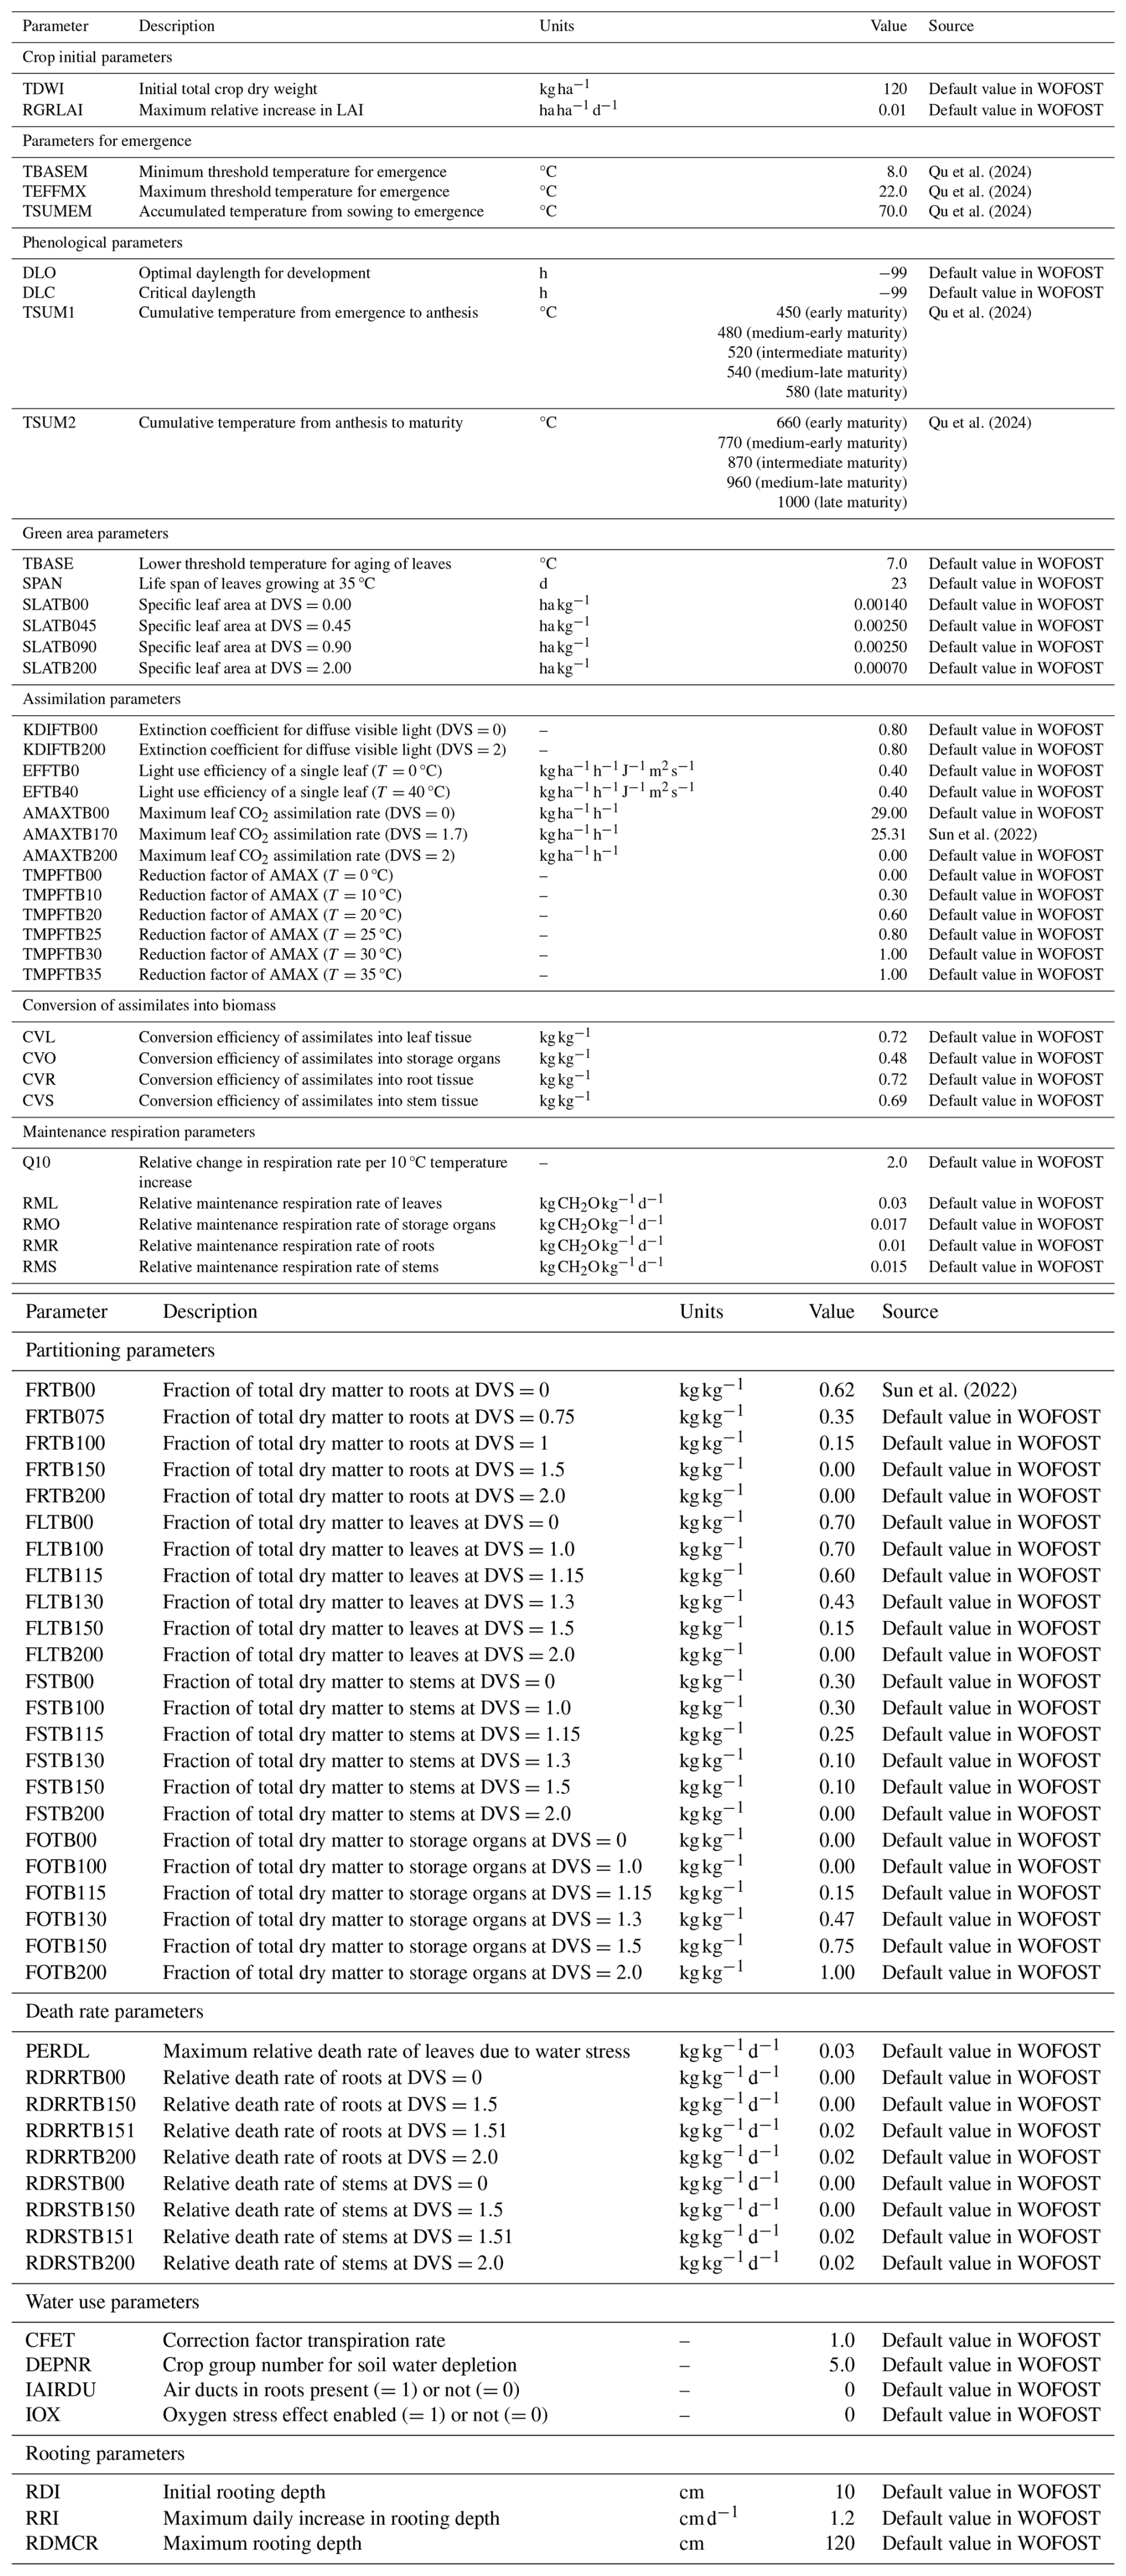
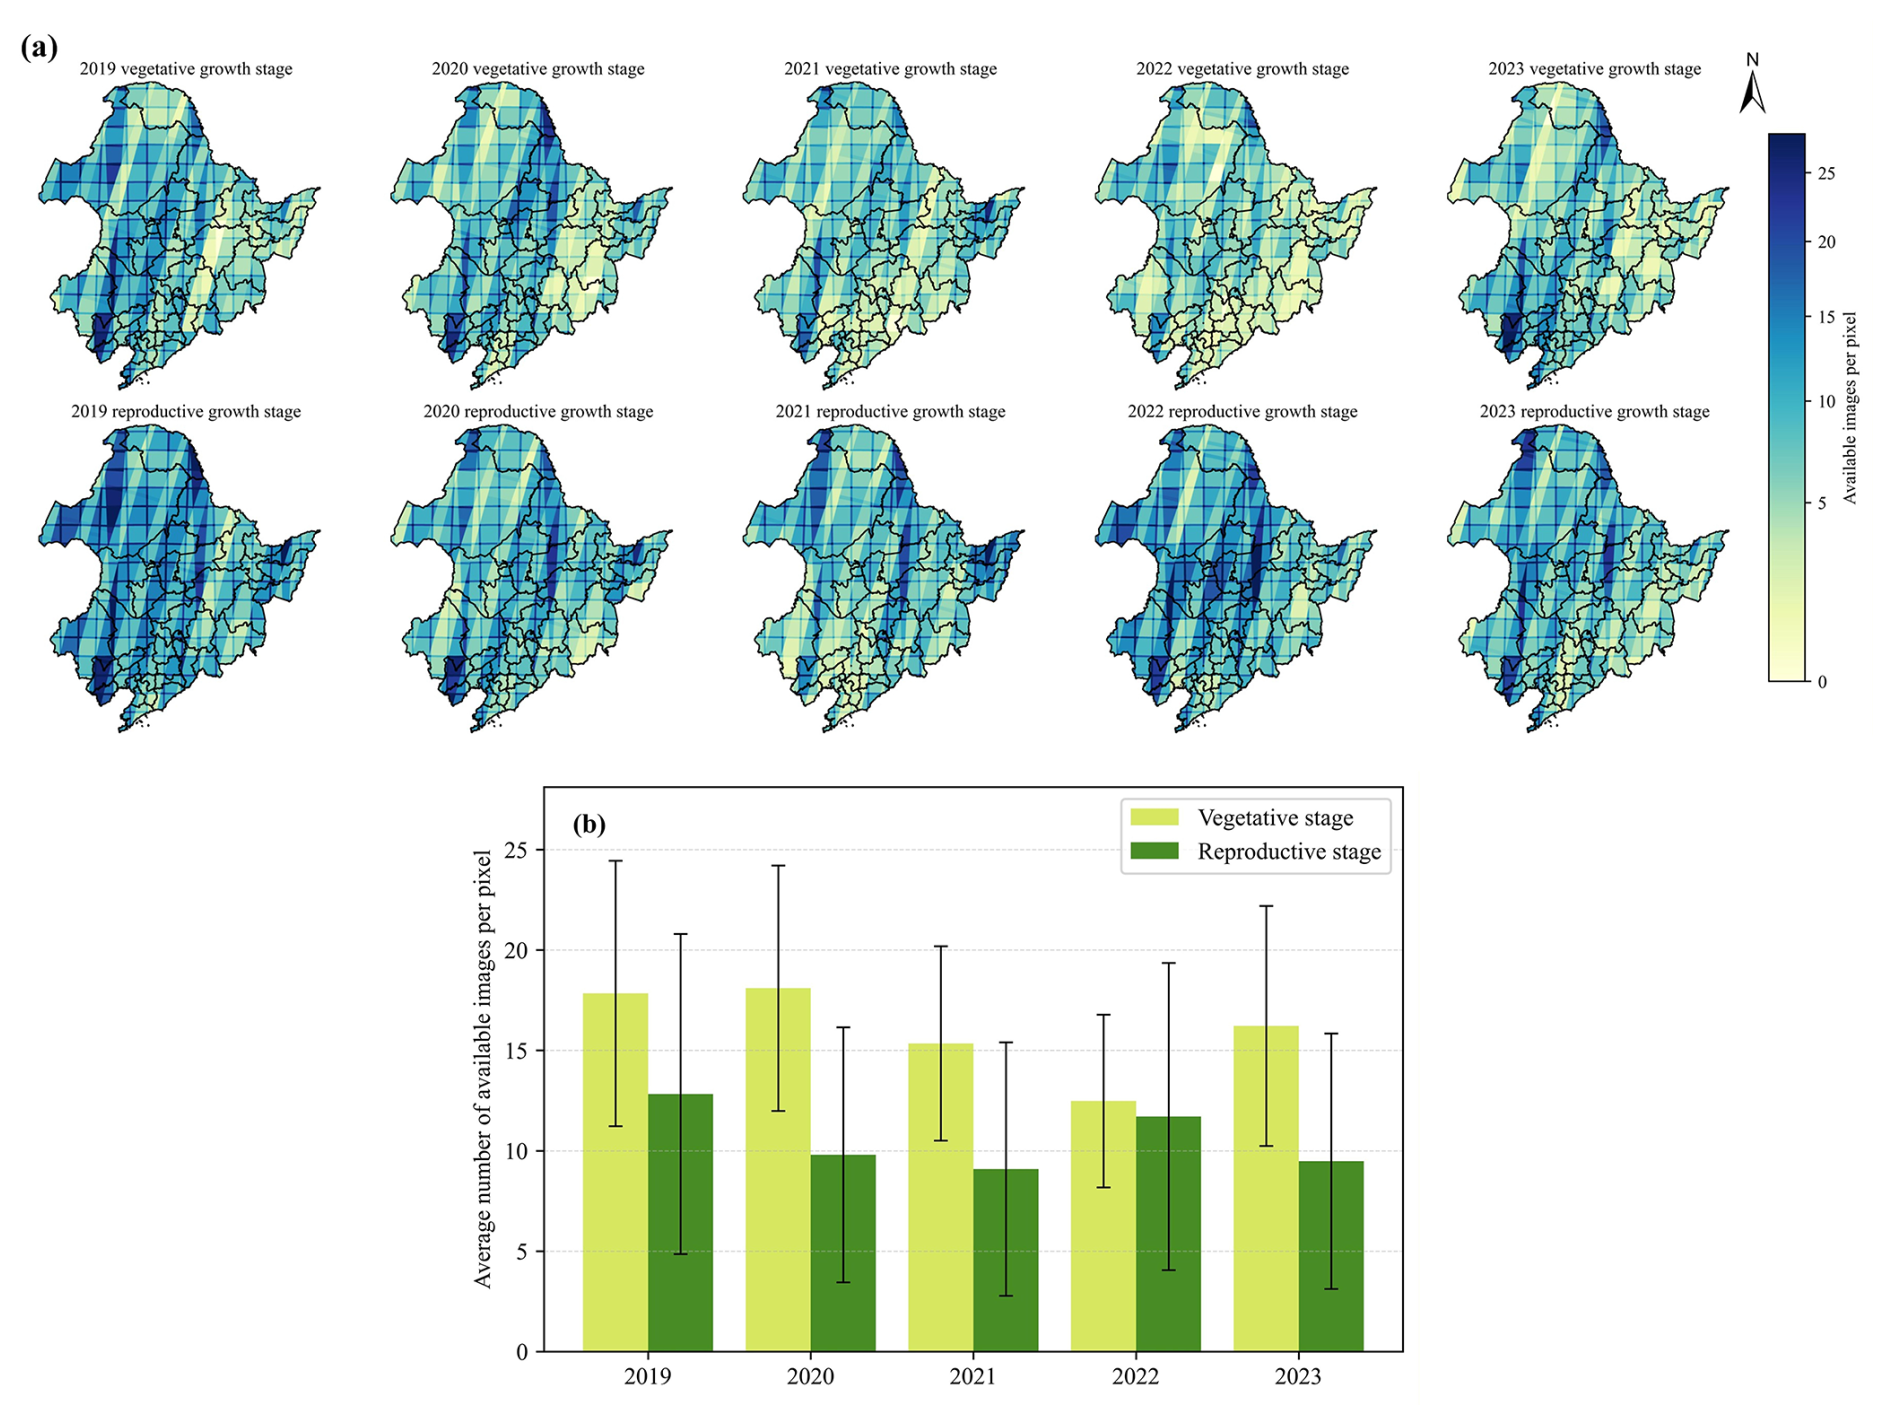
Figure A1Spatial distribution of the number of available Sentinel-2 images per pixel for each year: vegetative growth stage (top) and reproductive growth stage (bottom) (a) and yearly averages for each growth stage with error bars representing spatial standard deviation across pixels within the study area (b).
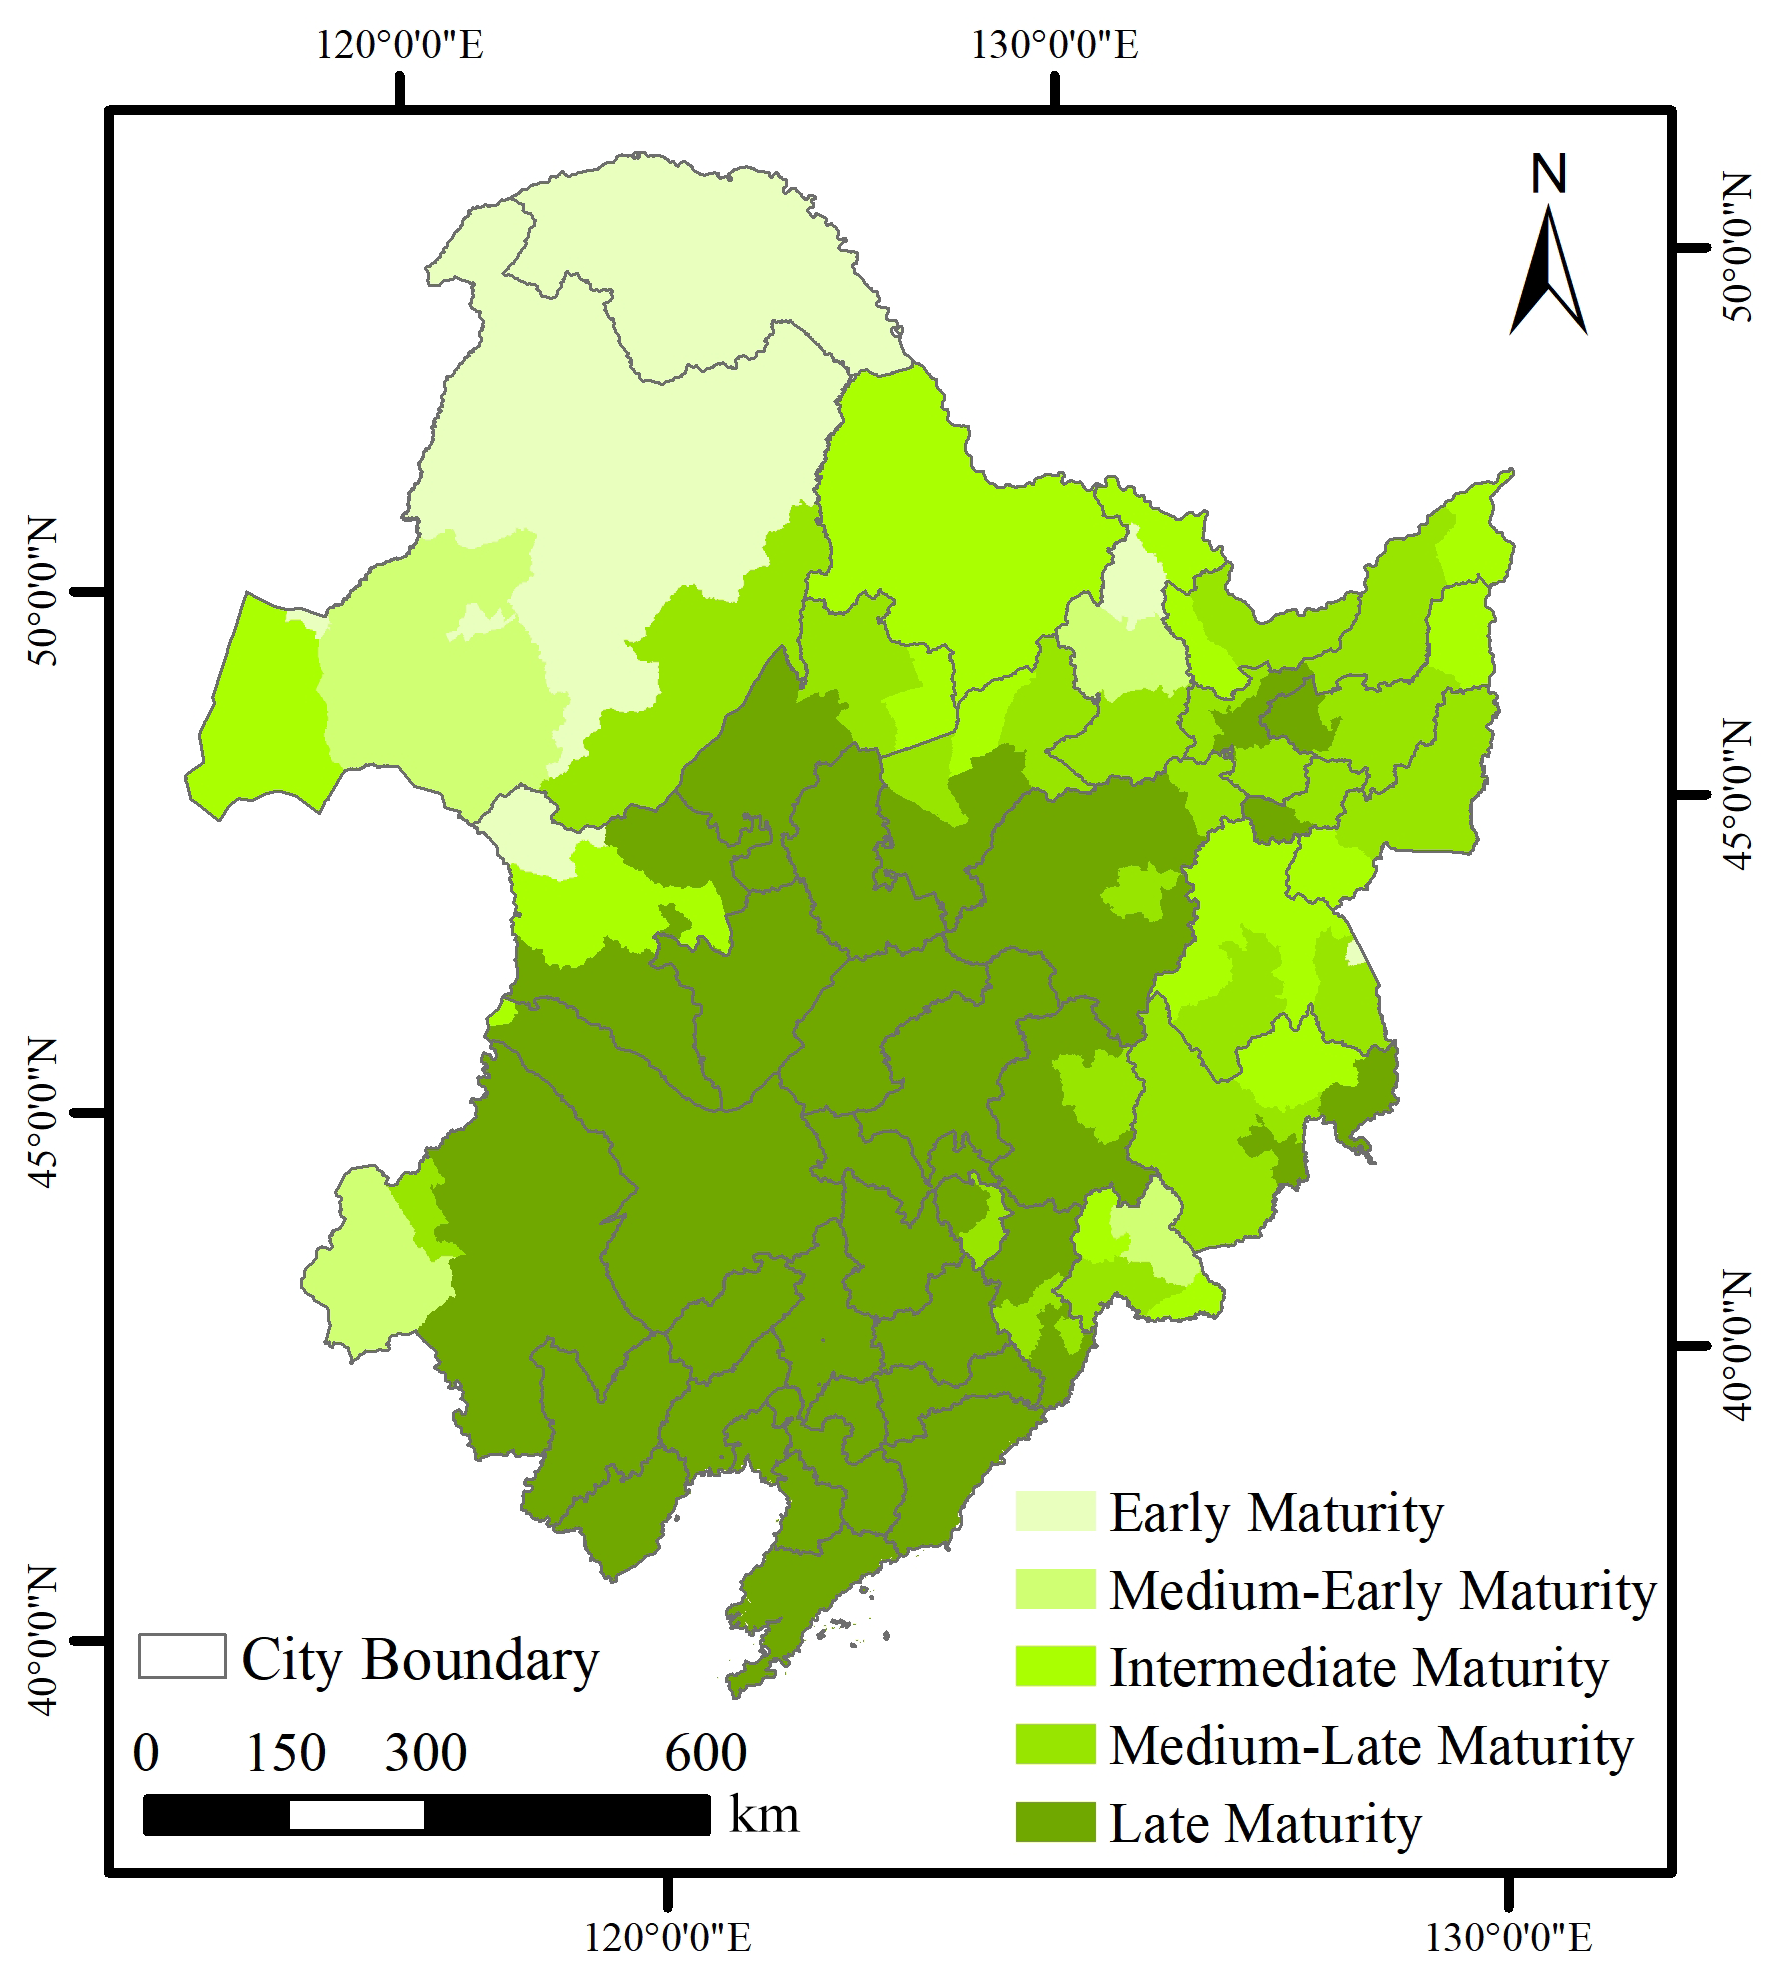
Figure A2Spatial distribution of soybean types in Northeast China.
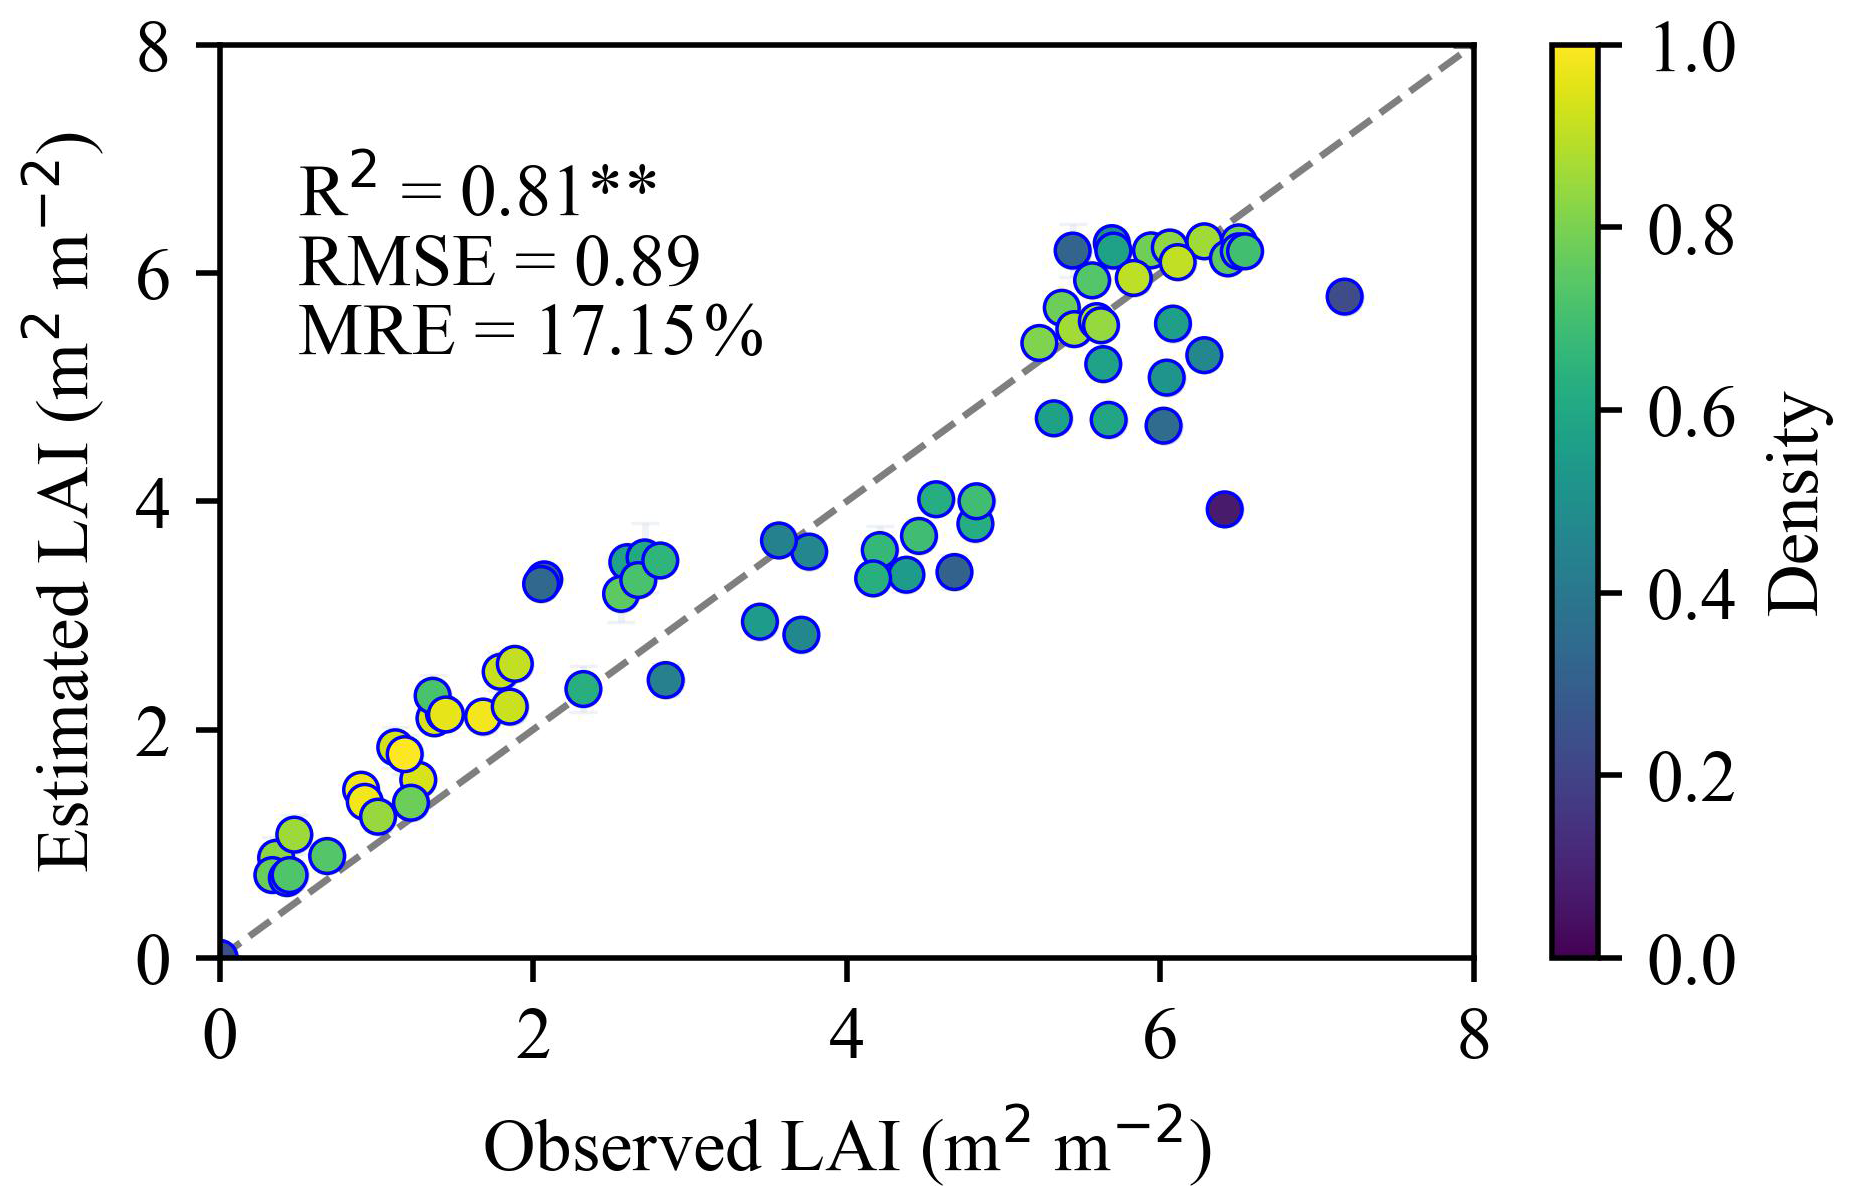
Figure A3Comparison between estimated and field-measured LAI from 2021 to 2023. Error bars represent one standard deviation indicating the uncertainty of LAI estimates. The dashed lines represent the 1:1 line. ** denotes statistical significance at p<0.01.
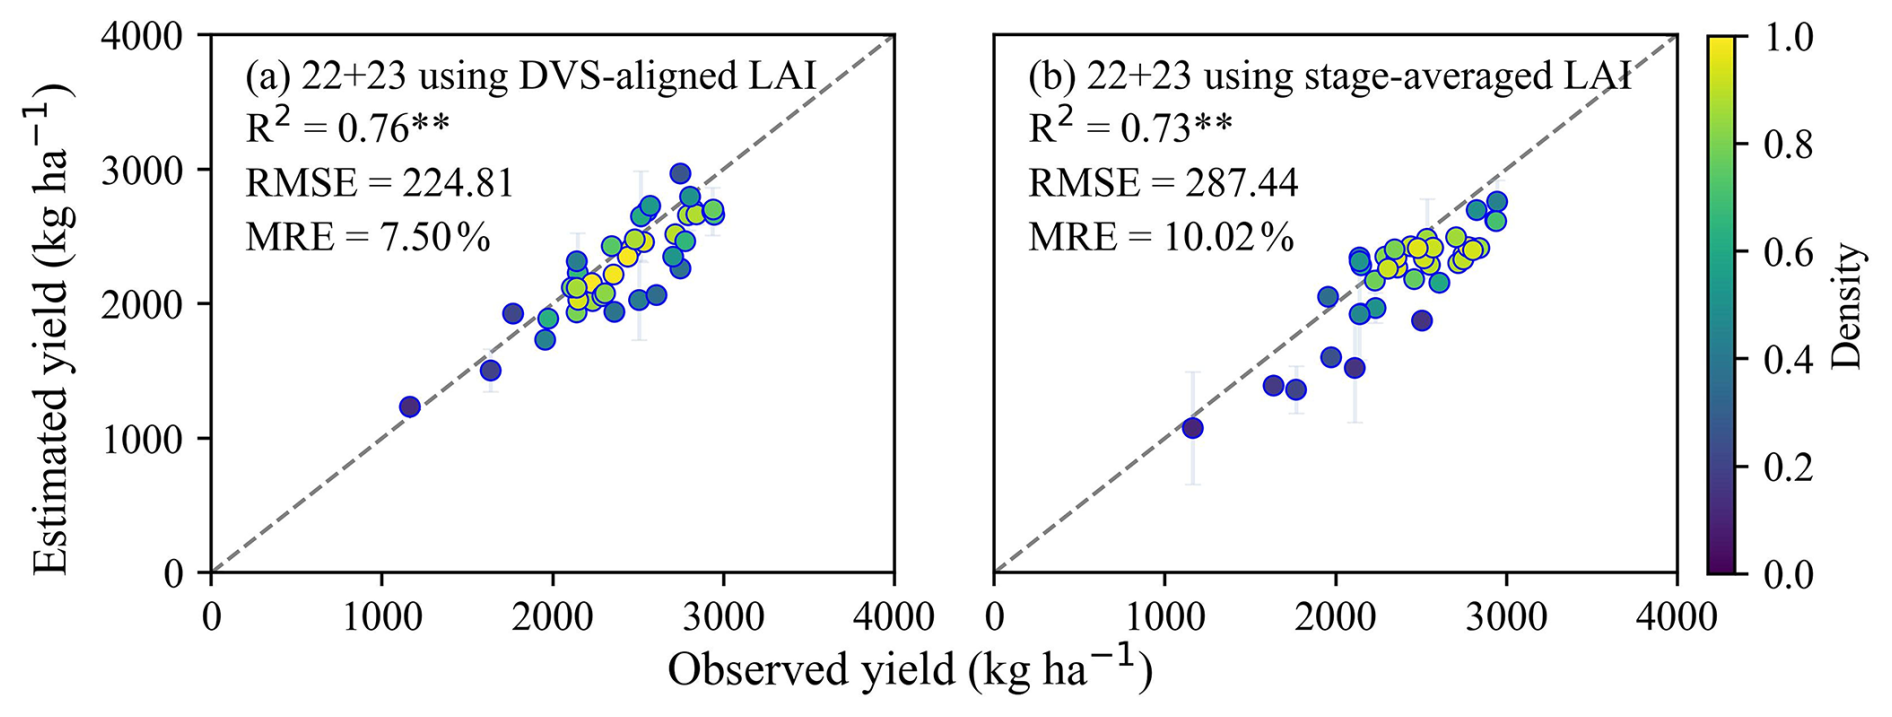
Figure A4Comparison between estimated and observed yield (2022 + 2023). (a) shows the estimates using the full DVS-aligned LAI and (b) shows the results using two stage-averaged LAI. Error bars represent one standard deviation indicating the uncertainty of yield estimates. Dashed lines represent the 1:1 line. ** denotes statistical significance at p<0.01.
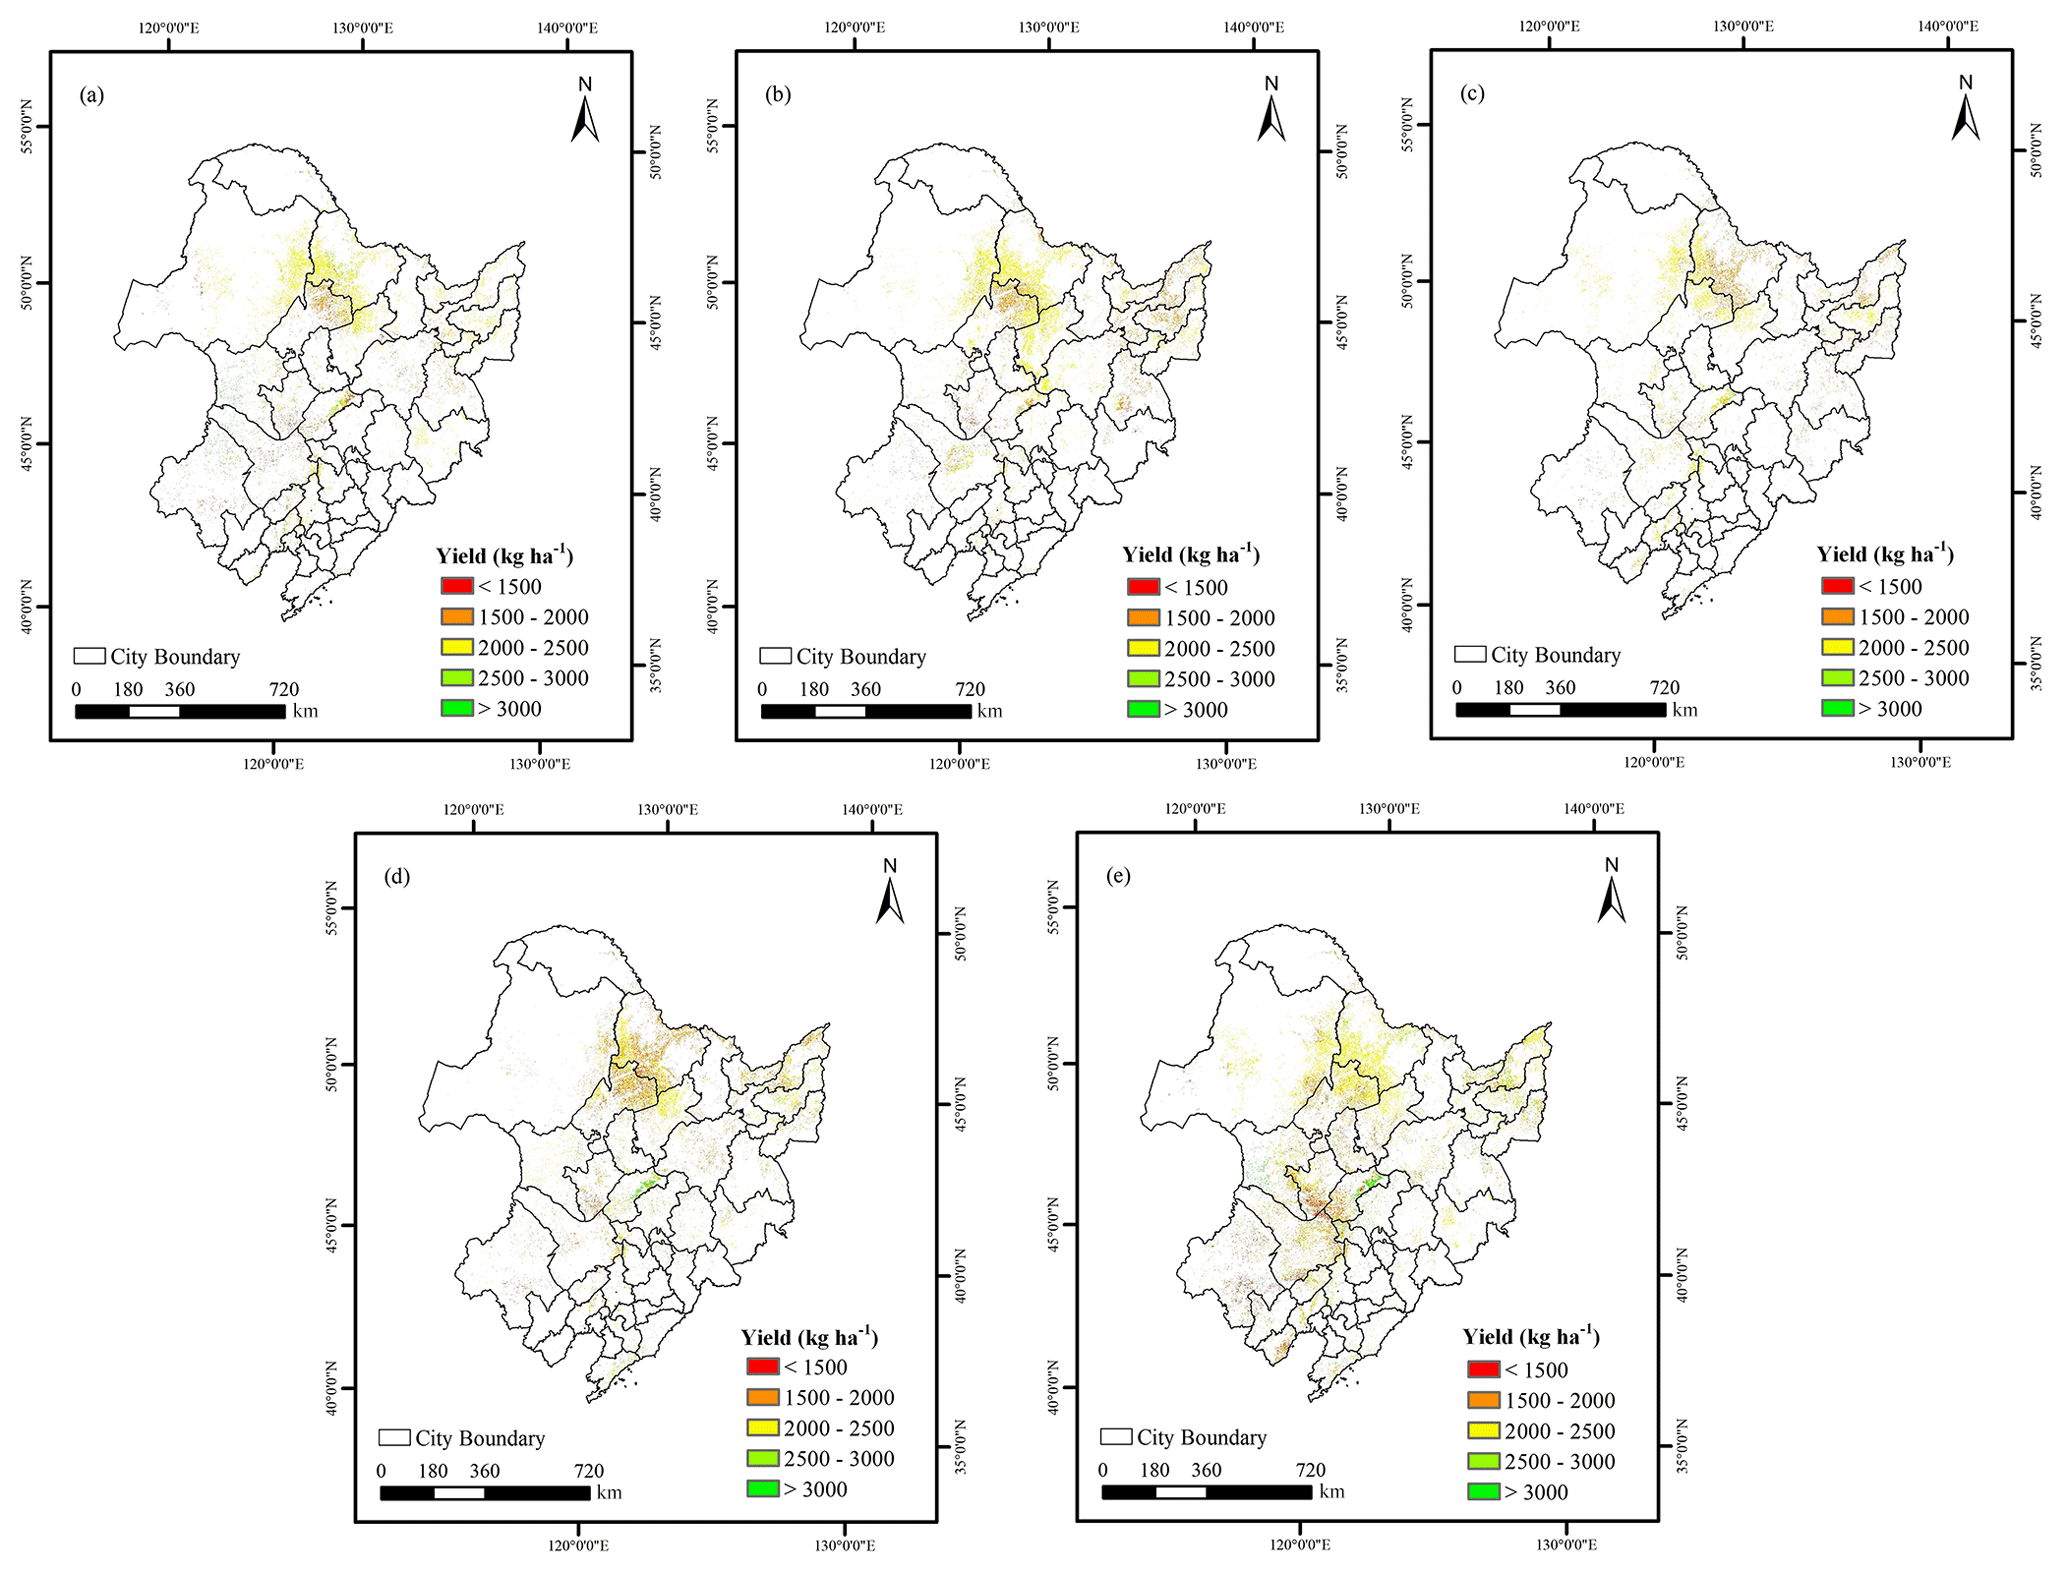
Figure A5Spatial distribution of annual soybean yield derived from Sentinel-2 before calibration in Northeast China from 2019 to 2023. (a)–(e) correspond to the years 2019, 2020, 2021, 2022, and 2023, respectively.
JXu, XD and QL – conceptualization; JXu, XD, YZ, HW, JXi, YS and YD – data curation; JXu, XD, TD – methodology; JXu, XD, JXi and JZ – investigation; TD and QL – supervision; HW, JXu and JZ – validation; YZ, HW and JZ – visualization; JXu – original draft preparation; XD, TD and YZ – reviewing and editing the manuscript.
The contact author has declared that none of the authors has any competing interests.
Publisher's note: Copernicus Publications remains neutral with regard to jurisdictional claims made in the text, published maps, institutional affiliations, or any other geographical representation in this paper. The authors bear the ultimate responsibility for providing appropriate place names. Views expressed in the text are those of the authors and do not necessarily reflect the views of the publisher.
We sincerely thank the editor and the reviewers for their valuable comments and constructive suggestions. We also gratefully acknowledge the Common Application Support Platform for Land Observation Satellites of China's Civil Space Infrastructure for providing the field-measured LAI data used in this study.
This research has been supported by the National Key Research and Development Program of China (grant no. 2021YFD1500103), the Strategic Priority Research Program of the Chinese Academy of Sciences (grant no. XDA28070504) and the National Natural Science Foundation of China (grant no. 42371359).
This paper was edited by Peng Zhu and reviewed by four anonymous referees.
Açikkar, M.: Fast grid search: A grid search-inspired algorithm for optimizing hyperparameters of support vector regression, Turk. J. Electr. Eng. Co., 32, 68–92, https://doi.org/10.55730/1300-0632.4056, 2024.
Anderson, M. C., Kustas, W. P., Norman, J. M., Diak, G. T., Hain, C. R., Gao, F., Yang, Y., Knipper, K. R., Xue, J., Yang, Y., Crow, W. T., Holmes, T. R. H., Nieto, H., Guzinski, R., Otkin, J. A., Mecikalski, J. R., Cammalleri, C., Torres-Rua, A. T., Zhan, X., Fang, L., Colaizzi, P. D., and Agam, N.: A brief history of the thermal IR-based Two-Source Energy Balance (TSEB) model – diagnosing evapotranspiration from plant to global scales, Agr. Forest Meteorol., 350, 109951, https://doi.org/10.1016/j.agrformet.2024.109951, 2024.
Ang, Y., Shafri, H. Z. M., Lee, Y. P., Abidin, H., Bakar, S. A., Hashim, S. J., Che'Ya, N. N., Hassan, M. R., Lim, H. S., and Abdullah, R.: A novel ensemble machine learning and time series approach for oil palm yield prediction using Landsat time series imagery based on NDVI, Geocarto Int., 37, 9865–9896, https://doi.org/10.1080/10106049.2022.2025920, 2022.
Azzari, G., Jain, M., and Lobell, D. B.: Towards fine resolution global maps of crop yields: Testing multiple methods and satellites in three countries, Remote Sens. Environ., 202, 129–141, https://doi.org/10.1016/j.rse.2017.04.014, 2017.
Baup, F., Fieuzal, R., and Betbeder, J.: Estimation of soybean yield from assimilated optical and radar data into a simplified agrometeorological model, in: 2015 IEEE International Geoscience and Remote Sensing Symposium (IGARSS), IGARSS 2015 – 2015 IEEE International Geoscience and Remote Sensing Symposium, Milan, Italy, 3961–3964, https://doi.org/10.1109/IGARSS.2015.7326692, 2015.
Boote, K. J., Pickering, N. B., and Allen Jr., L. H.: Plant Modeling: Advances and Gaps in Our Capability to Predict Future Crop Growth and Yield in Response to global Climate Change, Advances in Carbon Dioxide Effects Research, 179–228, https://doi.org/10.2134/asaspecpub61.c10, 1997.
Cao, H., Zhao, R., Xia, L., Wu, S., and Yang, P.: Trends in crop yield estimation via data assimilation based on multi-interdisciplinary analysis, Field Crop. Res., 322, 109745, https://doi.org/10.1016/j.fcr.2025.109745, 2025.
Cao, J., Zhang, Z., Tao, F., Zhang, L., Luo, Y., Zhang, J., Han, J., and Xie, J.: Integrating Multi-Source Data for Rice Yield Prediction across China using Machine Learning and Deep Learning Approaches, Agr. Forest Meteorol., 297, 108275, https://doi.org/10.1016/j.agrformet.2020.108275, 2021.
Che, Z., Purushotham, S., Cho, K., Sontag, D., and Liu, Y.: Recurrent Neural Networks for Multivariate Time Series with Missing Values, Sci. Rep.-UK, 8, 6085, https://doi.org/10.1038/s41598-018-24271-9, 2018.
Chen, Q., Zheng, B., Chen, T., and Chapman, S. C.: Integrating a crop growth model and radiative transfer model to improve estimation of crop traits based on deep learning, J. Exp. Bot., 73, 6558–6574, https://doi.org/10.1093/jxb/erac291, 2022a.
Chen, Y., Liu, S., Li, H., Li, X. F., Song, C. Y., Cruse, R. M., and Zhang, X. Y.: Effects of conservation tillage on corn and soybean yield in the humid continental climate region of Northeast China, Soil Till. Res., 115–116, 56–61, https://doi.org/10.1016/j.still.2011.06.007, 2011.
Chen, Y.-P., Huang, C.-H., Lo, Y.-H., Chen, Y.-Y., and Lai, F.: Combining attention with spectrum to handle missing values on time series data without imputation, Inform. Sciences, 609, 1271–1287, https://doi.org/10.1016/j.ins.2022.07.124, 2022b.
Cho, K., Van Merrienboer, B., Gulcehre, C., Bahdanau, D., Bougares, F., Schwenk, H., and Bengio, Y.: Learning Phrase Representations using RNN Encoder–Decoder for Statistical Machine Translation, in: Proceedings of the 2014 Conference on Empirical Methods in Natural Language Processing (EMNLP), Proceedings of the 2014 Conference on Empirical Methods in Natural Language Processing (EMNLP), Doha, Qatar, 1724–1734, https://doi.org/10.3115/v1/D14-1179, 2014.
Choi, D.-H., Ban, H.-Y., Seo, B.-S., Lee, K.-J., and Lee, B.-W.: Phenology and Seed Yield Performance of Determinate Soybean Cultivars Grown at Elevated Temperatures in a Temperate Region, PLoS ONE, 11, e0165977, https://doi.org/10.1371/journal.pone.0165977, 2016.
Diepen, C. A., Wolf, J., Keulen, H., and Rappoldt, C.: WOFOST: a simulation model of crop production, Soil Use Manage., 5, 16–24, https://doi.org/10.1111/j.1475-2743.1989.tb00755.x, 1989.
Dokoohaki, H., Kivi, M. S., Martinez-Feria, R., Miguez, F. E., and Hoogenboom, G.: A comprehensive uncertainty quantification of large-scale process-based crop modeling frameworks, Environ. Res. Lett., 16, 084010, https://doi.org/10.1088/1748-9326/ac0f26, 2021.
Dong, T., Liu, J., Shang, J., Qian, B., Ma, B., Kovacs, J. M., Walters, D., Jiao, X., Geng, X., and Shi, Y.: Assessment of red-edge vegetation indices for crop leaf area index estimation, Remote Sens. Environ., 222, 133–143, https://doi.org/10.1016/j.rse.2018.12.032, 2019.
Dong, T., Liu, J., Qian, B., He, L., Liu, J., Wang, R., Jing, Q., Champagne, C., McNairn, H., Powers, J., Shi, Y., Chen, J. M., and Shang, J.: Estimating crop biomass using leaf area index derived from Landsat 8 and Sentinel-2 data, ISPRS J. Photogramm., 168, 236–250, https://doi.org/10.1016/j.isprsjprs.2020.08.003, 2020.
Du, X., Song, F., Wang, H., Huanxuezhang, Meng, J., Li, Q., Liu, J., Ding, L., and Lu, Y.: Soybean yield estimation using HJ-1 CCD data in Northeast China, in: 2014 The Third International Conference on Agro-Geoinformatics, 2014 Third International Conference on Agro-Geoinformatics, Beijing, China, 1–4, https://doi.org/10.1109/Agro-Geoinformatics.2014.6910627, 2014.
Du, X., Zhu, J., Xu, J., Li, Q., Tao, Z., Zhang, Y., Wang, H., and Hu, H.: Remote sensing-based winter wheat yield estimation integrating machine learning and crop growth multi-scenario simulations, Int. J. Digit. Earth, 18, 2443470, https://doi.org/10.1080/17538947.2024.2443470, 2025.
Duchemin, B., Maisongrande, P., Boulet, G., and Benhadj, I.: A simple algorithm for yield estimates: Evaluation for semi-arid irrigated winter wheat monitored with green leaf area index, Environ. Modell. Softw., 23, 876–892, https://doi.org/10.1016/j.envsoft.2007.10.003, 2008.
Falcon, W. P., Naylor, R. L., and Shankar, N. D.: Rethinking Global Food Demand for 2050, Popul. Dev. Rev., 48, 921–957, https://doi.org/10.1111/padr.12508, 2022.
Fan, R., Zhang, X., Liang, A., Shi, X., Chen, X., Bao, K., Yang, X., and Jia, S.: Tillage and rotation effects on crop yield and profitability on a Black soil in northeast China, Can. J. Soil Sci., 92, 463–470, https://doi.org/10.4141/cjss2010-020, 2012.
FAOSTAT: Food and Agriculture Organization of the United Nations, FAO Statistical Databases, http://www.fao.org/faostat/en/ (last access: 30 March 2024), 2022.
Feng, P., Wang, B., Liu, D. L., Waters, C., Xiao, D., Shi, L., and Yu, Q.: Dynamic wheat yield forecasts are improved by a hybrid approach using a biophysical model and machine learning technique, Agr. Forest Meteorol., 285–286, 107922, https://doi.org/10.1016/j.agrformet.2020.107922, 2020.
Gao, F. and Anderson, M.: Evaluating Yield Variability of Corn and Soybean Using Landsat-8, Sentinel-2 and Modis in Google Earth Engine, in: IGARSS 2019 – 2019 IEEE International Geoscience and Remote Sensing Symposium, IGARSS 2019 – 2019 IEEE International Geoscience and Remote Sensing Symposium, Yokohama, Japan, 7286–7289, https://doi.org/10.1109/IGARSS.2019.8897990, 2019.
Gaso, D. V., Paudel, D., De Wit, A., Puntel, L. A., Mullissa, A., and Kooistra, L.: Beyond assimilation of leaf area index: Leveraging additional spectral information using machine learning for site-specific soybean yield prediction, Agr. Forest Meteorol., 351, 110022, https://doi.org/10.1016/j.agrformet.2024.110022, 2024.
Gevaert, C. M.: Explainable AI for earth observation: A review including societal and regulatory perspectives, Int. J. Appl. Earth Obs., 112, 102869, https://doi.org/10.1016/j.jag.2022.102869, 2022.
Gitelson, A. and Merzlyak, M. N.: Spectral Reflectance Changes Associated with Autumn Senescence of Aesculus hippocastanum L. and Acer platanoides L. Leaves. Spectral Features and Relation to Chlorophyll Estimation, J. Plant Physiol., 143, 286–292, https://doi.org/10.1016/S0176-1617(11)81633-0, 1994.
Gopi, P. S. S. and Karthikeyan, M.: Red fox optimization with ensemble recurrent neural network for crop recommendation and yield prediction model, Multimed. Tools Appl., 83, 13159–13179, https://doi.org/10.1007/s11042-023-16113-2, 2023.
Graham, P. H. and Vance, C. P.: Legumes: Importance and constraints to greater use, Plant Physiol., 131, 872–877, https://doi.org/10.1104/pp.017004, 2003.
Guo, S., Guo, E., Zhang, Z., Dong, M., Wang, X., Fu, Z., Guan, K., Zhang, W., Zhang, W., Zhao, J., Liu, Z., Zhao, C., and Yang, X.: Impacts of mean climate and extreme climate indices on soybean yield and yield components in Northeast China, Sci. Total Environ., 838, 156284, https://doi.org/10.1016/j.scitotenv.2022.156284, 2022.
He, M., Kimball, J., Maneta, M., Maxwell, B., Moreno, A., Beguería, S., and Wu, X.: Regional Crop Gross Primary Productivity and Yield Estimation Using Fused Landsat-MODIS Data, Remote Sens.-Basel, 10, 372, https://doi.org/10.3390/rs10030372, 2018.
Hou, M., Tian, F., Zhang, L., Li, S., Du, T., Huang, M., and Yuan, Y.: Estimating Crop Transpiration of Soybean under Different Irrigation Treatments Using Thermal Infrared Remote Sensing Imagery, Agronomy, 9, 8, https://doi.org/10.3390/agronomy9010008, 2018.
Hu, P., Zheng, B., Chen, Q., Grunefeld, S., Choudhury, M. R., Fernandez, J., Potgieter, A., and Chapman, S. C.: Estimating aboveground biomass dynamics of wheat at small spatial scale by integrating crop growth and radiative transfer models with satellite remote sensing data, Remote Sens. Environ., 311, 114277, https://doi.org/10.1016/j.rse.2024.114277, 2024.
Huang, H., Huang, J., Wu, Y., Zhuo, W., Song, J., Li, X., Li, L., Su, W., Ma, H., and Liang, S.: The Improved Winter Wheat Yield Estimation by Assimilating GLASS LAI Into a Crop Growth Model With the Proposed Bayesian Posterior-Based Ensemble Kalman Filter, IEEE T. Geosci. Remote, 61, 1–18, https://doi.org/10.1109/TGRS.2023.3259742, 2023.
Huang, J., Tian, L., Liang, S., Ma, H., Becker-Reshef, I., Huang, Y., Su, W., Zhang, X., Zhu, D., and Wu, W.: Improving winter wheat yield estimation by assimilation of the leaf area index from Landsat TM and MODIS data into the WOFOST model, Agr. Forest Meteorol., 204, 106–121, https://doi.org/10.1016/j.agrformet.2015.02.001, 2015.
Huang, J., Gómez-Dans, J. L., Huang, H., Ma, H., Wu, Q., Lewis, P. E., Liang, S., Chen, Z., Xue, J.-H., Wu, Y., Zhao, F., Wang, J., and Xie, X.: Assimilation of remote sensing into crop growth models: Current status and perspectives, Agr. Forest Meteorol., 276–277, 107609, https://doi.org/10.1016/j.agrformet.2019.06.008, 2019.
Huang, J., Song, J., Huang, H., Zhuo, W., Niu, Q., Wu, S., Ma, H., and Liang, S.: Progress and perspectives in data assimilation algorithms for remote sensing and crop growth model, Science of Remote Sensing, 10, 100146, https://doi.org/10.1016/j.srs.2024.100146, 2024.
Huang, Y. and Liu, Z.: Improving Northeast China's soybean and maize planting structure through subsidy optimization considering climate change and comparative economic benefit, Land Use Policy, 146, 107319, https://doi.org/10.1016/j.landusepol.2024.107319, 2024.
Hunt, M. L., Blackburn, G. A., Carrasco, L., Redhead, J. W., and Rowland, C. S.: High resolution wheat yield mapping using Sentinel-2, Remote Sens. Environ., 233, 111410, https://doi.org/10.1016/j.rse.2019.111410, 2019.
Jacquemoud, S., Verhoef, W., Baret, F., Bacour, C., Zarco-Tejada, P. J., Asner, G. P., François, C., and Ustin, S. L.: PROSPECT+SAIL models: A review of use for vegetation characterization, Remote Sens. Environ., 113, S56–S66, https://doi.org/10.1016/j.rse.2008.01.026, 2009.
Jain, A. K. and Dubes, R. C.: Algorithms for clustering data, Technometrics, 32, 227–229, 1988.
Kaur, S. and Singh, M.: Modeling the crop growth – A review, MAUSAM, 71, 103–114, 2020.
Ko, J., Shin, T., Kang, J., Baek, J., and Sang, W.-G.: Combining machine learning and remote sensing-integrated crop modeling for rice and soybean crop simulation, Front. Plant Sci., 15, 1320969, https://doi.org/10.3389/fpls.2024.1320969, 2024.
Kodadinne Narayana, N., Wijewardana, C., Alsajri, F. A., Reddy, K. R., Stetina, S. R., and Bheemanahalli, R.: Resilience of soybean genotypes to drought stress during the early vegetative stage, Sci. Rep.-UK, 14, https://doi.org/10.1038/s41598-024-67930-w, 2024.
Li, C., Ma, C., Cui, Y., Lu, G., and Wei, F.: UAV Hyperspectral Remote Sensing Estimation of Soybean Yield Based on Physiological and Ecological Parameter and Meteorological Factor in China, J. Indian Soc. Remot., 49, 873–886, https://doi.org/10.1007/s12524-020-01269-3, 2021.
Li, X., Chen, M., He, S., Xu, X., He, L., Wang, L., Gao, Y., Tang, F., Gong, T., Wang, W., Xu, M., Liu, C., Yu, L., Liu, W., and Yang, W.: Estimation of soybean yield based on high-throughput phenotyping and machine learning, Front. Plant Sci., 15, 1395760, https://doi.org/10.3389/fpls.2024.1395760, 2024.
Liu, X. and Herbert, S. J.: Fifteen years of research examining cultivation of continuous soybean in northeast China: A review, Field Crop. Res., 79, 1–7, https://doi.org/10.1016/S0378-4290(02)00042-4, 2002.
Liu, X., Jin, J., Herbert, S. J., Zhang, Q., and Wang, G.: Yield components, dry matter, LAI and LAD of soybeans in Northeast China, Field Crop. Res., 93, 85–93, https://doi.org/10.1016/j.fcr.2004.09.005, 2005.
Liu, X., Jin, J., Wang, G., and Herbert, S. J.: Soybean yield physiology and development of high-yielding practices in Northeast China, Field Crop. Res., 105, 157–171, https://doi.org/10.1016/j.fcr.2007.09.003, 2008.
Mei, Q., Zhang, Z., Han, J., Song, J., Dong, J., Wu, H., Xu, J., and Tao, F.: ChinaSoyArea10m: a dataset of soybean-planting areas with a spatial resolution of 10 m across China from 2017 to 2021, Earth Syst. Sci. Data, 16, 3213–3231, https://doi.org/10.5194/essd-16-3213-2024, 2024.
Misaal, M. A., Zahra, S. M., Rasul, F., Imran, M., Noor, R., and Fahad, M.: Influence of Climate Change on Crop Yield and Sustainable Agriculture, in: Climate Change Impacts on Natural Resources, Ecosystems and Agricultural Systems, edited by: Pande, C. B., Moharir, K. N., Singh, S. K., Pham, Q. B., and Elbeltagi, A., Springer International Publishing, Cham, 209–223, https://doi.org/10.1007/978-3-031-19059-9_7, 2023.
Muhuri, A., Goïta, K., Magagi, R., and Wang, H.: Soil Moisture Retrieval During Crop Growth Cycle Using Satellite SAR Time Series, IEEE J. Sel. Top. Appl., 16, 9302–9319, https://doi.org/10.1109/JSTARS.2023.3280181, 2023.
Mulvaney, M. J. and Devkota, P. J.: Adjusting Crop Yield to a Standard Moisture Content, EDIS, https://doi.org/10.32473/edis-ag442-2020, 2020.
Myneni, R., Knyazikhin, Y., and Park, T.: MODIS/Terra+Aqua Leaf Area Index/FPAR 4-Day L4 Global 500m SIN Grid V061, EarthData [data set], https://doi.org/10.5067/MODIS/MCD15A3H.061, 2021.
National Bureau of Statistics of China: National statistical yearbook, China Statistics Press, https://www.stats.gov.cn/sj/ndsj/2023/indexch.htm (last access: 6 March 2024), 2023.
National Soil Survey Office: Soil Species of China, China Agriculture Press, Beijing, 924 pp., https://www.resdc.cn/data.aspx?DATAID=145 (last access: 1 April 2026), 1995.
Nguy-Robertson, A. L., Peng, Y., Gitelson, A. A., Arkebauer, T. J., Pimstein, A., Herrmann, I., Karnieli, A., Rundquist, D. C., and Bonfil, D. J.: Estimating green LAI in four crops: Potential of determining optimal spectral bands for a universal algorithm, Agr. Forest Meteorol., 192–193, 140–148, https://doi.org/10.1016/j.agrformet.2014.03.004, 2014.
Ntakos, G., Prikaziuk, E., Ten Den, T., Reidsma, P., Vilfan, N., Van Der Wal, T., and Van Der Tol, C.: Coupled WOFOST and SCOPE model for remote sensing-based crop growth simulations, Comput. Electron. Agr., 225, 109238, https://doi.org/10.1016/j.compag.2024.109238, 2024.
Pang, A., Chang, M. W. L., and Chen, Y.: Evaluation of Random Forests (RF) for Regional and Local-Scale Wheat Yield Prediction in Southeast Australia, Sensors-Basel, 22, 717, https://doi.org/10.3390/s22030717, 2022.
Pasqualotto, N., Delegido, J., Van Wittenberghe, S., Rinaldi, M., and Moreno, J.: Multi-Crop Green LAI Estimation with a New Simple Sentinel-2 LAI Index (SeLI), Sensors-Basel, 19, 904, https://doi.org/10.3390/s19040904, 2019.
Peng, G. and Yili, Z.: Research on Forest Phenology Prediction Based on LSTM and GRU Model, Journal of Resources and Ecology, 14, 1674-764x, https://doi.org/10.5814/j.issn.1674-764x.2023.01.003, 2023.
Pinke, Z. and Lövei, G. L.: Increasing temperature cuts back crop yields in Hungary over the last 90 years, Glob. Change Biol., 23, 5426–5435, https://doi.org/10.1111/gcb.13808, 2017.
Pu, L., Zhang, S., Yang, J., Chang, L., and Bai, S.: Spatio-Temporal Dynamics of Maize Potential Yield and Yield Gaps in Northeast China from 1990 to 2015, Int. J. Env. Res. Pub. He., 16, 1211, https://doi.org/10.3390/ijerph16071211, 2019.
Qiao, C., Cheng, C., and Ali, T.: How climate change and international trade will shape the future global soybean security pattern, J. Clean. Prod., 422, 138603, https://doi.org/10.1016/j.jclepro.2023.138603, 2023.
Qu, H., Li, X., Zhu, H., Wang, L., Qu, B., Wang, Q., Lv, J., Ji, Y., and Jiang, L.: Effects of combination of low temperature and excessive precipitation at seedling stage on soybean yield in high-latitude cold region, Chinese Journal of Ecology, 43, 3040–3046, https://doi.org/10.13292/j.1000-4890.202410.003, 2024.
Radočaj, D., Plaščak, I., and Jurišić, M.: Phenology-Based Maize and Soybean Yield Potential Prediction Using Machine Learning and Sentinel-2 Imagery Time-Series, Appl. Sci.-Basel, 15, 7216, https://doi.org/10.3390/app15137216, 2025.
Ren, P., Li, H., Han, S., Chen, R., Yang, G., Yang, H., Feng, H., and Zhao, C.: Estimation of Soybean Yield by Combining Maturity Group Information and Unmanned Aerial Vehicle Multi-Sensor Data Using Machine Learning, Remote Sens.-Basel, 15, 4286, https://doi.org/10.3390/rs15174286, 2023a.
Ren, Y., Li, Q., Du, X., Zhang, Y., Wang, H., Shi, G., and Wei, M.: Analysis of Corn Yield Prediction Potential at Various Growth Phases Using a Process-Based Model and Deep Learning, Plants, 12, 446, https://doi.org/10.3390/plants12030446, 2023b.
Shi, B., Guo, L., and Yu, L.: Accurate LAI estimation of soybean plants in the field using deep learning and clustering algorithms, Front. Plant Sci., 15, https://doi.org/10.3389/fpls.2024.1501612, 2025.
Shi, X. Z., Yu, D. S., Warner, E. D., Pan, X. Z., Petersen, G. W., Gong, Z. G., and Weindorf, D. C.: Soil Database of 1:1 000 000 Digital Soil Survey and Reference System of the Chinese Genetic Soil Classification System, Soil Horizons, 45, 129, https://doi.org/10.2136/sh2004.4.0129, 2004.
Song, X.-P., Li, H., Potapov, P., and Hansen, M. C.: Annual 30 m soybean yield mapping in Brazil using long-term satellite observations, climate data and machine learning, Agr. Forest Meteorol., 326, 109186, https://doi.org/10.1016/j.agrformet.2022.109186, 2022.
Steduto, P., Hsiao, T. C., Raes, D., and Fereres, E.: AquaCrop – The FAO Crop Model to Simulate Yield Response to Water: I. Concepts and Underlying Principles, Agron. J., 101, 426–437, https://doi.org/10.2134/agronj2008.0139s, 2009.
Sun, X., Li, Q., Qiao, Y., Hu, Z., Zhang, X., and Liu, Y.: Warming and Drought in Hailun of Heilongjiang: Effects on Growth and Development of Soybean, Chinese Agricultural Science Bulletin, 38, 27–33, https://doi.org/10.11924/j.issn.1000-6850.casb2021-0788, 2022.
Tan, J., Yang, P., Liu, Z., Wu, W., Zhang, L., Li, Z., You, L., Tang, H., and Li, Z.: Spatio-temporal dynamics of maize cropping system in Northeast China between 1980 and 2010 by using spatial production allocation model, J. Geogr. Sci., 24, 397–410, https://doi.org/10.1007/s11442-014-1096-0, 2014.
Tian, H., Wang, P., Tansey, K., Zhang, J., Zhang, S., and Li, H.: An LSTM neural network for improving wheat yield estimates by integrating remote sensing data and meteorological data in the Guanzhong Plain, PR China, Agr. Forest Meteorol., 310, 108629, https://doi.org/10.1016/j.agrformet.2021.108629, 2021.
Urda, C., Rezi, R., Varga, A. G., Negrea, A., Muntean, E., Sopterean, L., and Duda, M. M.: Exploring the impact of sowing dates on soybean yield, seed quality and trypsin inhibitor activity, Agrolife Scientific Journal, 13, 223–230, 2024.
Viña, A., Gitelson, A. A., Nguy-Robertson, A. L., and Peng, Y.: Comparison of different vegetation indices for the remote assessment of green leaf area index of crops, Remote Sens. Environ., 115, 3468–3478, https://doi.org/10.1016/j.rse.2011.08.010, 2011.
Von Bloh, M., Nóia Júnior, R. D. S., Wangerpohl, X., Saltýk, A. O., Haller, V., Kaiser, L., and Asseng, S.: Machine learning for soybean yield forecasting in Brazil, Agr. Forest Meteorol., 341, 109670, https://doi.org/10.1016/j.agrformet.2023.109670, 2023.
Wang, B., Chen, C., Liu, D., Asseng, S., Yu, Q., and Yang, X.: Effects of climate trends and variability on wheat yield variability in eastern Australia, Clim. Res., 64, 173–186, https://doi.org/10.3354/cr01307, 2015.
Wang, C., Linderholm, H. W., Song, Y., Wang, F., Liu, Y., Tian, J., Xu, J., Song, Y., and Ren, G.: Impacts of Drought on Maize and Soybean Production in Northeast China During the Past Five Decades, Int. J. Env. Res. Pub. He., 17, 2459, https://doi.org/10.3390/ijerph17072459, 2020.
Wang, H., Liu, D., Chen, P., Li, Y., Han, X., and Hao, X.: Distribution of maturity types of maize based on accumulated temperature rezone in Northeast China, Chinese Journal of Agricultural Resources and Regional Planning, 43, 102–112, 2022.
Wang, X., Zhu, L., Hao, Y., Wang, Z., Xue, L., Ding, K., and Huang, X.: Impacts of aerosol meteorological feedback on China's yield potential of soybean, Meteorol. Appl., 31, e2198, https://doi.org/10.1002/met.2198, 2024.
Xie, Q., Dash, J., Huete, A., Jiang, A., Yin, G., Ding, Y., Peng, D., Hall, C. C., Brown, L., Shi, Y., Ye, H., Dong, Y., and Huang, W.: Retrieval of crop biophysical parameters from Sentinel-2 remote sensing imagery, Int. J. Appl. Earth Obs., 80, 187–195, https://doi.org/10.1016/j.jag.2019.04.019, 2019.
Xie, Y. and Huang, J.: Integration of a Crop Growth Model and Deep Learning Methods to Improve Satellite-Based Yield Estimation of Winter Wheat in Henan Province, China, Remote Sens.-Basel, 13, 4372, https://doi.org/10.3390/rs13214372, 2021.
Xin, M., Zhang, Z., Han, Y., Feng, L., Lei, Y., Li, X., Wu, F., Wang, J., Wang, Z., and Li, Y.: Soybean phenological changes in response to climate warming in three northeastern provinces of China, Field Crop. Res., 302, 109082, https://doi.org/10.1016/j.fcr.2023.109082, 2023.
Xu, J., Du, X., Dong, T., Li, Q., Zhang, Y., Wang, H., Xiao, J., Zhang, J., Shen, Y., and Dong, Y.: NortheastChinaSoybeanYield20m: an annual soybean yield dataset at 20 m in Northeast China from 2019 to 2023, Zenodo [data set], https://doi.org/10.5281/zenodo.14263103, 2024.
Yildirim, T., Moriasi, D. N., Starks, P. J., and Chakraborty, D.: Using Artificial Neural Network (ANN) for Short-Range Prediction of Cotton Yield in Data-Scarce Regions, Agronomy, 12, 828, https://doi.org/10.3390/agronomy12040828, 2022.
Yu, Q., You, L., Wood-Sichra, U., Ru, Y., Joglekar, A. K. B., Fritz, S., Xiong, W., Lu, M., Wu, W., and Yang, P.: A cultivated planet in 2010 – Part 2: The global gridded agricultural-production maps, Earth Syst. Sci. Data, 12, 3545–3572, https://doi.org/10.5194/essd-12-3545-2020, 2020.
Zhang, Y., Liu, M., Kong, L., Peng, T., Xie, D., Zhang, L., Tian, L., and Zou, X.: Temporal Characteristics of Stress Signals Using GRU Algorithm for Heavy Metal Detection in Rice Based on Sentinel-2 Images, Int. J. Env. Res. Pub. He., 19, 2567, https://doi.org/10.3390/ijerph19052567, 2022.
Zhao, G., Wang, J., Fan, W., and Ying, T.: Vegetation net primary productivity in Northeast China in 2000–2008: Simulation and seasonal change, J. Appl. Ecol., 22, 621–30, 2011.
Zhao, J., Wang, C., Shi, X., Bo, X., Li, S., Shang, M., Chen, F., and Chu, Q.: Modeling climatically suitable areas for soybean and their shifts across China, Agr. Syst., 192, 103205, https://doi.org/10.1016/j.agsy.2021.103205, 2021.
Zhao, J., Wang, Y., Zhao, M., Wang, K., Li, S., Gao, Z., Shi, X., and Chu, Q.: Prospects for soybean production increase by closing yield gaps in the Northeast Farming Region, China, Field Crop. Res., 293, 108843, https://doi.org/10.1016/j.fcr.2023.108843, 2023a.
Zhao, L., Li, Q., Chang, Q., Shang, J., Du, X., Liu, J., and Dong, T.: In-season crop type identification using optimal feature knowledge graph, ISPRS J. Photogramm., 194, 250–266, https://doi.org/10.1016/j.isprsjprs.2022.10.017, 2022.
Zhao, Y., Han, S., Zheng, J., Xue, H., Li, Z., Meng, Y., Li, X., Yang, X., Li, Z., Cai, S., and Yang, G.: ChinaWheatYield30m: a 30 m annual winter wheat yield dataset from 2016 to 2021 in China, Earth Syst. Sci. Data, 15, 4047–4063, https://doi.org/10.5194/essd-15-4047-2023, 2023b.
Zheng, L. and Zhang, X.: Harvest time monitoring data of Shengyang Station in Liaoning Province from 1998 to 2008, National Ecosystem Science Data Center, https://doi.org/10.12199/nesdc.ecodb.mon.2020.dp2011.sya.004, 2021.
Zhuo, W., Fang, S., Gao, X., Wang, L., Wu, D., Fu, S., Wu, Q., and Huang, J.: Crop yield prediction using MODIS LAI, TIGGE weather forecasts and WOFOST model: A case study for winter wheat in Hebei, China during 2009–2013, Int. J. Appl. Earth Obs., 106, 102668, https://doi.org/10.1016/j.jag.2021.102668, 2022.