the Creative Commons Attribution 4.0 License.
the Creative Commons Attribution 4.0 License.
 | 01 Apr 2026
A manually labeled contrail dataset from MSG/SEVIRI
Vanessa Santos Gabriel
Luca Bugliaro
Mara Montag
Sabrina Ries
Ziming Wang
Kai Widmaier
Matteo Arico
Simon Unterstrasser
Johanna Mayer
Deniz Menekay
Andreas Marsing
Elena de la Torre Castro
Liam Megill
Monika Scheibe
Christiane Voigt
Contrails – thin ice clouds formed by aircraft – are a major contributor to aviation-induced climate forcing, yet their observational characterization remains limited. We present a manually labeled contrail dataset derived from observations of the Meteosat Second Generation (MSG) SEVIRI instrument over Europe and the North Atlantic, comprising 140 scenes of 256 × 256 pixels at 3 km nominal resolution. The dataset covers the time period in which Meteosat-10 was the operational satellite (from January 2013 through February 2018 and from March 2023 through March 2024) and scenes are distributed randomly over the whole SEVIRI disk. Each scene was independently annotated by three labelers, with ground truth established via majority consensus. To provide additional context, the dataset includes outputs from two satellite retrievals: CiPS (Cirrus Properties from SEVIRI) and ProPS (Probabilistic Cloud Top Phase retrieval), offering information on cloud cover and cloud top phase, cirrus probability, ice optical thickness, and ice cloud top height. These complementary variables enable detailed investigations, such as factors influencing contrail visibility. The dataset supports analyses of contrail detection, contrail characteristics, cloud-contrail interactions, and environmental conditions affecting detection. By providing high-quality labeled data with auxiliary cloud information, this resource facilitates the development and evaluation of contrail studies, contributes to improved understanding of aviation-related cloud effects, and informs strategies for climate impact mitigation. The full dataset is available under: https://doi.org/10.5281/zenodo.17669443 (Santos Gabriel et al., 2025) with version v2 presented in this study.
- Article
(5171 KB) - Full-text XML
- BibTeX
- EndNote


Contrails are narrow ice clouds formed by aircraft when ambient temperatures are low enough. Under favorable conditions (when air is supersaturated with respect to ice), contrails can persist for hours and evolve into extensive cirrus clouds, so called contrail cirrus, contributing to aviation's impact on the climate (Lewellen, 2014; Vázquez-Navarro et al., 2015). Aviation accounts for roughly 3.5 % of anthropogenic effective radiative forcing (ERF), with contrail cirrus being the largest contributor, exceeding the radiative impact of CO2 emissions from aircraft (Lee et al., 2021). Simulation studies indicate that a small number of flights can produce disproportionately large contrail outbreaks, highlighting the importance of understanding which flights and atmospheric conditions lead to high-impact events (Burkhardt et al., 2018; Teoh et al., 2024). Despite their climatic relevance, observational knowledge of contrail properties, formation conditions, and evolution remains limited (Mannstein et al., 1999; Meyer et al., 2007; Bedka et al., 2013; Minnis et al., 2013; Spangenberg et al., 2013; Meijer et al., 2022). Passive imaging from geostationary satellites provides a critical resource, offering continuous spatial and temporal coverage to monitor contrails and estimate their radiative impact (e.g., Mannstein and Schumann, 2005; Chevallier et al., 2023; Wang et al., 2023, 2024; Vázquez-Navarro et al., 2015; Haywood et al., 2009; Atlas et al., 2006). Despite this coverage, detecting individual contrails remains challenging; Driver et al. (2025) demonstrate that only (46±2) % of a modeled population of global contrail segments (in clear sky conditions) is observable using current 2 km resolution imager data. Geostationary contrail observation still remains valuable as these detectable segments account for a disproportionately high (72±2) % of the total instantaneous long-wave radiative forcing. However, the development and evaluation of contrail studies are constrained by the lack of high-quality labeled datasets that reliably indicate where contrails are present in satellite imagery. Manually labeled datasets serve as an essential foundation, enabling the assessment of contrail detection algorithm accuracy, the evaluation of contrail properties, and investigation of their visibility under different atmospheric conditions. Synthetic and model-based contrail datasets (e.g. Chevallier et al., 2023) present an alternative to human labeled contrail datasets as this approach can help to build large-scale datasets with exact ground truth. However, the model-based approach uses simplified physics and therefore fails to simulate complex interactions with natural cirrus, overlapping contrails and variable background clouds. Exactly for those hard cases, human labelers are needed. Several efforts have sought to derive such human labeled data, but most of them are not publicly available (e.g. Mannstein et al., 1999, 2010; Dekoutsidis et al., 2023). A notable exception is Ng et al. (2024), who introduced the publicly available OpenContrails dataset, which offers manually annotated contrails over North and South America using geostationary satellite imagery from the GOES-16 Advanced Baseline Imager (ABI). Complementing this, McCloskey et al. (2021) developed a human-labeled Landsat-8 contrail dataset, covering a similar geographical extent but utilizing low Earth orbit (LEO) satellite imagery, and Gourgue et al. (2025) published a dataset of annotated ground-based hemispheric sky images. These open source datasets are valuable for validating automatic detection methods, for inter-comparing different detection approaches and also for studying contrail characteristics such as length, width, orientation, and persistence, which are critical for understanding their formation and climatic effects. Nevertheless, current datasets remain limited in spatial and temporal coverage, particularly over regions of dense air traffic like Europe and the North Atlantic, and often lack complementary information about the surrounding cloud environment.
To address these limitations, comprehensive labeled contrail datasets with additional cloud context are required. We present a human labeled contrail dataset using the Meteosat Second Generation (MSG) satellite that includes multiple labelers' annotations to assess the inherent subjectivity of manual labeling in MSG. We incorporate auxiliary information, such as cloud phase or optical properties derived from satellite retrievals, to facilitate more detailed investigations of the factors affecting contrail detectability. High-quality labeled datasets, such as the one presented here, enable researchers to rigorously evaluate contrail detections, investigate environmental and observational influences on detectability, and support studies aimed at mitigating the climate impact of aviation through informed rerouting or operational strategies. Contrail identification in MSG is particularly challenging due to the low spatial resolution of 3 km at nadir (4–6 km over Europe), compared for instance to 2 km for GOES-R/S/T or 1 km for many polar orbiting passive sensors like AVHRR and MODIS.
This paper is structured as follows: We begin by presenting the satellite data used in this study and introducing two satellite retrievals used to produce complementary information about the surrounding cloud environment in Sect. 2. Next, we provide a detailed description of the labeling campaign in Sect. 3, including the scene selection and a detailed description of the labeling process. In Sect. 4, we discuss the results of the labeling campaign. Section 5 highlights the compiled dataset with its contents and formats. Finally, Sect. 8 presents a summary of the key findings and discusses their implications for future studies on contrail detection and characterization.
Scenes for labeling are generated from MSG satellite data. To complement the dataset, outputs from two satellite retrievals – ProPS (Probabilistic Cloud Top Phase retrieval for SEVIRI) (Mayer et al., 2024a) and CiPS (Cirrus Properties from SEVIRI) (Strandgren et al., 2017a) – are also incorporated. By providing CiPS-derived cirrus properties and ProPS cloud top phase information alongside the labeled contrail dataset, the authors enable users to comprehensively examine the cloud characteristics that may enhance or obscure contrail visibility, thereby informing detection capabilities and algorithm development.
2.1 MSG/SEVIRI
The Meteosat Second Generation (MSG) satellites (Schmetz et al., 2002) are equipped with the Spinning Enhanced Visible and Infrared Imager (SEVIRI). The MSG program comprises four geostationary satellites, stationed at the nominal longitude of 0° E to observe Europe and Africa, though some have been operated at different longitudes or in alternative modes. SEVIRI provides imagery every 15 min, with a nadir spatial resolution of 3 km that degrades to about 4–6 km over Europe due to the oblique viewing geometry and Earth's curvature. The instrument observes in twelve spectral channels: four channels measure reflected solar radiation and eight infrared channels capture emitted thermal radiation. One solar channel, the broadband High Resolution Visible (HRV), has a sampling distance of 1 km at nadir. Satellite instruments measure the radiance received at the sensor, which represents the intensity of radiation within a specific spectral band. However, radiance alone depends on both the illumination geometry and the spectral characteristics of the sensor, making it difficult to interpret physically. Therefore, radiances in solar (visible and near-infrared) channels are converted to apparent reflectance, a dimensionless quantity that expresses the fraction of incident solar radiation reflected by the Earth–atmosphere system. For thermal infrared channels, the measured radiance originates from emitted terrestrial radiation rather than reflected sunlight. In this case, radiances are converted to brightness temperature, defined as the temperature a blackbody would have to emit the same radiance at wavelength λ. Throughout this work, we use reflectances and brightness temperatures, while SEVIRI channels are referred to by their central wavelength (e.g., IR108 denotes the 10.8 µm infrared channel). Real-time calibrated data for all SEVIRI channels was used in this work. To avoid potential spectral inconsistencies caused by using data from different satellites, only data from MSG3 (Meteosat-10) from the operational position above 0° E was used. This MSG3 data ranges from January 2013 through February 2018 and from March 2023 through March 2024.
2.2 CiPS
The CiPS (Cirrus Properties from SEVIRI) algorithm (Strandgren et al., 2017a) is designed to detect cirrus clouds and retrieve their key physical and optical properties using the SEVIRI instrument aboard the MSG satellites. CiPS employs artificial neural networks (ANNs) taking as input SEVIRI thermal infrared observations, European Centre for Medium-Range Weather Forecasts (ECMWF) surface temperatures, and auxiliary data. Cloud-Aerosol Lidar with Orthogonal Polarization (CALIOP) cloud products were used during training of the ANNs as a ground-truth target. The ECMWF surface temperature are spatially collocated with the satellite observations using the nearest neighbor and temporally collocated by linearly interpolating between the ECMWF 6 h time steps. This approach allows retrievals during both day and night and provides near-continuous coverage with 15 min temporal resolution and 3 km spatial resolution at nadir. CiPS outputs include: Cirrus Cloud Probability (CCP), Cirrus Opacity Probability (COP), Cloud Top Height (CTH), Ice Optical Thickness (IOT), Ice Water Path (IWP) and Effective Ice Particle Radius (Reff). In standard usage of CiPS, as recommended by Strandgren et al. (2017a), a pixel is considered a cirrus covered pixel when CCP is larger than 0.62. When COP is larger than the recommended threshold of 0.86 ice clouds are classified as thick, where CALIOP cannot provide accurate IOT/IWP retrievals. Based on the evaluation of 4.9 million CALIOP collocations, CiPS has a probability of detection for ice clouds of 71 % and 95 % of cirrus clouds with an optical thickness of 0.1 and 1, respectively. The average false alarm rate for ice clouds is 3.9 %. Identification of a thick ice cloud with COP yields a 71 % detection efficiency with a 4 % false alarm rate. CiPS has a relative error of less than 10 % regarding cloud top height and mean absolute percentage error of less than 100 % for ice optical thickness and ice water path. These outputs allow comprehensive characterization of cirrus cloud vertical structure, optical thickness and ice water path, enabling quantitative assessment of their radiative impact and life cycle evolution. CiPS outputs for one exemplary scene are shown in Fig. 1. CiPS has been extensively validated and characterized in Strandgren et al. (2017b) and applied in e.g. Rybka et al. (2021).
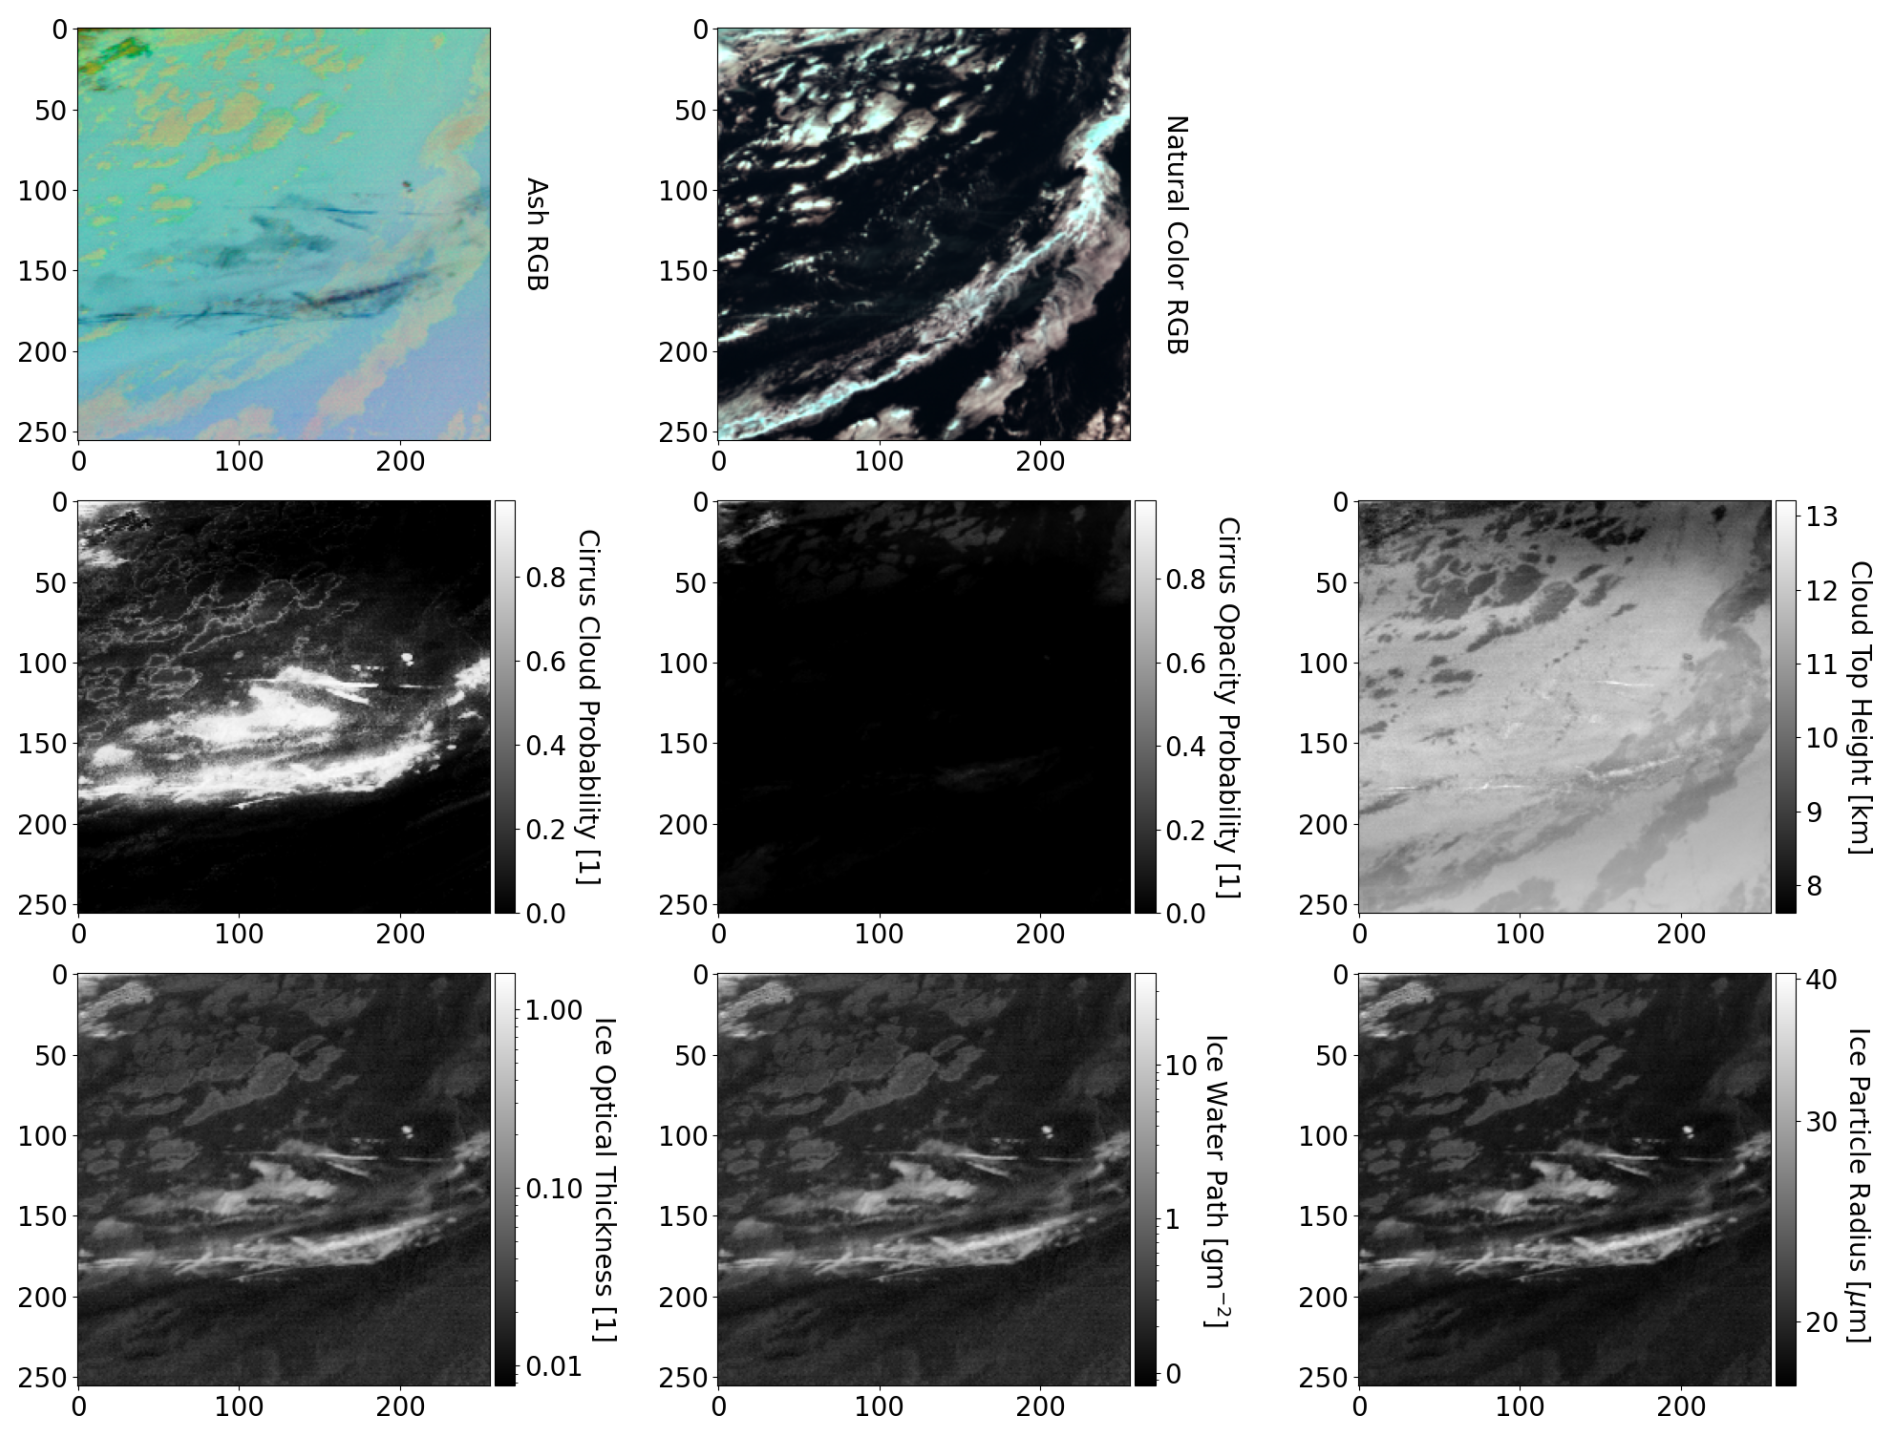
Figure 1Example of CiPS outputs for Scene 041 of the dataset (256 × 256 pixels). The figure shows eigth panels in three rows, with the top row showing the Ash RGB and Natural Color RGB composites, the middle row displaying (from left to right) cirrus cloud probability, cirrus opacity probability and cloud top phase, and the bottom row showing (from left to right) ice optical thickness, ice water path and ice particle radius. Contrails are located (mostly horizontal) in the central part of the image.
2.3 ProPS
The ProPS (PRObabilistic cloud top Phase retrieval for SEVIRI) algorithm (Mayer et al., 2024a) is designed to detect clouds and determine their thermodynamic phase using the SEVIRI instrument aboard the Meteosat Second Generation (MSG) geostationary satellites. ProPS employs a Bayesian approach, integrating SEVIRI measurements with a large collocated dataset from the DARDAR (liDAR/raDAR) product, which provides cloud phase information from lidar–radar synergy. This methodology enables the classification of cloud states into six categories: clear sky, warm liquid (LQ), supercooled liquid (SC), mixed-phase (MP), optically thin ice (TI) and optically thick ice (IC). The algorithm operates effectively during both day and night, offering near-continuous coverage with 15 min temporal resolution and 3 km spatial resolution at nadir. ProPS outputs the most probable thermodynamic phase assigned to each pixel based on the highest probability of each of the six cloud states. Validation against six months of independent DARDAR data demonstrates that ProPS achieves a daytime cloud detection rate of 93 % and a clear-sky detection rate of 86 %. For phase determination, ProPS accurately classifies 91 % of IC, 78 % of TI, 52 % of MP, 58 % of SC, and 86 % of LQ clouds. These outputs enable detailed analysis of cloud phase distributions, which are crucial for understanding cloud microphysics, radiative properties, and their role in atmospheric processes. Exemplary cloud-top phases for the same scene as in Fig. 1 are shown in Fig. 2.
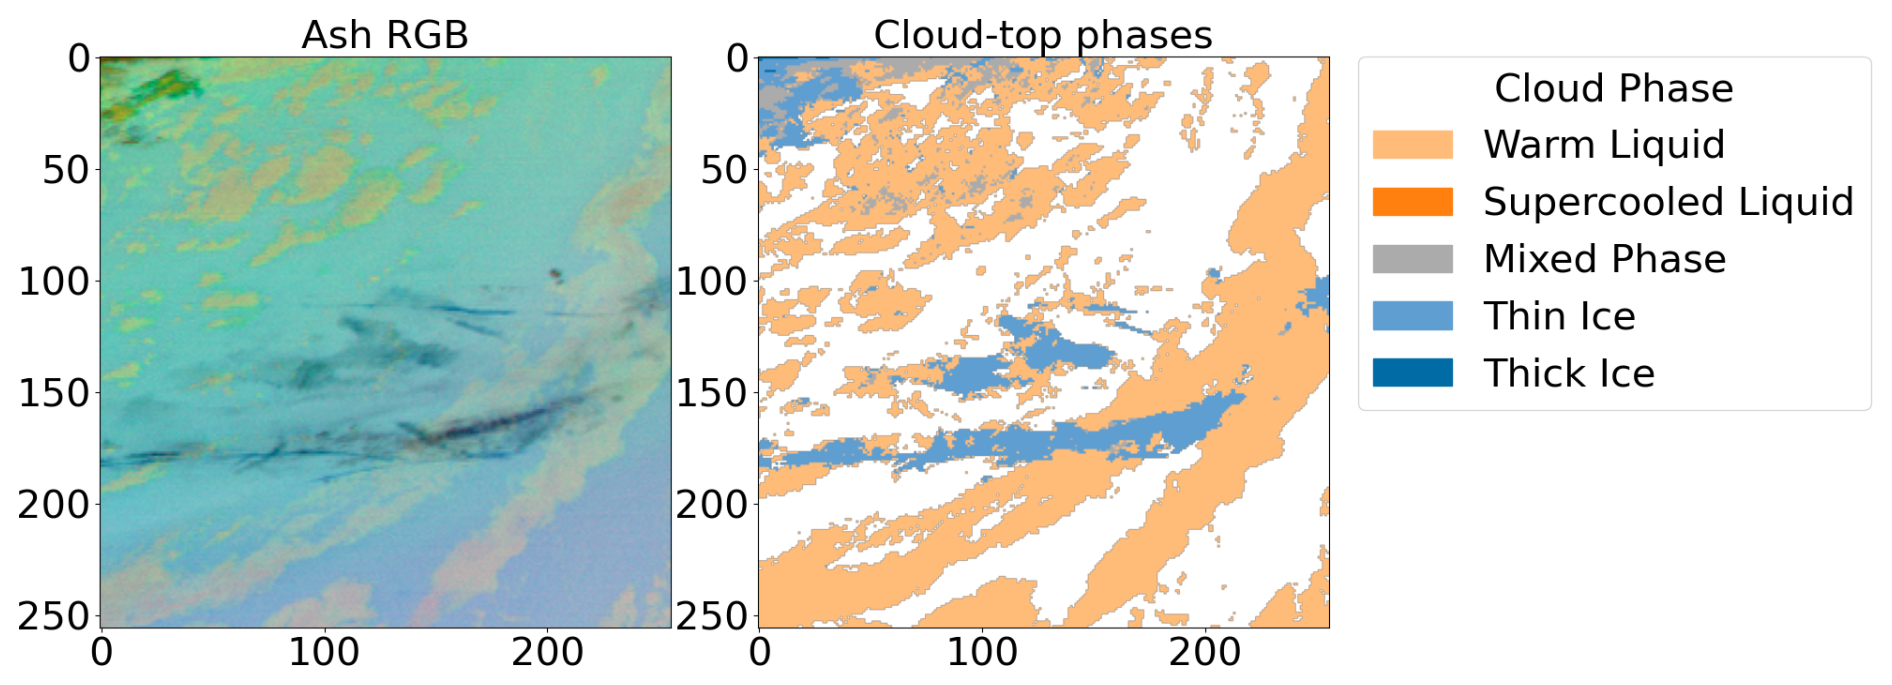
Figure 2Example of cloud-top phases for Scene 041 of the dataset as provided by ProPS
In this section, we describe the selection of scenes for the dataset and the contrail labeling procedure.
3.1 Scene selection
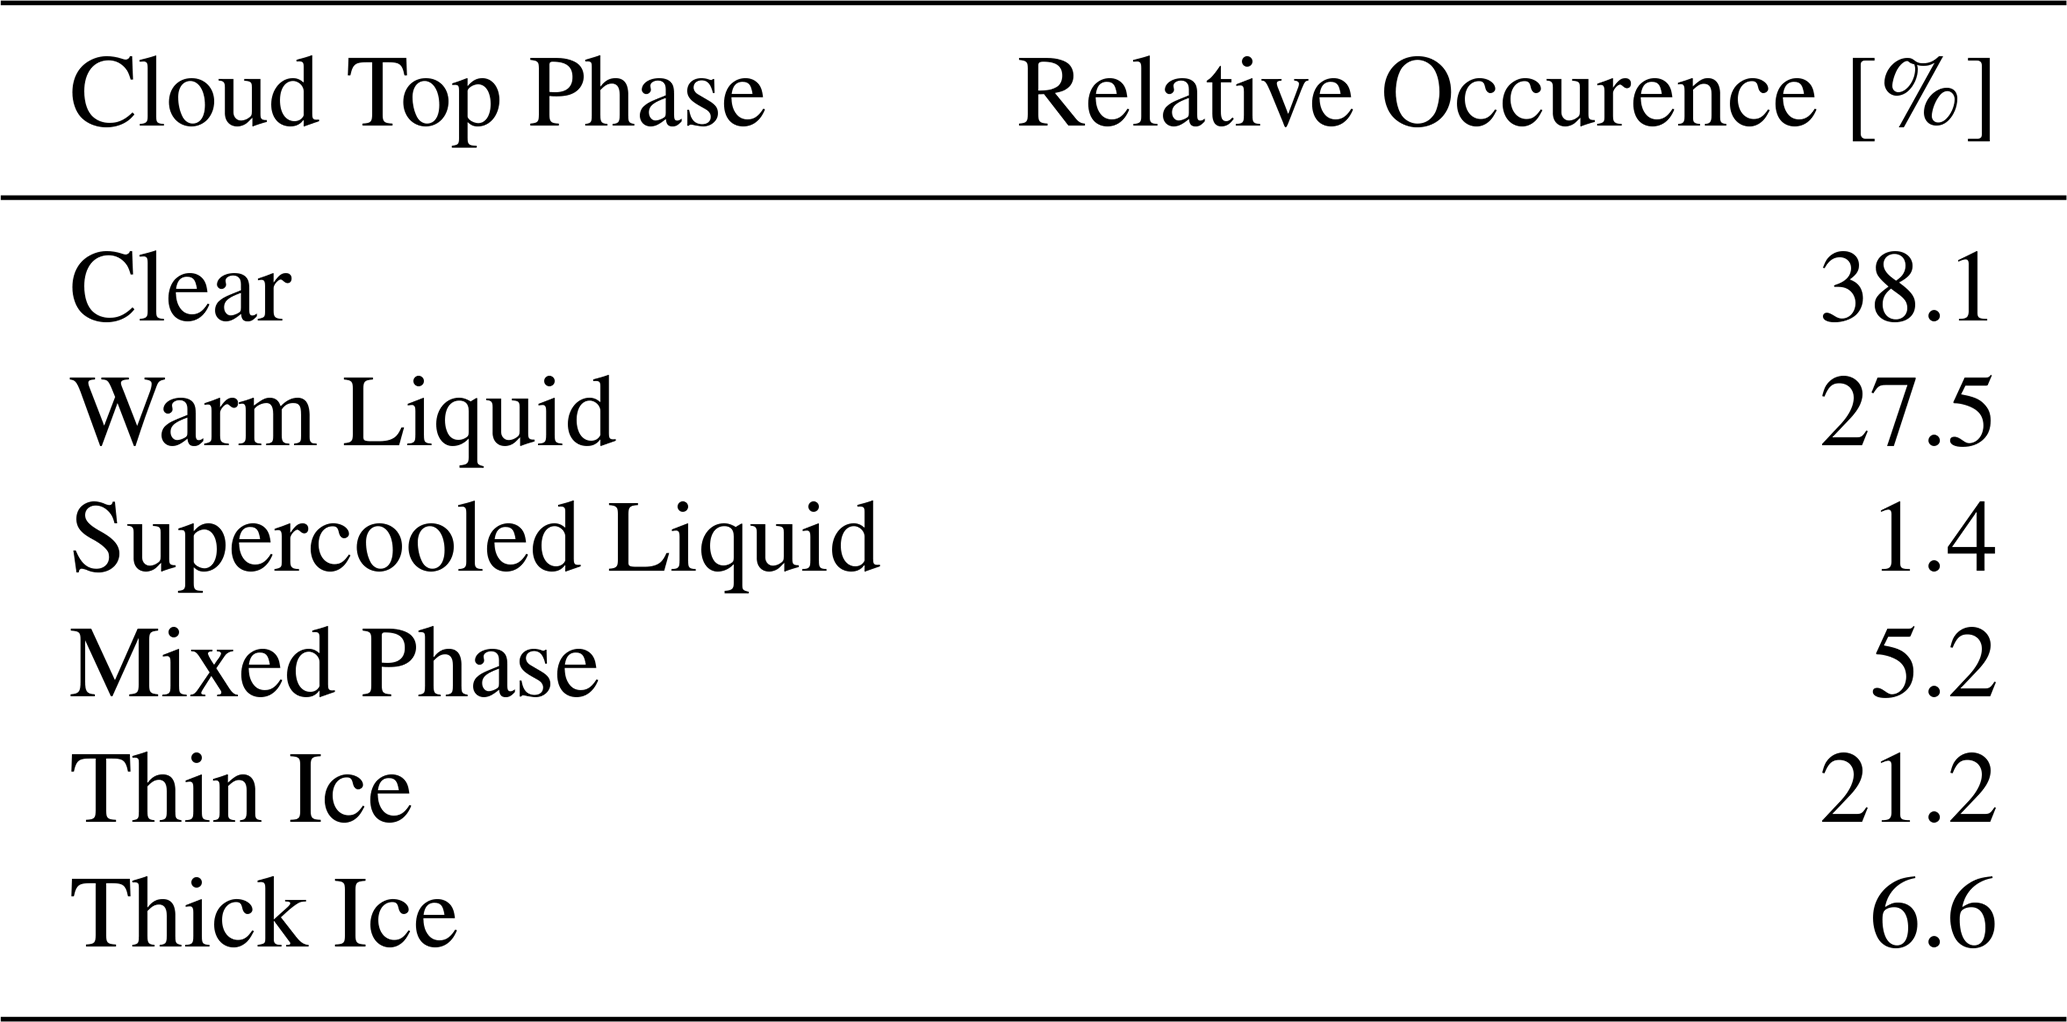
The contrail scene samples were created by randomly selecting times available from MSG3 ranging from 2013 to 2024 (see Sect. 2.1 for details). These were visually inspected with higher attention to regions more likely to contain contrails like Europe and the North-Atlantic Flight Corridor (Fig. 3). 140 images with a size of 256 × 256 pixels were selected (The majority of annotated contrails have a length of up to 60 pixels). Around 40 % of the scenes were selected with no visible contrails, the other 60 % were selected to include contrails based on the personal judgment of one human individual. This balance enhances the robustness of the dataset and guarantees that both contrail and non-contrail cases are represented: the 60 % majority ensures that a contrail detection model learns the diverse morphology of contrails, while the 40 % “null” scenes provide essential negative samples to reduce false-positive detections in clear-sky or natural-cloud conditions. The examples are not uniformly distributed in space and time as the images are sampled to include more contrail examples as described above (Fig. 3). Roughly half of the pixels are during daytime (Fig. 4), meaning that they have a solar zenith angle <90°. The distribution of cloud-top phases using the ProPS algorithm (Sect. 2.3) in all pixels of our dataset (Table 1) shows that clear-sky conditions account for the most frequently occurring pixel type. A substantial portion of the domain is covered by warm liquid or thin ice clouds. Thick ice and mixed-phase clouds occur less frequently, while supercooled liquid clouds are observed only rarely. Of course, a part of the contrails is already considered in this statistic, as they are partly identified as thin ice clouds, namely 66.21 % of contrails in the ground truth are identified as thin ice clouds by ProPS.
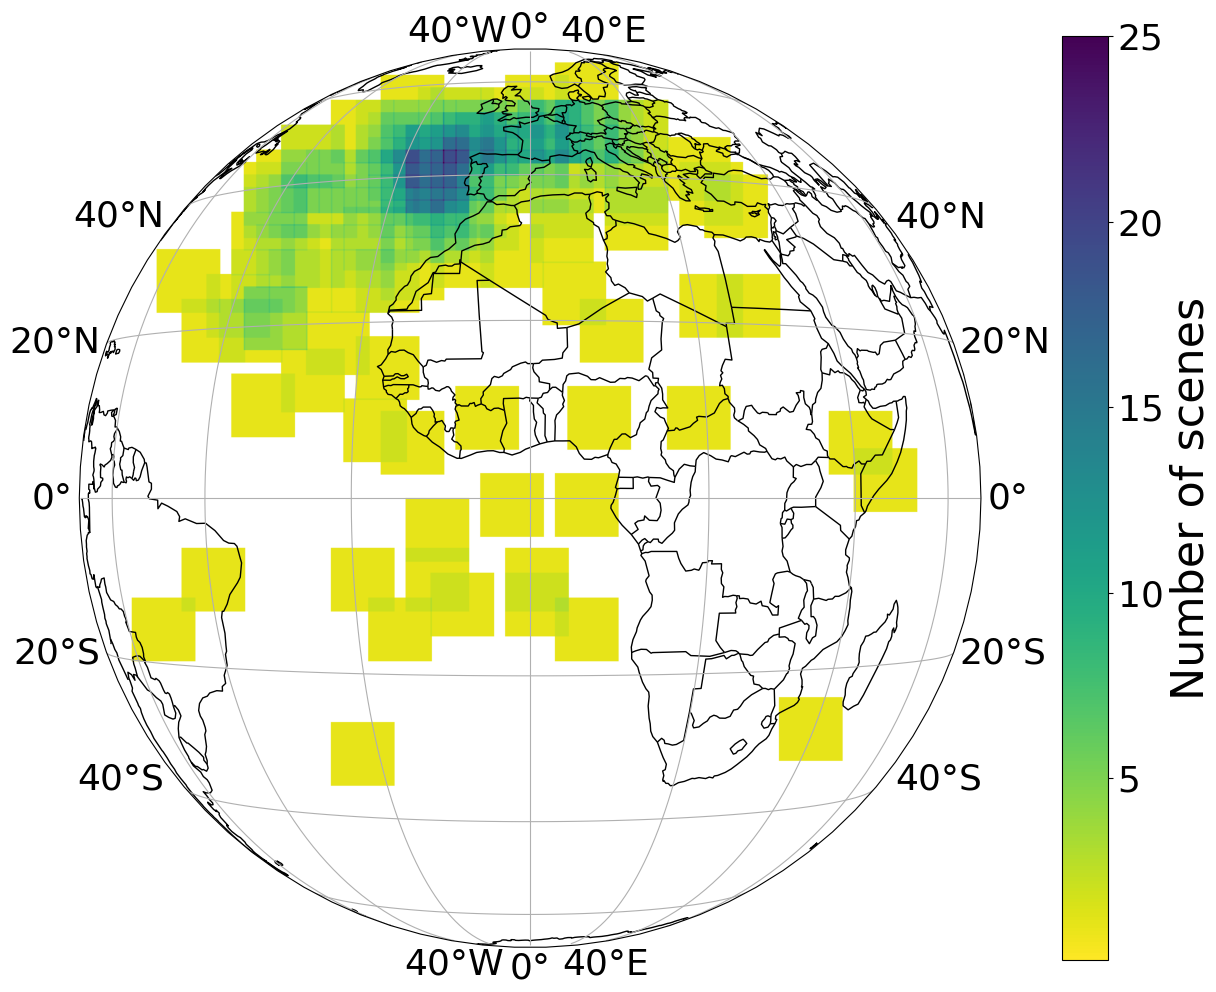
Figure 3Spatial distribution of scenes used in labeled contrail dataset. Color values indicate how many scenes contain each individual pixel location.
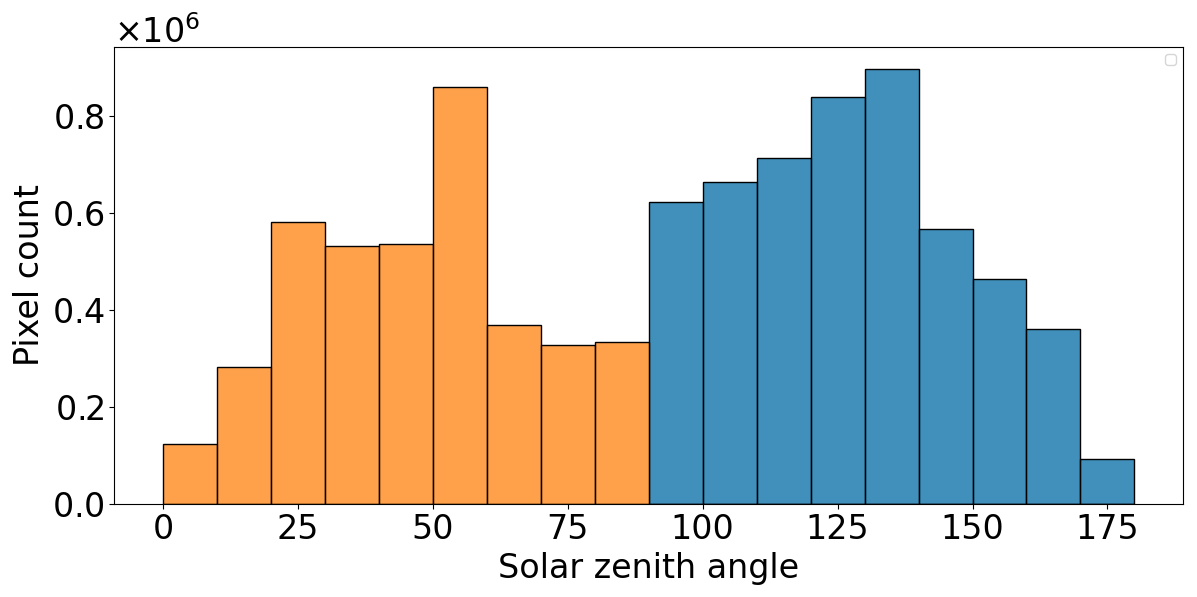
Figure 4Distribution of solar zenith angle in the dataset. Orange and blue bars correspond to daytime and nighttime samples, respectively. The values represent the number of pixels falling into each solar zenith angle bin.
Table 1Relative pixel count frequency of cloud-top phases from ProPS (Mayer et al., 2024a) in the compiled contrail dataset.
3.2 Contrail Labeling Process
The Open Source Darwin V7 Labeling tool (V7 Labs, 2025) was used for contrail labeling. Human labelers were presented with a subset of the 140 selected images or more precisely Ash RGB composite images in satellite projection in which contrails should be marked. The Ash RGB images are created in agreement with the EUMETSAT user manual by linearly stretching two Brightness Temperature Differences (BTDs) and one Brightness Temperature (BT) over a pre-defined range (see Table 2), without gamma correction (i.e. γ=1). This composite enhances thin ice clouds visibility, so contrails can be identified as dark blue linear structures in these images. Because only infrared channels are used, these composites are available during day and night. To further aid the labeling process, additional composites and BTDs were provided as a time series. Images spanning one hour prior to and one hour following the timestamp of the target image were provided to account for the temporal evolution of the objects. This time window was chosen as a compromise between providing sufficient temporal information and limiting the data volume and complexity of the dataset. In many cases, contrails can already be followed and identified within this time due to their advection and spreading. Duda et al. (2004) found a spreading rate of 2.7 km h−1. While other labeling campaigns have provided labelers with some rasterization of advected flight trajectories to inform their labels (e.g. Ng et al., 2024), they were not provided to labelers here. Contrails are expected to suddenly appear as thin straight lines and spread out over time. As contrails grow older, they lose their linear shape and their width increases. This is different to natural clouds that usually form more gradually and often have diffuse or irregular structures from the start, that might become or include linear structures due to wind shear or waves in the upper troposphere. This temporal context is very helpful for contrail identification (see also Ng et al., 2024). The additional time series imagery included the Ash RGB, an inverted Ash RGB, two BTDs (IR108 – IR120 and IR087 – IR120) and a Natural Color RGB and HRV Cloud RGB (EUMeTrain, 2022) if the solar channels were available during daytime (Fig. 5). Contrails appear as dark blue lines in the Ash RGB composite and bright yellow lines in the inverted Ash RGB. The two mentioned BTDs are known to enhance contrail visibility (Inoue, 1985; Mannstein et al., 1999, 2010; Mayer et al., 2024b) as contrails exhibit higher brightness compared to their surrounding in the BTDs. Additional daytime imagery (Natural Color RGB and HRV Cloud RGB) is provided to help to more clearly identify natural clouds and allow to help distinguish them from contrails. Using a brush tool, labelers were asked to mark each individual contrail pixel in the Ash RGBs, for all contrails that contain at least 10 pixels. Labelers were provided a detailed labeling guide in a similar way as in Ng et al. (2024), explaining the labeling tool and the additional imagery provided.
Table 2Channels and normalization ranges for Ash RGB according to EUMETSAT user manual (EUMeTrain, 2022).
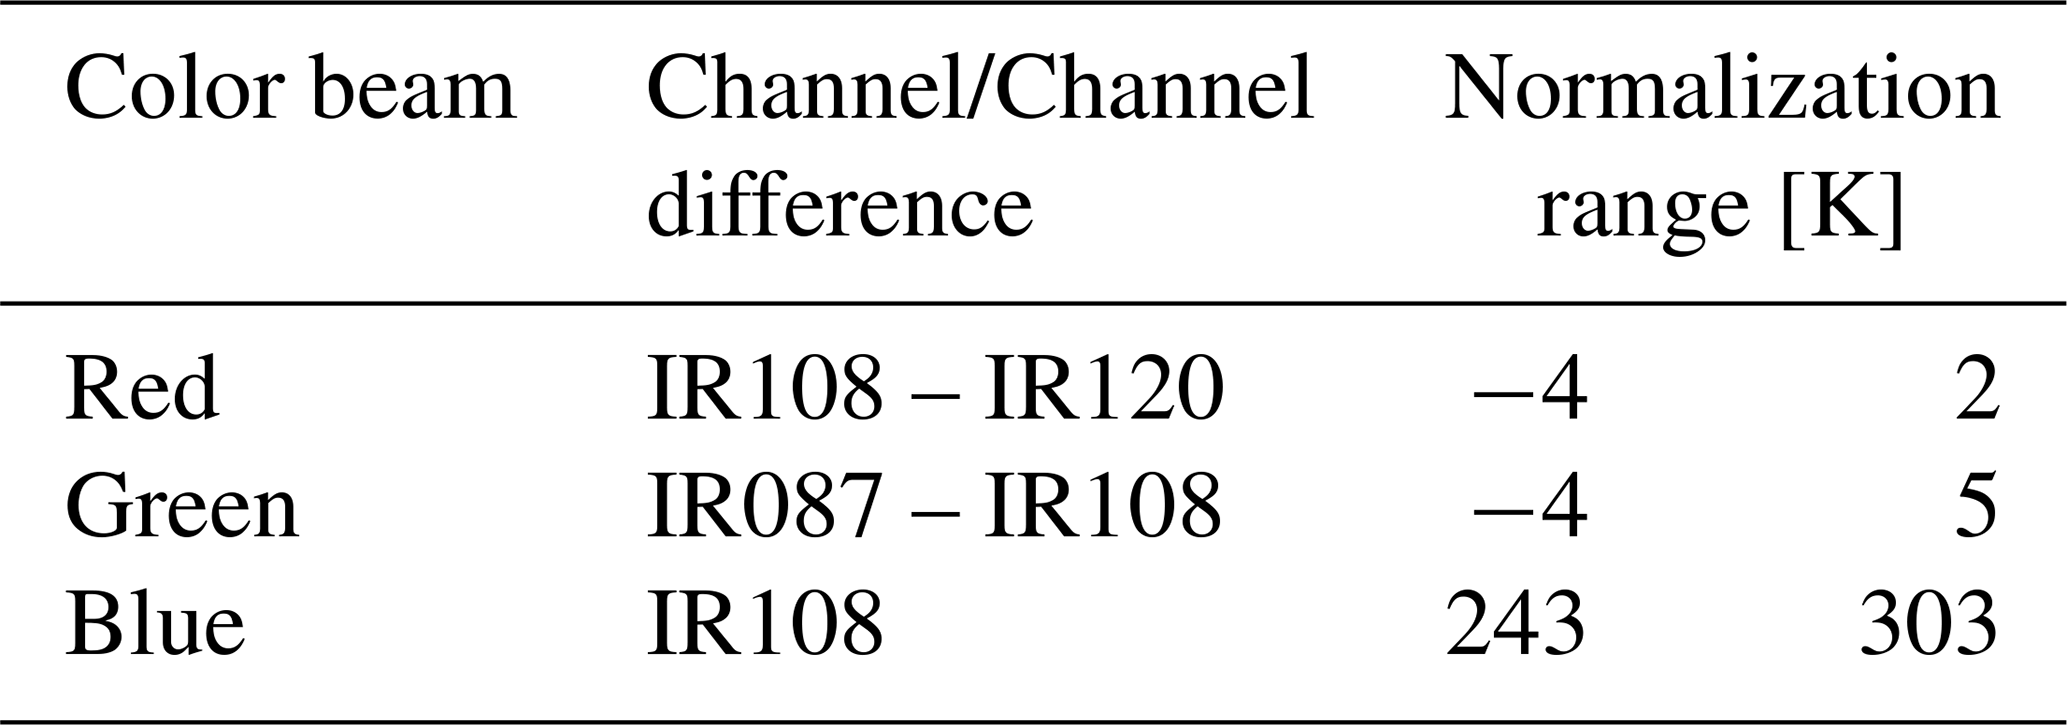
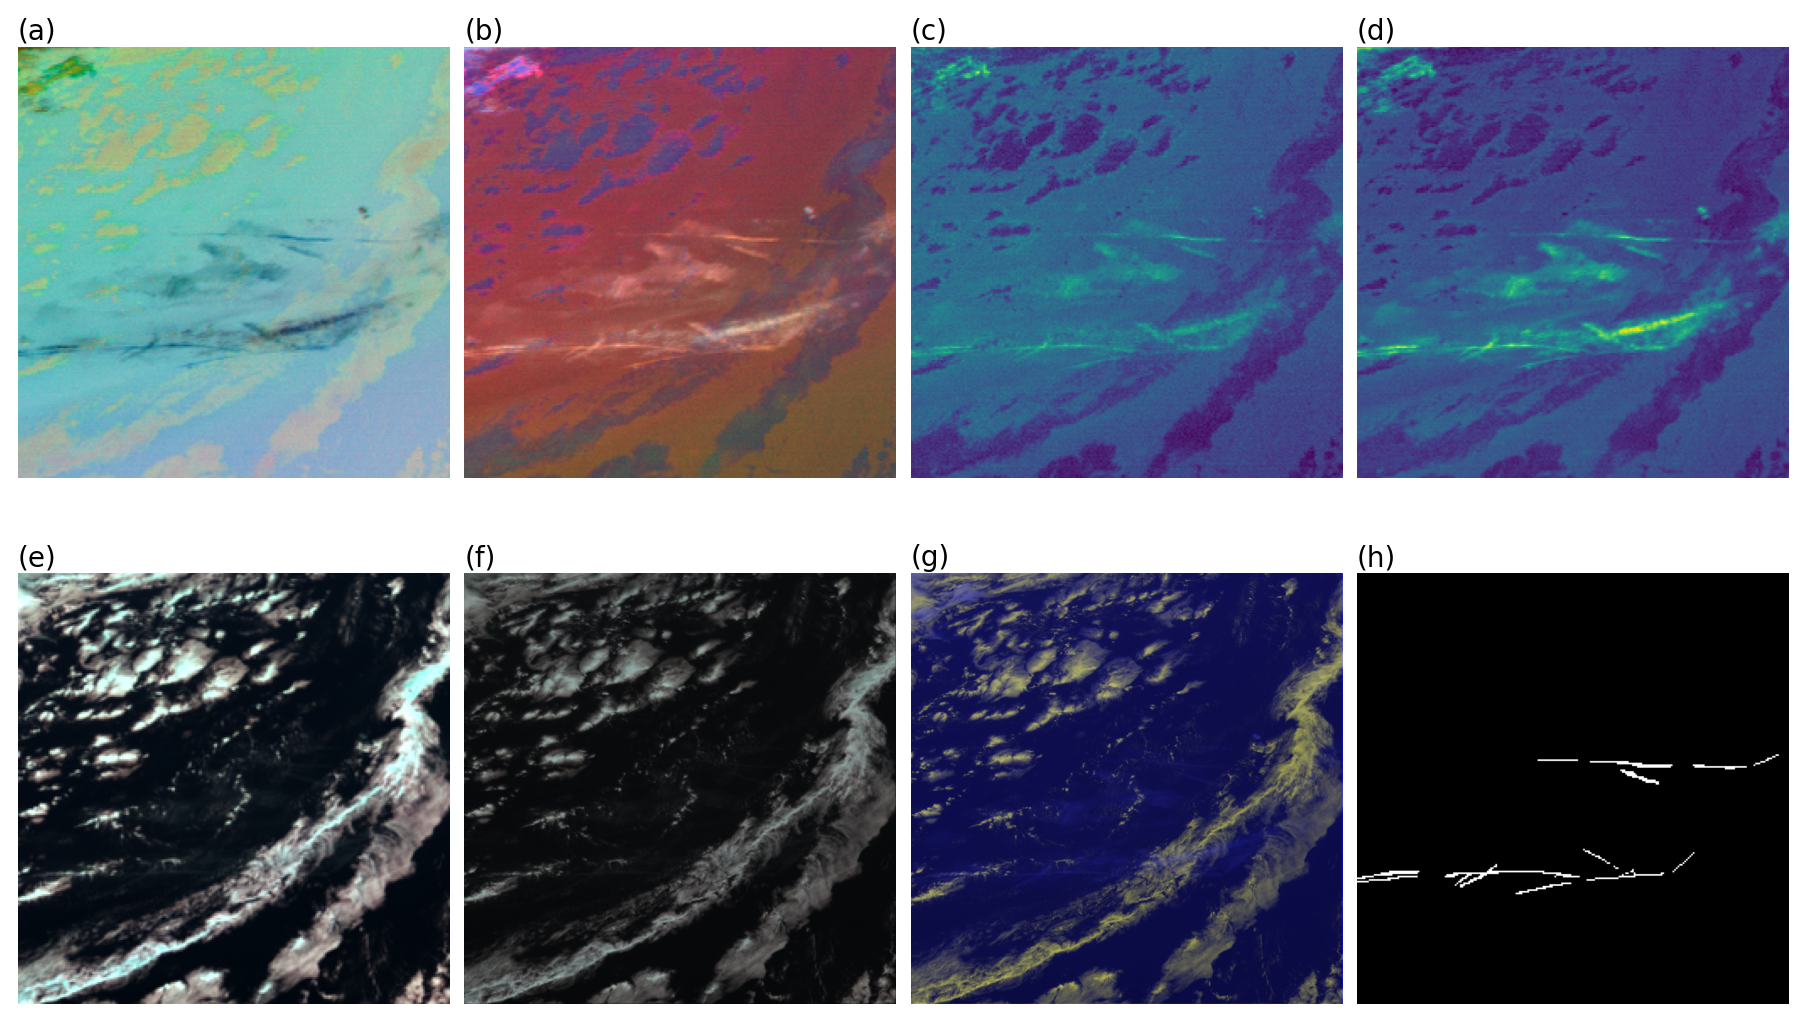
Figure 5Example images for Scene 041 provided to labelers: (a) Ash RGB; (b) Inverted Ash RGB; (c) BTD IR108 – IR120; (d) BTD IR087 – IR120; (e) Natural Color RGB; (f) HRV Natural Color RGB; (g) HRV Cloud RGB; and (h) labeling result as the agreement between three labelers (majority mask).
To establish a validation standard that reduces subjectivity of labelers in MSG labeling, each image was labeled independently by three different labelers. 14 total labelers were each given a subset of the 140 images, with three labelers receiving the same subset of images, making sure that each image is annotated three times by different persons. If at least two out of the three labelers marked a pixel as a contrail pixel, it was marked as a contrail pixel in the final contrail mask (majority mask, called also ground truth). Otherwise the pixel was marked as a non-contrail pixel. Some examples are shown in Fig. 6.
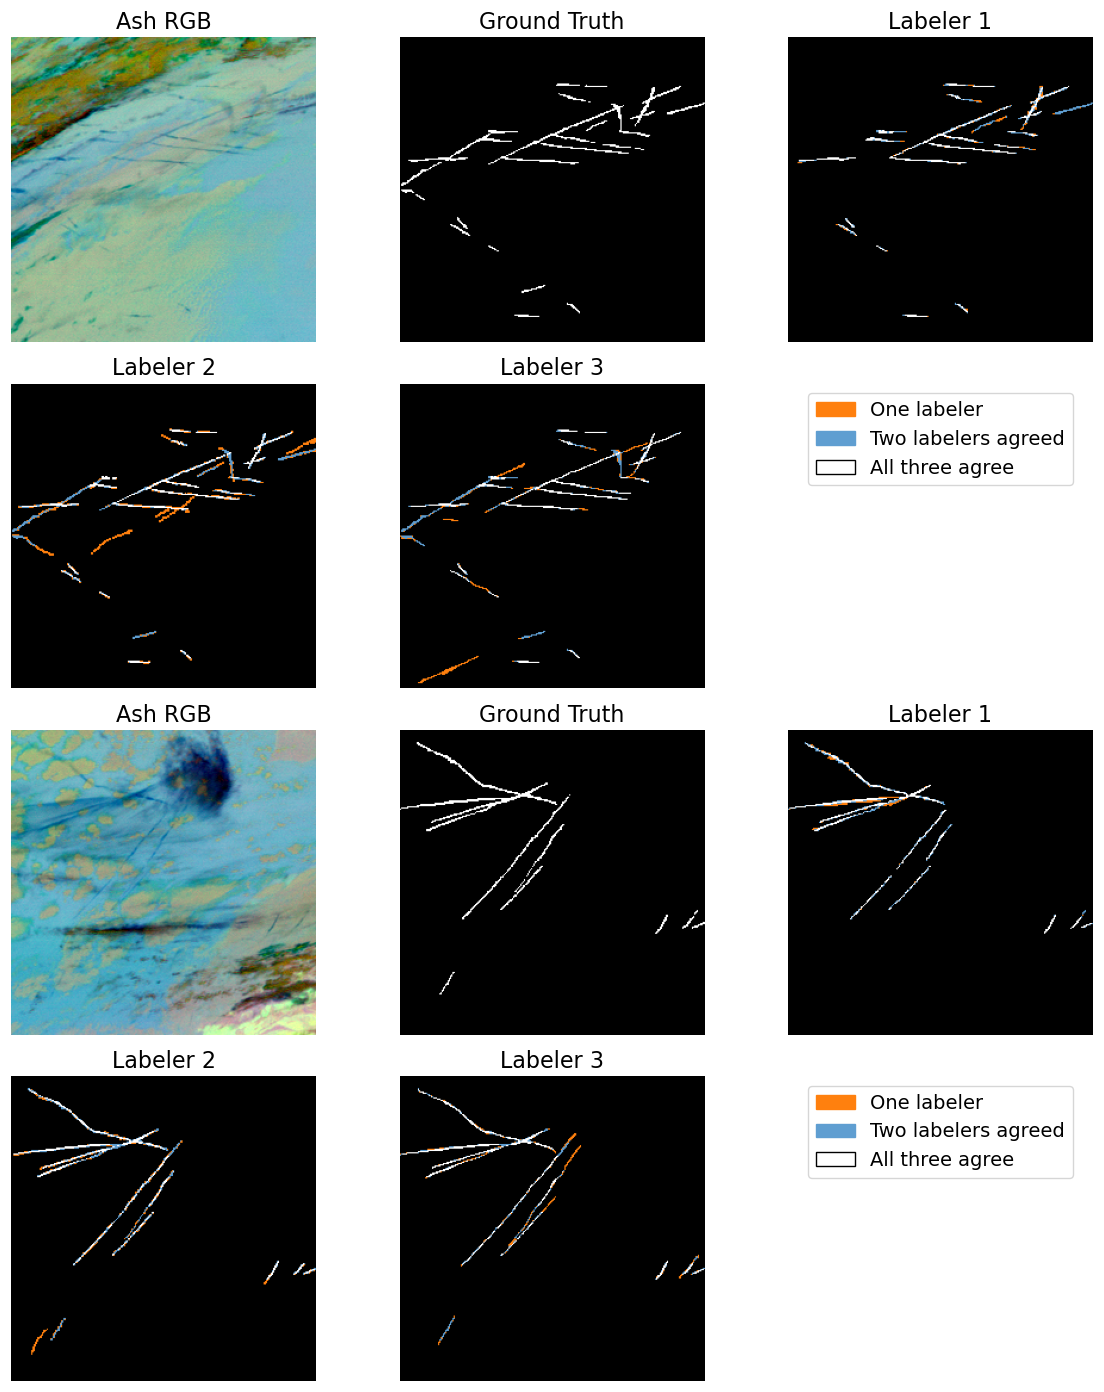
Figure 6Examples of individual labeler annotations and the resulting consensus ground truth for selected scenes in the dataset.
In the following, we discuss the results of the labeling campaign. The focus is on the established ground truth and its properties, labeling dependencies and the subjectivity of human labeling in MSG imagery.
4.1 Ground Truth
4.1.1 Derivation of contrail properties
Every contrail identified in the ground truth (majority consensus of three labelers) consists of a set of pixels that have been marked by the labelers. To compute properties like length, width and linearity we first fit a line to these pixels. The first and last point of the line that overlap with the pixels identified by the labelers define the two endpoints of the contrail. Contrail length is the distance between the two endpoints of the contrail. We define the width of a contrail as twice the perpendicular distance of a pixel to the fitted line of the contrail. Mean width is the mean of those distances for all pixels that are part of the contrail, while maximum width is the maximum of those distances. The average mean width of a contrail is the average of the mean width over all contrails in the ground truth. To assess linearity, a Principal Component Analysis (Hotelling, 1933) was performed, and the proportion of variance explained from the first component is used as a linearity score for the objects. If the pixels form a line, most variance is captured by the first principal component; if they form a blob, variance is shared with the second. Thus, the variance fraction of the first component serves as a linearity score.
4.1.2 Contrail properties in the ground truth
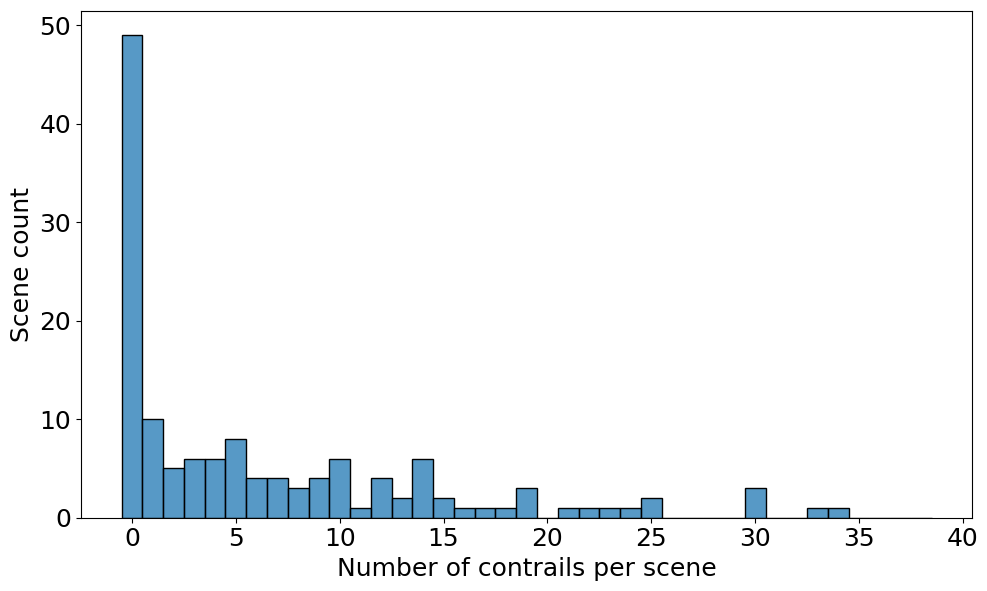
The ground truth contains a total of 772 contrails, with 40 812 pixels that were annotated by at least two labelers. This shows a slightly lower labeling density of 0.44 % compared to the 1.2 % observed in Ng et al. (2024). Most contrails in the ground truth have a length of less than 50 pixels (Fig. 7a), with an average length of 25 pixels. The average mean width is one pixel. Most labeled contrails have a mean width of up to two pixels (Fig. 7b). The maximum width of contrails in the ground truth can be up to 6 pixels. Linearity scores of contrails are mostly above 0.9 (Fig. 7c), averaging to 0.984. This indicates that contrails are easily distinguished in satellite images by human labelers if they are long, thin and linear stripes. 49 out of the 140 images contain no contrails in the ground truth (Fig. 8), thus 9 more than in the original first image selection process. This discrepancy highlights that some contrails are challenging to identify – often subtle or ambiguous – making them difficult to detect at first glance or leading to differences in classification among labelers. Across all scenes, the mean contrail number is approximately 7. When considering only scenes in which contrails are present, the mean increases to 10.9. 82.89 % of contrail pixels in the ground truth are classified as cirrus pixels by CiPS. 66.21 % of contrail pixels are correctly classified as thin ice clouds by ProPS. While pixels of a contrail might be classified correctly, those algorithms cannot distinguish between contrail pixels and other surrounding ice cloud pixels. Thus, they cannot depict the contrail in its shape. This indicates that these two satellite retrievals are not able to detect all contrails and a dedicated algorithm for contrail detection is needed. The presented ground truth provides the necessary basis for the development and evaluation of a contrail detection algorithm.
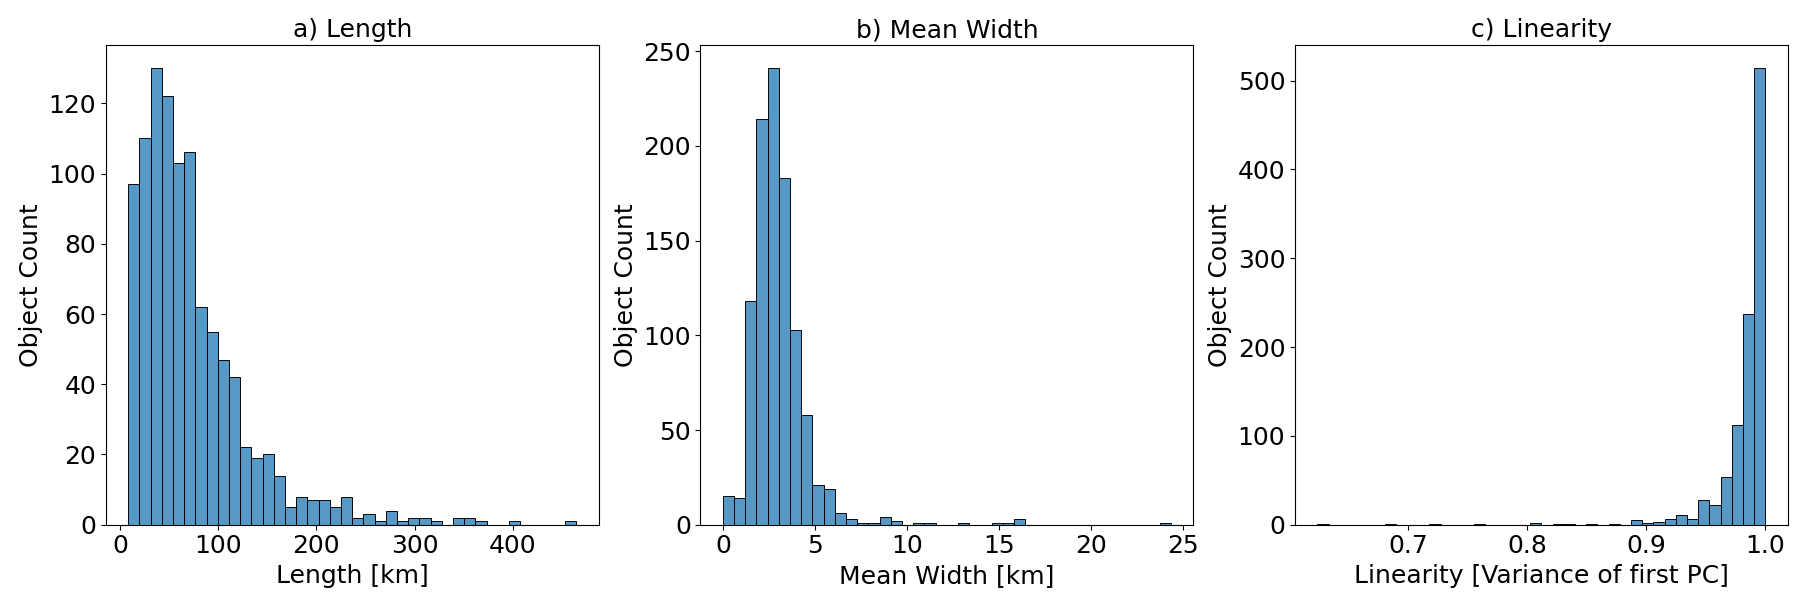
Figure 7(a) Length; (b) Mean Width; (c) Linearity of labeled contrails as the proportion of variance of the first principal component (PC) when performing a principal component analysis on each object's pixels in the ground truth (annotated by at least 2 labelers).
4.2 Labeling uncertainties
Labeling results can be investigated pixel-wise and object-wise. An object-wise agreement was assumed if at least half of the object's pixels matched. A total of 94 256 pixels were annotated by all labelers. 58 % of those pixels were marked by only one person and all three labelers agreed on only 20 % of marked pixels. Labelers marked a total of 1851 contrails in the 140 images. More than half of those contrails, namely 57 %, were only labeled by one person. All three labelers agreed on only 26 % of the labeled contrails. There was also a big difference in which pixels labelers marked in each contrail. On average, only half of the total labeled pixels for each contrail matched between the labelers. These results indicate that some labelers were stricter or more confident in identifying contrails. Also, some labelers have marked contrails more conservatively, while others included broader areas and marked contrails as longer or wider instead of labeling only the core of the contrail. The disagreement between the pixel-wise and object-wise results suggests that larger contrails may have more variation in labeling, while smaller contrails could be missed or misidentified entirely by some labelers. Labeler agreement depended heavily on the cloud phase (determined by ProPS) of clouds beneath/around the contrail. Contrails were more likely to be identified by all labelers in clear sky conditions or over warm liquid clouds. Over thick ice clouds they were more likely to be identified by only one or two persons (Fig. 9a). High linearity (see Sect. 4.1) also had a big impact on labeling agreement as more linear contrails were marked by all persons more often (Fig. 9b). Narrow contrails (i.e. pixel width <2.5) were usually marked by fewer labelers (Fig. 9c). Beyond the metrics shown in Fig. 9, which show the highest influence on labeler agreement, we evaluated a suite of additional properties to ascertain their influence on inter-labeler consistency. With ascending length of contrails, the labeler agreement increases slightly. No correlation can be found between labeler agreement and surface type (land/sea), surface altitude, solar zenith angle or satellite elevation angle. Number of contrail pixels present in the labeled image did also not have any significant effect on labeler agreement. The different labeling results are thus due to the subjective decisions taken based on the individual visual interpretation of the images and on the objective challenge in identifying contrail structures of different width, length, appearance and contrast and separating them from natural clouds.
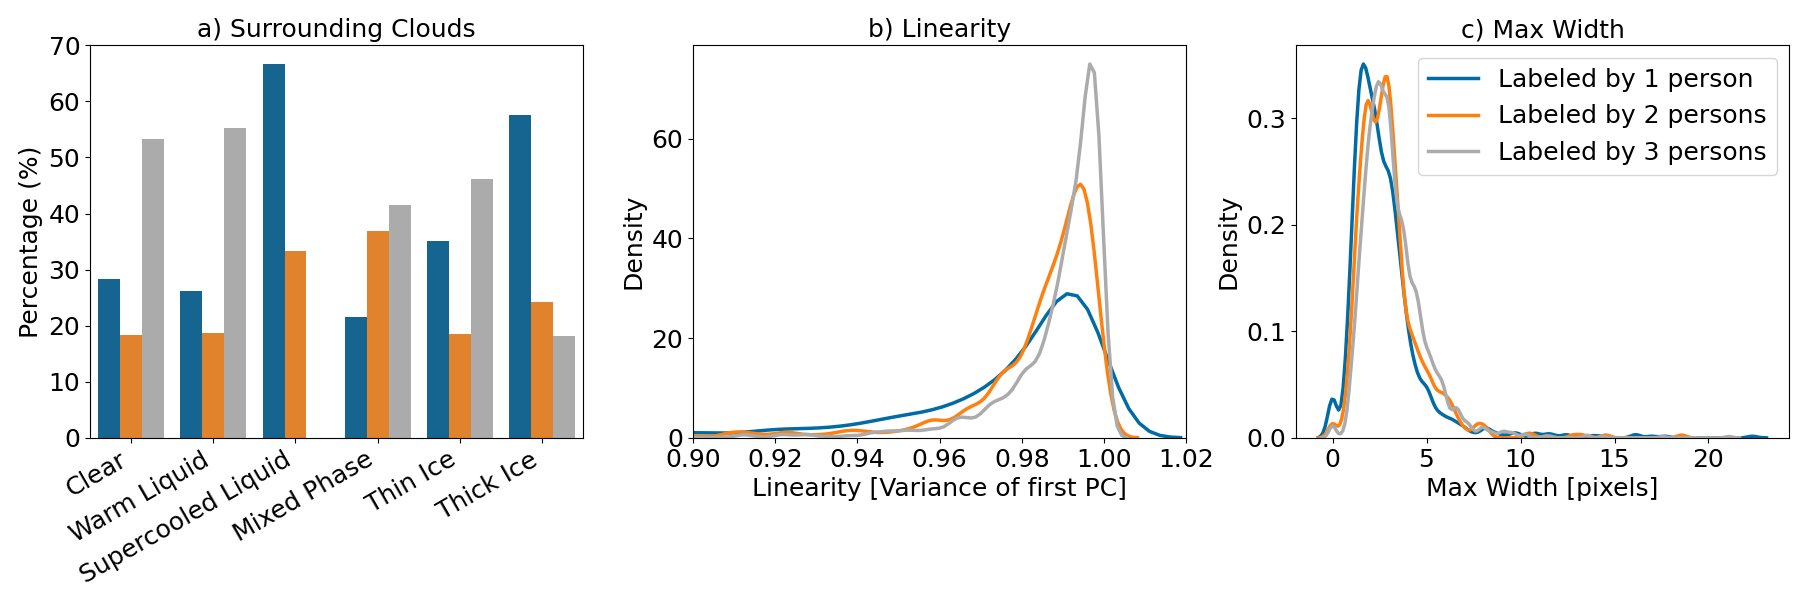
Figure 9(a) Cloud-top phase of clouds beneath/around labeled contrails; (b) Linearity of labeled contrails; (c) Maximum width in pixels of labeled contrails; sorted by labeler agreement (the number of labelers agreeing on a contrail). Percentage refers to the proportion of objects within each cloud type that were labeled by one, two or three people. (Probability) density indicates the likelihood of observing a given value; the area under each curve integrates to 1.
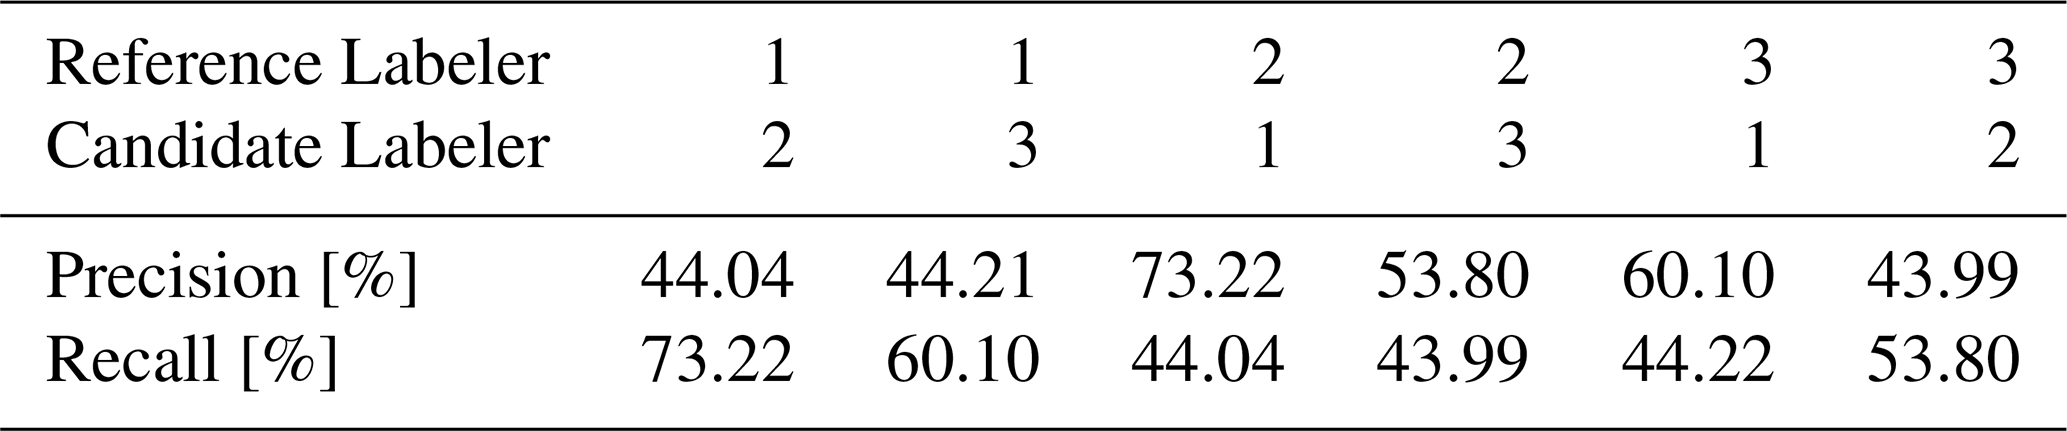
As illustrated above, although detailed labeling instructions were given, the task remained subjective. Therefore, we compare the results from different labelers to assess their level of agreement (see Table 3). This is done by assigning/defining that one labeler is the truth, so precision and recall for the other ones are computed. The highest precision (proportion of correctly identified contrails compared to all identified contrails) observed between labelers on the full dataset was 73 %, while some comparisons showed precision values as low as 43 %. Recall (proportion of correctly identified contrails to all contrails in the truth) values similarly varied within this range. When comparing individual labeler's results to the ground truth, labelers achieve a precision of about 67.5 % and a recall of 82.3 %. Ng et al. (2024) observed similar precision and recall values when comparing 200 examples from individual labelers with their ground truth, 64 % and 76 % respectively. Like SEVIRI, the imagery used in their study was sourced from a geostationary platform (GOES-16), which features a slightly higher spatial resolution of 2 km for infrared channels at nadir. However, they provided their labelers with some rasterization of advected flight trajectories, which we did not. These results highlight that even the established ground truth (validation standard) is inherently subjective in geostationary satellite imagery and not perfectly accurate. Defining it as objects labeled by at least two out of three labelers inevitably leads to missing an unknown amount of real contrails that were identified by only one person or even none but should also reduce false alarms.
Table 3Pixel-wise precision and recall comparing individual labeler's results (assuming that one labeler is the truth (reference labeler), so precision and recall for the other two (canditate labelers) are computed).
The dataset supporting this study follows the FAIR principles to ensure it is Findable, Accessible, Interoperable, and Reusable. The published dataset (Santos Gabriel et al., 2025) contains manually annotated contrail masks derived from MSG/SEVIRI imagery. Additionally, cloud properties and ancillary data are provided. Scenes are sequentially numbered from 0 to 139. The data repository includes the following content:
-
ash RGB images (PNG format)
-
ground truth images (PNG format)
-
labeler annotations, cloud properties and ancillary data (NetCDF format)
-
contrails as per Ground truth as individual objects (GeoJSON format)
-
file with observation times, regions, and additional info of full dataset (CSV format)
-
documentation file (md format)
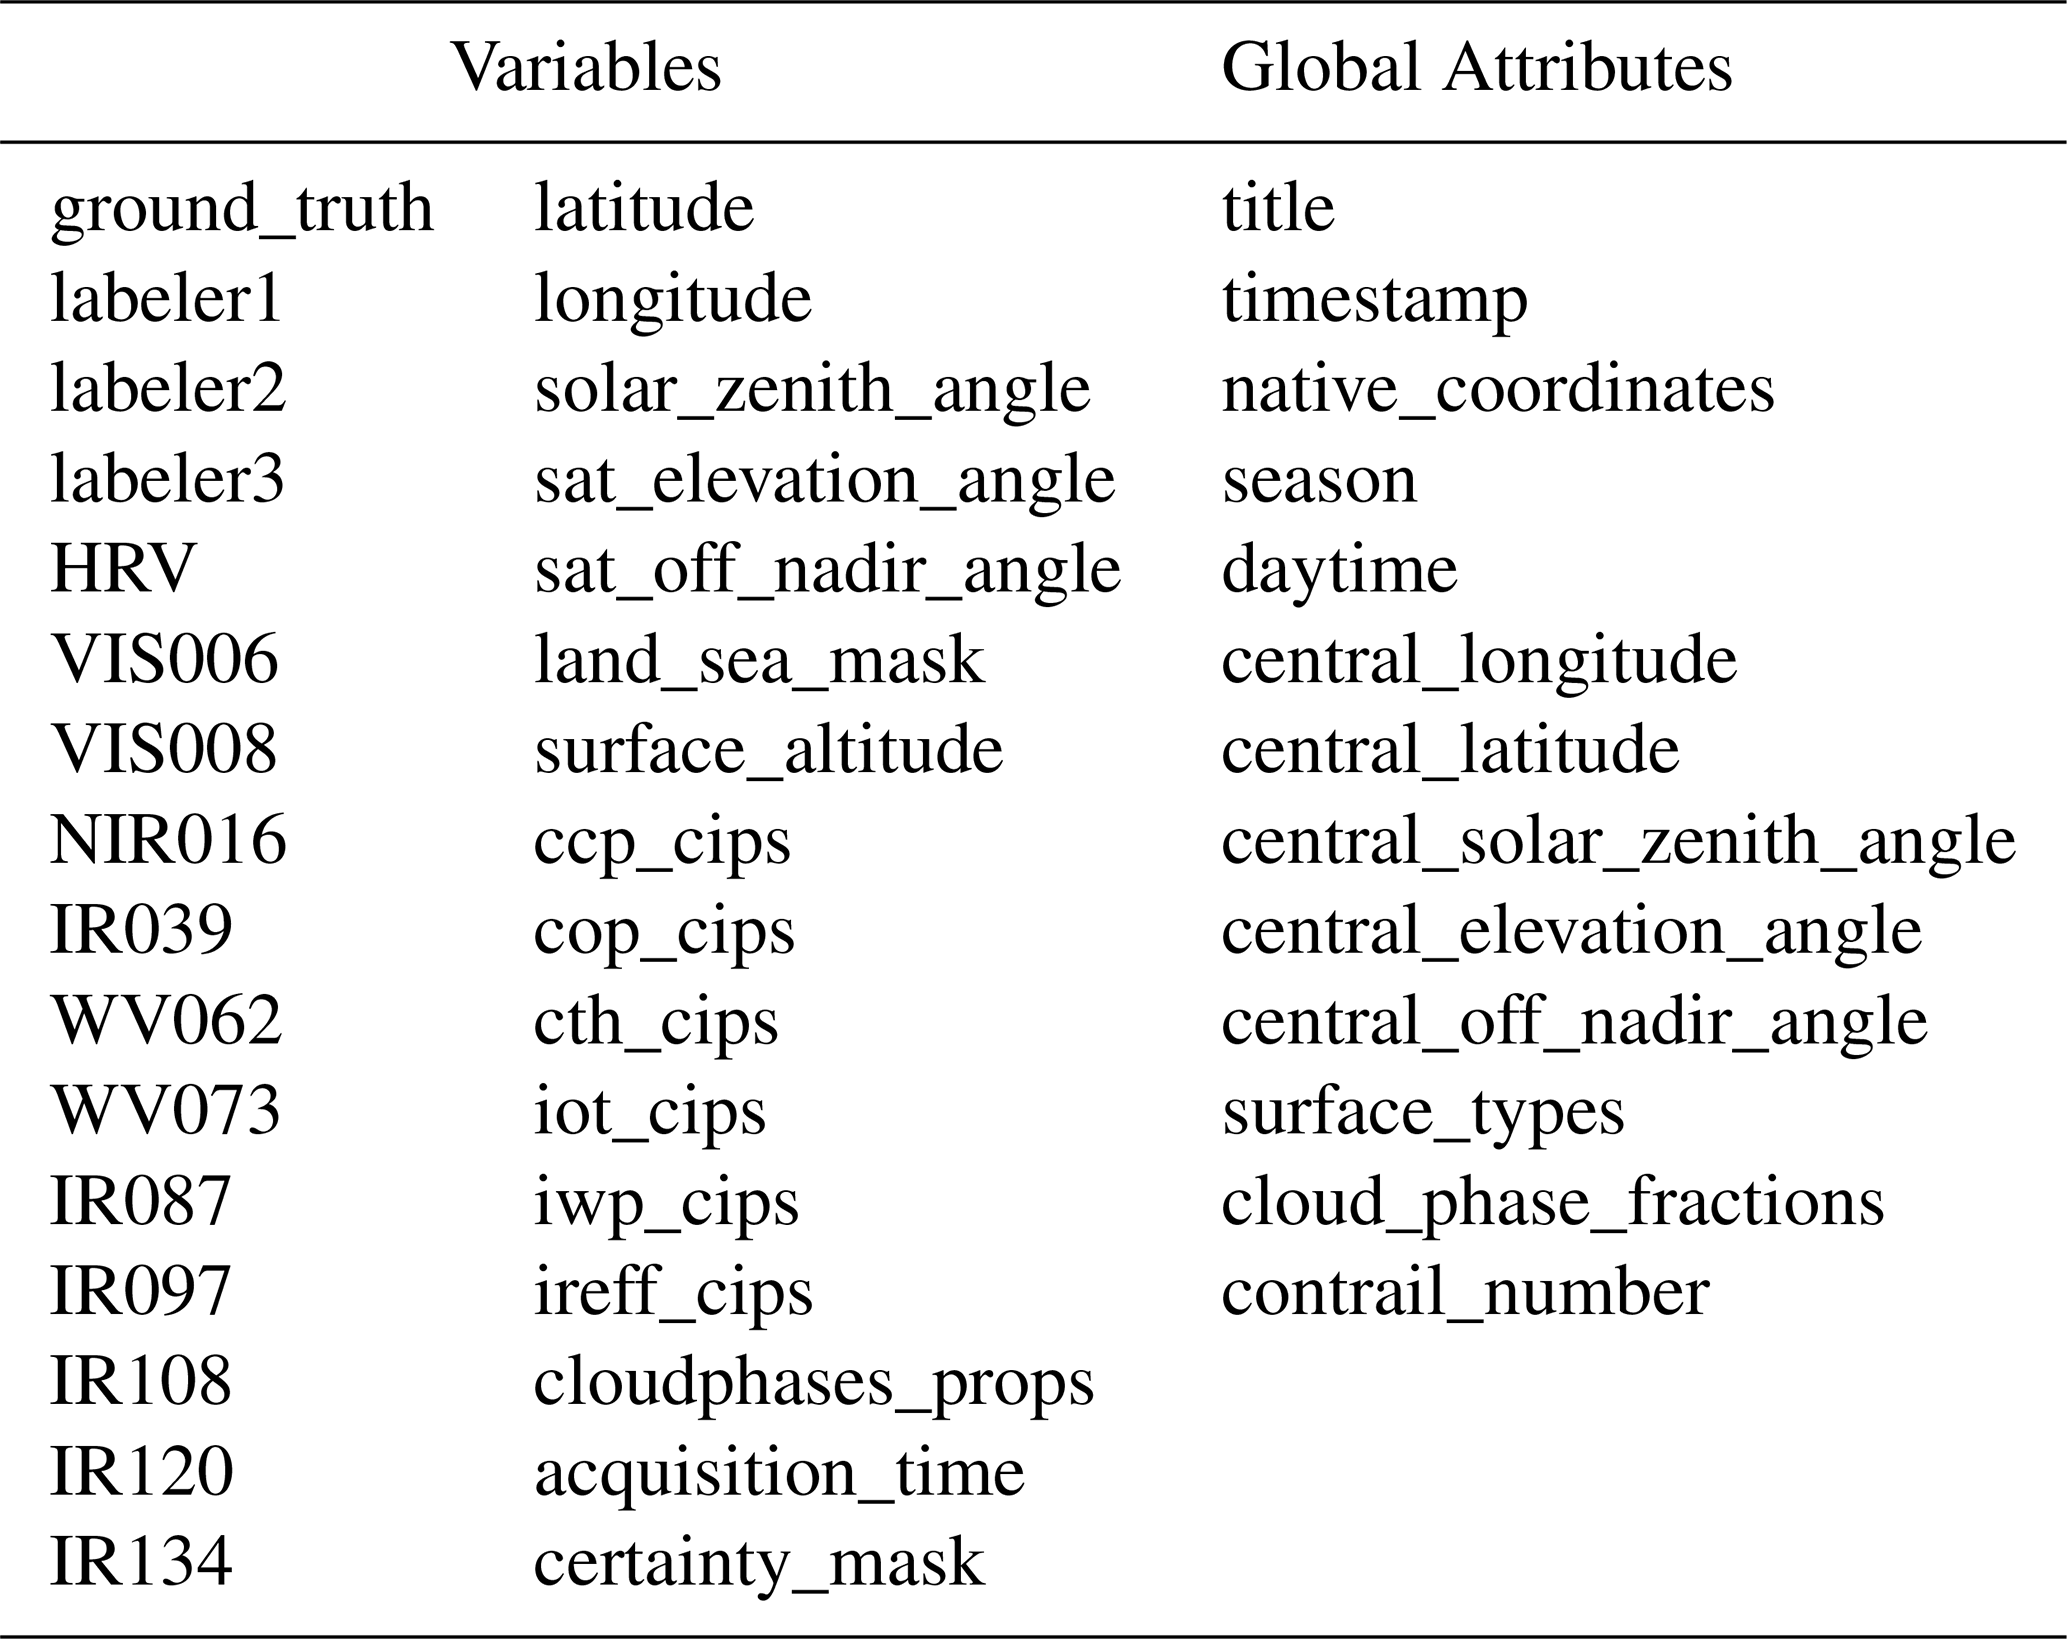
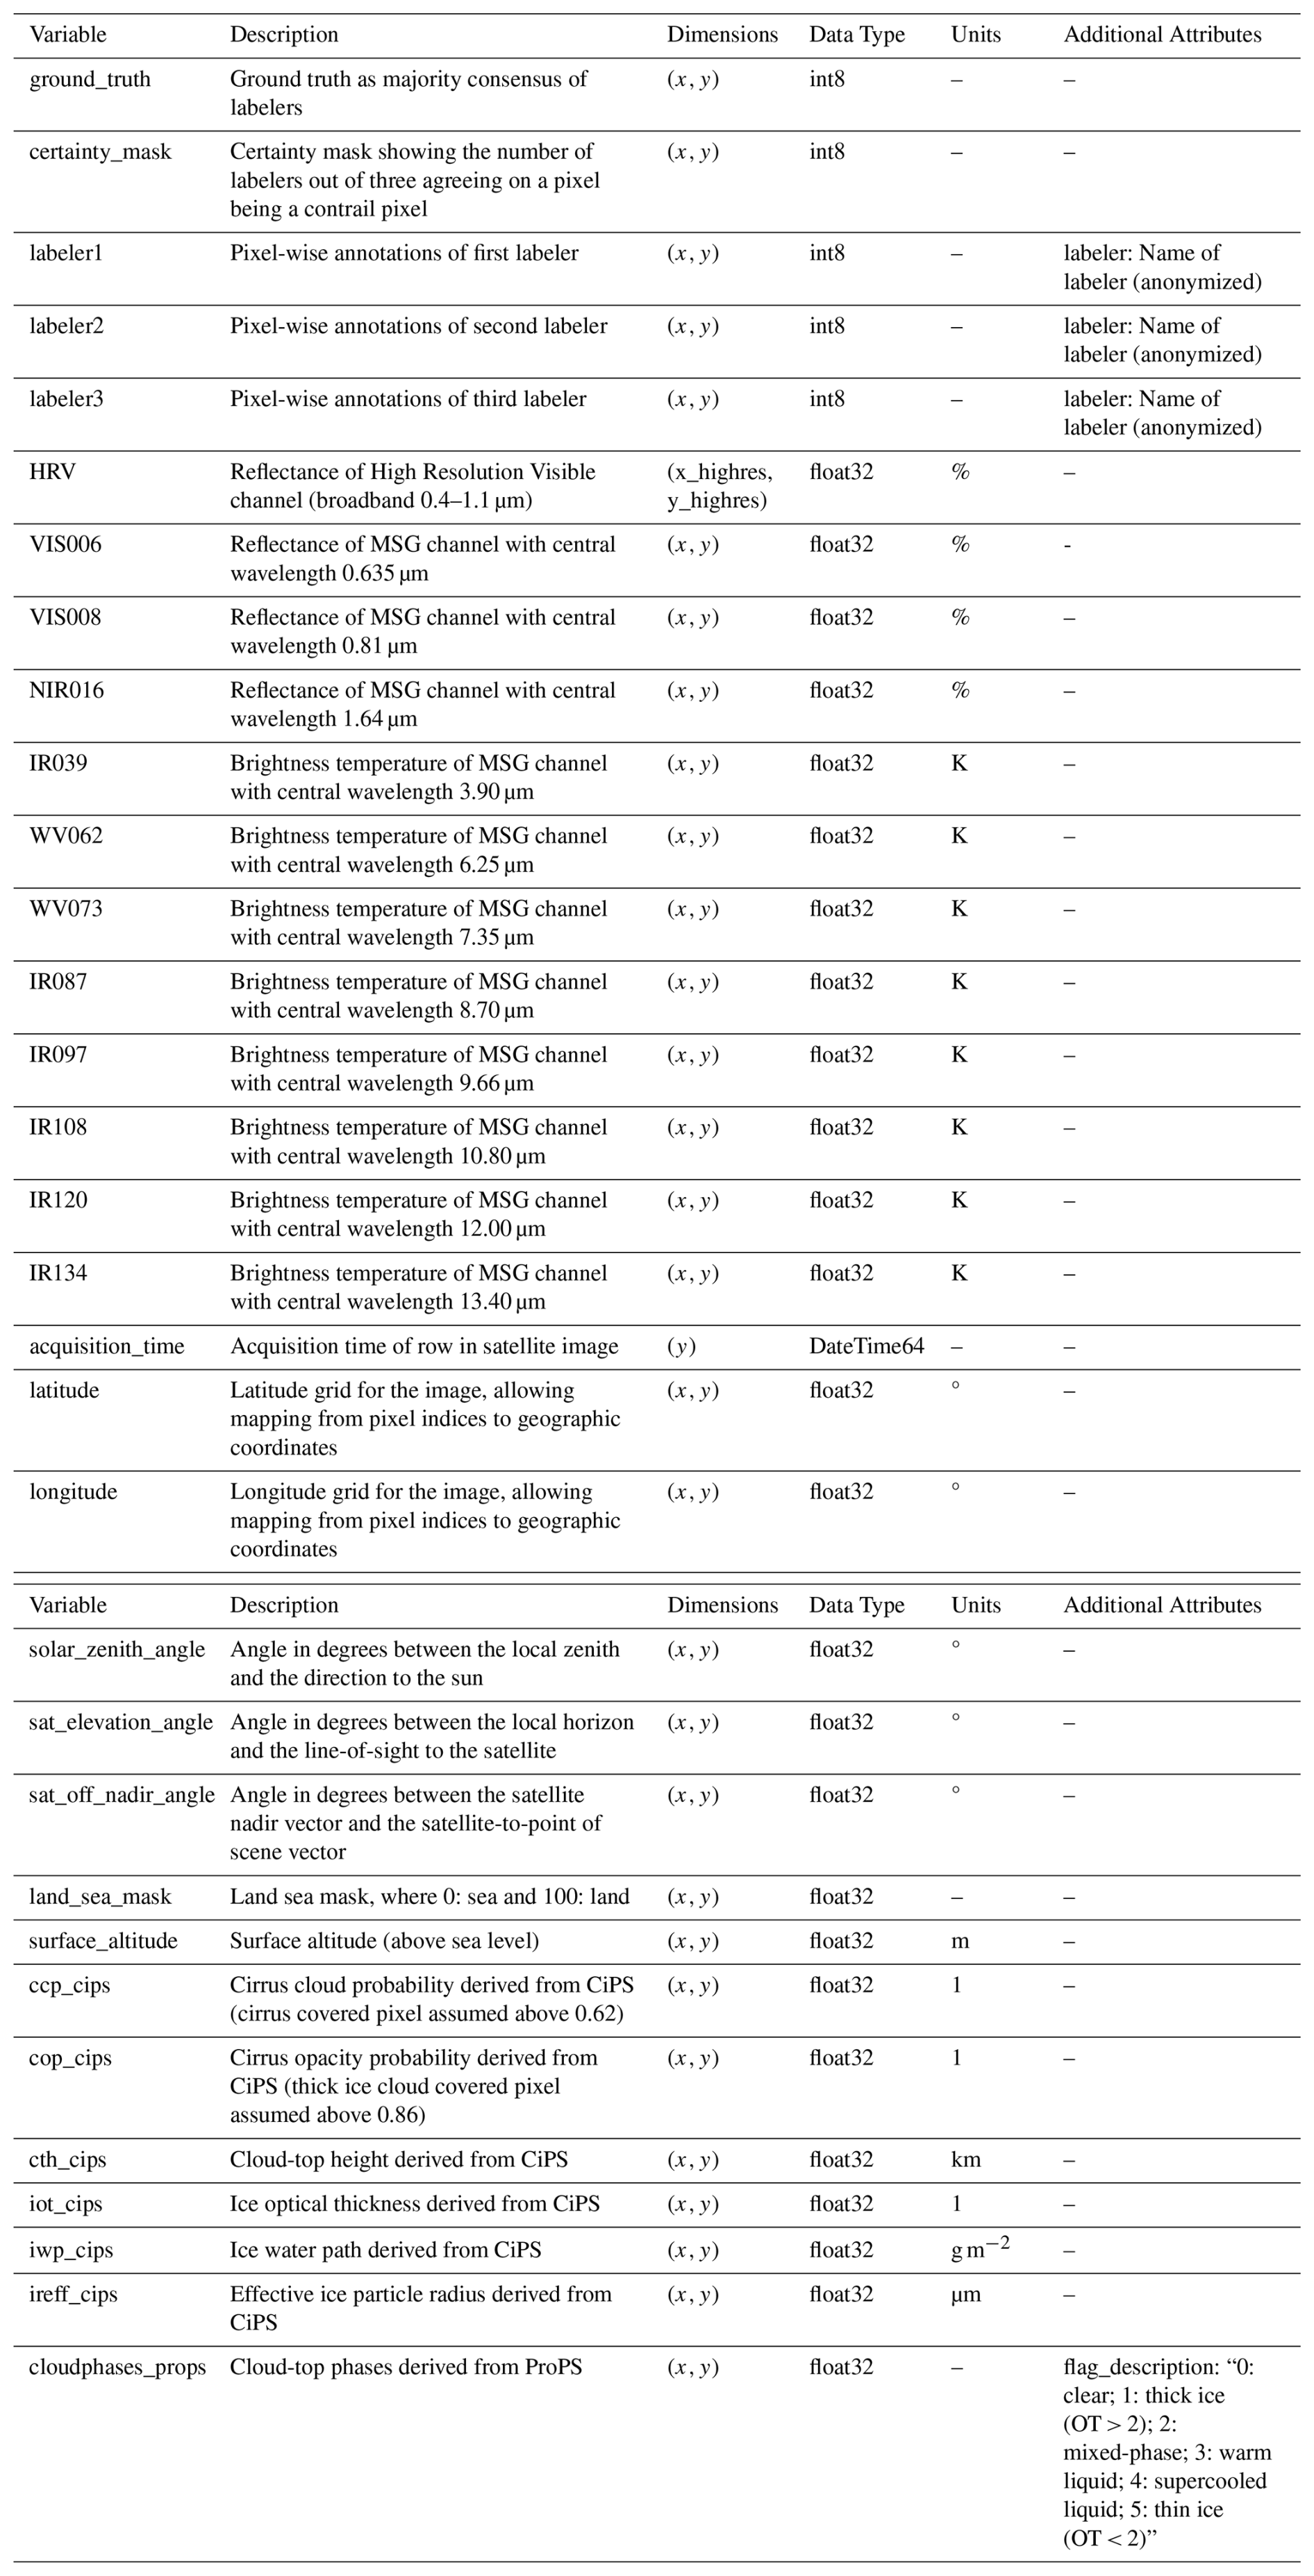
Our dataset provides the Ash RGB images (see Table 2) used for labeling and the ground truth (the majority consensus of labelers) in PNG format. The main data is stored in NetCDF files, that include processed satellite data, labeler annotations, cloud properties and ancillary information (see a list of all variables and relevant attributes in Table 4). They contain the annotations of each labeler per scene, with the additional info on labeler name (anonymized), as well as the established ground truth as the majority consensus of the three labelers. Satellite data, processed by the authors of this paper, for all 12 SEVIRI channels is provided in the NetCDF files as well. The four SEVIRI channels HRV, VIS006, VIS008, and NIR016, which are provided in reflectance, are limited to daytime conditions. SEVIRI scans the Earth's disk line by line, requiring several minutes to complete a full scan. Each image line is acquired at a slightly different time, so the acquisition time is provided in the dataset to identify the timestamp at which that specific scan line was recorded. Each scene is accompanied by the corresponding latitude and longitude grids in satellite projection, allowing the spatial collocation of detected contrails with their corresponding geophysical positions on Earth. The solar zenith angle, satellite elevation angle, and satellite off-nadir angle are also provided to support spatial collocation with respect to the satellite position. The solar zenith angle is the angle between the local zenith (straight up at point from scene on Earth) and the direction of the sun, where a value of less than 90° represents day and a value greater than 90° represents night. The satellite elevation angle is the angle between the local horizon and the line-of-sight to the satellite. The satellite off-nadir angle is the angle between the satellite nadir vector (line from satellite straight down to sub-satellite point) and the satellite-to-point-of-scene vector. The satellite viewing angle (the angle between the local vertical (nadir direction) at the point of the scene on Earth's surface and the line of sight to the satellite) can be calculated by subtracting the satellite elevation angle from 90°. A land–sea mask and surface altitude map (derived from the GTOPO30 global elevation dataset; U.S. Geological Survey, Earth Resources Observation and Science Center, 2018) are provided as additional auxiliary datasets. The land–sea mask (0 = sea, 100 = land) helps distinguish between oceanic and terrestrial regions, which is essential for interpreting surface-dependent features such as temperature, reflectance, or cloud characteristics. The surface altitude, given in meters, provides topographic context and supports a more accurate interpretation of variables influenced by elevation, such as radiance and temperature. The ice cloud properties cirrus cloud probability, cirrus opacity probability, cloud top height, ice optical thickness, ice water path and effective ice particle radius, derived from CiPS (see Sect. 2.2), are supplemented to the dataset. Note that all ice cloud properties are provided even if CiPS does not declare a pixel as a cirrus pixel (Calculation of ice cloud properties are only verified for cirrus pixels). In addition, cloud-top phases are determined with ProPS (see Sect. 2.3) and added to the NetCDF files. Here, a flag value is provided to indicate the cloud-top phase. A value of 0 corresponds to a clear sky pixel. 1 are thick ice clouds with an optical thickness greater than two. A flag value of 3 represents warm liquid and a value of 4 supercooled liquid clouds. Finally, thin ice clouds with an optical thickness smaller than two are assigned the value of 5. Outputs from the CiPS algorithm describing cloud properties, as well as outputs from the ProPS algorithm, are available both during day and night because they rely exclusively on infrared channels. The Dataset contains two spatial grids: x, y for the native 3 km SEVIRI resolution, and x_highres, y_highres for the corresponding 1 km high-resolution of the HRV channel. The coordinate units are expressed in meters, representing the scanning displacement relative to the sub-satellite point. In addition to the pixel-wise variables provided in two-dimensional format for each satellite scene, scene-level quantities are stored as global attributes within the NetCDF files. Each file has a title containing the subsequent scene number. The timestamp (UTC) and native SEVIRI bounding coordinates of each scene, corresponding to a cropped region of the MSG full disk, are included to enable an exact identification of the contrail's temporal and spatial context. To facilitate rapid analysis and ensure reproducibility, several secondary attributes – derived from the primary dataset – are provided. Although these can be recomputed from the original data, their inclusion allows users to avoid redundant calculations. Those attributes include the boreal season and daytime (day or night). Longitude, latitude, solar zenith angle, satellite elevation angle and satellite off-nadir angle are provided for the central point in the scene. The fractions of surface types (sea or land) in the scene, as well as the fractions of cloud-top phases are given for each labeled scene. Lastly, the number of contrails in each scene is provided as a global attribute in the NetCDF files. All variables and relevant attributes are presented in detailed tables in Appendix A. An overview of the whole dataset and all attributes of each scene is provided as well to allow for a rapid overview of the entire dataset. To supplement the ground truth, provided as a binary pixel mask, all individual contrails – including all constituent pixels – are represented in GeoJSON format. Each contrail can be accessed either as a LineString object, containing only its endpoints, or as a MultiPoint object, containing all associated pixels. This object-based ground truth is designed to facilitate analyses at the level of individual contrails. A documentation file is included in the dataset explaining all data and its usage.
Table 4Variables and relevant global attributes in NetCDF files included in the annotated contrail dataset for MSG.
The full dataset is available under: https://doi.org/10.5281/zenodo.17669443 (Santos Gabriel et al., 2025).
Contains modified EUMETSAT Meteosat data (2025). MSG/SEVIRI data are available from the EUMETSAT (European Organisation for the Exploitation of Meteorological Satellites) data centre (https://user.eumetsat.int/catalogue/EO:EUM:DAT:MSG:HRSEVIRI, EUMETSAT, 2024).
The code used to create the contrail dataset and generate all figures in this paper is available at: https://doi.org/10.5281/zenodo.19327966 (Santos Gabriel, 2026).
In this study, we present a manually labeled contrail dataset based on Meteosat Second Generation (MSG) SEVIRI imagery mainly over Europe and the North Atlantic. The dataset consists of 140 scenes of 256 × 256 pixels, each annotated independently by three labelers, with the ground truth defined through majority consensus. Beyond the binary pixel-level masks for all contrails and the majority mask, we provide an object-based representation of individual contrails in GeoJSON format, capturing both their shape and all associated pixels. To give additional context, we include outputs from two satellite retrievals – CiPS (Cirrus Properties from SEVIRI) and ProPS (Probabilistic Cloud Top Phase retrieval) – which provide information on cloud top phase, cirrus probability, ice optical thickness, ice water path, and effective ice particle radius. Auxiliary data, such as scene-level attributes, geolocation, solar and satellite angles, land–sea masks, and surface altitude, are also included to support detailed analyses and reproducibility.
This dataset addresses a significant gap in observational resources for contrail research. Although contrails and contrail cirrus are known to have an important impact on climate (Lee et al., 2021), observational data remain limited, and high-quality labeled datasets are rare. By providing carefully labeled data along with complementary satellite-derived variables, researchers can investigate contrail formation, evolution, and visibility under different atmospheric conditions. The inclusion of multiple labelers' annotations also allows exploration of the subjectivity inherent of manual labeling in MSG imagery, helping to quantify uncertainty and the limitations of human detection.
The dataset can be used for a variety of purposes. It can serve as a benchmark for developing and testing automatic contrail detection methods, as well as for studying contrail characteristics such as length, width, and orientation. The auxiliary cloud information makes it possible to look at cloud–contrail interactions and environmental factors that affect contrail detectability, which is important for understanding their radiative impact. Scene-level and pixel-level metadata make it easier to filter and analyze the data, which is useful both for machine learning approaches and more traditional observational studies. The scope of this dataset is limited by its size. While Meijer et al. (2022) and Ng et al. (2024) offer a multi-billion km2 coverage, we focus on a more targeted 82.5 million km2 providing critical ground truth over Europe. Given the limited size of the dataset, we expect it to be useful for training and validating contrail detection algorithms using image processing techniques and simple ML models or for validating other more complex ML models.
By making this dataset publicly available, we intend to provide a resource that supports research into contrail detection, subsequently improves understanding of aviation-related cloud effects, and eventually informs strategies to reduce aviation’s climate impact. We expect it to serve as a foundation for future work in atmospheric science, remote sensing, and climate modeling, supporting both algorithm development and scientific studies into the role of contrails in the climate system.
In this section, we present a table with all relevant global attributes contained in the NetCDF files of our compiled dataset (Table A1). This table includes the names of the global attributes as well as a description, the units and one example of this attribute. We also provide a table with all variables in the NetCDF files (Table A2). This table includes the name of the variables, a description, the dimensions of this variable, the data type, units and additional attributes of the variable.
Table A1Description of relevant attributes in NetCDF files in the annotated contrail dataset for MSG.
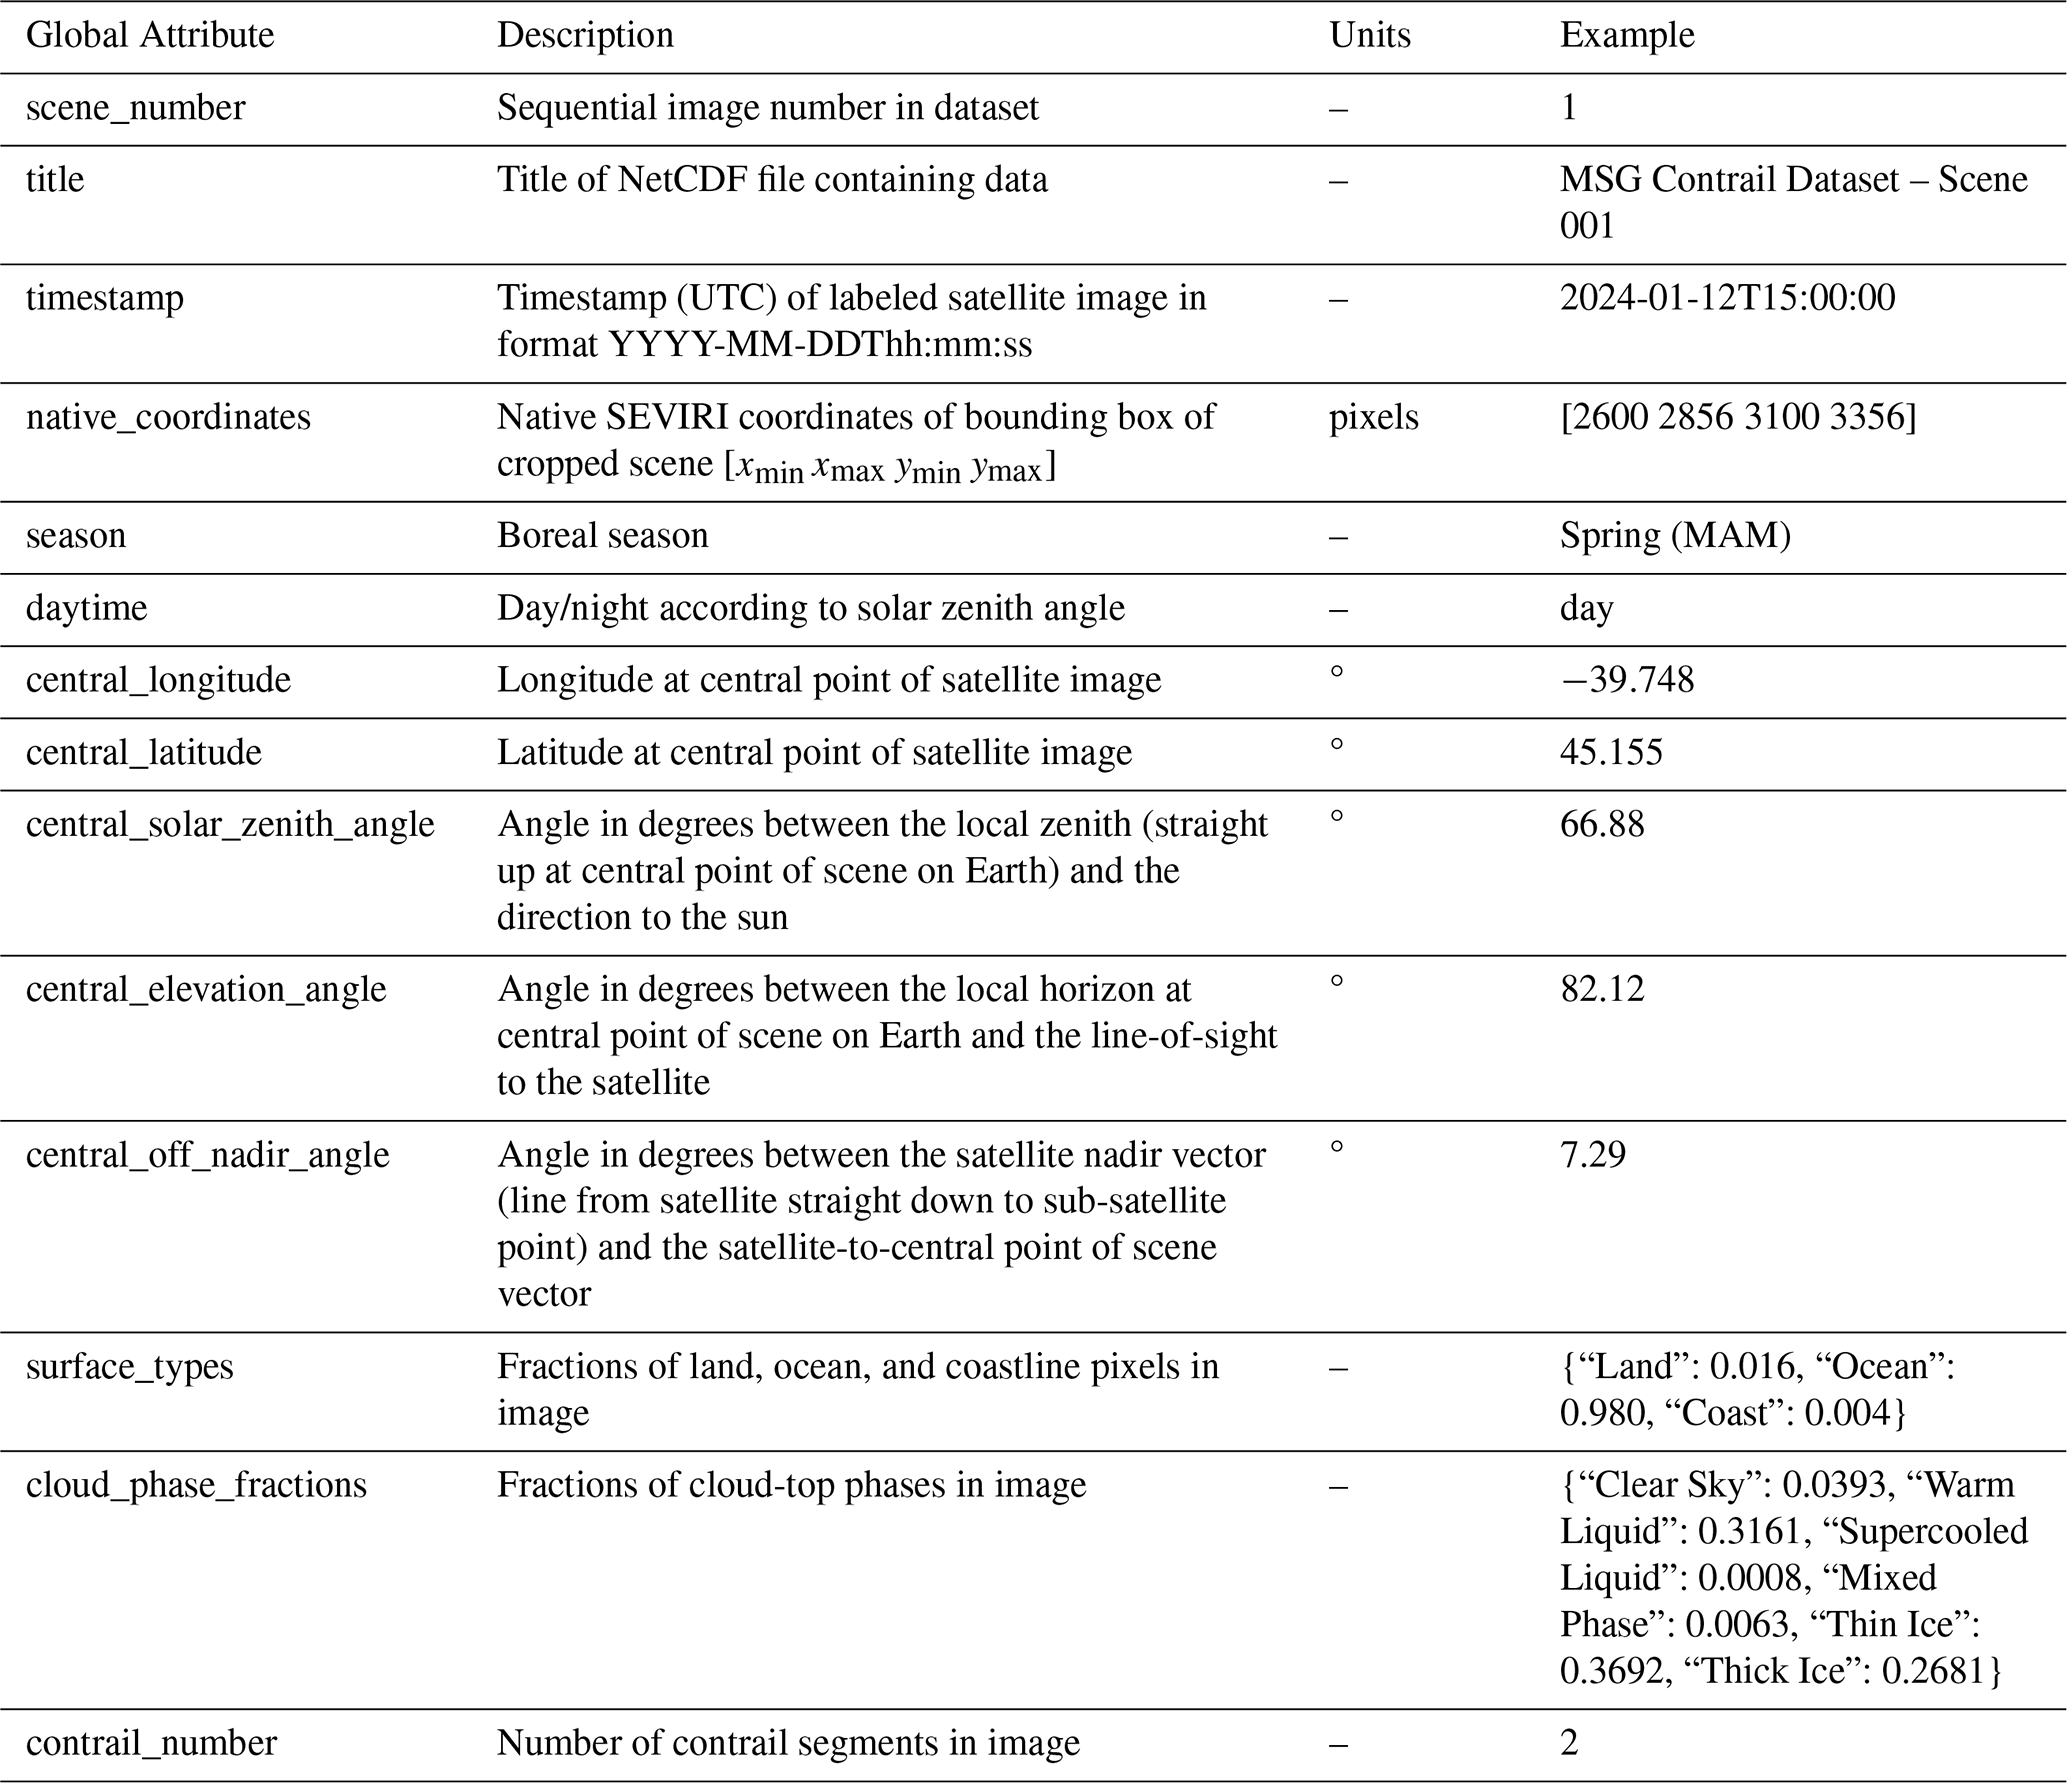
Table A2Description of variables in NetCDF files in the annotated contrail dataset for MSG.
VSG and LB conceived this study. VSG prepared the data and overlooked the labeling campaign with valuable feedback from LB. CV supervised the project and provided scientific feedback. The remaining authors took part in the labeling campaign for the contrail dataset. VSG took the lead in writing the manuscript. All authors provided feedback on the manuscript.
The contact author has declared that none of the authors has any competing interests.
Publisher's note: Copernicus Publications remains neutral with regard to jurisdictional claims made in the text, published maps, institutional affiliations, or any other geographical representation in this paper. The authors bear the ultimate responsibility for providing appropriate place names. Views expressed in the text are those of the authors and do not necessarily reflect the views of the publisher.
We thank EUMETSAT for clarifying attribution modalities and distribution conditions for the MSG data used in this study.
This research has been supported by the Bundesministerium für Wirtschaft und Klimaschutz (grant no. 20F2202B), the HORIZON EUROPE Reforming and enhancing the European Research and Innovation system (grant no. 101192301), and the Bundesministerium für Verkehr und Digitale Infrastruktur (grant no. 50.0391/2021).
This open-access publication was funded by Johannes Gutenberg University Mainz.
This paper was edited by Alexander Kokhanovsky and reviewed by three anonymous referees.
Atlas, D., Wang, Z., and Duda, D. P.: Contrails to cirrus – Morphology, microphysics, and radiative properties, J. Appl Meteorol. Clim., 45, 5–19, 2006. a
Bedka, S. T., Minnis, P., Duda, D. P., Chee, T. L., and Palikonda, R.: Properties of linear contrails in the Northern Hemisphere derived from 2006 Aqua MODIS observations, Geophys. Res. Lett., 40, 772–777, 2013. a
Burkhardt, U., Bock, L., and Bier, A.: Mitigating the contrail cirrus climate impact by reducing aircraft soot number emissions, npj Climate and Atmospheric Science, 1, 37, https://doi.org/10.1038/s41612-018-0046-4, 2018. a
Chevallier, R., Shapiro, M., Engberg, Z., Soler, M., and Delahaye, D.: Linear contrails detection, tracking and matching with aircraft using geostationary satellite and air traffic data, Aerospace, 10, 578, https://doi.org/10.3390/aerospace10070578, 2023. a, b
Dekoutsidis, G., Feidas, H., and Bugliaro, L.: Contrail detection on SEVIRI images and 1-year study of their physical properties and the atmospheric conditions favoring their formation over Europe, Theor. Appl. Climatol., 151, 1931–1948, 2023. a
Driver, O. G. A., Stettler, M. E. J., and Gryspeerdt, E.: Factors limiting contrail detection in satellite imagery, Atmos. Meas. Tech., 18, 1115–1134, https://doi.org/10.5194/amt-18-1115-2025, 2025. a
Duda, D. P., Minnis, P., Nguyen, L., and Palikonda, R.: A case study of the development of contrail clusters over the Great Lakes, J. Atmos. Sci., 61, 1132–1146, 2004. a
EUMeTrain: Compilation of RGB Recipes, https://www.eumetrain.org/sites/default/files/2022-10/RGB_recipes.pdf (last access: 14 October 2025), 2022. a, b
EUMETSAT: High Rate SEVIRI Level 1.5 Image Data – MSG – 0 degree, EUMETSAT [data set], https://user.eumetsat.int/catalogue/EO:EUM:DAT:MSG:HRSEVIRI, last access: 1 July 2024. a
Gourgue, N., Boucher, O., and Barthès, L.: A dataset of annotated ground-based images for the development of contrail detection algorithms, Data in Brief, 59, 111364, https://doi.org/10.1016/j.dib.2025.111364, 2025. a
Haywood, J. M., Allan, R. P., Bornemann, J., Forster, P. M., Francis, P. N., Milton, S., Rädel, G., Rap, A., Shine, K. P., and Thorpe, R.: A case study of the radiative forcing of persistent contrails evolving into contrail-induced cirrus, J. Geophys. Res.-Atmos., 114, https://doi.org/10.1029/2009JD012650, 2009. a
Hotelling, H.: Analysis of a complex of statistical variables into principal components, J. Educ. Psychol., 24, 417, https://doi.org/10.1037/h0071325, 1933. a
Inoue, T.: On the temperature and effective emissivity determination of semi-transparent cirrus clouds by bi-spectral measurements in the 10 µm window region, J. Meteorol. Soc. Jpn. Ser. II, 63, 88–99, 1985. a
Lee, D. S., Fahey, D. W., Skowron, A., Allen, M. R., Burkhardt, U., Chen, Q., Doherty, S. J., Freeman, S., Forster, P. M., Fuglestvedt, J., Gettelman, A., De León, R. R., Lim, L. L., Lund, M. T., Millar, R. J., Owen, B., Penner, J. E., Pitari, G., Prather, M. J., Sausen, R., and Wilcox, L. J.: The contribution of global aviation to anthropogenic climate forcing for 2000 to 2018, Atmos. Environ., 244, 117834, https://doi.org/10.1016/j.atmosenv.2020.117834, 2021. a, b
Lewellen, D.: Persistent contrails and contrail cirrus. Part II: Full lifetime behavior, J. Atmos. Sci., 71, 4420–4438, 2014. a
Mannstein, H. and Schumann, U.: Aircraft induced contrail cirrus over Europe, Meteorol. Z., 14, 549–554, 2005. a
Mannstein, H., Meyer, R., and Wendling, P.: Operational detection of contrails from NOAA-AVHRR-data, Int. J. Remote Sens., 20, 1641–1660, 1999. a, b, c
Mannstein, H., Brömser, A., and Bugliaro, L.: Ground-based observations for the validation of contrails and cirrus detection in satellite imagery, Atmos. Meas. Tech., 3, 655–669, https://doi.org/10.5194/amt-3-655-2010, 2010. a, b
Mayer, J., Bugliaro, L., Mayer, B., Piontek, D., and Voigt, C.: Bayesian cloud-top phase determination for Meteosat Second Generation, Atmos. Meas. Tech., 17, 4015–4039, https://doi.org/10.5194/amt-17-4015-2024, 2024a. a, b, c
Mayer, J., Mayer, B., Bugliaro, L., Meerkötter, R., and Voigt, C.: How well can brightness temperature differences of spaceborne imagers help to detect cloud phase? A sensitivity analysis regarding cloud phase and related cloud properties, Atmos. Meas. Tech., 17, 5161–5185, https://doi.org/10.5194/amt-17-5161-2024, 2024b. a
McCloskey, K., Geraedts, S., Van Arsdale, C., and Brand, E.: A human-labeled Landsat-8 contrails dataset, in: Proceedings of the ICML 2021 Workshop on Tackling Climate Change with Machine Learning, Virtually, Vol. 23, Climate Change AI, 2021. a
Meijer, V. R., Kulik, L., Eastham, S. D., Allroggen, F., Speth, R. L., Karaman, S., and Barrett, S. R.: Contrail coverage over the United States before and during the COVID-19 pandemic, Environ. Res. Lett., 17, 034039, https://doi.org/10.1088/1748-9326/ac26f0, 2022. a, b
Meyer, R., Buell, R., Leiter, C., Mannstein, H., Pechtl, S., Oki, T., and Wendling, P.: Contrail observations over Southern and Eastern Asia in NOAA/AVHRR data and comparisons to contrail simulations in a GCM, Int. J. Remote Sens., 28, 2049–2069, 2007. a
Minnis, P., Bedka, S. T., Duda, D. P., Bedka, K. M., Chee, T., Ayers, J. K., Palikonda, R., Spangenberg, D. A., Khlopenkov, K. V., and Boeke, R.: Linear contrail and contrail cirrus properties determined from satellite data, Geophys. Res. Lett., 40, 3220–3226, 2013. a
Ng, J. Y.-H., McCloskey, K., Cui, J., Meijer, V. R., Brand, E., Sarna, A., Goyal, N., Van Arsdale, C., and Geraedts, S.: Contrail Detection on GOES-16 ABI With the OpenContrails Dataset, IEEE T. Geosci. Remote Sens., 62, 1–14, https://doi.org/10.1109/TGRS.2023.3345226, 2024. a, b, c, d, e, f, g
Rybka, H., Burkhardt, U., Köhler, M., Arka, I., Bugliaro, L., Görsdorf, U., Horváth, Á., Meyer, C. I., Reichardt, J., Seifert, A., and Strandgren, J.: The behavior of high-CAPE (convective available potential energy) summer convection in large-domain large-eddy simulations with ICON, Atmos. Chem. Phys., 21, 4285–4318, https://doi.org/10.5194/acp-21-4285-2021, 2021. a
Santos Gabriel, V.: vsantosg0805/msg-contrail-dataset: Repository for the data paper: “A Manually Labeled Contrail Dataset from MSG/SEVIRI” (CT_DATASET), Zenodo [software], https://doi.org/10.5281/zenodo.19327966, 2026. a
Santos Gabriel, V., Bugliaro, L., Montag, M., Ries, S., Wang, Z., Widmaier, K., Arico, M., Unterstrasser, S., Mayer, J., Menekay, D., Marsing, A., De La Torre Castro, E., Megill, L., Scheibe, M., and Voigt, C.: Annotated Contrail Dataset for Meteosat Second Generation (MSG), Zenodo [data set], https://doi.org/10.5281/zenodo.17669443, 2025. a, b, c
Schmetz, J., Pili, P., Tjemkes, S., Just, D., Kerkmann, J., Rota, S., and Ratier, A.: An Introduction to Meteosat Second Generation (MSG), B. Am. Meteorol. Soc., 83, https://doi.org/10.1175/1520-0477(2002)083<0977:AITMSG>2.3.CO;2, 2002. a
Spangenberg, D. A., Minnis, P., Bedka, S. T., Palikonda, R., Duda, D. P., and Rose, F. G.: Contrail radiative forcing over the Northern Hemisphere from 2006 Aqua MODIS data, Geophys. Res. Lett., 40, 595–600, 2013. a
Strandgren, J., Bugliaro, L., Sehnke, F., and Schröder, L.: Cirrus cloud retrieval with MSG/SEVIRI using artificial neural networks, Atmos. Meas. Tech., 10, 3547–3573, https://doi.org/10.5194/amt-10-3547-2017, 2017a. a, b, c
Strandgren, J., Fricker, J., and Bugliaro, L.: Characterisation of the artificial neural network CiPS for cirrus cloud remote sensing with MSG/SEVIRI, Atmos. Meas. Tech., 10, 4317–4339, https://doi.org/10.5194/amt-10-4317-2017, 2017b. a
Teoh, R., Engberg, Z., Schumann, U., Voigt, C., Shapiro, M., Rohs, S., and Stettler, M. E. J.: Global aviation contrail climate effects from 2019 to 2021, Atmos. Chem. Phys., 24, 6071–6093, https://doi.org/10.5194/acp-24-6071-2024, 2024. a
U.S. Geological Survey, Earth Resources Observation and Science (EROS) Center: Global 30‐Arc‐Second Elevation (GTOPO30), https://doi.org/10.5066/F7DF6PQS, 2018. a
V7 Labs: V7 Darwin: AI Data Labeling & ML Training Data Platform, https://www.v7labs.com/darwin, last access: 30 November 2025. a
Vázquez-Navarro, M., Mannstein, H., and Kox, S.: Contrail life cycle and properties from 1 year of MSG/SEVIRI rapid-scan images, Atmos. Chem. Phys., 15, 8739–8749, https://doi.org/10.5194/acp-15-8739-2015, 2015. a, b
Wang, X., Wolf, K., Boucher, O., and Bellouin, N.: Radiative effect of two contrail cirrus outbreaks over Western Europe estimated using geostationary satellite observations and radiative transfer calculations, Geophys. Res. Lett., 51, e2024GL108452, https://doi.org/10.1029/2024GL108452, 2024. a
Wang, Z., Bugliaro, L., Jurkat-Witschas, T., Heller, R., Burkhardt, U., Ziereis, H., Dekoutsidis, G., Wirth, M., Groß, S., Kirschler, S., Kaufmann, S., and Voigt, C.: Observations of microphysical properties and radiative effects of a contrail cirrus outbreak over the North Atlantic, Atmos. Chem. Phys., 23, 1941–1961, https://doi.org/10.5194/acp-23-1941-2023, 2023. a
- Abstract
- Introduction
- Satellite Data and Spaceborne Cloud Retrievals
- Labeling Methodology
- Results
- Dataset Description
- Data availability
- Code availability
- Conclusions
- Appendix A: Variables and Attributes in Contrail Dataset
- Author contributions
- Competing interests
- Disclaimer
- Acknowledgements
- Financial support
- Review statement
- References