the Creative Commons Attribution 4.0 License.
the Creative Commons Attribution 4.0 License.
 | 27 Feb 2026
Mapping key soil micronutrients across the Tibetan Plateau
Huangyu Huo
Xiling Gu
Jiayi Li
Shanshan Yang
Yafeng Wang
Soil micronutrient supply sustains critical ecological functions but exhibit poorly quantified distribution patterns in high-altitude ecosystems. This study bridges this knowledge gap through a large-scale investigation across the Tibetan Plateau, a cold-arid region where cryogenic weathering, aridity, and suppressed pedogenesis interact to govern micronutrient cycling. We assembled a plateau-wide dataset from 526 sites with triplicate surface soils (0–10 cm) per site (n = 1660). Four micronutrients (Fe, Mn, Zn, and V) were measured by laboratory X-ray fluorescence (XRF) for all samples and calibrated and validated against inductively coupled plasma mass spectrometry (ICP-MS) for a subset of samples.Four micronutrients were paired with multi-source predictors (climate, vegetation, soil covariates, topography, grazing disturbance, and weathering proxy). Elemental contents span broad ranges, with site-level summaries (mean ± SD, mg kg−1) of Fe 22 864.30 ± 7589.01, Mn 576.74 ± 206.44, Zn 27.24 ± 8.55, and V 56.99 ± 19.33. Random Forest model was employed to quantify controls and generate high-resolution spatial maps. Key results reveal that pronounced regional heterogeneity is driven primarily by weathering intensity with secondary modulation from climate and topography covariates. Element-specific spatial patterns were observed, with Fe enrichment in southeastern/southern plateau, Mn gradients increasing southeastward. Zn hotspots in central-eastern and western marginal zones, and V exhibits a moderate spatial gradient, with higher contents in the southeastern Tibetan Plateau and relatively lower values in the northwest. We provide 1 km maps of all four micronutrients together with pixel-wise uncertainty layers to support benchmarking of process-based micronutrient cycling models and to inform sustainable ecosystem management under climate change. Predictions for major elements are robust, whereas trace-level elements, particularly Zn, exhibit comparatively higher methodological uncertainty despite calibration. Accordingly, users should interpret absolute Zn contents with caution and refer to the accompanying uncertainty diagnostics when applications require high-precision estimates. The dataset is openly available at TPDC (https://doi.org/10.11888/Terre.tpdc.303242, Huo et al., 2026).
- Article
(5779 KB) - Full-text XML
-
Supplement
(1188 KB) - BibTeX
- EndNote


As essential yet trace-level components of living systems, micronutrients (e.g., Fe, Mn, Zn, and V) sustain fundamental ecological processes, including photosynthesis (Fe, Mn; Fischer et al., 2015; Schmidt et al., 2020), respiration (Fe; Dallman, 1986), enzymatic/redox functions (Zn, V; Hänsch and Mendel, 2009), and biological nitrogen fixation (V; O'Hara, 2001). Crucially, micronutrient gradients in soils propagate through trophic chains, directly influencing human nutrition and health; deficiencies exacerbate global malnutrition burdens (Fageria et al., 2002; White and Broadley, 2005). Despite their pivotal role in ecosystem stability and food security (Prestele et al., 2016; Stehfest et al., 2019), critical knowledge gaps persist regarding the distribution patterns and drivers of soil micronutrients from regional to global scales.
The Tibetan Plateau represents a uniquely important yet underrepresented region for addressing these knowledge gaps. As the high-altitude landmass and the most extensive alpine permafrost region at low to mid-latitude (Yao et al., 2012), the Tibetan Plateau supports vast areas of cold- and nutrient-limited ecosystems, where plant productivity, microbial activity, and biogeochemical cycling are particularly sensitive to micronutrient availability (Han et al., 2022; Tian et al., 2019). In such environments, micronutrients may act as co-limiting or even primary limiting factors alongside nitrogen and phosphorus, yet their spatial distributions and environmental controls remain poorly quantified (Dong et al., 2023; Pan et al., 2024). Moreover, the Tibetan Plateau is experiencing rapid climate change characterized by accelerated warming and increasing moisture availability, which is expected to fundamentally alter soil weathering regimes, redox conditions, and mineral-organic interactions (Yu et al., 2024; Cheng et al., 2024). Without robust baseline assessments of soil micronutrients, it remains difficult to evaluate how ongoing climate change may reshape nutrient limitation patterns and ecosystem functioning across high-altitude regions.
Soil micronutrient supply originates from coupled physicochemical weathering and biological mediation, critically regulated by local climate and topography (Ochoa-Hueso et al., 2020; Hartmann and Six, 2023). In cold-arid high-altitude regions, particularly the Tibetan Plateau, extreme environmental interactions uniquely govern micronutrient cycling. Cryogenic processes such as glacial erosion and freeze-thaw cycles, accelerate physical bedrock weathering to mobilize lithogenic micronutrient reservoirs, while aridity concurrently constrains chemical weathering and elemental release (Mu et al., 2020, 2016). Low temperatures suppress biological turnover and synergize with aridity to compromise pedogenesis through clay deficits and diminished mineral reactive sites, thereby reducing elemental retention capacity (Dijkstra et al., 2004). The combined effects of these opposing processes jointly determine the overall abundance and spatial heterogeneity of soil micronutrients across alpine soils, likely differing from the patterns of soil micronutrients observed in temperate and tropical regions.
Despite the ecological significance of soil micronutrient, our understanding of their spatial distribution and controlling factors across the Tibetan Plateau remains limited. Previous studies have been largely confined to localized transects or site-specific investigations (e.g., the Heihe River Basin and the Tibetan Plateau Highway), offering limited spatial coverage and representativeness, and providing insufficient insight into how climate, vegetation, topography and lithology jointly regulate micronutrient patterns at the regional scale (Zhang et al., 2012; Guan et al., 2017; Bu et al., 2016). To address these knowledge gaps, we conducted a large-scale field investigation across the Tibetan Plateau, establishing 526 sampling sites distributed across representative temperature and moisture gradients (Fig. 1). The sampling design encompassed the plateau's dominant vegetation types and lithological classes. Using this dataset, we analyzed distribution patterns and key controlling factors for four essential micronutrients (Fe, Mn, Zn, V). We then applied a Random Forest algorithm to generate high-resolution spatial distribution maps of these micronutrients, representing the first comprehensive quantification at this scale and resolution.
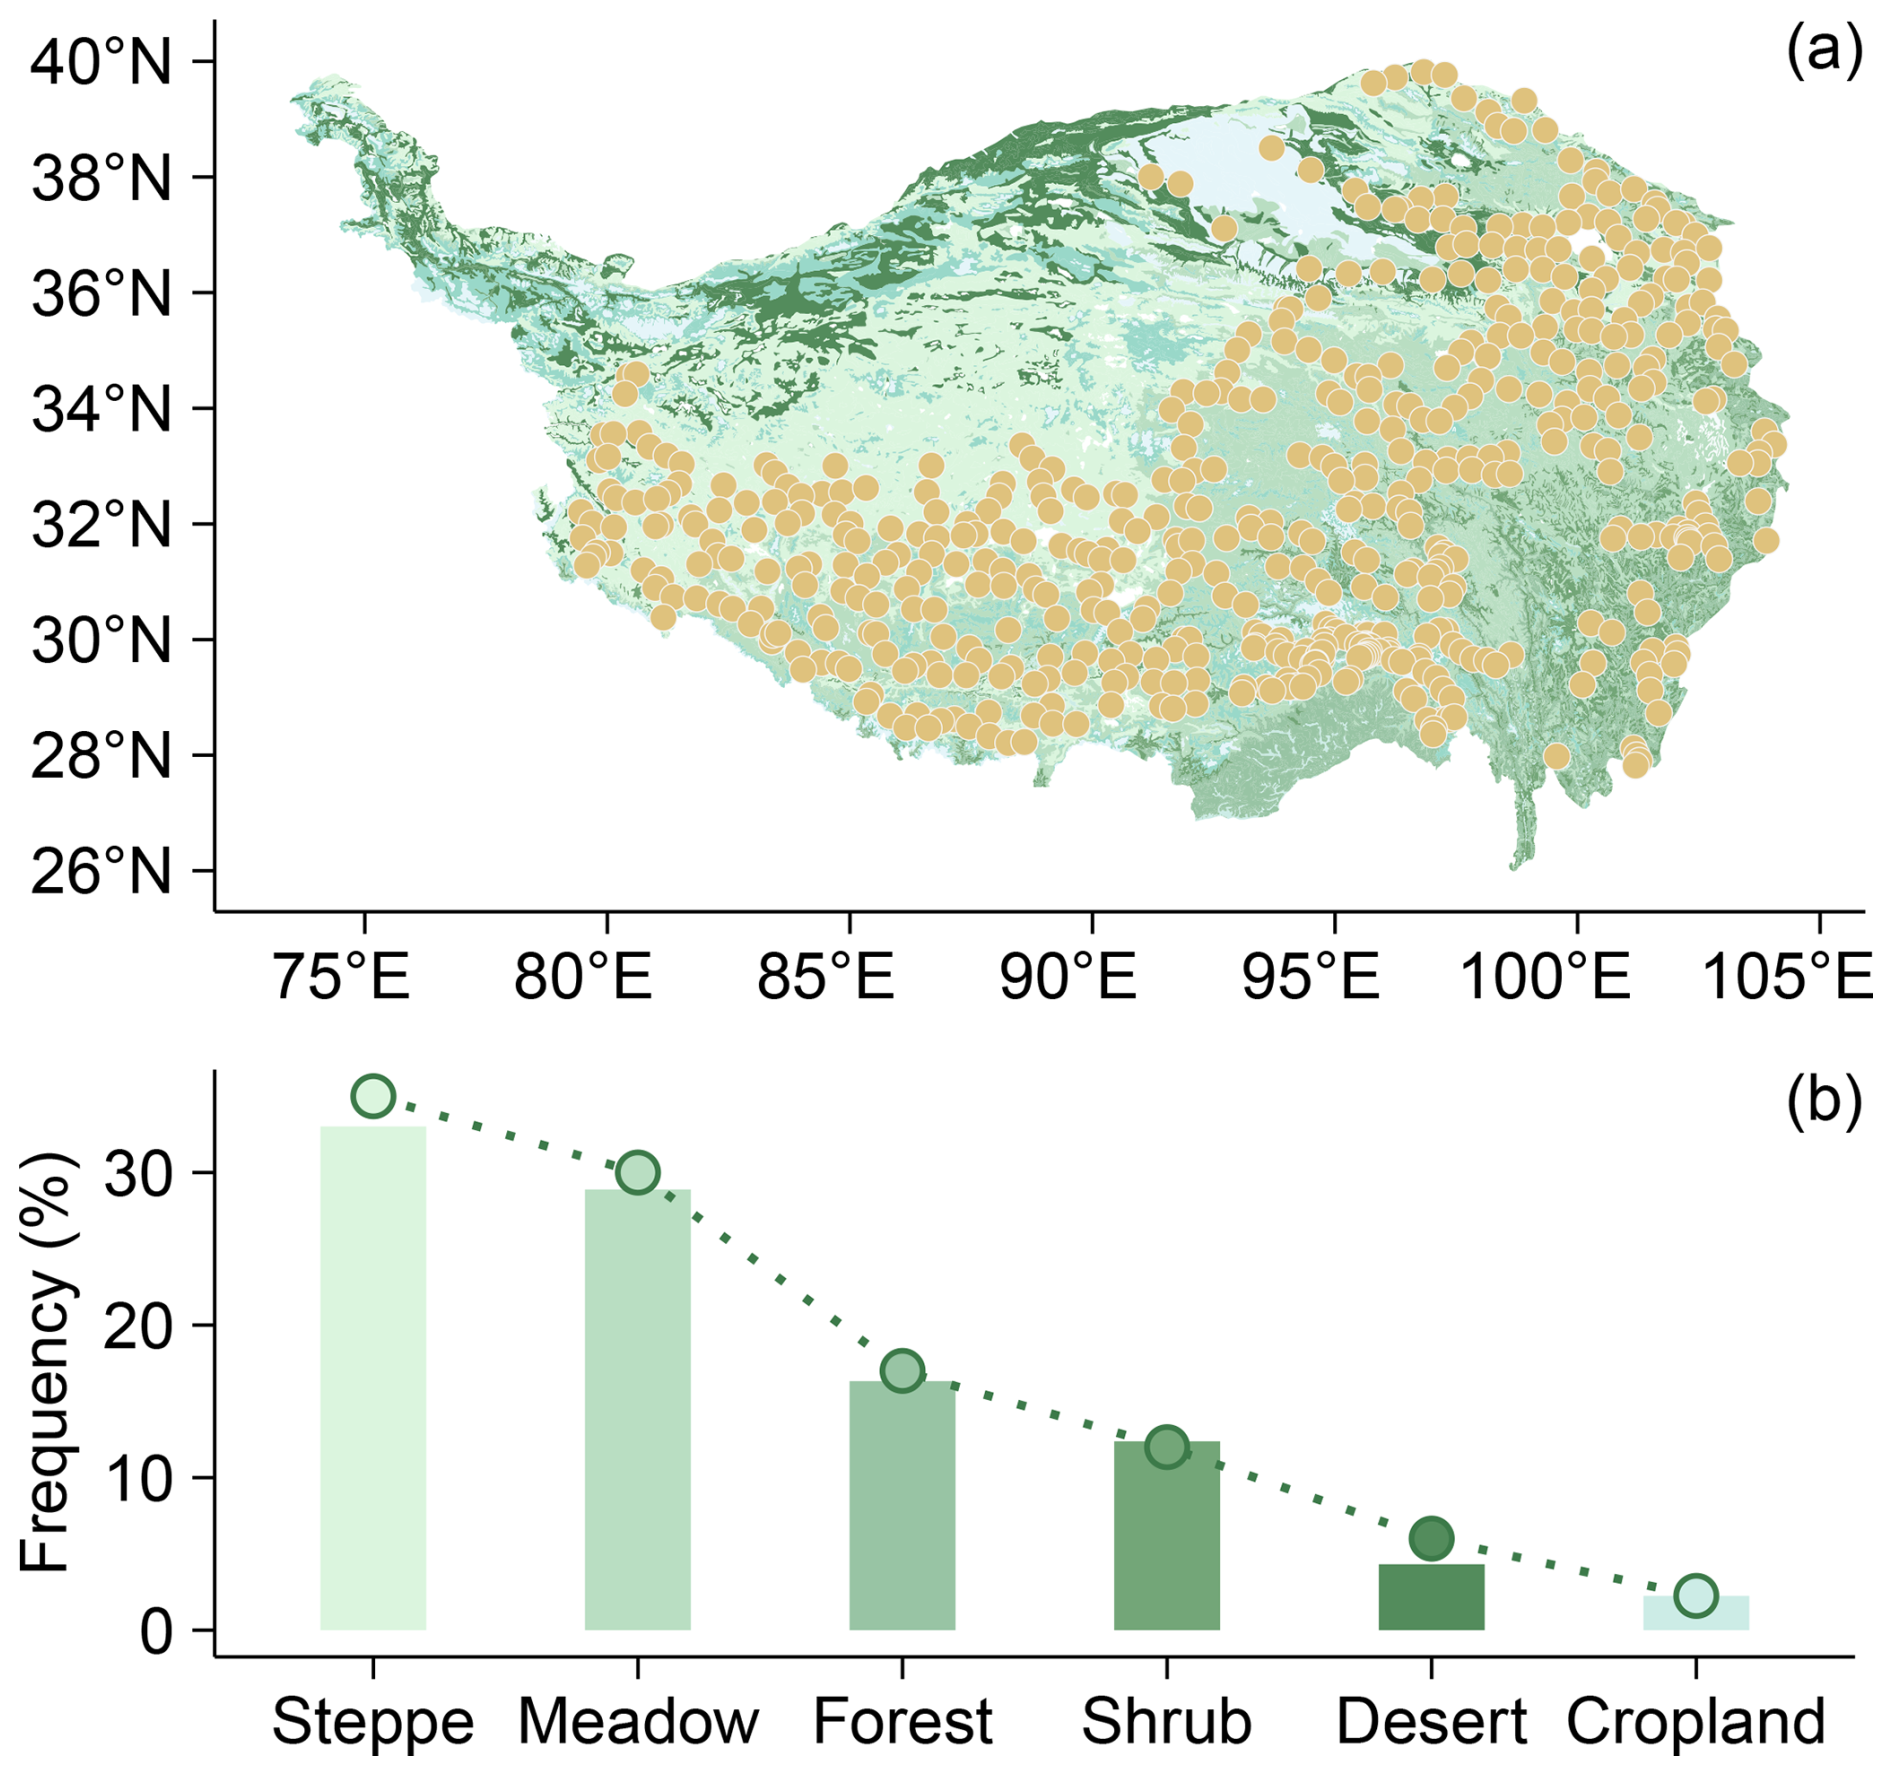
Figure 1Sampling strategy and ecosystem representativeness. (a) Spatial distribution of sampling sites superimposed on China's 1:1 000 000 vegetation map. (b) Areal proportions of ecosystem types (bars) versus sampling point frequency distribution (dots) across corresponding ecosystems. Similar bar and dot heights indicate that the sampling is proportionally representative.
2.1 Field survey and soil micronutrients analysis
We analyzed 1660 topsoil samples collected from 526 locations during a 2019–2021 growing season (July–August) field survey across the Tibetan Plateau (79–105° E, 27–40° N; Fig. 1a). Sampling sites represent major plateau ecosystems: forests, shrubs, steppes, meadows, deserts, and croplands (Table 1). Our field sampling followed a proportional, area-weighted design, whereby the number of sampling sites allocated to each ecosystem type was approximately proportional to its areal extent across the Tibetan Plateau. This design aims to provide a plateau-wide, regionally representative characterization of surface-soil micronutrients across dominant ecosystem types. The sites span broad environmental gradients, ranging from 759 to 5565 m in elevation, −7.83 to 18.46 °C in mean annual temperature (MAT), and 23 to 898 mm in mean annual precipitation (MAP), effectively capturing the plateau's topographic and climatic variability. Site was selected using standardized criteria: maintaining relative homogeneity in species composition, community structure, and habitat conditions, and avoiding proximity to roads or areas with frequent human activity. At each site, we established a 10×10 m2 quadrat and collected triplicate soil samples along the diagonal at three positions (0, 7.1, and 14.1 m; 0–10 cm depth), corresponding to the start, midpoint, and end of the quadrat diagonal. This design allows sampling across the spatial heterogeneity within each plot while maintaining a standardized sampling framework. This depth was chosen because it represents the biologically active surface horizon most relevant to plant uptake and microbially mediated cycling, and is widely used in regional soil inventories for comparability across ecosystems (Du et al., 2017; Cardon et al., 2013). This consistent protocol ensures cross-site comparability while capturing the variability of surface layer that most strongly interacts with vegetation and climate. Geographic coordinates, elevation, community type, and species composition (Cheng et al., 2022) were systematically documented.
To ensure the reliability of soil micronutrient measurements, we adopted a two-step analytical strategy. First, all 1660 topsoil samples collected from 526 sampling locations were air-dried, sieved (2 mm), and analyzed in the laboratory using a third-generation X-ray fluorescence spectrometer (XRF). All micronutrient data reported in this study are based on these laboratory XRF measurements. Second, to independently validate the XRF-derived concentrations, a subset of 218 samples was randomly selected and re-analyzed using inductively coupled plasma-mass spectrometry (ICP-MS), a widely accepted reference method for elemental analysis (Simon, 2005). Among the examined elements, Fe (R2=0.81), Mn (R2=0.67), Zn (R2=0.49), and V (R2=0.77) exhibit clear and statistically significant linear relationships with ICP measurements, demonstrating moderate to strong correlation (Fig. S1 in the Supplement). The increased dispersion observed at low contents reflects known limitations of XRF near detection thresholds, rather than method failure. Moreover, our analytical strategy follows established practice in large-scale geochemical mapping, where XRF is commonly used for high-throughput determination of total/major-element composition, while ICP-based methods are commonly employed in parallel for complementary measurements (e.g., extracted fractions, waters, or elements requiring lower detection limits) and, where appropriate, for inter-method comparison and validation. In addition to GEMAS and the NGSA, similar XRF-based workflows have been implemented in other regional/national baseline programmes (e.g., BGS G-BASE in the UK, the FOREGS Geochemical Atlas of Europe, and the Global Geochemical Baselines framework). These precedents support the robustness and suitability of using XRF with targeted ICP verification for plateau-scale geochemical datasets (Table S1 in the Supplement).
Table 1Ecosystem classification and sampling coverage on the Tibetan Plateau.
Biomes are grouped by diagnostic characteristics; dominant plant species are italicized. Elevation range gives the minimum-maximum elevation (m) of sampling sites within each biome. Climate conditions report site-level ranges of mean annual temperature (°C) and mean annual precipitation (mm). No. of samples is the number of soil samples analyzed (0–10 cm, three replicates per site), and No. of locations is the number of unique sampling sites.
2.2 Soil Properties
Soil samples were sifted through 2 mm sieve, discarding visible stones and extracted roots. Soil pH was measured using the potentiometric method, and soil texture analysis, quantifying clay, silt, and sand content fractions, was determined using a laser diffraction particle size analyzer (Mastersizer 2000, Malvern, UK). Soil organic carbon (SOC) content was quantified via the potassium dichromate oxidation method (Walkley-Black) with external heating. The chemical index of alteration (CIA) was calculated using the molar proportions of Al2O3, CaO*, Na2O, and K2O according to the formula: CIA = [Al2O(Al2O3 + CaO* + Na2O + K2O)] × 100 (Fedo et al., 1995). The major-element oxides used to calculate CIA (Al2O3, CaO, Na2O and K2O) were obtained from laboratory XRF measurements, which provide a well-established basis for CIA-based evaluation of relative chemical weathering gradients, and data quality was ensured through standard QA/QC including replicate analyses and certified reference materials. CIA reflects the relative loss of mobile base cations (Ca, Na, K) compared with the enrichment of immobile Al during weathering (McLennan, 1993). Higher CIA values indicate stronger chemical weathering and more advanced soil development, whereas lower values suggest weaker weathering and limited leaching of base cations (Nesbitt and Young, 1982).
2.3 Environmental variables
We considered geographic, climatic, biological, and edaphic drivers. Field measurements provided location (longitude, latitude), slope, aspect and vegetation type. For the spatial prediction of micronutrient distributions, however, the gridded predictor variables (e.g., elevation, slope, aspect, vegetation cover) were derived from online datasets in order to upscale site-level observations to the Plateau scale. Slope and aspect data came from the National Tibetan Plateau Data Center (https://data.tpdc.ac.cn, last access: 29 April 2024). The digital elevation model (DEM) data were collected from the Resource and Environment Science and Data Center (https://www. resdc.cn/, last access: 29 April 2024). Climate variables, mean annual temperature (MAT) and mean annual precipitation (MAP) were downloaded from the Climate Data Store (https://cds.climate.copernicus.eu/#!/home, last access: 16 November 2023). The Aridity Index (AI), calculated as mean annual precipitation/mean annual reference evapotranspiration, was obtained from the Global Aridity Index dataset (Trabucco and Zomer, 2018), where higher values indicate greater humidity. Vegetation types (Forest, Shrub, Meadow, Steppe, Desert, Cropland) followed the 1:1 000 000 China Vegetation Map classification (Hou, 2001). The normalized difference vegetation index (NDVI) data were obtained from an Earthdata Search (https://search. earthdata.nasa.gov/search, last access: 16 November 2023). The net primary productivity (NPP) data were obtained from the study by Chen et al. (2023) and were calculated using the CASA model (Potter et al., 1993). The grazing activity data were obtained from statistical yearbooks. Based on the lithological data published by Dijkshoorn et al. (2008), the rock types on the Tibetan Plateau were classified into acidic igneous rock (IA), acidic metamorphic rock (MA), clastic sedimentary rock (SC), carbonate rock (SO), aeolian facies rock (UE), and fluvial facies rock (UF).
2.4 Relative importance analysis and soil micronutrient mapping
Soil micronutrient measurements were preprocessed to detect and remove outliers exceeding the mean ± 3 standard deviations. After data screening, the retained sample sizes are: Fe 1654 (from 1660), Mn 1630 (from 1646), Zn 1655 (from 1661), and V 857 (from 867). To evaluate the relative importance of predictors in explaining soil micronutrient variability across the Tibetan Plateau, we applied the random forest permutation importance ( %IncMSE) to independently cross-validate the driver rankings. For spatial prediction, we developed four area-wide random forest models (each comprising 500 trees) targeting Fe, Mn, Zn, and V contents. The models were trained using a suite of environmental predictors, including topographic features (DEM, slope, aspect), climate variables (MAT, MAP, AI), vegetation indices (NDVI, NPP), soil covariates (texture, SOC, pH, CIA), and grazing intensity. Random forest was selected for its ability to model complex, nonlinear relationships and interactions among diverse types of predictors. Model hyperparameters were optimized using grid search combined with tenfold cross-validation. To assess model generalizability, we examined the extent to which the predictor parameter space in the validation set overlapped with that of the original training data. Model performance was evaluated by comparing predicted versus observed values using scatterplots (predicted on the x-axis, observed on the y-axis) following the method of Piñeiro et al. (2008), with models achieving strong predictive performance (R2 = 0.6–0.7). The uncertainty layer is calculated as the inter-pixel variance among tree predictions. All spatial predictions were produced on a uniform 1 km grid (0.01°) across the Tibetan Plateau to maintain consistent spatial support for both predictions and associated uncertainty estimates. All statistical analyses were conducted using R version 3.4.4.
3.1 Soil micronutrients content
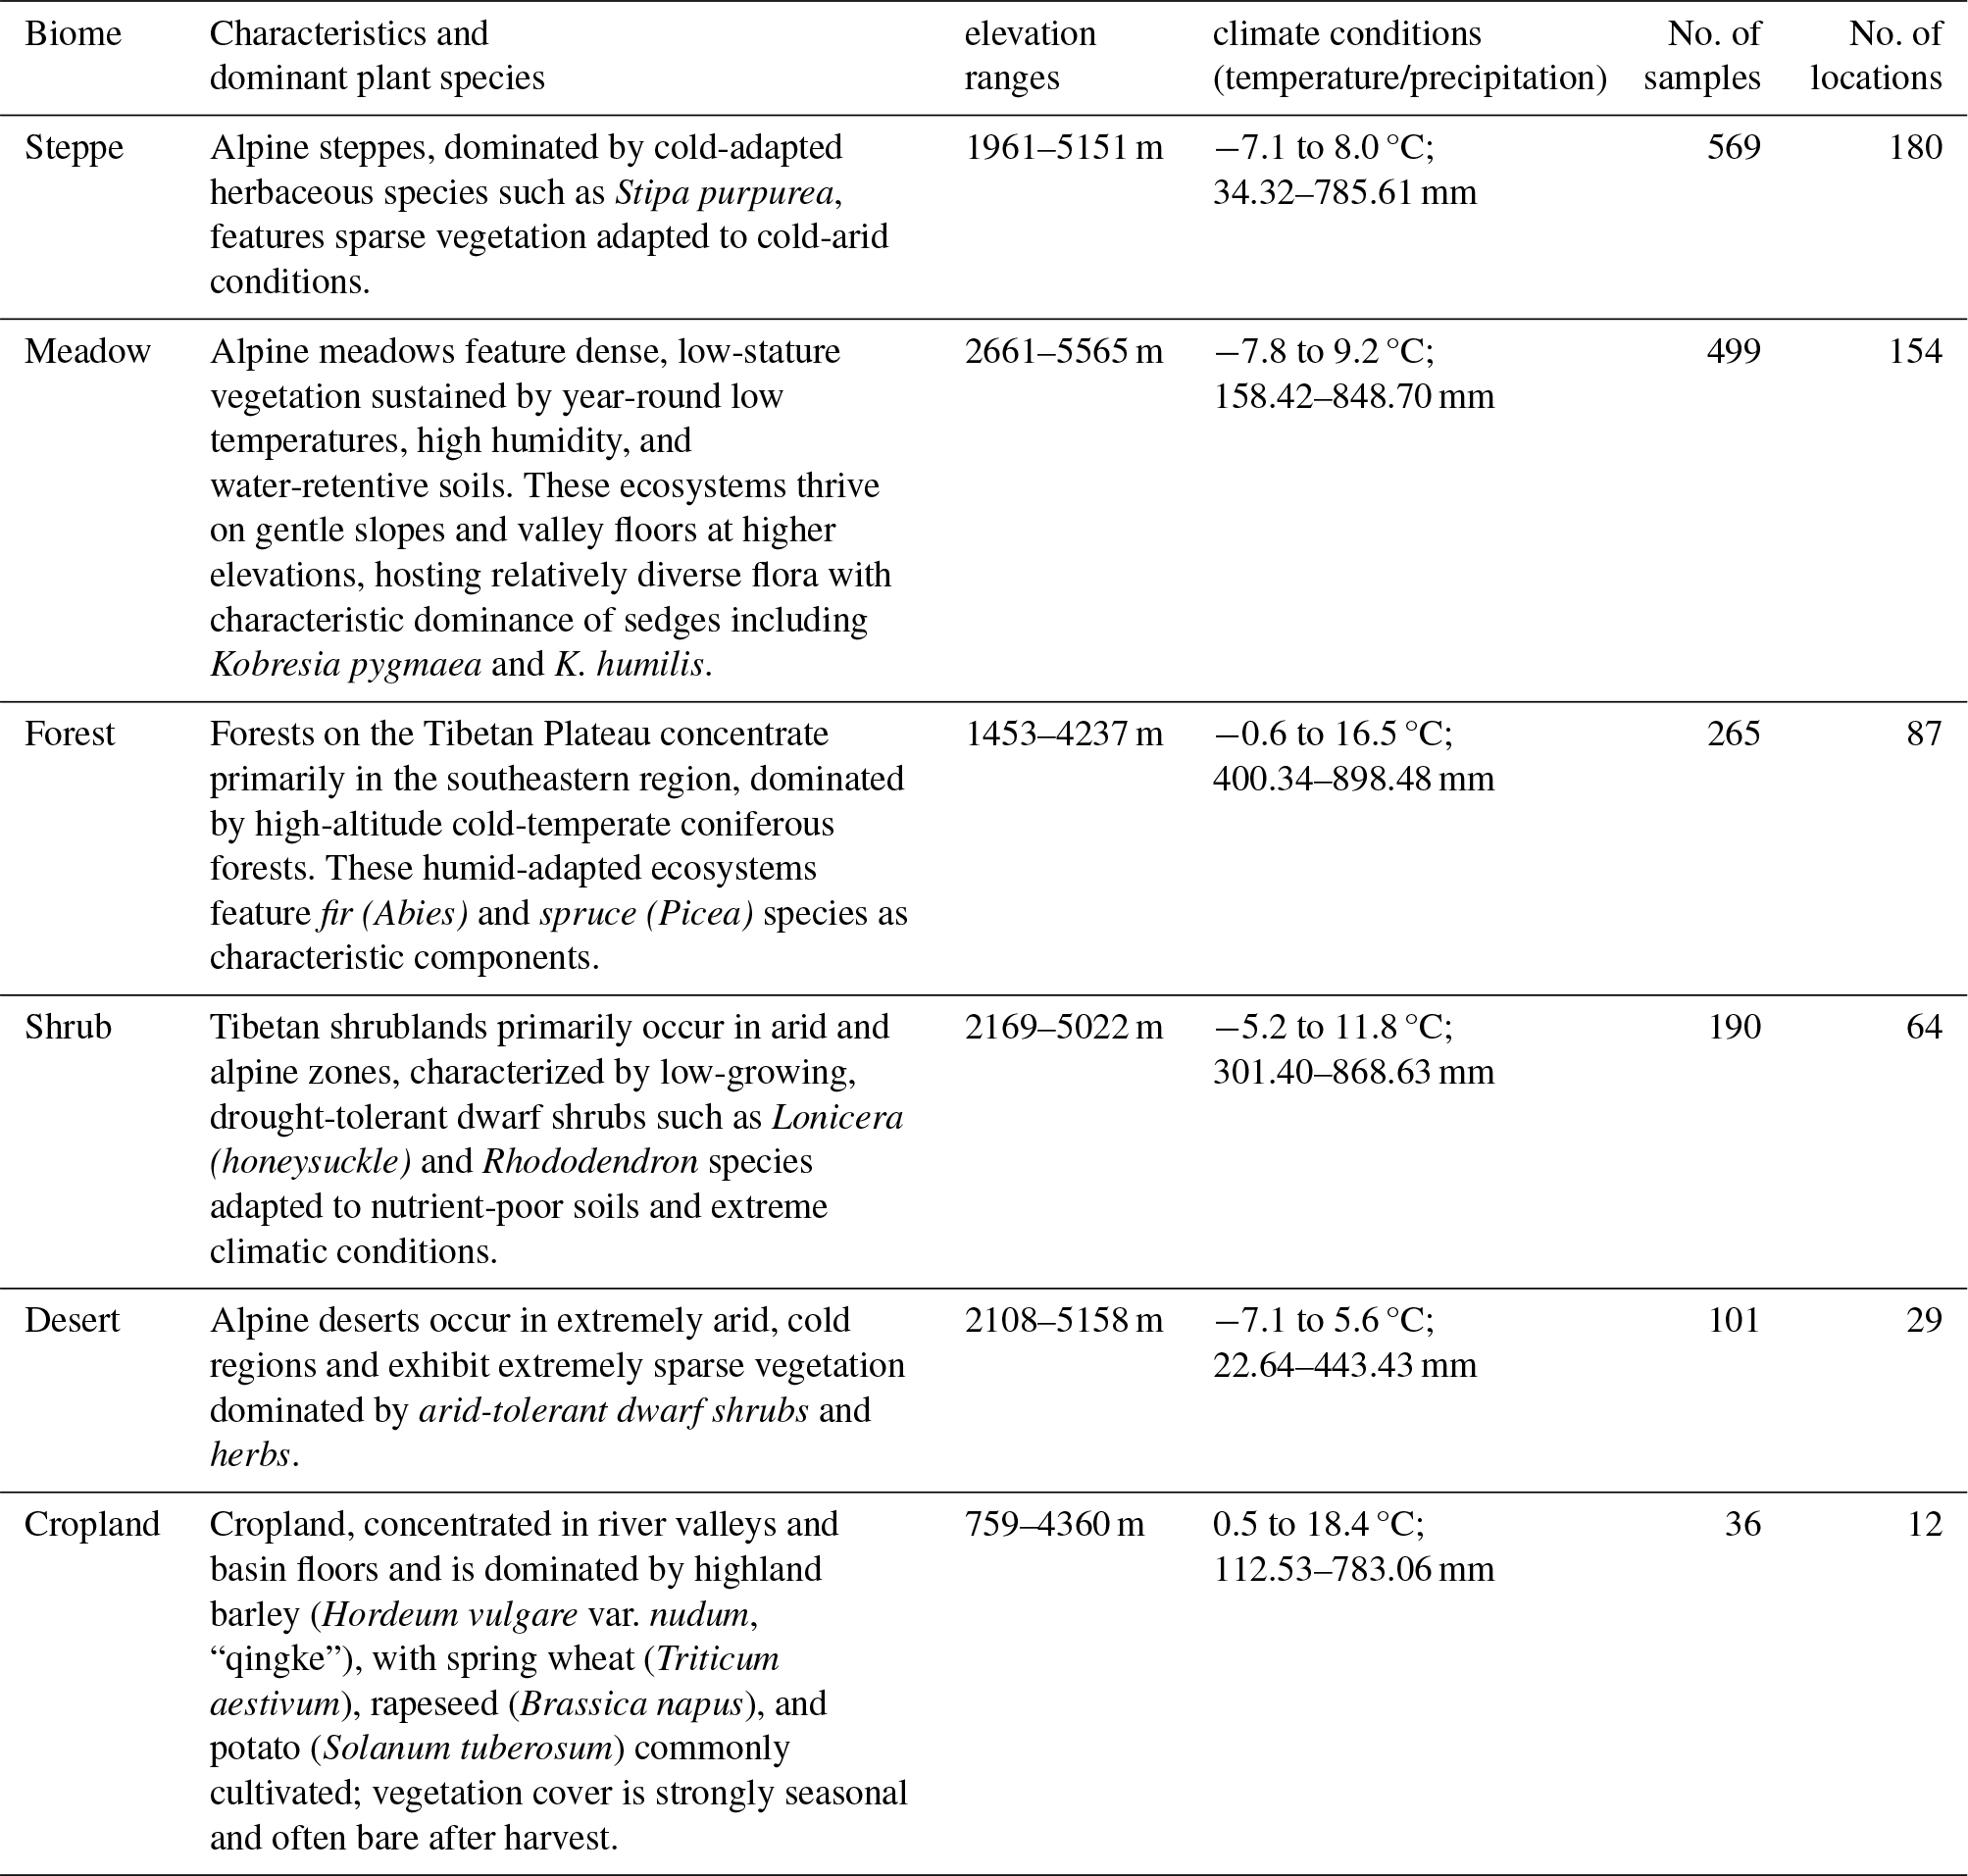
Across all sites, soil micronutrient contents varied widely, with mean value of 22 864.30 ± 7589.01 for Fe (mean ± SD, mg kg−1), 576.74 ± 206.44 for Mn, 27.24 ± 8.55 for Zn, and 56.99 ± 19.33 for V. Coefficients of variation (CV = SD/mean) were 33 % for Fe, 36 % for Mn, 31 % for Zn, and 34 % for V. Collectively, Fe and Mn dominate in absolute abundance, whereas Zn and V occur at tens of mg kg−1, indicating heterogeneous but orderly micronutrient levels across the Plateau (Fig. 2).
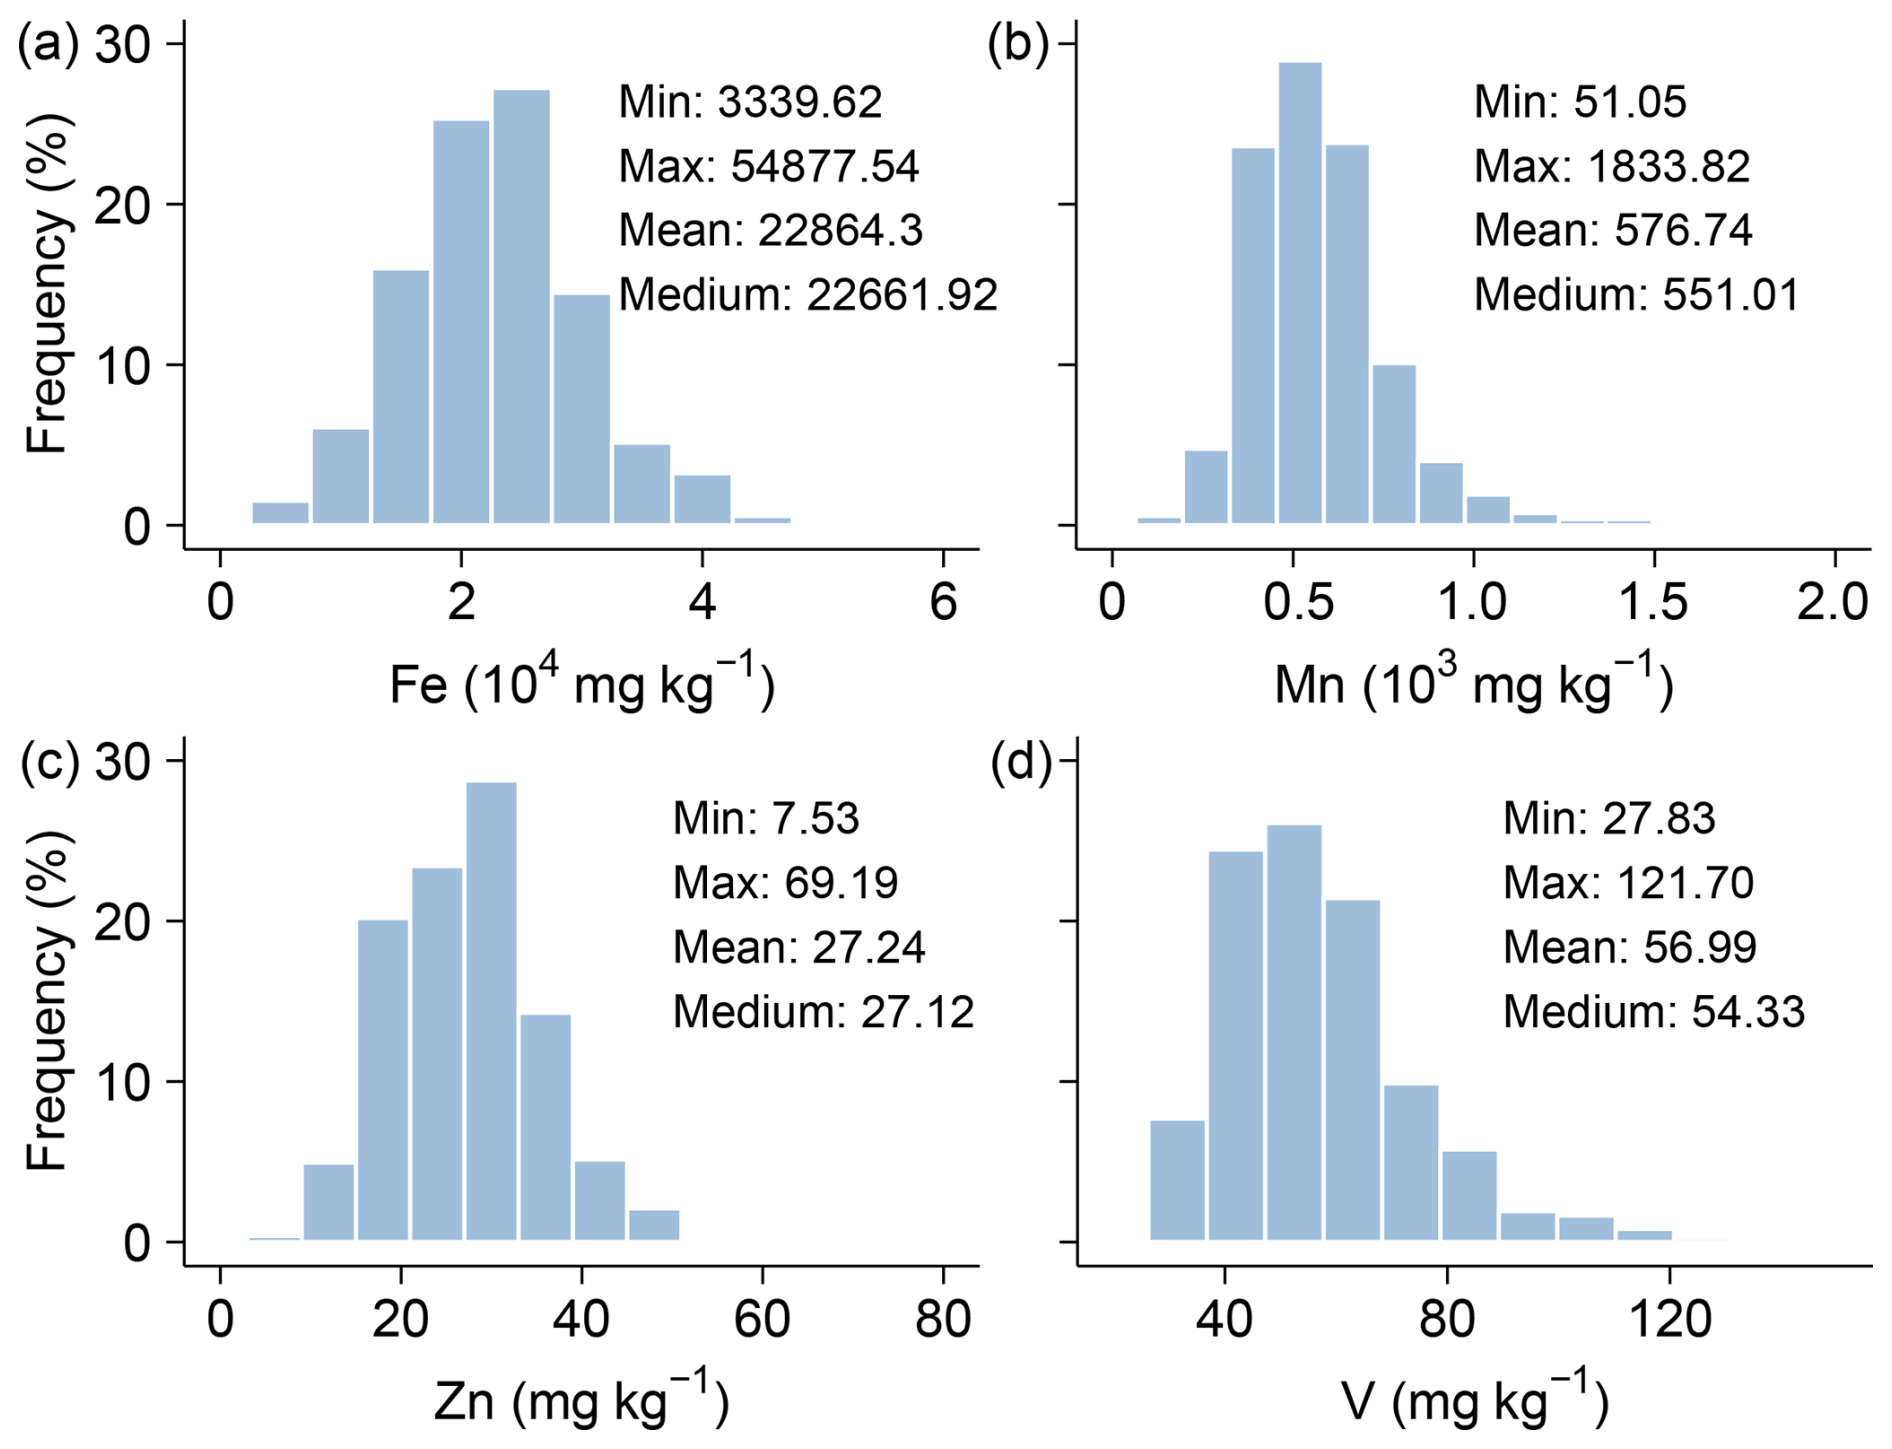
Figure 2Frequency distributions of soil micronutrients (Fe, Mn, Zn, V) across the Tibetan Plateau.
3.2 Soil micronutrients across vegetation types
Soil micronutrient content (Fe, Mn, Zn, and V) varied significantly among different vegetation types (Fig. 3). Fe contents were highest in shrub and forest ecosystems, with mean values of 26 264.11 and 26 090.66 mg kg−1, respectively, significantly exceeding values observed in desert (19 762.66 mg kg−1) and steppe ecosystems (19 852.37 mg kg−1) by 31 %–33 %. Similarly, Mn contents were significantly higher in forest (703.22 mg kg−1) than in shrub (606.33 mg kg−1), meadow (591.59 mg kg−1), desert and steppe ecosystems (both below 510 mg kg−1). Zn demonstrated a strong vegetation-dependent variability, with forest (32.00 mg kg−1) exhibiting the highest values and steppe (22.94 mg kg−1) and desert (21.95 mg kg−1) the lowest, shrub and cropland were intermediate and not significantly different from forest or meadow. V also varied among vegetation types, with forest being significantly higher than meadow and steppe, and shrub significantly higher than steppe, whereas cropland and desert displayed intermediate levels.
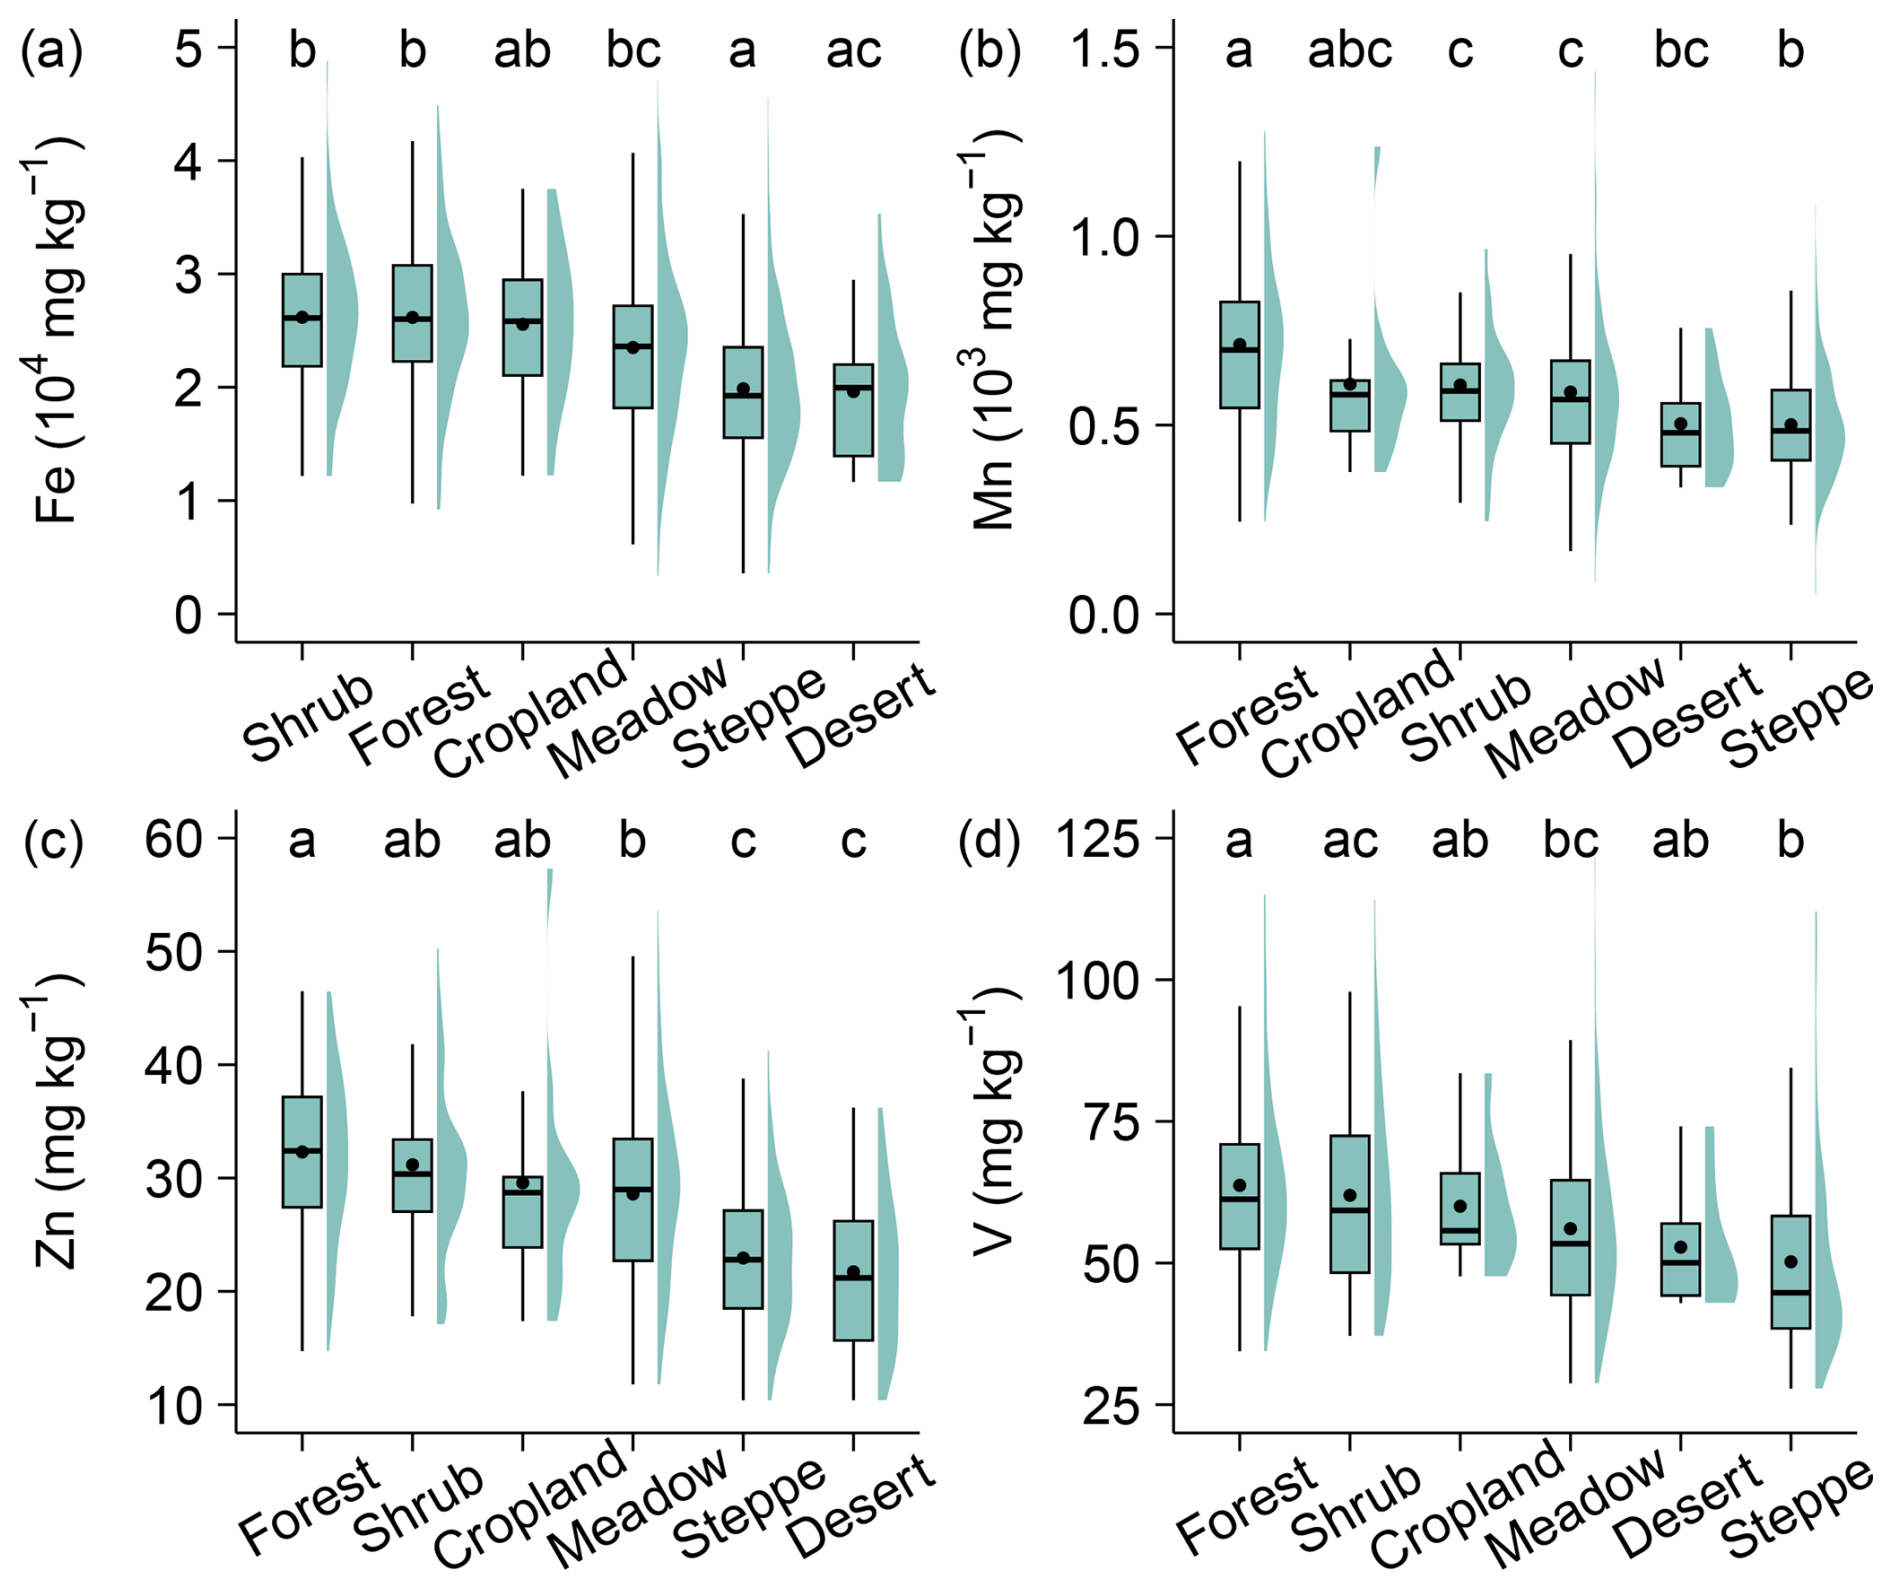
Figure 3Variability in soil micronutrient contents (Fe, Mn, Zn, V) across Tibetan vegetation types. Boxplots show the data distributions for each vegetation type. Within each plot, the boxes represent the interquartile range (IQR), the horizontal lines within boxes indicate the median values, and black dots denote the mean values. The whiskers extend to 1.5 times the IQR. The surrounding shaded violin shapes indicate the kernel density distribution of the data. Lowercase letters denote significance groups from Tukey's HSD multiple comparisons (α=0.05): groups sharing at least one letter do not differ significantly, whereas groups with no letters in common differ significantly (e.g., “ab” is not different from “a” or “b”).
3.3 Soil micronutrients across lithological classes
Lithological class exerted a significant influence on the distribution of several soil micronutrients (Fig. 4). Fe contents differed among lithological classes, with soils derived from acidic metamorphic rocks showing the highest mean value 25 252.72 mg kg−1 and being significantly higher than soils developed from acidic igneous rocks (20 830.15 mg kg−1) and fluvial facies rocks (21 910.22 mg kg−1), whereas carbonate (24 260.96 mg kg−1), eolian facies (23 902.77 mg kg−1), and clastic sedimentary rocks (23 157.66 mg kg−1) exhibited intermediate levels and were not significantly different from either group. A similar pattern was observed for Mn, where acidic-metamorphic-drived soils (658.37 mg kg−1) were significantly higher than acidic-igneous-drived soils (530.45 mg kg−1) and fluvial-facies-drived soils (560.91 mg kg−1), with the remaining lithologies showing intermediate values. Zn also varied among lithologies, with the highest mean content in acidic metamorphic rocks (30.79 mg kg−1), which was significantly higher than acidic igneous rocks (25.27 mg kg−1) and fluvial facies rocks (25.10 mg kg−1), while eolian facies, clastic sedimentary, and carbonate rocks did not differ significantly from acidic metamorphic rocks or the lower group. For V, acidic-metamorphic-derived soils (63.67 mg kg−1) were significantly higher than fluvial facies, acidic igneous, and clastic sedimentary derived soils, whereas eolian facies rocks and carbonate rocks showed intermediate levels and were not significantly different from acidic metamorphic rocks or the lower group.
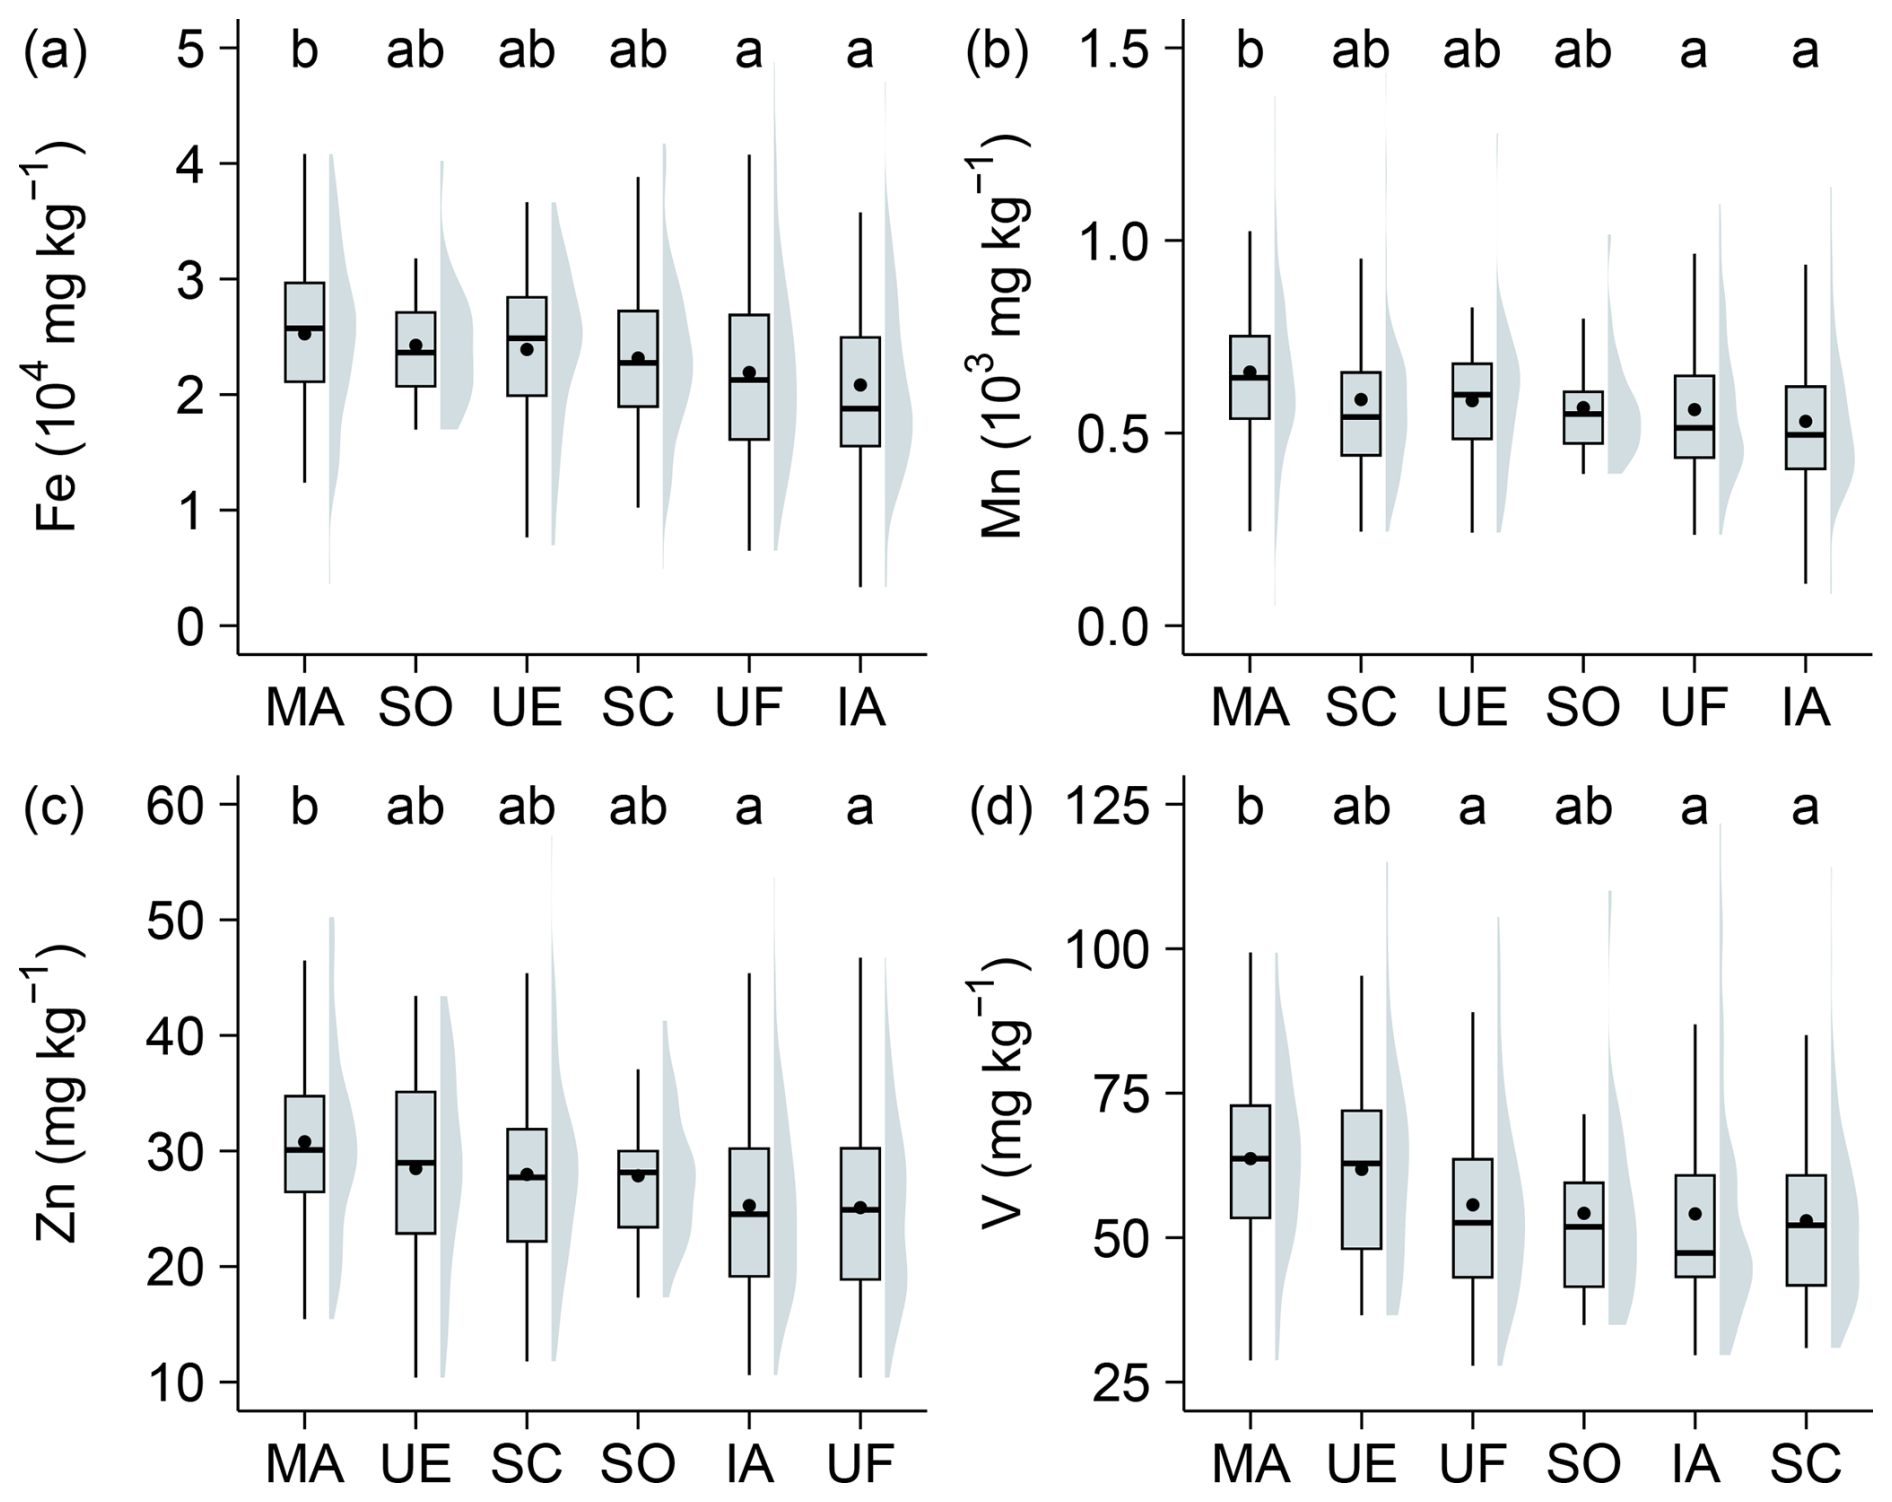
Figure 4Variability in soil micronutrient contents (Fe, Mn, Zn, V) across Tibetan lithological classes. Boxplots show the data distributions for each lithological classes. Within each plot, the boxes represent the interquartile range (IQR), the horizontal lines within boxes indicate the median values, and black dots denote the mean values. The whiskers extend to 1.5 times the IQR. The surrounding shaded violin shapes indicate the kernel density distribution of the data. Lowercase letters denote significance groups from Tukey's HSD multiple comparisons (α=0.05): groups sharing at least one letter do not differ significantly, whereas groups with no letters in common differ significantly (e.g., “ab” is not different from “a” or “b”). Abbreviations of lithological classes: IA = acidic igneous rock, MA = acidic metamorphic rock, SC = clastic sedimentary rock, SO = carbonate rock, UE = eolian facies rock, UF = fluvial facies rock.
3.4 Drivers of soil micronutrient pattern
Relative importance analysis was conducted for five predictor groups, including climate, vegetation, soil covariates, topography, and grazing disturbances. The rankings show clear element-specific controls (Fig. 5a–d). Soil covariates were the primary contributors to the spatial variation of micronutrient contents, followed by topographic and climatic factors, whereas vegetation and anthropogenic disturbance had relatively minor effects. Among all predictors, CIA, slope, and soil texture exhibited the highest importance, indicating that weathering intensity, terrain, and soil physical structure are the dominant controls on the spatial distribution of soil micronutrients. Specifically, CIA emerged as the dominant factor for Fe, Zn, and V. Topographic factors (slope) primarily influenced Mn.
The partial dependence plots illustrated the nonlinear responses of four soil micronutrients (Fe, Mn, Zn, and V) to five key environmental variables (Fig. 6). Overall, the effects of CIA, soil texture, slope, and moisture varied substantially among elements. CIA showed a generally positive relationship with most micronutrients, which increased markedly when chemical index of alteration exceeded approximately 0.5. Soil texture exerted a moderate positive influence on micronutrients. In contrast, slope exhibited a saturating effect – nutrient concentrations rose sharply at low slope angles (< 10°) and plateaued thereafter – highlighting the limited accumulation potential on steeper terrains. The aridity index demonstrated a clear U-shaped pattern for most micronutrients, with relatively low concentrations under intermediate aridity. Four micronutrients exhibited a typical U-shaped relationship with mean annual precipitation, showing higher contents in both low and high precipitation zones, and a clear trough in the intermediate range (approximately 300–500 mm). This pattern aligned closely with responses to drought indices, confirming shared moisture sensitivity. Collectively, these patterns emphasize that soil micronutrient distributions across the Tibetan Plateau are strongly shaped by interactions among chemical weathering intensity, soil physical properties, and climatic aridity.
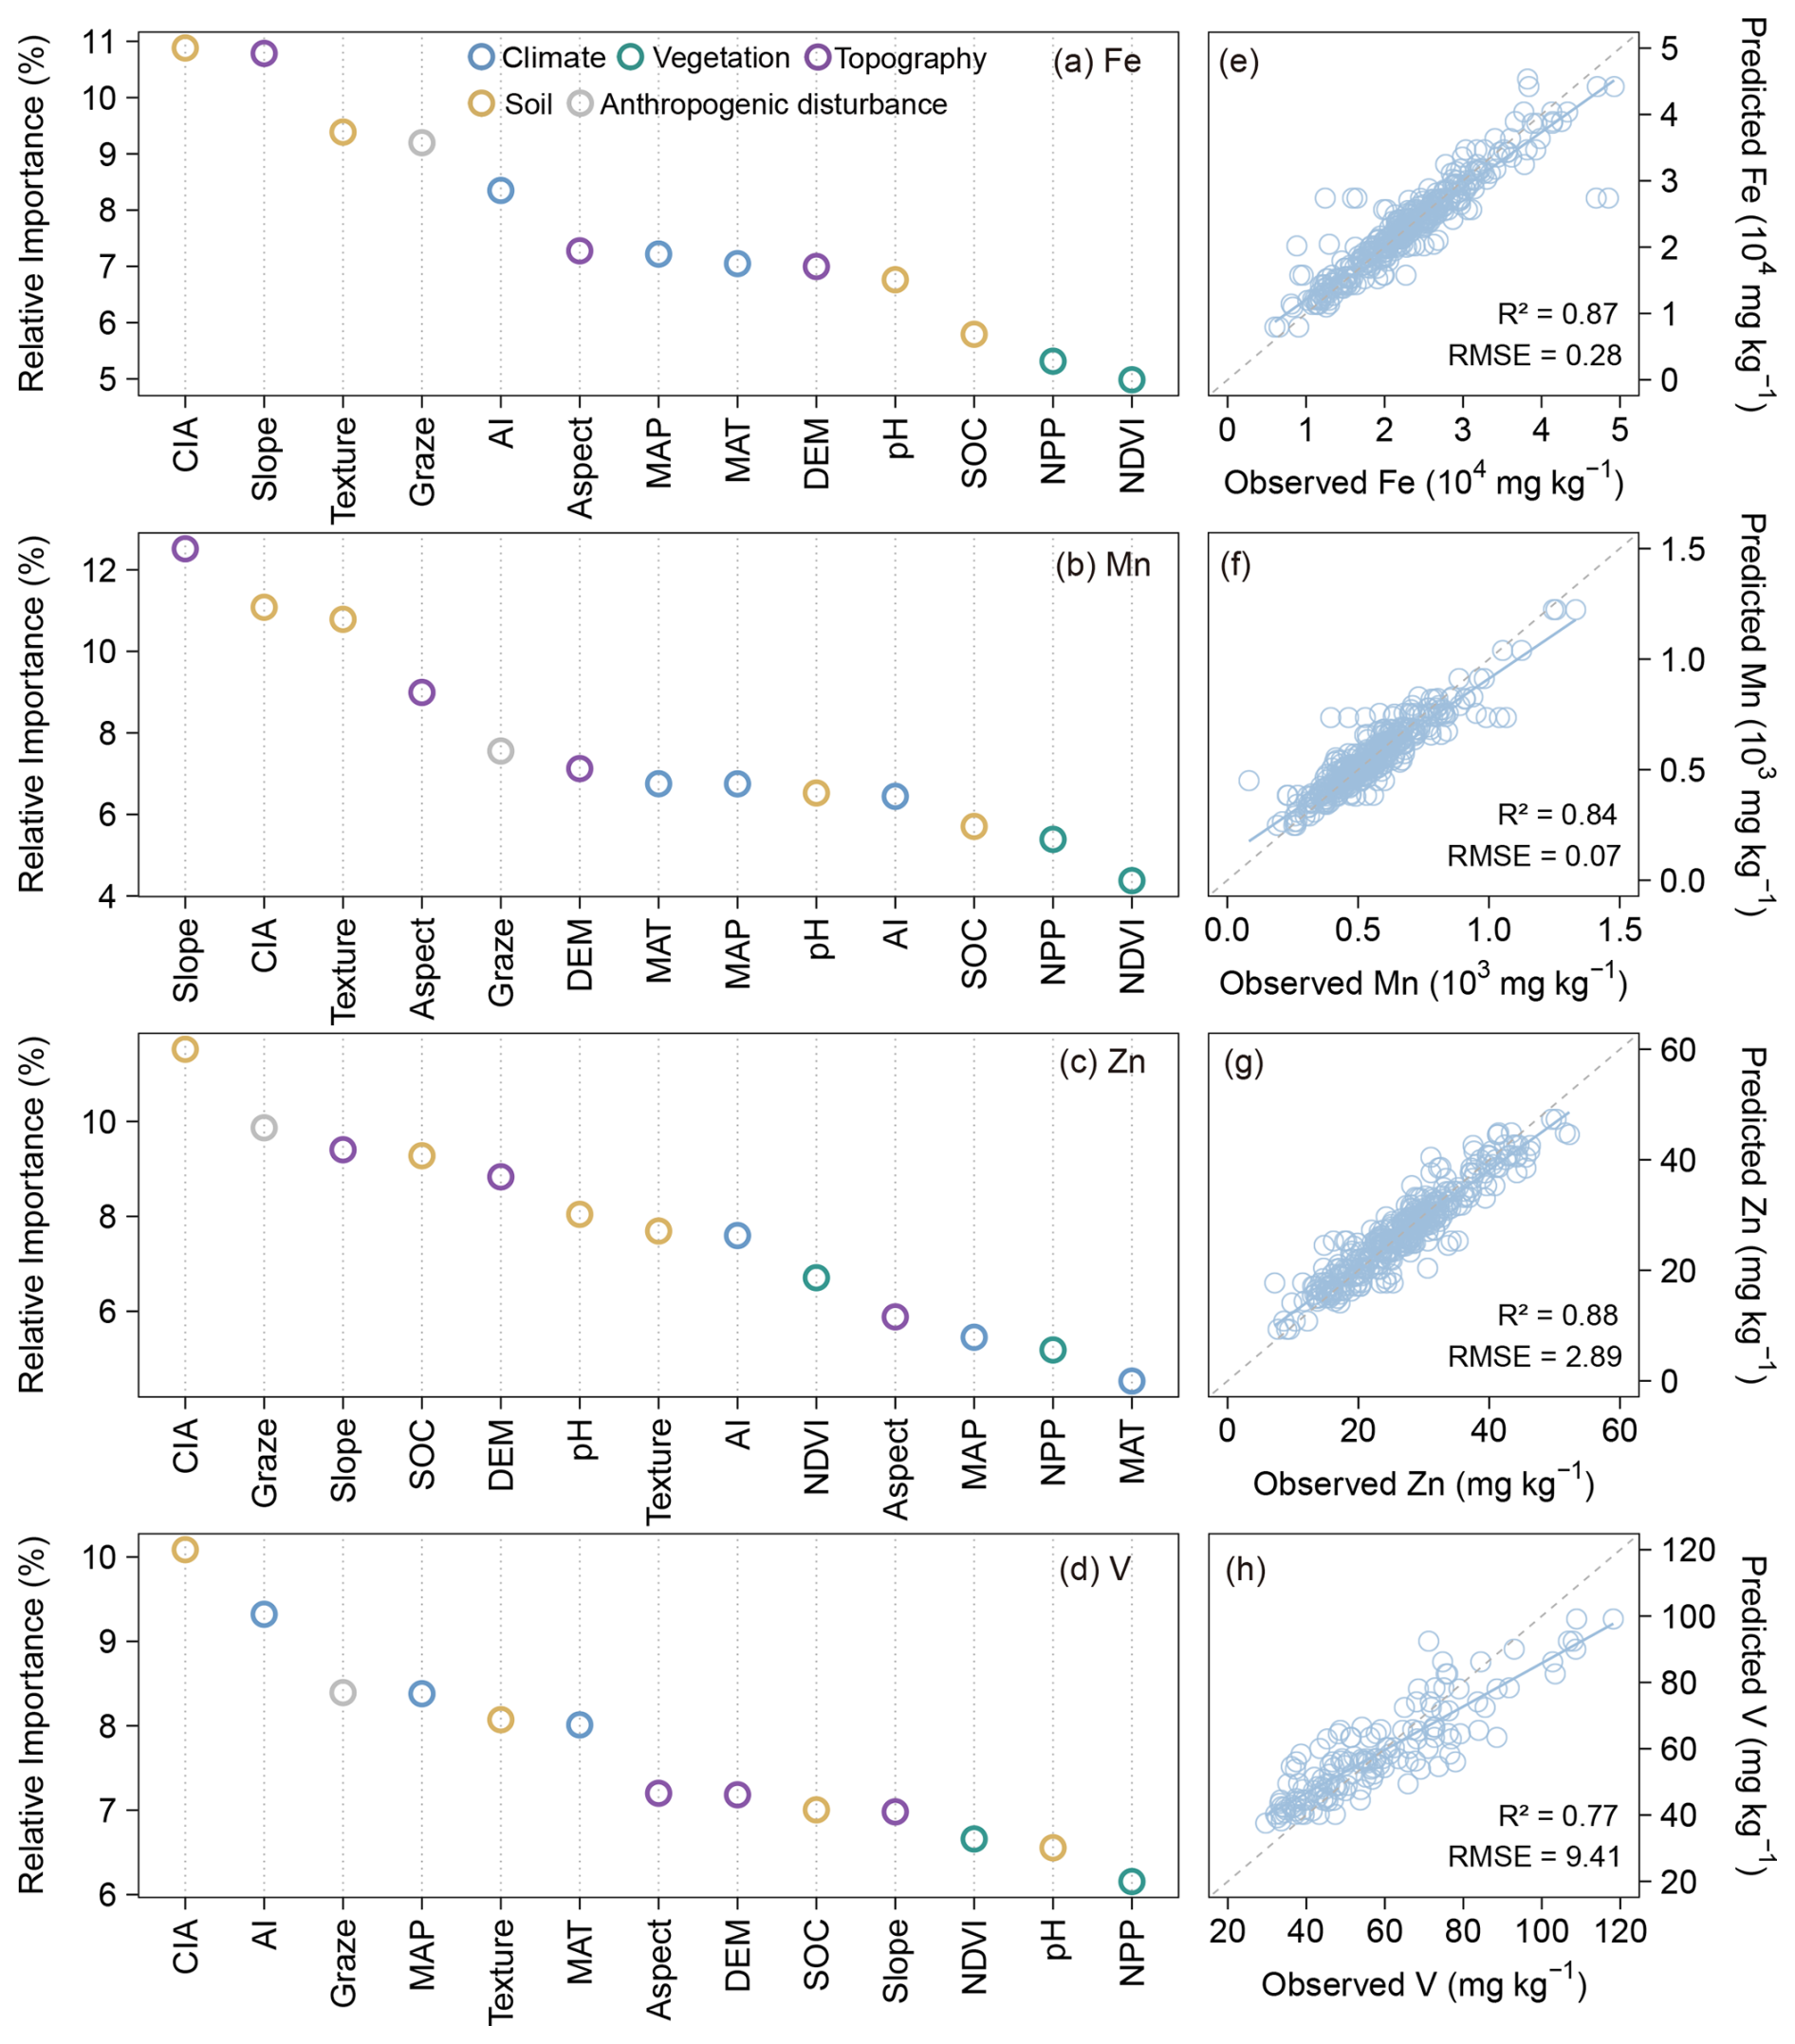
Figure 5Relative importance of biotic and abiotic factors for soil micronutrients (Fe, Mn, Zn, V) on the Tibetan Plateau (a–d). Relationship between observed and predicted values of soil micronutrients (Fe, Mn, Zn, V) on the Tibetan Plateau based on the Random Forest model (e–h). The blue solid line represents the fitted relationship using ordinary least squares regression, while the gray dashed line indicates the 1:1 line between observed and predicted values.
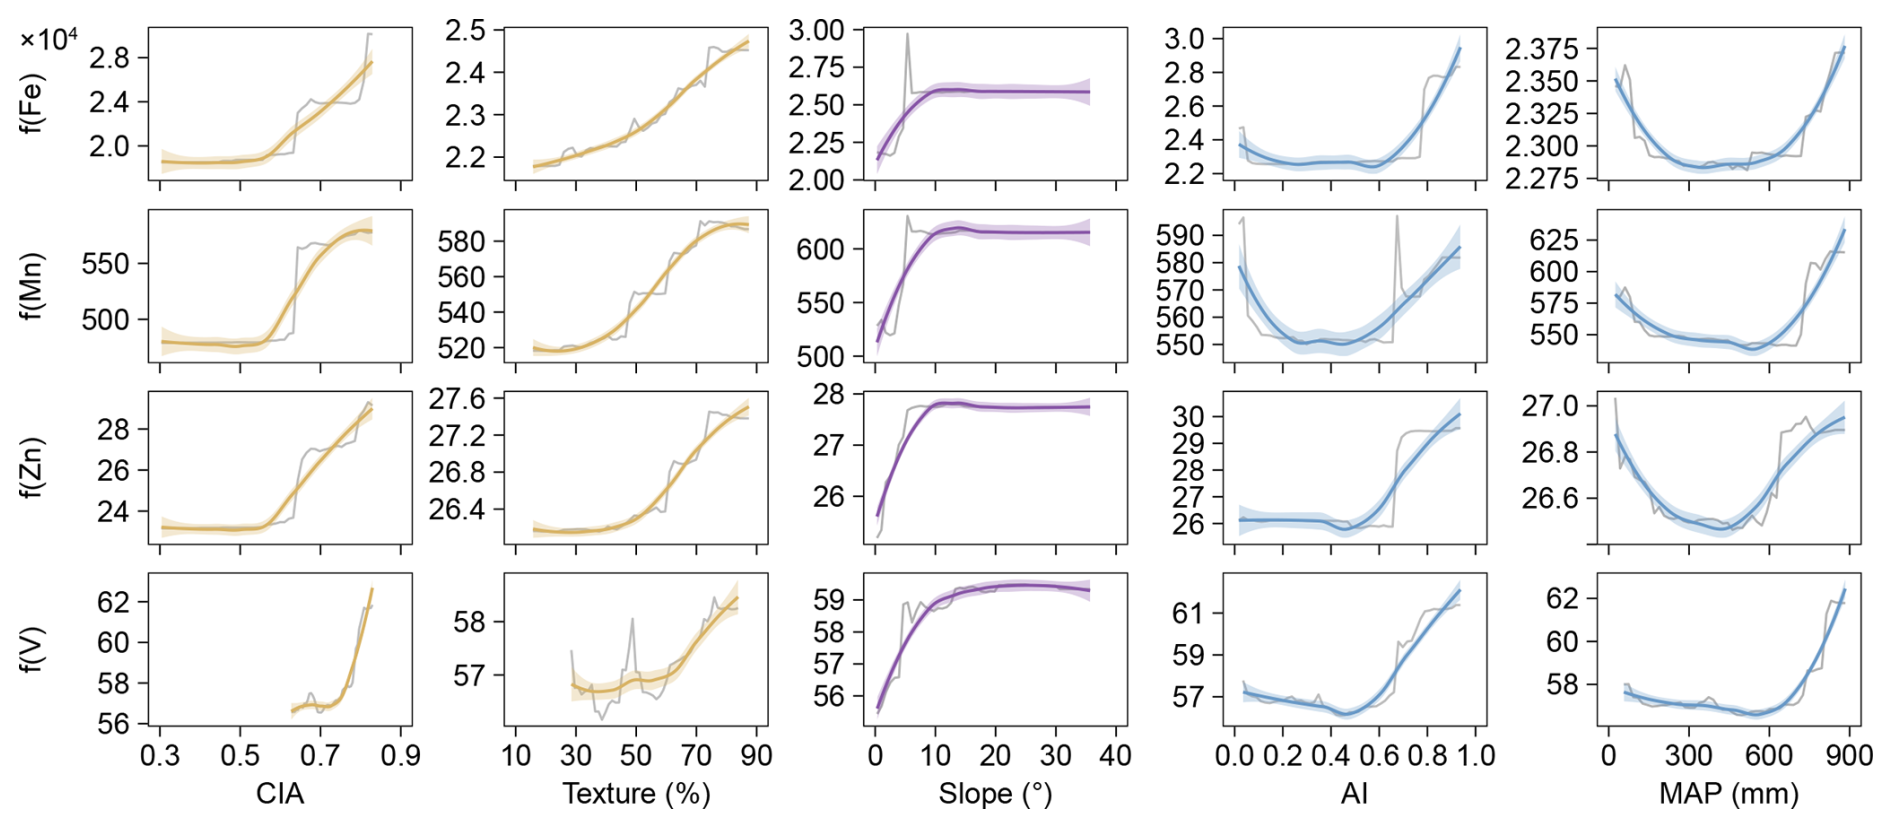
Figure 6Partial dependence of four soil micronutrients (Fe, Mn, Zn, V) on five predictive variables: chemical index of alteration (CIA), Texture, Slope, aridity index (AI) and mean annual precipitation (MAP). Gray lines represent the original partial dependence, while smoothed fits for each micronutrient are shown as colored lines. Shaded areas represent the 95 % confidence intervals.
3.5 Soil micronutrients maps
The random forest (RF) models exhibited strong overall predictive performance for soil micronutrient contents across the Tibetan Plateau, with varying accuracies among elements (Fig. 5e–h). The models for Fe, Mn, and Zn performed best, with R2 values ranging from 0.84 to 0.88 and relatively low RMSE, indicating high consistency between observed and predicted values. In particular, Zn (R2 = 0.88) and Fe (R2 = 0.87) achieved the highest predictive accuracy, suggesting that their spatial variability is well captured by the selected environmental predictors. Mn (R2 = 0.84) also showed strong model fits, reflecting robust representation of their spatial patterns. The V models displayed slightly lower but still acceptable performance (R2 = 0.77), implying that additional predictors may be required to fully capture their local variability. Overall, these results demonstrate that the random forest models effectively predict the spatial distributions of major soil micronutrients, with particularly high reliability for Fe, Mn, and Zn.
Figure 7 illustrates the spatial patterns of soil micronutrients (Fe, Mn, Zn, and V) across the Tibetan Plateau, as predicted by random forest models. The resulting maps reveal significant spatial heterogeneity of these elements. The highest contents of Fe are primarily located in the southeastern region, the southern margins, and parts of the western plateau. Mn shows a distinct gradient, with contents increasing from northeast to southwest. Predicted Mn values range from 298.47 to 1110.19 mg kg−1, and the areas with the highest Mn contents are mainly distributed in the humid southeastern and southern parts of the plateau. Zn displays relatively high contents in the central-eastern region and along certain western edges of the plateau, with predicted values ranging from 17.09 to 45.03 mg kg−1. Predicted V contents ranged from 40.79 to 82.00 mg kg−1, displaying a clear spatial gradient. Higher contents were predominantly found in the southeastern and southern regions of the plateau, where humid climatic conditions and intense chemical weathering promote V enrichment. Moderate levels occurred across the central and eastern plateau, while the lowest concentrations were observed in the arid western and northern areas.
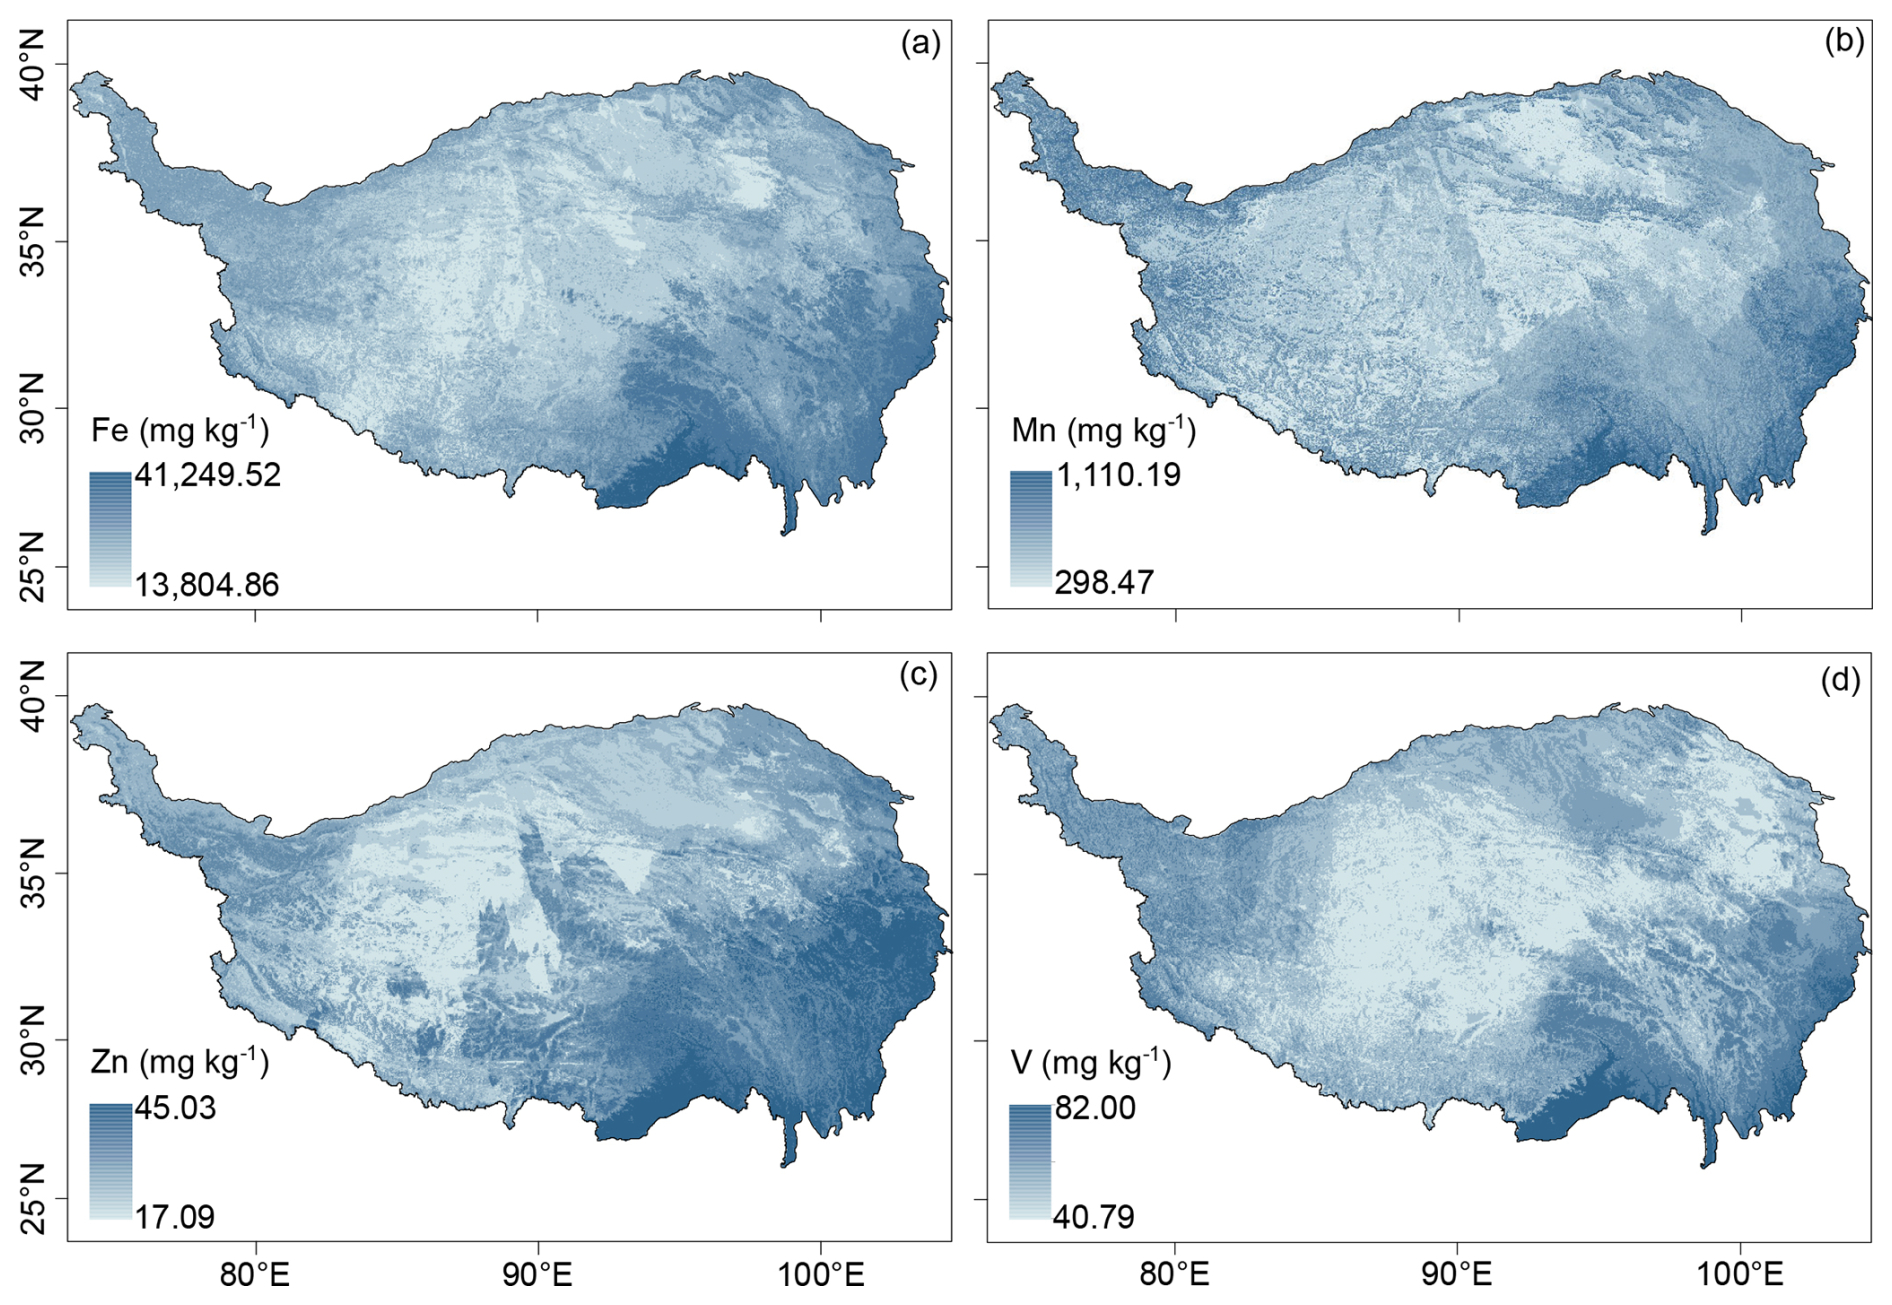
Figure 7Spatial distribution of soil micronutrients (Fe, Mn, Zn, V) on the Tibetan Plateau.
We added comparisons of our results with the few available observations on the Tibetan Plateau, as well as broader datasets from other regions, to better place our findings in a wider context (Table S2). In terms of data range and mean values, the contents and magnitudes of the soil micronutrients we observed are generally consistent with previous reports from the Plateau and global grassland soils, indicating the reliability of our datasets. For the Plateau, the mean Zn, and V contents in this study were slightly lower (Fig. S2). These discrepancies are more likely due to differences in study regions. Our sampling covered a much broader area, whereas previous studies focused mainly on local regions such as the Heihe Basin (Bu et al., 2016). Given the substantial spatial heterogeneity of soil micronutrients across the Tibetan Plateau, such differences are expected and further highlight the necessity of exploring soil micronutrient patterns at the plateau scale.
The vegetation-type contrasts likely reflect ecosystem controls on topsoil (0–10 cm) geochemistry (Fig. 3). These contrasts are consistent with ecosystem-mediated controls on topsoil geochemistry, where denser vegetation generally enhances near-surface nutrient cycling through greater biomass inputs, rhizosphere processes, and organic matter accumulation (Hinsinger, 2000). Increased organic inputs and reactive organo-mineral associations can promote retention of Fe, Mn, and Zn and, indirectly, V that is often associated with Fe-bearing phases (Lehmann and Kleber, 2015). In contrast, arid steppe and desert systems typically exhibit weaker soil development and lower organic inputs, reducing reactive surfaces and binding sites for micronutrients, resulting in lower surface pools (Kabata-Pendias, 2010). Cropland tends to show intermediate levels, likely reflecting mixing within the plough layer and partial homogenization of surface concentrations (Alloway, 2008). Lithological class imposes a first order control on surface soil micronutrient variability (Fig. 4), consistent with the well-established role of parent material in determining baseline micronutrient pools through differences in primary mineral assemblages and weathering products. In our dataset, acidic metamorphic-derived soils are consistently enriched in Fe, Mn, Zn, and V relative to several other lithologies, whereas acidic igneous and fluvial facies substrates tend to show lower contents, with carbonate, eolian facies, and clastic sedimentary rocks generally occupying intermediate levels. Such contrasts are expected where lithology governs not only the supply of Fe and Mn-bearing minerals but also the abundance of secondary oxides and clay surfaces formed during pedogenesis, which strongly influence trace-element retention and depletion intensity at regional scales (Lara et al., 2018; Spinola et al., 2022). The coherent behaviour of V alongside Fe is also mechanistically plausible because vanadate is efficiently retained by Fe and Mn oxides, making V distributions closely coupled to the abundance and reactivity of these mineral phases (Abernathy et al., 2022; Larsson et al., 2017).
The distribution of soil micronutrients across the Tibetan Plateau demonstrates significant spatial heterogeneity (Figs. 2 and 7), aligning with patterns observed in Europe for elements such as Zn (Van et al., 2023). This variability is predominantly governed by the interactions among soil, topography, and climate (Figs. 5a–d and 6). Soils act as the principal sink for micronutrients entering the terrestrial environment through both natural processes and anthropogenic inputs. Consistent with continental-scale assessments, clay content emerged as the dominant control on the spatial distribution of soil Zn in Europe, with coarse-textured soils showing markedly lower Zn concentrations (Van et al., 2023). Similar texture effects have been reported for other elements: soil Cu is positively related to clay and negatively related to sand (Ballabio et al., 2018), sensitivity analyses show that soil Se increases with increasing clay (Jones et al., 2017), whereas surface-soil Hg decreases once sand exceeds ∼ 30 % (Ballabio et al., 2021). These patterns agree with our observation that ecosystems developed on coarse substrates contain the lowest levels of micronutrients. This is because clay serves as an adsorption site for metal elements, whereas sandy soils are relatively weak adsorbents for micronutrients (Mesquita, 1998). In poorly developed soils with low clay content, such as those in arid climates, the lack of capacity to retain soil organic matter leads to a significant reduction in the amount of micronutrients, making them less likely to accumulate (Moreno-Jimenez et al., 2019). In addition to soil covariates, factors such as topography also play a significant role in the micronutrient content of surface soils on the Tibetan Plateau. Accumulated local effect (ALE) curves indicate pronounced, nonlinear elevation responses in soil micronutrients, with Fe and Mn generally decreasing with elevation, whereas Zn and V show threshold-like behaviour, remaining relatively stable at mid-elevations but changing sharply at higher elevations (Fig. S3). Contents of Fe, Mn, Zn, and V increased with slope steepness, particularly below 10°. This pattern suggests that topography governs both physical and chemical soil-forming processes by controlling erosion, leaching, and moisture dynamics (Jenny, 1941; Montgomery, 2007). Steeper slopes enhance runoff and erosion, removing fine particles enriched in Fe and Mn oxides and promoting elemental redistribution along hillslopes, while also accelerating bedrock weathering and releasing lithogenic elements such as Fe and V (Yoo et al., 2006). In contrast, gentler slopes favor organic matter accumulation and reducing conditions that can immobilize or leach redox-sensitive elements. Overall, slope-driven variations in hydrology, weathering, and redox status collectively shape the spatial heterogeneity of soil micronutrients across the Plateau (Quesada et al., 2010).
Notably, precipitation emerges as the primary predictor for micronutrients such as Fe, Mn, Zn, and V, with all elements exhibiting characteristic U-shaped responses, with minima occurring at 300–500 mm. This pattern likely reflects distinct weathering regimes across precipitation gradients. In arid regions (< 300 mm), physical weathering processes, including freeze-thaw fracturing and aeolian erosion, predominate, allowing micronutrients to accumulate near the surface due to evaporation effects (Pachauri et al., 2014; Moreno-Jimenez et al., 2023). In transitional precipitation regimes (300–500 mm), intensified chemical weathering occurs; however, leaching fluxes surpass the rates of parent material weathering, leading to soil elemental depletion (Anderson, 2019; Bluth and Kump, 1994; Hartmann et al., 2014). In humid regions (> 500 mm), enhanced chemical weathering results in the formation of secondary clay minerals (e.g., montmorillonite, illite), whose negatively charged surfaces facilitate elemental retention through ionic adsorption and co-precipitation mechanisms (Alloway, 2009). To further verify these nonlinear effects, accumulated local effects analyses were performed and revealed consistent U-shaped responses for Fe, Mn, Zn, and V, confirming the robustness of the partial dependence results (Fig. S4). This pattern likely reflects a trade-off between weathering intensity, leaching losses, and elemental retention under contrasting hydrological conditions. Additionally, MAP showed a significant positive correlation with CIA (Fig. S5), indicating that higher precipitation enhances chemical weathering. However, this relationship alone does not fully explain the observed U-shaped nutrient responses, as direct indicators of leaching fluxes and mineral retention are lacking. We therefore consider this U-shaped pattern, supported by multiple lines of evidence, as an open question for future investigation, emphasizing the need for complementary datasets (e.g., redox status, mineral composition) to refine its mechanistic interpretation. Although lithological differences are detectable for some elements, they do not alter the overall spatial patterns (Fig. 4). In summary, lithology modulates the baseline levels of certain micronutrients but is not the dominant factor shaping their regional distributions, which are more strongly governed by external environmental drivers such as climate, weathering intensity, sediment transport, and biotic cycling.
Our findings suggest that the aridity index is a significant determinant of soil micronutrient distribution. Specifically, elemental contents tend to decrease when the aridity index falls below a certain threshold (Fig. 6). This trend likely reflects reduced input or retention of elements under arid conditions. Grouped comparisons across aridity classes (humid, dry sub-humid, semi-arid, arid, and hyper-arid) were performed. The results show that the medians and means of Fe, Mn, Zn, and V decrease with increasing aridity (Fig. S6). Drought conditions may modify soil redox states, thereby influencing element speciation, adsorption capacity, mobility, and ultimately, leaching behavior (Brady and Weil, 2016; Loveland and Webb, 2003; Carter and Stewart, 1995). Also, arid environments may indirectly impact micronutrients through alterations in soil pH and soil organic matter content (Moreno-Jimenez et al., 2019). Previous research has shown that droughts induced by climate change can restrict the availability of essential micronutrients, such as iron and zinc (Moreno-Jimenez et al., 2019; Bista et al., 2018). This limitation, along with other adverse effects like diminished water availability, poses substantial threats to vital ecological processes and services in drylands, including food production (Gupta et al., 2008; Graham, 1991). Furthermore, ongoing regional warming and associated hydroclimatic shifts may interact with hydrology and redox processes, organic-matter cycling, and vegetation patterns, thereby altering the availability and spatial variability of certain micronutrients (Myers et al., 2014; Pachauri et al., 2014).
Multiple biogeochemical processes are sensitive to micronutrient availability. Biological nitrogen fixation relies on Mo and Fe as essential cofactors of nitrogenase, while the methane cycle depends on Ni and Cu through their roles in methanogenesis and methane oxidation, respectively (Thauer, 2019; Stefan et al., 2020). Permafrost thaw and thermokarst development can further activate Fe-Mn redox cycling, altering metal mobility (Chauhan et al., 2024). Collectively, soil micronutrients depletion may cascade through nutrient cycling and ecosystem feedbacks, amplifying the impacts of ongoing environmental change across the Plateau.
Although the laboratory XRF measurements used in this study were validated against ICP-MS and generally showed strong correlations, several limitations should be noted. For Fe, Mn, and V, the two methods produced highly consistent results, supporting the robustness of the dataset. In contrast, Zn exhibited systematic deviations from the 1:1 line, with XRF tending to slightly underestimate contents relative to ICP-MS (Fig. S1). These deviations likely arise from element-specific detection sensitivities of XRF. To address this, we calibrated Zn, using the regression relationships between the two methods and then repeated spatial mapping. The results before and after calibration were not significantly different, confirming that these deviations do not affect our main findings (Figs. S7 and S8). Furthermore, the primary scientific purpose of this dataset is to characterize spatial patterns, ecological gradients, and multivariate relationships across the Plateau, rather than to provide ultra-precise quantification of element contents at the individual-sample level. For these objectives, XRF-derived contents, supported by calibration, cross-validation, and transparent uncertainty reporting, provide reliable and ecologically interpretable information. Nonetheless, we acknowledge that incorporating ICP-based measurements on a larger sample set would further strengthen the accuracy of the dataset, and future efforts should consider combining multiple analytical approaches to minimize methodological uncertainties.
Our random forest regression models demonstrated robust predictive capability (e.g. cross-validated R2 range from 0.65 to 0.77 for Fe, Mn, and Zn; Table S3), V exhibit weaker predictive performance (R2=0.39). The spatial predictions inevitably contain uncertainties arising from both the Random Forest model and the input datasets. Model-based uncertainty was quantified as the inter-tree variance among predictions (RF-SD; Fig. S9), while additional uncertainty may stem from sparse meteorological observations and limited soil sampling across the Tibetan Plateau. Large regions in the west (including parts of the Changtang Plateau and Ngari) are sparsely inhabited and difficult to access, with extensive high-elevation terrain and access restrictions that constrain fieldwork. Consequently, model estimates in these areas are supported by fewer observations and should be interpreted with greater caution. We therefore recommend that users consider the accompanying uncertainty layer when applying the gridded products, especially for analyses focusing on the western Plateau or on fine-scale local interpretation. Nevertheless, model accuracy could be further improved to more extensive field sampling and refinement of input data. Specifically, targeted collection of soil micronutrient data and associated covariates in underrepresented high-altitude regions of the Tibetan Plateau is necessary to address existing spatial gaps. Additionally, systematic reduction of uncertainties inherent in gridded environmental datasets is essential, as these uncertainties propagate errors into micronutrient predictions. Continued advancement in both field observations and foundational geospatial dataset is crucial for improving the reliability of regional-scale element mapping.
We note that the reported contents represent a fixed-depth (0–10 cm) surface layer, which may correspond to different dominant horizons among land uses (organic-rich surface in some forests, mineral topsoil in grasslands/meadows, and the plough layer in croplands). Users should consider this context when applying the dataset, especially for process inference or when comparing across ecosystems with contrasting surface horizons. Where applications require deeper profiles or horizon-specific interpretation, we recommend integrating our maps with local profile data. Because croplands occupy a very small fraction of the Plateau and are represented by a limited number of samples in our area-weighted design, cropland-related results should be interpreted primarily as a cross-ecosystem contrast at the plateau scale. Users addressing cropland-specific questions are advised to use these values with caution and, where possible, complement them with targeted cropland sampling or independent field observations.
The gridded soil micronutrient (Fe, Mn, Zn, and V) maps for Tibetan Plateau can be downloaded from https://doi.org/10.11888/Terre.tpdc.303242 (Huo et al., 2026). Users should note that laboratory XRF provides robust estimates for major elements (e.g., Fe), whereas trace-level elements (particularly Zn) carry higher uncertainty even after ICP-MS calibration. The dataset is intended primarily for plateau-scale analyses and cross-ecosystem spatial comparisons, caution is advised when using absolute Zn contents for applications requiring high analytical precision (e.g., bioavailability thresholds, detailed mass-balance calculations, or benchmarking requiring near-reference values), and users should consult the accompanying calibration statistics and uncertainty diagnostics.
This study delivers a comprehensive assessment of spatial distribution patterns for four soil micronutrients (Fe, Mn, Zn, and V) across the Tibetan Plateau, revealing pronounced regional-scale heterogeneity. Soil covariates were the primary contributors to the spatial variation of micronutrient contents, followed by topographic and climatic factors, whereas vegetation and grazing disturbance had relatively minor effects. These findings highlight the coupled effects of climate, vegetation, and parent material on micronutrient biogeochemical cycling within the complex environmental context of the Tibetan Plateau. Using five predictor groups (climate, vegetation, soil covariates, topography, and grazing disturbances), we generated high-resolution spatial maps for key soil micronutrients (Fe, Mn, Zn, and V) via machine learning. These maps provide validated initial conditions for process-based models simulating micronutrient cycling, advances understanding of elemental distribution in alpine ecosystems.
The supplement related to this article is available online at https://doi.org/10.5194/essd-18-1561-2026-supplement.
JZ conceived the study. HY conducted the field survey and was responsible for data collection and processing. HY prepared the manuscript with contributions from all co-authors.
The contact author has declared that none of the authors has any competing interests.
Publisher's note: Copernicus Publications remains neutral with regard to jurisdictional claims made in the text, published maps, institutional affiliations, or any other geographical representation in this paper. The authors bear the ultimate responsibility for providing appropriate place names. Views expressed in the text are those of the authors and do not necessarily reflect the views of the publisher.
This study was supported by the Second Tibetan Plateau Scientific Expedition and Research Program (2022QZKK0101), National Natural Science Foundation of China (42471159), and Chinese Academy of Sciences (CAS) Project for Young Scientists in Basic Research (YSBR-037).
This research has been supported by the Second Tibetan Plateau Scientific Expedition and Research Program (grant no. 2022QZKK0101), National Natural Science Foundation of China (grant no. 42471159), and Chinese Academy of Sciences (CAS) Project for Young Scientists in Basic Research (grant no. YSBR-037).
This paper was edited by Yuanzhi Yao and reviewed by four anonymous referees.
Abernathy, M. J., Schaefer, M. V., Ramirez, R., Garniwan, A., Lee, I., Zaera, F., Polizzotto, M. L., and Ying, S. C.: Vanadate retention by iron and manganese oxides, ACS Earth and Space Chemistry, 6, 2041–2052, https://doi.org/10.1021/acsearthspacechem.2c00116, 2022.
Alloway, B. J.: Zinc in soils and crop nutrition, 2nd edn., International Zinc Association (IZA) and International Fertilizer Industry Association (IFA), Brussels and Paris, ISBN 9789081333108, 2008.
Alloway, B. J.: Soil factors associated with zinc deficiency in crops and humans, Environmental Geochemistry and Health, 31, 537–548, https://doi.org/10.1007/s10653-009-9255-4, 2009.
Anderson, S. P.: Breaking it down: Mechanical processes in the weathering engine, Elements: An International Magazine of Mineralogy, Geochemistry, and Petrology, 15, 247–252, https://doi.org/10.2138/gselements.15.4.247, 2019.
Ballabio, C., Jiskra, M., Osterwalder, S., Borrelli, P., Montanarella, L., and Panagos, P.: A spatial assessment of mercury content in the European Union topsoil, Science of the Total Environment, 769, 144755, https://doi.org/10.1016/j.scitotenv.2020.144755, 2021.
Ballabio, C., Panagos, P., Lugato, E., Huang, J. H., Orgiazzi, A., Jones, A., Fernández-Ugalde, O., Borrelli, P., and Montanarella, L.: Copper distribution in European topsoils: An assessment based on LUCAS soil survey, Science of the Total Environment, 636, 282–298, https://doi.org/10.1016/j.scitotenv.2018.04.268, 2018.
Bista, D. R., Heckathorn, S. A., Jayawardena, D. M., Mishra, S., and Boldt, J. K.: Effect of drought and carbon dioxide on nutrient uptake and levels of nutrient-uptake proteins in roots of barley, American Journal of Botany, 107, 1401–1409, https://doi.org/10.1002/ajb2.1542, 2018.
Bluth, G. J. and Kump, L. R.: Lithologic and climatologic controls of river chemistry, Geochimica et Cosmochimica Acta, 58, 2341–2359, https://doi.org/10.1016/0016-7037(94)90015-9, 1994.
Brady, N. C. and Weil, R. R.: The nature and properties of soils, Pearson Education, Boston, 1104 pp., ISBN 9780133254488, 2016.
Bu, J. W., Sun, Z. Y., Zhou, A. G., Xu, Y. N., Ma, R., Wei, W. H., and Liu, M.: Heavy Metals in Surface Soils in the Upper Reaches of the Heihe River, Northeastern Tibetan Plateau, China, 13, https://doi.org/10.3390/ijerph13030247, 2016.
Cardon, Z. G., Stark, J. M., Herron, P. M., and Rasmussen, J. A.: Sagebrush carrying out hydraulic lift enhances surface soil nitrogen cycling and nitrogen uptake into inflorescences, Proceedings of the National Academy Sciences of the United States of America, 110, 18988–18993, https://doi.org/10.1073/pnas.1311314110, 2013.
Carter, M. R. and Stewart, B. A.: Structure and organic matter storage in agricultural soils, CRC Press, Boca Raton, 304 pp., https://doi.org/10.1201/9781003075561, 1995.
Chauhan, A., Patzner, M. S., Bhattacharyya, A., Borch, T., Fischer, S., Obst, M., Thomasarrigo, L. K., Kretzschmar, R., Mansor, M., Bryce, C., Kappler, A., and Joshi, P.: Interactions between iron and carbon in permafrost thaw ponds, Science of the Total Environment, 946, 174321, https://doi.org/10.1016/j.scitotenv.2024.174321, 2024.
Cheng, C. J., He, N. P., Li, M. X., Xu, L., Cai, W. X., Li, X., Zhao, W. W., Li, C., and Sun, O. J.: Plant species richness on the Tibetan Plateau: patterns and determinants, Ecography, 2023, https://doi.org/10.1111/ecog.06265, 2022.
Chen, J. H., Wang, Y. F., Sun, J., Zhang, J. X., Zhang, J. T., Wang, Y. X., Zhou, T. C., Huo, H. Y., and Liang, E. Y.: Linking ecosystem service benefit and grazing prohibition intensity can better optimize fence layout in northern Tibet, Land Degradation Development, 34, 2038–2051, https://doi.org/10.1002/ldr.4587, 2023.
Cheng, F. T., Chen, D. L., Wang, B., Ou, T. H., and Lu, M. Q.: Human-induced warming accelerates local evapotranspiration and precipitation recycling over the Tibetan Plateau, Communications Earth Environment, 388, https://doi.org/10.1038/s43247-024-01537-8, 2024.
Dallman, P. R.: Biochemical basis for the manifestations of iron deficiency, Annual Review of Nutrition, 6, 13-40, https://doi.org/10.1146/annurev.nu.06.070186.000305, 1986.
Dijkshoorn, J. A., van Engelen, V. W. P., and Huting, J. R. M.: Soil and landform properties for LADA partner countries (Argentina, China, Cuba, Senegal and The Gambia, South Africa and Tunisia), ISRIC Report 2008/06 and GLADA Report 2008/03, ISRIC-World Soil Information and FAO, Wageningen, 23 pp., https://edepot.wur.nl/32994 (last access: 22 November 2023), 2008.
Dijkstra, J. J., Meeussen, J. C. L., and Comans, R. N. J.: Leaching of heavy metals from contaminated soils: an experimental and modeling study. Environmental Science & Technology, 38, 4390–4395, https://doi.org/10.1021/es049885v, 2004.
Dong, K., Li, W. J., Tang, Y. L., Ma, S. H., and Jiang, M. L.: Co-limitation of N and P is more prevalent in the Qinghai-Tibetan Plateau grasslands, Frontiers in Plant Science, 14, 1140462, https://doi.org/10.3389/fpls.2023.1140462, 2023.
Du, Z. Y., Cai, Y. J., Yan, Y., and Wang, X. D.: Embedded rock fragments affect alpine steppe plant growth, soil carbon and nitrogen in the northern Tibetan Plateau, Plant and Soil, 420, 79–92, https://doi.org/10.1007/s11104-017-3376-9, 2017.
Fageria, N. K., Baligar, V. C., and Clark, R. B.: Micronutrients in crop production, Advances in Agronomy, 77, 185-268, https://doi.org/10.1016/S0065-2113(02)77015-6, 2002.
Fedo, C. M., Nesbitt, H. W., and Young, G. M.: Unraveling the effects of potassium metasomatism in sedimentary rocks and paleosols, with implications for paleoweathering conditions and provenance, Geology, 23, 921–924, https://doi.org/10.1130/0091-7613(1995)023<0921:UTEOPM>2.3.CO;2, 1995.
Fischer, W. W., Hemp, J., and Johnson, J. E.: Manganese and the evolution of photosynthesis, Origins of Life and Evolution of Biospheres, 45, 351-357, https://doi.org/10.1007/s11084-015-9442-5, 2015.
Graham, T. W.: Trace element deficiencies in cattle, Veterinary Clinice of North America-Food Animal Practice, 7, 153–215, https://doi.org/10.1016/S0749-0720(15)30816-1, 1991.
Guan, Z. H., Li, X. G., and Wang, L.: Heavy metal enrichment in roadside soils in the eastern Tibetan Plateau, Environmental Science and Pollution Research, 25, 7625–7637, https://doi.org/10.1007/s11356-017-1094-8, 2017.
Gupta, U. C., Wu, K., and Liang, S.: Micronutrients in soils, crops, and livestock, Earth Science Frontiers, 15, 110–125, 2008.
Han, D. L., Huang, J. P., Ding, L., Zhang, G. L., Liu, X. Y., Li, C. Y., and Yang, F.: Breaking the Ecosystem Balance Over the Tibetan Plateau, Earth's Future, 10, https://doi.org/10.1029/2022EF002890, 2022.
Hänsch, R. and Mendel, R. R.: Physiological functions of mineral micronutrients (Cu, Zn, Mn, Fe, Ni, Mo, B, Cl), Current Opinion in Plant Biology, 12, 259-266, https://doi.org/10.1016/j.pbi.2009.05.006, 2009.
Hartmann, J., Moosdorf, N., Lauerwald, R., Hinderer, M., and West, A. J.: Global chemical weathering and associated P-release-The role of lithology, temperature and soil properties, Chemical Geology, 363, 145–163, https://doi.org/10.1016/j.chemgeo.2013.10.025, 2014.
Hartmann, M. and Six, J.: Soil structure and microbiome functions in agroecosystems, Nature Reviews Earth & Environment, 4, 4–18, https://doi.org/10.1038/s43017-022-00366-w, 2023.
Hinsinger, P.: Bioavailability of trace elements as related to root-induced changes in the rhizosphere, Trace Elements in the Rhizosphere, 25–41, https://doi.org/10.1201/9781420039993.ch2, 2000.
Hou, X. Y. (Ed.): Atlas of vegetation of China (), Science Press, Beijing, ISBN 978-7-03-008956-4, 2001.
Huo, H. Y., Gu, X. L., Li, J. Y., Yang, S. S., Wang, Y. F., and Ding, J. Z.: The gridded soil micronutrient (Fe, Mn, Zn, and V) maps for Tibetan Plateau, National Tibetan Plateau/Third Pole Environment Data Center [data set], https://doi.org/10.11888/Terre.tpdc.303242, 2026.
Jenny, H.: Factors of Soil Formation: A System of Quantitative Pedology, McGraw-Hill, New York, https://doi.org/10.1134/S1064229309120138, 1941.
Jones, G. D., Droz, B., Greve, P., Gottschalk, P., Poffet, D., McGrath, S. P., Seneviratne, S. I., Smith, P., and Winkel, L. H. E.: Selenium deficiency risk predicted to increase under future climate change, Proceedings of the National Academy of Sciences of the United States of America, 114, 2848–2853, https://doi.org/10.1073/pnas.1611576114, 2017.
Kabata-Pendias, A.: Trace elements in soils and plants, 4th Edn., CRC Press, Boca Raton, FL, USA, https://doi.org/10.1201/b10158, 2010.
Lara, M. C., Buss, H. L., and Pett-Ridge, J. C.: The effects of lithology on trace element and REE behavior during tropical weathering, Chemical Geology, 500, 88–1020, https://doi.org/10.1016/j.chemgeo.2018.09.024, 2018.
Larsson, M. A., Persson, I., Sjoestedt, C., and Gustafsson, J. P.: Vanadate complexation to ferrihydrite: X-ray absorption spectroscopy and CD-MUSIC modelling, Environmental Chemistry, 14, 141–150, https://doi.org/10.1071/EN16174, 2017.
Lehmann, J. and Kleber, M.: The contentious nature of soil organic matter, Nature, 528, 60–68, https://doi.org/10.1038/nature16069, 2015.
Loveland, P. and Webb, J.: Is there a critical level of organic matter in the agricultural soils of temperate regions: a review, Soil Tillage Research, 70, 1–18, https://doi.org/10.1016/S0167-1987(02)00139-3, 2003.
McLennan, S. M.: Weathering and global denudation, The Journal of Geology, 101, 295–303, https://doi.org/10.1086/648222, 1993.
Mesquita, M. E.: Copper and zinc competitive adsorption in schistic and granitic acid soils, Agrochimica, 42, 235–245, 1998.
Montgomery, D. R.: Soil erosion and agricultural sustainability, Proceedings of the National Academy of Sciences of the United States of America, 104, 13268–13272, https://doi.org/10.1073/pnas.0611508104, 2007.
Moreno-Jimenez, E., Plaza, C., Saiz, H., Manzano, R., Flagmeier, M., and Maestre, F. T.: Aridity and reduced soil micronutrient availability in global drylands, Nature Sustainability, 2, 371–377, https://doi.org/10.1038/s41893-019-0262-x, 2019.
Moreno-Jimenez, E., Maestre, F. T., Flagmeier, M., Guirado, E., Berdugo, M., Bastida, F., Dacal, M., Díaz-Martínez, P., Ochoa-Hueso, R., Plaza, C, Rillig, MC., Crowther, T. W., and Delgado-Baquerizo, M.: Soils in warmer and less developed countries have less micronutrients globally, Global Change Biology, 29, 522–532, https://doi.org/10.1111/gcb.16478, 2023.
Mu, C. C., Zhang, T. J., Zhao, Q., Guo, H., Zhong, W., Su, H., and Wu, Q.B.: Soil organic carbon stabilization by iron in permafrost regions of the Qinghai-Tibet Plateau, Geophysical Research Letters, 43, 10286–10294, https://doi.org/10.1002/2016GL070071, 2016.
Mu, C. C., Zhang, F., Mu, M., Chen, X., Li, Z. L., and Zhang, T. J.: Organic carbon stabilized by iron during slump deformation on the Qinghai-Tibetan Plateau, Catena, 187, 104282, https://doi.org/10.1016/j.catena.2019.104282, 2020.
Myers, S. S., Zanobetti, A., Kloog, I., Huybers, P., Leakey, A. D., Bloom, A. J., Carlisle, E., Dietterich, L. H., Fitzgerald, G., Hasegawa, T., Holbrook, N. M., Nelson, R. L., Ottman, M. J., Raboy, V., Sakai, H., Sartor, K. A., Schwartz, J., Seneweera, S., Tausz, M., and Usui, Y.: Increasing CO2 threatens human nutrition, Nature, 510, 139–142, https://doi.org/10.1038/nature13179, 2014.
Nesbitt, H. W. and Young, G. M.: Early Proterozoic climates and platemotions inferred frommajor element chemistry of lutites, Nature, 299, 715–717, https://doi.org/10.1038/299715a0, 1982.
Ochoa-Hueso, R., Plaza, C., Moreno-Jimenez, E., and Delgado-Baquerizo, M.: Soil element coupling is driven by ecological context and atomic mass, Ecology Letters, 24, 319–326, https://doi.org/10.1111/ele.13648, 2020.
O'Hara, G. W.: Nutritional constraints on root nodule bacteria affecting symbiotic nitrogen fixation: A review, Australian Journal of Experimental Agriculture, 41, 417-433, https://doi.org/10.1071/EA00087, 2001.
Pachauri, R. K., Allen, M. R., Barros, V. R., Broome, J., Cramer, W., Christ, R., Church, J. A., Clarke, L., Dahe, Q., and Dasgupta, P.: Climate change 2014: Synthesis report. Contribution of Working Groups I, II and III to the Fifth Assessment Report of the Intergovernmental Panel on Climate Change, IPCC, Geneva, Switzerland, 151 pp., ISBN 9789291691432, 2014.
Pan, J. X., Zhang, X. Y., Liu, S., Liu, N., Liu, M. J., Chen, C., Zhang, X. Y., Niu, S. L., and Wang, J. S.: Precipitation alleviates microbial C limitation but aggravates N and P limitations along a 3000-km transect on the Tibetan Plateau, Catena, 247, 108535, https://doi.org/10.1016/j.catena.2024.108535, 2024.
Piñeiro, G., Perelman, S., Guerschman, J. P., and Paruelo, J. M.: How to evaluate models:: Observed vs. predicted or predicted vs. observed? Ecological Modelling, 216, 316–322, https://doi.org/10.1016/j.ecolmodel.2008.05.006, 2008.
Potter, C. S., Randerson, J. T., Field, C. B., Matson, P. A., Vitousek, P. M., Mooney, H. A., and Klooster, S. A.: Terrestrial ecosystem production: A process model based on global satellite and surface data, Global Biogeochemical Cycles, 7, 811–841, https://doi.org/10.1029/93GB02725, 1993.
Prestele, R., Alexander, P., Rounsevell, M. D., Arneth, A., Calvin, K., Doelman, J., Eitelberg, D. A., Engström, K., Fujimori, S., Hasegawa, T., Havlik, P., Humpenoeder, F., Jain, A. K., Krisztin, T., Kyle, P., Meiyappan, P., Popp, A., Sands, R. D., Schaldach, R., Schuengel, J., Stehfest, E., Tabeau, A., Van Meijl, H., Van Vliet, J., Verburg, P. H.: Hotspots of uncertainty in landuse and landcover change projections: A globalscale model comparison, Global Change Biology, 22, 3967-3983, https://doi.org/10.1111/gcb.13337, 2016.
Quesada, C. A., Lloyd, J., Schwarz, M., Patiño, S., Baker, T. R., Czimczik, C., Fyllas, N. M., Martinelli, L., Nardoto, G. B., Schmerler, J., Santos, A. J. B., Hodnett, M. G., Herrera, R., Luizão, F. J., Arneth, A., Lloyd, G., Dezzeo, N., Hilke, I., Kuhlmann, I., Raessler, M., Brand, W. A., Geilmann, H., Moraes Filho, J. O., Carvalho, F. P., Araujo Filho, R. N., Chaves, J. E., Cruz Junior, O. F., Pimentel, T. P., and Paiva, R.: Variations in chemical and physical properties of Amazon forest soils in relation to their genesis, Biogeosciences, 7, 1515–1541, https://doi.org/10.5194/bg-7-1515-2010, 2010.
Schmidt, W., Thomine, S., and Buckhout, T. J.: Iron nutrition and interactions in plants, Frontiers in Plant Science, 10, 1670, https://doi.org/10.3389/fpls.2019.01670, 2020.
Simon, M. N.: Inductively Coupled Plasma Mass Spectrometry Handbook, Blackwell Publishing, Oxford, https://doi.org/10.1002/9781444305463, 2005.
Spinola, D., Portes, R., Fedenko, J., Lybrand, R., Dere, A., Biles, F., Trainor, T., Bowden, M. E., and D'Amore, D.: Lithological controls on soil geochemistry and clay mineralogy across Spodosols in the coastal temperate rainforest of southeast Alaska, Geoderma, 428, 116211, https://doi.org/10.1016/j.geoderma.2022.116211, 2022.
Stefan, B., Jiménez-Vicente, E., Echavarri-Erasun, C., and Rubio, L. M.: Biosynthesis of Nitrogenase Cofactors, Chemical Reviews, 120, 4919–5794, https://doi.org/10.1021/acs.chemrev.9b00489, 2020.
Stehfest, E., van Zeist, W. J., Valin, H., Havlik, P., Popp, A., Kyle, P., Tabeau, A., MasonD'Croz, D., Hasegawa, T., Bodirsky, B. L., Calvin, K., Doelman, J. C., Fujimori, S., Humpenoeder, F., Lotze-Campen, H., van Meijl, H., and Wiebe, K.: Key determinants of global landuse projections, Nature Communications, 10, 1–10, https://doi.org/10.1038/s41467-019-09945-w, 2019.
Thauer, P. K.: Methyl (Alkyl)-Coenzyme M Reductases: Nickel F-430-Containing Enzymes Involved in Anaerobic Methane Formation and in Anaerobic Oxidation of Methane or of Short Chain Alkanes, Biochemistry, 58, 5198–5220, https://doi.org/10.1021/acs.biochem.9b00164, 2019.
Tian, L. M., Zhao, L., Wu, X. D., Hu, G. J., Fang, H. B., Zhao, Y. H., Sheng, Y., Chen, J., Wu, J. C., Li, W. P., Ping, C.L., Pang, C. L., Pang, Q. Q., Liu, Y., Shi, W., Wu, T. H., and Zhang, X. M.: Variations in soil nutrient availability across Tibetan grassland from the 1980s to 2010s, Geoderma, 338, 197–205, https://doi.org/10.1016/j.geoderma.2018.12.009, 2019.
Trabucco, A. and Zomer, R. J.: Global Aridity Index and Potential Evapo-Transpiration (ET0) Climate Database v2, CGIAR Consortium for Spatial Information (CGIAR-CSI) [data set], https://cgiarcsi.community (last access: 5 February 2024), 2018.
Van, E., Fendrich, A. N., Ballabio, C., and Panagos, P.: Spatial assessment of topsoil zinc concentrations in Europe, Science of the Total Environment, 892, 164512, https://doi.org/10.1016/j.scitotenv.2023.164512, 2023.
White, P. J. and Broadley, M. R.: Biofortifying crops with essential-mineral elements, Trends in Plant Science, 10, 586-593, https://doi.org/10.1016/j.tplants.2005.10.001, 2005.
Yao, T. D., Thompson, L. G., Mosbrugger, V., Zhang, F., Ma, Y. M., Luo, T. X., Xu, B. Q., Yang, X. X., Joswiak, D. R., Wang, W. C., Joswisk, M. E., Devkota, L. P., Tayal, S., Jilani, R., and Fayziev, R.: Third Pole Environment (TPE), Environmental Development, 3, 52–64, https://doi.org/10.1016/j.envdev.2012.04.002, 2012.
Yoo, K., Amundson, R., Mudd, S. M., Sanderman, J., Amundson, R., and Blum, A.: Spatial patterns and controls of soil chemical weathering rates along a transient hillslope, Earth and Planetary Science Letters, 288, 184–193, https://doi.org/10.1016/j.epsl.2009.09.021, 2006.
Yu, Y. F., You, Q. L., Zhang, Y. Q., Jin, Z., Kang, S. C., and Zhai, P. M.: Integrated warm-wet trends over the Tibetan Plateau in recent decades, Journal of Hydrology, 639, 131599, https://doi.org/10.1016/j.jhydrol.2024.131599, 2024.
Zhang, H., Wang, Z. F., Zhang, Y. L., and Hu, Z. J.: The effects of the Qinghai-Tibet railway on heavy metals enrichment in soils, Science of the Total Environment, 439, 240–280, https://doi.org/10.1016/j.scitotenv.2012.09.027, 2012.