the Creative Commons Attribution 4.0 License.
the Creative Commons Attribution 4.0 License.
 | 27 Feb 2026
A 30 m spatial resolution dataset of ecosystem services in China for 2000, 2010, and 2020
Yue Liu
Zhijie Zhang
Jingyi Ding
Lixin Wang
Ecosystem services are the various benefits provided by ecosystems to humans, establishing a crucial link between the natural environment and human well-being. High-resolution ecosystem service datasets can provide more detailed and accurate information, enabling the identification of site-specific differences at local scales. In this study, we produced a high spatial resolution dataset of ecosystem services in China for the years 2000, 2010, and 2020, simulated using ecological process models. Model parameters were calibrated based on literature summaries, ground monitoring data, and reconstructed remote sensing data. The dataset, with a spatial resolution of 30 m, includes net primary productivity, soil conservation, sandstorm prevention, and water yield. The validation results show high consistency between this ecosystem services dataset and both in situ observations and existing datasets. Among the three decades (2000, 2010, and 2020), the overall trends for net primary productivity, soil conservation, and sandstorm prevention in China showed a weak increase, while water yield decreased during this period. This high-precision dataset provides a valuable scientific foundation for accurately assessing the provision of ecosystem services and supports evidence-based government decision-making. The dataset is made available at https://doi.org/10.57760/sciencedb.20797 under a CC-BY 4.0 license (Liu et al., 2025).
- Article
(10409 KB) - Full-text XML
-
Supplement
(1103 KB) - BibTeX
- EndNote


Ecosystem services are the benefits humans gain directly or indirectly from ecosystems (Costanza et al., 1997) and serve as the foundation for human survival and development. Their supply holds great significance for ensuring human well-being. According to the Millennium Ecosystem Assessment (MEA), ecosystem services can be categorized into provisioning services, regulating services, supporting services, and cultural services (Millennium Ecosystem Assessment, 2005). At present, the resolution of most ecosystem service datasets is 250 m or 1 km (Ouyang et al., 2016; Feng et al., 2012; IPBES, 2019a). Although these datasets can provide valuable insights into large-scale ecosystem trends, studies on the localized impact of human activities, such as deforestation, urban expansion, agricultural intensification, and mining, require more detailed spatial and temporal information (Zhang et al., 2023; Hansen et al., 2013; Wu et al., 2024). This limitation also affects the ability to evaluate the effectiveness of measures such as protected area construction and ecological engineering implementation (Liu et al., 2023; Liu et al., 2024). Thus, high-resolution and long-term ecosystem service datasets are highly needed to support more effective ecosystem management and protection policies.
Accurate ecosystem service assessment relies heavily on high-quality data. However, detailed studies on ecosystem impacts caused by human activities remain constrained due to the insufficient availability of high-resolution and long-term datasets. Land cover is the foundation of ecosystem service assessment, and the land cover changes directly impact the accuracy of these assessments (Costanza et al., 2017). Currently, due to data consistency issues, the land cover data used in ecosystem service assessment varies significantly. Examples include the European Space Agency Climate Change Initiative Land Cover Dataset (Peng et al., 2023), the Moderate Resolution Imaging Spectroradiometer (MODIS) Land Cover Dataset (Zhao and Running, 2010), and the Landsat Dataset (Mugiraneza et al., 2019). However, these datasets still have limitations in terms of resolution and consistency. The GlobelLand 30 dataset is among the highest-resolution and most accurate global land cover datasets available (Chen et al., 2015). It represents a significant resource for global land cover research and applications. This dataset covers the world, ensuring data consistency and high accuracy, making it suitable for detailed ecosystem service assessments (Chen et al., 2015). Furthermore, most existing ecosystem service datasets lack sufficient temporal resolution to support long-term assessments. Addressing these challenges by developing ecosystem service datasets with both high spatial resolution and long temporal resolution based on the GlobeLand30 dataset would significantly enhance the precision and applicability of ecosystem service assessments. This will improve our understanding and management of human impacts on ecosystems, providing a robust scientific foundation for policy-making and environmental protection (Li et al., 2023a; Chen et al., 2017a).
The global ecosystem service dataset primarily comes from the Intergovernmental Science-Policy Platform on Biodiversity and Ecosystem Services (IPBES) global ecosystem service assessment (IPBES, 2019a). The IPBES assessments provide a comprehensive scientific basis for understanding the current state and changes in global ecosystem services (IPBES, 2019b). Although these data offer extensive coverage, their infrequent update poses significant challenges in meeting the demands of long-term research (Díaz-Reviriego et al., 2019). In China, the main sources of ecosystem service data are the studies conducted by Ouyang et al. (2016). Their research provides a solid foundation for the quantitative evaluation of ecosystem services (Ouyang et al., 2016). However, most of their data focuses on the period around 2010 and lacks recent updates, limiting the comprehensive understanding of dynamic changes in ecosystem services. Similarly, contributions from Fang et al. (2018) are significant, but their datasets also suffer from discontinuity and infrequent updates (Fang et al., 2018). This inconsistency and lack of long-term updates severely limit the study of ecosystem services changes over time. Due to the lack of continuous data, it is currently challenging to accurately assess the combined impacts of land cover and climate change on ecosystem services over recent decades (Xu et al., 2017). Long-term data are crucial for understanding the dynamic changes in ecosystem services, identifying driving factors, and formulating effective environmental protection policies (Wang et al., 2024, 2022). To address this issue, there is a need to develop high-resolution, long-term sequence ecosystem service datasets. This development will enhance the precision and applicability of ecosystem service assessments, helping scientists better understand and manage the impacts of human activities on ecosystems.
Verification of ecosystem service data is crucial for ensuring data quality, supporting scientific research, and informing policy-making (Jiang et al., 2021). The primary methods for validating ecosystem service data include cross-validation, error analysis, controlled experiments, and field observations. Cross-validation involves comparing results with different remote sensing data sources to ensure consistency (e.g., comparing the results with remote sensing data sets from different sources) (Feng et al., 2016). Error analysis assesses random errors and systematic errors (e.g., sensor calibration corrections) (Richardson et al., 2006; Zhang et al., 2023). Controlled experiments, both in the field and laboratory (e.g., measuring soil moisture under various management practices), ensure data accuracy and consistency (Bockheim and Gennadiyev, 2009). Additionally, comparing model predictions with measured data (e.g., carbon stock predictions from carbon cycle models versus field measurements) (Le Noë et al., 2023) and sensitivity analyses (e.g., assessing the impact of parameter changes on carbon stock predictions) further verify data accuracy and stability (Hooper et al., 2017). Several limitations, including insufficient field observations, heterogeneous data sources, and a lack of robust cross-validation methods, constrain current methods for data validation. These shortcomings undermine the reliability and applicability of ecosystem service assessments, particularly in the context of complex and dynamic ecosystems. Consequently, the development of more accurate and comprehensive validation methods is crucial for improving the precision of the ecosystem service dataset.
This study integrated various datasets, such as remote sensing, in situ observations, and primary literature, to obtain key parameters for ecosystem services. We used a series of models with clear mechanisms and data support from previous research. By incorporating and utilizing the GlobelLand 30 dataset, this study achieves higher-resolution assessments of ecosystem services in China, covering four key MEA-classified services: net primary productivity (NPP), classified as a supporting service, provides the foundation for biomass production and carbon cycling; soil conservation and sandstorm prevention, both regulating services, play a crucial role in mitigating land degradation, controlling erosion, and maintaining environmental stability; water yield, also a regulating service, is essential for sustaining hydrological cycles and ensuring water resource availability. This high-resolution dataset is valuable for assessing carbon sink capacity, mitigating global ecological risks such as land degradation and water scarcity, and providing scientific support for the implementation of ecological compensation mechanisms, land-use planning optimization, and the sustainable development of regional ecological economies (Ouyang et al., 2016). The aims of this work are (1) to construct the assessment models and datasets, (2) to map the ecosystem services in China, (3) to verify the ecosystem services data, and (4) to explore the ecosystem service dynamics.
The temporal and spatial patterns of China's ecosystem services are analyzed across 34 provincial administrative regions, including 23 provinces (Hebei, Shanxi, Liaoning, Jilin, Heilongjiang, Jiangsu, Zhejiang, Anhui, Fujian, Jiangxi, Shandong, Henan, Hubei, Hunan, Guangdong, Hainan, Sichuan, Guizhou, Yunnan, Shaanxi, Gansu, Qinghai, Taiwan), five autonomous regions (Inner Mongolia, Guangxi, Tibet, Ningxia, Xinjiang), four municipalities directly under the central government (Beijing, Tianjin, Shanghai, Chongqing), and two special administrative regions (Hong Kong, Macau), as shown in Fig. 1.
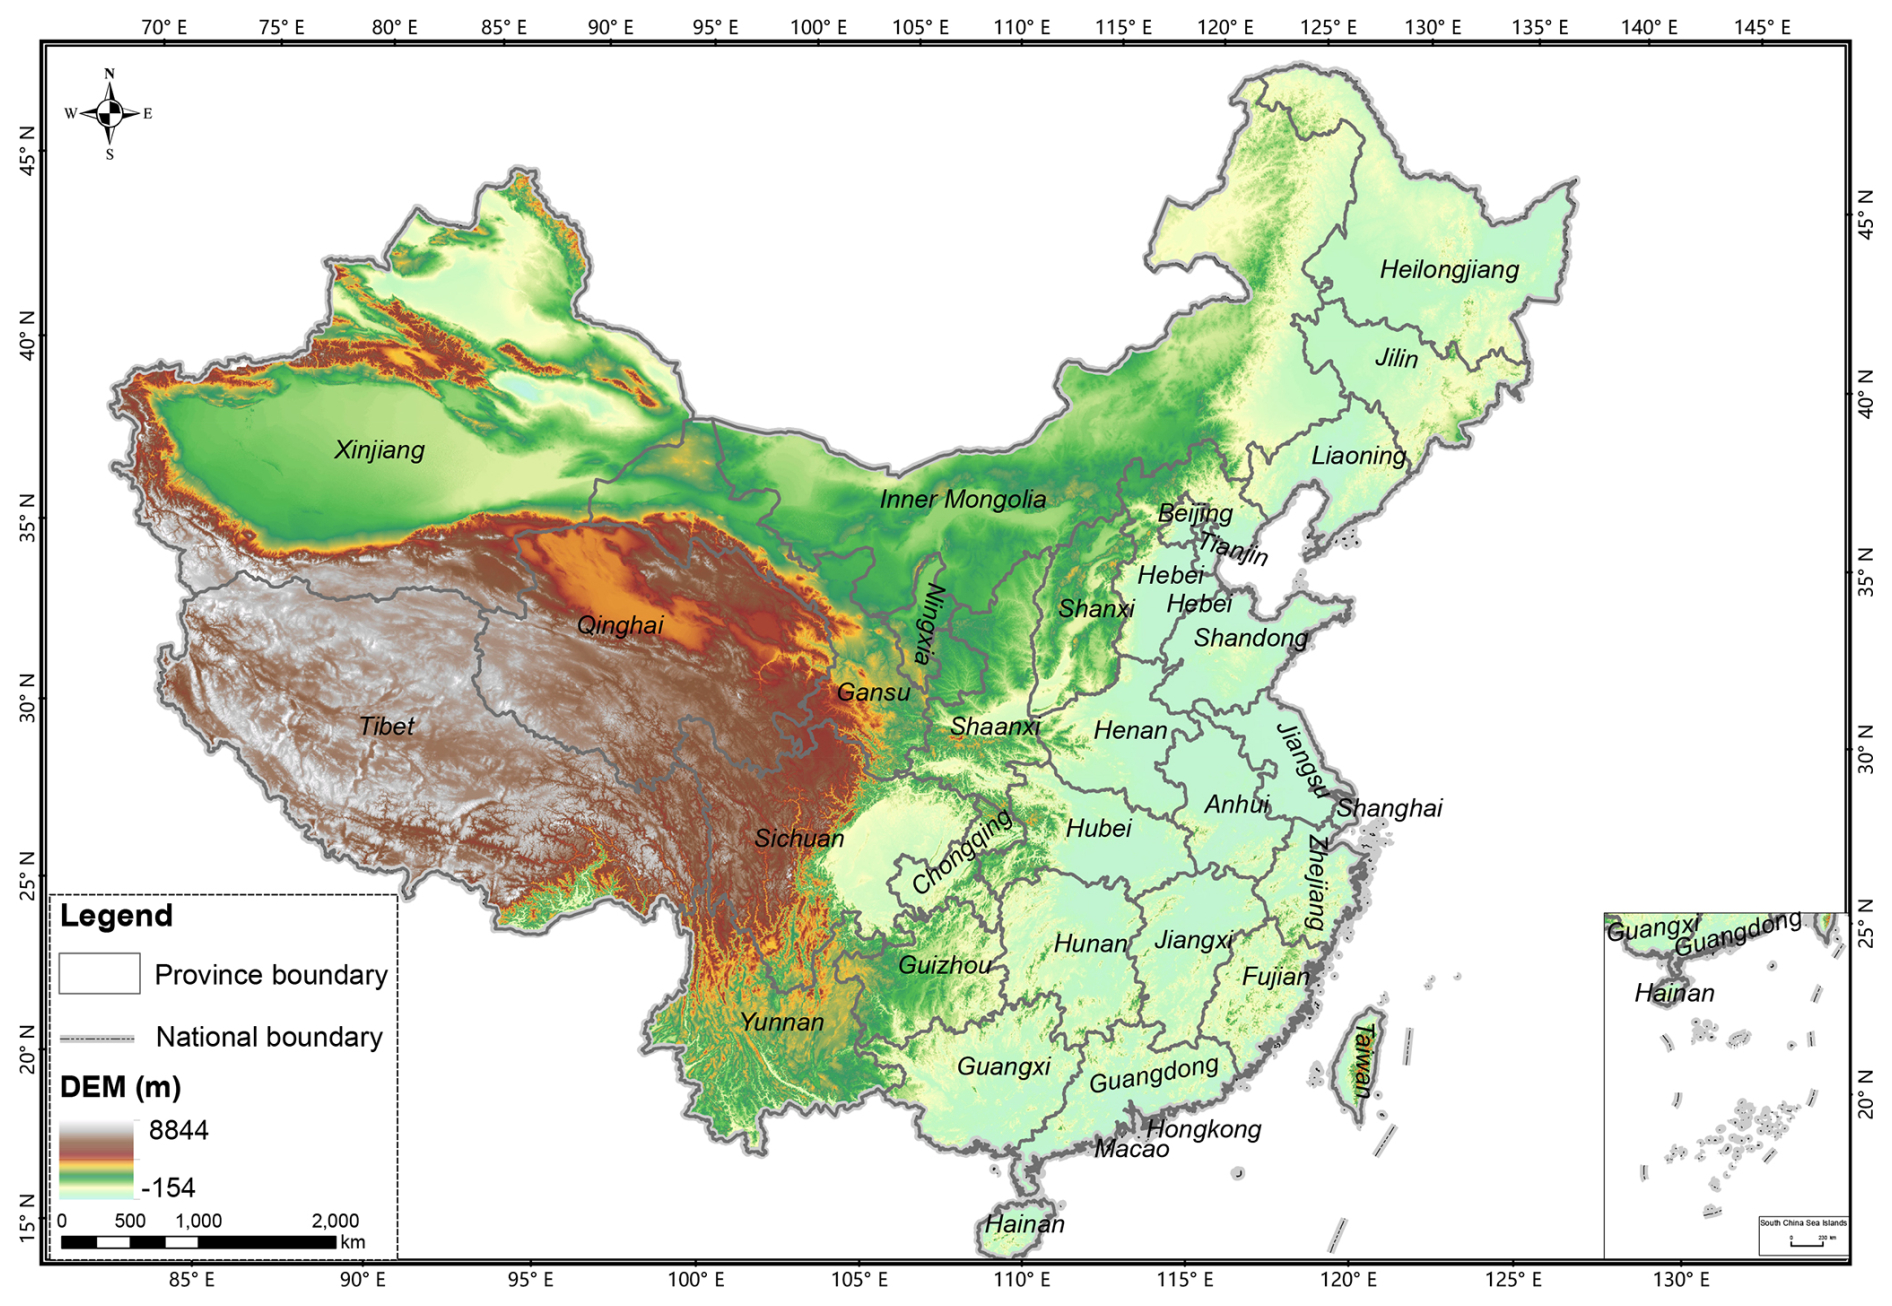
Figure 1The study area.
3.1 Ecosystem services assessment parameters and localization processing
This study uses the Carnegie-Ames-Stanford Approach (CASA) model, the Revised Universal Soil Loss Equation (RUSLE) model, the Revised Wind Erosion Equation (RWEQ) model, and the Integrated Valuation of Ecosystem Services and Tradeoffs (InVEST) model to assess the net primary productivity, soil conservation, sandstorm prevention, and water yield of China.
The models and input data were based on the following principles: (1) Widely used of the models: The selected models (e.g., CASA, RUSLE) are well-established within the field of ecosystem service assessment. Their principles are mature and have been extensively validated in applications at global and regional scales, which facilitates the comparison of our results with existing studies. (2) Data availability and model compatibility: The selected models are compatible with the multi-source remote sensing, meteorological, soil, and topographic data collected for this study, ensuring the feasibility of the assessment. (3) Suitability for spatially explicit assessment: All models are capable of spatially explicit calculation, which allows them to fully utilize the 30 m high-resolution spatial data to generate detailed distribution maps, meeting the accuracy requirements for refined management and policy formulation. The application of these models at this fine resolution is well-supported by previous studies. The CASA model has been successfully applied to estimate China's land net primary productivity (NPP) data with high accuracy (Sun et al., 2021; Zhang et al., 2023). Similarly, both the RUSLE and RWEQ models have been successfully applied at high resolution for soil erosion and sandstorm prevention mapping, respectively, demonstrating their suitability for high-resolution assessment (Zong et al., 2025; Yan et al., 2025). The InVEST has proved to be suitable for large-scale water yield assessment in China (Yin et al., 2020). This capability meets the accuracy requirements for refined management and policy formulation.
The methods and datasets for assessing the four ecosystem services are shown in the Supplement and Table 1. In this study, the datasets were projected to the Albers projection and resampled to a 30 m resolution to standardize the data (Liu et al., 2023).
3.1.1 Net primary productivity
Based on the nationally adapted CASA model (Zhu, 2005), this study calculated monthly net primary productivity (NPP) and summed these monthly values to obtain the annual NPP. Based on high-precision remote sensing data, this study localized the maximum and minimum values of NDVI and SR, as well as the maximum light use efficiency (εmax) specific to various landcover types.
-
Normalized Difference Vegetation Index (NDVI). NDVI is an important parameter for estimating the absorbed photosynthetically active radiation (APAR) by vegetation (Jiao et al., 2021), and the accuracy of NPP mostly depends on the values of NDVIi,min and NDVIi,max.
Following Zhu's method, GlobeLand 30 data were used as a mask to extract the NDVI of each land cover using ArcGIS10.3 software. According to the pixel NDVI distribution probability, the corresponding DN (Digital Number) values of NDVI 95% and 5% were selected as the NDVIi,max and NDVIi,min, respectively (Table S1).
-
Simple Ratio Vegetation Index (SR). SR is a common vegetation index used to assess the amount of vegetation, and the details are shown in Eq. S6. We extracted the SR values for each landcover type based on GlobeLand30 data. According to the pixel SR distribution probability, the corresponding DN values of SR 95 % and 5 % were selected as the SRi,max and SRi,min, respectively.
-
Maximum light use efficiency (εmax). The εmax in this study was determined in three steps. First, this study calculated the APAR, temperature, and moisture stress for all pixels. Next, the measured NPP data were sourced from the National Ecosystem Research Network of China during the same period. Finally, the εmax values for each land cover were simulated based on the principle of minimizing error. For a certain land cover from the GlobeLand30 dataset, the error between the measured and the simulated NPP can be expressed by the following formula:
where i and j are the number of samples and the maximum number of samples of a certain landcover, respectively. m and n are the measured NPP and the product of APAR, temperature, and moisture stress, respectively. x is the simulated εmax of a certain landcover. l and u are the maximum and minimum εmax of land cover. Equation (1) represents an upward-opening parabola, which guarantees the existence of a minimum value within the interval [l,u]. The corresponding x value at this minimum point represents the simulated εmax value for a certain land cover (Table S1 in the Supplement).
3.1.2 Soil conservation
The Revised Universal Soil Loss Equation (RUSLE) model is widely used for large-scale soil conservation assessment at regional and global scales (Benavidez et al., 2018) due to its simple structure and empirical basis. It mainly estimated the annual average soil conservation based on five factors, namely, rainfall erosivity factor (R factor), vegetation cover and management factor (C factor), soil erodibility factor (K factor), slope length factor (LS factor), and soil and water conservation measure factor (P factor).
-
R factor. The R factor is mainly affected by the intensity of continuous rain. In this study, the R factor was calculated according to the empirical equation (Eq. S14) of Wischmeier and Smith (1978). The monthly precipitation data obtained from the National Earth System Science Data Center were resampled to 30 m spatial resolution using ArcGIS10.3 software.
-
C factor. The C factor represents how varying vegetation cover and management practices influence soil conservation (S19). Vegetation coverage (Cov) was calculated using NDVI, and the calculation is expressed by the following formula:
where NDVImax and NDVImin are the DN values of NDVI 95 % and 5 %, respectively.
-
K factor. The K factor represents soil sensitivity to erosion from raindrop splash or surface runoff, influenced by rainfall, runoff, and infiltration. This study used the method developed by Williams et al. (1984) to estimate the K factor in the EPIC (erosion-productivity impact calculator) model (Eq. S15). The soil properties data used in this model (SoilGrids250m v2.0) were from the International Soil Reference and Information Centre (ISRIC), and resampled to a 30 m spatial resolution.
-
LS factor. The LS factor reflects the relationship between slope and terrain conditions and is essentially the distance over which raindrops or sediment flow until their energy is dissipated. The slope length factor (L factor) was calculated using the algorithm proposed by Delgado et al. (2024) (Eq. S16). The slope factor (S factor) was determined using different formulas depending on the slope range: for slopes below 10°, it was calculated using the formula proposed by McCool et al. (1987), and for slopes above 10°, the formula see the Eq. (S18).
-
P factor. The P factor is the ratio of soil loss after adopting specific measures to the soil loss when planting along the slope, reflecting the differences in soil loss due to various vegetation management measures. Since field experiments were not conducted and remote sensing methods are challenging to apply nationwide, this study assigns P factor values based on landcover classifications, as derived from relevant literature (Table S2).
3.1.3 Sandstorm prevention
The Revised Wind Erosion Equation (RWEQ) model includes five factors, namely the soil erodibility factor (SEF), the soil crust factor (SCF), the vegetation factor (C), the soil roughness factor (K′), and the weather factor (WF).
-
Soil erodibility factor (SEF). The SEF factor reflects the soil's vulnerability to wind erosion under specific physical and chemical conditions. In this study, the SEF factor was calculated based on the relationship between soil physical and chemical properties and soil erodibility, as established by Fryrear et al. (1994). The formula can be found in Eq. (S29). The soil properties data used in this model come from ISRIC and were resampled to a 30 m spatial resolution.
-
Soil crust factor (SCF). The presence of soil crusts effectively reduces the content of erodible particles and diminishes the abrasive effect of airflow on soil particles (Zobeck et al., 2000). Hagen (1991) developed the equation for the SCF based on wind tunnel tests of soils with different physical and chemical properties (Eq. S30). This study applies this equation to calculate the SCF. The source and processing method of soil properties data is the same as that of SEF.
-
Vegetation factor (C). C factor is essential for soil protection against wind erosion by covering the surface, increasing surface roughness, and aiding in the deposition of moving particles. The vegetation factor includes two parameters: vegetation cover (Cov) and the coefficient of different vegetation types. The calculation of Cov is provided in Eq. (2), while the coefficient is set based on related literature.
-
Soil roughness factor (K'). K′ factor indicates how terrain-induced surface roughness influences wind erosion and is primarily derived from DEM data processed in ArcGIS10.3 software (Eq. S31).
-
Weather factor (WF). The WF factor represents the combined effect of various meteorological factors on wind erosion, with wind being the primary driving force. The WF factor is determined by three indicators: wind factor (Wf), soil moisture factor (SW), and snow cover factor (SD).
The Wf data were sourced from ECMWF Reanalysis v5 (ERA5), and relevant processing was completed on the GEE platform. SW was calculated from potential evapotranspiration and precipitation data. SD data were derived by aggregating 500 m observations from the MODIS/Terra Snow Cover Daily L3 Global 500 m Grid' dataset. All the datasets were resampled to a 30 m resolution using ArcGIS10.3 software.
3.1.4 Water yield
The water yield data of China (2000–2020) were obtained by merging the data from individual watersheds, and these watershed data were from the Ministry of Water Resources (China) (http://www.mwr.gov.cn/, last access: 1 January 2025).
-
Precipitation. The annual average precipitation data comes from the National Earth System Science Data Center (https://www.geodata.cn/, last access: 1 January 2025) with 1000 m pixel resolution. These data were resampled to 30 m and clipped into small watersheds according to the watershed vector.
-
Potential evapotranspiration. The MOD16A2 dataset provides 8 d composite data on evapotranspiration/latent heat flux at 500 m pixel resolution. This study calculated the annual average potential evapotranspiration data, resampled them to 30 m, and clipped them to obtain the potential evapotranspiration of the separate watersheds.
-
Plant available water content (PAWC). PAWC represents the fraction of total soil water content that is accessible for plant growth. It is typically calculated using the following formula:
where FC and PWP are the field capacity and permanent wilting point, respectively. The PAWC can be estimated based on soil properties, as detailed in Eq. (S40). The soil properties data come from the SoilGrids dataset, which has a resolution of 250 m. In this study, it has been resampled to 30 m and clipped according to the watershed.
-
Rooting depth. Rooting depth refers to the actual depth that the roots of various plants can reach across different land cover. In this study, we have obtained the rooting depth parameters in each land cover by combining findings from the literature and existing materials. The detailed information is in the Table S4.
-
Available water content (AWC). AWC of the soil (mm) depends on soil properties and effective depth, determining its water storage and supply for plant growth. It is influenced by PAWC, as well as the maximum soil root depth and the plant's minimum root depth.
-
Z value. The seasonal parameter Z is an empirical constant that reflects the regional distribution of precipitation and hydrogeological factors. Donohue et al. (2012), through their study of Australia's climatic conditions, found that the seasonal parameter Z can be expressed as Eq. (4). Although this formula originated from Australia, its foundation lies in the globally universal ecological hydrological principle of the water-energy trade-off. Moreover, the extensive climatic gradients spanned by Australia – from humid to arid regions – closely mirror the diverse conditions found across China, thereby providing a robust empirical basis for its application in our study.
where N represents the number of rainfall events per year. Based on the daily precipitation data from the National Meteorological Administration for 2000, 2010, and 2020, the average annual precipitation was assigned a value N, and the seasonal parameters of the study area were calculated accordingly.
-
Evapotranspiration coefficient (Kc). Kc is the evapotranspiration coefficient for each landcover type, and it estimates plant evapotranspiration for landcover.
where Kcm is the average plant evapotranspiration coefficient in month m (January to December), and ET0 m is the potential evapotranspiration in month m. In this study, we utilized the methodology based on the vegetation evapotranspiration coefficients for different growth stages published by FAO-56 (Allen, 2000). Through a comprehensive literature review and analysis of statistical yearbook data, this study identified the most widely distributed vegetation types across various land cover types in China. Subsequently, the average evapotranspiration coefficients for these vegetation types over their whole life cycles were calculated. The mean of the coefficients of the different vegetation types within that category then represented the evapotranspiration coefficient for each land cover.
The main input parameters of the four models are shown in Table 1, and all remote sensing data were resampled to a resolution of 30 m.
Table 1Assessment model and input data used in this study.
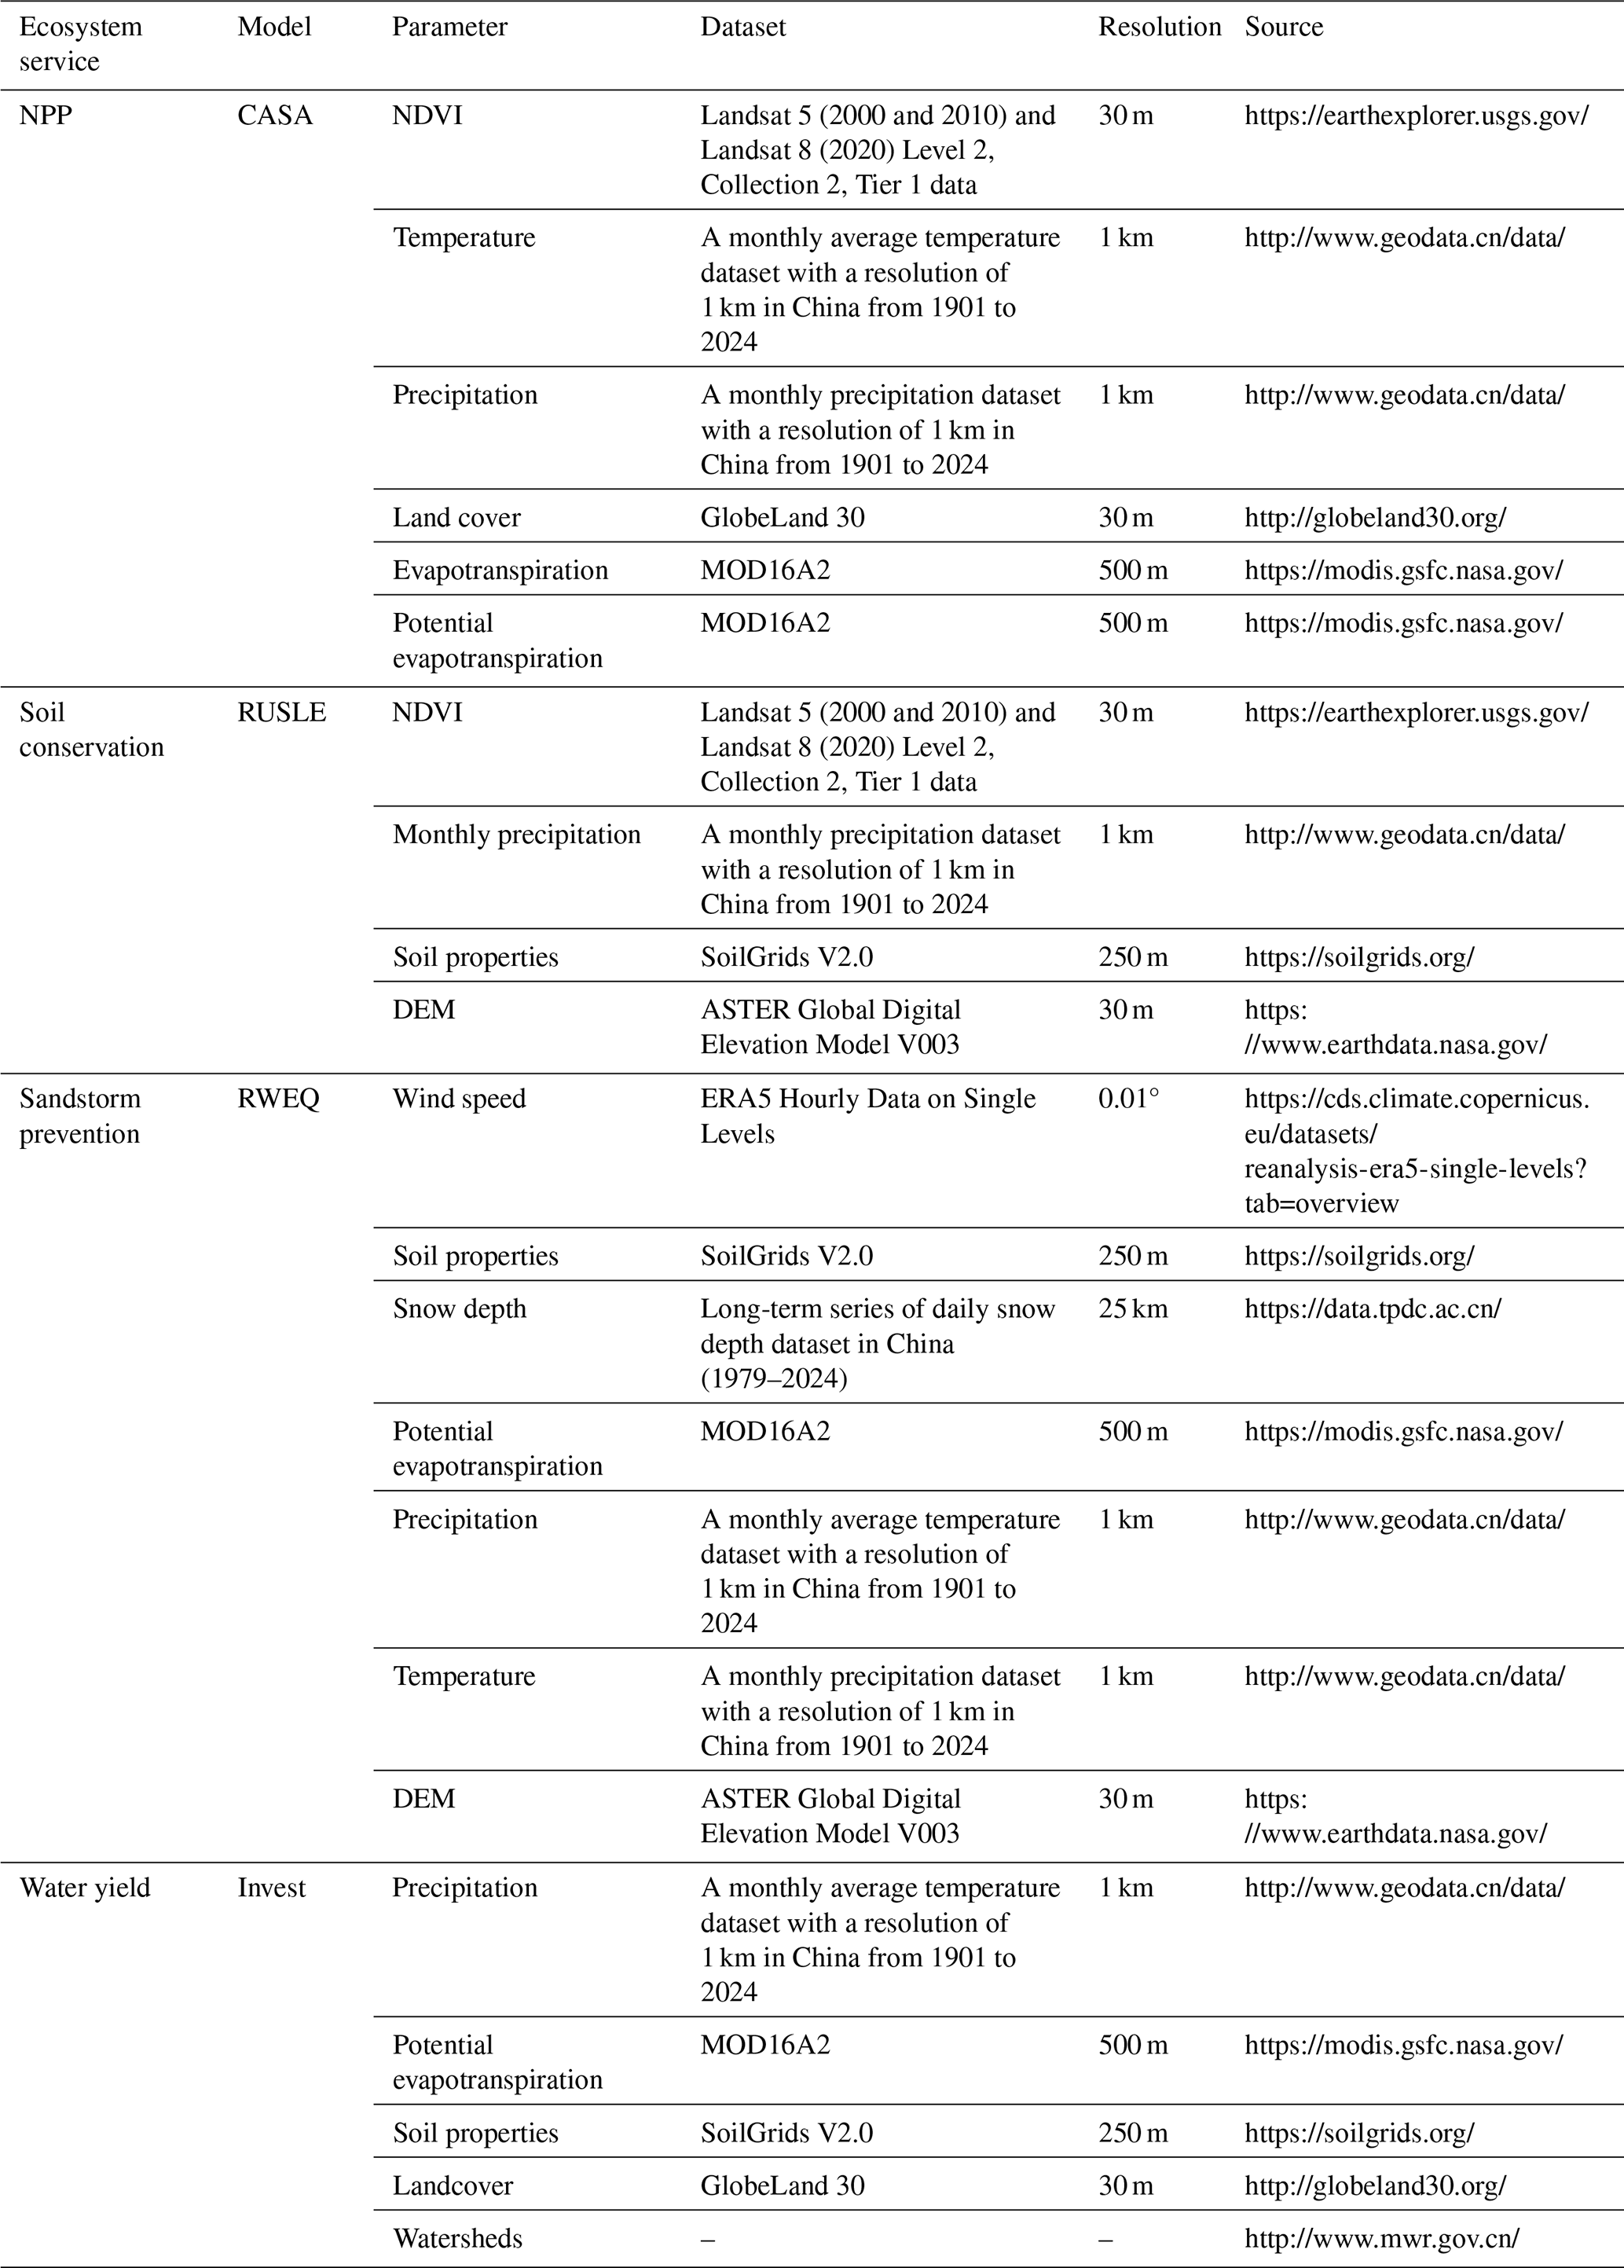
All links in this table were last accessed on 1 January 2025.
3.2 Data processing
3.2.1 Landsat data
Landsat data provide a more extended time series with a 30 m pixel resolution, with NDVI derived from Landsat 5 TM for 2000 and 2010, and Landsat 8 OLI for 2020. This study also adjusted the radiometric discrepancies between Landsat 5 and Landsat 8 sensors (Zhang et al., 2023) because of their different spectral response functions (Markham and Helder, 2012).
NDVI was calculated in Google Earth Engine (GEE) using Landsat 5 and 8 Level 2, Collection 2, Tier 1 data, specifically utilizing the red, near-infrared, and quality evaluation (QA) bands. The time-series datasets were processed through three stages: (1) cloud masking, (2) reflectance calibration, (3) mosaic, reproject, and clip. Cloud, snow, and shadow pixels were identified as low-quality pixels, and the image was masked using its QA layer. A scaling factor (Eq. 6) was used to adjust the surface reflectance and surface temperature outputs before utilizing the data (Markham and Helder, 2012). To correct the surface reflectance data for Landsat 5 and 8, this study used the robust and verifiable correction approach (Eq. 7) (Anderson et al., 2020). The Landsat 5 and 8 datasets were merged, and NDVI was calculated for each collected image (Eq. 8). Finally, monthly and quarterly NDVI datasets were generated.
where OpticalBands, SR_B, TM, and OLI refer to the corrected bands, the visible spectrum bands, Landsat 5 data, and Landsat 8 data, respectively. BNIR and BRED represent the near-infrared band and red band of images, respectively.
Vegetation coverage was calculated using Eq. (2), and NDVI and vegetation coverage mapping were then merged to cover China. The sinusoidal projection was transformed into the Albers projection, which is more suitable for large east-west-oriented areas at mid-latitudes.
3.2.2 MODIS data
Evapotranspiration, potential evapotranspiration, and snow cover datasets used in this study were MODIS Level-2 products that adopt temporal registration, providing data with the same spatial resolution and covering the same geographic area.
This study identified and reconstructed the low-quality pixels of the MODIS images. Data reconstruction involves two main steps: filtering and restoration. Low-quality and missing pixels were identified as invalid and required reconstruction (Wan, 2014). This study used quality control labels from daily and monthly files as mask layers to detect low-quality pixels, ensuring the reliability of the remote sensing data. Monthly evapotranspiration data grid cells marked with “MODLAND_QC bits = 0”, and “Cloud state =0” in the ET_QC Bitmask layer are classified as high-quality data, with other pixels considered low-quality pixels and set to missing values. This study initially identified invalid pixels in 8 d evapotranspiration images for each day of the month at the same locations and then reconstructed these invalid daily pixels. The process of reconstructing invalid pixels involves three steps: (1) filling the invalid pixels with co-located in situ observations when available; (2) using geographically weighted regression (GWR) to interpolate invalid pixels when in situ data is absent, based on similar pixels from multiple sources; and (3) filling the remaining invalid pixels with data from the same month in adjacent years.
Then, these products were composited for eight days, so this study obtained monthly products by calculating the mean of the data for that month. Finally, the MODIS Reprojection Tool (MRT) was used to mosaic, reproject, and resample the MODIS data to 30 m to be consistent with the NDVI data.
3.2.3 Supplementary data
As one of the high-precision global land cover datasets, GlobeLand30 achieves an overall accuracy of over 80.33 %, providing detailed ground cover information (Chen et al., 2017b). The national-scale independent verification conducted in China (GlobeLand30 2010) indicated that its overall accuracy was 82.39 % (Yang et al., 2017). Due to errors in the remote sensing sensors, slight offsets were observed in the 2020 data. This study used the ArcGIS10.3 software to correct the offset, mosaic, and reproject the GlobeLand30 data.
Temperature, precipitation, soil properties, and digital elevation model data were mosaicked, reprojected, and resampled to 30 m. Solar radiation and wind speed were obtained, reprojected, and resampled in GEE. In situ observation data were retrieved from the China Meteorological Administration (https://www.cma.gov.cn/, last access: 1 January 2025).
4.1 Validation
We have developed an indirect cross-validation framework that integrates multiple dataset sources and land cover stratification. The framework systematically leverages diverse, authoritative proxy datasets to triangulate the reliability of the simulations from multiple perspectives, thereby minimizing dependence on any single observational source. Beyond multi-source datasets, we stratify all evaluations by land cover class (e.g., cropland, forest, grassland, shrubland, and barren), enabling class-specific accuracy diagnostics and revealing class-dependent biases that might be masked in aggregate assessments.
This study utilized simulated Net Primary Productivity (NPP) data and existing remote sensing datasets for cross-validation, addressing the scarcity of large-scale biomass monitoring data. Spawn and Gibbs (2020) provided a global 300 m resolution map of aboveground and belowground biomass carbon density for 2010. This dataset was rigorously validated and quality assessed by its original producers. This study randomly generated 2000 points on the map of China and extracted the values of the simulated NPP and Spawn's datasets in 2010. This study then performed a correlation analysis, with the results shown in Fig. 2a. In addition, the NPP estimated in this study is multi-year monthly data, this study separately cross-validates the NPP for multiple years with remote sensing datasets (MODIS/Terra Net Primary Production Gap-Filled Yearly L4 (MOD17A3HGF) (Fig. 2b), Global Primary Production Data Initiative (GPPDI) (Fig. 2c), and Resource and Environment Science and Data Center (RESDC) (Fig. 2d). The results show that the NPP simulated by the CASA model have good consistency with the available biomass carbon density and NPP datasets.

Figure 2Validation of the NPP in this study, (a) the aboveground biomass and NPP of China in 2010, (b) the NPP estimated in this study and MODIS/Terra Net Primary Production Gap-Filled Yearly L4 (MOD17A3HGF), (c) the NPP estimated in this study and Global Primary Production Data Initiative (GPPDI) NPP data, (d) the NPP estimated in this study and Resource and Environment Science and Data Center (RESDC) NPP data.
Despite the overall agreement shown in Fig. 2, differences with other datasets are expected because the compared products diverge in concepts, algorithms, inputs, and scales. Our dataset estimates net primary productivity (NPP), whereas the biomass map of Spawn and Gibbs. (2020) represents carbon stocks for 2010; stock flux comparisons are sensitive to assumptions about disturbance, harvest, and turnover. CASA model and MOD17A3HGF use different light-use-efficiency parameterization algorithms and environmental data (temperature and precipitation). GPPDI and RESDC further rely on distinct input data and modeling frameworks, which can lead to systematic offsets. Input data also vary (meteorological data, land cover maps, soil/terrain), and the spatial resolution is mismatched (30 m in this study and 1000 m for several products), so resampling and mixed pixels cause scale effects. NPP shows a clear land cover class-dependence (Fig. S2). In croplands, strong management signals – such as irrigation, multiple cropping, fertilization, and harvest – are imperfectly captured by generic drivers, resulting in a larger scatter and mismatch. In forests, NDVI saturation and topographic illumination in complex terrain dampen high values and flatten slopes, while differences in disturbance and turnover assumptions add bias. Grasslands are governed by water limitation, so errors in precipitation forcings and residual cloud/snow contamination mainly affect the low-value range. Shrublands show the best agreement, likely because disturbance is weaker and the simulated NPP and NPP products' response is closer to linear. In barren lands, sparse vegetation also avoids NDVI saturation, preserving a near-linear radiometric–productivity relationship that reduces slope dampening seen in dense forests. Moreover, the extensive homogeneous patches in these areas ensure higher land cover purity at 30 m resolution, weakening mixed-pixel and misclassification effects. This advantage is further enhanced by the typically low cloudiness in arid regions, which minimizes residual cloud and shadow errors. Together, these conditions foster stronger consistency across datasets.
Obtaining observed soil conservation data is generally challenging. Since the soil conservation service is derived from soil erosion rates estimated by the RUSLE model, its reliability can be indirectly assessed by validating simulated soil erosion rates (Xiao et al., 2017). Therefore, this study used watershed soil erosion data to evaluate the model's accuracy (Liu et al., 2023). The watersheds include the Yangtze, Yellow, Huai, and Hai River Basins. This study obtained the soil erosion rates of these watersheds from 2000 to 2020 from the China Soil and Water Conservation Bulletin (http://www.mwr.gov.cn/sj/tjgb/zgstbcgb/, last access: 1 January 2025), and simulated erosion rates were extracted using basin vectors provided by the Water Resources Department. Based on these two datasets, this study performed a correlation analysis, with the results shown in Fig. 3a. In this study, we additionally cross-validated the simulated soil conservation with two published datasets – the Science Data Bank (SDB) soil conservation product for 2010 (Fig. 3b) and the Resource and Environment Science and Data Center (RESDC) soil conservation dataset (Fig. 3c).

Figure 3Validation of the soil conservation in this study, (a) the simulations and measurement of annual soil erosion rates for six river basins, including those of the Yangtze, Yellow, Haihe, Huaihe, Pearl, and Songhua and Liaohe in 2000 and 2010, (b) the soil conservation simulated in this study and Science Data Bank (SDB) soil conservation data in 2010, (c) the soil conservation simulated in this study and Resource and Environment Science and Data Center (RESDC) soil conservation data.
At the basin scale, simulated erosion rates agree well with observations from the China Soil and Water Conservation Bulletin (Fig. 3a), indicating that the RUSLE-driven framework captures the dominant spatial and interannual gradients in water-driven erosion. Cross-comparison with two soil conservation products (SDB and RESDC; Fig. 3b and c) also shows good consistency, but systematic spreads are expected for several reasons. Firstly, RUSLE represents annual hillslope sheet/rill erosion; however, it does not explicitly model gully and bank erosion, landslides/debris flows, snowmelt pulses, and wind erosion. Secondly, parameter/input uncertainty also leads to verification bias. R factor (rainfall erosivity) is derived from station/reanalysis fields that under-resolve short-lived convective storms, K and LS factors depend on soil maps and DEM, C factor comes from NDVI maps and cloud/shadow residuals, and P factor (conservation practices) is often approximated by regional constants, missing local terracing/contouring/residue cover. Thirdly, scale/definition mismatches arise when 30 m maps are compared with 1000 m products. The verification accuracy of soil conservation and published products shows significant differences in land cover classes (Fig. S3). The barren areas are generally poorly managed, exhibit homogeneous and blocky patterns, and are primarily influenced by the LS and K factors, leading to the highest consistency across datasets. Forest areas, characterized by low and stable C-factor values, are nevertheless affected by topographic and observational artifacts such as terrain shadows and DEM smoothing. Extreme events such as landslides and gully erosion also introduce outliers. Shrublands maintain a stable structure and thus achieve relatively high estimation precision. In contrast, grasslands are influenced by episodic rainfall events and grazing disturbances, while residual cloud and snow cover increase dispersion in the low-value range. Cropland exhibits the greatest uncertainty, mainly due to the high spatiotemporal heterogeneity of the P-factor and the effects of irrigation and tillage practices.
This study utilized simulated sandstorm prevention data and a remote sensing dataset for cross-validation, due to the limited availability of monitoring data on sandstorm prevention. Gkikas et al. (2022) quantified the dust optical depth and characterized its monthly and interannual variability at both global and regional scales for the period 2003–2017, using a fine spatial resolution (0.1° × 0.1°). This study randomly generated 2000 points on the map of China and extracted the values of the simulated sandstorm prevention data and Gkikas' datasets in 2010. This study then performed a correlation analysis, with the results shown in Fig. 4a. The simulated sandstorm prevention was also verified with two published datasets, namely the SDB sandstorm prevention data in 2010 (Fig. 4b) and the RESDC sandstorm prevention dataset (Fig. 4c), showing close consistency, thereby enhancing the credibility of the RWEQ model simulation results. The validation results show that simulated sandstorm prevention is negatively correlated with the dust optical depth (DOD) (Fig. 4a) – greater sandstorm prevention implies lower column dust – with residual spread driven by scope and scale mismatches. DOD integrates regional transport, vertical mixing, hygroscopic growth, and advection from remote sources, whereas the RWEQ model quantifies local emission control. Comparisons with other sandstorm prevention datasets (SDB and RESDC) reveal a positive spatial correlation (Fig. 4b and c), indicating a broadly consistent regional distribution. However, systematic offsets in slopes and intercepts are observed due to differences in drivers and parameterizations, such as wind speed, soil erodibility, and vegetation constraints. Land cover classes validation shows strong agreement for forest, shrubland, grassland, and cropland, whereas barren areas perform less well (Fig. S4). The differences stem from the surface roughness, the timeliness of wind and soil-moisture forcing, and classification/scale effects. Forests and shrublands supply stable roughness elements, so P conservation practices (shelterbelts/barriers) are captured consistently across products. Grasslands and croplands also agree well but exhibit slightly larger scatter at low values due to phenology, irrigation/tillage, and moisture pulses. In barren lands, absolute magnitudes are small and highly sensitive to gust thresholds and fine-fraction composition.
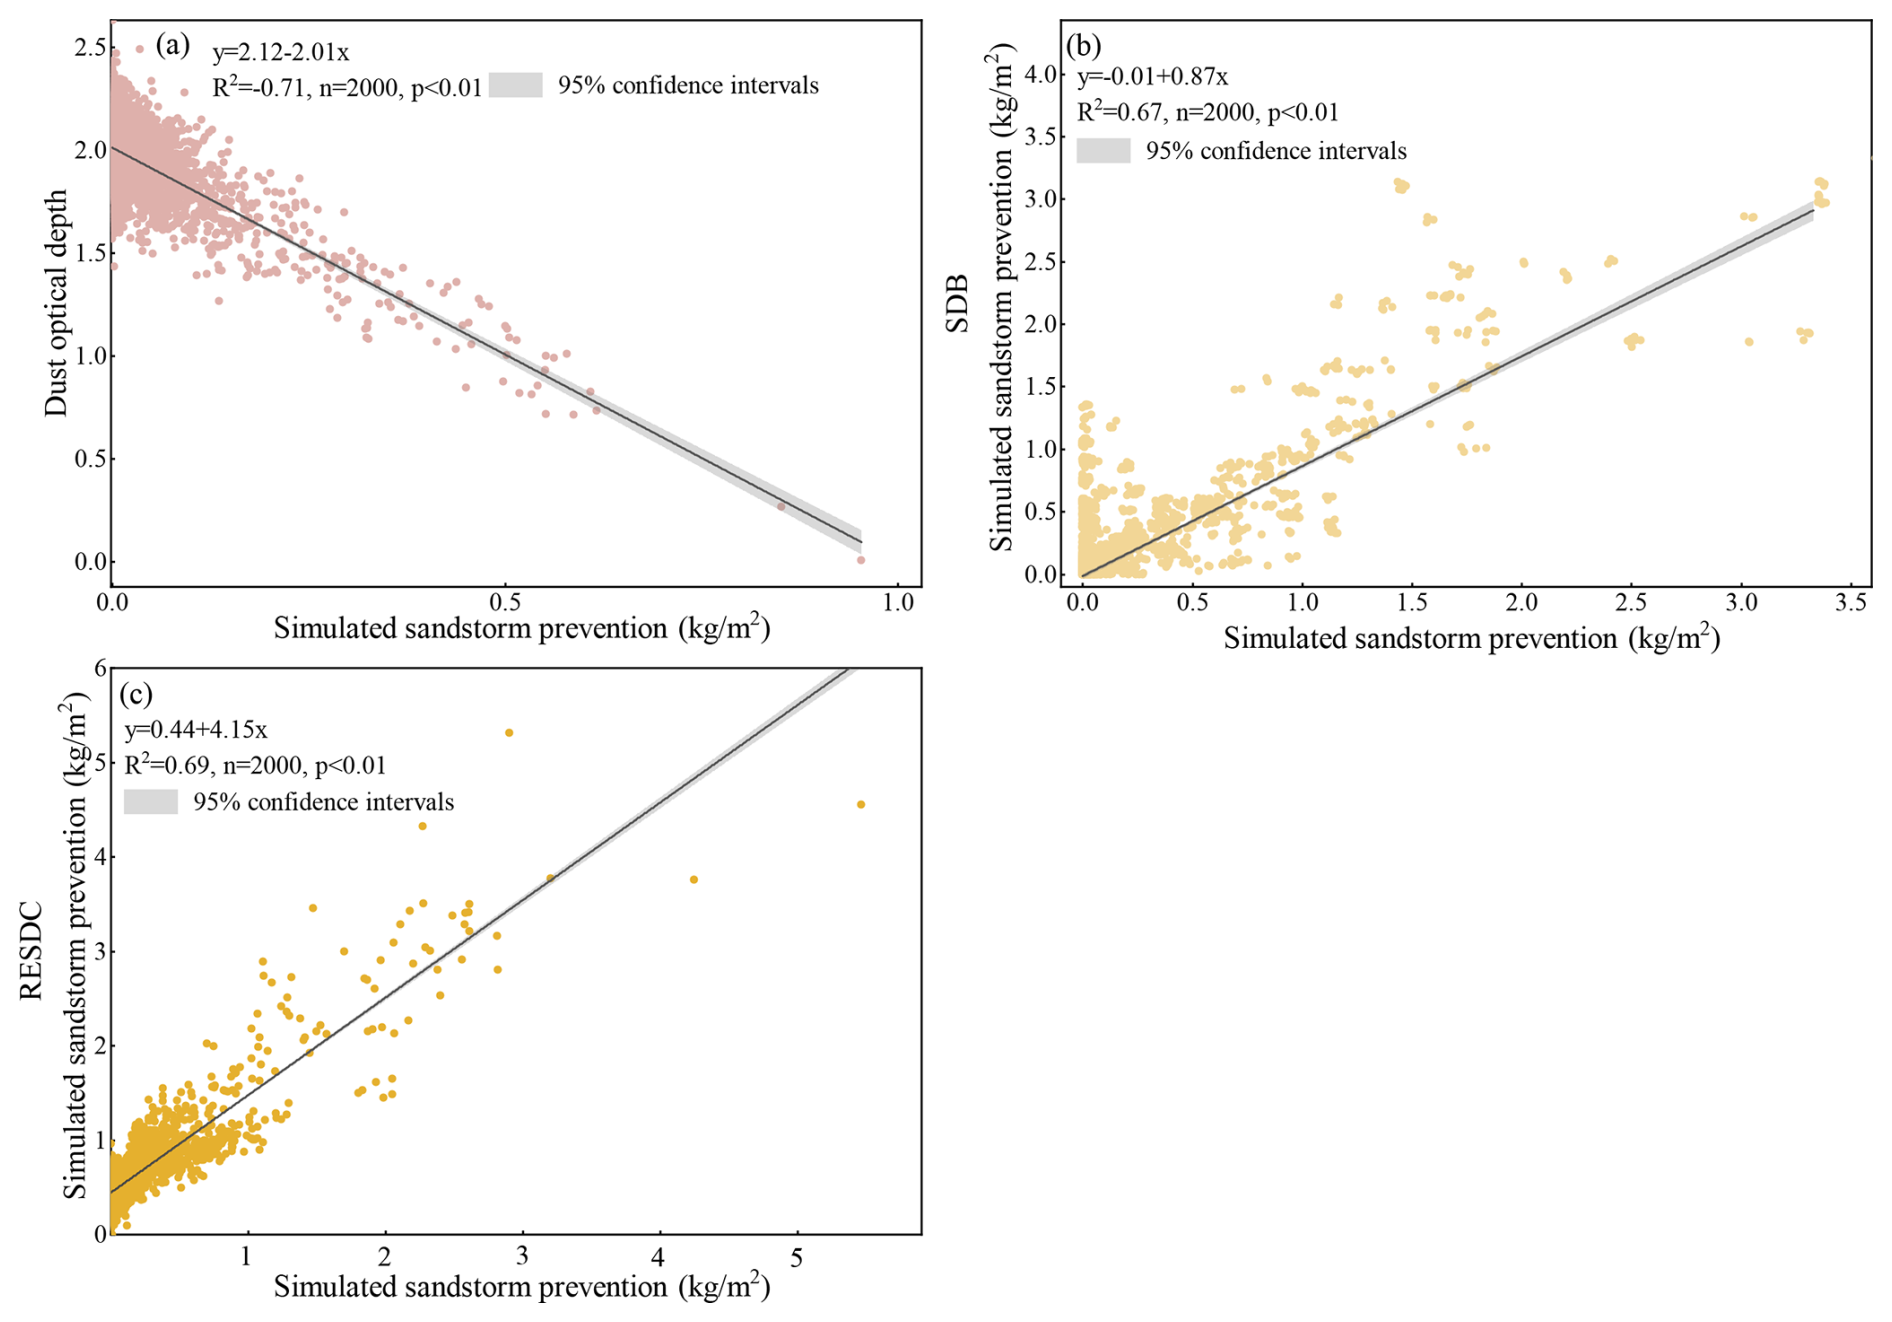
Figure 4Validation of the sandstorm prevention in this study, (a) the simulated sandstorm prevention and dust optical depth of China in 2010, (b) the sandstorm prevention simulated in this study and Science Data Bank (SDB) soil conservation data in 2010, (c) the sandstorm prevention simulated in this study and Resource and Environment Science and Data Center (RESDC) soil conservation data.
Surface water resource data for each province were obtained from the Water Resources Bulletin (http://www.mwr.gov.cn/sj/tjgb/szygb/, last access: 1 January 2025) from 2000 to 2020, typically obtained through field monitoring and statistical methods conducted by the water conservancy department. This study matched the water yield simulated by the InVEST model with the actual water yield data from the bulletin. To ensure consistency, this study aligned the data based on the same provinces and the same years. Due to missing data for some provinces in the year 2000, this study matched the data for 2010 and 2020 for analysis. This study performed a correlation analysis on the matched datasets. The coefficient of determination (R2) between the actual water yield and the simulated water yield was calculated to assess the consistency between the two datasets. The results are shown in Fig. 5a. Further validation with the SDB 2010 water yield data in 2010 (Fig. 5b) and the RESDC water yield dataset (Fig. 5c) revealed strong consistency with our simulations, indicating that the InVEST model results are reliable. Figure 5a shows strong agreement at the provincial scale, yet systematic differences remain because the InVEST model is structurally simplified and several definition/scale mismatches exist. The model estimates water yield from precipitation, reference ET, and vegetation/soil parameters without explicitly representing groundwater and surface water interactions, flow routing and regulation, inter-basin transfers, or human withdrawals/returns. By contrast, provincial Water Resources Bulletin statistics typically include baseflow contributions and management effects and are aggregated by administrative units, which do not perfectly match hydrological boundaries – hence larger deviations in arid or heavily regulated regions. Forcings and parameters add uncertainty (biases in precipitation/ET downscaling, PAWC/root depth, and Kc spatialization, the regional Z parameter), and annual averaging can smooth snow/ice melt or extreme events, affecting slopes and intercepts. Although the comparison between the simulated water yield and the SDB/RESDC dataset shows a good positive correlation (Fig. 5b and c), the intercept is positive and the slope is greater than 1, suggesting that the water yield product has a higher baseline water yield (which may include more base flow/human regulation volume or adopt a more humid meteorological environment). At the same time, these datasets differ in their spatial resolution, land cover, soil inputs, and parametric schemes, while scale effects also intrinsically influence the comparison. Land cover classes validation shows the strongest agreement for shrubland and barren, while forest and cropland correlate well but exhibit steeper slopes and negative intercepts, and grassland performs the weakest (Fig. S5). These differences stem from the simplifications in InVEST and scale mismatches (Budyko, 1974). Croplands are strongly affected by irrigation, runoff regulation, and return flows, raising baselines in published products. Forests reflect orographic precipitation biases, snow/ice melt, and baseflow, making external estimates higher. Grasslands show larger dispersion due to water-stress pulses, grazing effects, and heterogeneous PAWC/Kc. By contrast, shrubland and barren areas have simpler processes and weaker management, resulting in closer precipitation and ET partitioning across products.
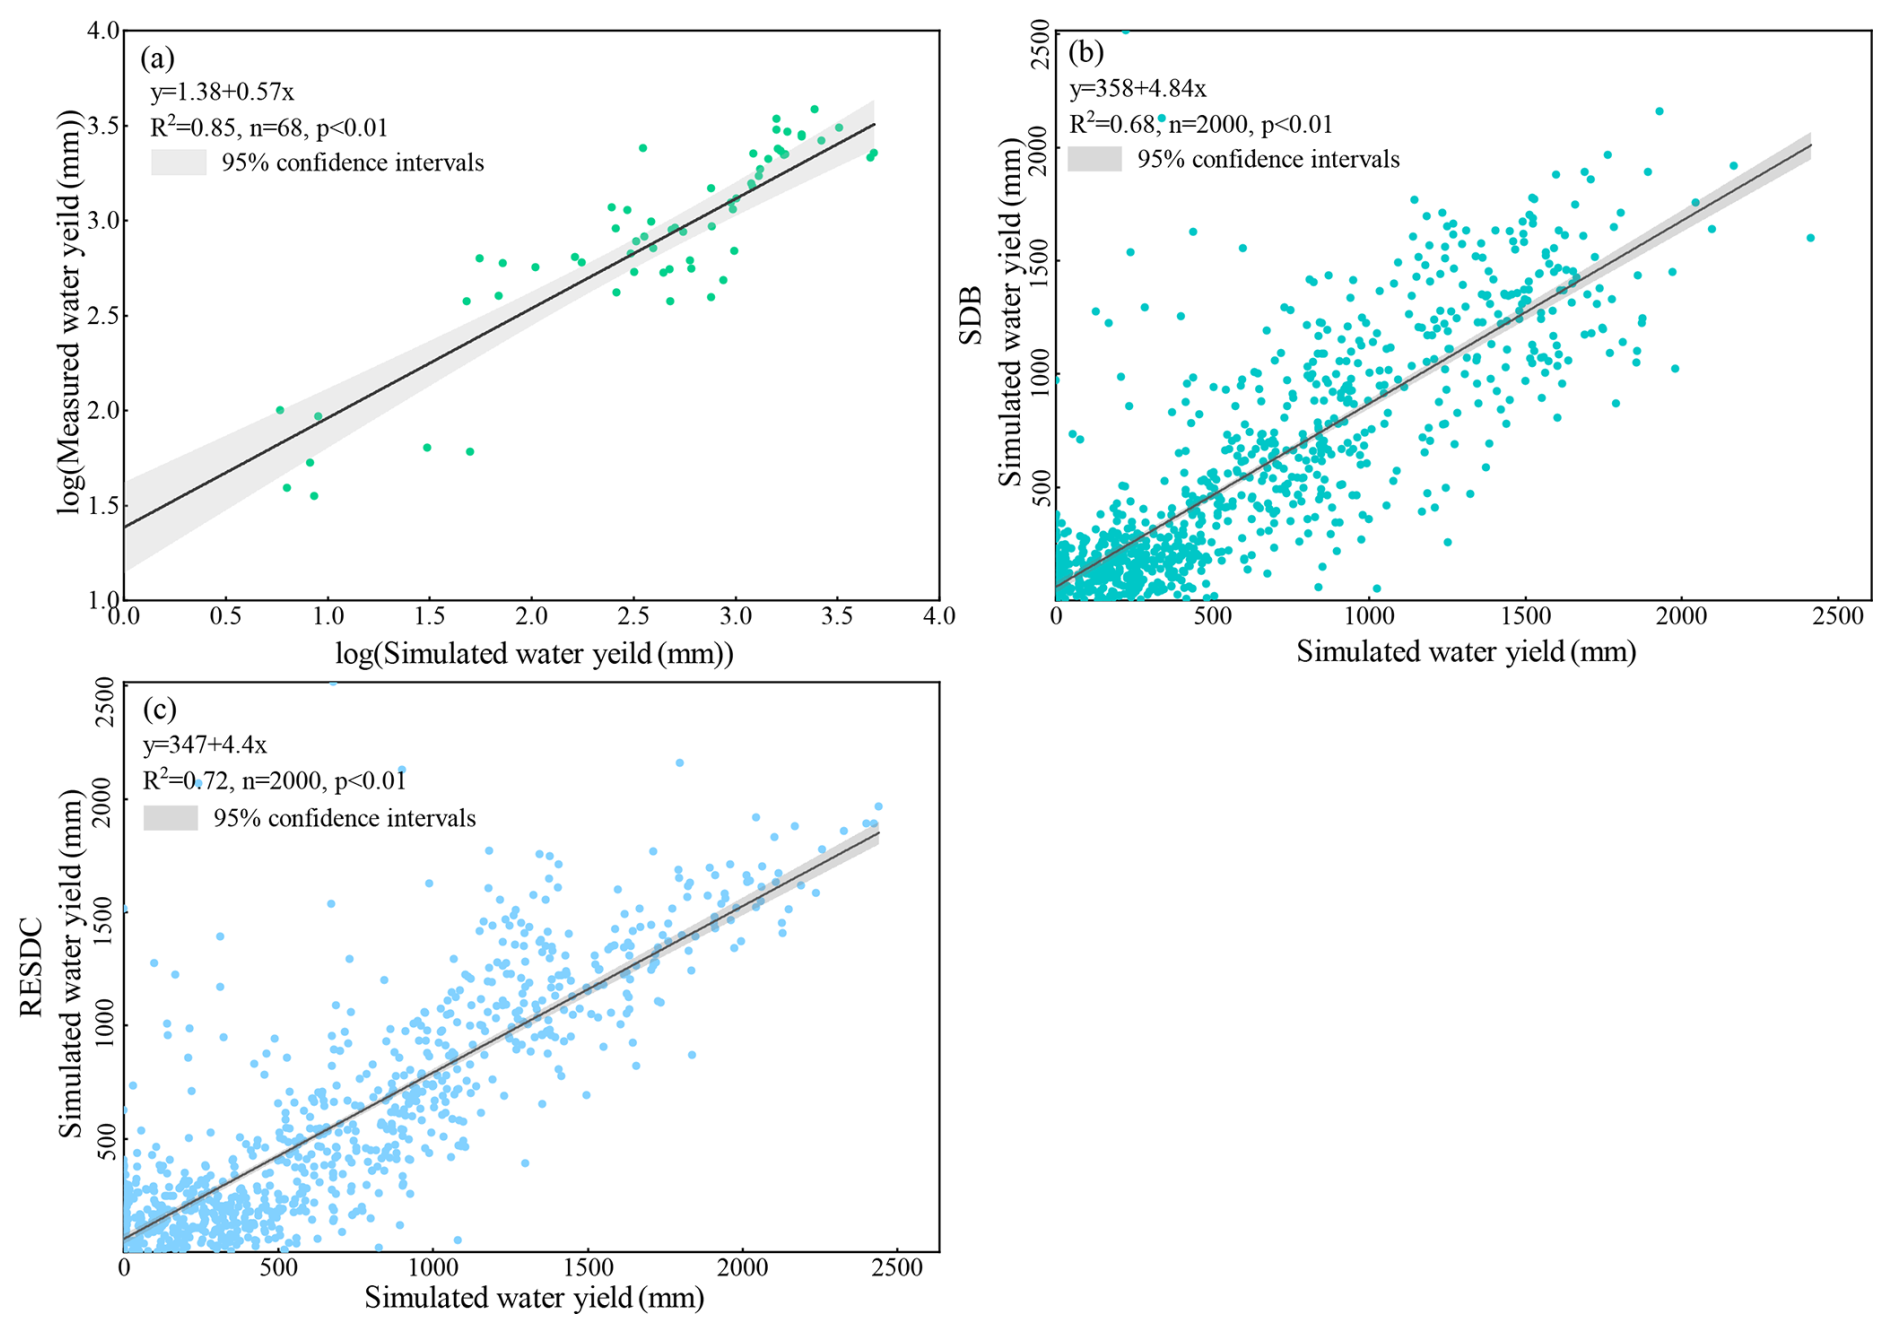
Figure 5Validation of the water yield in this study, (a) the simulations and measurements of water yield for 34 provinces in 2000 and 2020. (b) the water yield simulated in this study and Science Data Bank (SDB) water yield data in 2010, (c) the water yield simulated in this study and Resource and Environment Science and Data Center (RESDC) water yield data.
4.2 Net primary productivity dynamics
The spatial distribution of net primary productivity (NPP) showed significant regional differences, generally showing an increasing trend along the rainfall-temperature gradient from northwest to southeast (Fig. 6). In 2020, high NPP regions were mainly distributed in Yunnan, Sichuan, Guangdong, Guangxi, and Heilongjiang, accounting for 9 %, 9.27 %, 3.80 %, 4.86 %, and 5.97 % of China, respectively (Table S5). The total NPP increased by 0.45 Pg over the 20 years, with an increase of 11.31 % (Fig. S6). The NPP of Yunnan, Inner Mongolia, Sichuan, Shanxi, Hebei, and Shaanxi increased, accounting for 28.04 %, 8.69 %, 20.82 %, 15.89 %, 14.44 %, and 13.54 % of the NPP dynamics from 2000 to 2020, respectively (Table S6).
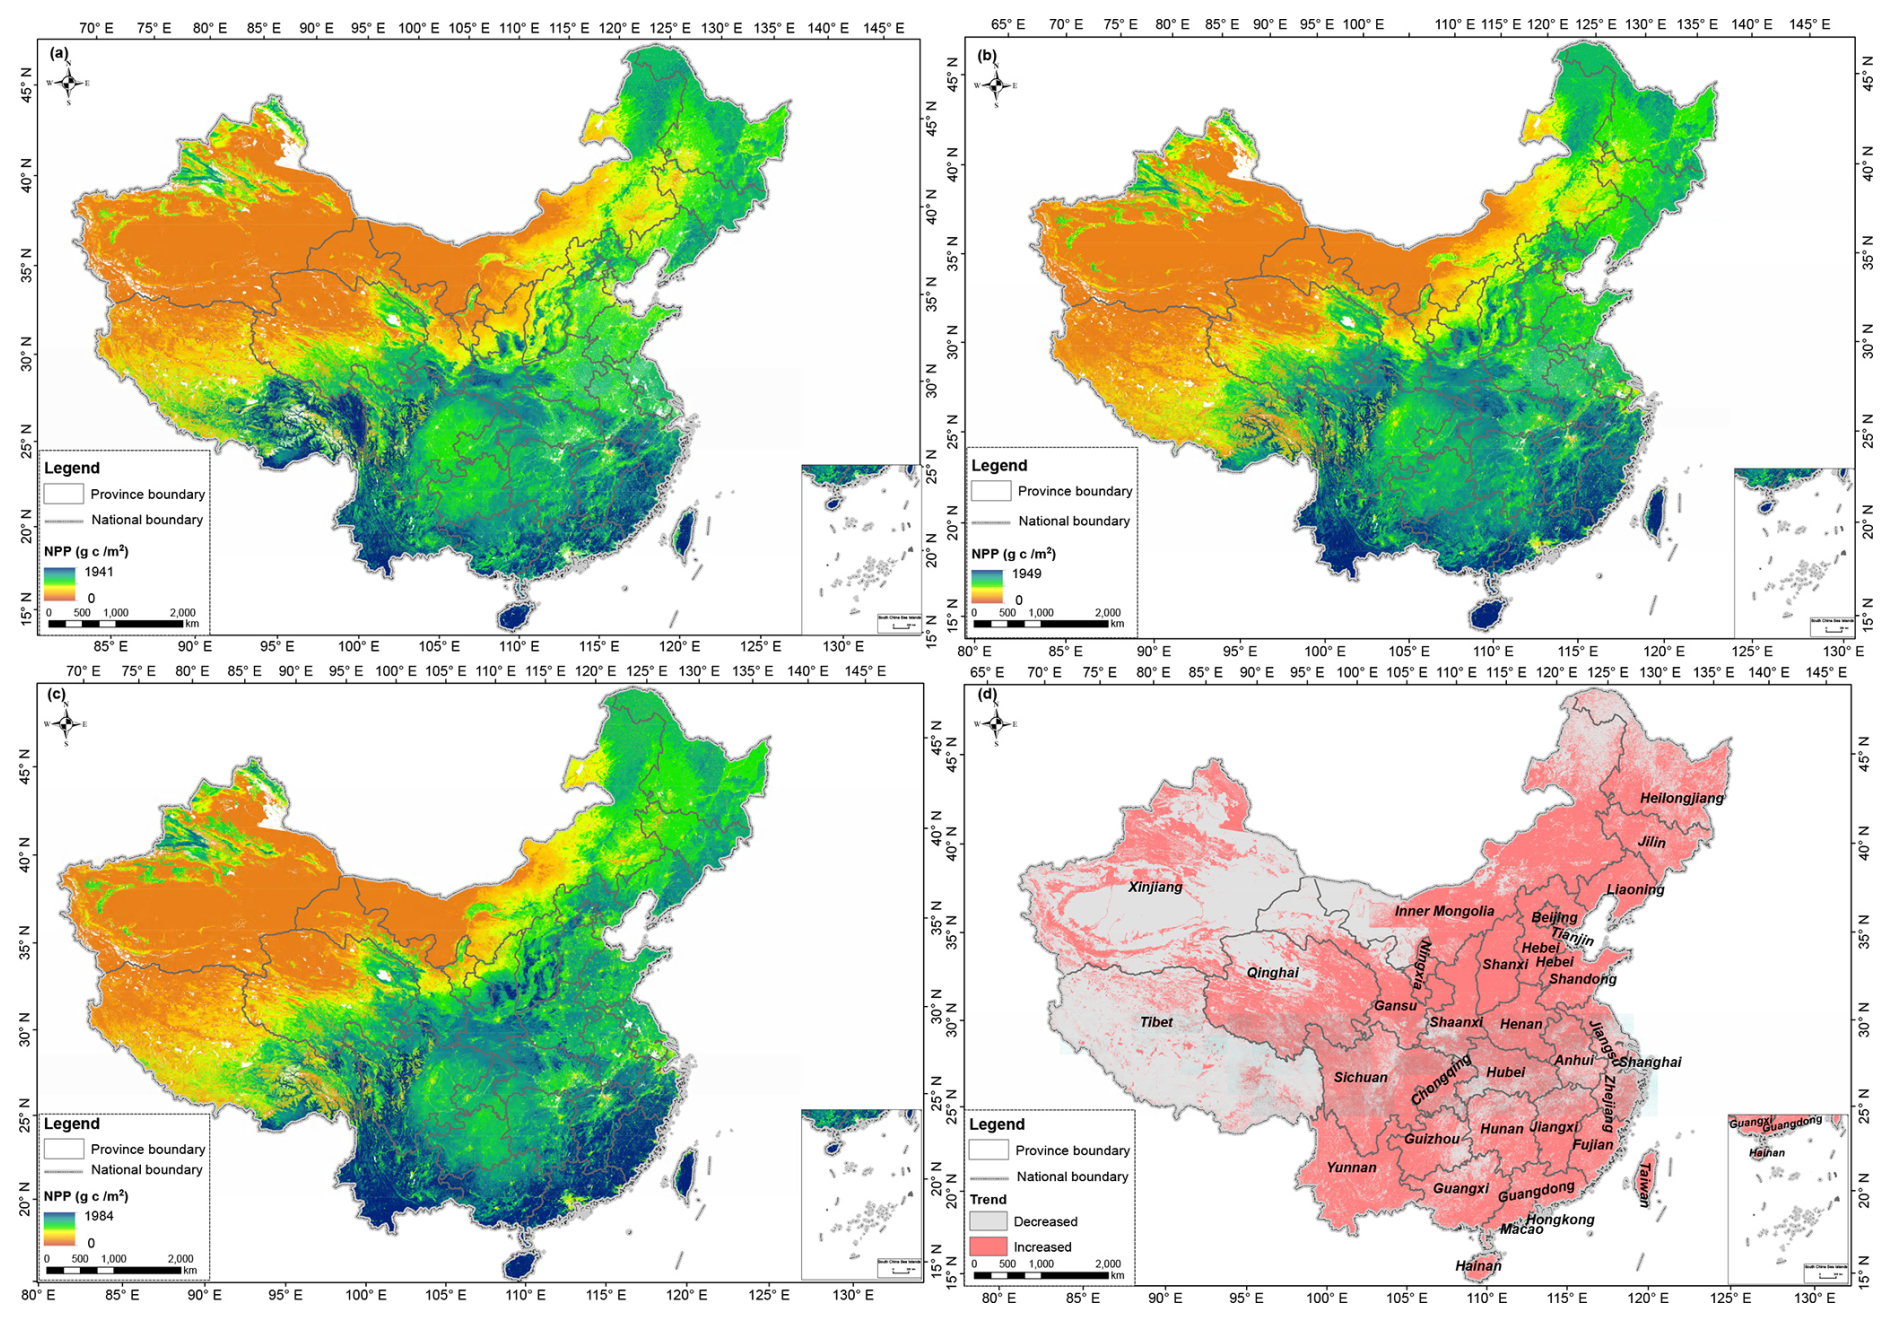
Figure 6Spatial and temporal distribution of net primary productivity (NPP) in China from 2000 to 2020. (a) 2000 NPP; (b) 2010 NPP; (c) 2020 NPP; (d) NPP dynamics from 2000 to 2020.
These results are similar to those of Ouyang et al. (2016), who also found significant regional differences in NPP across different areas of China, with an overall increasing trend. This finding is consistent with other studies, such as Feng et al. (2016), which indicated that NPP significantly increased in the Loess Plateau region through vegetation restoration measures. This trend is further corroborated by Zhao and Running (2010), who observed that NPP in China's ecosystems has increased in recent decades, especially in the southeastern regions with relatively high precipitation and temperature.
4.3 Soil conservation dynamics
Soil conservation is primarily concentrated in the Sichuan Basin, Loess Plateau, and surrounding mountainous and hilly areas, eastern Great Khingan, and the Yunnan-Guizhou Plateau (Fig. 7). In 2020, the province with the most soil conservation quantity is Tibet (24.35 %), while the least is Macao (0.00001%) (Table S5). Over the 20 years, total soil conservation increased by 184 million tons, with an increase rate of 13.67 % (Fig. S6). The regions where soil conservation increased over the 20 years were Yunnan, Sichuan, Gansu, and Tibet, with reductions of 50, 19, 27, and 42 million tons, respectively (Table S6), accounting for 19.74 %, 7.502 %, 10.66 %, and 16.58 % of the soil conservation dynamics from 2000 to 2020 (Table S6). The decrease in soil conservation is mainly in the three provinces (regions) of Jilin, Hainan, and Guizhou, with increases of 20, 7, and 3 million tons, respectively, accounting for 0.79 %, 2.76 %, and 1.18 % of the dynamic soil conservation from 2000 to 2020 (Table S6).
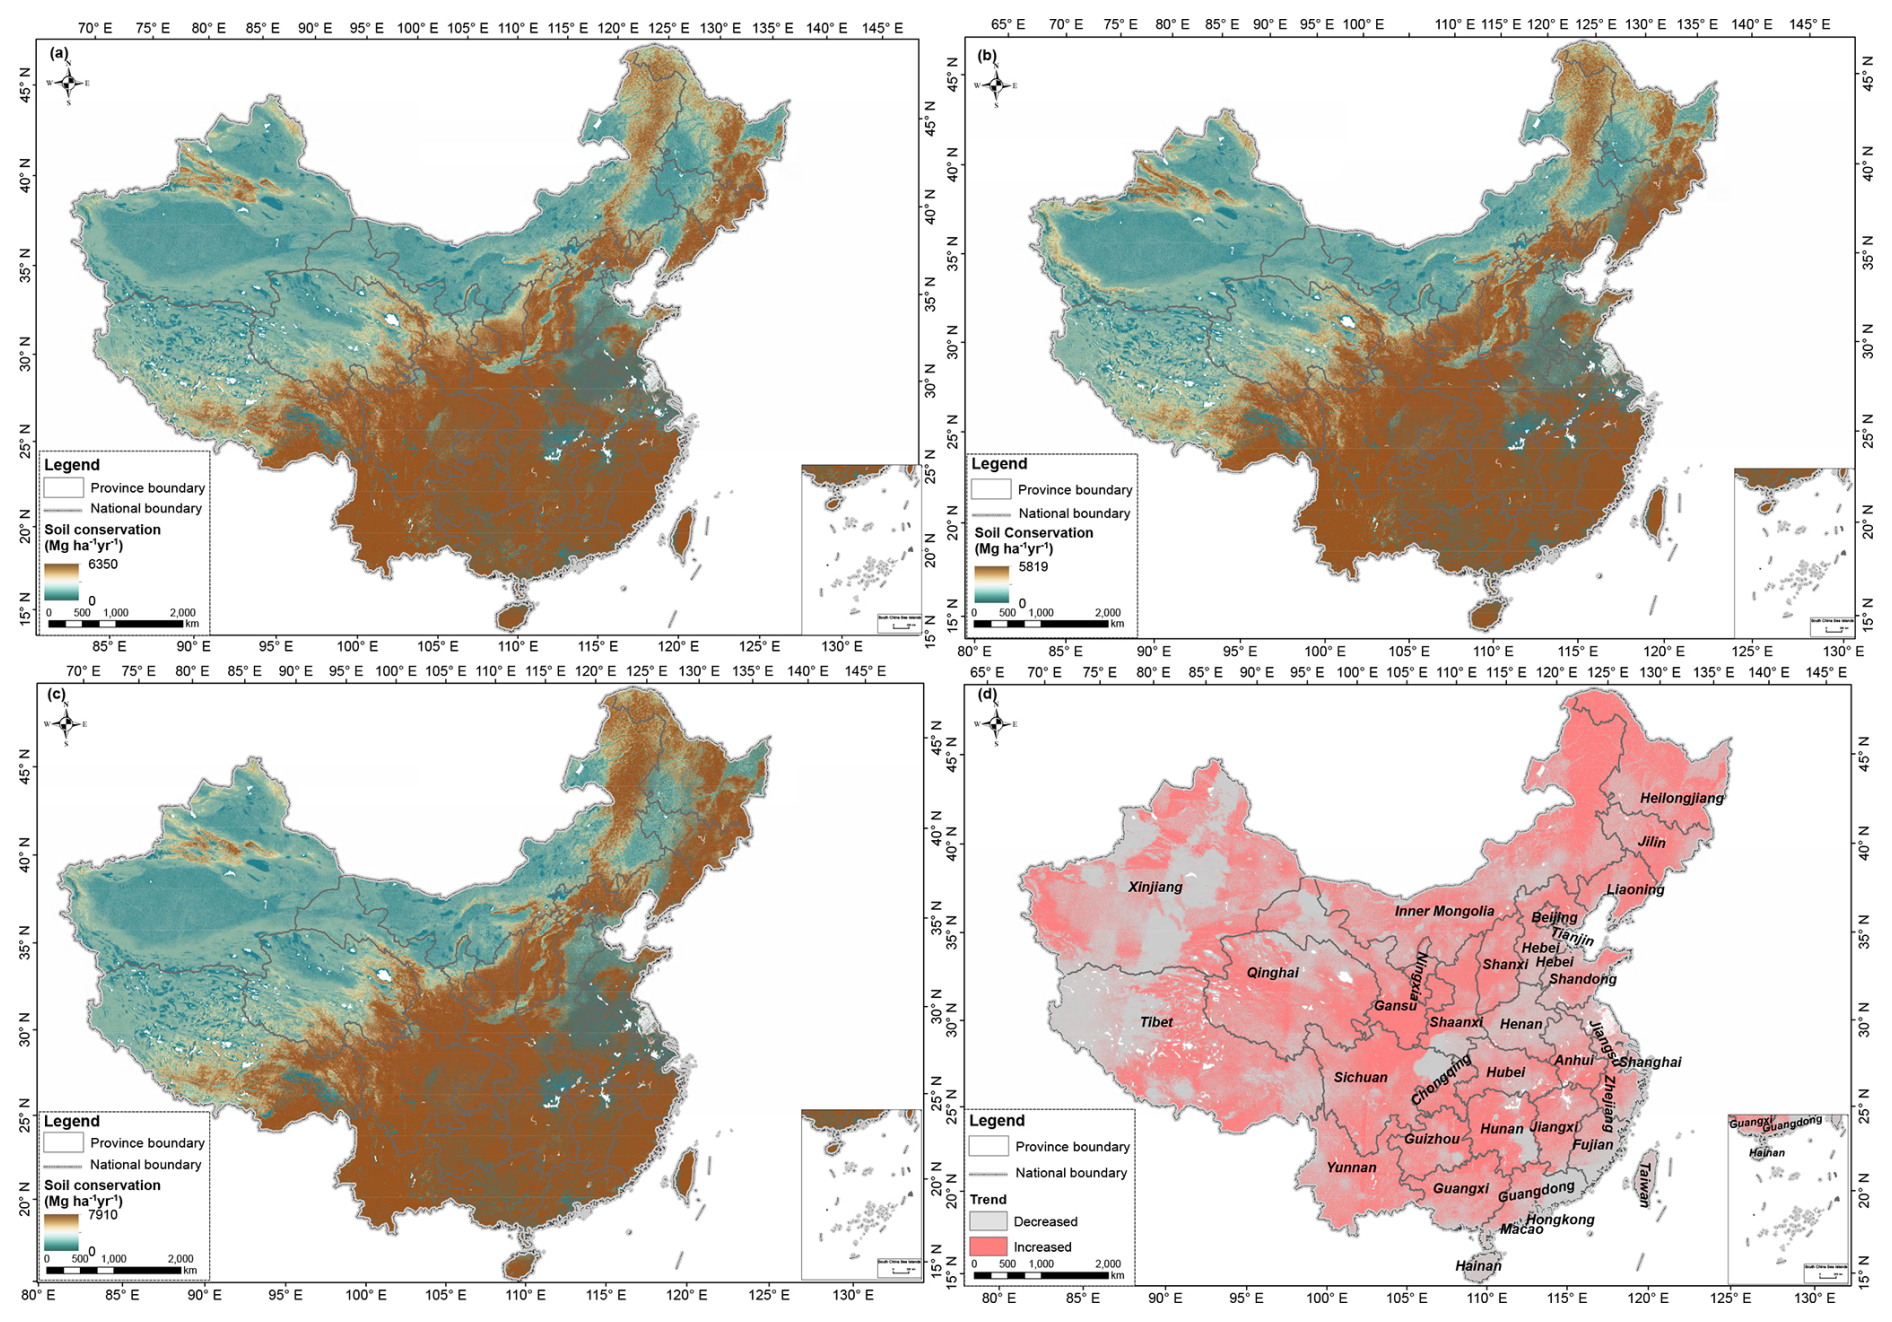
Figure 7Spatial and temporal distribution of soil conservation in China from 2000 to 2020. (a) 2000 soil conservation; (b) 2010 soil conservation; (c) 2020 soil conservation; (d) Soil conservation dynamics from 2000 to 2020.
The results of this study are consistent with Ouyang et al. (2016), who found that implementing ecological restoration measures and vegetation reconstruction effectively controlled soil erosion in regions such as the Loess Plateau, resulting in high soil conservation values. Additionally, other studies have shown that through vegetation restoration measures and proper land management, the soil conservation capacity in most regions of China has significantly improved (Li et al., 2023b).
4.4 Sandstorm prevention dynamics
Sandstorm prevention is mainly distributed in arid and semi-arid areas of China, with significant quantities found in the western Alxa Plateau, Hexi Corridor, Junggar Basin, Tarim Basin, and eastern Qaidam Basin (Fig. 8). Over the 20 years, the sandstorm prevention increased by 18.67 million tons, with an increased rate of 78.94 % (Fig. S6). During this period, the sandstorm prevention showed an increasing trend. The provinces (regions) where sandstorm prevention increased include Inner Mongolia, Ningxia, Xinjiang, Gansu, Tibet, Shaanxi, and Qinghai, with increases of 1095.04, 110.46, 287.05, 211.69, 28.89, 73.02, and 60.96 million tons, respectively, accounting for 58.65 %, 5.92 %, 15.37 %, 11.34 %, 1.55 %, 3.91 %, and 3.26 % of the sandstorm prevention dynamics from 2000 to 2020 (Table S6).
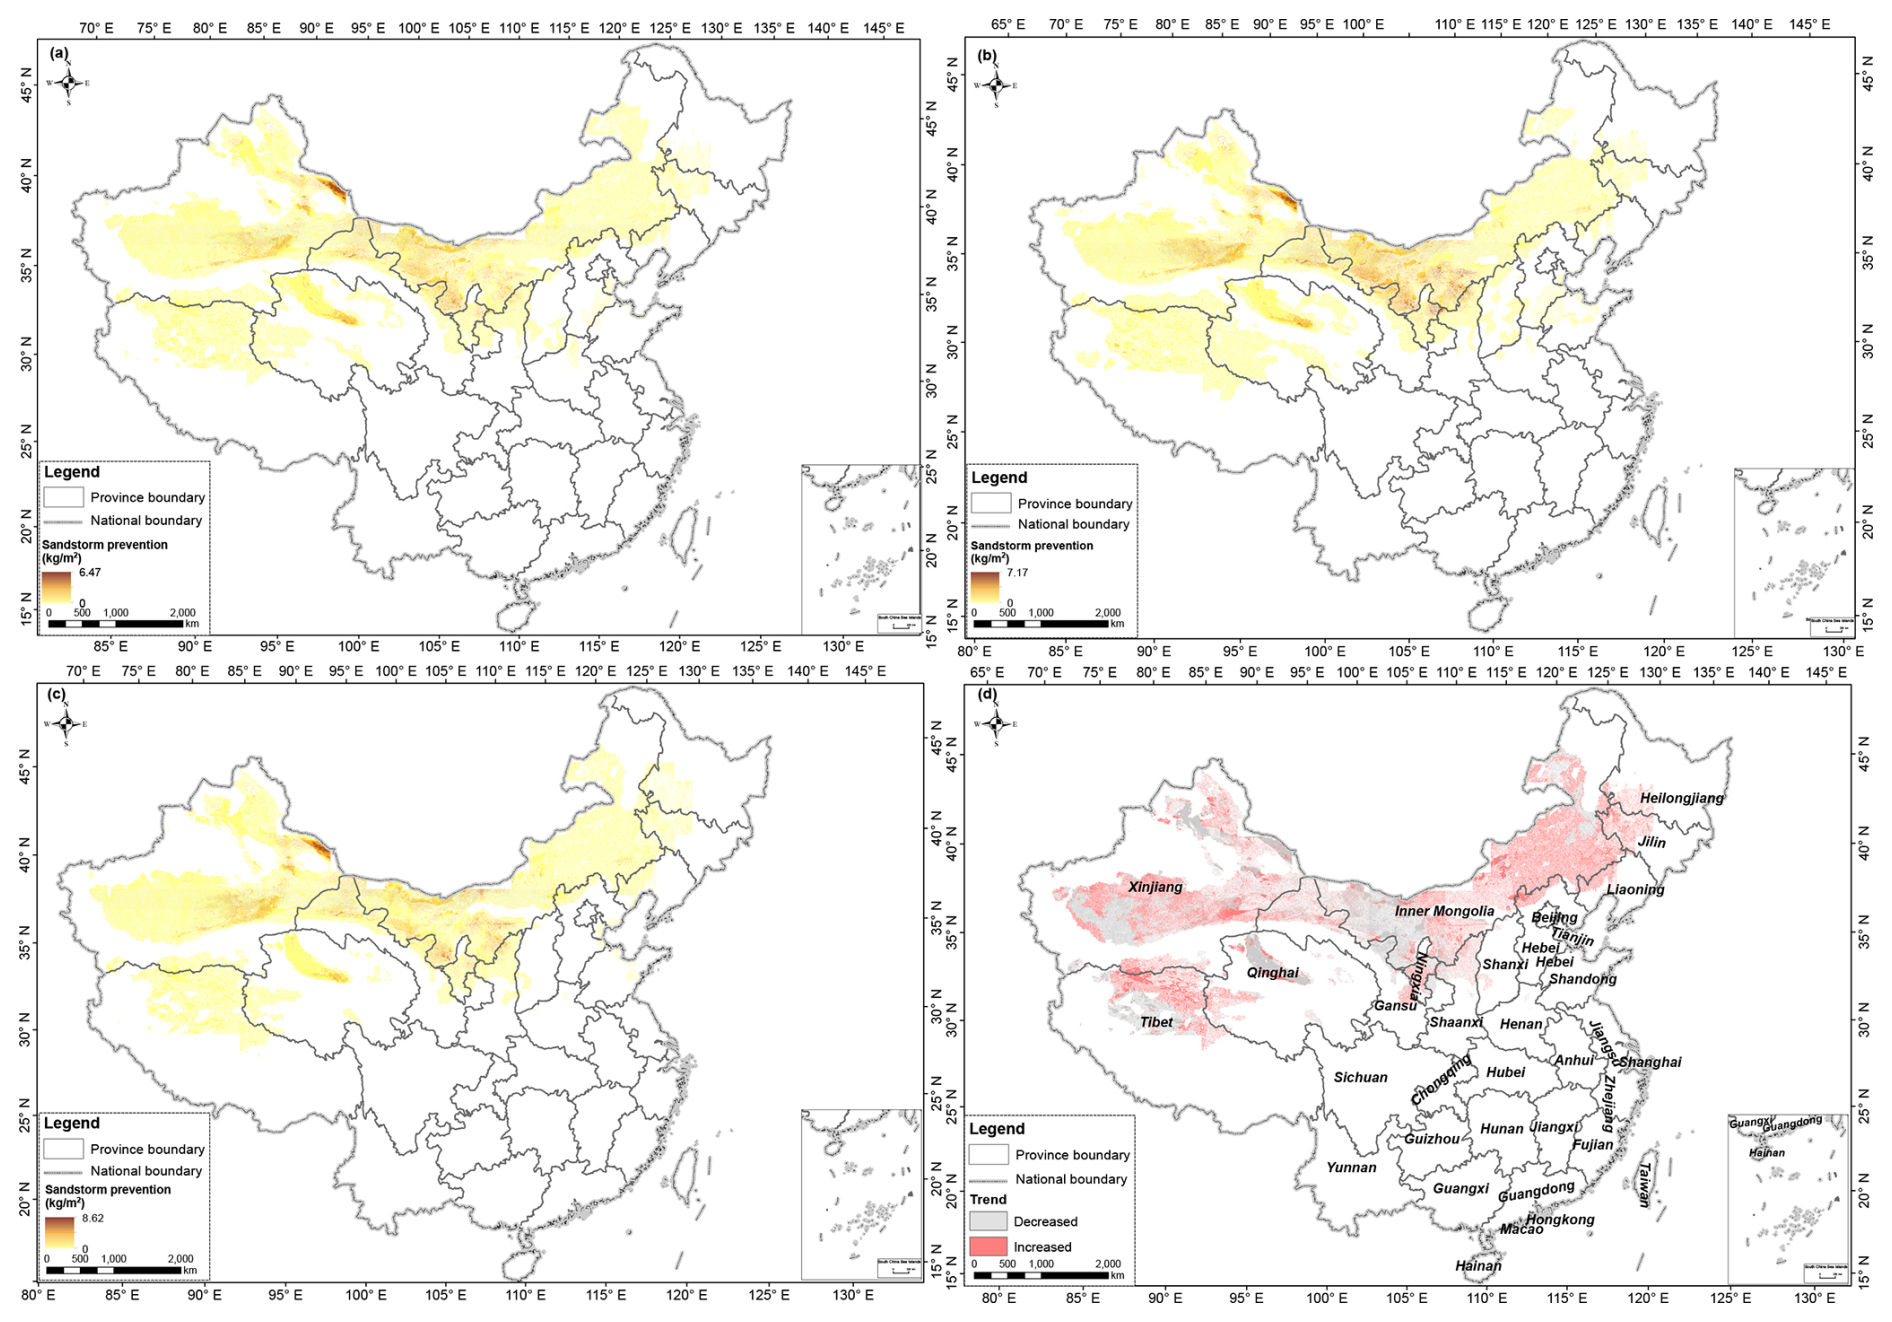
Figure 8Spatial and temporal distribution of sandstorm prevention in China from 2000 to 2020. (a) 2000 sandstorm prevention; (b) 2010 sandstorm prevention; (c) 2020 sandstorm prevention; (d) Sandstorm prevention dynamics from 2000 to 2020.
The results of this study align with Xu et al. (2017), who observed that sandstorm prevention efforts are predominantly focused on the Northwestern region, including Mongolia's Ordos Plateau and Hunshandake. Some studies have also found that through vegetation restoration projects and ecosystem management measures, significant success has been achieved in sandstorm prevention in China. These measures have not only effectively reduced the frequency and intensity of sandstorms but also promoted the restoration and health of ecosystems. For instance, Ouyang et al. (2016) demonstrated that ecological restoration projects significantly improve soil retention and reduce sandstorms. Similarly, the study by Feng et al. (2016) supports these findings, emphasizing the crucial role of vegetation restoration in the Loess Plateau.
4.5 Water yield dynamics
The water yield sis higher in the southeast and lower in the northwest and gradually decreasing from east to west (Fig. 9). The provinces that have high water yields are Yunnan, Sichuan, Guangdong, Guangxi, Jiangxi, Hunan, Hubei, and Heilongjiang, accounting for 6.90 %, 7.37 %, 5.56 %, 6.65 %, 5.46 %, 5.19 %, 6.51 %, and 5.28 % of the total national water production (Table S5). Over the 20 years, the water yield decreased by 60.64 mm m−2, with a reduction rate of 13.53% (Fig. S6). The regions where water yield decreased are Yunnan, Guangdong, Guangxi, and Fujian provinces, with reductions of 9.33, 5.85, 6.03, and 2.06 mm m−2, respectively, accounting for 15.42 %, 9.67 %, 9.96 %, and 3.405 % of the dynamic water yield from 2000 to 2020. The increased provinces (regions) are Inner Mongolia, Sichuan, Anhui, and Hubei provinces, with increases of 9.82, 4.77, 7.37, and 11.24 mm m−2, respectively, accounting for 16.23 %, 7.88 %, 12.18 %, and 18.58 % of the dynamic water yield from 2000 to 2020 (Table S6).
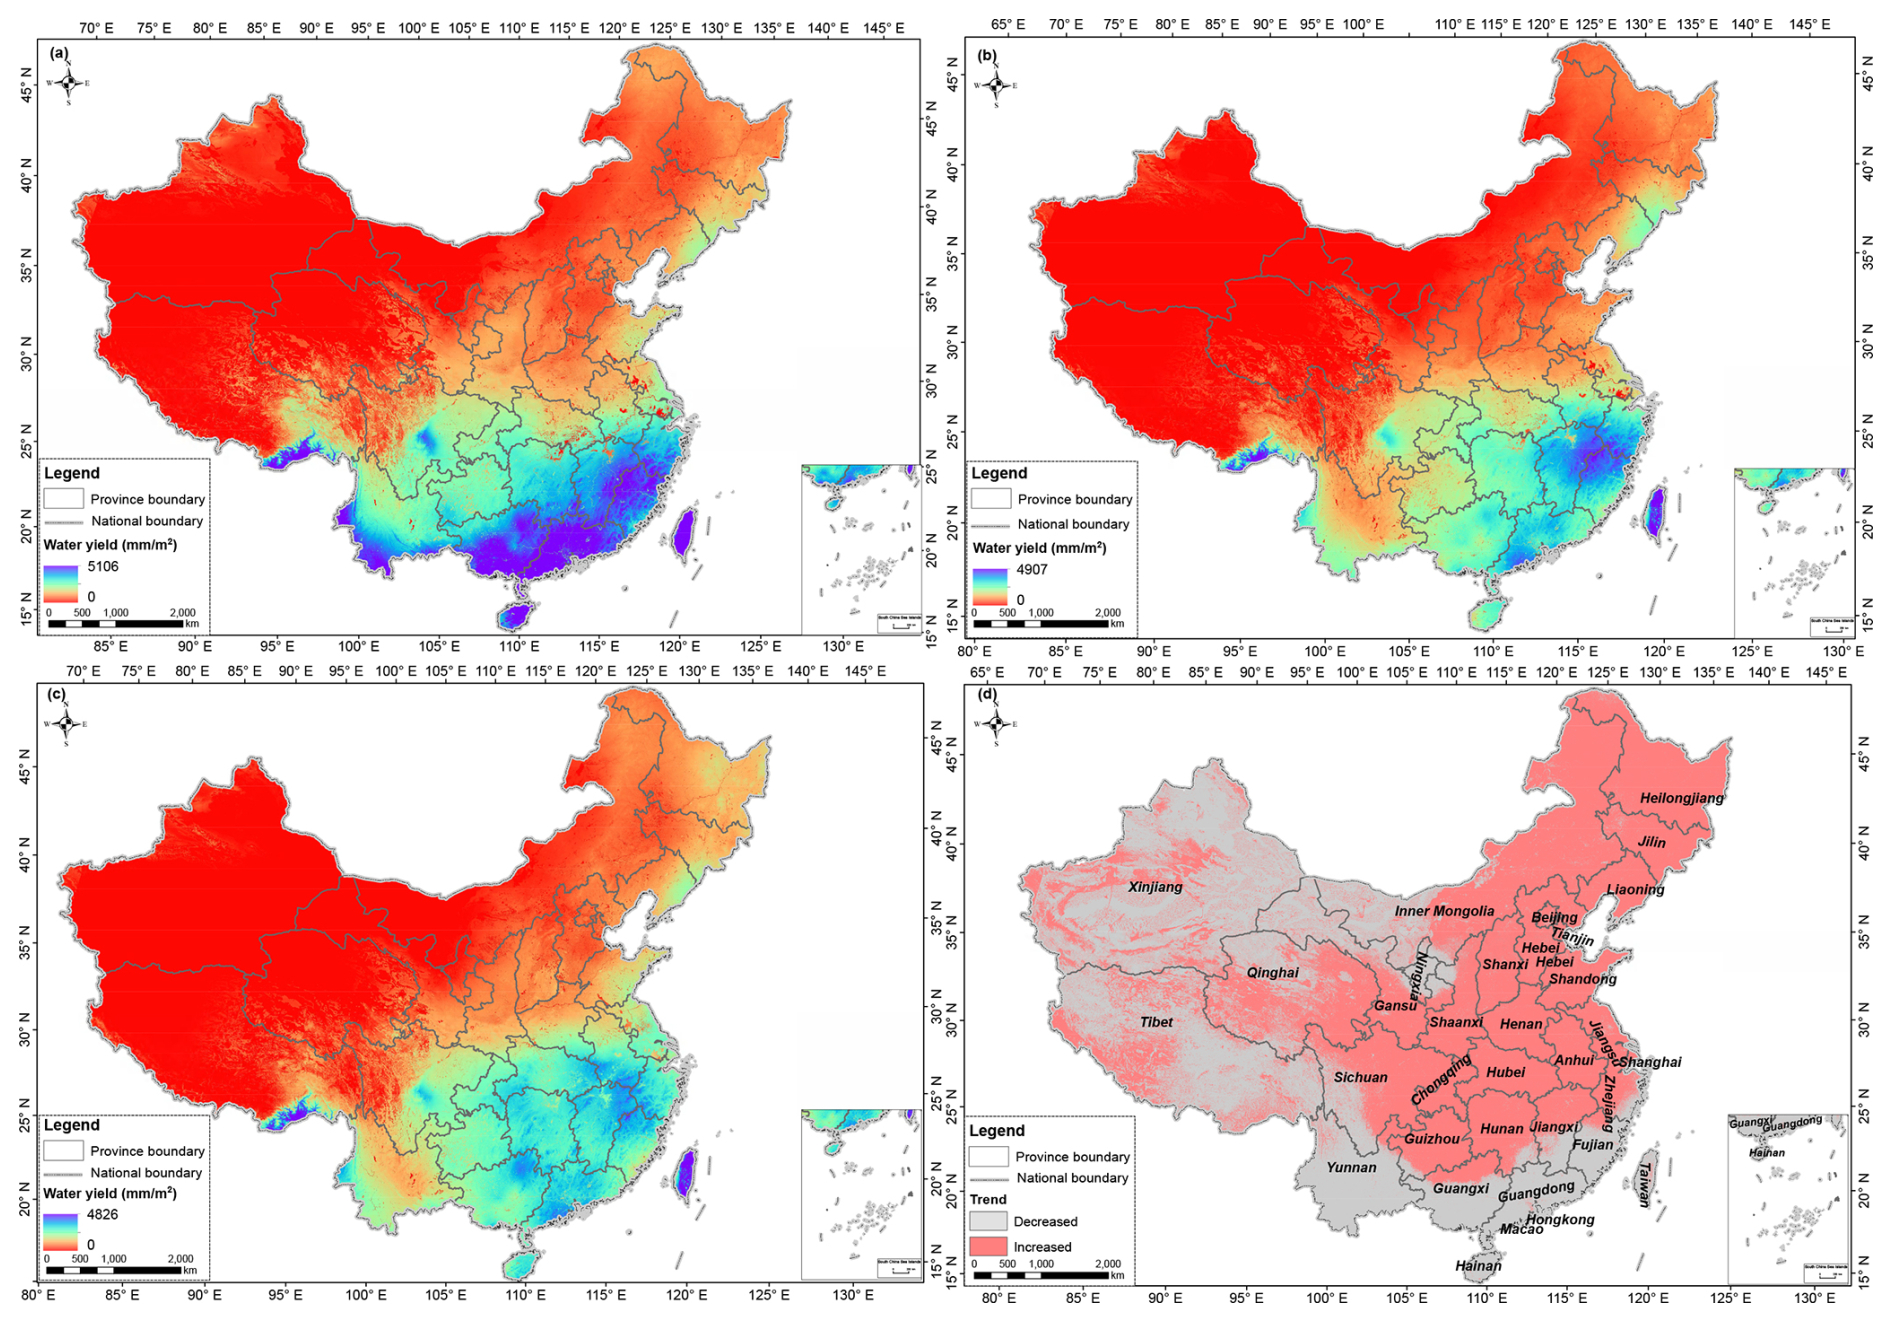
Figure 9Spatial and temporal distribution of water yield in China from 2000 to 2020. (a) 2000 water yield; (b) 2010 water yield; (c) 2020 water yield; (d) Water yield dynamics from 2000 to 2020.
The results are in agreement with those of Yin et al. (2020), who identified a trend of higher water yield in the southeast and lower water yield in the northwest of China. High values are concentrated in the Sichuan-Yunnan-Loess Plateau ecological barrier and the southern mountainous areas, while lower values are found in the northwestern Qinghai-Tibet Plateau ecological barrier and the northern sand control zone. The water yield shows a declining trend, with reductions mainly in the southeastern Sichuan-Yunnan-Loess Plateau and the central-southern mountainous areas.
5.1 Ecosystem services dynamics
The provincial differences in ecosystem services are mainly affected by area, terrain, climate, and land cover. Yunnan, Sichuan, Guangdong, Guangxi, and Heilongjiang have good hydrothermal conditions and vegetation growth. Ecological initiatives like the Natural Forest Protection Project and Shelterbelt Project in the Upper-middle Reaches of the Yangtze River have positively impacted net primary productivity (NPP). Meanwhile, negative human activities such as deforestation have relatively low interference, resulting in higher net primary productivity in these regions (Lu et al., 2018). Beyond land cover change, interannual NPP gains are also consistent with broader climate influences (warmer springs, adequate precipitation, increased radiation) and a background rise in atmospheric CO2 that may enhance photosynthetic capacity (CO2 fertilization), especially where water is not limiting (Li et al., 2021). Sichuan, Xinjiang, Tibet, and Qinghai have more soil retention due to their extensive administrative areas. These provinces have rugged terrain, and most of the land cover is barren, which easily leads to soil erosion (Rao et al., 2023). Inner Mongolia, Xinjiang, Gansu, and Qinghai belong to arid or semi-arid climates, with relatively low precipitation and dry soil, making them prone to wind erosion and sandstorms due to high wind speeds and extensive barren (Piao et al., 2020). Yunnan, Sichuan, Guangdong, Guangxi, Jiangxi, Hunan, Hubei, and Heilongjiang have greater water yield due to abundant rainfall, complex terrain with various landforms such as mountains, plateaus, and hills, which facilitates the formation and accumulation of precipitation. Moreover, these regions are mostly covered by rich vegetation, and the transpiration effect of vegetation promotes precipitation formation and circulation (Yang et al., 2023). The interplay of climate and urbanization drives water yield dynamics. Climatically, yield is primarily a function of net water supply (precipitation minus PET), where warming-induced PET increases can negate the benefits of higher precipitation (Zhou et al., 2015). In parallel, urbanization alters the hydrological partitioning: impervious surfaces generate more rapid runoff, but this comes at the cost of reduced infiltration, ultimately diminishing groundwater recharge and baseflow in river basins (Huang et al., 2024).
In recent decades, China has implemented ambitious ecological projects, such as the Natural Forest Protection Project (NFPP), the Grain for Green Program (GFGP), the Three-north Shelter Forest Project (TSFP), and the Project for Preventing and Controlling Desertification (PPCD). The implementation of these projects has changed the land cover, effectively increasing vegetation coverage and improving ecosystem stability (Cai et al., 2022). Concurrently, warming temperatures in recent years have also supported the vegetation growth (Song et al., 2021), contributing to a general increase in net primary productivity (NPP). Our province-level summaries indicate widespread positive NPP trends in regions targeted by NFPP and GFGP, consistent with afforestation effects and climate co-benefits. The enhanced NPP reflects improved photosynthetic capacity driven by vegetation recovery, particularly in areas targeted by national restoration projects. The expansion of forests, shrubs, and grasslands under these ecological programs has strengthened vegetation and root systems, improving soil stability and sand retention capacity. These improvements have led to notable increases in soil conservation, particularly within watersheds affected by reforestation and revegetation efforts (Wang et al., 2016). The spatial patterns of increased soil conservation are closely associated with the implementation areas of the GFGP and NFPP. Simultaneously, the observed reduction in desertified land and improvements in sandstorm prevention capacity correspond well with the effects of the TSFP and anti-desertification efforts (Li et al., 2023c). These spatial patterns indicate that this high-resolution dataset can serve as an effective tool for assessing the ecological outcomes of national policy initiatives. Nevertheless, the increased vegetation cover has also affected hydrological processes, particularly through increased evapotranspiration and reduced surface runoff, which may result in declining water yield in afforested regions (Zhao et al., 2021). This highlights the importance of considering potential trade-offs between restoration benefits and water resource availability, especially in arid and semi-arid regions.
By revealing the relationship between changes in ecosystem services and policy measures, this dataset provides a scientific basis for multi-level governments and ecological management agencies to achieve sustainable landscape governance.
5.2 Data accuracy and validation
In the previous studies, the resolution of land cover data commonly used in ecosystem service assessment is mainly concentrated at 300, 500, or even 1000 m (Peng et al., 2023; Zhao and Running, 2010; IPBES, 2019a). These data provide a holistic perspective for large-area analysis but are insufficient in terms of details (Li et al., 2023d). For example, at a resolution of 300 m, the accuracy of the identification and boundaries of land feature types is limited, which leads to the lack of detailed descriptions and accurate spatial distribution information in areas with complex terrain and diverse land cover types (Yang et al., 2017). In contrast, this study used a dataset with a resolution of 30 m, which enabled us to capture more detailed geographic features and land cover changes during the assessment process, thereby providing richer and more detailed assessment results (Chen et al., 2015). The 30 m resolution data allow us to more accurately identify and quantify different land feature types, such as buildings, farmland, forests, wetlands, etc., and to more accurately delineate their spatial distribution and boundaries (Kuang et al., 2021). Compared with the low resolution, this dataset shows significant advantages in land cover classification accuracy and the completeness of spatial information. This refined data resolution enhances our understanding and management of ecological services in complex ecosystems, providing more targeted and operational data support for regional planning and environmental management decisions.
To ensure the reliability and accuracy of the data, this study used cross-validation, field observations, and statistical data to verify the accuracy and credibility of the 30 m resolution ecosystem service dataset in terms of spatial distribution and quantity estimation. After detailed verification and analysis, this dataset showed higher accuracy and reliability (Figs. 2, 3, 4 and 5). These verification work verified the application potentials of the dataset in ecosystem service assessment and provided a reliable data basis for subsequent related research and practical applications. In addition, this dataset has been used in studies such as exploring the effectiveness evaluation of protected areas (Liu et al., 2023) and the impact of urban urbanization on the dynamics of urban vegetation in China (Zhang et al., 2023). Through the dual verification of verification and application, this dataset has been fully verified and tested in practice, showing its reliability and practicality in various complex environments and application scenarios.
5.3 Limitations and Uncertainties
This study utilized remote sensing datasets and meteorological station data to develop long-term datasets of NDVI, vegetation coverage, evapotranspiration, potential evapotranspiration, and snow cover in China. These datasets effectively removed the missing or low-quality pixels in the original images, overcame the challenge of reconstructing data under cloud cover with limited information, and improved the precision of the monthly data. Although we used high-precision data to assess ecosystem services, there are several uncertainties and limitations. For example, we calibrated the Landsat 5 and 8 spectral response data and calculated monthly and quarterly NDVI. However, there remains the possibility that sensor-related bias has not been fully eliminated (Anderson et al., 2020). Residual remote-sensing artifacts may remain after preprocessing, including undetected clouds/cloud-shadows and topographic illumination effects, mixed-pixel issues in ecotones, and NDVI saturation over dense-canopy regions (Lin and Roy, 2021). These factors may bias both spatial contrasts and temporal trends despite our cross-sensor harmonization. Although this study extensively utilizes site data to maximize available information and enhance spatial and temporal continuity, the ground observation data still face representativeness issues, and accuracy requires improvement in certain areas. Validating remote sensing products with site observation data is also subject to representativeness challenges, and uncertainties still exist in the accuracy verification process (Zhao et al., 2020).
The four ecosystem services were assessed using different satellite sources of data. The ecosystem service maps are presented at 30 m resolution, driven by the highest-resolution data (Landsat NDVI, GlobeLand30, and DEM). Other essential input data (e.g., climate and soil properties) were originally at coarser resolutions. Although these data were resampled to the 30 m resolution, this process inevitably introduces uncertainty. The fine-resolution output effectively captures spatial patterns defined by the land cover and NDVI, but the precision of absolute values in highly heterogeneous areas may be constrained by the inherent information content of the original coarser datasets (Liu et al., 2023).
Despite of the high resolution and accuracy of the dataset, our data set still have some limitations. First, some of the ecosystem service modules (e.g., InVEST water yield) simplify hydrological and geomorphic processes and typically do not explicitly simulate groundwater recharge, surface-groundwater interactions, or threshold/nonlinear responses during extreme events (Redhead et al., 2016). Such simplifications can reduce accuracy in arid basins, karst areas, or groundwater-dependent systems. Data scarcity further increases uncertainty in remote regions. In high-elevation and desert areas (e.g., the Tibetan Plateau and arid Northwest), meteorological and hydrological stations are sparse, quality-controlled long time series are limited, and cloud/ice/snow contamination of optical imagery is more frequent (Walther et al., 2025).
Model-based assessments of ecosystem services inevitably involve multiple sources of uncertainty. These uncertainties primarily arise from errors in input data (such as climate variables, land cover types, and soil parameters), which propagate through the modeling process and have a cumulative effect on the results (Walther et al., 2025). Although cross-validation with existing products and ground-based observations demonstrates the overall robustness of the dataset, this study did not conduct a systematic approach to quantifying uncertainty. Future studies should incorporate quantitative uncertainty analysis, such as sensitivity analysis and error propagation analysis, to provide confidence intervals for key ecosystem service estimates. These potential uncertainties should be carefully considered when applying this dataset to fine-scale ecological planning, ecosystem restoration decision-making, and the design of payment for ecosystem services (PES) schemes.
In stable climatic conditions, many ecosystem services exhibit slow inter-annual variation. Thus, for numerous policy and management applications – such as evaluating long-term ecological restoration programs – a decadal assessment is often sufficient (Ouyang et al., 2016). However, with the increasing frequency of extreme climate events, which can significantly alter ecosystem services dynamics year-to-year, there is a growing scientific need for annual assessments (Dee et al., 2025). Moreover, improving data availability, particularly the emergence of more detailed annual land cover products, along with advancements in downscaling techniques, will further support the generation of annual ecosystem service datasets (Yang and Huang, 2021). For users who may wish to interpolate or model annual data, such as using our decadal data as benchmarks and integrating it with annually available coarser-resolution remote sensing indices (e.g., MODIS NDVI) for trend analysis and interpolation. Future research can also focus on other ecosystem services, including biodiversity and habitat quality, pollination, flood regulation, and water quality purification, thereby supporting a more comprehensive assessment. In addition, the biophysical layer can be combined with socio-economic data (such as population density, accessibility and infrastructure, water intake, economic activities, and PES programs) to achieve scenario analysis, trade-off assessment, and fair-oriented decision-making.
5.4 Application potentials
This dataset is widely applicable to various research and application scenarios, particularly in domains requiring high-resolution analysis, such as urbanization monitoring, nature reserve management, and policy implementation assessment. It also provides robust data support for long-term ecosystem change research. The potential users of this dataset include government decision-makers, land-use planning and management agencies, environmental protection and natural resource management institutions, and researchers. Government policymakers can use this dataset to quantitatively assess the effectiveness of ecological restoration policies (e.g., the Grain for Green Programs and the Natural Forest Protection program), optimize land-use planning, and establish payment for ecosystem services (PES) schemes. Land-use planning and management agencies can leverage this dataset for urban expansion monitoring and land-use optimization, contributing to the development of sustainable strategies. Environmental protection organizations can utilize this dataset to monitor biodiversity, habitat changes, and ecosystem functions within nature reserves, providing scientific support for conservation and restoration efforts. Researchers can employ this dataset as a high-precision foundation for studies on ecosystem services, climate change, and land-use change, improving the accuracy and reliability of model-based analyses. Furthermore, this dataset demonstrates exceptional performance in long-term dynamic change analysis, accurately capturing and analyzing trends in ecosystem services across different regions, thus offering critical data support and a decision-making foundation for ecosystem management, environmental protection, and sustainable development.
This dataset is essential for various geoscience research, particularly in understanding ecosystem responses to climate change, water resource management, environmental protection, and management. The dataset is openly available at https://doi.org/10.57760/sciencedb.20797 (Liu et al., 2025). All data are produced and generated in the ArcGIS10.3, with the format being TIFF. They can be viewed and utilized in visualization geographic information systems or remote sensing industry software that supports the aforementioned format.
Mapping high-resolution ecosystem services is essential for understanding and managing ecosystems, particularly in achieving carbon neutrality and sustainable development goals. Existing ecosystem service datasets are often limited by low spatial resolution, outdated datasets, and data inconsistencies, which constrain their applicability at regional and local scales. In this study, we integrated the high-precision remote sensing data and ground observations to produce high-resolution maps of four key ecosystem services in China for the years 2000, 2010, and 2020, including one provisioning service – net primary productivity, and three regulating services – soil conservation, sandstorm prevention, and water yield. The mapping process employed robust ecological process models and achieved a dataset with 30 m spatial resolution. Through comparison and cross-validation with other data sources, this dataset has been proven to have significant advantages in accuracy and applicability. This dataset offers the advantages of high spatial resolution and a long time series, and is expected to provide data support for evaluating the implementation effects of major ecological restoration programs, such as the Grain for Green Program and the Natural Forest Protection Program. In addition, this dataset can also be used to guide land cover optimization, ecological restoration strategy formulation, and the design and implementation of incentive mechanisms based on ecosystem services (such as the ecological compensation system).
The supplement related to this article is available online at https://doi.org/10.5194/essd-18-1519-2026-supplement.
YL anf ZZ: Methodology, Software, Visualization, Writing (original draft preparation); WZ and JD: Conceptualization, Formal analysis, Writing (review and editing), Supervision; LW: Writing (review and editing).
The contact author has declared that none of the authors has any competing interests.
Publisher's note: Copernicus Publications remains neutral with regard to jurisdictional claims made in the text, published maps, institutional affiliations, or any other geographical representation in this paper. The authors bear the ultimate responsibility for providing appropriate place names. Views expressed in the text are those of the authors and do not necessarily reflect the views of the publisher.
The authors would like to thank all the reviewers who participated in the review.
This research was supported by the Third Xinjiang Scientific Expedition Program (grant no. 2022xjkk0405), the 111 project, and the Fundamental Research Funds for the Central Universities of China.
This paper was edited by Nophea Sasaki and reviewed by Xuemeng Tian and one anonymous referee.
Allen, R. G.: Using the FAO-56 dual crop coefficient method over an irrigated region as part of an evapotranspiration intercomparison study, J. Hydrol., 299, 27–41, https://doi.org/10.1016/S0022-1694(99)00194-8, 2000.
Anderson, K., Fawcett, D., Cugulliere, A., Benford, S., Jones, D., and Leng, R. L.: Leng Vegetation expansion in the subnival Hindu Kush Himalaya, Glob. Chang. Biol., 26, 1608–1625, https://doi.org/10.1111/gcb.14919, 2020.
Benavidez, R., Jackson, B., Maxwell, D., and Norton, K.: A review of the (Revised) Universal Soil Loss Equation ((R)USLE): with a view to increasing its global applicability and improving soil loss estimates, Hydrol. Earth Syst. Sci., 22, 6059–6086, https://doi.org/10.5194/hess-22-6059-2018, 2018.
Bockheim, J. G. and Gennadiyev, A. N.: The value of controlled experiments in studying soil-forming processes: A review, Geoderma, 152, 208–217, https://doi.org/10.1016/j.geoderma.2009.06.019, 2009.
Budyko, M. I.: Climate and life, Academic Press, New York, USA, ISBN 0-12-139450-4, 1974.
Cai, Y., Zhang, F., and Duan, P.: Vegetation cover changes in China induced by ecological restoration-protection projects and land-use changes from 2000 to 2020, Catena, 217, 106530, https://doi.org/10.1016/j.catena.2022.106530, 2022.
Chen, J., Chen, A., Liao, X., Cao, L., Chen, X., He, C., Han, G., Peng, S., Lu, M., Zhang, W., Tong, X., and Mills, J.: Global Land Cover Mapping at 30m Resolution: A POK-based Operational Approach, ISPRS J. Photogramm. Remote Sens., 103, 7–27, https://doi.org/10.1016/j.isprsjprs.2014.09.002, 2015.
Chen, J., Cao, X., Peng, S., and Ren, H.: Analysis and Applications of GlobeLand30: A Review, ISPRS Int. J. Geo-Inf., 6, 230, https://doi.org/10.3390/ijgi6080230, 2017a.
Chen, W., Liu, W., Geng, Y., Brown, M. T., Gao, C., and Wu, R.: Recent progress on energy research: a bibliometric analysis, Renew. Sust. Energ. Rev., 73, 1051–1060, https://doi.org/10.1016/j.rser.2017.02.041, 2017b.
Costanza, R., d'Arge, R., de Groot, R., Farber, S., Grasso, M., Hannon, B., Limburg, K., Naeem, S., O'Neill, R. V., Paruelo, J., Raskin, R. G., Sutton, P., and van den Belt, M.: The value of the world's ecosystem services and natural capital, Nature, 387, 253–260, https://doi.org/10.1038/387253a0, 1997.
Costanza, R., de Groot, R., Braat, L., Kubiszewski, I., Fioramonti, L., Sutton, P., Farber, S., and Grasso, M.: Twenty years of ecosystem services: How far have we come and how far do we still need to go?, Ecosyst. Serv., 28, 1–16, https://doi.org/10.1016/j.ecoser.2017.09.008, 2017.
Dee, L., Miller, S., Helmstedt, K., Boersma, K., Polasky, S., and Reich, P.: Quantifying disturbance effects on ecosystem services in a changing climate, Nat. Ecol. Evol., 9, 436–447, https://doi.org/10.1038/s41559-024-02626-y, 2025.
Delgado, D., Sadaoui, M., Ludwig, W., and Méndez, W.: DEM spatial resolution sensitivity in the calculation of the RUSLE LS-Factor and its implications in the estimation of soil erosion rates in Ecuadorian basins, Environ Earth Sci., 83, 36, https://doi.org/10.1007/s12665-023-11318-y, 2024.
Díaz-Reviriego, I., Turnhout, E., and Beck, S.: Participation and inclusiveness in the Intergovernmental Science-Policy Platform on Biodiversity and Ecosystem Services, Nat. Sustain., 2, 457–464, https://doi.org/10.1038/s41893-019-0290-6, 2019.
Donohue, R. J., Roderick, M. L., and Mcvicar, T. R.: Roots, storms and soil pores: Incorporating key ecohydrological processes into Budyko's hydrological model, J. Hydrol., 436–437, 35–50, https://doi.org/10.1016/j.jhydrol.2012.02.033, 2012.
Fang, J., Yu, G., Liu, L., Hu, S., and Chapin, F. S.: Climate change, human impacts, and carbon sequestration in China, P. Natl. Acad. Sci. USA, 115, 4015–4020, https://doi.org/10.1073/pnas.1700304115, 2018.
Feng, X., Fu, B., Piao, S., Wang, S., Ciais, P., Zeng, Z., Lü, Y., Zeng, Y., Li, Y., Jiang, X., and Wu, B.: Revegetation in China's Loess Plateau is approaching sustainable water resource limits, Nature Clim. Change, 6, 1019–1022, https://doi.org/10.1038/nclimate3092, 2016.
Feng, X. M., Sun, G., Fu, B. J., Su, C. H., Liu, Y., and Lamparski, H.: Regional effects of vegetation restoration on water yield across the Loess Plateau, China, Hydrol. Earth Syst. Sci., 16, 2617–2628, https://doi.org/10.5194/hess-16-2617-2012, 2012.
Fryrear, D. W., Krammes, C. A., Williamson, D. L., and Zobeck, T. M.: Computing the wind erodible fraction of soils, J. Soil Water Conserv., 49, 183–188, https://www.proquest.com/55scholarly-journals/computing-wind-erodible-fraction-soils/docview/220961018/se-2 (last access: 1 January 2025), 1994.
Gkikas, A., Proestakis, E., Amiridis, V., Kazadzis, S., Di Tomaso, E., Marinou, E., Hatzianastassiou, N., Kok, J. F., and García-Pando, C. P.: Quantification of the dust optical depth across spatiotemporal scales with the MIDAS global dataset (2003–2017), Atmos. Chem. Phys., 22, 3553–3578, https://doi.org/10.5194/acp-22-3553-2022, 2022.
Hagen, L. J.: A wind erosion prediction system to meet user needs, J. Soil Water Conserv., 46, 106–111, 1991.
Hansen, M. C., Potapov, P. V, Hancher, M., Turubanova, S. A., Tyukavina, A., Thau, D., Stehman, S. V., Goetz, S. J., Loveland, T. R., kommareddy, A., Georov, A., Chini, L., Justice, C. O., and Townshend, J. R. G.: High-Resolution Global Maps of 21st-Century Forest Cover Change, Science, 342, 850–853, https://doi.org/10.1126/science.1244693, 2013.
Hooper, T., Beaumont, N., Griffiths, C., Langmead, O., and Somerfield, P. J.: Assessing the sensitivity of ecosystem services to changing pressures, Ecosyst. Serv., 24, 160–169, https://doi.org/10.1016/j.ecoser.2017.02.016, 2017.
Huang, S., Gan, Y., Chen, N., Wang, C., Zhang, X., and Li, C., Horton, D.: Urbanization enhances channel and surface runoff: A quantitative analysis using both physical and empirical models over the Yangtze River basin, J. Hydrol., 635, 131194, https://doi.org/10.1016/j.jhydrol.2024.131194, 2024.
IPBES: Global assessment report on biodiversity and ecosystem services of the Intergovernmental Science-Policy Platform on Biodiversity and Ecosystem Services, IPBES Secretariat, Bonn, Germany, 1148, https://www.ipbes.net/global-assessment (last access: 1 January 2025), 2019a.
IPBES: Summary for policymakers of the global assessment report on biodiversity and ecosystem services of the Intergovernmental Science-Policy Platform on Biodiversity and Ecosystem Services, IPBES Secretariat, Bonn, Germany, 45, 680–681, Zenodo, https://doi.org/10.5281/zenodo.3553579, 2019b.
Jiang, W., Wu, T., and Fu, B.: The value of ecosystem services in China: A systematic review for twenty years, Ecosyst. Serv., 52, 101365, https://doi.org/10.1016/j.ecoser.2021.101365, 2021.
Jiao, W., Wang, L., Smith, W. K., Chang, Q., Wang, H., and D'Odorico, P.: Observed increasing water constraint on vegetation growth over the last three decades, Nat. Commun., 12, 3777, https://doi.org/10.1038/s41467-021-24016-9, 2021.
Kuang, W., Zhang, S., Li, X., and Lu, D.: A 30 m resolution dataset of China's urban impervious surface area and green space, 2000–2018, Earth Syst. Sci. Data, 13, 63–82, https://doi.org/10.5194/essd-13-63-2021, 2021.
Le Noë, J., Manzoni, S., Abramoff, R., Bölscher, T., Bruni, E., Cardinael, R., Ciais, P., Chenu, C., Clivot, H., Derrien, D., Ferchaud, F., Garnier, P., Goll, D., Lashermes, G., Martin, M., Rasse, D., Rees, F., Sainte-Marie, J., Salmon, E., Schiedung, M., Schimel, J., Wieder, W., Abiven, S., Barré, P., Cécillon, L., and Guenet, B.: Soil organic carbon models need independent time-series validation for reliable prediction, Commun. Earth Environ., 4, 158, https://doi.org/10.1038/s43247-023-00830-5, 2023.
Li, C., Gao, Z., Sun, B., Wu, J., Wang, H., and Ding, X.: Ecological restoration effects of the Beijing-Tianjin Sandstorm Source Control Project in China since 2000, Ecol. Indic., 146, 109782, https://doi.org/10.1016/j.ecolind.2022.109782, 2023c.
Li, F., Wang, F., Liu, H., Huang, K., Yu, Y., and Huang, B.: A comparative analysis of ecosystem service valuation methods: Taking Beijing, China as a case, Ecol. Indic., 154, 110872, https://doi.org/10.1016/j.ecolind.2023.110872, 2023d.
Li, H., Wu, Y., Liu, S., and Xiao, J.: Regional contributions to interannual variability of net primary production and climatic attributions, Agr. Forest Meteorol., 303, 108384, https://doi.org/10.1016/j.agrformet.2021.108384, 2021.
Li, J., He, H., Zeng, Q., Chen, L., and Sun, R.: A Chinese soil conservation dataset preventing soil water erosion from 1992 to 2019, Sci. Data, 10, 319, https://doi.org/10.1038/s41597-023-02246-4, 2023b.
Li, Z., Chen, X., Qi, J., Xu, C., An, J., and Chen, J.: Accuracy assessment of land cover products in China from 2000 to 2020, Sci. Rep., 13, 12936, https://doi.org/10.1038/s41598-023-39963-0, 2023a.
Lin, Y. and Roy, D.: Spatially and temporally complete Landsat reflectance time series modelling: The fill-and-fit approach, Remote Sens. Environ., 241, 111718, https://doi.org/10.1016/j.rse.2020.111718, 2021.
Liu, X., Zhao, W., Yao, Y., and Pereira, P.: The rising human footprint in the Tibetan Pateau threatens the effectiveness of ecological restoration on vegetation growth, J. Environ. Manage., 351, 119963, https://doi.org/10.1016/j.jenvman.2023.119963, 2024.
Liu, Y., Zhao, W. W., Zhang, Z. J., Hua, T., and Ferreira, C.: The role of nature reserves on conservation effectiveness of ecosystem services in China, J. Environ. Manage., 342, 118228, https://doi.org/10.1016/j.jenvman.2023.118228, 2023.
Liu, Y., Zhao, W. W., Zhang, Z. J., Ding, J. Y., and Wang, L. X.: A 30-meter spatial resolution dataset of ecosystem services in China for 2000, 2010, and 2020, Science Data Bank [data set], https://doi.org/10.57760/sciencedb.20797, 2025.
Lu, F., Hu, H., Sun, W., and Yu, G.: Effects of national ecological restoration projects on carbon sequestration in China from 2001 to 2010, P. Natl. Acad. Sci. USA, 115, 4039–4044, https://doi.org/10.1073/pnas.1700294115, 2018.
Markham, B. L. and Helder, D. L.: Forty-year calibrated record of earth-reflected radiance from Landsat: a review, Remote Sens. Environ., 122, 30–40, https://doi.org/10.1016/j.rse.2011.06.026, 2012.
McCool, D. K., Brown, L. C., Foster, G. R., Mutchler, C. K., and Meyer, L. D.: Revised slope steepness factor for the Universal Soil Loss Equation, Transactions of the ASAE, 30, 1387–1396, https://doi.org/10.13031/2013.30576, 1987.
Millennium Ecosystem Assessment: Ecosystems and Human Well Being: Synthesis, Washington, DC, Island Press, https://www.wri.org/research/millennium-ecosystem-assessment-ecosystems-and-human-well-being (last access: 1 January 2025), 2005.
Mugiraneza, T., Ban, Y., and Haas, J.: Urban land cover dynamics and their impact on ecosystem services in Kigali, Rwanda using multi-temporal Landsat data, RSASE, 13, 234–246, https://doi.org/10.1016/j.rsase.2018.11.001, 2019.
Ouyang, Z., Zheng, H., Xiao, Y., Polasky, S., Liu, J., Xu, W., Wang, Q., Zhang, L., Xiao, Y., Rao, E., Jiang, N., Lu, F., Wang, X., Yang, G., Gong, S., Wu, B., Zeng, Y., Yang, W., and Daily, G. C.: Improvements in ecosystem services from investments in natural capital, Sci. Adv., 2, e1500961, https://doi.org/10.1126/science.aaf2295, 2016.
Peng, Y., Chen, W., Pan, S., Gu, T., and Zeng, J.: Identifying the driving forces of global ecosystem services balance, 2000–2020, J. Clean. Prod., 426, 13901, https://doi.org/10.1016/j.jclepro.2023.139019, 2023.
Piao, S., Wang, X., Park, T., Chen, C., Lian, X., He, Y., Bjerke, J., Chen, A., Ciais, P., Tømmervik, H., Nemani, R., and Myneni, B.: Characteristics, drivers and feedbacks of global greening, Nat. Rev. Earth Environ., 1, 14–27, https://doi.org/10.1038/s43017-019-0001-x, 2020.
Rao, W., Shen, Z., and Duan, X.: Spatiotemporal patterns and drivers of soil erosion in Yunnan, Southwest China: RULSE assessments for recent 30 years and future predictions based on CMIP6, Catena, 220, 106703, https://doi.org/10.1016/j.catena.2022.106703, 2023.
Redhead, J., Stratford, C., Sharps, K., Jones, L., Ziv, G., Clarke, D., Oliver, T., and Bullock, J.: Empirical validation of the InVEST water yield ecosystem service model at a national scale, Sci. Total Environ., 569–570, 1418–1426, https://doi.org/10.1016/j.scitotenv.2016.06.227, 2016.
Richardson, A. D., Hollinger, D. Y., Burba, G. G., Davis, K. J., Flanagan, L. B., Katul, G. G., Munger, J. W., Ricciuto, D. M., Stoy, P. C., Suyker, A. E., Verma, S. B., and Wofsy, S. C.: A multi-site analysis of random error in tower-based measurements of carbon and energy fluxes, Agr. Forest. Meteorol., 136, 1–18, https://doi.org/10.1016/j.agrformet.2006.01.007, 2006.
Spawn, S. A. and Gibbs, H. K.: Global aboveground and belowground biomass carbon density maps for the year 2010, ORNL DAAC [data set], https://doi.org/10.3334/ORNLDAAC/1763, 2020.
Song, Z., Yang, H., Huang, X., and Ma, M.: The spatiotemporal pattern and influencing factors of land surface temperature change in China from 2003 to 2019, Int. J. Appl. Earth Obs. Geoinf., 104, 102537, https://doi.org/10.1016/j.jag.2021.102537, 2021.
Sun, J., Yue, Y., and Niu, H.: Evaluation of NPP using three models compared with MODIS-NPP data over China, PLoS ONE, 16, e0252149, https://doi.org/10.1371/journal.pone.0252149, 2021.
Walther, F., Barton, D., Schwaab, J., Kato-Huerta, J., Immerzeel, B., Adamescu, M., Andersen, E., Coyote, M., Arany, I., Balzan, M., Bruggeman, A., Carvalho-Santos, C., Cazacu, C., Geneletti, D., Giuca, R., Inácio, M., Lagabrielle, E., Lange, S., Le Clec'h, S., Vanessa Lim, Z., Mörtberg, U., Nedkov, S., Portela, A., Porucznik, A., Racoviceanu, T., Rendón, P., Ribeiro, D., Seguin, J., Hribar, M., Stoycheva, V., Vejre, H., Zoumides, C., and Grêt-Regamey, A.: Uncertainties in ecosystem services assessments and their implications for decision support – A semi-systematic literature review, Ecosyst. Serv., 73, 101714, https://doi.org/10.1016/j.ecoser.2025.101714, 2025.
Wan, Z.: New refinements and validation of the collection-6 MODIS land-surface temperature/emissivity product, Remote Sens. Environ., 140, 36–45, https://doi.org/10.1016/j.rse.2006.06.026, 2014.
Wang, H., Zhan, J., Wang, C., Chen, B., Yang, Z., and Bai, C.: Short-term fluctuations of ecosystem services beneath long-term trends, Resour. Conserv. Recy., 203, 107454, https://doi.org/10.1016/j.resconrec.2024.107454, 2024.
Wang, L., Jiao, W., MacBean, N., Rulli, M. C., Manzoni, S., Vico, G., and D'Odorico, P.: Dryland productivity under a changing climate, Nat. Clim. Chang., 12, 981–994, https://doi.org/10.1038/s41558-022-01499-y, 2022.
Wang, S., Fu, B., Piao, S., Lu, Y., Ciais., Feng, X., and Wang, Y: Reduced sediment transport in the Yellow River due to anthropogenic changes, Nat. Geosci., 9, 38–41, https://doi.org/10.1038/ngeo2602, 2016.
Williams, J. R., Jones, C. A., and Dyke, P. T.: A modeling approach to determining the relationship between erosion and soil productivity, Transactions of the ASAE, 27, 129–144, https://doi.org/10.13031/2013.32748, 1984.
Wischmeier, W. H. and Smith, D. D.: Predicting Rainfall Erosion Losses – A Guide to Conservation Planning, U.S. Department of Agriculture, Washington, DC, Agriculture Handbook No. 537, https://babel.hathitrust.org/cgi/pt?id=uva.x001754985&seq=1 (last access: 1 January 2025), 1978.
Wu, Q., Yang, L., and Mi, J.: Detecting the effects of opencast mining on ecosystem services value in arid and semi-arid areas based on time-series remote sensing images and Google Earth Engine (GEE), BMC, Ecol. Evo., 24, 28, https://doi.org/10.1186/s12862-024-02213-6, 2024.
Xiao, Q., Hu, D., and Xiao, Y.: Assessing changes in soil conservation ecosystem services and causal factors in the Three Gorges Reservoir region of China, J. Clean Prod., 163, S172–S180, https://doi.org/10.1016/j.jclepro.2016.09.012, 2017.
Xu, W., Xiao, Y., Zhang, J., Yang, W., Zhang, L., Zheng, H., Liu, J., Polasky, S., Jiang, L., Xiao, Y., Shi, X., Rao, E., Lu, F., Wang, X., Daily, G. C., and Ouyang, Z.: Strengthening protected areas for biodiversity and ecosystem services in China, P. Natl. Acad. Sci. USA, 114, 1601–1606, https://doi.org/10.1073/pnas.1620503114, 2017.
Yan, J., Wang, S., Feng, J., He, H., Wang, L., Sun, Z., and Zheng, C.: New 30-m resolution dataset reveals declining soil erosion with regional increases across Chinese mainland (1990–2022), Remote Sens. Environ., 323, 114681, https://doi.org/10.1016/j.rse.2025.114681, 2025.
Yang, J. and Huang, X.: The 30 m annual land cover dataset and its dynamics in China from 1990 to 2019, Earth Syst. Sci. Data, 13, 3907–3925, https://doi.org/10.5194/essd-13-3907-2021, 2021.
Yang, Y., Xiao, P., Feng, X., and Li, H.: Accuracy assessment of seven global land cover datasets over China, ISPRS J. Photogramm. Remote Sens., 125, 156–173, https://doi.org/10.1016/j.isprsjprs.2017.01.016, 2017.
Yang, Y., Roderick, M. L., Guo, H., Miralles, D., Zhang, L., Fatichi, S., Luo, Y., Zhang, Y., McVicar, T., Tu, Z., Keenan, T., Fisher, J., Gan, R., Zhang, X., Piao, S., Zhang, B., and Yang, D.: Evapotranspiration on a greening Earth, Nat. Rev. Earth Environ., 4, 626–641, https://doi.org/10.1038/s43017-023-00464-3, 2023.
Yin, L., Wang, W., and Wang, Y.: National Ecological Barrier Zone 1-km Resolution Water Production Dataset (2000–2015), Journal of Global Change Data & Discovery, 4, 332–337, https://doi.org/10.3974/geodb.2020.03.18.V1, 2020.
Zhao, B., Mao, K., Cai, Y., Shi, J., Li, Z., Qin, Z., Meng, X., Shen, X., and Guo, Z.: A combined Terra and Aqua MODIS land surface temperature and meteorological station data product for China from 2003 to 2017, Earth Syst. Sci. Data, 12, 2555–2577, https://doi.org/10.5194/essd-12-2555-2020, 2020.
Zhao, M. and Running, S. W.: Drought-induced reduction in global terrestrial net primary production from 2000 through 2009, Science, 329, 940–943, https://doi.org/10.1126/science.1192666, 2010.
Zhao, M., Zhang, J., Velicogna, L., Liang, C., and Li, Z.: Ecological restoration impact on total terrestrial water storage, Nat. Sustain., 4, 56–62, https://doi.org/10.1038/s41893-020-00600-7, 2021.
Zhang, Z., Zhao, W., Liu, Y., and Pereira, P.: Impacts of urbanisation on vegetation dynamics in Chinese cities, Environ. Impact Assess. Rev., 103, 107227, https://doi.org/10.1016/j.eiar.2023.107227, 2023.
Zhou, G., Wei, X., Chen, X., Zhou, P., Liu, X., Xiao, Y., Sun, G., Scott, D., Zhou, S., Han, L., and Su, Y.: Global pattern for the effect of climate and land cover on water yield, Nat. Commun., 6, 5918, https://doi.org/10.1038/ncomms6918, 2015.
Zhu, W. Q.: Estimation of net primary productivity of Chinese terrestrial vegetation based on remote sensing and its relationship with global climate change, PhD thesis, Beijing Normal University, Beijing, https://d.wanfangdata.com.cn/thesis/ChhUaGVzaXNOZXdTM jAyNDA5MjAxNTE3MjUSB1k3NTU2NzMaCG8xbm0yMW Z0 (last access: 1 January 2025), 2005.
Zobeck, T. M., Parker, N. C., Haskell, S., and Guoding, K.: Scaling up from field to region for wind erosion prediction using a field-scale wind erosion model and GIS, Agric. Ecosyst. Environ., 82, 247–259, https://doi.org/10.1016/S0167-8809(00)00229-2, 2000.
Zong, R., Fang, N., Zeng, Y., Lu, X., Wang, Z., Dai, W., and Shi, Z.: Soil Conservation Benefits of Ecological Programs Promote Sustainable Restoration, Earth's Future, 13, e2024EF005287, https://doi.org/10.1029/2024EF005287, 2025.