the Creative Commons Attribution 4.0 License.
the Creative Commons Attribution 4.0 License.
 | 03 Mar 2025
Bivalve monitoring over French coasts: multi-decadal records of carbon and nitrogen elemental and isotopic ratios as ecological indicators of global change
Camilla Liénart
Alan Fournioux
Andrius Garbaras
Hugues Blanchet
Nicolas Briant
Stanislas F. Dubois
Aline Gangnery
Anne Grouhel Pellouin
Pauline Le Monier
Arnaud Lheureux
Xavier de Montaudouin
Nicolas Savoye
Recent changes in climate and environment, influenced by both global and local factors, have had profound impacts on coastal ecosystem functioning and trajectories. By examining archived samples from ongoing ecological monitoring efforts, particularly focusing on bivalves like mussels and oysters, we gain a valuable long-term perspective on how ecosystems are responding at various scales. We conducted analyses on carbon and nitrogen content (C %, N %) as well as elemental and isotopic ratios (C:N, δ13C, δ15N) of mussel and oyster soft tissues collected annually at 33 sites along the French coast from 1981 to 2021. This extensive dataset (https://doi.org/10.17882/100583, Liénart et al., 2024a) offers a comprehensive view spanning multiple decades and ecosystems, allowing us to track how coastal ecosystems and marine species record changing climate, physical-chemical environments, and organic matter cycles. Additionally, these data are crucial for establishing isotope baselines for studying food webs. Ultimately, this dataset provides valuable information for more effective ecosystem conservation and management strategies in our rapidly changing world.
- Article
(4414 KB) - Full-text XML
- BibTeX
- EndNote


Over the past 2 decades, rapid and sometimes abrupt changes in climate and environmental conditions have significantly impacted ecosystem functioning with human activities widely acknowledged as a primary factor driving and modulating these changes (Cloern et al., 2016). At the land–ocean interface, coastal and estuarine environments are particularly vulnerable to climate change alongside local human-induced pressures such as pollution and habitat destruction (Harley et al., 2006; Lotze et al., 2006). In such dynamic environments, pressures vary simultaneously, with different directions and magnitudes, over different time (short- vs. long-term) and spatial (global vs. local) scales (Cabral et al., 2019). Hence, a fundamental challenge persists in elucidating how the various facets of global change affect coastal ecosystem responses at local and regional scales and consequently the services they provide to human societies. Recurrent ecological monitoring programs conducted at large spatial scales are valuable in assessing ecosystem status and the pressures affecting important properties (e.g., biodiversity, carbon, and nutrient cycling) and detecting changes over multiple decades (Hofmann et al., 2013; Sukhotin and Berger, 2013). Yet only a few ecological indicators are both integrative (i.e., measured in long-living species' tissues) and sensitive enough (e.g., measured at a molecular level, such as metallothionein, used as a biomarker of metal exposure; Amiard et al., 2006) to various disturbances while also exhibiting predictable responses with a low variability in its response (Dale and Beyeler, 2001; Niemi and McDonald, 2004).
Filter-feeding bivalves include important reef habitat forming species, which promote benthic–pelagic coupling and nutrient recycling (Ray and Fulweiler, 2020). Some of them, such as mussels (Mytilus) and oysters (Magallana gigas, formerly Crassostrea gigas), represent an economical value through aquaculture and are widely used as bioindicators for climate and environmental change as well as contaminant monitoring (Kanduč et al., 2018; Karlson and Faxneld, 2021; Mazaleyrat et al., 2022; Briand et al., 2023; Chahouri et al., 2023; Liénart et al., 2024b). The use of ecological indicators is the basis of ecosystem monitoring to detect early-warning signals in ecosystem changes or disturbances (Dale and Beyeler, 2001). Indeed, bivalve tissues record the environmental conditions of their sampling area over time. Since the end of the 1970s, the French monitoring network ROCCH (Réseau d'Observation de la Contamination CHimique, coordinated by Ifremer) has been monitoring chemical contamination in the environment along French coastlines using oysters and mussels as bioindicators (Briant et al., 2018; Chahouri et al., 2023). The ROCCH network focuses on chemical contaminants, but its archived tissues represent a large sample bank that can be useful for other ecological purposes, such as understanding long-term changes in ecosystem functioning and responses to global or local pressures.
The C:N ratio is mostly an indicator of bivalve condition and physiology, reflecting the balance between organisms' requirements and elemental availability in the environment; i.e., ecological stoichiometry sensu Elser et al., 2003; N content increases (thus the C:N ratio decreases) as the protein content increases whereas C content increases (thus the C:N ratio increases) as the lipid or carbohydrate content increases. When measured long-term in bivalve tissues, such a dataset allows scientists to understand ecosystem responses to the changing physical–chemical environment and organic matter cycling and to track trends in climate changes and its effect on coastal ecosystems (Liénart et al., 2020, 2024b). We took advantage of the large-scale multi-decadal sample bank of the ROCCH monitoring network to analyze C and N content as well as C:N, δ13C, and δ15N ratios in mussels (Mytilus edulis, Mytilus galloprovincialis) and oysters (Magallana gigas) tissues from a set of 33 stations distributed along the French coasts. In this paper, we present a unique dataset of multi-decadal and multi-ecosystem carbon and nitrogen content and elemental and isotopic ratios from three widespread bivalve species. Ultimately, it could provide valuable input for developing predictive models of bivalve physiology (Emmery et al., 2011) or trophic ecology (Marín Leal et al., 2008), explaining the ecosystem response to future environmental changes and possibly forecasting potential impacts of climate change and human activities on coastal ecosystems. Overall, this long-term dataset provides insights into ecosystem dynamics and is essential for advancing scientific understanding in the face of ongoing environmental challenges.
2.1 ROCCH: network and sampling procedure
Over the last 4 decades, the French national monitoring network for chemical contaminant, ROCCH (Réseau d'Observation de la Contamination CHimique), coordinated by Ifremer (Institut français de recherche pour l'exploitation de la mer, https://littoral.ifremer.fr/Reseaux-de-surveillance/Environnement/ROCCH-Reseau-d-Observation-de-la-Contamination, last access: 19 February 2025), has been annually sampling bivalves as bioindicators of chemical contamination. The number of stations has varied since the initiation of the network, so has the sampling frequency. Approximately 150 stations are nowadays monitored along the French coastlines, with the historical station having been monitored since 1979. Sampling takes place once a year during winter (currently mid-February), with a tolerance of one tidal cycle before and after the target date, meaning a 6-week amplitude spreading from the end of January to the beginning of March on all sites of the network. Three different species are targeted – namely, the Pacific oyster (Magallana gigas) and the blue mussel (Mytilus edulis) in the English Channel and Atlantic coastal areas, and Mytilus galloprovincialis in the Mediterranean coastal area.
The sampling protocol has been identical since the start of the monitoring and is designed to acquire bivalve samples with consistent and homogeneous characteristics for measuring chemical concentrations of contaminants. Bivalves are collected alive at fixed points (maximum tolerance of 180 m around the selected point) chosen so they are away from known anthropogenic discharges. Bivalves are sourced from either wild beds or dedicated rearing facilities, ensuring that they remain on site for at least 6 months before being sampled. The selected individuals are adults of the same species and of uniform size (30 to 60 mm long for mussels, 90 to 140 mm long for oysters, i.e., 2 to 3 years old). A minimum of 50 mussels or 10 oysters is required to constitute a representative pooled sample accounting for inter-individual variability and to get enough material for chemical analysis and long-term storage. Bivalves are first depurated for 18 to 26 h in decanted seawater collected near the collection site. Next, once extracted from the shell, the whole bodies (i.e., total soft tissues) of each individual are pooled and drained all together for 30 min. The resulting pooled bivalve samples are placed in clean glass containers (washed and baked for 8 h at 450 °C) covered with calcined aluminum foil and sealed with a plastic lid and frozen (−20 °C). Frozen samples are sent to the central laboratory in Nantes (France), where the samples are thawed, grounded, and homogenized in a stainless-steel-bladed blender and then freeze-dried. After the chemical analysis of a sample aliquot, the containers are stored indefinitely at the Nantes Ifremer center at room temperature, protected from light, and under moisture-regulation control to prevent moisture pick-up. The original protocol (Grouhel, 2023, in French) is available at https://doi.org/10.13155/97878.
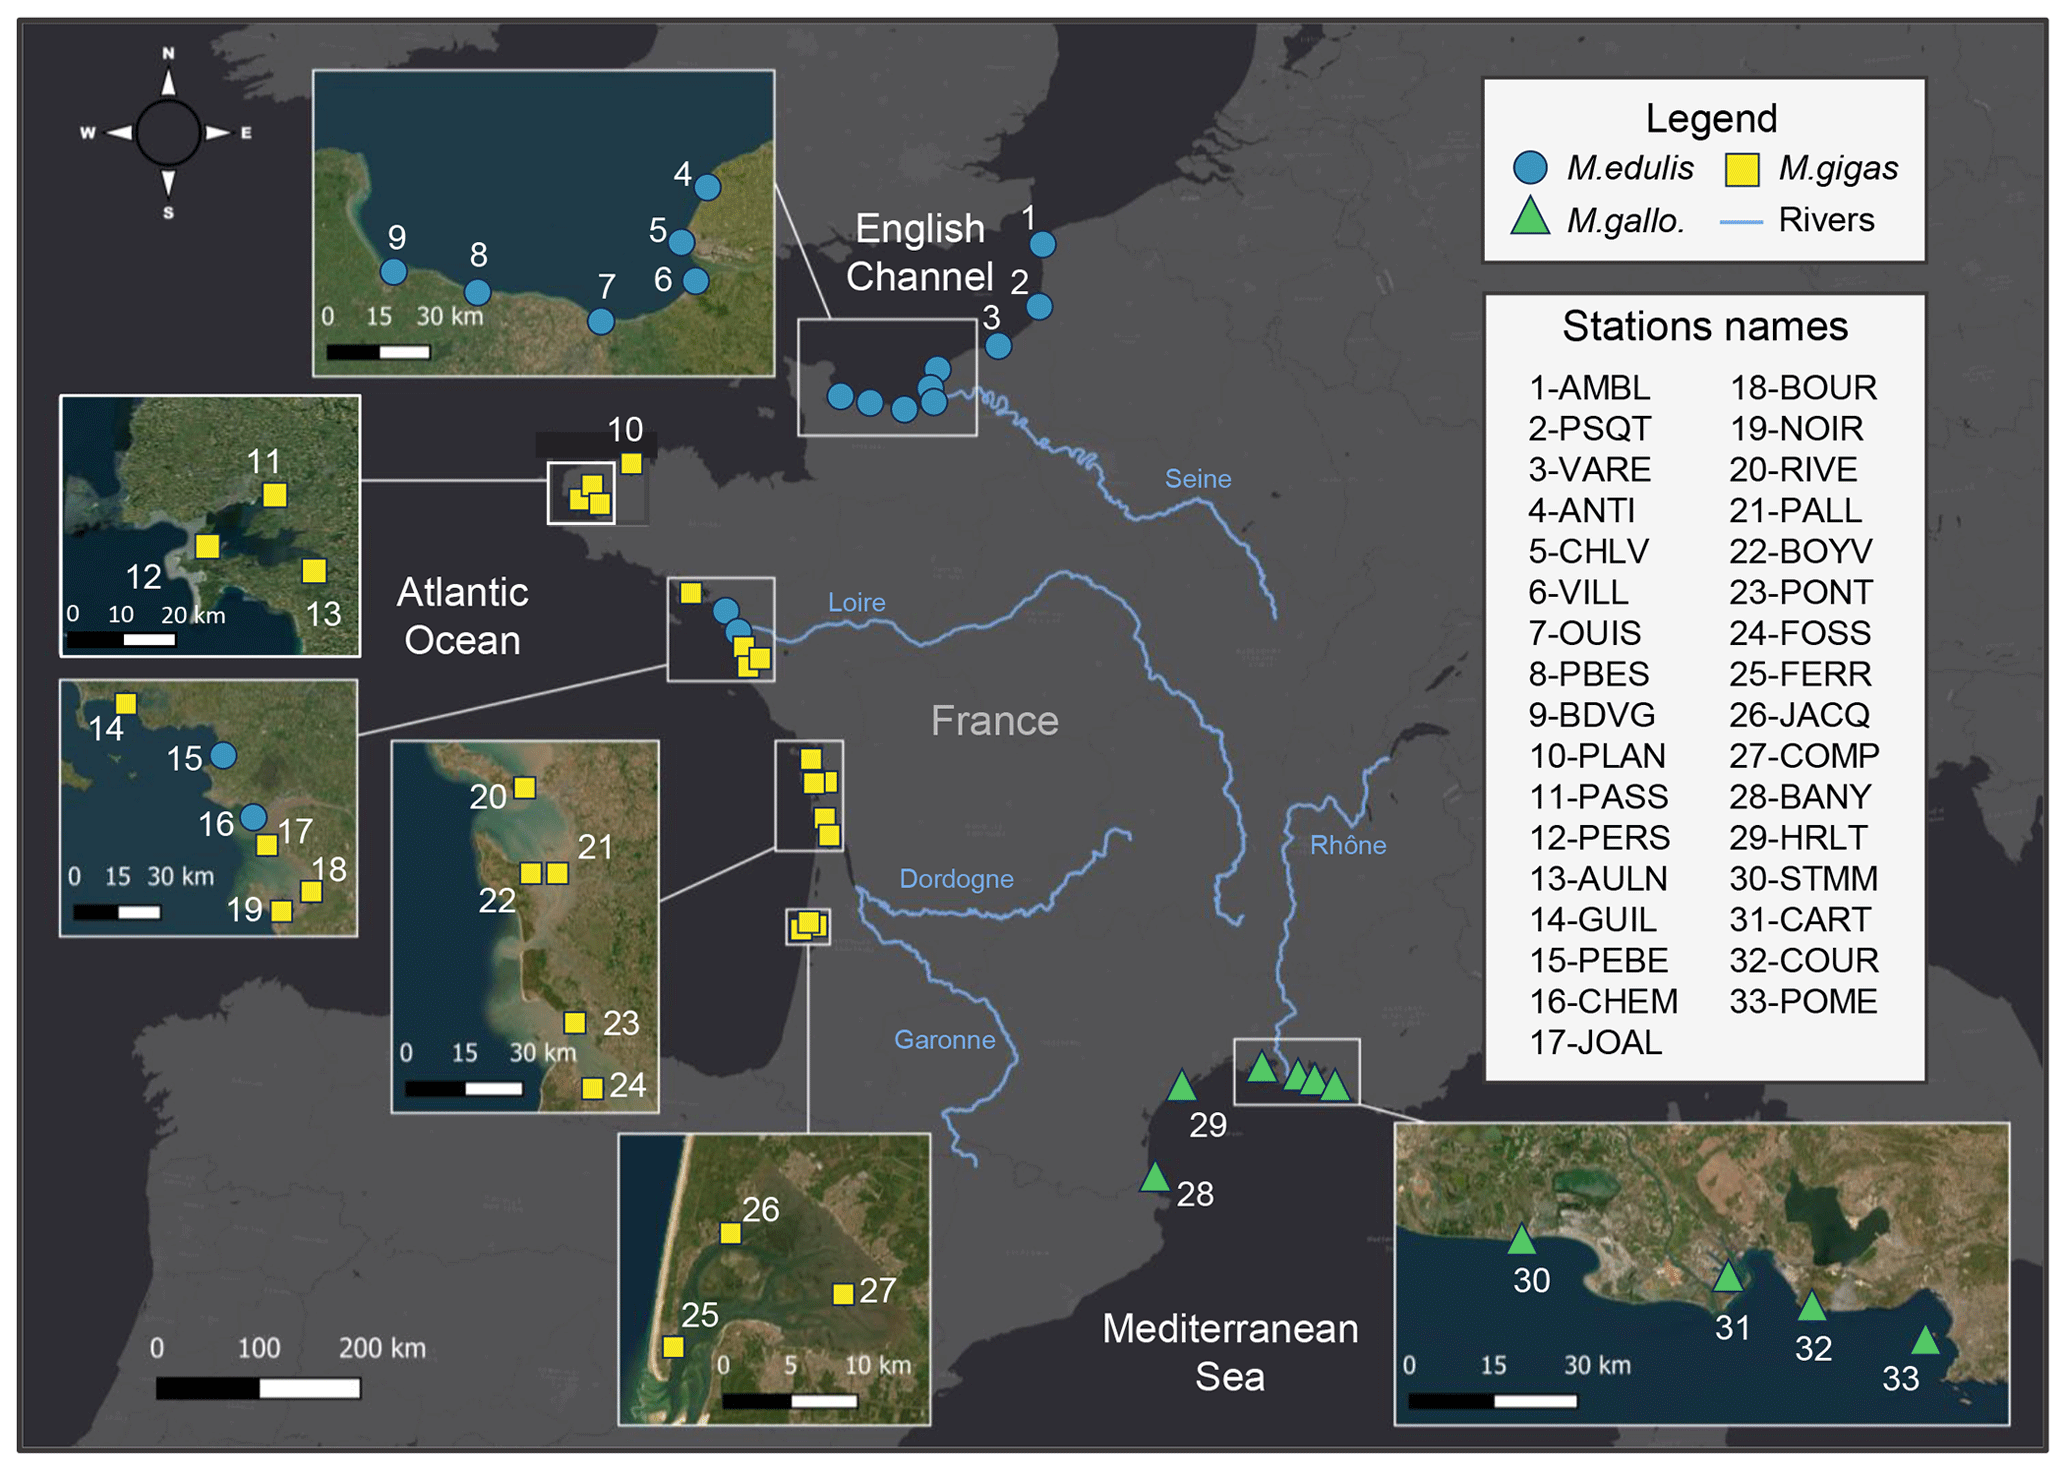
Figure 1Map of the 33 stations from the three sea coastal areas of France analyzed for bivalves' elemental and isotopic ratios. Bivalve species are the mussels Mytilus edulis and Mytilus galloprovincialis and the oyster Magallana gigas. The main rivers are presented in blue. Basemap source: Esri, HERE, © OpenStreetMap contributors, and the GIS user community.
2.2 Study sites and bivalve dataset
In the present dataset, bivalve samples were selected from 33 stations of the ROCCH network distributed along the three French sea coastal areas: the English Channel (EC, 10 stations), the Atlantic Ocean (AO, 17 stations), and the Mediterranean Sea (MS, 6 stations; Fig. 1, Table 1). The stations were selected to span over a wide diversity of geomorphological and environmental conditions encountered by bivalves along the French coastlines. Ecosystems vary between open-sea coasts (rocky or sandy littoral shores), open or semi-enclosed bays and rias, lagoons (shallow waterbodies almost closed by narrow landforms), and estuary mouths, ranging from eutrophic to oligotrophic systems, under temperate oceanic or Mediterranean climates and along gradients of influence from the main French rivers (Seine, Loire, Garonne, Dordogne, and Rhône; Table 2). The complete dataset consists of 1141 bivalve winter samples for time series spanning 11 to 40 years (depending on stations) over the period 1981–2021 (Table 1; https://doi.org/10.17882/100583, Liénart et al., 2024a).
2.3 Sample analysis and data quality
Aliquots of 400–700 µg of each dry and grounded archived sample of pooled bivalve tissues (not acidified) were analyzed for carbon and nitrogen elemental and isotopic composition (C, N, δ13C, δ15N) at the Center for Physical Science and Technology (Vilnius, Lithuania) with a FlashEA 1112 Series Elemental Analyzer (Thermo Finnigan) connected to a Delta V Advantage isotope ratio mass spectrometer (Thermo Fisher). Carbon and nitrogen elemental contents are expressed as the percentage (%) of mass ratio (g g−1) dry weight, while the C:N ratio is express in mol mol−1. Isotope ratios are expressed using the conventional delta notation: δ13Csample or δ15N, where or , in per mill deviation (‰) from international reference, Vienna Pee Dee Belemnite for δ13C and atmospheric N2 for δ15N. The mass spectrometer was calibrated against external certified standards (IAEA600, caffeine: δ13C of −27.77 ‰, δ15N of 1.00 ‰; USGS24, graphite: δ13C of −16.05 ‰) and internal standards (casein: δ13C of −23.30 ‰, δ15N of 6.30 ‰, glycine: δ13C of −45.20 ‰, δ15N of 3.00 ‰), controlled using IAEA-CH-6 (sucrose); IAEA-N-1 and IAEA-N-2 (ammonium sulfate) and USGS24 (graphite) were added at the beginning and after every 10 samples within each batch of samples to control analytical performance.

Figure 2Box plots of δ13C, δ15N, C, N and C:N values of bivalves for the 33 stations of the three French sea coastal areas over the period from 1981–2021 (Magallana gigas, Mytilus edulis, Mytilus galloprovincialis). The lower and upper edges of the box indicate the 25th and 75th percentiles and the middle line the median. The whiskers indicate the maximum/minimum values and the open circles the extreme values. The black arrows and associated values represent extreme values out of graphical bounds.
Analytical precision was always better than 0.2 ‰ for δ13C and δ15N and 0.1 mol mol−1 for the C:N ratio (median of the standard deviations of each standard used for all batches is 0.12 ‰ for δ13C and δ15N and 0.04 mol mol−1 for C:N ratio). Each sample was usually analyzed once, and for some peculiar values that seemed too high/low or outside of the average trend, samples were reanalyzed to verify the values. If values were similar (<0.5 ‰), we chose the average value of both analyses; otherwise, we chose the value associated with the best analytical precision. The dataset presented here consists of a single value for a given year at a given station (the standard deviation associated with repeated measures is not presented). One data point was considered an outlier in regard of its carbon isotope value (reanalysis confirmed the value): the station 14-PALL in 2014 (Fig. 2) exhibited unexpected low values of δ13C (−26.96 ‰) and high δ15N (10.26 ‰) compared to the average values at this station ( ‰, ‰), suggesting potential issues in the sampling and/or storage. This value was therefore removed from average calculations and statistical tests. Within the C and N % datasets, there were a few exceptionally high/low values (Fig. 2) for the stations 1-AMBL in 1990 (low C % only), 5-CLHV in 1994 (high C and N %), 18-BOUR in 1990 (low C and N %), 20-RIVE in 1989 (high C and N %), and 30-STMM in 2016 (high C and N %). These values must be considered with caution when interpreting or using C and N % data and were excluded from statistical calculations (see Sect. 2.4). Nevertheless, these data pairs all led to a consistent C:N ratio at these sites and years and were kept for C:N statistical analyses. All the other values presented in this dataset are considered analytically valid and were scientifically validated taking into consideration expert knowledge of each ecosystem.
Table 1Metadata description for the 33 stations analyzed for bivalve carbon and nitrogen elemental and isotopic ratios. The species studied are the mussels Mytilus edulis and Mytilus galloprovincialis and the oyster Magallana gigas. The station 31-CART represents two stations merged over time (at a distance of 720 m). The geographic coordinate system is WGS 84.
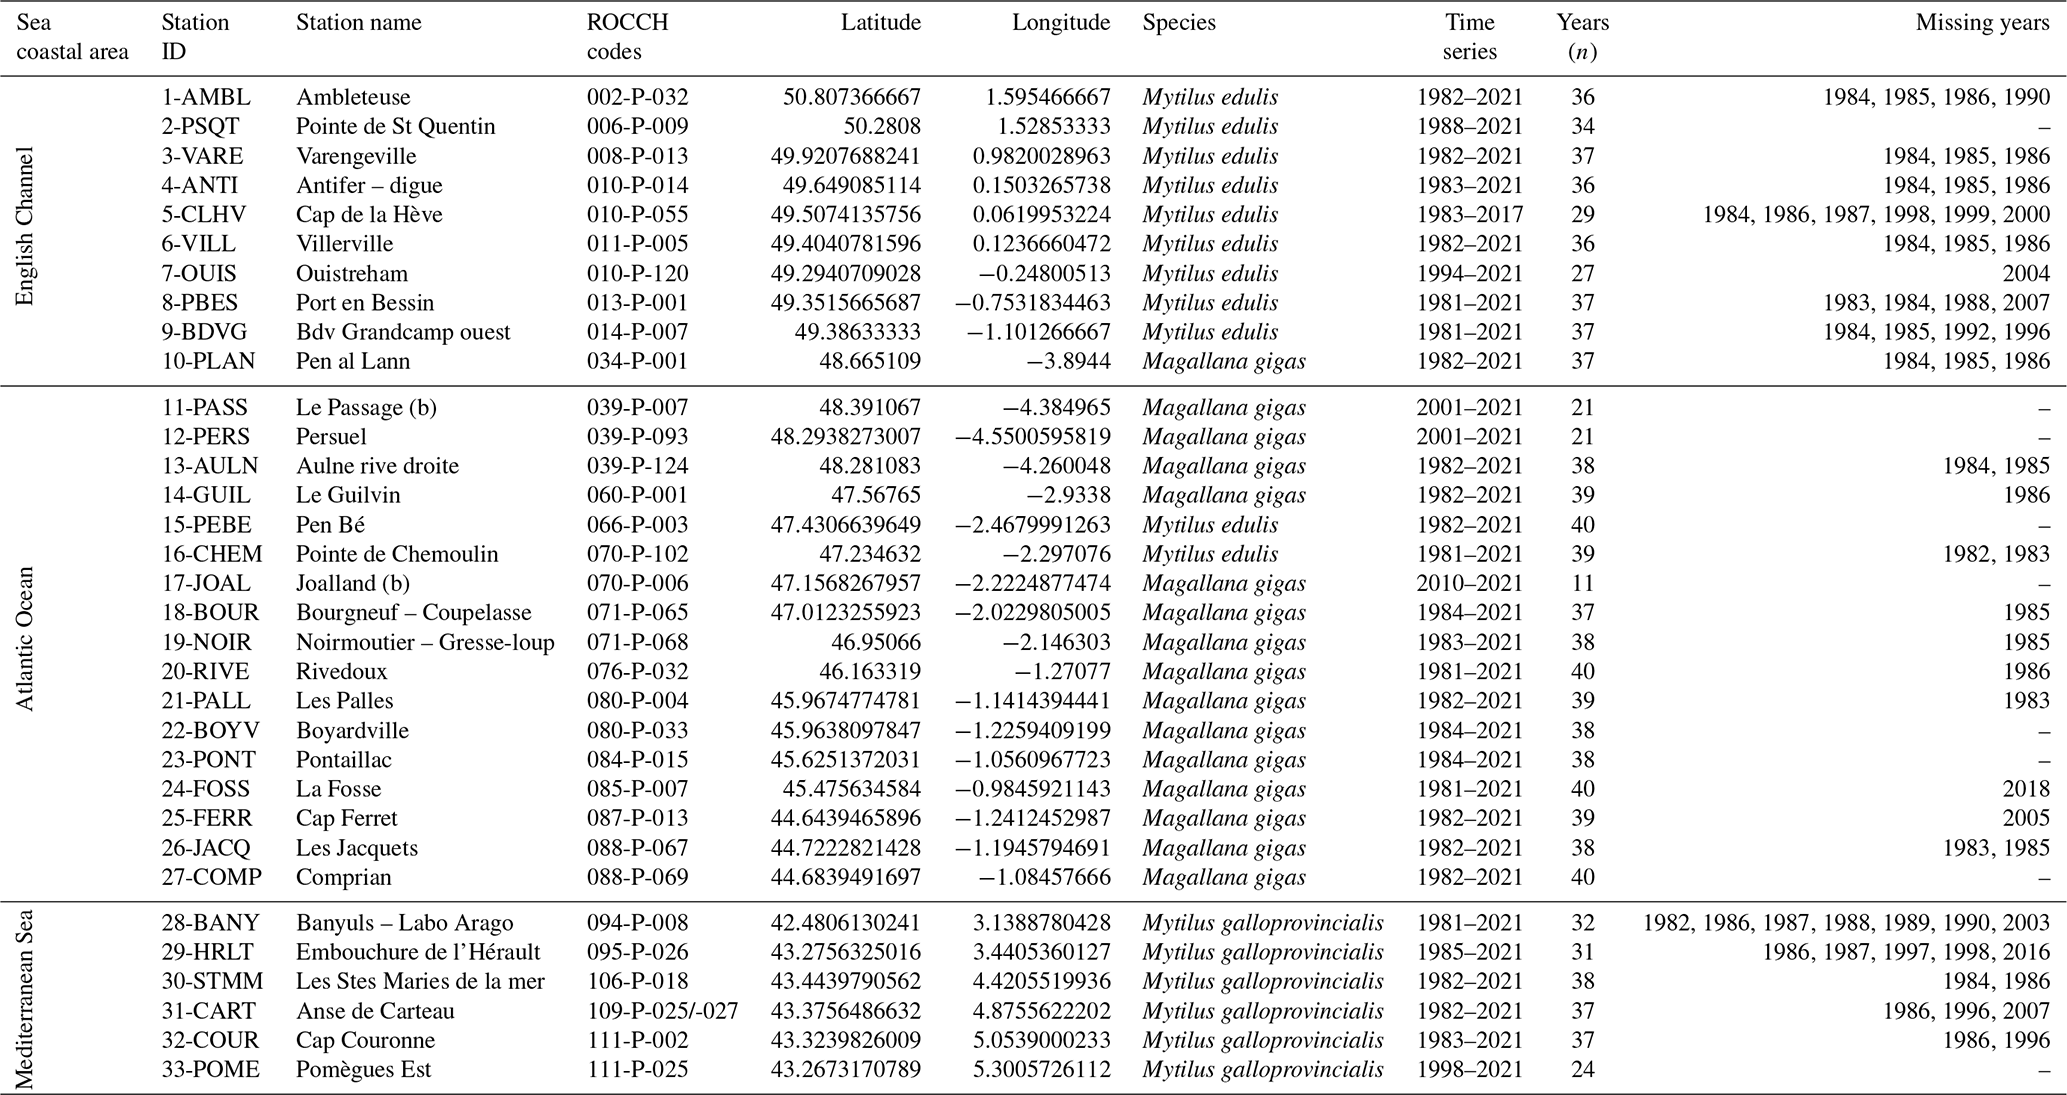
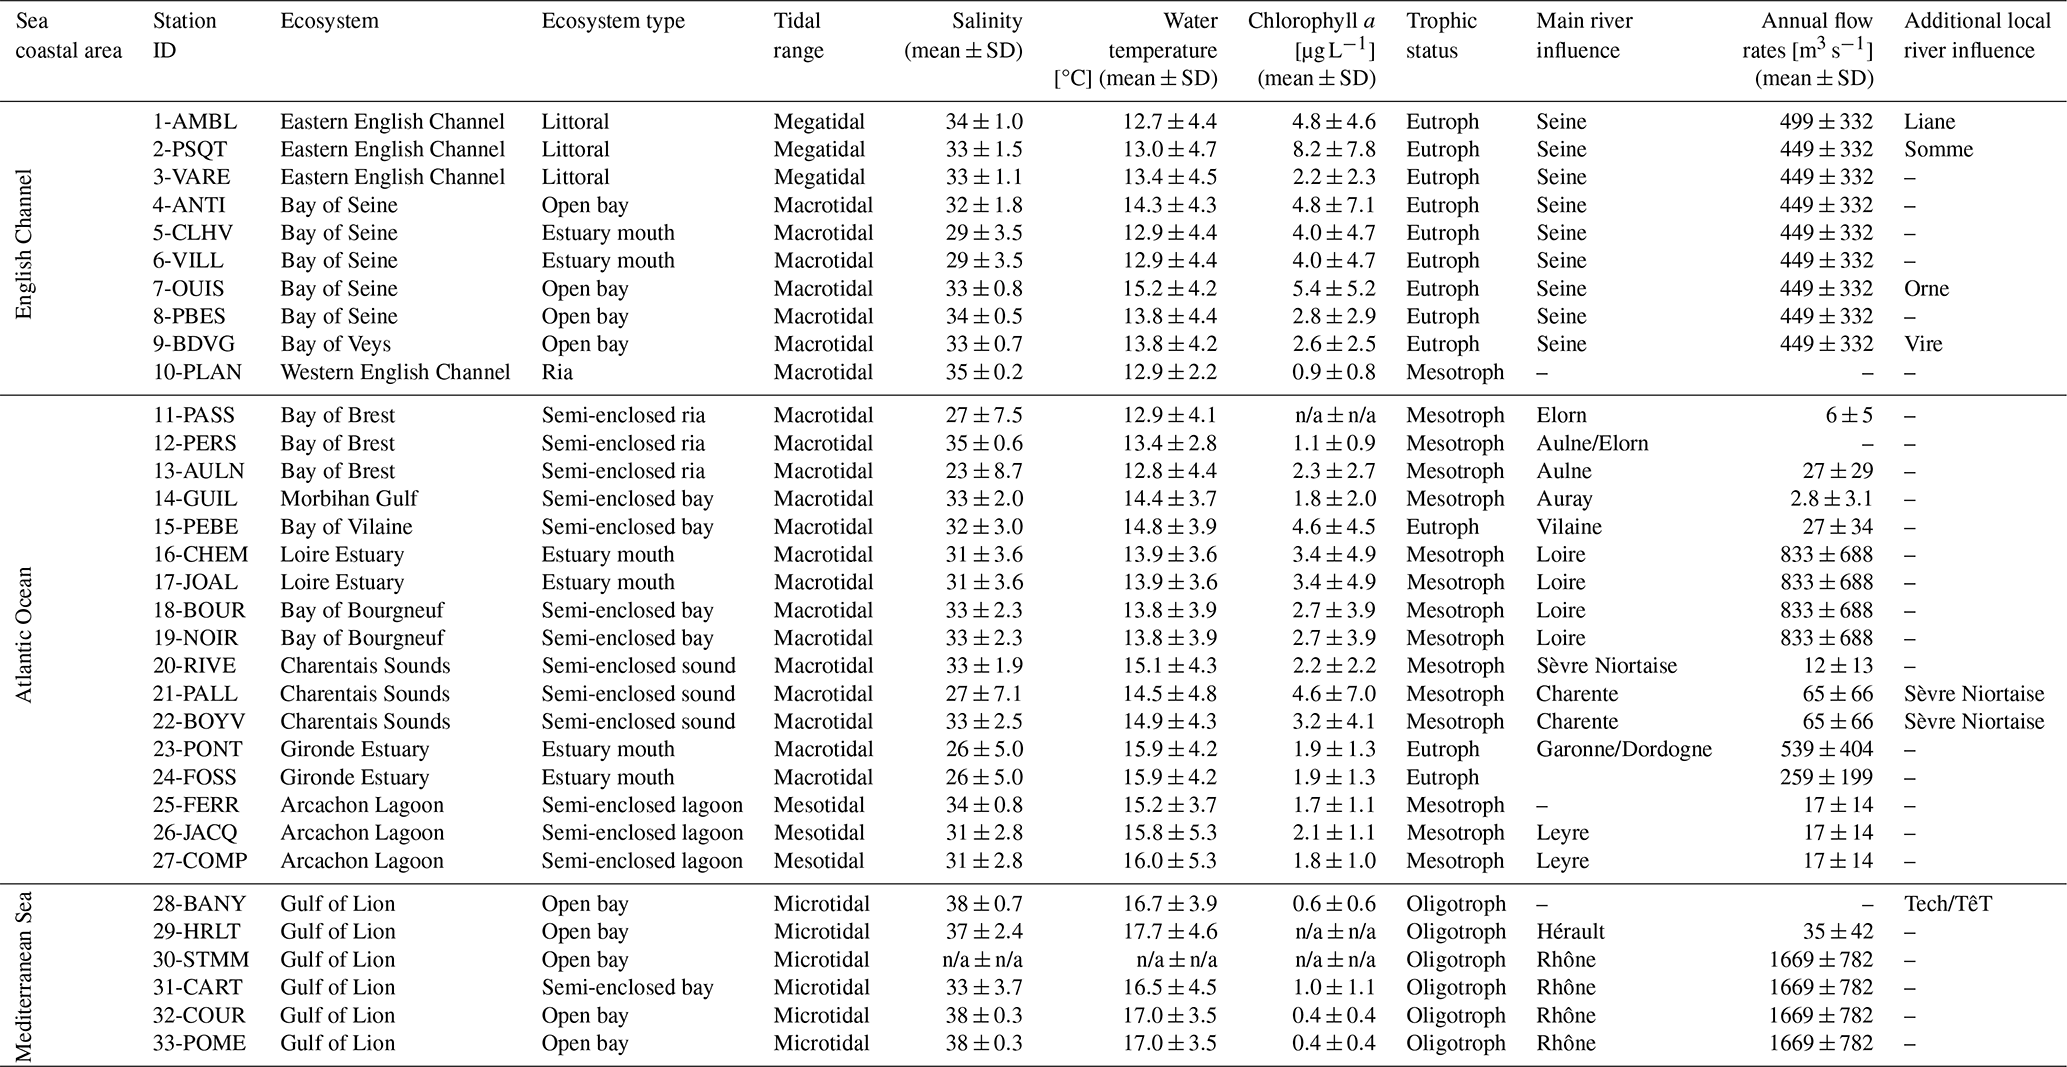
Table 2Environmental characteristics of the 33 stations studied for bivalve elemental and isotopic ratios. Average values for salinity, water temperature, and chlorophyll a were calculated, when available, over the studied period from monitoring stations located nearby bivalves sampling stations, with data retrieved from Surval (https://surval.ifremer.fr, last access: November 2022, Ifremer) and Somlit (https://www.somlit.fr/, last access: November 2022, INSU) databases. Average annual flow rates of the main rivers were calculated over the study period using the HydroPortail database (https://hydro.eaufrance.fr/, last access: November 2022). The average trophic status for each station is based on the literature (Liénart et al., 2017; Lheureux et al., 2023) and the knowledge of local experts. n/a: not available.
2.4 Statistical analyses
Statistical analyses were performed with the R software (R Core Team, 2022, version 4.3.1).
Due to the nature of the dataset (i.e., only one of the three species was sampled for each sea coastal area except for stations 15-PEBE and 16-CHEM from the Atlantic coastal area), it was not possible to test whether the observed geographical differences in elemental and isotopic ratios were due to differences between species or sea coastal area, nor was it possible to ascertain if there was any interaction between these two factors. Consequently, we have tested the effects of both factors (species and sea coastal area) independently. Therefore, particular attention should be paid to interpreting the results of these tests. The effects of species (three levels) and sea coastal area (three levels) were tested independently for each elemental and isotopic variable over the entire dataset (all stations and time series) with non-parametric Kruskal–Wallis tests followed by Dunn post hoc tests (R package PMCMRplus version 1.9.10, functions kruskalTest( ) and kwAllPairsDunnTest( ); Pohlert, 2023) since normality and homogeneity of variance (inspected using Shapiro–Wilk and Levene tests, respectively) were not met, precluding the use of analyses of variance (ANOVA, parametric test).
Monotonous temporal trends in bivalve elemental and isotopic times series were examined for each station using Mann–Kendall tests corrected for autocorrelation (R package modifiedmk version 1.6, function mmkh( ), Patakamuri and O'Brien, 2021). Linear models (R package stats version 4.2.1, function lm( ), R Core Team, 2022) were applied to calculate the value of the slope (in ‰ per decade) for each time series (note that all time series do not have the same number of years). Complete time series were tested for shifts, allowing for the detection of one unique shift per time series (R package cpm version 2.3, function detectChangePoint( ), Gordon, 2015).
This dataset illustrates the temporal and spatial variability in carbon and nitrogen content (C and N %) and elemental and isotopic ratios (C:N, δ13C, δ15N) of three species of bivalve along the French coasts from 1981 to 2021. Overall, the average δ13C and δ15N values of bivalves were significantly lower for the stations of the Mediterranean Sea compared with the stations of the English Channel and the Atlantic Ocean. We observed that stations closest to river mouths displayed the lowest average δ13C values compared to those more distant from river influence. Over the last 10 to 40 years, nearly all stations exhibited a significant decrease in δ13C and δ15N. There was no spatial nor temporal pattern in C:N, but values differed between bivalve genera (mussel vs. oyster). It is important to note that, due to the nature of the dataset (one species present for each sea coastal area), it was not possible, across all our study sites, to determine whether the differences observed in elemental and isotopic ratios between the three bivalve species and across the three sea coastal areas were due to species/genera or spatial differences. However, this could be assessed at the scale of the Atlantic coastal area (see Sects. 2.4 and 3.1).
3.1 Taxonomic patterns
Different species may exhibit different C and N elemental and isotopic ratios under the same environmental and growth conditions (Mele et al., 2023), and within a single species, varying environmental conditions can lead to differences in these values (e.g., Magni et al., 2013; Briant et al., 2018). Overall, bivalve δ13C ranged from −23.29 ‰ to −16.98 ‰, δ15N from 2.47 ‰ to 13.15 ‰, C:N from 4.13 to 8.12 mol mol−1, C from 29.81 % to 48.64 %, and N from 5.81 % to 10.57 % (out of extreme data, see Sect. 2.3). There was a significant difference in δ13C and C content (p<0.001) between Mytilus galloprovincialis (δ13C: ‰, C: 36.10±1.53 %) and the other two species, Mytilus edulis (δ13C: ‰, C: 39.80±1.93 %) and Magallana gigas (δ13C: ‰, C: 39.30±1.90 %), which were not significantly different from each other (Fig. 2). There was a significant difference in N content (p<0.001) between Magallana gigas (8.02±0.81 %) and the two other species, Mytilus edulis (9.16±0.46 %) and Mytilus galloprovincialis (9.06±0.44 %; Fig. 2). Finally, there was a significant difference in δ15N (p<0.001) between the three species of bivalves (Magallana gigas: 8.42±1.09 ‰, Mytilus edulis 9.41±1.19 ‰, Mytilus galloprovincialis 5.70±1.49 ‰) as well as in C:N (p<0.001, Magallana gigas: 5.77±0.62 mol mol−1, Mytilus edulis 5.07±0.31 mol mol−1, Mytilus galloprovincialis 4.65±0.23 mol mol−1; Fig. 2). Since the mussel Mytilus galloprovincialis is exclusively present in the Mediterranean Sea and the two other species, Mytilus edulis and Magallana gigas are mostly present in the English Channel and Atlantic Ocean, respectively, it is difficult to separate the species factor from the spatial factor (see Sect. 3.2) in elemental and isotopic ratios (especially in δ13C, where Mytilus galloprovincialis differs significantly). However, within the Atlantic coastal area, where mostly oysters are sampled ( stations), two stations are sampled for mussels (stations 15-PEBE and 16-CHEM), hence species effect can be tested for this coastal area. There were no significant differences in δ13C between the two species (Magallana gigas: ‰, Mytilus edulis: ‰), but δ15N, C and N content, and C:N ratio differed significantly (p<0.001) between Magallana gigas (δ15N: 8.43±1.12 ‰, C: 39.40±1.93 %, N: 8.06±0.82 %, C:N: 5.76±0.62 mol mol−1) and Mytilus edulis (δ15N: 10.54±0.88 ‰, C: 38.20±1.33 %, N: 9.34±0.39 %, C:N: 4.78±0.19 mol mol−1). Note that the unequal sample sizes (15 stations for oysters, 2 stations for mussels) can reduce the power of the test and the ability to detect real differences.
3.2 Spatial patterns
3.2.1 Among sea coastal areas
The three sea coastal areas showed significant differences in bivalve δ13C (p<0.001). The Mediterranean Sea had lower values ( ‰) than the other two sea coastal areas, the English Channel ( ‰) and the Atlantic Ocean ( ‰), which were not significantly different from each other (Fig. 2). There was also a significant difference in bivalve δ15N among the three sea coastal areas (p<0.01), showing a latitudinal gradient with high δ15N values in the English Channel (9.02±1.07 ‰), intermediate values in the Atlantic Ocean (8.71±1.30 ‰), and low values in the Mediterranean Sea (5.70±1.49 ‰; Fig. 2). Bivalve C content and the C:N ratio were also significantly different among the three sea coastal areas (p<0.001), with high values in the English Channel (C: 40.0±1.89 %, C:N: 5.24±0.42 mol mol−1) and Atlantic Ocean (C: 39.20±1.90 %, C:N: 5.63±0.67 mol mol−1) and low values in the Mediterranean Sea (C: 36.10±1.53 %, C:N: 4.65±0.23 mol mol−1; Fig. 2). Finally, N content differed significantly (p<0.001) between the Atlantic Ocean (8.23±0.89 %) and the two other sea coastal areas (English Channel: 8.94±0.69 %, Mediterranean Sea: 9.06±0.44 %), which is likely dependent on the genera/species (oysters vs. mussels; see Sect. 3.1).
3.2.2 Among stations
The lowest δ13C values were mostly observed in bivalves from the stations inside or close to the main river mouths: 5-CLHV ( ‰) and 6-VILL ( ‰) for the Seine River, 16-CHEM ( ‰) and 17-JOAL ( ‰) for the Loire river, 24-FOSS ( ‰) for the Gironde Estuary, and 30-STMM ( ‰) and 31-CART ( ‰) for the Rhône River (Fig. 2). The lowest δ15N values were mostly observed for bivalves from the Mediterranean Sea stations (all below <6 ‰), with minimum average values for station 28-BANY (4.27±0.94 ‰) and maximum for station 30-STMM (5.91±0.75 ‰). The highest δ15N values were observed for stations under the Loire and Seine river plumes (>9 ‰), e.g., 16-CHEM (10.90±0.90 ‰), 17-JOAL (9.79±0.43 ‰), 5-CLHV (9.41±1.08 ‰), and 6-VILL (9.78±1.26 ‰), and locally under the influence of smaller rivers (Fig. 2), e.g., 9-BDVG (10.16±0.52 ‰), 13-AULN (9.81±0.42 ‰), and 15-PEBE (10.19±0.71 ‰). This pattern is less clear for the Garonne and Dordogne rivers (Gironde Estuary), where δ15N shows intermediate values 23-PONT (7.74±0.60 ‰), 24-FOSS (8.04±0.73 ‰). Bivalve C and N content and C:N ratio did not show any clear spatial pattern between stations and seemed mostly linked with genera/species (differing between coastal areas; Fig. 2; see also Sect. 3.1).
Interestingly, for stations 16-CHEM and 17-JOAL, both located at the mouth of the Loire river and sampled for mussels and oysters, respectively, the δ13C signal did not differ significantly (mussels: ‰, oysters: ‰) over the same time period (2010–2021), despite being different species and genus. As for the comparison among the Atlantic coastal area (see Sect. 3.1), δ15N values significantly differed between the two species (mussels: 10.30±0.44 ‰, oysters: 9.79±0.43 ‰); however, the C:N ratio was not significantly different between the two species for this specific area (mussels: 4.74±0.19 ‰, oysters: 5.16±0.64 ‰). This suggests that spatial location could be the main driver of bivalve carbon isotope signal but that nitrogen is likely influenced by both global and local processes, including bivalve physiology, that compensate for species difference.
3.2.3 Key messages
Bivalves' elemental and isotopic ratios were generally lower for the stations of the Mediterranean Sea compared to those located in the Atlantic Ocean and English Channel. We found significant differences in carbon and nitrogen content and elemental and isotopic ratios between species (see Sect. 3.1), each of which is present in only one sea coastal area (with a few exceptions). Nevertheless, this difference is also linked with spatial variability. Indeed, C and N baselines (for isotope signal) and trophic status (i.e., nutrient and chlorophyll amounts) vary between each sea coastal area (oligotrophic Mediterranean Sea vs. meso- to eutrophic Atlantic Ocean and English Channel; Table 2) but also locally (i.e., proximity to river mouth). To overcome the lack of nutrients available in the Mediterranean Sea, some specific groups of phytoplankton (i.e., diazotrophs) uses 15N-depleted atmospheric nitrogen as the source of N, which decreases both the δ15N of the overall particulate organic matter (Kerhervé et al., 2001; Wannicke et al., 2010; Landrum et al., 2011; Liénart et al., 2017), and, by trophic propagation, the low δ15N signal is reflected in bivalves (Liénart et al., 2022, 2023). There is a clear difference in the δ15N baseline between the Mediterranean Sea and the other French sea coastal areas (Liénart et al., 2017). Generally, there was a clear difference in the δ13C signal close to river mouths, decreasing along river plumes, and in δ15N for some of the main (mostly eutrophicated) rivers. The enriched 15N signal of nutrients coming from rivers with extensive watershed agricultural activities and urban outlets is reflected in the high δ15N values of bivalves sampled close to river mouths (Fukumori et al., 2008; Thibault et al., 2020). Similarly, low δ13C values for bivalves sampled close to river mouths are mostly linked to the inputs of continental particulate material bearing this specific signal (Liénart et al., 2017). δ13C values of dissolved inorganic carbon (DIC) are lower in riverine/freshwater ecosystems compared to marine environments (Mook and Rozanski, 2000), resulting in more negative δ13C values in phytoplankton, which may be ingested locally by bivalves. Additionally, δ13C of particulate organic carbon (POC) from terrestrial sources tends to be more negative (Liénart et al., 2017) and can be consumed by bivalves. However, whether terrestrial POC is a significant food source for bivalves remains debated (Malet et al., 2008; Marín Leal et al., 2008; Dubois et al., 2014). Similarly, the δ15N signal of freshwater and marine phytoplankton differs due to the distinct nitrogen sources in these two environments. Therefore, it is not surprising that the δ15N signal in bivalves varies along a gradient related to proximity to river mouths.
3.3 Temporal patterns
3.3.1 Pluri-decadal δ13C dataset
Bivalve δ13C showed a significant decrease over the period from 1981–2021 for 82 % of the stations (27/33 stations; Fig. 3). The Mediterranean Sea exhibited a significant decrease for all stations (6/6 stations), the Atlantic Ocean for 82 % of the stations (14/17 stations), and the English Channel for 70 % of the stations (7/10 stations). The average decrease over the total period was consistent across all coastal areas, averaging ‰ per decade, ranging from −0.22 ‰ to −1.21 ‰ per decade (i.e., −4.85 ‰ to −0.89 ‰ over the last 40 years) when the slopes were significant. This decrease in bivalve δ13C was more pronounced for the shorter time series starting from the late 1990s (17-JOAL, 2010–2021; 11-PASS and 12-PERS, 2001–2021; 33-POME, 1998–2021; and 7-OUIS, 1994–2021; Fig. 3). Overall, the slopes were more pronounced for the Mediterranean Sea and for the stations in the western Bay of Seine, i.e., under the influence of the Seine plume (stations 7 to 10). Some of the stations showed strong interannual variability in bivalve δ13C (e.g., 1-AMBL, 6-VILL, and 24-FOSS; Fig. 3).
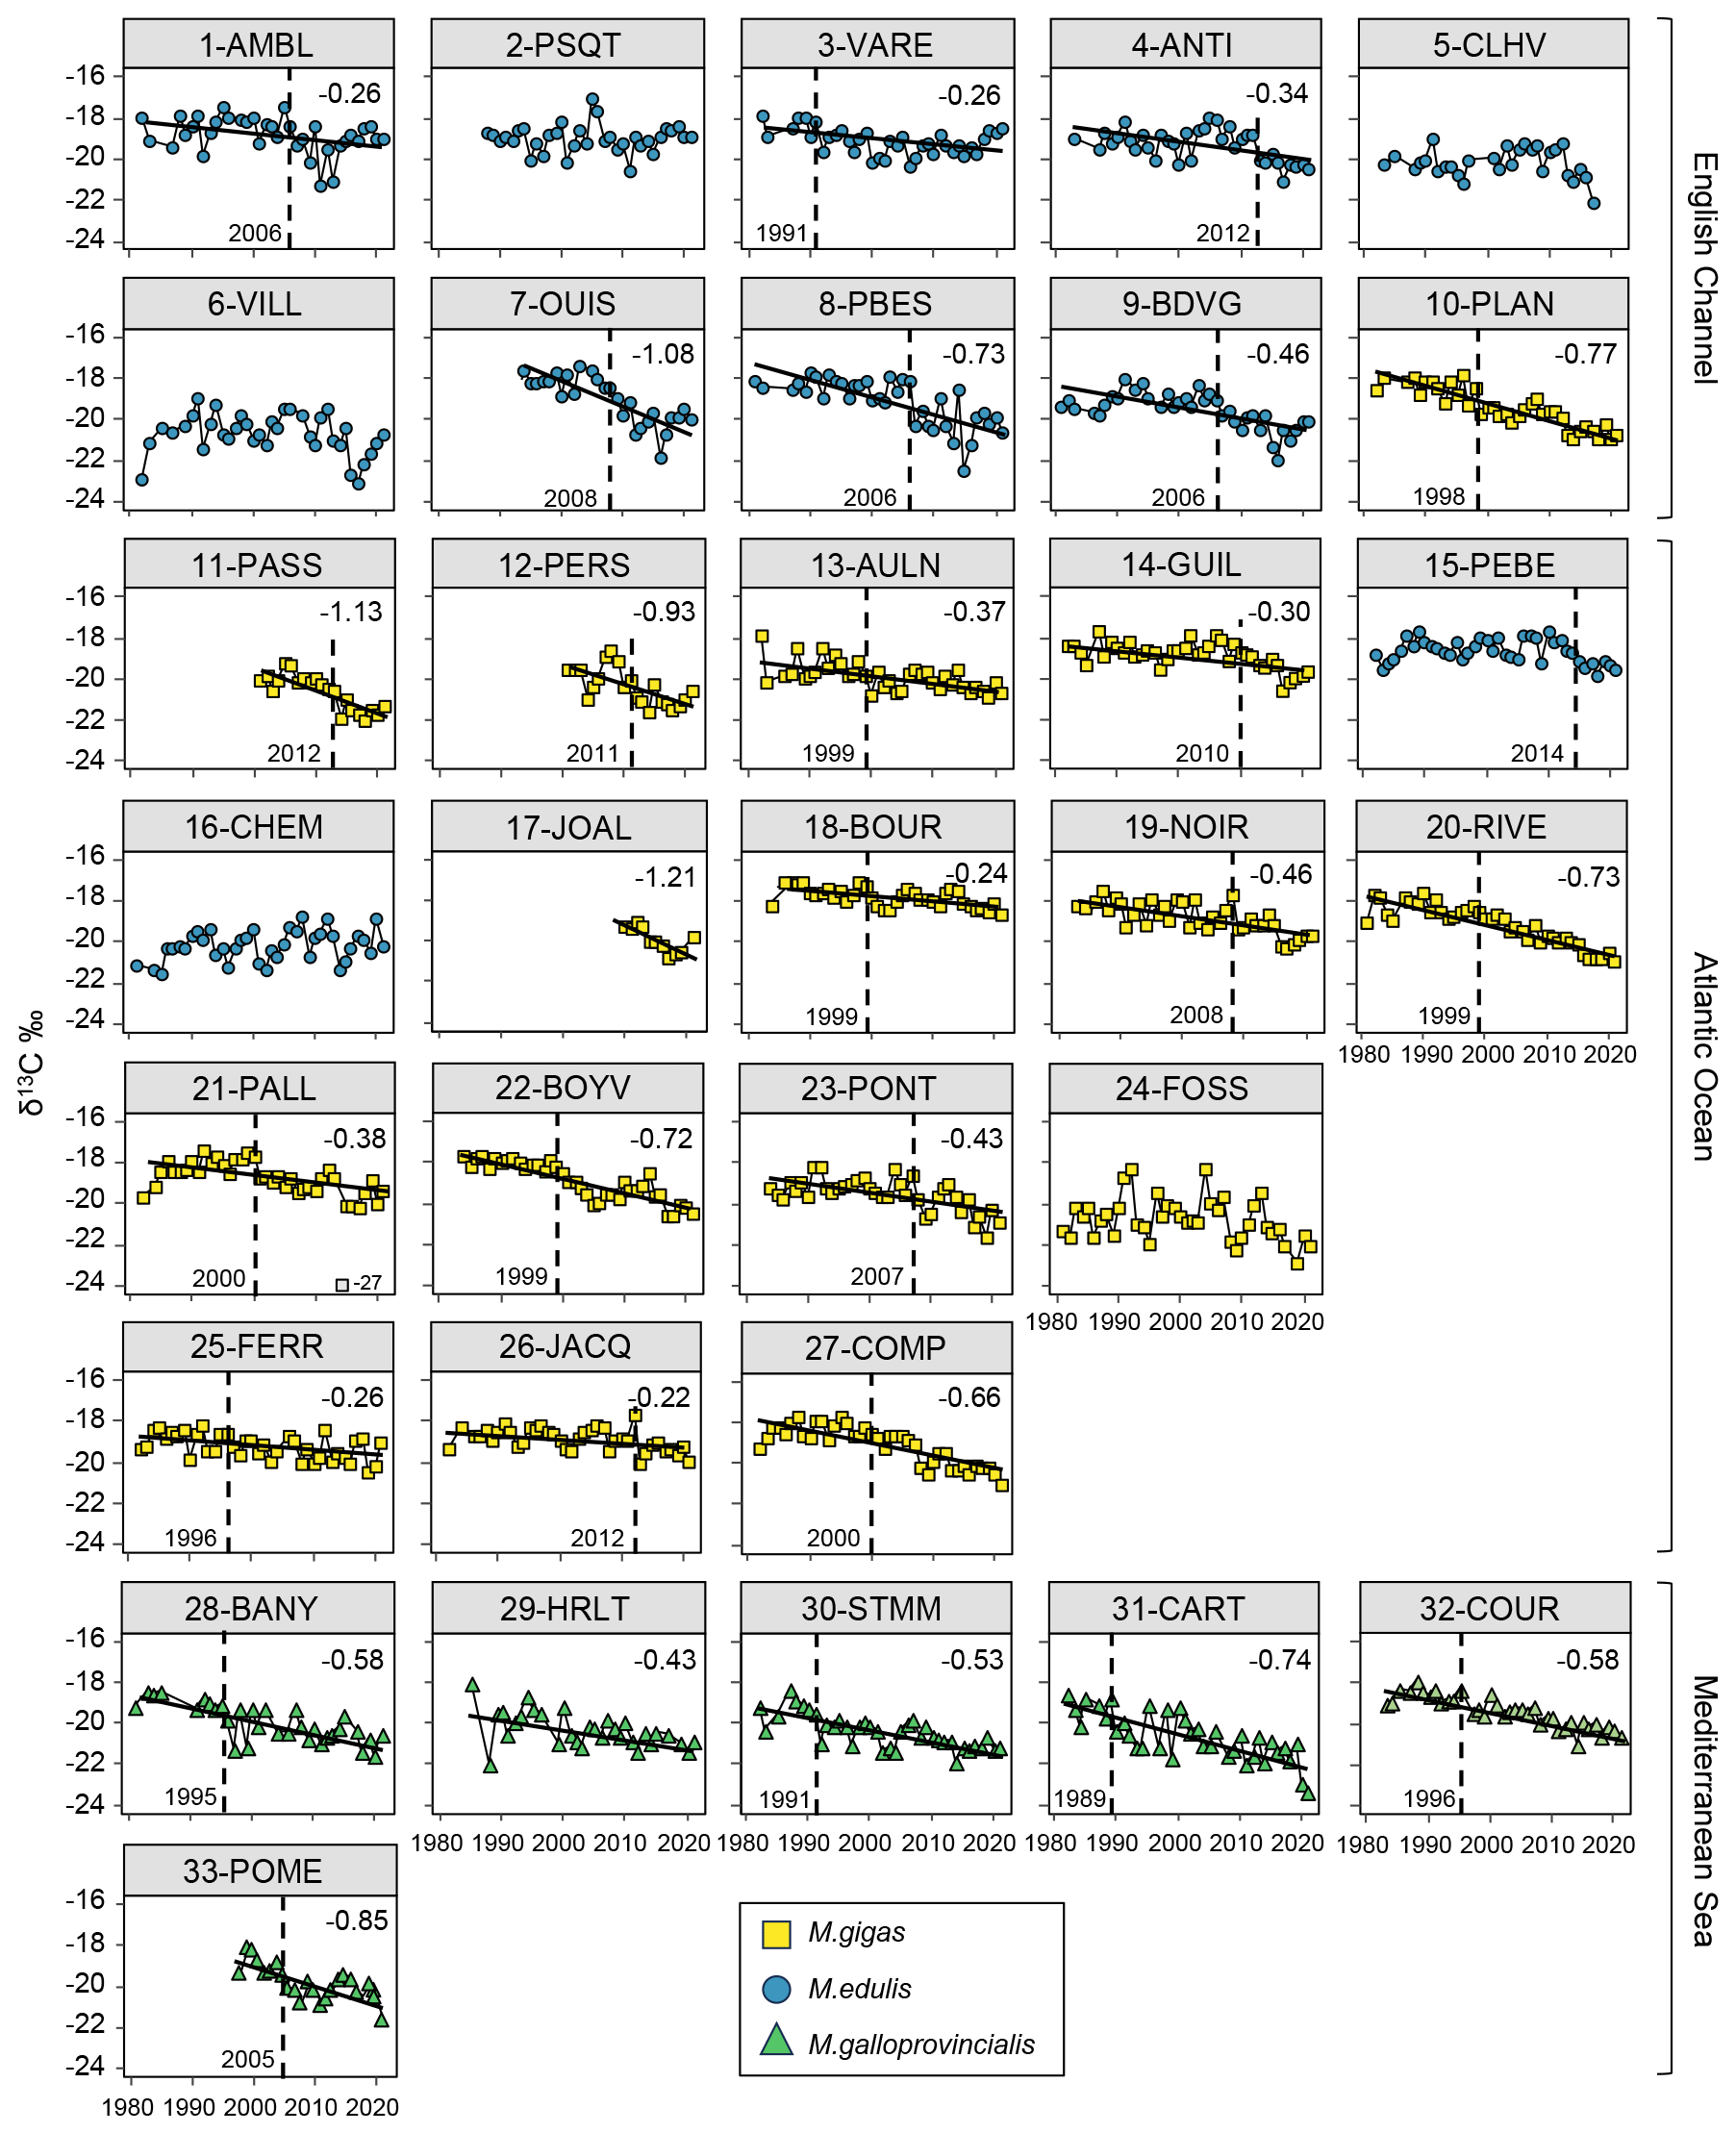
Figure 3Bivalve δ13C time series over the period from 1981–2021 for the 33 stations of the three French sea coastal areas (Magallana gigas, Mytilus edulis, Mytilus galloprovincialis). Black lines correspond to significant trends (Mann–Kendall tests; p value < 0.05), and the slope value (‰ per decade) appears in the upper-right corner. Shifts are represented by the vertical dashed line, with the year mentioned to its bottom left. One outlier is shown in grey (21-PALL, −27 ‰) but was not considered for statistical analyses.
Shifts in bivalve δ13C time series were detected for 79 % of the stations (26/33 stations), equally represented in each sea coastal area. The shifts occurred mostly around the year 1999–2000 (6/26 stations) or after, around the years 2006±1 year and 2012±1 year, with no specific pattern per coastal area. In the Mediterranean Sea, most of the shifts occurred before 2000. The earliest shift was in 1989 (31-CART), there were two in 1999, and the latest was in 2014 (15-PEBE). Usually, no shift was detected at the stations close to river mouths, i.e., the Seine (5-CLHV, 6-VILL), Loire (16-CHEM, 17-JOAL), and Gironde (24-FOSS) estuaries, and at some of the mouths of smaller rivers (e.g., 15-PEBE, Vilaine River, and 29-HRLT, Hérault River).
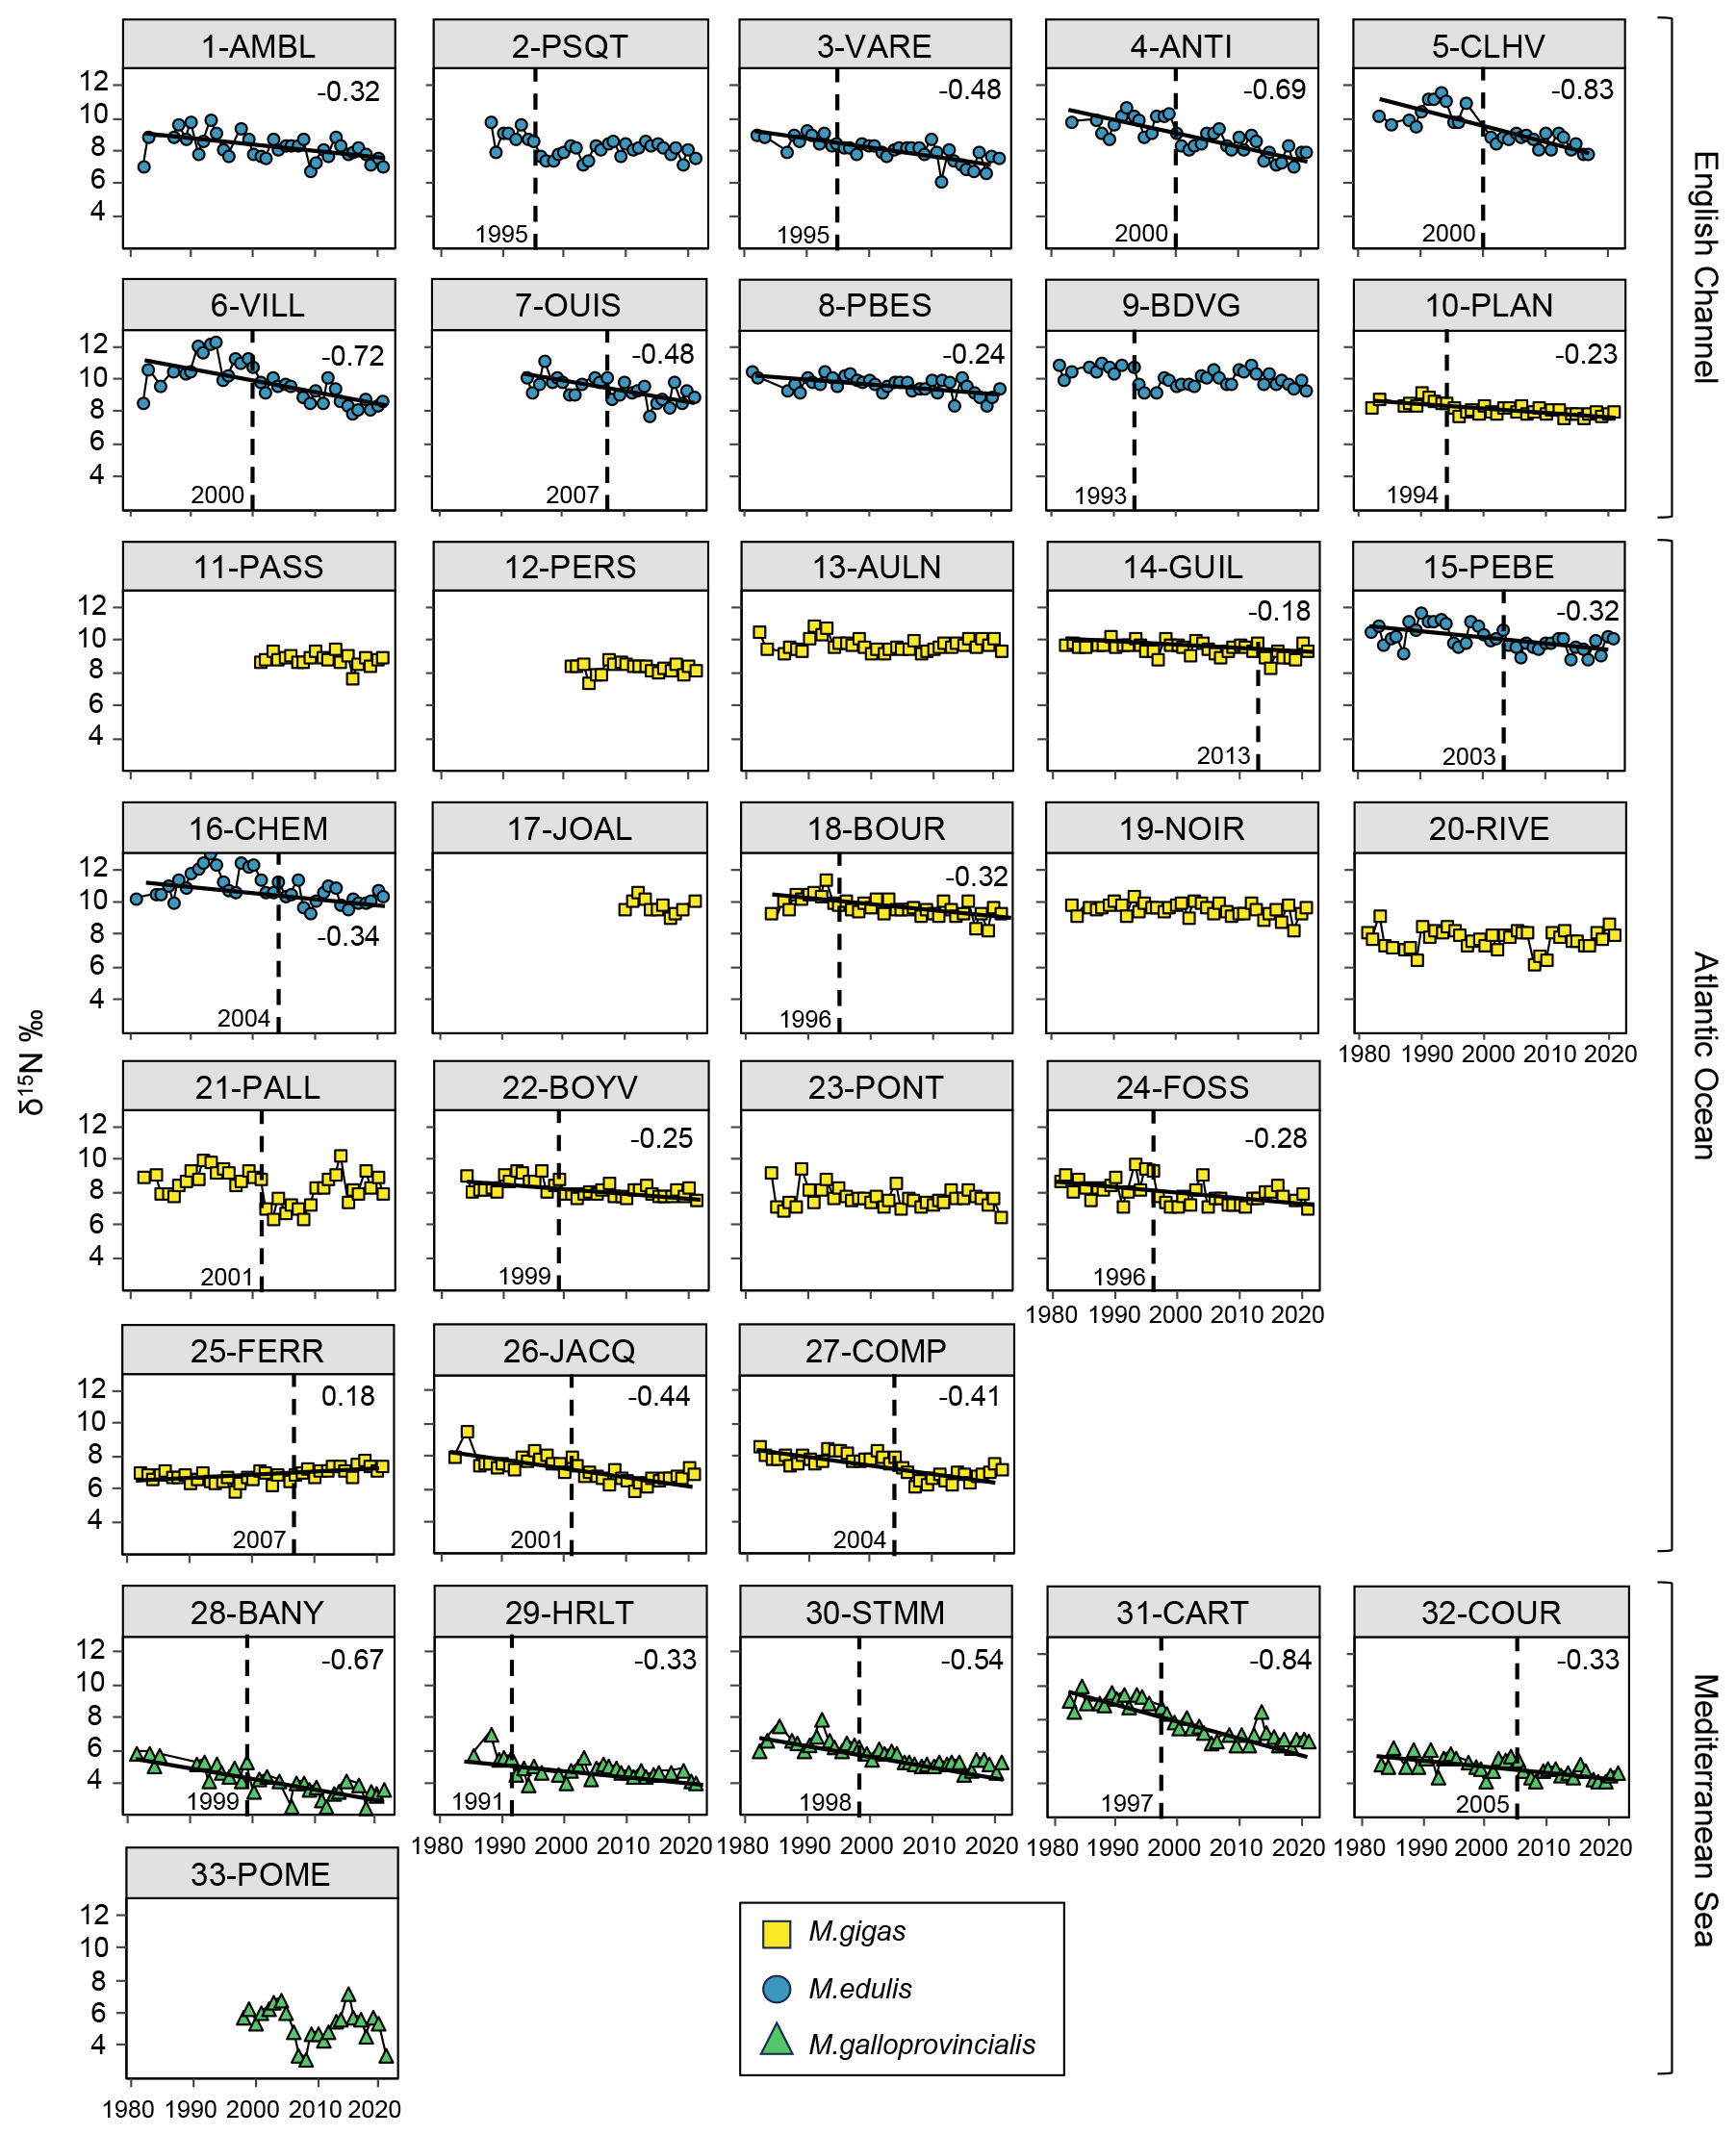
Figure 4Bivalve δ15N time series over the period from 1981–2021 for the 33 stations of the three French sea coastal areas (Magallana gigas, Mytilus edulis, Mytilus galloprovincialis). Black lines correspond to significant trends (Mann–Kendall tests; p value < 0.05), and the slope value (‰ per decade) appears in the upper-right corner. Shifts are represented by the vertical dashed line, with the year mentioned to its bottom left.
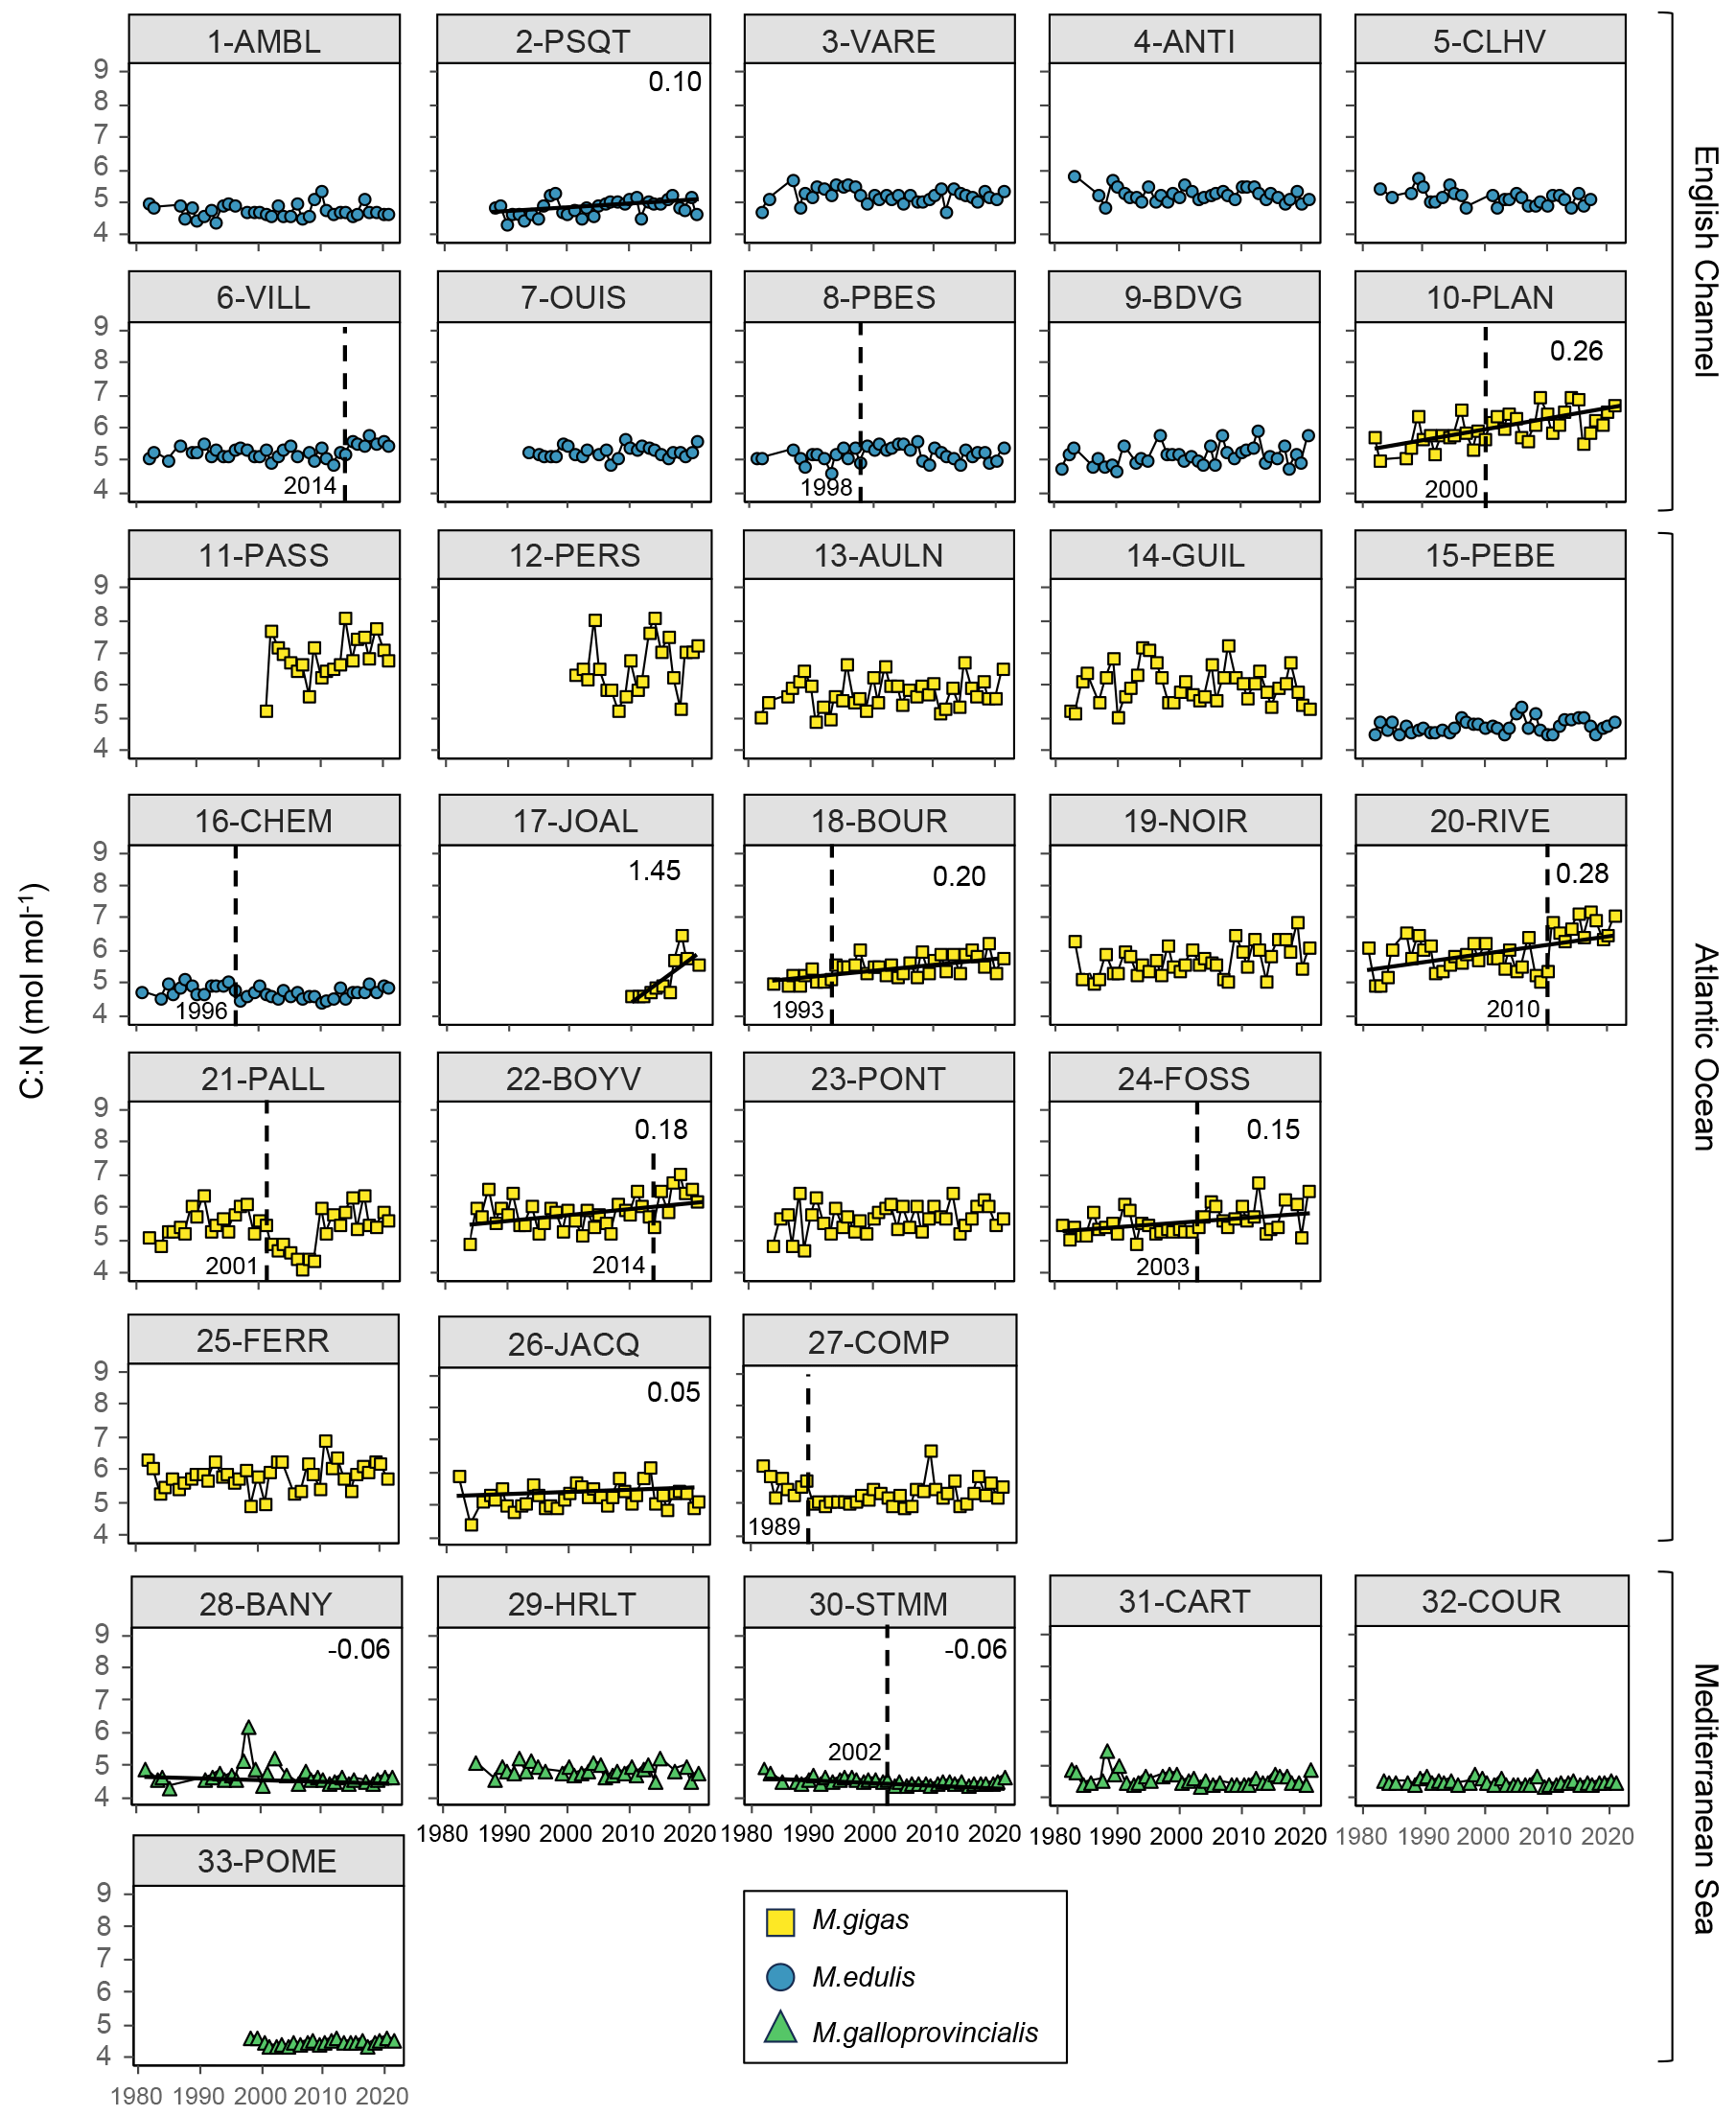
Figure 5Bivalve C:N time series over the period from 1981–2021 for the 33 stations of the three French sea coastal areas (Magallana gigas, Mytilus edulis, Mytilus galloprovincialis). Black lines correspond to significant trends (Mann–Kendall tests; p value < 0.05), and the slope value (‰ per decade) appears in the upper-right corner. Shifts are represented by the vertical dashed line, with the year mentioned to its bottom left.
3.3.2 Pluri-decadal δ15N dataset
Bivalve δ15N also showed a significant decrease over the period from 1981–2021 for 64 % of the stations (22/33 stations; Fig. 4). The Mediterranean Sea exhibited a significant decrease for 83 % of the stations (5/6 stations), the English Channel for 80 % of the stations (8/10 stations), and the Atlantic Ocean for only 53 % of the stations (9/17 stations). Only one station showed a significant increase (25-FERR, 0.34 ‰ over 39 years). The average decrease was ‰ per decade, ranging from −0.18 ‰ to −0.84 ‰ per decade (i.e., −0.72 ‰ to −3.35 ‰ over the last 40 years; Fig. 4). However, this decrease was more pronounced in the English Channel ( ‰) in the eastern part and close to the Seine river mouth (e.g., 3-VARE, 4-ANTI, and 6-VILL) and in the Mediterranean Sea ( ‰) compared with the Atlantic Ocean ( ‰), where the lowest slopes were near the Loire river mouth and the inner two stations of the Arcachon Lagoon. The interannual variability was relatively low for δ15N, with the exception of some stations (e.g., 1-AMBL, 6-VILL, 16-CHEM, and 33-POME).
Shifts in bivalve δ15N time series were detected for 70 % of the stations (23/33 stations), mostly in the English Channel and Mediterranean Sea. The shifts occurred mostly around the year 1999–2000 (5/23 stations) and then around the years 1995–1996 (4/23 stations) and 2004 ± 1 year (4/23 stations), with shifts mostly occurring before 2000 in the Mediterranean Sea. For each sea coastal area, there were often shifts occurring the same year or in two close years for nearby stations (e.g., 15-PEBE, 2003, and 16-CHEM, 2004). The earliest shift was in 1991 (29-HRLT) and the latest in 2013 (14-GUIL).
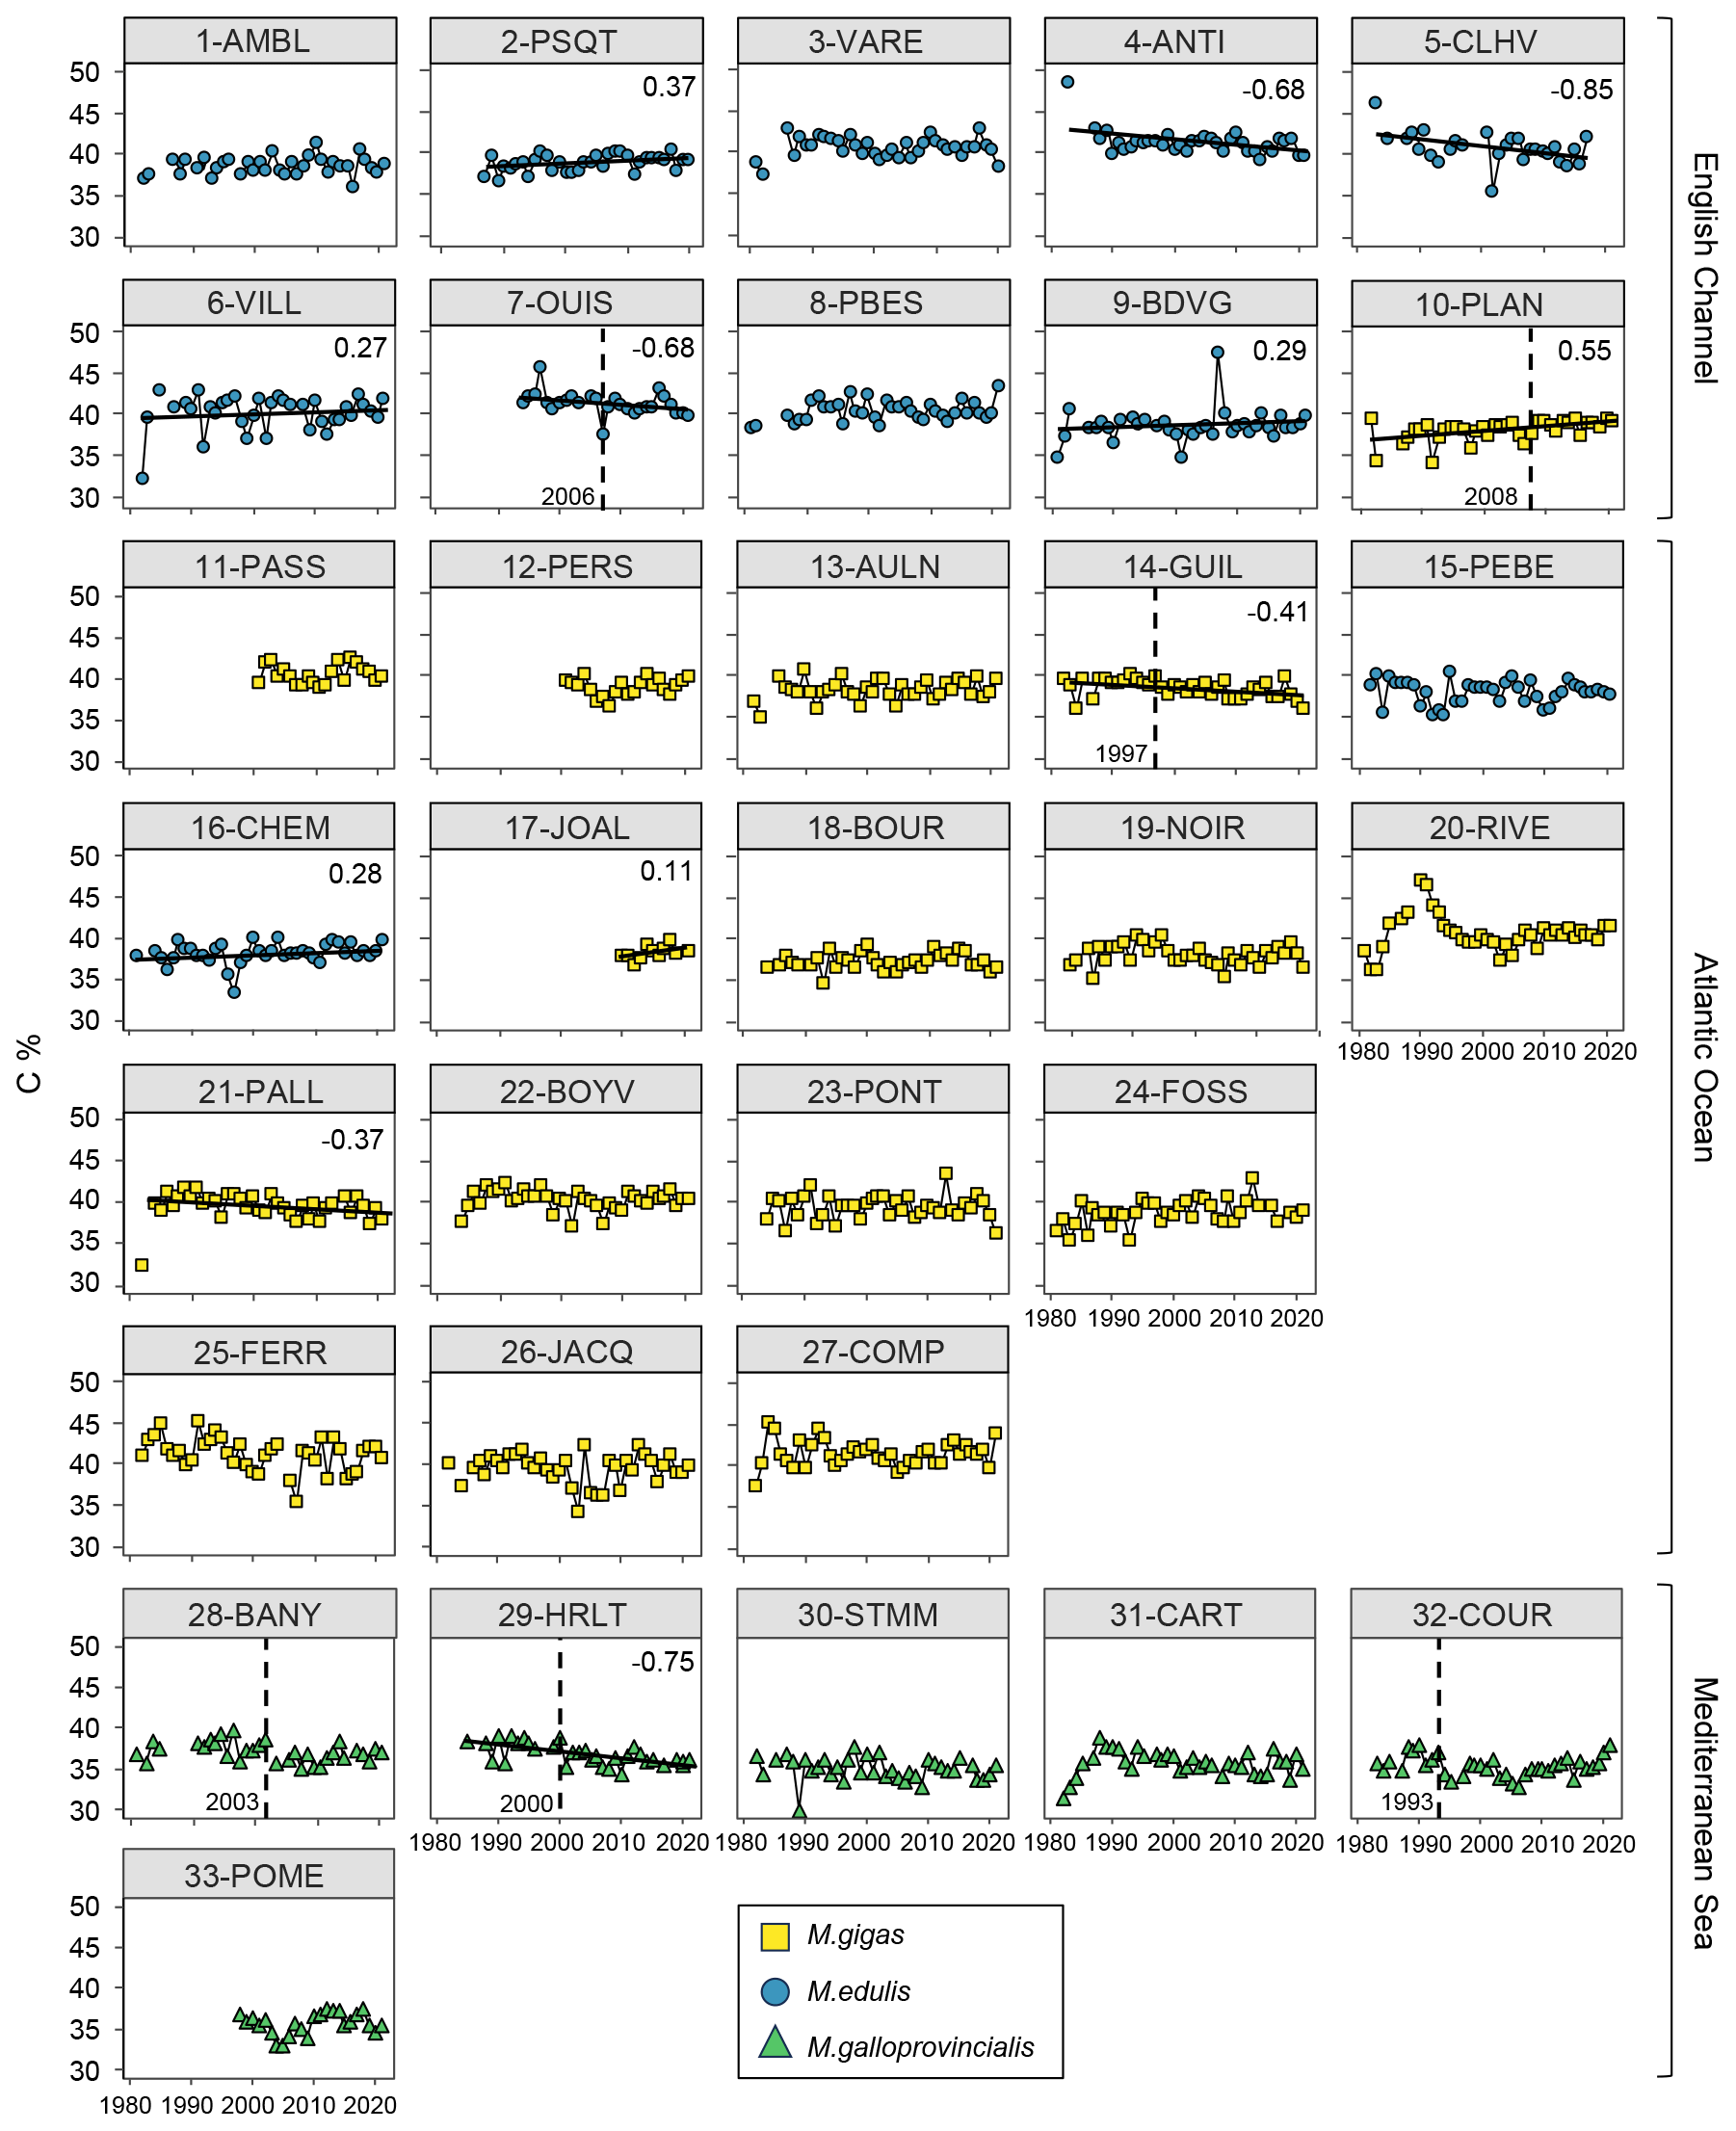
Figure 6Bivalve C content (%) time series over the period from 1981–2021 for the 33 stations of the three French sea coastal areas (Magallana gigas, Mytilus edulis, Mytilus galloprovincialis). Black lines correspond to significant trends (Mann–Kendall tests; p value < 0.05, calculated excluding extreme values mentioned in Sect. 2.3), and the slope value (‰ per decade) appears in the upper-right corner. Shifts are represented by the vertical dashed line with the year mentioned to its bottom left. Extreme values mentioned in Sect. 2.3 are not represented and were excluded from the calculations of the slopes and shifts.
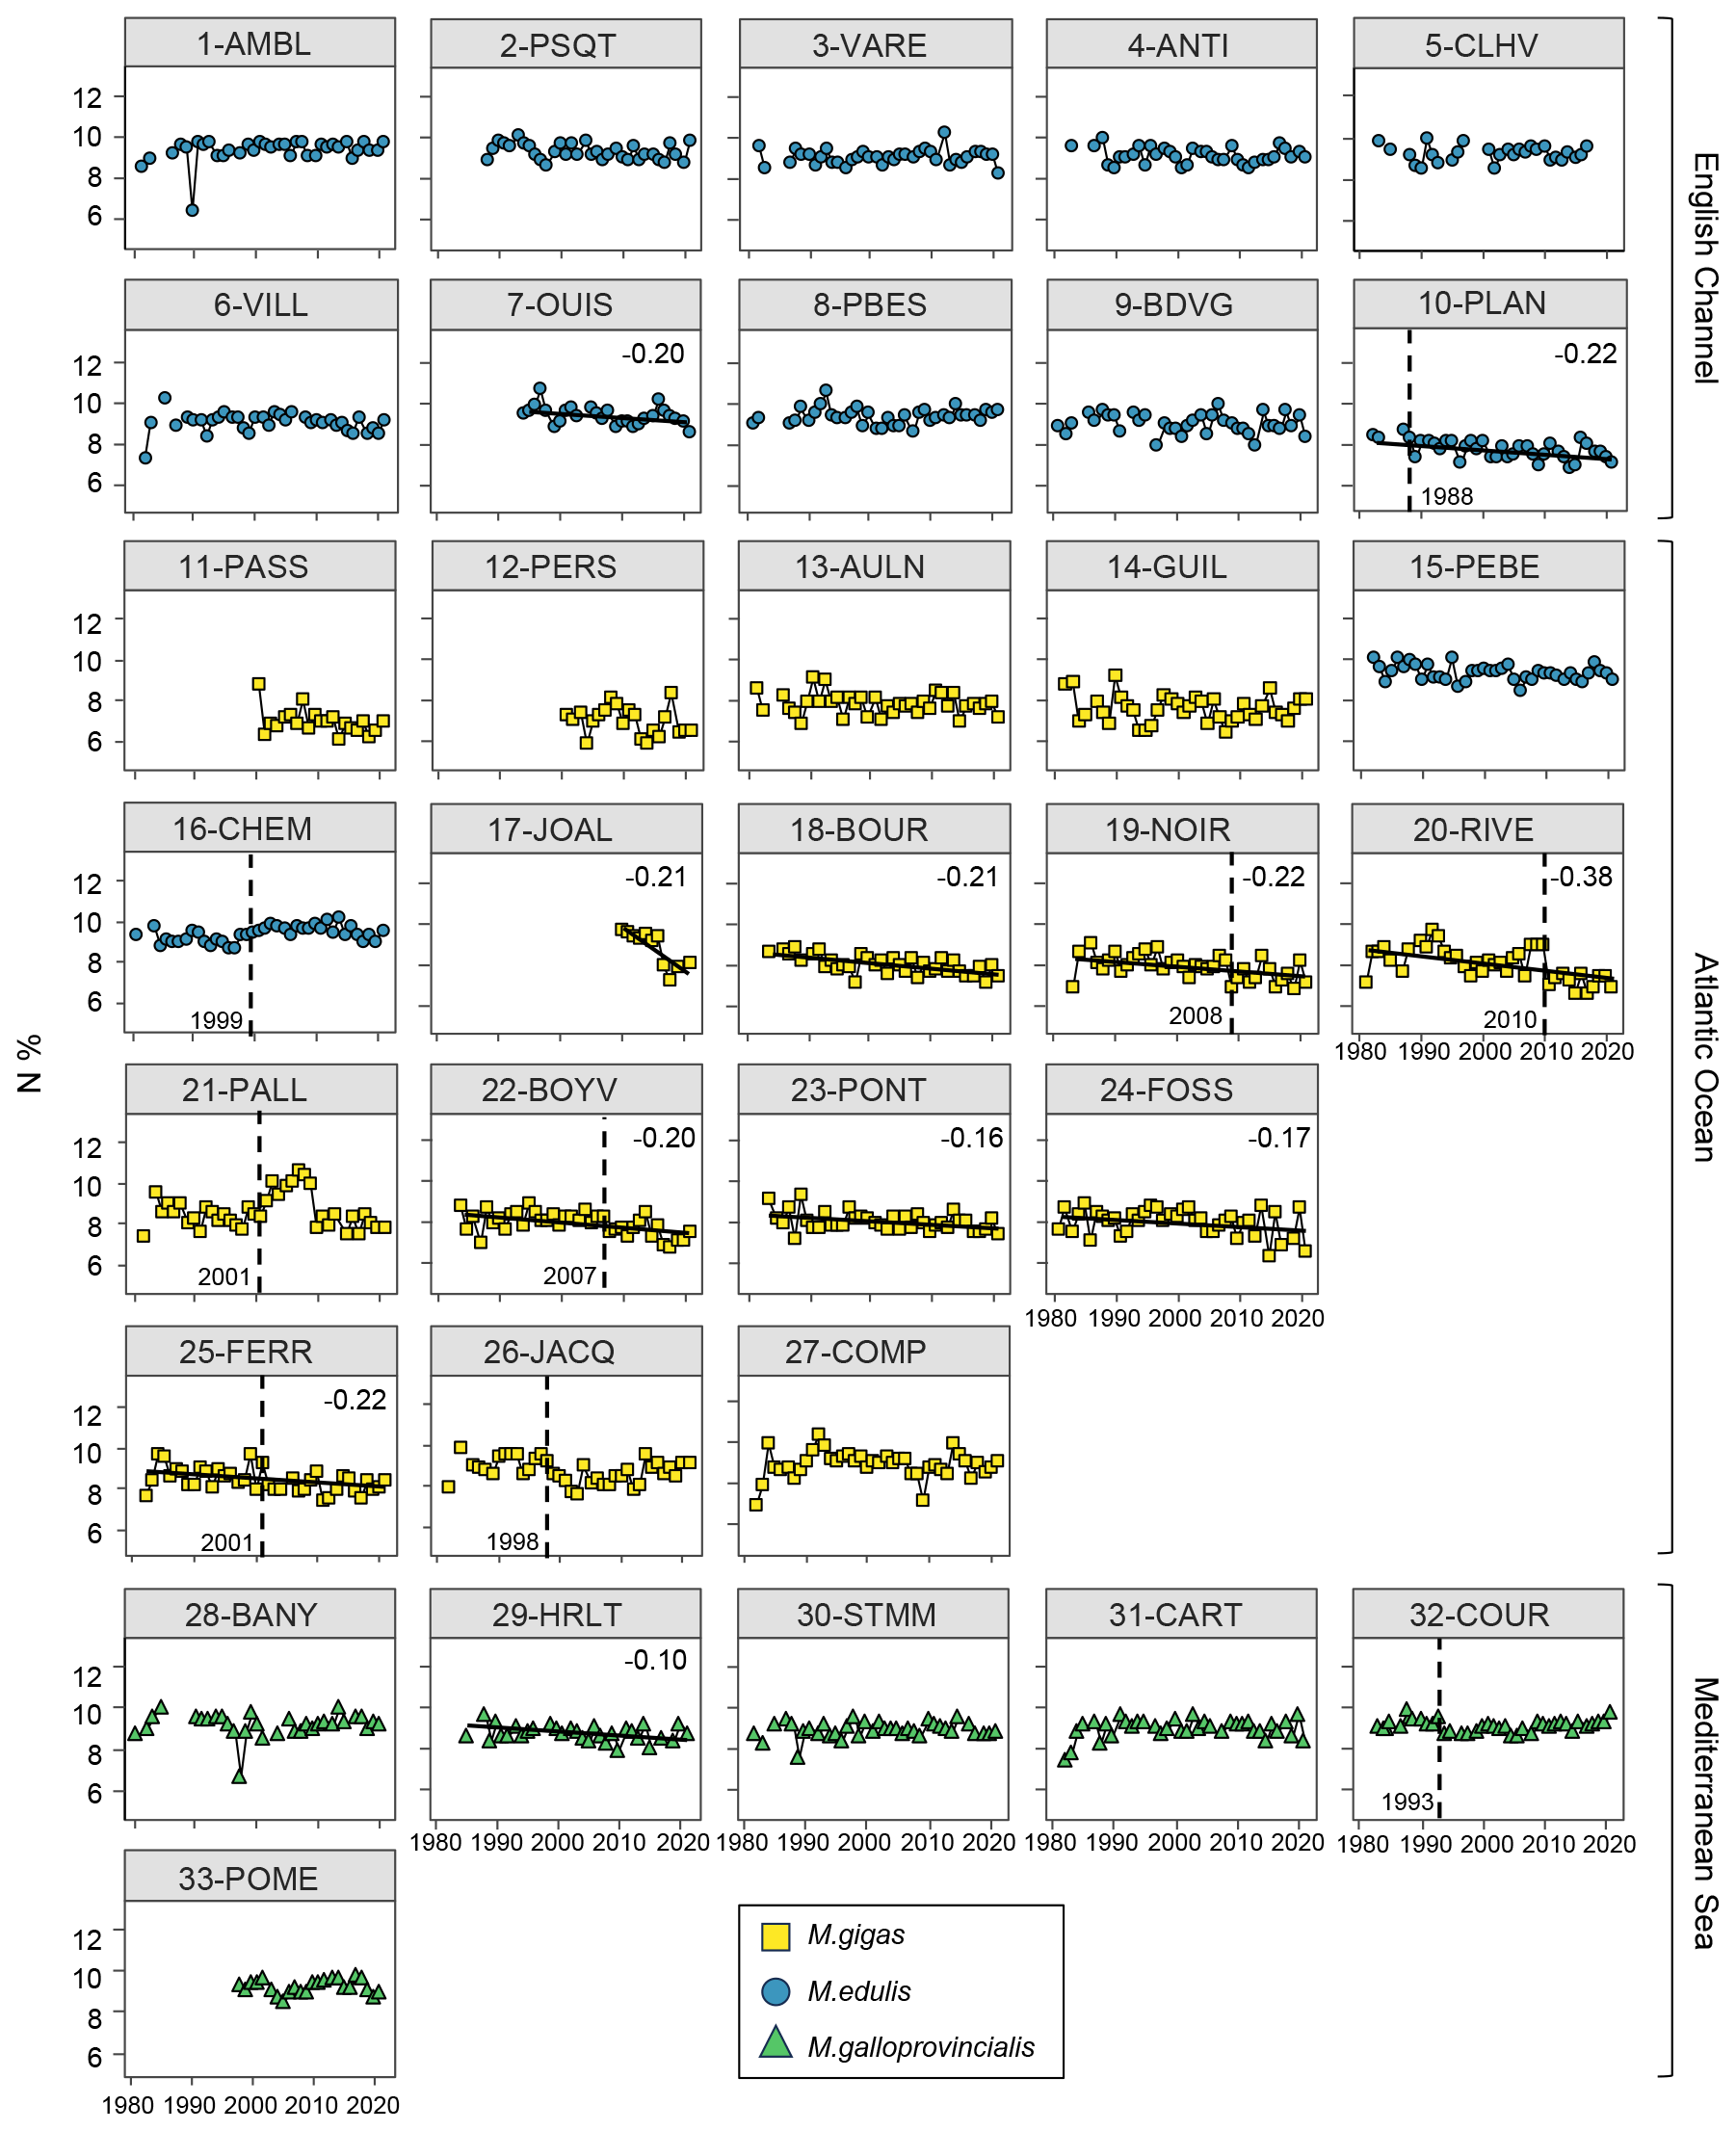
Figure 7Bivalve N content (%) time series over the period from 1981–2021 for the 33 stations of the three French sea coastal areas (Magallana gigas, Mytilus edulis, Mytilus galloprovincialis). Black lines correspond to significant trends (Mann–Kendall tests; p value < 0.05, calculated excluding extreme values mentioned in Sect. 2.3), and the slope value (‰ per decade) appears in the upper-right corner. Shifts are represented by the vertical dashed line with the year mentioned to its bottom left. Extreme values mentioned in Sect. 2.3 are not represented and were excluded from the calculations of the slopes and shifts.
3.3.3 Pluri-decadal C and N datasets
Bivalve C and N contents and C:N ratio showed significant trends for less than half of the stations (between 30 % and 36 %) over the period from 1981–2021 (C: 12/33 stations, N: 11/33 stations, C:N: 10/33 stations; Figs. 5–7). For C content, there was the same number of increasing and decreasing trends (both 18 %, 6/33 stations), with no spatial pattern, while the N content showed only decreasing trends (33 %, 11/33 stations). However, most of the significant trends were increasing for the C:N ratio (24 %, 8/33 stations), exclusively in the Atlantic Ocean (6/33 stations) and the English Channel (2/33 stations), and only 6 % (2/33 stations) of the stations showed decreasing trends, all in the Mediterranean Sea. The average increase in the C:N ratio was 0.27±0.37 mol mol−1 per decade, ranging from 0.05 to 0.38 mol mol−1 per decade (i.e., 0.20 to 1.53 mol mol−1 over the last 40 years, excluding 17-JOAL with a 1.45 mol mol−1 increase for 11 years; Fig. 5). The average C:N decrease in the Mediterranean Sea was mol mol−1 per decade. Interannual variability in bivalve C:N was either very low for the two mussel species (e.g., 7-OUIS, 16-CHEM, and 33-POME) or very large for the oysters (e.g., 12-PERS, 19-NOIR, and 22-BOYV). The decreasing trends in the C:N ratio were mostly linked to decreases in bivalve N % (6/8 stations), whereas only 3/8 stations showed a significant increase in C %. Shifts in bivalve C, N, and C:N time series were detected only for 18 % to 33 % of the stations (C: 6/33 stations, N: 9/33 stations, C:N: 11/33 stations), without any peculiar spatial pattern. Most of the shifts occurred after the year 2000 (C: 4/33 stations, N: 5/33 stations, C:N: 7/11 stations). The earliest C:N shift was in 1989 (27-COMP) and the latest in 2014 (6-VILL, 22-BOYV). There was no apparent spatial pattern in the C, N, and C:N shifts.
3.3.4 Key messages
In summary, over the last 30 to 40 years, bivalves have shown a general decrease in both δ13C and δ15N for most stations of the three French sea coastal areas. These trends are most likely linked with global processes occurring at large spatial scales, such as climate change. Liénart et al. (2024b) explained the decrease in δ13C is primarily associated with the increase in atmospheric CO2 concentrations due to fossil-fuel burning, which generates a decrease in atmospheric CO2 δ13C values occurring since the industrial revolution in 1850 (the Suess effect; Keeling, 1979; Gruber et al., 1999). This decrease in δ13C values propagates along marine food webs and is visible in organisms' tissues (Schloesser et al., 2009; Liénart et al., 2022, 2024b). However, other global factors, such as rising temperatures or climate indices, may also contribute to this overall decrease in δ13C through passive (e.g., Suess effect) or active processes related to bivalve physiology (e.g., change in fractionation; Liénart et al., 2024b). Decreasing δ15N trends are potentially linked to global factors, indirectly, through a general decrease in nutrients and particles inputs from rivers (Milliman et al., 2008; Bauer et al., 2013). Since organic particles generated in areas with high human activities bear a high δ15N signal, the decrease in such 15N-enriched inputs is reflected in coastal water and marine fauna (Connolly et al., 2013). However, such changes are strongly influenced by regional and local factors, such as regional climate, watershed activities, and damming (Milliman et al., 2008), resulting in different slope values in isotope time series close to river mouths (more pronounced for both C and N isotopes). The observed decrease in both isotopic ratios likely results from the cumulative, synergistic, or antagonistic effects of global and regional/local influences (Cabral et al., 2019). Such interacting pressures are more likely to occur in regions strongly affected by climate change, such as the Mediterranean Sea (Tuel and Eltahir, 2020). In this dataset, isotopes reveal both global (climate) effects, mostly through δ13C, and some local variability in the organic matter used by bivalves, as shown by the different δ13C (low) and δ15N (high) signals along the river-mouth-to-sea gradient. The decrease in bivalve δ13C and in δ15N over the past decades may indicate a decrease in nutrient and particle inputs from the rivers over the same period. Finally, as an indicator of bivalve condition and physiology (Elser et al., 2003), the increase in C:N ratio observed for most stations in the Atlantic and the English Channel can be attributed to either an increase in carbon content (i.e., increase in lipid or carbohydrate content), which is unlikely given rising temperatures and appears significant for only few of our stations, or a decrease in nitrogen content (i.e., proteins and amino acids), as observed in our data, as is more likely due to a decrease in N nutrient availability in the environment, which is consistent with the observed decrease in δ15N. The absence of trends at most of the stations and the large interannual variability in the C:N ratio may result from the complex interplay between global and local environmental effects and bivalve physiology related to this parameter.
The dataset presented in this article and the metadata associated can be freely accessed on the SEANOE open-access repository (https://www.seanoe.org/, last access: 19 February 2025) using the following DOI: https://doi.org/10.17882/100583 (Liénart et al., 2024a). The data give the δ13C and δ15N (‰), C and N (%), and C:N ratio (mol mol−1), for each station and year, with the sampling date and species name. For each station, it contains the sea coastal area, station ID, station name, ROCCH codes, latitude and longitude (geographic coordinate system WGS 84) as presented in Table 1. Carbon isotopic time series have already been published (Liénart et al., 2024b, except from station 17-JOAL) in a study focused on global effect on coastal ecosystems by large-scale anthropogenic and natural climate proxies, including the Suess effect, over the period from 1981–2021. Bivalve δ13C data and δ13C corrected from the Suess effect are available via the permanent identifier https://doi.org/10.6084/m9.figshare.24884871.v1 (Liénart et al., 2024c). The companion data from ROCCH (contaminants) are available in the Surval database (https://surval.ifremer.fr, Ifremer, 2022).
By providing this dataset to the scientific community, including caveats for interpreting such data spatially and over time, we expect it to be useful for numerous ecological studies. Such data are relevant to trace nutrients origin and to set accurate baselines to study organism diets and food web structure and can be and indicator of water quality over space and time through bivalve physiology. It could also provide valuable input for developing predictive models of bivalve physiology (Emmery et al., 2011) or trophic ecology (Marín Leal et al., 2008). Multi-decadal time series allow scientists to understand coastal ecosystem responses to global change through biological and biogeochemical processes. The carbon isotope dataset is already part of a study where trends are thoughtfully interpreted taking into consideration global proxies for climate and anthropogenic changes and corrected for the Suess effect (Liénart et al., 2024b). Part of the observed δ13C trends was linked with the Suess effect, leading to shifts in the isotope baseline over recent decades (i.e., Suess effect for δ13C) rather than specific changes in ecosystem functioning. Hence, we would like to draw users' attention to the need to correct for the Suess effect before comparing biological samples collected 1 or more decades apart as recommended in literature (Dombrosky, 2020; Clark et al., 2021; Liénart et al., 2024b). Additionally, in order to take into account the low δ13C and high δ15N signal observed near river mouths, we advise users to compare slope values rather than absolute values when assessing temporal changes between stations. Overall, the complex interplay between global and regional/local effects needs to be considered when interpreting time series. This long-term dataset of elemental and isotopic values in suspension-feeder tissues provides insights into ecosystem dynamics and holds broader significance for advancing scientific understanding in the face of ongoing environmental challenges.
CL and NS are the leaders of the project. NS, CL, AL, AGP, PLM, XdM, HB, SD, and AlG participated in defining the scientific strategy and selection of archived samples for analysis. AF and NB prepared the samples for analysis. AnG carried out sample analysis. PLM and AGP are the curators of the ROCCH sample archive. CL and AF performed the statistical analysis. CL prepared the manuscript and figures and integrated the final contribution from all co-authors.
The contact author has declared that none of the authors has any competing interests.
Publisher's note: Copernicus Publications remains neutral with regard to jurisdictional claims made in the text, published maps, institutional affiliations, or any other geographical representation in this paper. While Copernicus Publications makes every effort to include appropriate place names, the final responsibility lies with the authors.
This article is based on a collaborative work with the team of the ROCCH monitoring network coordinated by Ifremer. We thank the members of ROCCH and of the different institutions, from the field workers and sample analysts to the coordinators, who made it possible for us to use these samples.
This research has been supported by the Office Français de la Biodiversité (grant no. OFB.21.0456 as part of the project EVOLECO-BEST).
This paper was edited by Frédéric Gazeau and reviewed by Sébastien Lefebvre and one anonymous referee.
Amiard, J. C., Amiard-Triquet, C., Barka, S., Pellerin, J., and Rainbow, P. S.: Metallothioneins in aquatic invertebrates: Their role in metal detoxification and biomonitoring., Aquat. Toxicol., 76, 160–202, https://doi.org/10.1016/j.aquatox.2005.08.015, 2006.
Bauer, J. E., Cai, W.-J., Raymond, P., Bianchi, T. S., Hopkinson, C. S., and Regnier, P. G.: The changing carbon cycle of the coastal ocean, Nature, 504, 61–70, https://doi.org/10.1038/nature12857, 2013.
Briand, M. J., Herlory, O., Briant, N., Brach-Papa, C., Boissery, P., and Bouchoucha, M.: The French Mussel Watch: More than two decades of chemical contamination survey in Mediterranean coastal waters, Mar. Pollut. Bull., 191, 114901, https://doi.org/10.1016/j.marpolbul.2023.114901, 2023.
Briant, N., Savoye, N., Chouvelon, T., David, V., Rodriguez, S., Charlier, K., Sonke, J. E., Chiffoleau, J. F., Brach-Papa, C., and Knoery J.: Carbon and nitrogen elemental and isotopic ratios of filter-feeding bivalves along the French coasts: An assessment of specific, geographic, seasonal and multi-decadal variations, Sci. Total Environ., 613–614, 196–207, https://doi.org/10.1016/j.scitotenv.2017.08.281, 2018.
Cabral, H., Fonseca, V., Sousa, T., and Leal, M. C.: Synergistic effects of climate change and marine pollution: An overlooked interaction in coastal and estuarine areas, Int. J. Environ. Res. Publ. Health, 16, 1–17, https://doi.org/10.3390/ijerph16152737, 2019.
Chahouri, A., Yacoubi, B., Moukrim, A., and Banaoui, A.: Bivalve molluscs as bioindicators of multiple stressors in the marine environment: Recent advances, Cont. Shelf Res., 264, 105056, https://doi.org/10.1016/j.csr.2023.105056, 2023.
Clark, C. T., Cape, M. R., Shapley, M. D., Mueter, F. J., Finney, B. P., and Misarti, N.: SuessR: Regional corrections for the effects of anthropogenic CO2 on δ13C data from marine organisms, Meth. Ecol. Evol., 12, 1508–1520, https://doi.org/10.1111/2041-210X.13622, 2021.
Cloern, J. E., Abreu, P. C., Carstensen, J., Chauvaud, L., Elmgren, R., Grall, J., Greening, H., Johansson, J. O. R., Kahru, M., Sherwood, E. T., Xu, J., and Yin, K.: Human activities and climate variability drive fast-paced change across the world's estuarine-coastal ecosystems, Global Change Biol., 22, 513–529, https://doi.org/10.1111/gcb.13059, 2016.
Connolly, R. M., Gorman, D., Hindell, J. S., Kildea, T. N., and Schlacher, T. A.: High congruence of isotope sewage signals in multiple marine taxa, Mar. Pollut. Bull., 71, 152–158, https://doi.org/10.1016/j.marpolbul.2013.03.021, 2013.
Dale, V. H. and Beyeler, S. C.: Challenges in the development and use of ecological indicators, Ecol. Indic., 1, 3–10, https://doi.org/10.1016/S1470-160X(01)00003-6, 2001.
Dombrosky, J.: A ∼ 1000-year 13C Suess correction model for the study of past ecosystems, Holocene, 30, 474–478, https://doi.org/10.1177/0959683619887416, 2020.
Dubois, S., Blanchet, H., Garcia, A., Massé, M., Galois, R., Grémare, A., Charlier, K., Guillou, G., Richard, P., and Savoye, N.: Trophic resource use by macrozoobenthic primary consumers within a semi-enclosed coastal ecosystem: stable isotope and fatty acid assessment, J. Sea Res., 88, 87–99, https://doi.org/10.1016/j.seares.2014.01.004, 2014.
Elser, J. J., Acharya, K., Kyle, M., Cotner, J., Makino, W., Markow, T., Watts, T., Hobbie, S., Fagan, W., Schade, J., Hood, J., and Sterner, R. W.: Growth rate-stoichiometry couplings in diverse biota, Ecol. Lett., 6, 936–943, https://doi.org/10.1046/j.1461-0248.2003.00518.x, 2003.
Emmery, A., Lefebvre, S., Alunno-Bruscia, M., and Kooijman, S. A. L. M.: Understanding the dynamics of δ13C and δ15N in soft tissues of the bivalve Crassostrea gigas facing environmental fluctuations in the context of Dynamic Energy Budgets (DEB), J. Sea Res., 66, 361–371, https://doi.org/10.1016/j.seares.2011.08.002, 2011.
Fukumori, K., Oi, M., Doi, H., Takahashi, D., Okuda, N., Miller, T. W., Kuwae, M., Miyasaka, H., Genkai-Kato, M., Koizumi, Y., Omori, K., and Takeoka, H.: Bivalve tissue as a carbon and nitrogen isotope baseline indicator in coastal ecosystems, Estuar. Coast. Shelf Sci., 79, 45–50, https://doi.org/10.1016/j.ecss.2008.03.004, 2008.
Gordon, J. R.: Parametric and Nonparametric Sequential Change Detection in R: The cpm Package, J. Stat. Softw., 66, 1–20, 2015.
Grouhel, A.: Prescriptions techniques pour l'échantillonnage de mollusques du réseau national d'observation des contaminants chimiques (ROCCH), RST-RBE/CCEM/ROCCH 23-02, ARCHIMER, https://doi.org/10.13155/97878, 2023.
Gruber, N., Keeling, C. D., Bacastow, R. B., Guenther, P. R., Lueker, T. J., Wahlen, M., Meijer, H. A. J., Mook, W. G., and Stocker, T. F: Spatiotemporal patterns of carbon-13 in the global surface ocean and the oceanic Suess effect, Global Biogeochem. Cy., 13, 307–335, https://doi.org/10.1029/1999GB900019, 1999.
Harley, C. D. G., Hughes, A. R., Hultgren, K. M., Miner, B. G., Sorte, C. J. B., Thornber, C. S., Rodriguez, L. F., Tomanek, L., and Williams, S. L.: The impacts of climate change in coastal marine systems, Ecol. Lett., 9, 228–241, https://doi.org/10.1111/j.1461-0248.2005.00871.x, 2006.
Hofmann, G. E., Blanchette, C. A., Rivest, E. B., and Kapsenberg, L.: Taking the pulse of marine ecosystems: The importance of coupling long-term physical and biological observations in the context of global change biology, Oceanography, 26, 140–148, 2013.
Ifremer: Quadrige database, https://surval.ifremer.fr (last access: 19 February 2025), 2022.
Kanduč, T., Šlejkovec, Z., Falnoga, I., Mori, N., Budič, B., Kovačić, I., Pavičić – Hamer, D., and Hamer, B.: Environmental status of the NE Adriatic Sea, Istria, Croatia: Insights from mussel Mytilus galloprovincialis condition indices, stable isotopes and metal(loid)s, Mar. Pollut. Bull., 126, 525–534, https://doi.org/10.1016/j.marpolbul.2017.09.052, 2018.
Karlson, A. M. L. and Faxneld, S.: Polycyclic aromatic hydrocarbons and stable isotopes of carbon and nitrogen in Baltic Sea blue mussels: Time series data 1981–2016, Data Brief, 35, 4–8, https://doi.org/10.1016/j.dib.2021.106777, 2021.
Keeling, C. D.: The Suess effect: 13Carbon–14Carbon interrelations, Environ. Int., 2, 229–300, https://doi.org/10.1016/0160-4120(79)90005-9, 1979.
Kerhervé, P., Minagawa, M., Heussner, S., and Monaco, A.: Stable isotopes (C-13/C-12 and N-15/N-14) in settling organic matter of the northwestern Mediterranean Sea: biogeochemical implications, Oceanol. Acta, 24, S77–S85, 2001.
Landrum, J. P., Altabet, M. A., and Montoya, J. P.: Basin-scale distributions of stable nitrogen isotopes in the subtropical North Atlantic Ocean: Contribution of diazotroph nitrogen to particulate organic matter and mesozooplankton, Deep-Sea Res. Pt. I, 58, 615–625, https://doi.org/10.1016/j.dsr.2011.01.012, 2011.
Lheureux, A., David, V., Del Amo, Y., Soudant, D., Auby, I., Bozec, Y., Conan, P., Ganthy, F., Grégori, G., Lefebvre, A., Leynart, A., Rimmelin-Maury, P., Souchu, P., Vantrepote, V., Blondel, C., Cariou, T., Crispi, O., Cordier, M.-A., Crouvoisier, M., Duquesne, V., Ferreira, S., Garcia, N., Gouriou, L., Grosteffan, E., Le Merrer, Y., Meteigner, C., Retho, M., Tournaire, M.-P., and Savoye, N.: Trajectories of nutrients concentrations and ratios in the French coastal ecosystems: 20 years of changes in relation with large-scale and local drivers, Sci. Total Environ., 857, 159619, https://doi.org/10.1016/j.scitotenv.2022.159619, 2023.
Liénart, C., Savoye, N., Bozec, Y., Breton, E., Conan, P., David, V., Feunteun, E., Grangeré, K., Kerhervé, P., Lebreton, B., Lefebvre, S., L'Helguen, S., Mousseau, L., Raimbault, P., Richard, P., Riera, P., Sauriau, P.-G., Schaal, G., Aubert, F., Aubin, S., Bichon, S., Boinet, C., Bourasseau, L., Bréret, M., Caparros, J., Cariou, T., Charlier, K., Claquin, P., Cornille, V., Corre, A.-M., Costes, L., Crispi, O., Crouvoisier, M., Czamanski, M., Del Amo, Y., Derriennic, H., Dindinaud, F., Durozier, M., Hanquiez, V., Nowaczyk, A., Devesa, J., Ferreira, S., Fornier, M., Garcia, F., Garcia, N., Geslin, S., Grossteffan, E., Gueux, A., Guillaudeau, J., Guillou, G., Joly, O., Lachaussée, N., Lafont, M., Lamoureux, J., Lecuyer, E., Lehodey, J.-P., Lemeille, D., Leroux, C., Macé, E., Maria, E., Pineau, P., Petit, F., Pujo-Pay, M., Rimelin-Maury, P., and Sultan, E.: Dynamics of particulate organic matter composition in coastal systems: A spatio-temporal study at multi-systems scale, Prog. Oceanogr., 156, 221–239, https://doi.org/10.1016/j.pocean.2017.03.001, 2017.
Liénart, C., Garbaras, A., Qvarfordt, S., Sysoev, A. Ö., Höglander, H., Walve, J., Schagerström, E., Eklöf, J., and Karlson, A. M.: Long-term changes in trophic ecology of blue mussels in a rapidly changing ecosystem, Limnol. Oceanogr., 66, 694–710, https://doi.org/10.1002/lno.11633, 2020.
Liénart, C., Garbaras, A., Qvarfordt, S., Walve, J., and Karlson, A. M. L.: Spatio-temporal variation in stable isotope and elemental composition of key-species reflect environmental changes in the Baltic Sea, Biogeochemistry, 157, 149–170, https://doi.org/10.1007/s10533-021-00865-w, 2022.
Liénart, C., Tedengren, M., Garbaras, A., Lim, H., Chynel, M., Robinson, C., Meziane, T., and Karlson, A. M. L.: Diet quality determines blue mussel physiological status: A long-term experimental multi-biomarker approach, J. Exp. Mar. Biol. Ecol., 563, 151894, https://doi.org/10.1016/j.jembe.2023.151894, 2023.
Liénart, C., Fournioux, A., Garbaras, A., Blanche, H., Briant, N., Dubois, S., Gangnery, A., Grouhel, A., Le Monier, P., Lheureux, A., de Montaudouin, X., and Savoye, N.: Bivalve multi-decadal (1981–2021) records of carbon and nitrogen elemental and isotopic ratios (δ13C, δ15N and C:N) of 33 coastal sites of France, SEANOE [data set], https://doi.org/10.17882/100583, 2024a.
Liénart, C., Fournioux, A., Garbaras, A., Lheureux, A., Blanchet, H., Briant, N., Dubois, S. F., Gangnery, A., Grouhel Pellouin, A., Le Monier, P., de Montaudouin, X., and Savoye, N.: Bivalve tissues as a recorder of multidecadal global anthropogenic and climate-mediated change in coastal areas, Limnol. Oceanogr. Lett., 9, 653–666, https://doi.org/10.1002/lol2.10399, 2024b.
Liénart, C., Fournioux, A., Garbaras, A., Lheureux, A., Blanchet, H., Briant, N., Dubois, S. F., Gangnery, A., Grouhel Pellouin, A., Le Monier, P., de Montaudouin, X., and Savoye, N.: Bivalves δ13C time series (1981–2021) 32 stations France, Figshare [data set], https://doi.org/10.6084/m9.figshare.24884871.v1, 2024c.
Lotze, H. K., Lenihan, H. S., Bourque, B. J., Bradbury, R. H., Cooke, R. G., Kay, M. C., Kidwell, S. M., Kirby, M. X., Peterson, C. H., and Jackson, J. B.: Depletion, degradation, and recovery potential of estuaries and coastal seas, Science, 312, 1806–1809, https://doi.org/10.1126/science.1128035, 2006.
Magni, P., Rajagopal, S., Como, S., Jansen, J. M., van der Velde, G., and Hummel, H.: δ13C and δ15N variations in organic matter pools, Mytilus spp. and Macoma balthica along the European Atlantic coast, Mar. Biol., 160, 541–552, https://doi.org/10.1007/s00227-012-2110-7, 2013.
Malet, N., Sauriau, P. G., Ryckaert, M., Malestroit, P., and Guillou, G.: Dynamics and sources of suspended particulate organic matter in the Marennes-Oléron oyster farming bay: Insights from stable isotopes and microalgae ecology, Estuar. Coast. Shelf Sci., 78, 576–586, https://doi.org/10.1016/j.ecss.2007.11.001, 2008.
Marín Leal, J. C., Dubois, S., Orvain, F., Galois, R., Blin, J.-L., Ropert, M., Bataillé, M.-P., Ourry, A., and Lefebvre, S.: Stable isotopes (δ13C, δ15N) and modelling as tools to estimate the trophic ecology of cultivated oysters in two contrasting environments, Mar. Biol., 153, 673–688, https://doi.org/10.1007/s00227-007-0841-7, 2008.
Mazaleyrat, A., Normand, J., Dubroca, L., and Fleury, E.: A 26-year time series of mortality and growth of the Pacific oyster C. gigas recorded along French coasts, Sci. Data, 9, 392, https://doi.org/10.1038/s41597-022-01511-2, 2022.
Mele, I., McGill, R. A., Thompson, J., Fennell, J., and Fitzer, S.: Ocean acidification, warming and feeding impacts on biomineralization pathways and shell material properties of Magallana gigas and Mytilus spp., Mar. Environ. Res., 186, 105925, https://doi.org/10.1016/j.marenvres.2023.105925, 2023.
Milliman, J. D., Farnsworth, K. L., Jones, P. D., Xu, K. H., and Smith, L. C.: Climatic and anthropogenic factors affecting river discharge to the global ocean, 1951–2000, Global Planet. Change, 62, 187–194, https://doi.org/10.1016/j.gloplacha.2008.03.001, 2008.
Mook, W. and Rozanski, K.: Environmental isotopes in the hydrological cycle – Principles and applications, IAEA, https://www.hydrology.nl/images/docs/ihp/Mook_I.pdf (last access: 19 February 2025), 2000.
Niemi, G. J. and McDonald, M. E.: Application of ecological indicators, Annu. Rev. Ecol. Evol. Syst., 35, 89–111, https://doi.org/10.1146/annurev.ecolsys.35.112202.130132, 2004.
Patakamuri, S. and O'Brien, N.: modifiedmk: Modified versions of Mann Kendall and Spearman's Rho Trend Tests, R package version 1.6, CRAN, https://CRAN.R-project.org/package=modifiedmk (last access: 19 February 2025), 2021.
Pohlert, T.: PMCMRplus: Calculate Pairwise Multiple Comparisons of Mean Rank Sums Extended, R package version 1.9.10, CRAN, https://CRAN.R-project.org/package=PMCMRplus (last access: 19 February 2025), 2023.
Ray, N. E. and Fulweiler, R. W.: Seasonal patterns of benthic-pelagic coupling in oyster habitats, Mar. Ecol. Prog. Ser., 652, 95–109, https://doi.org/10.3354/meps13490, 2020.
R Core Team: R: A language and environment for statistical computing, R Foundation for Statistical Computing, https://www.R-project.org/ (last access: 19 February 2025), 2022.
Schloesser, R. W., Rooker, J. R., Louchuoarn, P., Neilson, J. D., and Secor, D. H.: Interdecadal variation in seawater δ13C and δ18O recorded in fish otoliths, Limnol. Oceanogr., 54, 1665–1668, https://doi.org/10.4319/lo.2009.54.5.1665, 2009.
Sukhotin, A. and Berger, V.: Long-term monitoring studies as a powerful tool in marine ecosystem research, Hydrobiolgia, 706, 1–9, https://doi.org/10.1007/s10750-013-1456-2, 2013.
Thibault, M., Duprey, N., Gillikin, D. P., Thébault, J., Douillet, P., Chauvaud, L., Amice, E., Munaron, J. M., and Lorrain, A.: Bivalve δ15N isoscapes provide a baseline for urban nitrogen footprint at the edge of a World Heritage coral reef, Mar. Pollut. Bull., 152, 110870, https://doi.org/10.1016/j.marpolbul.2019.110870, 2020.
Tuel, A. and Eltahir, E. A.: Why is the Mediterranean a climate change hot spot?, J. Climate, 33, 5829–5843, https://doi.org/10.1175/JCLI-D-19-0910.1, 2020.
Wannicke, N., Liskow, I., and Voss, M.: Impact of diazotrophy on N stable isotope signatures of nitrate and particulate organic nitrogen: case studies in the north-eastern tropical Atlantic Ocean, Isotop. Environ. Health Stud., 46, 337–354, https://doi.org/10.1080/10256016.2010.505687, 2010.