the Creative Commons Attribution 4.0 License.
the Creative Commons Attribution 4.0 License.
 | 21 Feb 2025
High-resolution hydrometeorological and snow data for the Dischma catchment in Switzerland
Jan Magnusson
Yves Bühler
Louis Quéno
Bertrand Cluzet
Giulia Mazzotti
Clare Webster
Rebecca Mott
Tobias Jonas
We present an hourly hydrometeorological and snow dataset with 100 m spatial resolution from the alpine Dischma watershed and its surroundings in eastern Switzerland, including station measurements of variables such as snow depth and catchment runoff. This dataset is particularly suited for different modelling experiments using distributed and process-based models, including physics-based snow and hydrological models. Additionally, the data are highly useful for testing various snow data assimilation schemes and for developing models representing snow–forest interactions. The dataset covers 7 water years from 1 October 2016 to 30 September 2023. The complete domain spans an area of 333 km2 with altitudes ranging from 1250 to 3228 m. The Dischma Basin, with its outlet at 1671 m elevation, occupies 42.9 km2. Included in the dataset are high-resolution (100 m) hourly meteorological data (air temperature, relative humidity, wind speed and direction, precipitation, and long- and shortwave radiation) from a numerical weather predication model and rain radar, land cover characteristics (primarily forest properties), and a digital elevation model. Notably, the dataset includes snow depth acquisitions obtained from airborne lidar and photogrammetry surveys, constituting the most extensive spatial snow depth dataset derived using such techniques in the European Alps. Along with these gridded datasets, we provide daily quality-controlled snow depth recordings from seven sites, biweekly snow water equivalent measurements from two locations, and hourly runoff and stream temperature observations for the Dischma watershed. The data compiled in this study will be useful to further develop our ability to forecast snow and hydrological conditions in high-alpine headwater catchments that are particularly sensitive to ongoing climate change. All data are available for download at https://doi.org/10.16904/envidat.568 (Magnusson et al., 2024).
- Article
(3797 KB) - Full-text XML
- BibTeX
- EndNote


In this paper, we present a high-resolution hydrometeorological and snow dataset from the Dischma watershed and its surroundings in eastern Switzerland. The Dischma catchment represents a typical high-alpine watershed in the European Alps and serves as a headwater basin of the Rhine River. The Rhine flows through Switzerland, Germany, and the Netherlands before reaching the North Sea, passing through some of the most densely populated regions in Europe. Snow deficits in headwater catchments like Dischma can contribute to summer droughts far downstream, causing significant socio-economic impacts (Avanzi et al., 2024). Conversely, rain-on-snow events can lead to devastating floods (Rössler et al., 2014). Additionally, snow cover influences ecosystem dynamics (Rixen et al., 2022), natural hazards (Ortner et al., 2023), tourism (Töglhofer et al., 2011), and climate through snow–albedo feedback (Thackeray et al., 2019). Therefore, accurately monitoring and reliably forecasting snow and water resources in these headwater catchments is of high importance for a large range of applications.
To improve the predictability of water resources from mountainous regions, the International Network for Alpine Research Catchment Hydrology (INARCH) was initiated by Pomeroy et al. (2015) as part of the Global Energy and Water Exchanges project of the World Climate Research Programme. The Dischma catchment belongs to the study basins of the INARCH project (for more details, see https://inarch.usask.ca, last access: 1 December 2024), and similar datasets to ours have already been presented for sites such as Marmot Creek in Canada (Fang et al., 2019), Guadalfeo Basin in Spain (Polo et al., 2019), Heihe catchment in China (Che et al., 2019), the Tuolumne and Merced watersheds in the USA (Roche et al., 2019), and the Rofental in Austria (Strasser et al., 2018). Our dataset, which features distributed meteorological forcing data and annual measurements of spatial snow depth distribution in the basin, will complement existing studies and provide the hydrological and snow modelling communities with valuable data to conduct simulation experiments for the high-alpine Dischma watershed.
Numerous snow and hydrological research studies have been conducted in the Dischma Basin and its surrounding areas. Early studies employed seminal methods for snowmelt runoff modelling (Kustas et al., 1994; Martinec, 1975; Rango and Martinec, 1981) and included assessments of groundwater hydrology (Martinec et al., 1982); the impact of avalanches on hydrology (Martinec, 2014); and the relationships between snow-covered area, snow water equivalent, and runoff volume (Martinec, 1982; Martinec and Rango, 1987). Data from the basin have been used to compare spatially distributed hydrological models in mountainous catchments, including simple energy-balance schemes for snow cover simulations (Gurtz et al., 2003; Zappa et al., 2003), also in the context of climate change (Carletti et al., 2022).
The physics-based surface process model Alpine3D was initially tested using observations from Dischma (Lehning et al., 2006), with subsequent applications in this particular catchment for assessments of snow and climate change (Bavay et al., 2009; Bavay et al., 2013), runoff dynamics (Brauchli et al., 2017; Wever et al., 2017), and stream temperatures (Comola et al., 2015). Further studies in the catchment and its vicinity include analyses of avalanche activity (Baggi and Schweizer, 2009), snow–forest interactions (e.g. Mazzotti et al., 2020b; Moeser et al., 2015), snow redistribution processes (Berg et al., 2024; Quéno et al., 2024), snow–atmosphere interactions (Mott et al., 2017; Haugeneder et al., 2024), and snowfall processes (Gerber et al., 2018; Reynolds et al., 2024). The Dischma catchment and its surroundings have been a focus area for the development of cost-efficient techniques to acquire accurate, high-resolution snow depth data over large areas. This effort has resulted in a unique long-term dataset for the European Alps (Bührle et al., 2023).
The purpose of this paper is to provide a comprehensive high-resolution (100 m) meteorological dataset with an hourly temporal resolution and snow observations as well as relevant land cover data complemented by station measurements encompassing variables such as catchment runoff and snow water equivalent for the Dischma Basin (area equal to 42.9 km2) and its surroundings in eastern Switzerland (total area equal to 333 km2). We provide hourly meteorological and runoff data over the complete study period from 1 October 2016 until 30 September 2023, spanning 7 water years. The meteorological data were obtained from a numerical weather prediction model and a precipitation radar product. The presented datasets serve as a pivotal resource to further improve and test distributed process-based models, including physics-based snow models, land surface schemes, and hydrological models tailored for detailed simulations within high-alpine regions. The dataset is processed to be directly useful in various modelling experiments as well as to be suitable for testing various data assimilation schemes. We describe the different data sources and processing methods employed and where the data can be accessed below.
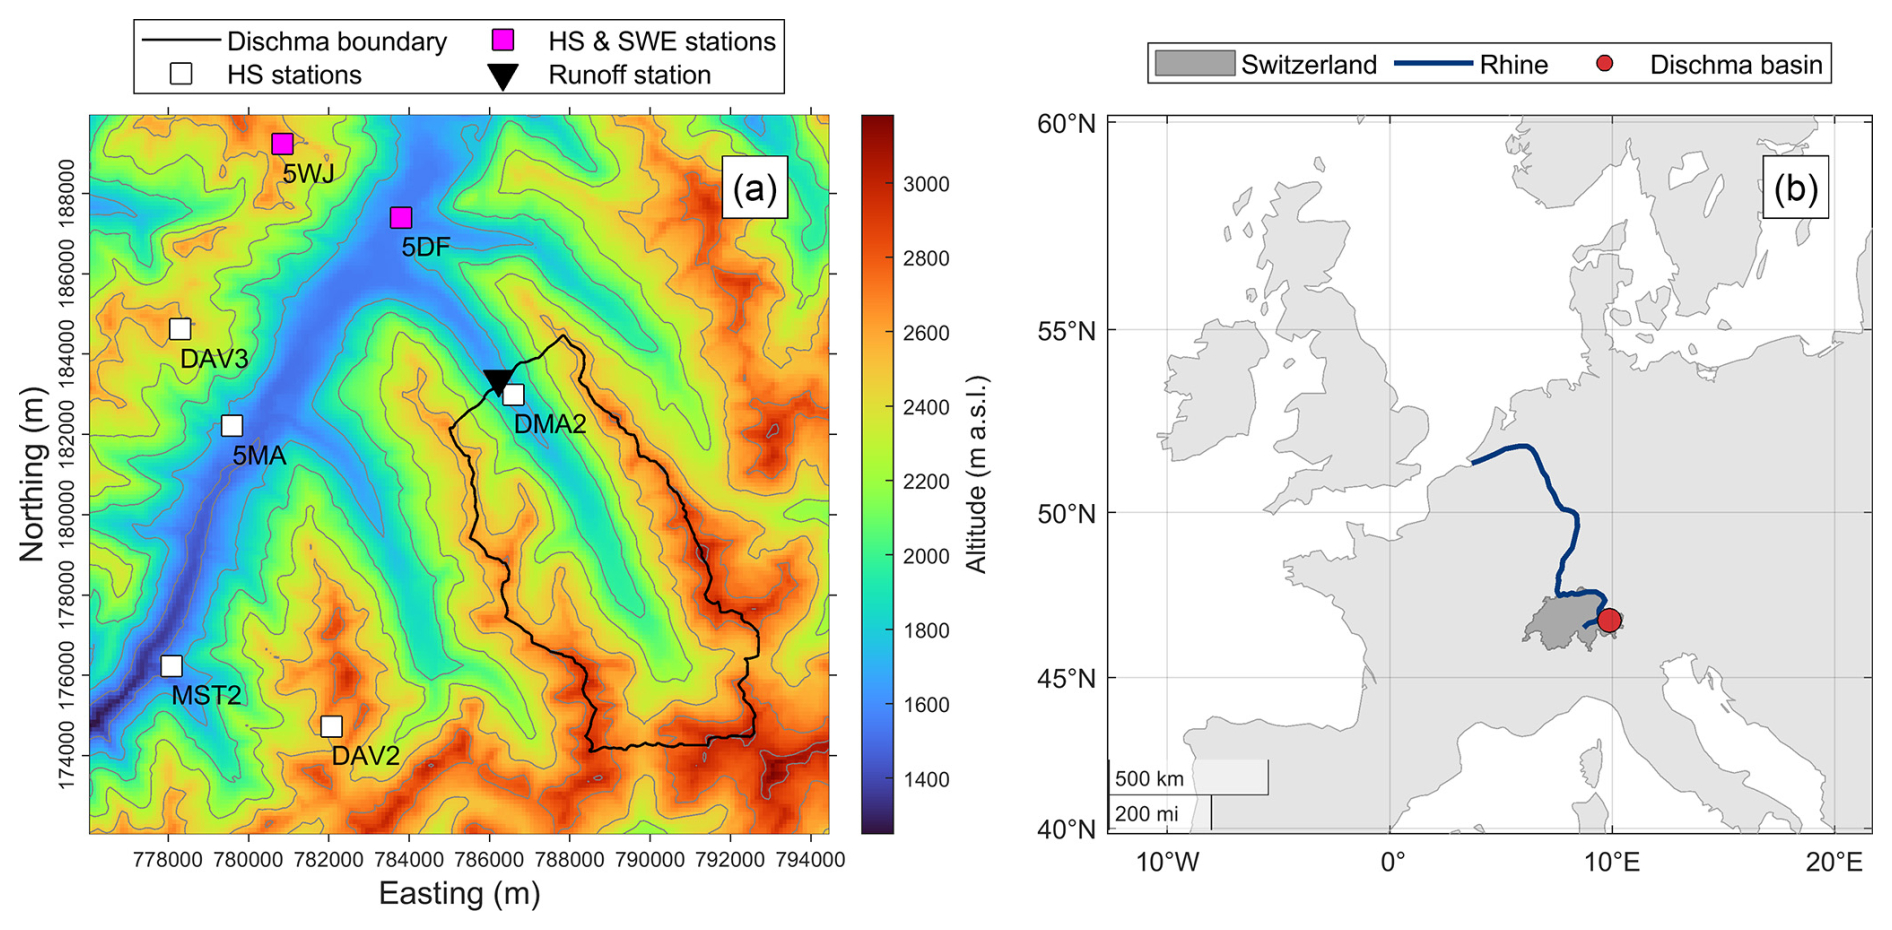
Figure 1(a) Site map of the Dischma watershed and the extended domain for which we provide meteorological and land cover data. The map indicates the altitude of the domain as well as the location of stations used for snow, meteorological, and runoff measurements. (b) The location of the Dischma Basin in Europe along with the Swiss national borders and the Rhine River.
The Dischma watershed, located in eastern Switzerland, spans an area of approximately 42.9 km2 and serves as a headwater basin for the Rhine River (Fig. 1). The basin is situated in the transition zone between the wet northern Alps and the dry central Alps (Carletti et al., 2022). The elevation within the catchment ranges from 1671 to 3146 m, with an average altitude of 2371 m. Below, we provide an overview of the most significant characteristics of the Dischma catchment as described by Höge et al. (2023).
The mean slope of the catchment is 25°, with 84 % of the basin area being steeper than 15° and 35 % being steeper than 30°. Higher altitudes in the watershed are primarily characterized by bare land with rocks and bare soil, covering 55 % of the watershed area. At lower altitudes, grasses and herb vegetation dominate, accounting for 33 % of the area. Coniferous forests cover 2 % of the basin, while mixed forests cover 1 %. Wetlands, which make up 7 % of the landscape, are distributed across the watershed, and the Scaletta Glacier, occupying the southeasternmost part, covers 1 % of the area. The glacier has an area of 0.49 km2 and a volume of 0.01 km2, according to the latest inventories (Swiss Glacier Inventory, 2016, described in Linsbauer et al., 2021). The soils in the Dischma watershed are mainly sandy, with smaller inclusions of silt, clay, and minor amounts of organic material. Geologically, the basin is characterized by metamorphic rocks and unconsolidated sediments. For more detailed information about the catchment attributes, the reader is referred to Höge et al. (2023) and the references therein.
Within the Dischma catchment, only one site with snow observations is available (Fig. 1). To obtain a sufficient number of locations with continuous snow observations for model evaluations, we expanded our domain and meteorological forcing dataset (see Sect. 3) to cover an 18.5 km × 18.0 km region surrounding the Dischma watershed. In this expanded region, altitudes range from 1250 to 3228 m, with an average altitude of 2257 m. Additionally, this larger region covers lower elevations with larger forest cover, important for conducting research on snow–forest interactions (e.g. Mazzotti et al., 2019b). The snow observations are either performed by the WSL Institute for Snow and Avalanche Research SLF (SLF) or by the Federal Office of Meteorology and Climatology (MeteoSwiss).
Hourly gridded meteorological data (air temperature, relative humidity, long- and shortwave radiation, wind speed and direction, precipitation, and air pressure) at 100 m resolution were derived from the analysis fields of the COSMO (Consortium for Small-scale Modeling; see https://www.cosmo-model.org/, last access: 1 December 2024) weather forecasting model and the CombiPrecip combined gauge and radar precipitation product by employing variable-specific downscaling techniques, as outlined below (see Sects. 3.1 to 3.4). Both the COSMO model results and the CombiPrecip product are generated by MeteoSwiss. We provide the same forcing data as used by Quéno et al. (2024) for detailed snow cover simulations including wind- and gravity-driven snow redistribution. Equivalent meteorological datasets based on largely the same downscaling strategies have been used in various snow studies (e.g. Magnusson et al., 2017; Winstral et al., 2019). Importantly, the meteorological forcing data presented here but at a 250 m resolution are used for real-time snow-hydrological forecasting in Switzerland (Mott et al., 2023). Thus, the high-resolution meteorological dataset presented in this paper is particularly valuable for assessing various model simulations under operational data constraints.
The COSMO numerical weather prediction system was developed for regional-scale atmospheric simulations. COSMO employs a grid-nesting approach, enabling simulations at varying spatial resolutions, including 1.1 km in our case. As mentioned above, we use data from the analysis version of this model, which became operational in March 2016 (Winstral et al., 2019). The COSMO model incorporates a set of primitive equations to describe atmospheric behaviour and uses a non-hydrostatic formulation suitable for depicting atmospheric processes at smaller scales and in mountainous regions such as the Swiss Alps. COSMO uses detailed parameterizations for physical processes such as radiation, turbulence, and microphysics, enhancing its ability to capture a wide range of atmospheric phenomena. The non-hydrostatic formulation of the model allows for a better representation of features like mesoscale orographic effects, which are crucial for accurately capturing features such as precipitation patterns (Vionnet et al., 2016). COSMO is widely used in operational weather forecasting and research applications, particularly for regions with complex terrain or small-scale weather features (Klasa et al., 2018).
In addition to data from the COSMO weather forecasting model, we also used precipitation fields from the hourly CombiPrecip product. These precipitation fields are derived using a geostatistical combination of heated rain-gauge observations and radar measurements, providing state-of-the-art spatial precipitation estimates. The product relies on data from automatic stations that record precipitation every 10 min and five C-band weather radars located within Switzerland. Within the study domain, there are two precipitation gauges with 10 min measurements (near locations 5DF and 5WJ in Fig. 1) and one radar (near site 5WJ in Fig. 1). A method based on co-kriging with external drift is used to combine the two data sources, resulting in nearly unbiased precipitation maps at an hourly resolution (Barton et al., 2020; Sideris et al., 2014). However, the quality of this product at high altitudes remains uncertain, as the validation was mainly based on precipitation measurements located below 2000
Below, we describe the downscaling strategy for the various meteorological variables. Initially, we generated data at a 25 m resolution. Subsequently, to maintain reasonable data volumes, we upscaled the results to 100 m resolution for the extended data domain (see Fig. 1) and aligned with the provided land cover data such as the digital elevation model (see Sect. 7).
3.1 Air temperature and relative humidity
Air temperature was linearly interpolated onto the high-resolution grid, incorporating a lapse rate correction of 6.5 K km−1, which was held constant over time. To obtain distributed relative humidity values, we first interpolated dew point temperatures onto the high-resolution grid using the same method and lapse rate as for air temperature. Finally, the interpolated air and dew point temperatures were converted to relative humidity using the saturation pressure function by Murray (1967). The obtained fields represent air temperature and relative humidity at 10 m above the ground.
3.2 Long- and shortwave radiation
Shortwave radiation was downscaled to account for terrain effects using the HPEval radiation transfer model (Jonas et al., 2020). HPEval masks direct shortwave radiation whenever surrounding terrain inhibits insolation, while diffuse shortwave radiation is scaled with the local sky-view fraction (which is provided with this dataset; see Sect. 7). The resulting incoming shortwave radiation at the surface is output per inclined surface area. Incoming longwave radiation is provided as downwelling flux above terrain so that the influence of the surrounding terrain can be calculated inside the snow model based on the simulated surface temperatures. Note that incoming radiation below the forest canopy should be treated using the forest radiation transfer parameters discussed in Sect. 4 below.
3.3 Wind speed and direction
To account for topographic effects on wind fields, wind speed and direction were downscaled using the mass-conserving WindNinja (version 3.7.0) dynamical downscaling model (Forthofer et al., 2014; Wagenbrenner et al., 2016). The coarse-resolution COSMO wind fields (see above) were used as forcing input to the model. Vionnet et al. (2021) and Quéno et al. (2024) noted model instabilities in very complex terrain when using the mass- and momentum-conserving version of WindNinja (Wagenbrenner et al., 2019), which was then not applied for the present domain. The final fields represent wind speed and direction at 10 m above the ground.
3.4 Precipitation
Hourly precipitation fields were obtained from the combined radar and rain-gauge product CombiPrecip (see description in Sect. 3). These precipitation fields were improved via the assimilation of daily snow depth recordings using an optimal interpolation scheme, a data assimilation scheme often used for improving gridded precipitation estimates (e.g. Lussana et al., 2018). The combination of point snow depth recordings with the gridded precipitation field required four steps:
-
Daily snowfall rates were estimated at the snow monitoring sites using a density model (HS2SWE) that converts changes in snow depth to snow water equivalents (Magnusson et al., 2025).
-
Daily solid and liquid precipitation fields were obtained using the precipitation fields from CombiPrecip and gridded air temperatures from COSMO.
-
The daily gridded snowfall fields were improved by assimilating the snowfall estimates obtained at the stations in step 1 using an optimal interpolation scheme.
-
The daily improved snowfall fields together with the daily rainfall estimates were used to correct the hourly precipitation fields from CombiPrecip. For detailed information about the assimilation procedure outlined here, see Magnusson et al. (2014), Mott et al. (2023), and Quéno et al. (2024).
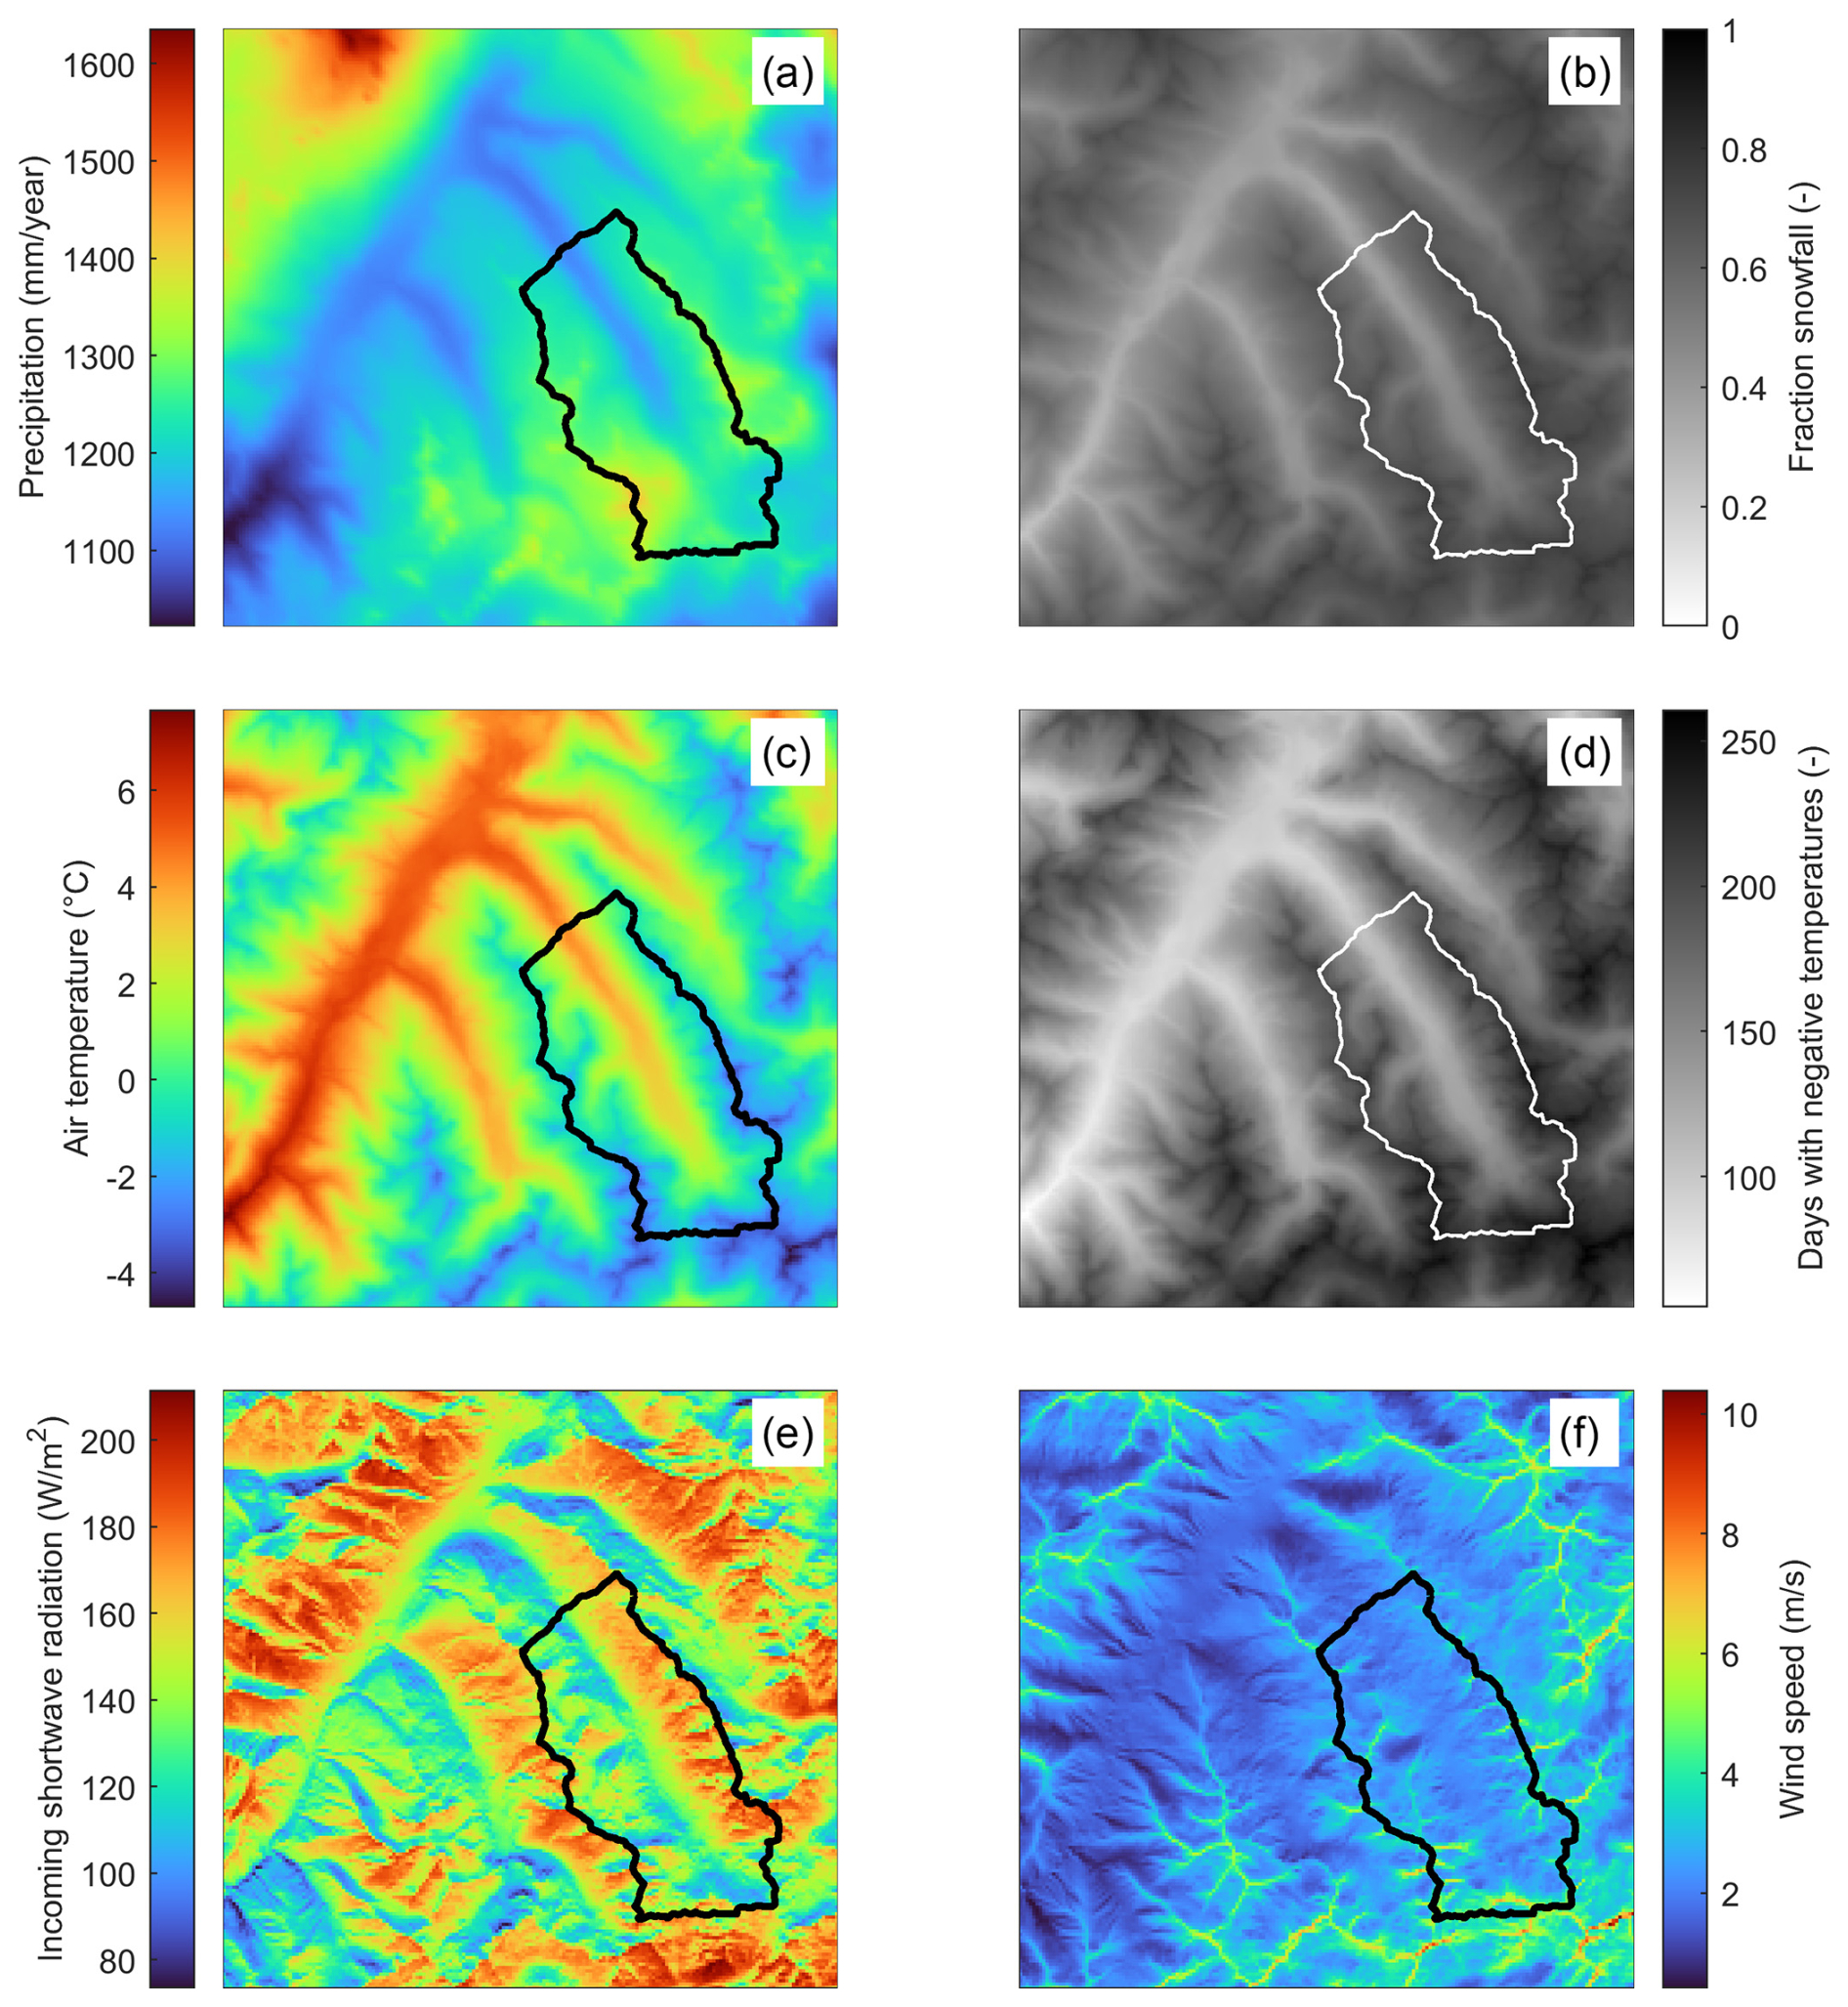
Figure 2Panel (a) shows the average annual precipitation over the study period, while panel (b) illustrates the fraction of total precipitation that falls as snow. Panel (c) presents the mean air temperature during the study period, and panel (d) displays the number of days per year with a daily average air temperature below 0°C. Finally, panel (e) depicts the mean incoming shortwave radiation, and panel (f) visualizes the average wind speed over the data period.
3.5 Features of meteorological forcing fields
Figure 2 illustrates various features of the high-resolution meteorological forcing fields. A precipitation gradient is evident, with the northwestern part of the region experiencing a wetter climate, while the southeastern area is comparatively drier (Fig. 2a). There is also a pronounced vertical gradient in precipitation, with valleys receiving less precipitation than mountain ridges. In the valleys, approximately 30 % to 40 % of the total precipitation falls as snow during the study period, whereas this fraction increases to roughly 70 % at higher altitudes (Fig. 2b). Over the Dischma catchment, approximately 60 % of precipitation falls as snow. Throughout the study domain, the average air temperature ranges from −4.7 to 7.7 °C, principally reflecting the variations in altitude (Fig. 2c). The coldest air temperatures are recorded in the southeastern parts of the domain, coinciding with the highest mountain peaks (compare with Fig. 1a). On the valley floors, the average daily air temperature falls below 0 °C for roughly 3 months each year, whereas negative daily average temperatures occur for approximately 7 to 8 months annually at higher elevations (Fig. 2d). Unlike the relatively smooth precipitation and air temperature fields, the downscaled shortwave radiation, which includes both direct and diffuse components, exhibits fine-grained features with significantly higher radiation inputs on south-facing compared with north-facing slopes (Fig. 2e). Similar fine-grained patterns are observed in the downscaled wind fields, where average wind speeds exceed approximately 8 m s−1 along the ridges, while wind speeds are around 2 m s−1 on average in lower and more sheltered areas (Fig. 2f).
In addition to meteorological forcings, spatially distributed, process-based snow and hydrological models applied to (partially) forested domains require datasets characterizing the forest structure, as forest structure has a substantial impact on water and energy exchanges between the atmosphere and the land surface. In this dataset, we have included forest structure descriptors used in the FSM2oshd snow model (Mott et al., 2023). As the forest representation in FSM2oshd was specifically developed to account for the impact of heterogeneous forest structure (Mazzotti et al., 2021), it incorporates more forest structure variables than “standard” land surface and hydrological models. Available datasets are described in the following sections. All of these forest structure descriptors are derived from a 1 m canopy height model generated from airborne lidar datasets that cover all of Switzerland (Webster et al., 2024). According to the model-upscaling strategy proposed in Mazzotti et al. (2021), forest structure metrics are calculated at very high resolution (here, evaluation points at 10 m spacing) and then aggregated to 100 m to match the resolution of the meteorological datasets.
4.1 Canopy structure variables
Canopy structure descriptors provided in this study include the following variables: canopy height (Hc), local and stand-scale canopy cover fraction (Fcl and Fcs), and leaf area index (LAI). These descriptors are valid for the fraction of the grid cell covered by forest, which is also provided in addition to the parameters listed above (Ffor). These variables are required as land use information by FSM2oshd, while many land surface and hydrological models require LAI and canopy height only. Hc, Fcl, and Fcs are computed from the 1 m nationwide canopy height model (CHM), over areas of 5 m (Fcs) and 50 m (Hc and Fcs) radii around each evaluation point. LAI is parameterized from Fcl and Hc, with maximum LAI values limited to specific values for forest type (needleleaf vs. broadleaf or evergreen vs. deciduous) and ecoregions and assuming leaf-off wintertime conditions. As these datasets were specifically created for snow modelling, seasonal variations in LAI and forest cover are disregarded. For further detail, we refer to Mott et al. (2023).
4.2 Radiation transmission variables
Sky-view fraction (Vf) and time-varying direct-beam transmissivity (Td(t)) are used to calculate the transmission of diffuse and direct shortwave radiation, respectively, as well as to calculate longwave radiation (Vf only). Both are dimensionless variables that describe the proportion of above-canopy radiation transmitted through the canopy to the snow/ground surface. In particular, the transmission of direct solar radiation through forest canopies is a highly complex process that is dependent on the position of individual tree crowns relative to the Sun. Spatially and temporally, it varies over metre and minute scales. Vf and Td(t) are provided as input to FSM2oshd and, therefore, included in the datasets provided in this study. In a snow modelling context, this allows a detailed representation of canopy radiative transfer without added model complexity and has been shown to be beneficial for capturing the impact of complex canopy structure on forest snow dynamics. The radiation transfer information has also proven useful in the context of ecological modelling (Zellweger et al., 2024).
Both Vf and Td(t) were calculated using the Canopy Radiation Model (CanRad; Webster et al., 2023). CanRad calculates synthetic hemispheric images at each evaluation point as follows: first, it traces the canopy horizon line from the CHM; second, it calculates a probability of light transmission below this line using a statistical relationship between canopy thickness and tree crown volume, which is dependent on tree type across the model domain, determined using the forest mix rate data from Waser et al. (2017). Vf and Td(d) are calculated using the methods in Essery et al. (2008) and Jonas et al. (2020), respectively. The 10 m evaluation points used in this study are part of the SwissRad10 dataset (Webster et al., 2024) and were aggregated to 100 m for FSM2oshd. In this dataset, both Vf and Td(t) are calculated assuming leaf-off canopy conditions. Like the canopy structure variables (Sect. 4.1), Vf and Td(t) relate to the forest fraction of each grid cell.
5.1 Spatial snow depth data from airborne surveys
High-resolution snow depth (HS) data for the Dischma Basin and surrounding areas were obtained from airborne photogrammetric and lidar surveys. The photogrammetric surveys were conducted once each winter (from mid-March to mid-April) throughout the entire study period, while the three lidar acquisitions were collected during the winter-to-spring transition in 2017. It is important to note that lidar data provide measurements in both forested and open areas, whereas the photogrammetric method only captures data in open areas. The lidar surveys have been used in studies of snow–forest interactions (Mazzotti et al., 2019b, 2023; Yang et al., 2023; John et al., 2022); for validation of snow modelling, including snow redistribution processes (Berg et al., 2024; Quéno et al., 2024); and for spatially distributed modelling of snow instability (Richter et al., 2021). Photogrammetric HS data obtained within the study domain have been applied in snow depth modelling and mapping studies as key validation and training datasets (e.g. Helbig et al., 2021; Daudt et al., 2023). Notably, these large-scale and high-resolution acquisitions of snow depths are unique for the European Alps. Those datasets are comparable in quality to the results generated with lidar altimetry by the Airborne Snow Observatory (ASO) programme in the USA (Painter et al., 2016; Meyer et al., 2022), but the monitoring started earlier, in 2010 (Bühler et al., 2015). The Dischma acquisitions represent the longest data record of large-scale and high-resolution HS monitoring based on airborne remote sensing, although with a smaller area than that covered by the ASO programme.
The photogrammetric HS fields provided in our dataset were acquired using the UltraCam survey-grade frame camera, which provides data with a spatial resolution of 0.5 m (Bührle et al., 2023). These datasets have been compared to manual measurements and drone-based photogrammetry (Vander Jagt et al., 2015; Bühler et al., 2016) as well as results from satellite photogrammetry (Marti et al., 2016), resulting in a HS accuracy in terms of the root-mean-square error ranging from 0.1 to 0.15 m (Eberhard et al., 2021). The three lidar surveys were performed on 20 March 2017, 31 March 2017, and 17 May 2017 over a region centred on the Dischma Valley, and the resulting data have a spatial resolution of 1 m. Mazzotti et al. (2019b) validated these datasets in sparse forested terrain against roughly 11 000 measurements of HS taken by manual probing, showing a low bias (−4 to 0 cm) and root-mean-square error (4 to 8 cm) between the two datasets. For both the photogrammetry and lidar datasets, urban areas (e.g. buildings) and outliers were masked out. Additionally, forested terrain was excluded from the photogrammetric data. These filtering steps enhance the suitability of the datasets for model evaluation purposes.
In our dataset, we have upscaled (averaged) the high-resolution HS data from both photogrammetry and lidar to the common 100 m grid used for all spatial data (e.g. land cover and meteorological fields). Thus, the observed HS fields can directly be used for evaluating model simulations performed with the provided meteorological forcing data (see Sect. 3). The native-resolution photogrammetry data can be obtained from Bührle et al. (2022). Overall, the upscaled lidar acquisitions cover an area ranging from 139 to 150 km2, or 42 % to 45 % of the complete domain. Excluding 2018, the upscaled photogrammetric data cover an area ranging from 165 to 284 km2, or 50 % to 85 % of the domain. In 2018, bad weather and sensor failures resulted in a smaller acquisition area equal to 51 km2, or 15 % of the domain. Overall, this dataset provides a unique opportunity to evaluate physics-based snow models including redistribution processes in the European Alps (e.g. Quéno et al., 2024).
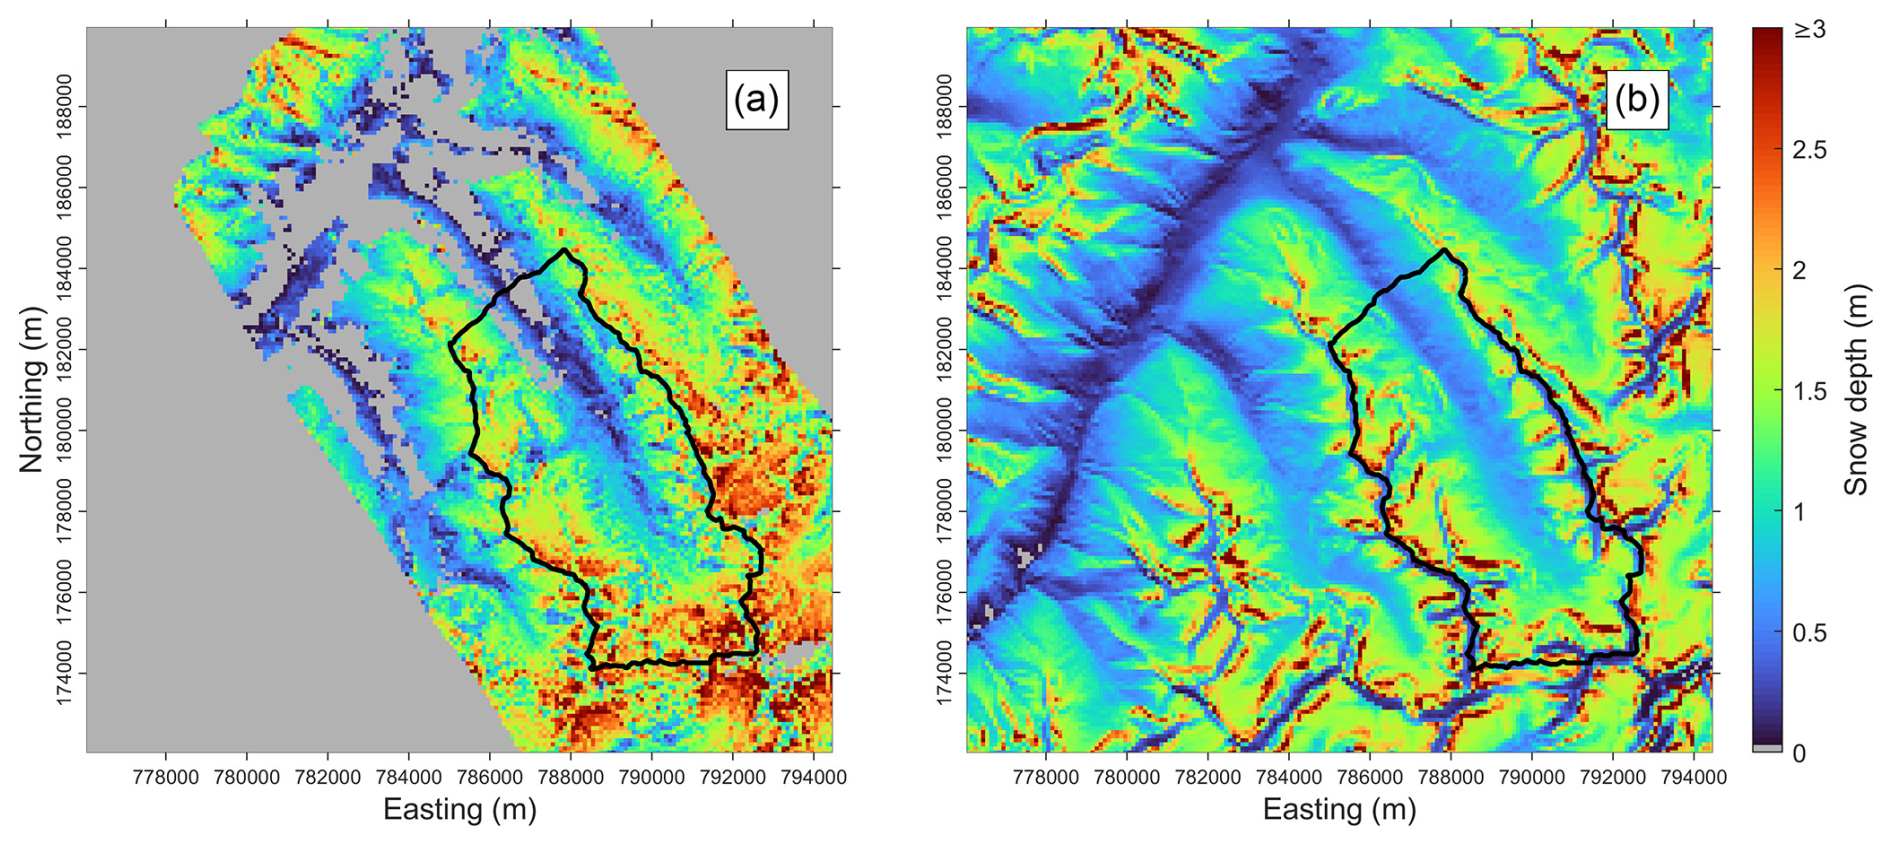
Figure 3Observed (a) and simulated (b) snow cover at 100 m resolution over the study domain for 6 April 2020. Areas without observations are masked by the grey colour in panel (a).
Figure 3a illustrates a HS field obtained through photogrammetry for the Dischma Valley and its surroundings. The method does not provide valid data outside of the acquisition perimeter or in low-elevation areas with forests and buildings, so these regions area masked out and marked in grey (as described above). The largest snow accumulations are observed in the southeastern and high-altitude areas (see also Fig. 1), even though this area belongs to the drier part of the domain according to our precipitation fields (see Fig. 2a). These large snow accumulations align with the small glacier located along the southern border of the Dischma catchment (see Sect. 2).
Figure 3b presents simulation results for the same domain and date, obtained using the FSM2trans model, which includes snow redistribution by wind and avalanches (Quéno et al., 2024). The model was run with the datasets presented in this study. Overall, the model captures the main features of the observed snow cover reasonably well, such as (a) the strong elevation trend in HS; (b) the large snow accumulations due to snowdrift and, below steep slopes, due to avalanches; and (c) the snow-free ridges caused by wind erosion (although sometimes erosion is too strong). At the same time, at the highest altitudes above 2500 m, the model displays lower snow depths than the observations, likely due to underestimated precipitation (Quéno et al., 2024). The model also fails to capture some of the small-scale variability in the observed HS, in particular at mid-altitudes (compare Fig. 3a and b). Despite these limitations, this example demonstrates that valuable model results can be obtained from the data provided in this paper. Such results can lead to interesting conclusions and potentially improve both the forcing data (e.g. better correction of precipitation data) and the models (e.g. more accurate wind redistribution schemes).
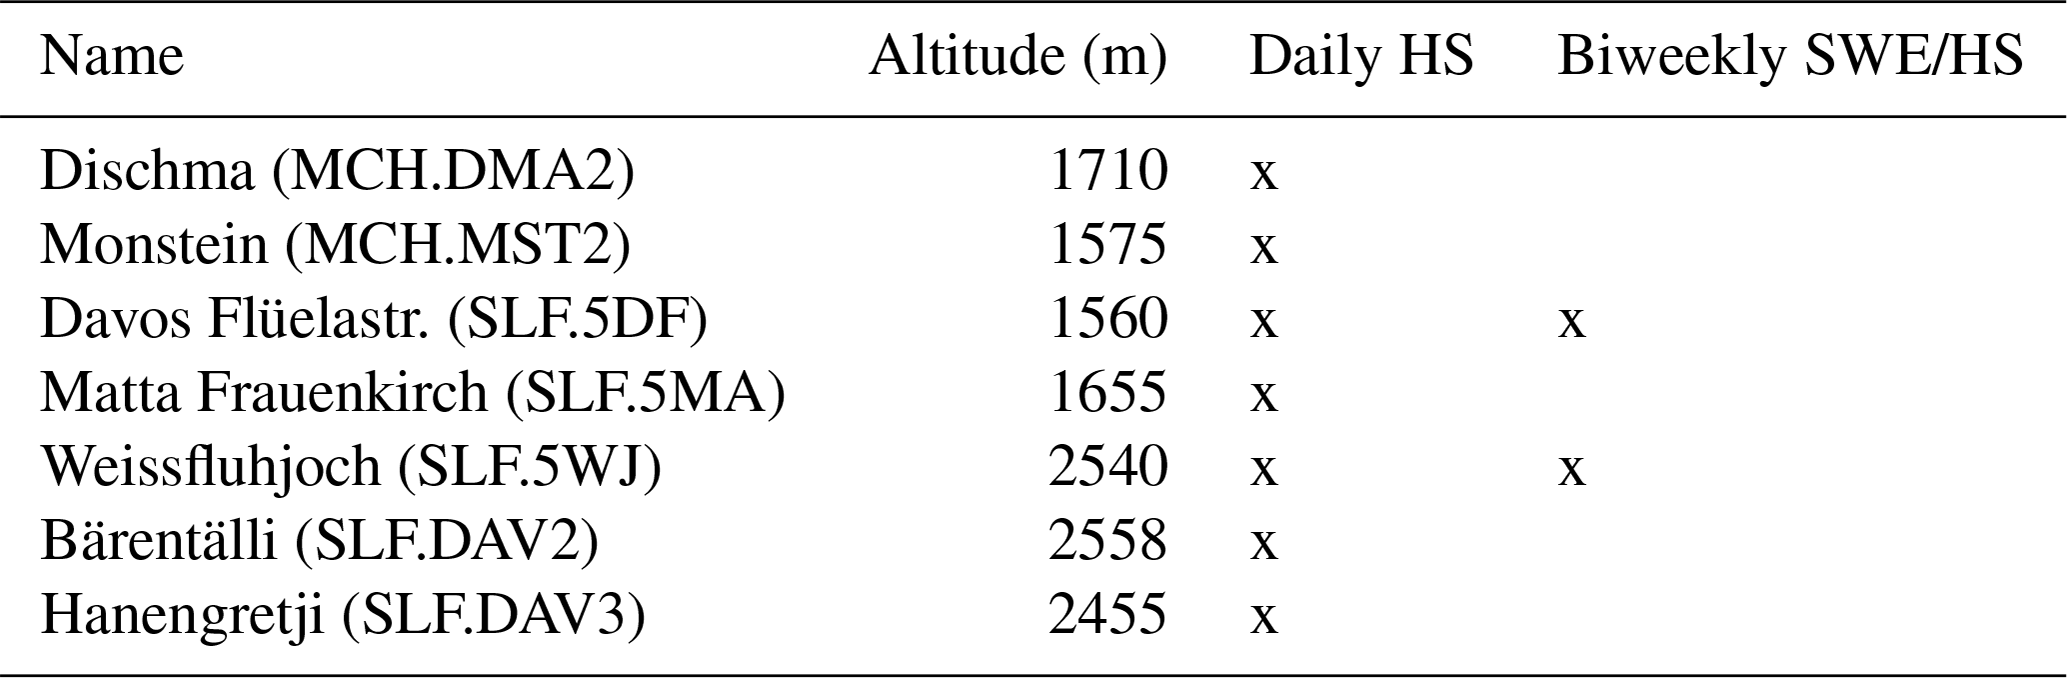
Table 1Sites with daily snow depth recordings and biweekly snow profiles providing snow water equivalent (SWE) estimates. Data providers are either MeteoSwiss (MCH) or SLF. The DAV2 and DAV3 sites are equipped with automatic sensors, whereas measurements are performed manually at the remaining locations.
5.2 Station snow depth measurements
Daily HS recordings from seven stations and biweekly snow water equivalent (SWE) measurements from two sites were provided in this dataset (Table 1). All measurement locations are characterized by limited exposure to wind and by flat terrain. The HS observations were performed either manually, using a fixed installed and graded measurement stake, or automatically, using ultrasonic sensors. The manual daily HS recordings have an uncertainty in the range of ± 2 cm (Resch et al., 2023), while the corresponding uncertainty for the automatic measurement is in the order of ± 1 cm (Ryan et al., 2008). The HS recordings provided in this dataset have been manually quality-checked. Gaps have been filled and outliers have been corrected through interpolation procedures utilizing data from surrounding stations. These quality-controlled daily HS data are routinely used within the snow-hydrological forecasting service operated by SLF (Mott et al., 2023).
The biweekly SWE observations were obtained through manual profiling by taking vertical snow cores from the top to the bottom of the snowpack with the ETH sampler. The ETH cylinder has demonstrated lower variability between sample replicates compared with most other devices used for measuring SWE in Europe and North America (López-Moreno et al., 2020). Each SWE observation is paired with a HS recording from the same snow pit. Note that the HS measurement from the pit may differ from the daily HS recording taken at the nearby stake or automatic sensor due to spatial variability in the snow cover. The ratio between the SWE and HS observation obtained from the manual profile gives an estimate of the bulk snow density. The manual snow profiles are conducted by experienced field staff, and the data are used operationally by the avalanche forecasting service as well as by the snow-hydrological forecasting team at SLF.
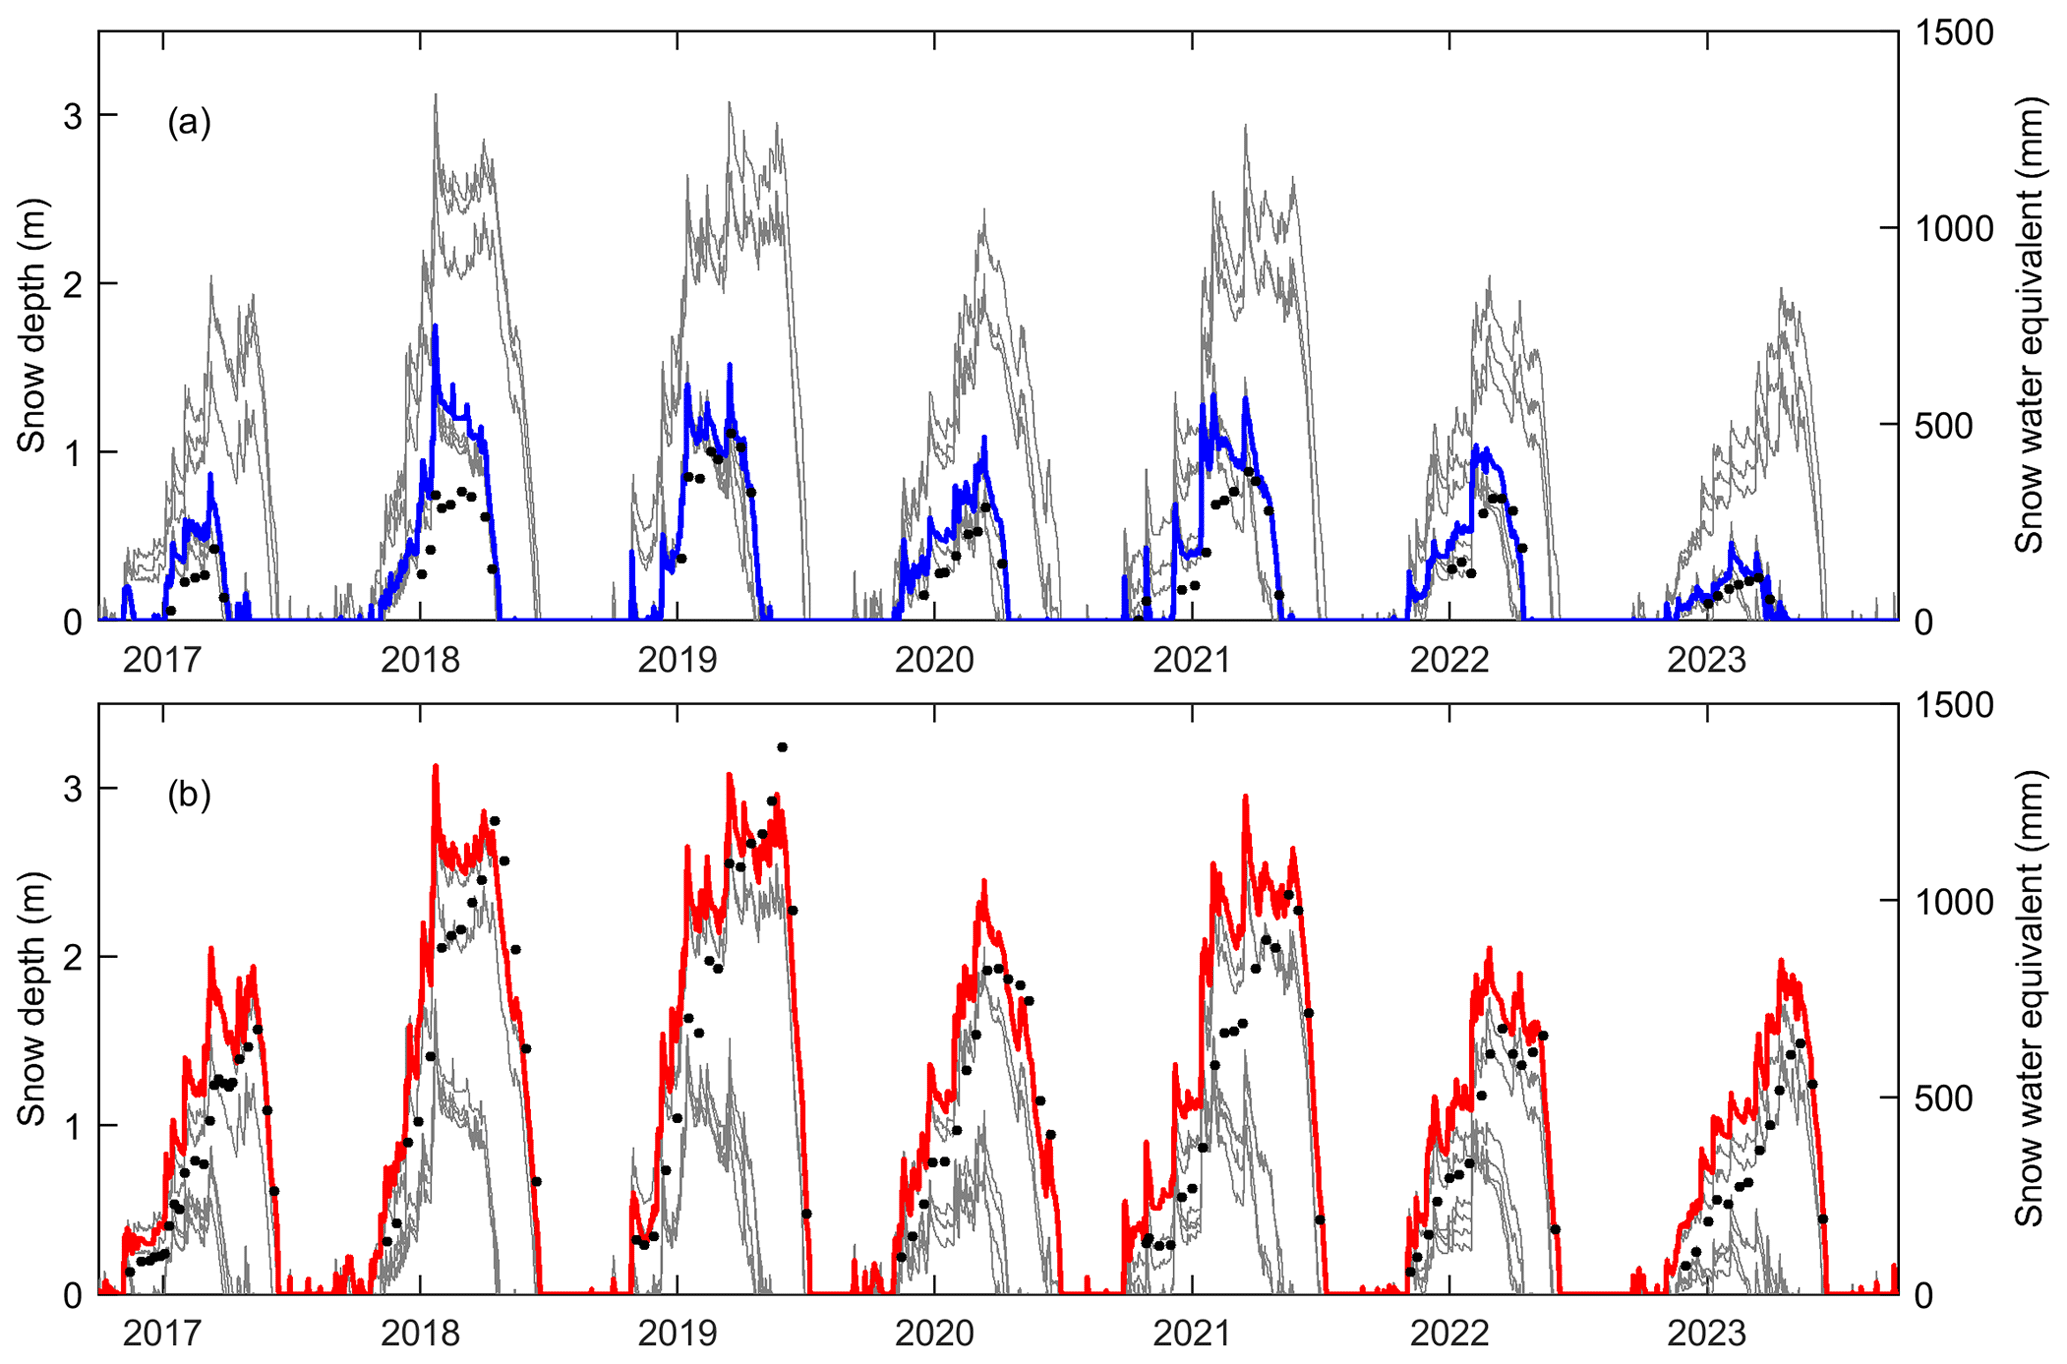
Figure 4Snow depth observations from the low-elevation location SLF.5DF (blue line in panel a) and the high-alpine site SLF.5WJ (red line in panel b) as well as biweekly SWE measurements (black dots in both panels). The grey lines represent snow depth recordings from the remaining stations within the study domain (see also Table 1 and Fig. 1).
Figure 4 shows HS and SWE recordings from the stations (see Fig. 1 for their locations). The seasonal snow at low-altitude stations, such as SLF.5DF, typically lasts for about 5 months, from November to March (see Fig. 4a). At higher-altitude locations, like the SLF.5WJ site, the snow cover usually extends for around 8 months, from November to June (see Fig. 4b). Peak snow depths at the low-altitude SLF.5DF site range between 0.46 and 1.75 m, while they range between 1.98 and 3.13 m at the high-altitude SLF.5WJ site. Overall, the high-altitude location shows 79 % to 330 % higher peak HS than the low-altitude site. For SWE, maximum values range between 110 and 477 mm at SLF.5DF, whereas they range between 636 and 1389 mm at SLF.5WJ. Consequently, the high-altitude site exhibits approximately 117 % to 478 % higher peak SWE values than the low-altitude location. Thus, the station recordings display a significant difference in snow thickness and mass between low and high altitudes, typical of the European Alps.
Runoff and temperature in the Dischma stream are measured at the Kriegsmatte station, operated by the Federal Office for the Environment (FOEN). This station, located at 1671 , has been recording discharge since 1963 and stream temperature since 2004. Figure 1 displays the location of this runoff gauging site, which has identifier 2327 according to FOEN terminology. In this dataset, we provide hourly averages of the recorded flows and temperatures in the Dischma stream for the complete study period. Below, we present various long-term statistics of the temperature and streamflow recordings, that were acquired from FOEN (see https://hydrodaten.admin.ch, last access: 27 May 2024).
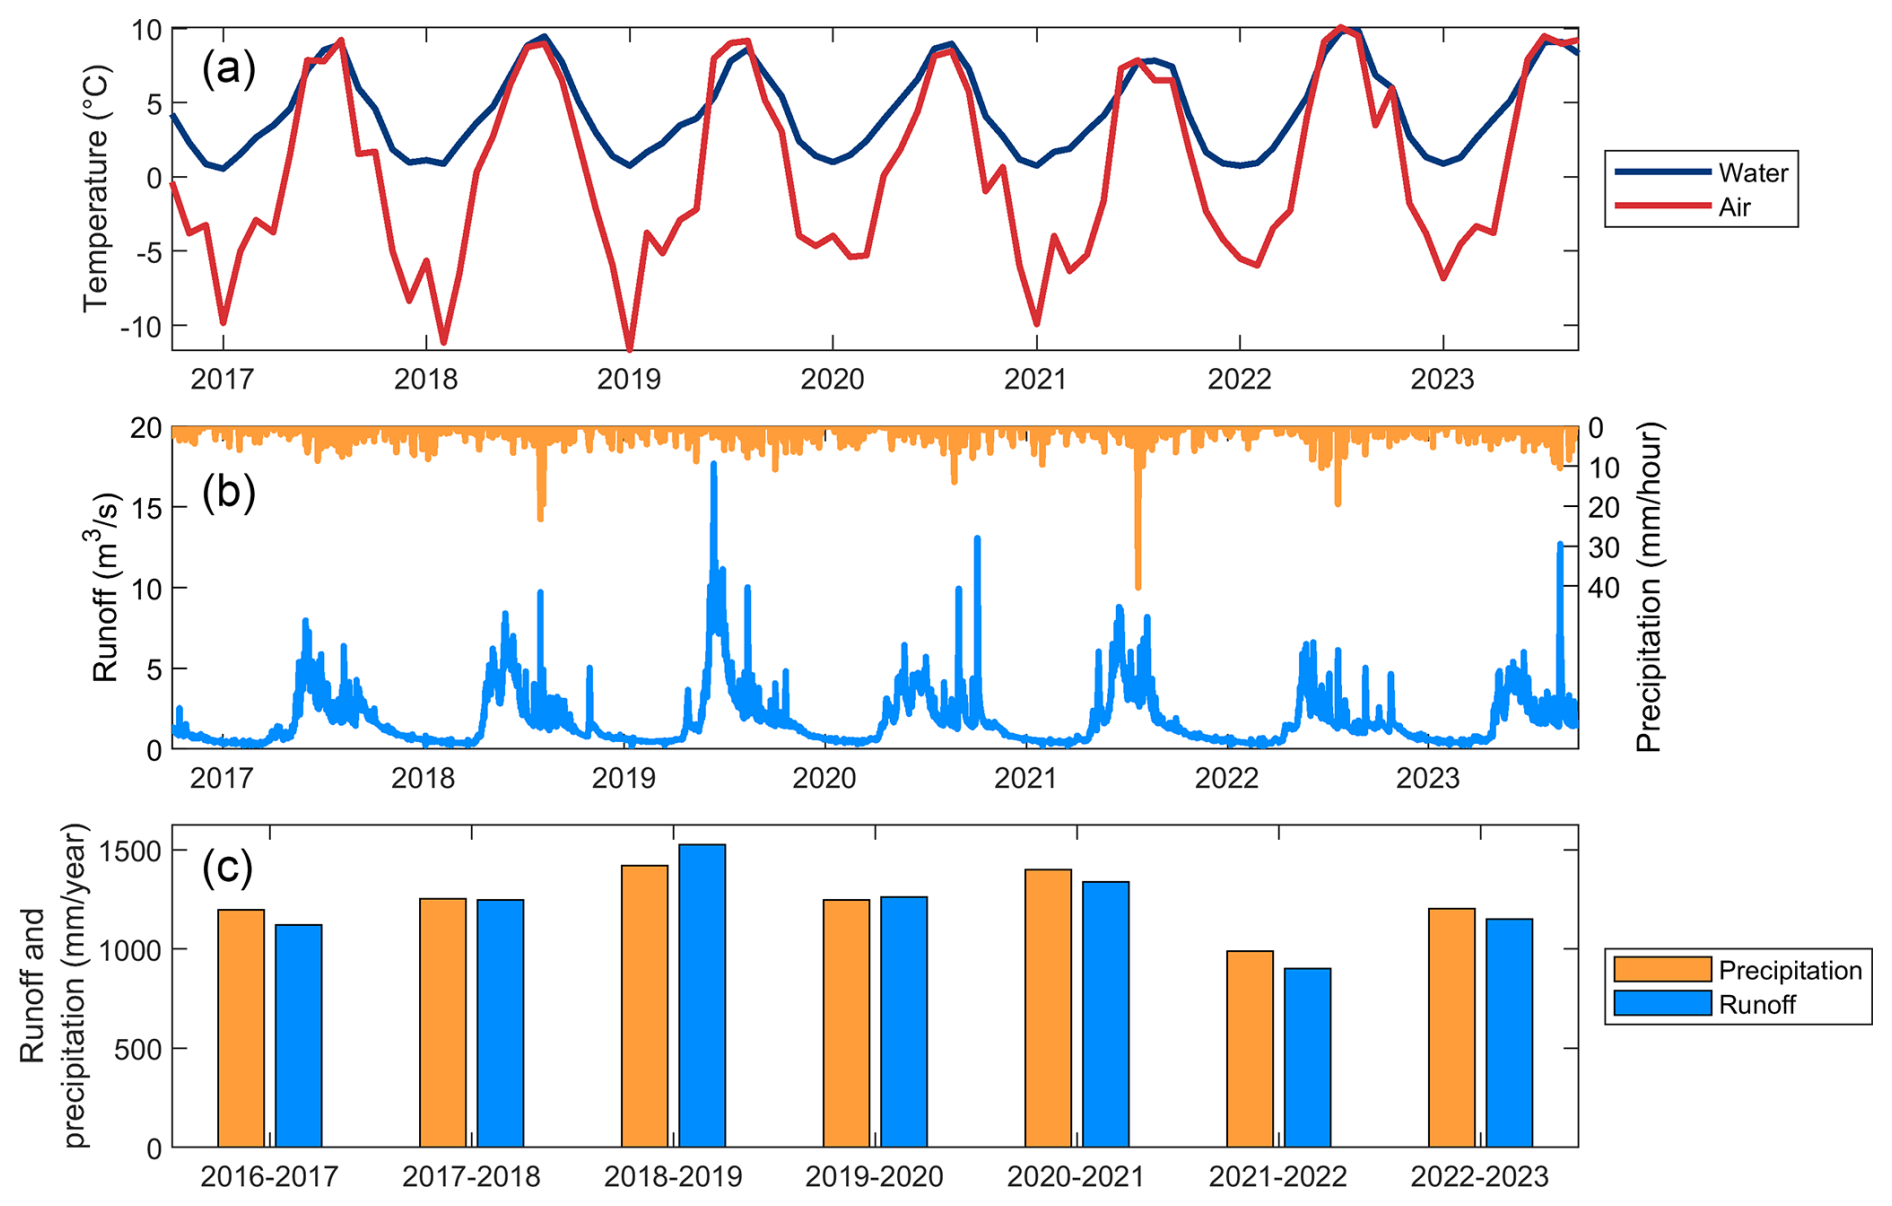
Figure 5(a) Average monthly water temperature measured at the Kriegsmatte station in Dischma and catchment-averaged monthly air temperature. (b) Measured hourly runoff and basin-averaged hourly precipitation. (c) Yearly sums, from 1 October to 31 September, of measured runoff and precipitation averaged over the catchment area.
Figure 5 shows various characteristic of the stream measurements in relation to the meteorological data included in this dataset (see Sect. 3). The variations in monthly average air temperatures for the Dischma catchment are larger than the variations in the stream temperatures (see Fig. 5a). The monthly mean water temperature varies between 0.5 and 9.9 °C, whereas the corresponding monthly mean air temperatures range from −11.7 to 10.1 °C. Over the complete study period, the average water temperature equals approximately 4.4 °C, which is very close to the long-term average of 4.3 °C.
The discharge in the Dischma stream is heavily influenced by snowmelt, resulting in high streamflows in May and June, whereas the winter period is marked by low flows (see Fig. 5b). The average discharge measured over the study period equals approximately 1.7 m3 s−1, matching the long-term average precisely. Runoff exceeding 11.4 m3 s−1 has a return period of 2 years, while runoff surpassing 19.5 m3 s−1 has a return period of 100 years. Low flows are characterized by a return period of 2 years for discharges below 0.31 m3 s−1, and a return period of 100 years for runoff below 0.12 m3 s−1. Due to a significant portion of precipitation falling as snow (see Fig. 2b), streamflow is largely disconnected from precipitation events and only occasionally reacts to rainfall episodes.
The variations in annual total runoff align well with the cumulative precipitation sums over the Dischma catchment (Fig. 5c). The runoff ratio, defined as streamflow divided by precipitation, ranges from 0.91 to 1.07 over the 7-year period. In 2 of those years, the runoff ratio exceeds 1, suggesting that either the rainfall and/or snowfall amounts are underestimated, even after applying our corrections outlined in Sect. 3.4. Annual evapotranspiration amounts to approximately 260 mm in Dischma according to model-derived estimates provided by Höge et al. (2023), suggesting that the runoff ratio should equal approximately 0.82. Thus, it is likely that our precipitation forcing data still underestimate actual precipitation over the complete study period, despite our corrected precipitation fields showing significant improvements compared with other commonly used precipitation products in Switzerland. For instance, RhiresD, also provided by MeteoSwiss, entails runoff ratios of approximately 1.25 for the Dischma catchment in the CAMELS-CH dataset (Höge et al., 2023) and, consequently, shows a much stronger underestimation of actual precipitation than our dataset. Nevertheless, for hydrological modelling applications, additional adjustments to the precipitation fields in this dataset may be necessary. Such corrections are commonly required to ensure reliable results when simulating catchment runoff (e.g. Pulka et al., 2024).
Along with the data presented above, we provide (1) a digital elevation model at 100 m resolution that was computed by upscaling the 25 m model from Federal Office of Topography (swisstopo) in Switzerland and (2) a polygon defining the area draining to the Kriegsmatte runoff station. All gridded data (e.g. land and forest cover, spatial snow depth maps, and meteorological forcing data) were aligned with this digital elevation model.
In addition to the data provided in this paper, various open-data sources may be relevant for different modelling applications, many of which are referred to in the CAMELS-CH dataset (Höge et al., 2023). For instance, land cover and land use information can be sourced from the Coordination of Information on the Environment (CORINE) dataset (Büttner et al., 2004), which was last updated in 2018. This dataset offers a land inventory in 44 thematic classes (e.g. natural grassland, bare rock, and the combined class of glaciers and perpetual snow) with a spatial resolution of 100 m or better. Additionally, the 3D soil hydraulic database of Europe, with a resolution of 250 m, provides data on variables such as saturated water content and saturated hydraulic conductivity at seven levels up to a soil depth of 2 m (Tóth et al., 2017). Data derived from the European Soil Database offer further insights into soil composition (Hiederer, 2013a, b). Geological information can be accessed through the high-resolution global lithology map, which categorizes rock types into a limited set of classes (Hartmann and Moosdorf, 2012). Finally, the Swiss Glacier Inventory contains detailed glacier data, including areas, outlines, and debris cover of all glaciers in Switzerland (Linsbauer et al., 2021). The above-mentioned open-data sources are among the most significant references within the CAMELS-CH dataset (Höge et al., 2023) and can potentially be useful in various modelling applications related to the data presented in this study.
The data presented in this paper are available at https://www.doi.org/10.16904/envidat.568, which is hosted by EnviDat (Magnusson et al., 2024). For all files, we use the Swiss coordinate system CH1903/LV03 (EPSG:21781), while all date information is given in central European time (UTC + 01:00). The meteorological forcing data are stored as self-explanatory NetCDF files formatted to produce correct visualizations in software packages such as Panoply (https://www.giss.nasa.gov/tools/panoply, NASA Goddard Institute for Space Studies, 2024; tested with Panoply Version 5.3.4 on Windows 11), and the files adhere to standard NetCDF conventions (see the global attributes of the respective files). Each NetCDF file contains a set of 3D arrays containing 1 d of hourly meteorological data for each meteorological variable (see Sect. 3). The time-varying direct-beam transmissivity data (see Sect. 4.2) are stored in a single NetCDF file. The station measurements (e.g. runoff and snow water equivalent) are stored in comma-separated text files with headers containing all necessary metadata (e.g. station coordinates). All raster files (e.g. spatial snow depth maps and forest cover data) are stored in GeoTIFF format. To facilitate data transfer and download processes, all files in the dataset have been compressed into a single ZIP file (format Zip64).
Several complementary datasets have been published on EnviDat (https://www.envidat.ch/, last access: 1 December 2024) that may be relevant for evaluating modelling experiments performed with the data published in this paper. Examples of particular interest include forest canopy structure data for radiation and snow modelling (https://doi.org/10.16904/envidat.220, Mazzotti et al., 2020a); snow and canopy data for high-resolution forest snow modelling (https://doi.org/10.16904/envidat.125, Mazzotti et al., 2019a); and input datasets for forest snow modelling in Flüela Valley, northeast of Dischma (https://doi.org/10.16904/envidat.338, Mazzotti and Jonas, 2022). The Flüela Valley is within the domain of the datasets presented in this paper. Additionally, drone-based snow depth maps, 10 in total, with a spatial resolution of 0.1 m and an accuracy of approximately 0.1 m are available for a 4 km2 subset of the Dischma catchment in the area of the Schürlialp located in the southern part of the basin (for data, see https://doi.org/10.16904/envidat.373; Bühler et al., 2022). These datasets have an extremely high level of detail and were applied as reference data for the accuracy assessment of the photogrammetric datasets (Bühler et al., 2017; Eberhard et al., 2021). Additionally, data from the well-known Stillberg ecological treeline research site established 1975 in Dischma are also freely available (Lechler et al., 2024, https://www.envidat.ch/#/projects/treeline-research-stillberg-switzerland, last access: 1 December 2024). Finally, a large range of datasets from the Dischma Valley and surrounding areas, such as biweekly snow profiles from Weissfluhjoch and glide-snow avalanche activity at Dorfberg north of Dischma, can be obtained from EnviDat.
We provide 7 water years of high-resolution (100 m) spatially distributed hourly meteorological data for the Dischma catchment and surrounding areas in eastern Switzerland that will be useful as input to various models. These model forcing data include air temperature, relative humidity, wind speed and direction, short- and longwave radiation, and precipitation, alongside land and forest cover information. The meteorological data were obtained from a numerical weather prediction model and precipitation radar product. The model forcing data, used by Quéno et al. (2024) for detailed snow simulations including snow redistribution processes, have been formatted for ease of use to facilitate different modelling experiments. We additionally provide forest structure data, based on a detailed canopy height model, enabling modelling of snow–forest interactions in heterogeneous landscapes, thus ensuring that the impact of forest cover is accurately captured in snow and hydrological applications.
In addition to the model input data, we have assembled validation datasets, including the following: (a) snow depth measurements from airborne lidar and photogrammetry surveys, quality-controlled and upscaled to a 100 m grid; (b) daily controlled and gap-filled snow depth recordings as well as biweekly snow water equivalent observations, both from ground locations; and (c) hourly runoff and stream temperature measurements at the basin outlet of the Dischma catchment. The lidar and photogrammetric surveys provide the most extensive spatial snow depth dataset in the European Alps, with comparable quality to the Airborne Snow Observatory in the USA (Painter et al., 2016) but covering a smaller area.
Overall, the dataset is valuable for enhancing physics-based snow, land surface, and hydrological models with applications in high-alpine catchments. This dataset is particularly useful for modelling snow redistribution through wind and avalanches, snow–forest interactions, and developing snow data assimilation schemes based on forcing data typically available in an operational setting. We anticipate that this dataset will lower the barriers for the snow and hydrological modelling communities to conduct simulation experiments in the Dischma region, a typical headwater catchment in the European Alps with a long history of diverse research studies.
JM and TJ initiated and coordinated the study and processed the meteorological data. YB, LQ, and BC compiled and processed the spatial snow depth data, while GM and CW handled the forest cover data. RM was responsible for processing the land cover data. JM also compiled the remaining datasets, such as runoff observations, wrote the manuscript, and created all of the figures. All authors contributed to the analysis and supported the writing of the manuscript.
The contact author has declared that none of the authors has any competing interests.
Publisher's note: Copernicus Publications remains neutral with regard to jurisdictional claims made in the text, published maps, institutional affiliations, or any other geographical representation in this paper. While Copernicus Publications makes every effort to include appropriate place names, the final responsibility lies with the authors.
The authors would like to thank the editor and the two reviewers for their efforts in improving this work. MeteoSwiss and the Swiss Federal Office for the Environment (FOEN) are acknowledged for the provision of the respective meteorological and hydrological data.
The development of methods for downscaling meteorological data and generating forest datasets was primarily funded by FOEN. The Swiss National Science Foundation provided support for Giulia Mazzotti's contributions (grant no. P5R5PN_225378) as well as for airborne snow depth measurements (grant no. 200021_207519).
This paper was edited by James Thornton and reviewed by Francesco Avanzi and one anonymous referee.
Avanzi, F., Munerol, F., Milelli, M., Gabellani, S., Massari, C., Girotto, M., Cremonese, E., Galvagno, M., Bruno, G., di Cella, U. M., Rossi, L., Altamura, M., and Ferraris, L.: Winter snow deficit was a harbinger of summer 2022 socio-hydrologic drought in the Po Basin, Italy, Commun. Earth Environ., 5, 64, https://doi.org/10.1038/s43247-024-01222-z, 2024.
Baggi, S. and Schweizer, J.: Characteristics of wet-snow avalanche activity: 20 years of observations from a high alpine valley (Dischma, Switzerland), Nat. Hazards, 50, 97–108, https://doi.org/10.1007/s11069-008-9322-7, 2009.
Barton, Y., Sideris, I. V., Raupach, T. H., Gabella, M., Germann, U., and Martius, O.: A multi-year assessment of sub-hourly gridded precipitation for Switzerland based on a blended radar—Rain-gauge dataset, Int. J. Climatol., 40, 5208–5222, https://doi.org/10.1002/joc.6514, 2020.
Bavay, M., Lehning, M., Jonas, T., and Löwe, H.: Simulations of future snow cover and discharge in Alpine headwater catchments, Hydrol. Process., 23, 95–108, https://doi.org/10.1002/hyp.7195, 2009.
Bavay, M., Grünewald, T., and Lehning, M.: Response of snow cover and runoff to climate change in high Alpine catchments of Eastern Switzerland, Adv. Water Resour., 55, 4–16, https://doi.org/10.1016/j.advwatres.2012.12.009, 2013.
Berg, J., Reynolds, D., Quéno, L., Jonas, T., Lehning, M., and Mott, R.: A seasonal snowpack model forced with dynamically downscaled forcing data resolves hydrologically relevant accumulation patterns, Front. Earth Sci.-Switzerland, 12, https://doi.org/10.3389/feart.2024.1393260, 2024.
Brauchli, T., Trujillo, E., Huwald, H., and Lehning, M.: Influence of Slope-Scale Snowmelt on Catchment Response Simulated With the Alpine3D Model, Water Resour. Res., 53, 10723–10739, https://doi.org/10.1002/2017wr021278, 2017.
Bühler, Y., Marty, M., Egli, L., Veitinger, J., Jonas, T., Thee, P., and Ginzler, C.: Snow depth mapping in high-alpine catchments using digital photogrammetry, The Cryosphere, 9, 229–243, https://doi.org/10.5194/tc-9-229-2015, 2015.
Bühler, Y., Adams, M. S., Bösch, R., and Stoffel, A.: Mapping snow depth in alpine terrain with unmanned aerial systems (UASs): potential and limitations, The Cryosphere, 10, 1075–1088, https://doi.org/10.5194/tc-10-1075-2016, 2016.
Bühler, Y., Adams, M. S., Stoffel, A., and Boesch, R.: Photogrammetric reconstruction of homogenous snow surfaces in alpine terrain applying near-infrared UAS imagery, Int. J. Remote Sens., 38, 3135–3158, https://doi.org/10.1080/01431161.2016.1275060, 2017.
Bühler, Y., Stoffel, A., and Salzmann, C. M.: Photogrammetric Drone Data Schürlialp, EnviDat [dataset], https://doi.org/10.16904/envidat.373, 2022.
Bührle, L. J., Ruttner-Jansen, P., Marty, M., and Bühler, Y.: Snow depth mapping by airplane photogrammetry (2017–ongoing), EnviDat [dataset], https://doi.org/10.16904/envidat.418, 2022.
Bührle, L. J., Marty, M., Eberhard, L. A., Stoffel, A., Hafner, E. D., and Bühler, Y.: Spatially continuous snow depth mapping by aeroplane photogrammetry for annual peak of winter from 2017 to 2021 in open areas, The Cryosphere, 17, 3383–3408, https://doi.org/10.5194/tc-17-3383-2023, 2023.
Büttner, G., Feranec, J., Jaffrain, G., Mari, L., Maucha, G., and Soukup, T.: The CORINE land cover 2000 project, EARSeL eProceedings, 3, 331–346, 2004.
Carletti, F., Michel, A., Casale, F., Burri, A., Bocchiola, D., Bavay, M., and Lehning, M.: A comparison of hydrological models with different level of complexity in Alpine regions in the context of climate change, Hydrol. Earth Syst. Sci., 26, 3447–3475, https://doi.org/10.5194/hess-26-3447-2022, 2022.
Che, T., Li, X., Liu, S., Li, H., Xu, Z., Tan, J., Zhang, Y., Ren, Z., Xiao, L., Deng, J., Jin, R., Ma, M., Wang, J., and Yang, X.: Integrated hydrometeorological, snow and frozen-ground observations in the alpine region of the Heihe River Basin, China, Earth Syst. Sci. Data, 11, 1483–1499, https://doi.org/10.5194/essd-11-1483-2019, 2019.
Comola, F., Schaefli, B., Rinaldo, A., and Lehning, M.: Thermodynamics in the hydrologic response: Travel time formulation and application to Alpine catchments, Water Resour. Res., 51, 1671–1687, https://doi.org/10.1002/2014wr016228, 2015.
Daudt, R. C., Wulf, H., Hafner, E. D., Bühler, Y., Schindler, K., and Wegner, J. D.: Snow depth estimation at country-scale with high spatial and temporal resolution, ISPRS J. Photogramm., 197, 105–121, https://doi.org/10.1016/j.isprsjprs.2023.01.017, 2023.
Eberhard, L. A., Sirguey, P., Miller, A., Marty, M., Schindler, K., Stoffel, A., and Bühler, Y.: Intercomparison of photogrammetric platforms for spatially continuous snow depth mapping, The Cryosphere, 15, 69–94, https://doi.org/10.5194/tc-15-69-2021, 2021.
Essery, R., Pomeroy, J., Ellis, C., and Link, T.: Modelling longwave radiation to snow beneath forest canopies using hemispherical photography or linear regression, Hydrol. Process., 22, 2788–2800, https://doi.org/10.1002/hyp.6930, 2008.
Fang, X., Pomeroy, J. W., DeBeer, C. M., Harder, P., and Siemens, E.: Hydrometeorological data from Marmot Creek Research Basin, Canadian Rockies, Earth Syst. Sci. Data, 11, 455–471, https://doi.org/10.5194/essd-11-455-2019, 2019.
Forthofer, J. M., Butler, B. W., and Wagenbrenner, N. S.: A comparison of three approaches for simulating fine-scale surface winds in support of wildland fire management. Part I. Model formulation and comparison against measurements, Int. J. Wildland Fire, 23, 969–981, https://doi.org/10.1071/Wf12089, 2014.
Gerber, F., Besic, N., Sharma, V., Mott, R., Daniels, M., Gabella, M., Berne, A., Germann, U., and Lehning, M.: Spatial variability in snow precipitation and accumulation in COSMO–WRF simulations and radar estimations over complex terrain, The Cryosphere, 12, 3137–3160, https://doi.org/10.5194/tc-12-3137-2018, 2018.
Gurtz, J., Zappa, M., Jasper, K., Lang, H., Verbunt, M., Badoux, A., and Vitvar, T.: A comparative study in modelling runoff and its components in two mountainous catchments, Hydrol. Process., 17, 297–311, https://doi.org/10.1002/hyp.1125, 2003.
Hartmann, J. and Moosdorf, N.: The new global lithological map database GLiM: A representation of rock properties at the Earth surface, Geochem. Geophy. Geosy., 13, Q12004, https://doi.org/10.1029/2012gc004370, 2012.
Haugeneder, M., Lehning, M., Stiperski, I., Reynolds, D., and Mott, R.: Turbulence in the Strongly Heterogeneous Near-Surface Boundary Layer over Patchy Snow, Bound.-Lay. Meteorol., 190, 7, https://doi.org/10.1007/s10546-023-00856-4, 2024.
Helbig, N., Bühler, Y., Eberhard, L., Deschamps-Berger, C., Gascoin, S., Dumont, M., Revuelto, J., Deems, J. S., and Jonas, T.: Fractional snow-covered area: scale-independent peak of winter parameterization, The Cryosphere, 15, 615–632, https://doi.org/10.5194/tc-15-615-2021, 2021.
Hiederer, R.: Mapping soil typologies – spatial decision support applied to European Soil Database, EUR 25932, JRC80664, Publications Office of the European Union, Luxembourg, 147, https://doi.org/10.2788/87286, 2013a.
Hiederer, R.: Mapping soil properties for Europe-spatial representation of soil database attributes, Publications Office of the European Union, Luxembourg, 47, https://doi.org/10.2788/94128, 2013b.
Höge, M., Kauzlaric, M., Siber, R., Schönenberger, U., Horton, P., Schwanbeck, J., Floriancic, M. G., Viviroli, D., Wilhelm, S., Sikorska-Senoner, A. E., Addor, N., Brunner, M., Pool, S., Zappa, M., and Fenicia, F.: CAMELS-CH: hydro-meteorological time series and landscape attributes for 331 catchments in hydrologic Switzerland, Earth Syst. Sci. Data, 15, 5755–5784, https://doi.org/10.5194/essd-15-5755-2023, 2023.
John, A., Cannistra, A. F., Yang, K., Tan, A., Shean, D., Hille Ris Lambers, J., and Cristea, N.: High-Resolution Snow-Covered Area Mapping in Forested Mountain Ecosystems Using PlanetScope Imagery, Remote Sens.-Basel, 14, 3409, https://doi.org/10.3390/rs14143409, 2022.
Jonas, T., Webster, C., Mazzotti, G., and Malle, J.: HPEval: A canopy shortwave radiation transmission model using high-resolution hemispherical images, Agr. Forest Meteorol., 284, 107903, https://doi.org/10.1016/j.agrformet.2020.107903, 2020.
Klasa, C., Arpagaus, M., Walser, A., and Wernli, H.: An evaluation of the convection-permitting ensemble COSMO-E for three contrasting precipitation events in Switzerland, Q. J. Roy. Meteor. Soc., 144, 744–764, https://doi.org/10.1002/qj.3245, 2018.
Kustas, W. P., Rango, A., and Uijlenhoet, R.: A Simple Energy Budget Algorithm for the Snowmelt Runoff Model, Water Resour. Res., 30, 1515–1527, https://doi.org/10.1029/94wr00152, 1994.
Lechler, L., Rixen, C., Bebi, P., Bavay, M., Marty, M., Barbeito, I., Dawes, M. A., Hagedorn, F., Krumm, F., Mohl, P., Schaub, M., and Frei, E. R.: Five decades of ecological and meteorological data enhance the mechanistic understanding of global change impacts on the treeline ecotone in the European Alps, Agr. Forest Meteorol., 355, https://doi.org/10.1016/j.agrformet.2024.110126, 2024.
Lehning, M., Völksch, I., Gustafsson, D., Nguyen, T. A., Stähli, M., and Zappa, M.: ALPINE3D: a detailed model of mountain surface processes and its application to snow hydrology, Hydrol. Process., 20, 2111–2128, https://doi.org/10.1002/hyp.6204, 2006.
Linsbauer, A., Huss, M., Hodel, E., Bauder, A., Fischer, M., Weidmann, Y., Bärtschi, H., and Schmassmann, E.: The New Swiss Glacier Inventory SGI2016: From a Topographical to a Glaciological Dataset, Front. Earth Sci.-Switzerland, 9, https://doi.org/10.3389/feart.2021.704189, 2021.
López-Moreno, J. I., Leppänen, L., Luks, B., Holko, L., Picard, G., Sanmiguel-Vallelado, A., Alonso-González, E., Finger, D. C., Arslan, A. N., Gillemot, K., Sensoy, A., Sorman, A., Ertas, M. C., Fassnacht, S. R., Fierz, C., and Marty, C.: Intercomparison of measurements of bulk snow density and water equivalent of snow cover with snow core samplers: Instrumental bias and variability induced by observers, Hydrol. Process., 34, 3120–3133, https://doi.org/10.1002/hyp.13785, 2020.
Lussana, C., Saloranta, T., Skaugen, T., Magnusson, J., Tveito, O. E., and Andersen, J.: seNorge2 daily precipitation, an observational gridded dataset over Norway from 1957 to the present day, Earth Syst. Sci. Data, 10, 235–249, https://doi.org/10.5194/essd-10-235-2018, 2018.
Magnusson, J., Gustafsson, D., Hüsler, F., and Jonas, T.: Assimilation of point SWE data into a distributed snow cover model comparing two contrasting methods, Water Resour. Res., 50, 7816–7835, https://doi.org/10.1002/2014wr015302, 2014.
Magnusson, J., Winstral, A., Stordal, A. S., Essery, R., and Jonas, T.: Improving physically based snow simulations by assimilating snow depths using the particle filter, Water Resour. Res., 53, 1125–1143, https://doi.org/10.1002/2016wr019092, 2017.
Magnusson, J., Jonas, T., Bühler, Y., Webster, C., and Mazzotti, G.: A high-resolution snow and hydrometeorological dataset for the Dischma region in Switzerland, EnviDat [data set], https://doi.org/10.16904/envidat.568, 2024.
Magnusson, J., Cluzet, B., Quéno, L., Mott, R., Oberrauch, M., Mazzotti, G., Marty, C., and Jonas, T.: Evaluating methods to estimate the water equivalent of new snow from daily snow depth recordings, Cold Reg. Sci. Technol., 233, 104435, https://doi.org/10.1016/j.coldregions.2025.104435, 2025.
Marti, R., Gascoin, S., Berthier, E., de Pinel, M., Houet, T., and Laffly, D.: Mapping snow depth in open alpine terrain from stereo satellite imagery, The Cryosphere, 10, 1361–1380, https://doi.org/10.5194/tc-10-1361-2016, 2016.
Martinec, J.: SNOWMELT – RUNOFF MODEL FOR STREAM FLOW FORECASTS, Hydrol. Res., 6, 145–154, https://doi.org/10.2166/nh.1975.0010, 1975.
Martinec, J.: Runoff Modeling from Snow Covered Area, IEEE T. Geosci. Remote, 20, 259–262, https://doi.org/10.1109/Tgrs.1982.350440, 1982.
Martinec, J.: Hydrological consequences of snow avalanches, in: Hydrology of Disasters, edited by: Starosolszky, Ö. and Melder, O. M., Routledge, Milton Park, Abingdon, UK, 284–293, ISBN 978-1-873936-04-7, https://doi.org/10.4324/9781315073583, 2014.
Martinec, J. and Rango, A.: Interpretation and utilization of areal snow-cover data from satellites, Ann. Glaciol., 9, 166–169, 1987.
Martinec, J., Oeschger, H., Schotterer, U., and Siegenthaler, U.: Snowmelt and Groundwater Storage in Alpine Basin, Hydrolog. Sci. J., 27, 261–261, 1982.
Mazzotti, G. and Jonas, T.: Input datasets for forest snow modelling in Fluela valley, WY 2016-21, EnviDat [dataset], https://doi.org/10.16904/envidat.338, 2022.
Mazzotti, G., Moeser, D., and Jonas, T.: Snow depth, canopy structure and meterorological datasets from the Davos area, Switzerland, Winters 2012/13-2014/15, used for high-resolution forest snow modelling, EnviDat [dataset], https://doi.org/10.16904/envidat.125, 2019a.
Mazzotti, G., Currier, W. R., Deems, J. S., Pflug, J. M., Lundquist, J. D., and Jonas, T.: Revisiting Snow Cover Variability and Canopy Structure Within Forest Stands: Insights From Airborne Lidar Data, Water Resour. Res., 55, 6198–6216, https://doi.org/10.1029/2019wr024898, 2019b.
Mazzotti, G., Webster, C., and Jonas, T.: Forest canopy structure data for radiation and snow modelling (CH/FIN), EnviDat [dataset], https://doi.org/10.16904/envidat.220, 2020a.
Mazzotti, G., Essery, R., Moeser, C. D., and Jonas, T.: Resolving Small-Scale Forest Snow Patterns Using an Energy Balance Snow Model With a One-Layer Canopy, Water Resour. Res., 56, e2019WR026129, https://doi.org/10.1029/2019WR026129, 2020b.
Mazzotti, G., Webster, C., Essery, R., and Jonas, T.: Increasing the Physical Representation of Forest-Snow Processes in Coarse-Resolution Models: Lessons Learned From Upscaling Hyper-Resolution Simulations, Water Resour. Res., 57, e2020WR029064, https://doi.org/10.1029/2020WR029064, 2021.
Mazzotti, G., Webster, C., Quéno, L., Cluzet, B., and Jonas, T.: Canopy structure, topography, and weather are equally important drivers of small-scale snow cover dynamics in sub-alpine forests, Hydrol. Earth Syst. Sci., 27, 2099–2121, https://doi.org/10.5194/hess-27-2099-2023, 2023.
Meyer, J., Deems, J. S., Bormann, K. J., Shean, D. E., and Skiles, S. M.: Mapping snow depth and volume at the alpine watershed scale from aerial imagery using Structure from Motion, Front. Earth Sci.-Switzerland, 10, https://doi.org/10.3389/feart.2022.989792, 2022.
Moeser, D., Morsdorf, F., and Jonas, T.: Novel forest structure metrics from airborne LiDAR data for improved snow interception estimation, Agr. Forest Meteorol., 208, 40–49, https://doi.org/10.1016/j.agrformet.2015.04.013, 2015.
Mott, R., Schlögl, S., Dirks, L., and Lehning, M.: Impact of Extreme Land Surface Heterogeneity on Micrometeorology over Spring Snow Cover, J. Hydrometeorol., 18, 2705–2722, https://doi.org/10.1175/Jhm-D-17-0074.1, 2017.
Mott, R., Winstral, A., Cluzet, B., Helbig, N., Magnusson, J., Mazzotti, G., Quéno, L., Schirmer, M., Webster, C., and Jonas, T.: Operational snow-hydrological modeling for Switzerland, Front. Earth Sci.-Switzerland, 11, https://doi.org/10.3389/feart.2023.1228158, 2023.
Murray, F. W.: On the computation of saturation vapor pressure, J. Appl. Meteorol., 6, 203–204, https://doi.org/10.1175/1520-0450(1967)006<0203:OTCOSV>2.0.CO;2, 1967.
NASA Goddard Institute for Space Studies: Panoply netCDF, HDF and GRIB Data Viewer, https://www.giss.nasa.gov/tools/panoply/credits.html, last access: 20 June 2024.
Ortner, G., Bründl, M., Kropf, C. M., Röösli, T., Bühler, Y., and Bresch, D. N.: Large-scale risk assessment on snow avalanche hazard in alpine regions, Nat. Hazards Earth Syst. Sci., 23, 2089–2110, https://doi.org/10.5194/nhess-23-2089-2023, 2023.
Painter, T. H., Berisford, D. F., Boardman, J. W., Bormann, K. J., Deems, J. S., Gehrke, F., Hedrick, A., Joyce, M., Laidlaw, R., Marks, D., Mattmann, C., McGurk, B., Ramirez, P., Richardson, M., Skiles, S. M., Seidel, F. C., and Winstral, A.: The Airborne Snow Observatory: Fusion of scanning lidar, imaging spectrometer, and physically-based modeling for mapping snow water equivalent and snow albedo, Remote Sens. Environ., 184, 139–152, https://doi.org/10.1016/j.rse.2016.06.018, 2016.
Polo, M. J., Herrero, J., Pimentel, R., and Pérez-Palazón, M. J.: The Guadalfeo Monitoring Network (Sierra Nevada, Spain): 14 years of measurements to understand the complexity of snow dynamics in semiarid regions, Earth Syst. Sci. Data, 11, 393–407, https://doi.org/10.5194/essd-11-393-2019, 2019.
Pomeroy, J., Bernhardt, M., and Marks, D.: Research network to track alpine water, Nature, 521, 32–32, https://doi.org/10.1038/521032c, 2015.
Pulka, T., Herrnegger, M., Ehrendorfer, C., Lücking, S., Avanzi, F., Formayer, H., Schulz, K., and Koch, F.: Evaluating precipitation corrections to enhance high-alpine hydrological modeling, J. Hydrol., 645, 132202, https://doi.org/10.1016/j.jhydrol.2024.132202, 2024.
Quéno, L., Mott, R., Morin, P., Cluzet, B., Mazzotti, G., and Jonas, T.: Snow redistribution in an intermediate-complexity snow hydrology modelling framework, The Cryosphere, 18, 3533–3557, https://doi.org/10.5194/tc-18-3533-2024, 2024.
Rango, A. and Martinec, J.: Accuracy of Snowmelt Runoff Simulation, Nord. Hydrol., 12, 265–274, 1981.
Resch, G., Koch, R., Marty, C., Chimani, B., Begert, M., Buchmann, M., Aschauer, J., and Schöner, W.: A quantile-based approach to improve homogenization of snow depth time series, Int. J. Climatol., 43, 157–173, https://doi.org/10.1002/joc.7742, 2023.
Reynolds, D., Quéno, L., Lehning, M., Jafari, M., Berg, J., Jonas, T., Haugeneder, M., and Mott, R.: Seasonal Snow-Atmosphere Modeling: Let's do it, EGUsphere [preprint], https://doi.org/10.5194/egusphere-2024-489, 2024.
Richter, B., Schweizer, J., Rotach, M. W., and van Herwijnen, A.: Modeling spatially distributed snow instability at a regional scale using Alpine3D, J. Glaciol., 67, 1147–1162, https://doi.org/10.1017/jog.2021.61, 2021.
Rixen, C., Hoye, T. T., Macek, P., Aerts, R., Alatalo, J. M., Anderson, J. T., Arnold, P. A., Barrio, I. C., Bjerke, J. W., Björkman, M. P., Blok, D., Blume-Werry, G., Boike, J., Bokhorst, S., Carbognani, M., Christiansen, C. T., Convey, P., Cooper, E. J., Cornelissen, J. H. C., Coulson, S. J., Dorrepaal, E., Elberling, B., Elmendorf, S. C., Elphinstone, C., Forte, T. G. W., Frei, E. R., Geange, S. R., Gehrmann, F., Gibson, C., Grogan, P., Halbritter, A. H., Harte, J., Henry, G. H. R., Inouye, D. W., Irwin, R. E., Jespersen, G., Jónsdóttir, I. S., Jung, J. Y., Klinges, D. H., Kudo, G., Lämsä, J., Lee, H., Lembrechts, J. J., Lett, S., Lynn, J. S., Mann, H. M. R., Mastepanov, M., Morse, J., Myers-Smith, I. H., Olofsson, J., Paavola, R., Petraglia, A., Phoenix, G. K., Semenchuk, P., Siewert, M. B., Slatyer, R., Spasojevic, M. J., Suding, K., Sullivan, P., Thompson, K. L., Väisänen, M., Vandvik, V., Venn, S., Walz, J., Way, R., Welker, J. M., Wipf, S., and Zong, S. W.: Winters are changing: snow effects on Arctic and alpine tundra ecosystems, Arct. Sci., 8, 572–608, https://doi.org/10.1139/as-2020-0058, 2022.
Roche, J. W., Rice, R., Meng, X., Cayan, D. R., Dettinger, M. D., Alden, D., Patel, S. C., Mason, M. A., Conklin, M. H., and Bales, R. C.: Climate, snow, and soil moisture data set for the Tuolumne and Merced river watersheds, California, USA, Earth Syst. Sci. Data, 11, 101–110, https://doi.org/10.5194/essd-11-101-2019, 2019.
Rössler, O., Froidevaux, P., Börst, U., Rickli, R., Martius, O., and Weingartner, R.: Retrospective analysis of a nonforecasted rain-on-snow flood in the Alps – a matter of model limitations or unpredictable nature?, Hydrol. Earth Syst. Sci., 18, 2265–2285, https://doi.org/10.5194/hess-18-2265-2014, 2014.
Ryan, W. A., Doesken, N. J., and Fassnacht, S. R.: Evaluation of ultrasonic snow depth sensors for U. S. snow measurements, J. Atmos. Ocean. Tech., 25, 667–684, https://doi.org/10.1175/2007jtecha947.1, 2008.
Sideris, I. V., Gabella, M., Erdin, R., and Germann, U.: Real-time radar–rain-gauge merging using spatio-temporal co-kriging with external drift in the alpine terrain of Switzerland, Q. J. Roy. Meteor. Soc., 140, 1097–1111, https://doi.org/10.1002/qj.2188, 2014.
Strasser, U., Marke, T., Braun, L., Escher-Vetter, H., Juen, I., Kuhn, M., Maussion, F., Mayer, C., Nicholson, L., Niedertscheider, K., Sailer, R., Stötter, J., Weber, M., and Kaser, G.: The Rofental: a high Alpine research basin (1890–3770 ) in the Ötztal Alps (Austria) with over 150 years of hydrometeorological and glaciological observations, Earth Syst. Sci. Data, 10, 151–171, https://doi.org/10.5194/essd-10-151-2018, 2018.
Thackeray, C. W., Derksen, C., Fletcher, C. G., and Hall, A.: Snow and Climate: Feedbacks, Drivers, and Indices of Change, Current Climate Change Reports, 5, 322–333, https://doi.org/10.1007/s40641-019-00143-w, 2019.
Tóth, B., Weynants, M., Pásztor, L., and Hengl, T.: 3D soil hydraulic database of Europe at 250 m resolution, Hydrol. Process., 31, 2662–2666, https://doi.org/10.1002/hyp.11203, 2017.
Töglhofer, C., Eigner, F., and Prettenthaler, F.: Impacts of snow conditions on tourism demand in Austrian ski areas, Clim. Res., 46, 1–14, https://doi.org/10.3354/cr00939, 2011.
Vander Jagt, B., Lucieer, A., Wallace, L., Turner, D., and Durand, M.: Snow Depth Retrieval with UAS Using Photogrammetric Techniques, Geosciences, 5, 264–285, 2015.
Vionnet, V., Dombrowski-Etchevers, I., Lafaysse, M., Quéno, L., Seity, Y., and Bazile, E.: Numerical Weather Forecasts at Kilometer Scale in the French Alps: Evaluation and Application for Snowpack Modeling, J. Hydrometeorol., 17, 2591–2614, https://doi.org/10.1175/JHM-D-15-0241.1, 2016.
Vionnet, V., Marsh, C. B., Menounos, B., Gascoin, S., Wayand, N. E., Shea, J., Mukherjee, K., and Pomeroy, J. W.: Multi-scale snowdrift-permitting modelling of mountain snowpack, The Cryosphere, 15, 743–769, https://doi.org/10.5194/tc-15-743-2021, 2021.
Wagenbrenner, N. S., Forthofer, J. M., Lamb, B. K., Shannon, K. S., and Butler, B. W.: Downscaling surface wind predictions from numerical weather prediction models in complex terrain with WindNinja, Atmos. Chem. Phys., 16, 5229–5241, https://doi.org/10.5194/acp-16-5229-2016, 2016.
Wagenbrenner, N. S., Forthofer, J. M., Page, W. G., and Butler, B. W.: Development and Evaluation of a Reynolds-Averaged Navier-Stokes Solver in WindNinja for Operational Wildland Fire Applications, Atmosphere-Basel, 10, https://doi.org/10.3390/atmos10110672, 2019.
Waser, L. T., Ginzler, C., and Rehush, N.: Wall-to-Wall Tree Type Mapping from Countrywide Airborne Remote Sensing Surveys, Remote Sens.-Basel, 9, 766, https://doi.org/10.3390/rs9080766, 2017.
Webster, C., Essery, R., Mazzotti, G., and Jonas, T.: Using just a canopy height model to obtain lidar-level accuracy in 3D forest canopy shortwave transmissivity estimates, Agr. Forest Meteorol., 338, 109429, https://doi.org/10.1016/j.agrformet.2023.109429, 2023.
Webster, C., Jonas, T., and Ginzler, C.: SwissRad10 Hourly light availability maps at 10 m resolution over Switzerland, EnviDat [data set], https://doi.org/10.16904/envidat.544, 2024.
Wever, N., Comola, F., Bavay, M., and Lehning, M.: Simulating the influence of snow surface processes on soil moisture dynamics and streamflow generation in an alpine catchment, Hydrol. Earth Syst. Sci., 21, 4053–4071, https://doi.org/10.5194/hess-21-4053-2017, 2017.
Winstral, A., Magnusson, J., Schirmer, M., and Jonas, T.: The Bias-Detecting Ensemble: A New and Efficient Technique for Dynamically Incorporating Observations Into Physics-Based, Multilayer Snow Models, Water Resour. Res., 55, 613–631, https://doi.org/10.1029/2018wr024521, 2019.
Yang, K., John, A., Shean, D., Lundquist, J. D., Sun, Z., Yao, F., Todoran, S., and Cristea, N.: High-resolution mapping of snow cover in montane meadows and forests using Planet imagery and machine learning, Frontiers in Water, 5, https://doi.org/10.3389/frwa.2023.1128758, 2023.
Zappa, M., Pos, F., Strasser, U., Warmerdam, P., and Gurtz, J.: Seasonal water balance of an Alpine catchment as evaluated by different methods for spatially distributed snowmelt modelling, Nord. Hydrol., 34, 179–202, 2003.
Zellweger, F., Sulmoni, E., Malle, J. T., Baltensweiler, A., Jonas, T., Zimmermann, N. E., Ginzler, C., Karger, D. N., De Frenne, P., Frey, D., and Webster, C.: Microclimate mapping using novel radiative transfer modelling, Biogeosciences, 21, 605–623, https://doi.org/10.5194/bg-21-605-2024, 2024.
- Abstract
- Introduction
- Site description – Dischma catchment and surroundings
- Spatial meteorological data
- Forest structure datasets
- Snow data
- Hydrological data and water balance analysis
- Additional data describing the Dischma catchment and surroundings
- Data availability
- Summary and outlook
- Author contributions
- Competing interests
- Disclaimer
- Acknowledgements
- Financial support
- Review statement
- References