the Creative Commons Attribution 4.0 License.
the Creative Commons Attribution 4.0 License.
 | 21 Oct 2025
A lacustrine surface-sediment pollen dataset covering the Tibetan Plateau and its potential in past vegetation and climate reconstructions
Fang Tian
Weiyu Cao
Xiaohan Liu
Zixin Liu
Xianyong Cao
A dataset of pollen extracted from the surface-sediments of lakes with broad spatial coverage is essential for pollen-based reconstructions of past vegetation and climate. We collected 90 new lake surface-sediment pollen samples from the Tibetan Plateau (TP), covering major vegetation types, including alpine forest, alpine meadow, alpine steppe, and alpine desert. By integrating these new data with previously published lacustrine pollen datasets, we established a comprehensive modern pollen dataset comprising 476 samples across the TP, covering the full range of climatic gradients across the TP, with Net Primary Production (NPP) from 0.16 to 6617.36 kg C m−2, mean annual precipitation (Pann) from 97 to 788 mm, mean annual temperature (Tann) −9.09 to 6.93 °C, mean temperature of the coldest month (Mtco) −23.48 to −2.65 °C, and mean temperature of the warmest month (Mtwa) 1.77 to 19.26 °C. Numerical analyses based on the comprehensive modern pollen dataset (n=476) revealed that Pann is the primary climatic determinant for pollen distribution, while NPP is a valuable variable reflecting vegetation conditions. To detect the quantitative relationship between pollen and NPP Pann, both Weighted-Averaging Partial Least Squares (WA-PLS) and Random Forest algrithom (RF) were employed. The performance of both models suggests that this modern pollen dataset has good predictive power in estimating past NPP and Pann, but RF has a slight advantage with this dataset. This comprehensive modern pollen dataset provides a reliable basis for reconstructing past vegetation and climate changes on the central TP. However, caution is required when applying it to pollen spectra from marginal regions of the TP or to records covering the Last Glacial period, where analogue quality is relatively poor. The dataset, including site locations, pollen percentages, NPP, and climate data for 90 lakes, is available at the National Tibetan Plateau Data Center (TPDC; Tian et al., 2025; https://doi.org/10.11888/Paleoenv.tpdc.302470).
- Article
(3702 KB) - Full-text XML
-
Supplement
(604 KB) - BibTeX
- EndNote


A modern pollen dataset is the foundation for the quantitive reconstruction of past vegetation and climate based on fossil pollen spectra. Surface-soil samples for pollen analysis can be easily obtained, but their pollen assemblages are easily affected by local vegetation components, which cause more noise in the modern relationships of pollen–vegetation and pollen-climate (Cao et al., 2014). Lake sediments, in contrast, provide more regional pollen signals owing to broader pollen source areas, more stable sedimentation rates, and better preservation, making them more suitable for researching regional vegetation and climate changes (Tian et al., 2020; Cao et al., 2021). Due to the sparse distribution of lakes, high sampling costs, and limited accessibility – especially in remote regions – modern pollen datasets from lake surface sediments remain limited and spatially biased, particularly in China (Herzschuh et al., 2010; Ma et al., 2017; Cao et al., 2021).
The Tibetan Plateau (TP), situated at high elevations and subject to complex climate systems, is highly sensitive to global climate change and human activities and exhibits strong regional ecological and climatic peculiarities (Chen et al., 2015, 2020; Pepin et al., 2015). These features make the TP a research hotspot for past vegetation and climate reconstructions. Fortunately, the widespread distribution of lakes across the plateau offers an opportunity to expand and refine pollen-based calibration datasets using lake surface sediments, but the distribution of available pollen sites of lake surface-sediment remains uneven and incomplete due to logistical constraints (Cao et al., 2021; Qin, 2021; Ma et al., 2024). Hence, it is essential to improve the coverage and comprehensiveness of the modern calibration-set from lake surface-sediments on the TP.
While previous pollen–climate relationships are often the focus of calibration–set studies, the pollen–vegetation relationship is also crucial on the TP, where vegetation type is generally employed as the target variable, especially when reconstructing ecological conditions (e.g. Qin, 2021; Qin et al., 2022). Existing modern pollen datasets reveal that pollen assemblages from different vegetation types on the TP generally present only minor differences in pollen components and their abundance. For instance, the dominant pollen taxa are generally herbaceous taxa, including Cyperaceae, Artemisia, Amaranthaceae (with Chenopodiaceae treated as a subfamily), and Poaceae (e.g. Herzschuh et al., 2010; Ma et al., 2017; Cao et al., 2014, 2021; Li et al., 2020; Qin, 2021), making it difficult to distinguish vegetation conditions based on pollen assemblages directly. However, the pollen concentration and percentages from lake sediments have been confirmed to positively correlate with vegetation coverage, which reflects total plant biomass (Liu et al., 2023). Since net primary production (NPP) represents the carbon fixed and accumulated as biomass by plants (Fang et al., 2001; Nemani et al., 2003; Gonsamo et al., 2013; Ni, 2013; Walker et al., 2015; Ji et al., 2020), pollen can serve as an indirect proxy for NPP, allowing us to infer spatial and temporal patterns of vegetation conditions on the TP.
Here, we analysed 90 lake surface-sediment samples for pollen and combined them with previously published 386 modern pollen data extracted from lake surface-sediments (Herzschuh et al., 2010; Li and Li, 2015; Cao et al., 2021; Ma et al., 2024; Wu et al., 2024), then used Detrended Correspondence Analysis (DCA), Redundancy Analysis (RDA), Weighted Averaging Partial Least Squares (WA-PLS), and Random Forest algrithom(RF) to: (1) establish a comprehensive pollen dataset extracted from lake surface-sediments covering the entire TP with an relative even distribution; (2) evaluate the predictive power of models using the modern pollen dataset in reconstructing past vegetation and climate.
The climate of the TP is controlled mainly by the Asian Summer Monsoon in summer with warm-wet conditions and by westerlies in winter with a cold-dry climate (Wang, 2006). In addition, there is a gradient from high summer temperatures (up to 19 °C) and high precipitation (>700 mm) on the south-eastern TP, to low summer temperatures (ca. 6 °C) and low precipitation (<100 mm) on the north-western TP (Fig. 1; Sun, 1999; Herzschuh, 2007; He et al., 2020).
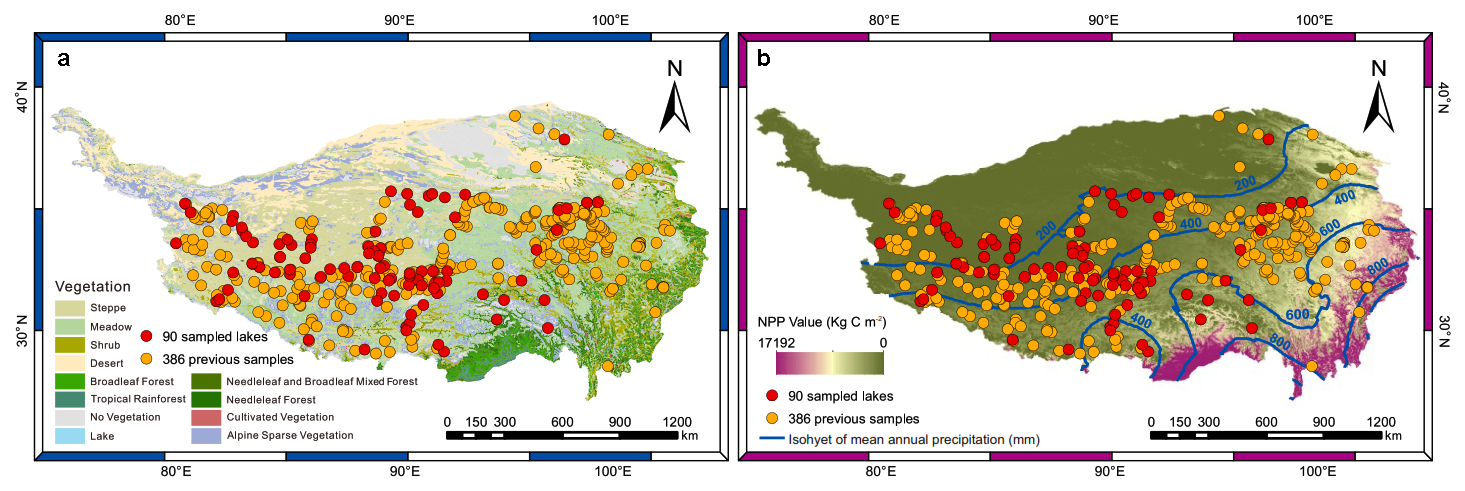
Figure 1Spatial distribution of 476 modern pollen samples collected from lake surface-sediments on the Tibetan Plateau. Red filled circles indicate the 90 lakes sampled in this study; orange filled circles represent 386 previously published sites (Herzschuh et al., 2010; Li and Li, 2015; Cao et al., 2021; Ma et al., 2024; Wu et al., 2024) based on (a) vegetation types and (b) net primary production (NPP; Zhao and Running, 2010).
The TP exhibits distinct vegetation zonation along thermal and moisture gradients oriented along a southeast–northwest axis, with ecosystems transitioning from forest through alpine meadow and steppe to desert vegetation (Fig. 1; Zhang, 2007). Alpine forest dominated by Pinus, Picea, Abies, Betula, Quercus, and Tsuga is primarily distributed in the warm-humid south-eastern and eastern marginal regions of the TP (Herzschuh, 2007). Alpine meadow, as one of the most important vegetation types, is mainly distributed on the eastern and southern TP, and are characterized by Kobresia spp., Carex, Asteraceae, Polygonum, Potentilla, Fabaceae, Caryophyllaceae, Leontopodium, Arenaria, Ranunculus, and Poaceae (Wu, 1995; Herzschuh et al., 2010; Cao et al., 2021). Alpine steppe is primarily distributed across the southern, eastern, and central TP, and is mainly dominated by Stipa purpurea, Artemisia, Potentilla, Asteraceae, Amaranthaceae, and Carex (Fig. 1; Zhang, 2007; Yue et al., 2011). Alpine desert, located in the dry north-central and westernmost central TP, is characterized by sparse vegetation and are predominantly occupied by drought-tolerant taxa such as Ceratoides, Salsola, Haloxylon, Kalidium, Artemisia, Ephedra, Nitraria, and Poaceae (Fig. 1; Zhang, 2007).
3.1 Sample collection and pollen processing
To achieve a broadly representative coverage of lakes across different vegetation zones on the TP, we collected one surface-sediment sample (top 2 cm) from the centre of each lake, for a total of 90 lakes across different vegetation types on the TP: forest (n=5), meadow (n=22), steppe (n=53), and desert (n=10) between 2021 and 2023 (Fig. 1, Table 1). Collecting from the lake centre is intended to provide a representative pollen assemblage that integrates inputs from the surrounding catchment. The elevation of the sampled lakes ranges from 3923 to 5433 m a.s.l., with a median of 4652 m a.s.l. (Fig. 1).
For each sample, 2–3 g of dry material was used for pollen extraction, and a tablet with Lycopodium spores (10 315 grains) was added to each sample initially as a tracer (Maher, 1981). Pollen samples were processed using standard acid–alkali–acid procedures (Fægri and Iversen, 1989), including 10 % HCl, 10 % KOH, 40 % HF, acetolysis treatment, and sieving in an ultrasonic bath to remove particles < 7 µm. Pollen grains were identified and counted under a Zeiss optical microscope at 400× magnification, referring to modern pollen slides collected from the eastern and central TP and published palynological literature (Wang et al., 1995; Tang et al., 2016; Cao et al., 2020). To ensure the reliability of the pollen assemblages for numerical analyses, more than 500 terrestrial pollen grains, or over 2000 Lycopodium spores were counted for each sample. The pollen diagram was constructed using Tilia software (Grimm, 1987, 1991).
Table 1Locations of the sampling sites of our field work on the Tibetan Plateau.
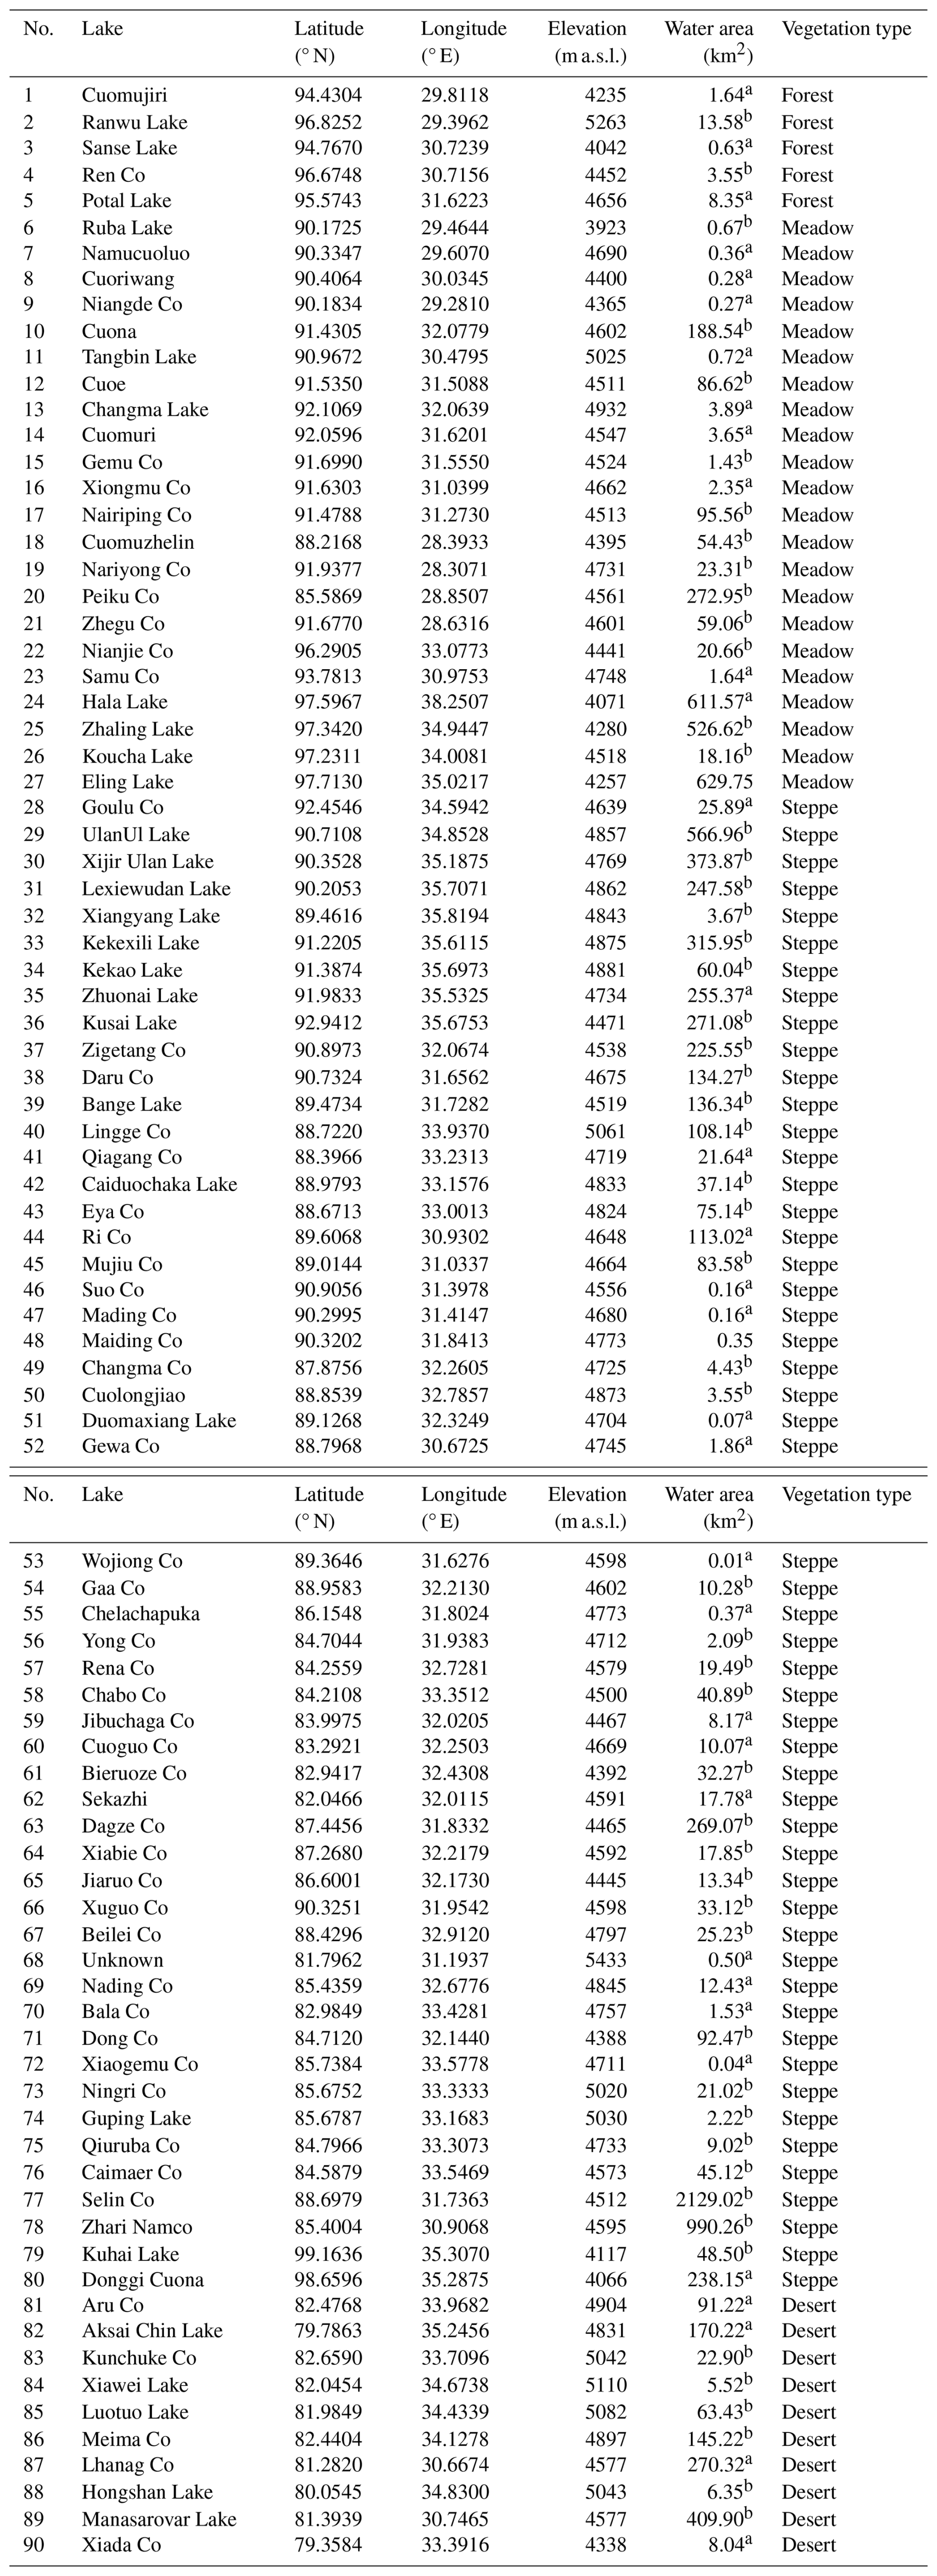
a Data measured from ArcGis; b data from Yang (2019).
3.2 Data collection and harmonization
We compiled a dataset of modern pollen assemblages from lake surface sediments across the TP, incorporating 375 lakes situated in the eastern (Herzschuh et al., 2010; Cao et al., 2021), central, and western TP (Ma et al., 2024; Wu et al., 2024), obtained from accessible databases or from authors directly. To enhance spatial coverage, an additional 11 surface pollen assemblages were digitized from a published diagram representing sites along the eastern edge of TP (Li and Li, 2015). The final dataset comprises 476 pollen assemblages from lake surface-sediments on the TP (Fig. S1 in the Supplement). The pollen assemblages of the 386 previously published samples have already been described and discussed in detail in their original publications. Therefore, in this study, we present only the pollen assemblages of the 90 newly collected samples.
The pollen data are standardized following the procedures outlined in Cao et al. (2013), including harmonization of taxonomy, generally to the family or genus level, and recalculation of pollen percentages based on total terrestrial pollen grains. Only pollen taxa with an abundance of at least 0.5 % in at least three samples and a maximum ≥ 3 % (n=35) were retained for the following statistical analyses.
We employed the Chinese Meteorological Forcing Dataset (CMFD), a gridded near-surface meteorological dataset covering the period from January 1979 to December 2018, with a temporal resolution of 3 h and a spatial resolution of 0.1°. Climate data of each sampled lake were assigned as the values of the nearest pixel from the meteorological dataset. For all 476 lakes, the following parameters were extracted: Pann: mean annual precipitation, mm; Tann: mean annual temperature, °C; Mtco: mean temperature of the coldest month, °C; Mtwa: mean temperature of the warmest month, °C (He et al., 2020). The geographical distances between lake coordinates and grid centroids were calculated geodetically using the rdist.earth function in the fields package version 16.3.1 (Nychka et al., 2025) for R (R Core Team, 2019).
The NPP value, defined as Gross Primary Productivity (GPP) minus Maintenance Respiration (MR) (Zhao and Running, 2010), was obtained from observations of the MOD17A3HGF.006 product during 2001–2022 with a pixel resolution of 1000 m. Across the study region, NPP values range from 0.16 to 6617.36 kg C m−2, Pann ranging from 97 to 788 mm, and cold thermal conditions characterized by low Tann (−9.09 to 6.93 °C) and Mtco (−23.48 to −2.65 °C; Table S1 in the Supplement).
3.3 Data analysis
For all statistical analyses (RDA, WA-PLS, RF), we used the full integrated dataset of 476 samples.
To visualize how the modern pollen assemblages respond to climatic variables, ordination techniques were employed based on the selected 35 pollen types from all 476 sites. Pollen data were square-root transformed to stabilize variances and optimize the signal-to-noise ratio (Prentice, 1980). Detrended Correspondence Analysis (DCA; Hill and Gauch, 1980) showed that the gradient length of the first axis of the pollen data was 2.36 SD (Standard Deviation units), indicating that a linear response model is suitable for our pollen dataset (ter Braak and Verdonschot, 1995). We employed RDA to assess how major pollen taxa and sampling sites are distributed along vegetation and climate gradients. Climatic predictors were introduced sequentially following a forward selection procedure, with multicollinearity assessed at each step via variance inflation factors (VIF). Variables exhibiting VIF values above the threshold of 20 were excluded to maintain model parsimony and reduce redundancy (ter Braak and Prentice, 1988; Birks, 1995). Additionally, the suitability of each climatic variable for quantitative reconstruction was evaluated using the ratio of the first constrained eigenvalue to the first unconstrained eigenvalue (), where larger ratios indicate stronger predictive potential (Juggins, 2013). All ordinations were carried out using the rda and decorana functions in the vegan package (Oksanen et al., 2019).
WA-PLS regression was applied to calibrate transfer functions linking modern pollen assemblages to Pann and NPP, based on square-root transformed relative abundances of the 35 selected taxa – consistent with those used in the ordination analyses (ter Braak and Juggins, 1993). Model performance was evaluated using “leave-one-out” cross-validation, and the optimal number of WA-PLS components was determined based on a randomization t-test (Juggins and Birks, 2012). All the analyses were performed using the WA-PLS function of the rioja package version 0.7–3 (Juggins, 2012) in R.
As WA-PLS is known to produce systematic prediction biases near the ends of environmental gradients – commonly referred to as the “edge effect” (Birks, 1998; Tian et al., 2022) – we further explored a complementary reconstruction method. RF is an ensemble learning algorithm that integrates multiple decision trees based on a classification tree algorithm and summarizes their results for classification or regression tasks (Breiman, 2001). The importance of the explanatory variable is normally measured as a percentage increase in the residual sum of squares after random shuffling of the variables' order, thereby determining which explanatory variable can be added to the model. RF has been applied in the geographical and ecological fields and performs well (Li, 2013; Jin et al., 2016). In this study, we applied RF to assess the importance of pollen and the NPP/climate variables (Table S1). The model was systematically optimized through a stepwise reduction procedure, in which the pollen taxa with the least important score were deleted until the RF-importance of all remaining taxa were greater than 0 (Breiman, 2001). The RF algorithm was run based on square-root transformed pollen percentages of the selected 35 taxa, using the randomForest function in the randomForest package version 4.6–14 (Liaw, 2018) in R. The statistical significance of the reconstructions derived from WA-PLS and RF was tested with the randomTF function of the palaeoSig package (Telford and Birks, 2011; Telford, 2013) in R.
In quantitative climate reconstructions, the taxonomic distance between a fossil pollen assemblage and its modern analogue is a key variable in evaluating the analogue quality (Birks et al., 1990). Shorter distances indicate closer taxonomic similarity and higher analogue quality, enhancing reconstruction reliability. This distance is commonly calculated using the squared chord distances based on the percentages of all pollen taxa. To evaluate the analogue quality, we calculated the squared chord distances between the selected fossil pollen spectra since the last glacial maximum (n=65, elevation higher than 3000 m a.s.l.; Cao et al., 2013) and the combined modern pollen dataset on the TP. The square chord distances were calculated using the MAT function of the rioja package (Juggins, 2018) in R.
The pollen assemblages of the new surface-sediment samples (n=90) are dominated by herbaceous pollen from alpine meadow, steppe, and desert sites on the TP. In contrast, arboreal pollen dominates the samples collected from the forest, consisting mainly of Pinus, Picea, Alnus, Tsuga, Juniperus, Betula, and Quercus (Fig. 2). Additionally, there are evident regional peculiarities in its distribution (Figs. 2–4). Sites with Cyperaceae abundances >60 % from alpine meadows are more common than other sites, whereas steppe regions are marked by higher percentages of Poaceae and Artemisia, typically exceeding 30 % and 50 %, respectively. The distribution center of Amaranthaceae (>30 %) is generally located in desert (Figs. 2–4; Table S1).
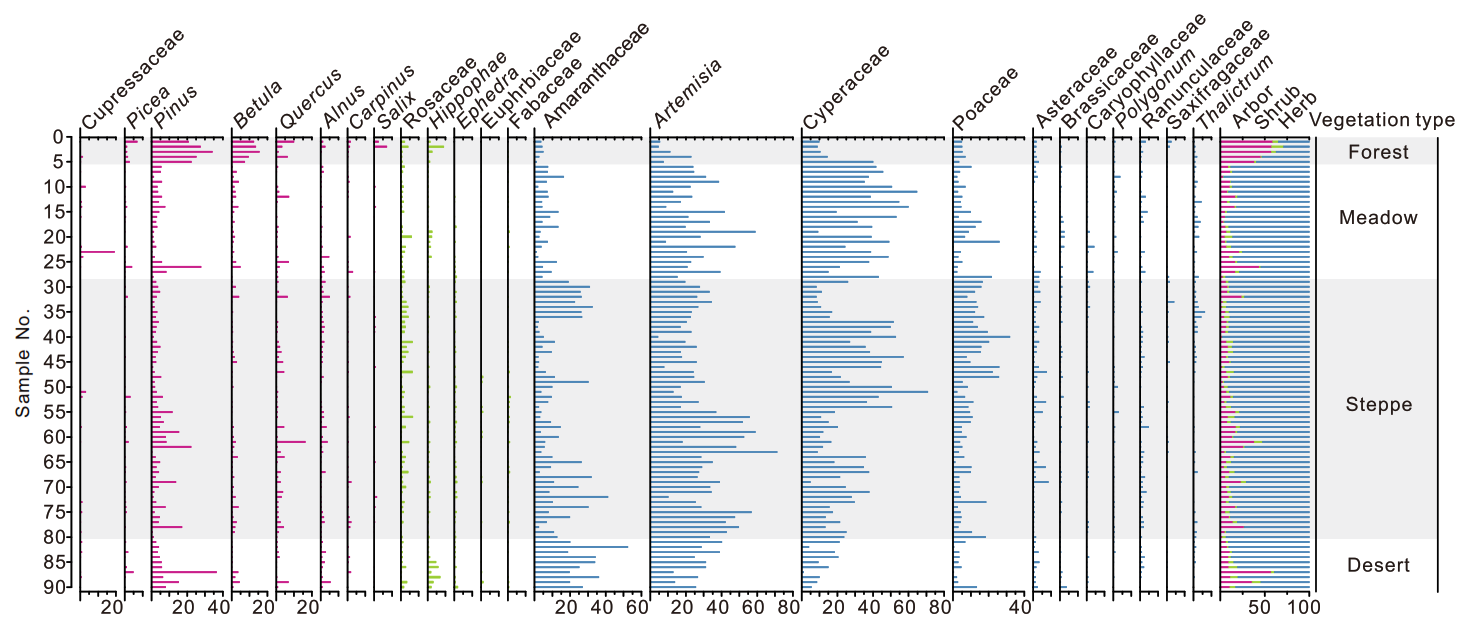
Figure 2Percentage diagram of major pollen taxa for 90 lake surface-sediment samples on the Tibetan Plateau. Samples are arranged according to their vegetation type.
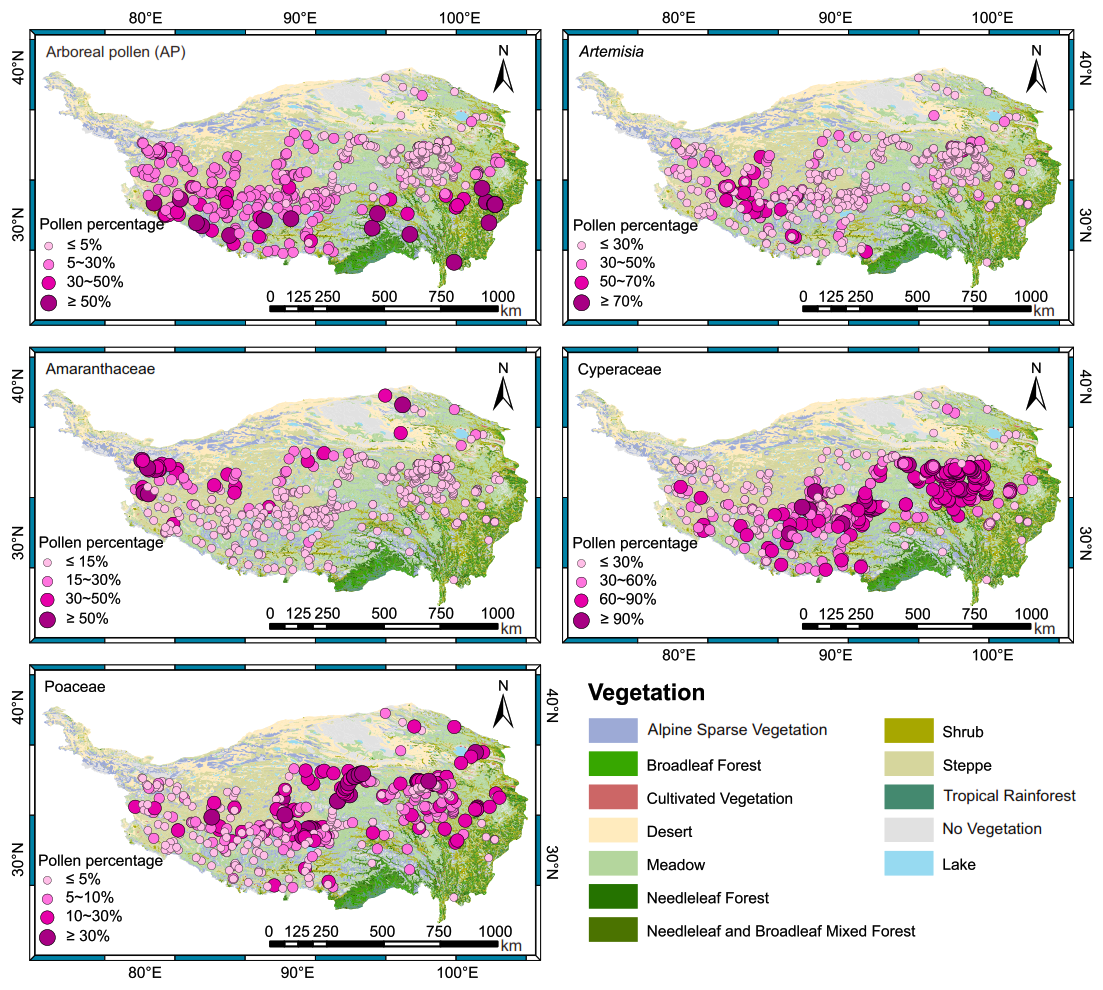
Figure 3The spatial distribution maps of pollen percentages for total arboreal pollen (AP) and selected herbaceous taxa (Artemisia, Amaranthaceae, Cyperaceae, Poaceae) in the dataset of lake surface-sediment samples (n=476) on the Tibetan Plateau.
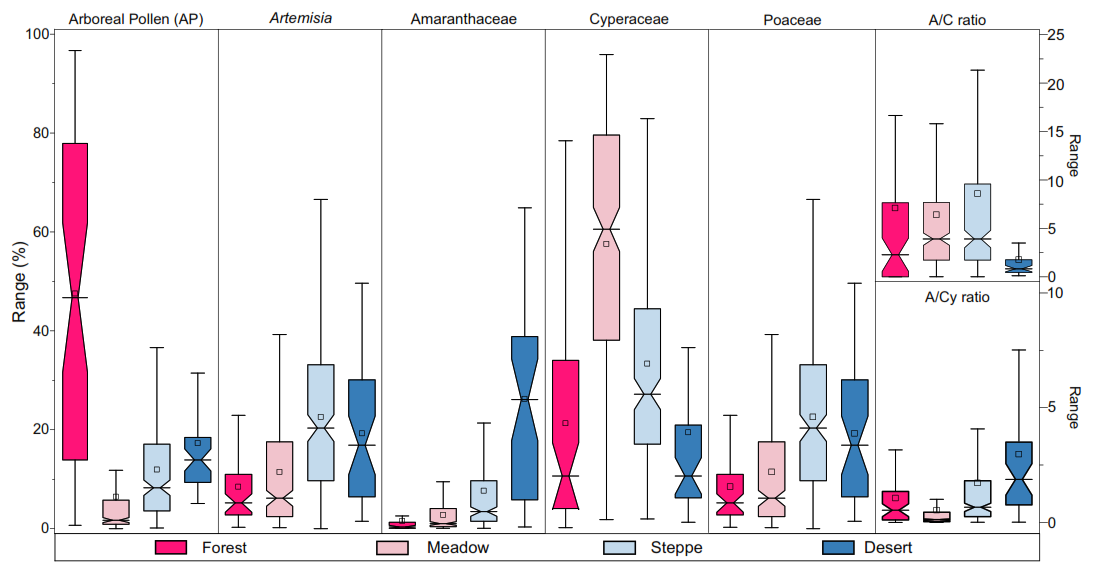
Figure 4Box plots of the regional percentage distributions of arboreal pollen (AP) and four selected herbaceous pollen types (Artemisia, Amaranthaceae, Cyperaceae, Poaceae), plus the ratios of (Artemisia Amaranthaceae) and (Artemisia Cyperaceae) from modern lake surface-sediment samples across the Tibetan Plateau.
Group 1 (forest, n=5): The pollen assemblages of the sampled lakes are characterized by the lowest Artemisia and Amaranthaceae abundance, yet exhibits the highest arboreal pollen (AP) percentages among the four groups. Key arboreal taxa include Pinus (mean 26.0 %, maximum 34.2 %; mean and max values are showed in this order below), Betula (11.7 %, 15.6 %), Quercus (3.9 %, 9.3 %), and Picea (2.7 %, 7.0 %, Figs. 2–4).
Group 2 (meadow, n=22): This group is typically characterized by the lowest AP and (Artemisia Cyperaceae) ratio but the highest Cyperaceae abundance (39.8 %, 64.7 %), with common taxa comprising Artemisia (27.1 %, 58.9 %), Amaranthaceae (6.8 %, 16.4 %), and Poaceae (6.3 %, 26.1 %, Figs. 2–4).
Group 3 (steppe, n=53): Artemesia (28.9 %, 59.0 %) is the most dominant component compared to meadow sites (Figs. 2–4). In addition, as a common taxon, Poaceae (10.3 %, 31.4 %), as well as the (Artemisia Amaranthaceae) ratio (range 0.25–12.14, median 3.45), reach their highest values of the different vegetation types.
Group 4 (desert, n=10): These sites are characterized by the highest percentages of Amaranthaceae (26.7 %, 52.4 %), with higher Artemisia abundance (27.4 %, 40.2 %, Figs. 2–4), and the lowest Poaceae (3.1 %, 6.6 %), Cyperaceae (11.4 %, 21.1 %) percentages, and ratio (range 0.55–2.08, median 0.83).
Although AP pollen is detected at most meadow and steppe sites, and occasionally in desert regions, its abundance is markedly lower than that in the forest sites (Table 1, Figs. 2–4). Since trees are absent in the alpine meadow, steppe, and desert communities on the TP (Wu, 1995; Wu and Xiao, 1995; Herzschuh et al., 2010), the low AP abundances likely represent wind-transported pollen transported from adjacent low-elevation regions. Despite this influence, the pollen assemblages effectively represent local vegetation composition, as the contribution of distant pollen is minimal overall (Figs. 2–4). Thus, the modern pollen distribution aligns closely with established vegetation types, corroborating findings from previous studies (Shen et al., 2006; Herzschuh et al., 2010; Li et al., 2020). Pollen assemblages of the 476 pollen samples of the dataset from TP are shown in Fig. S1.
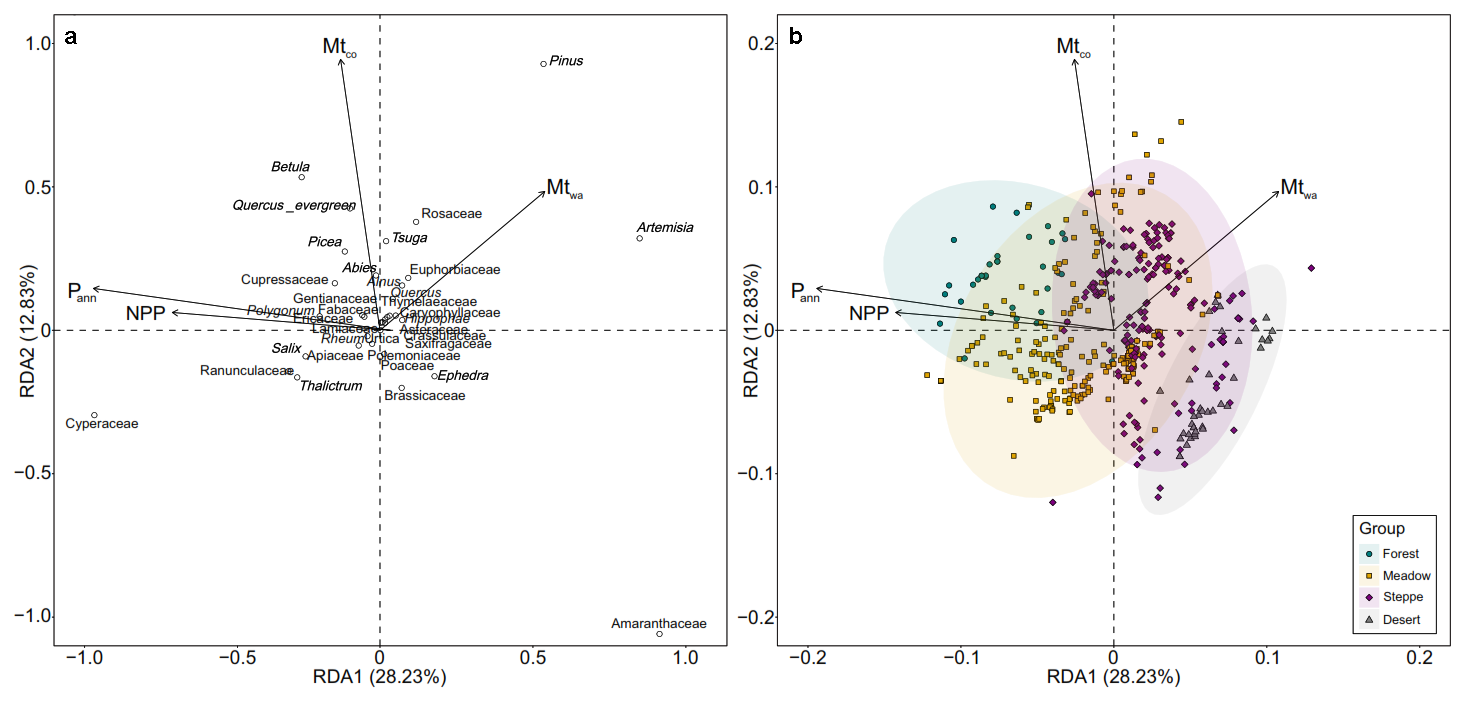
Figure 5Redundancy analysis (RDA) biplots of the pollen dataset along the first two axes, showing the relationships between (a) 35 selected pollen taxa (circles) and (b) 476 integrated samples (symbols) from different vegetation types and the four variables respectively (arrows): net primary production (NPP, kg C m−2), mean annual precipitation (Pann, mm), mean temperature of the coldest month (Mtco, °C), and mean temperature of the warmest month (Mtwa, °C).
Table 2Summary statistics of RDA of 476 sites, 35 pollen types, and four climatic variables (Pann: mean annual precipitation, mm; Mtco: mean temperature of the coldest month, °C; Mtwa: mean temperature of the warmest month, °C; Tann: annual mean temperature, °C) and NPP (Net Primary Production) in the pollen dataset from the Tibetan Plateau. VIF: variance inflation factor.
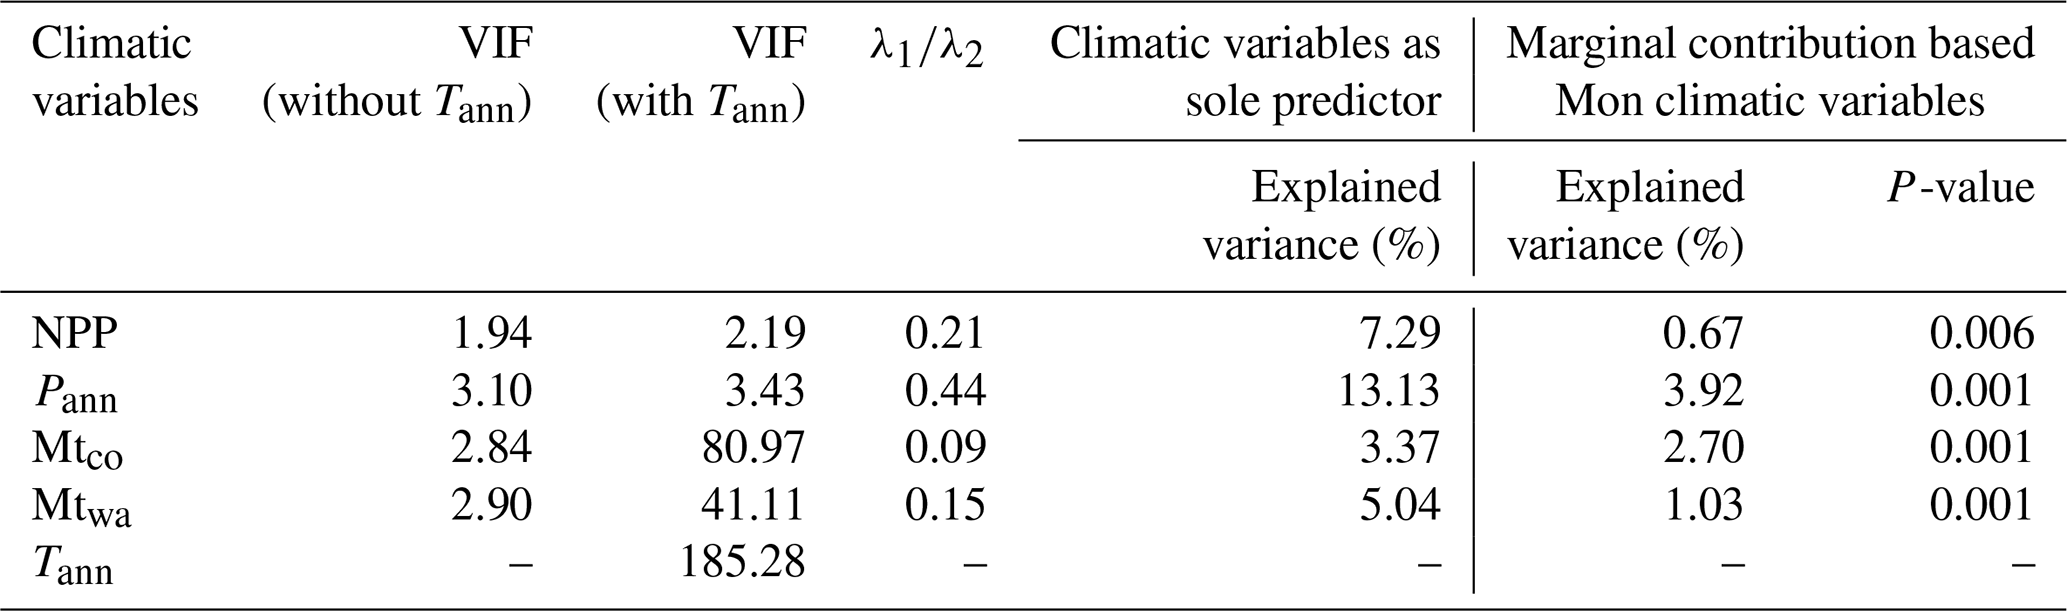
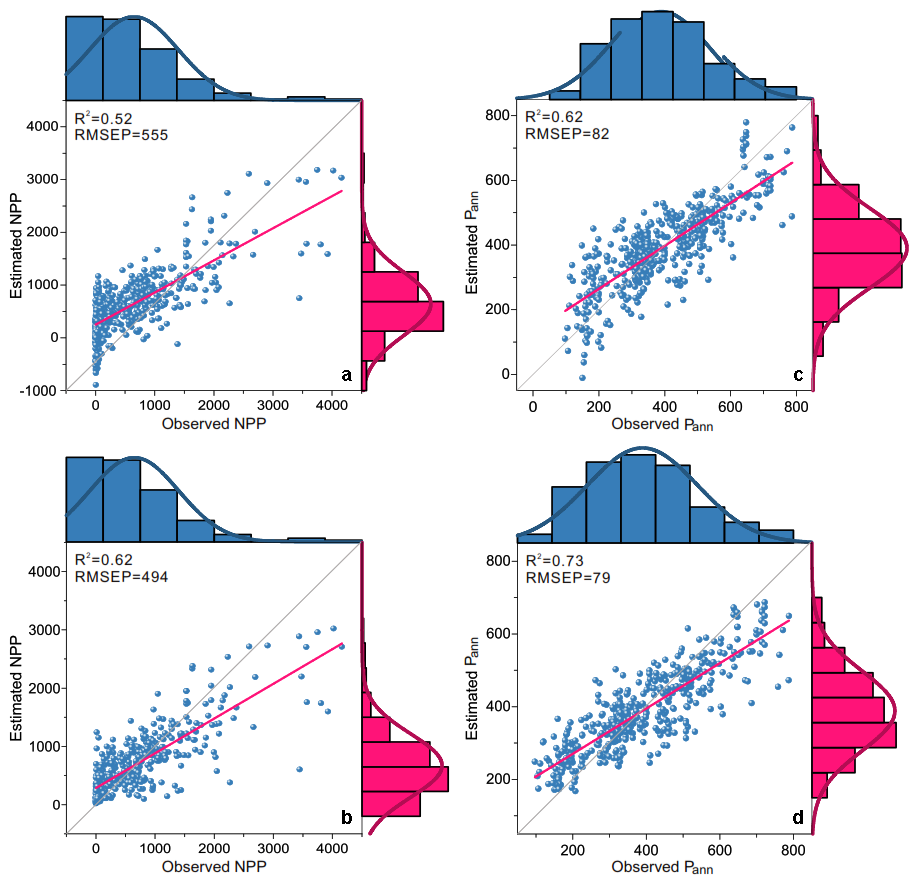
Figure 6Scatter plots of observed Net Primary Production (NPP) vs. predicted NPP (a, b), observed mean annual precipitation (Pann) vs. predicted Pann (c, d) using Weighted-Averaging Partial Least Squares (WA-PLS: top row) and Random Forest algrithom (RF: bottom row) based on the pollen data (n=476) from lake surface-sediments on the Tibetan Plateau (R2: coefficient of determination between observed and predicted values; RMSEP: root mean square error of prediction produced by “leave-one-out” cross-validation).
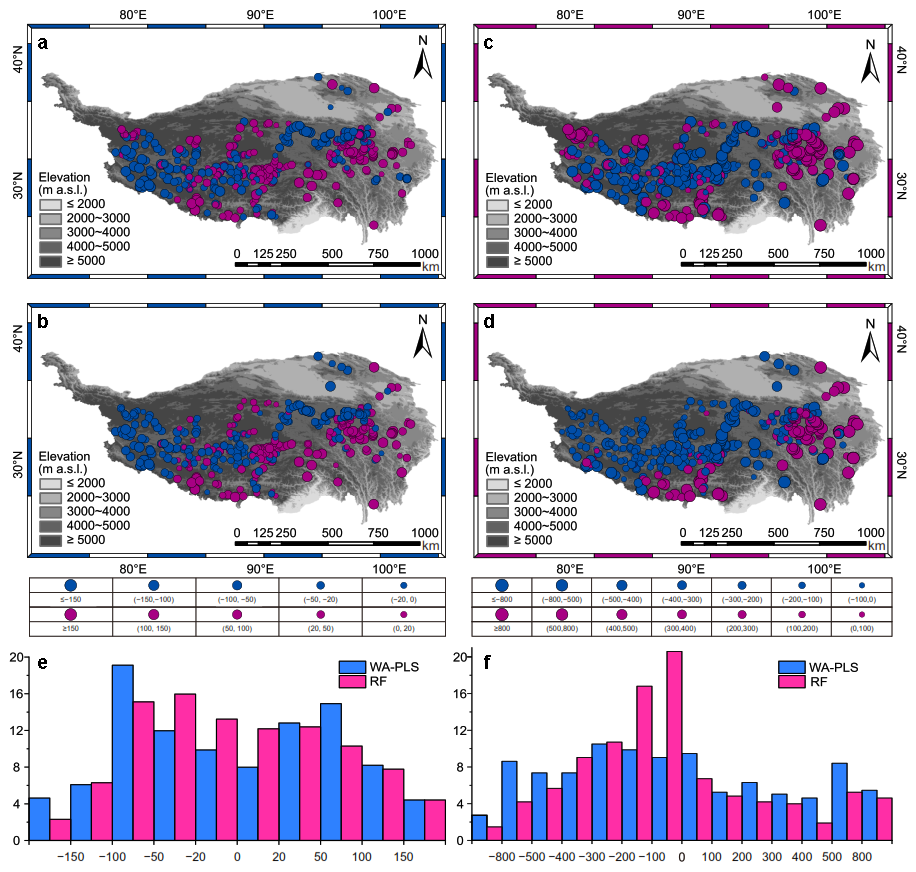
Figure 7The residuals between observations and pollen-based reconstructions for the lake surface-sediment sites (n=476) on the Tibetan Plateau: Net Primary Production (NPP) by Weighted-Averaging Partial Least Squares (WA-PLS) (a) and Random Forest algrithom (RF) (b), mean annual precipitation (Pann) by WA-PLS (c) and RF (d). The two bar charts in the lower part of the figure show the proportions of modern pollen sites available within different ranges of residuals (observation minus reconstruction) for both NPP (e) and Pann (f).
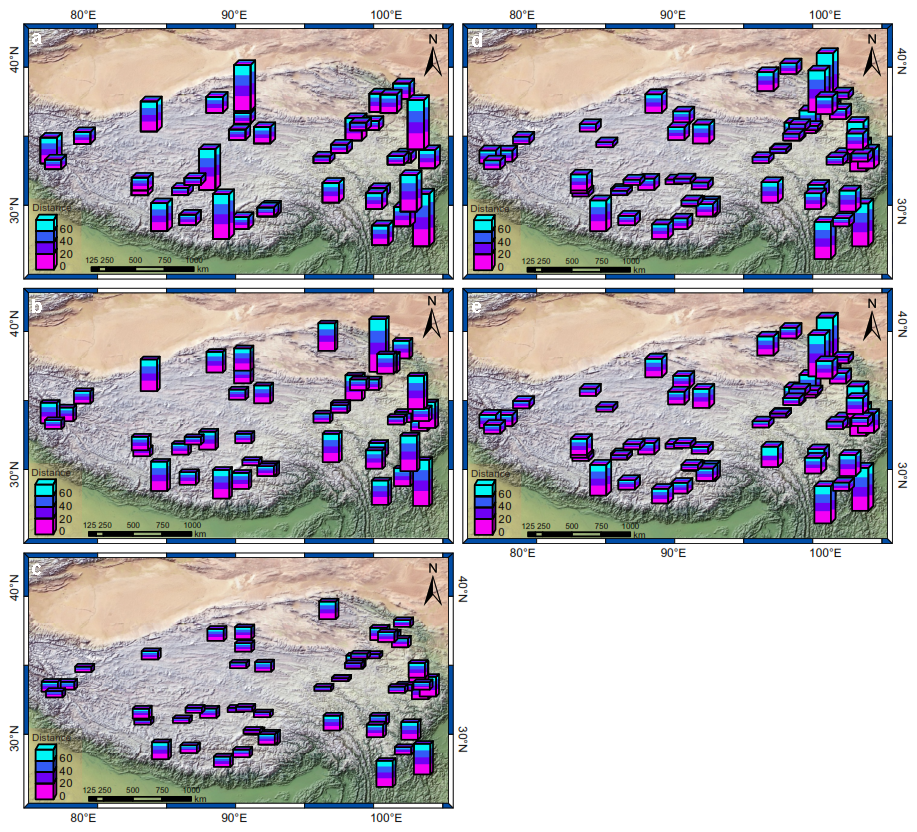
Figure 8Spatial distribution of analogue quality for six key time slices on the Tibetan Plateau: (a) 15–12 cal ka BP; (b) 12–9 cal ka BP; (c) 9–6 cal ka BP; (d) 6–3 cal ka BP; (e) 3–0 cal ka BP.
The initial RDA showed that the VIF values for Tann, Mtco, and Mtwa exceeded 20. Since Tann had the highest VIF, it was removed. After this adjustment, the remaining four variables (NPP, Pann, Mtco, and Mtwa) all had VIF values below 20, and were therefore retained in the final RDA to assess their influence on the modern pollen dataset.
The RDA results highlight that, as a sole predictor, relative to Mtco and Mtwa, NPP and Pann explain substantial portions of pollen assemblage variation (7.29 % and 13.13 %, respectively) in the dataset (Table 2). Biplots of the RDA shows that the vectors for both NPP and Pann form smaller angles with the positive direction of axis 1 (capturing 28.23 % of total inertia in the dataset) than with axis 2 (12.83 %), suggesting moisture availability as the primary determinant along axis 1 (Fig. 5). RDA axis 1, which is highly correlated with NPP and Pann, generally divides the pollen taxa into two groups. One group, comprising Cyperaceae, Ranunculaceae, and Salix, indicates wet climatic conditions (located along the positive direction of Pann), while the other group, consisting of Artemisia, Amaranthaceae, Poaceae, Ephedra, and Saxifragaceae represents drought (located along the negative direction of Pann; Fig. 5a). Furthermore, samples collected from alpine desert, steppe, meadow, and forest are located along the gradients of NPP and Pann (Fig. 5b), indicating that they can effectively distinguish different vegetation types as well as pollen assemblages.
In the calibration-sets, NPP and Pann are selected as the target variables because of their identified importance in influencing pollen distribution, with NPP further providing insights into alpine vegetation conditions (Table S2). Pollen-based estimates of modern NPP and Pann using both WA-PLS and RF approaches match original measurements well, exhibiting a high coefficient of determination (R2) and a low root mean square error of prediction (RMSEP), as shown in Fig. 6. The RF model showed superior predictive performance compared to WA-PLS for both target variables.
Reconstructions for NPP (< 1000 kg C m−2) and Pann (ca. 300–600 mm) are expected to be reliable because their bias is low (Fig. 6). For NPP, RF also shows a notably higher proportion of residuals between −500 and 500 kg C m−2 (84.5 %) compared to WA-PLS (74.8 %). This advantage persists for the narrower range of −300 to 300 kg C m−2 (RF: 63.9 % vs. WA-PLS: 50.4 %). For Pann, the proportion of residuals between −50 and 50 mm derived from RF (48.1 %) is slightly higher than that of WA-PLS (45.6 %). Similarly, for the range of −100 to 100 mm, RF (71.8 %) outperforms WA-PLS (65.8 %). However, both models consistently overestimated NPP and Pann in arid areas with low productivity and underestimated these variables in humid, high-productivity areas, highlighting the necessity of addressing the “edge-effect” (Figs. 6, 7).
Most of the poor analogue assemblages come from the TP margin and date back to >12 cal ka BP, possibly due to the higher abundance of arboreal pollen in this specific period and region (Fig. 8). While our combined modern pollen dataset from lake surface-sediments can provide good analogues for fossil pollen assemblages and enhance the performance of palaeoclimate reconstructions on the central TP, caution remains warranted for interpreting pollen assemblages from plateau margins and periods earlier than the Holocene (Fig. 8).
The modern pollen dataset from lake surface-sediment samples (n=90) comprising pollen percentages, site locations, net primary production, and climatic data for each lake is accessible from the National Tibetan Plateau/Third Pole Environment Data Center (TPDC; Tian et al., 2025; https://doi.org/10.11888/Paleoenv.tpdc.302470).
We established a comprehensive modern pollen dataset extracted from lake surface-sediments in forest, meadow, steppe, and desert vegetation types on the TP by combining new modern pollen data with previous datasets. Numerical analyses reveal that Pann is the most important climatic determinant influencing pollen distribution. Our dataset has good predictive power for past NPP and Pann reconstructions. The random forest algorithm is found to be a reliable approach for pollen-based reconstructions of past environments.
The pollen data from our sampled lakes help to fill the geographical gap left by previously published modern pollen datasets, thereby improving the spatial distribution of sampling sites covering the TP. Our dataset is a key component for providing quantitative estimates of past vegetation or climate, and can also be integrated with other pollen datasets in the future to improve the reliability of past ecosystem and climate reconstructions on the TP. Moreover, the current spatial coverage of lakes across the TP is still not fully even, highlighting the need for additional sampling to achieve a more representative dataset in future work.
The supplement related to this article is available online at https://doi.org/10.5194/essd-17-5529-2025-supplement.
FT and XC designed the pollen dataset, compiled the standardization for the dataset, performed numerical analyses, and organized the manuscript. FT, WC, XC collected the samples, WC performed pollen extraction and identification, XL and ZL prepared the figures and tables. All authors discussed the results and contributed to the final paper.
The contact author has declared that none of the authors has any competing interests.
Publisher's note: Copernicus Publications remains neutral with regard to jurisdictional claims made in the text, published maps, institutional affiliations, or any other geographical representation in this paper. While Copernicus Publications makes every effort to include appropriate place names, the final responsibility lies with the authors. Views expressed in the text are those of the authors and do not necessarily reflect the views of the publisher.
The authors would like to express their gratitude to the palynologists Ulrike Herzschuh (Alfred Wegener Institute Helmholtz Center for Polar and Marine Research), Kai Li (College of Life Sciences, Zhejiang Normal University), Qingfeng Ma (Institute of Tibetan Plateau Research, Chinese Academy of Sciences) who contributed to the dataset. We thank Zhitong Chen (Institute of Tibetan Plateau Research, Chinese Academy of Sciences), and students Meijiao Chen, Yunqing Li, and Anjing Jian for their help with sample collections in the field work.
This research was supported by the National Natural Science Foundation of China (grant nos. 42471179 and 42071107).
This paper was edited by Hanqin Tian and reviewed by Hanqin Tian and two anonymous referees.
Birks, H. J. B. (Eds.): Quantitative palaeoenvironmental reconstructions. Statistical modelling of Quaternary science data, Vol. 5, Technical guide, edited by: Maddy, D. and Brew, J. S., Quaternary Research Association, Cambridge, UK, 271 pp., https://w2.uib.no/filearchive/95birks_qpr_in_maddybrew_1.pdf (last access: 22 December 2024), 1995.
Birks, H. J. B.: Numerical tools in palaeolimnology–Progress, potentialities, and problems, J. Paleolimnol., 20, 307–332, https://doi.org/10.1023/A:1008038808690, 1998.
Birks, H. J. B., Line, J. M., Juggins, S., Stevenson, A. C., and ter Braak, C. J. F.: Diatoms and pH reconstruction, Philos. T. R. Soc. B, 327, 263–278, https://doi.org/10.1098/rstb.1990.0062, 1990.
Breiman, L.: Random Forests, Mach. Learn, 45, 5–32, https://doi.org/10.1023/A:1010933404324, 2001.
Cao, X., Ni, J., Herzschuh, U., Wang, Y., and Zhao, Y.: A late Quaternary pollen dataset from eastern continental Asia for vegetation and climate reconstructions: Set up and evaluation, Rev. Palaeobot. Palynol., 194, 21–37, https://doi.org/10.1016/j.revpalbo.2013.02.003, 2013.
Cao, X., Herzschuh, U., Telford, R. J., and Ni, J.: A modern pollen–climate dataset from China and Mongolia: Assessing its potential for climate reconstruction, Rev. Palaeobot. Palynol., 211, 87–96, https://doi.org/10.1016/j.revpalbo.2014.08.007, 2014.
Cao, X., Tian, F., Andreev, A., Anderson, P. M., Lozhkin, A. V., Bezrukova, E., Ni, J., Rudaya, N., Stobbe, A., Wieczorek, M., and Herzschuh, U.: A taxonomically harmonized and temporally standardized fossil pollen dataset from Siberia covering the last 40 kyr, Earth Syst. Sci. Data, 12, 119–135, https://doi.org/10.5194/essd-12-119-2020, 2020.
Cao, X., Tian, F., Li, K., Ni, J., Yu, X., Liu, L., and Wang, N.: Lake surface sediment pollen dataset for the alpine meadow vegetation type from the eastern Tibetan Plateau and its potential in past climate reconstructions, Earth Syst. Sci. Data, 13, 3525–3537, https://doi.org/10.5194/essd-13-3525-2021, 2021.
Chen, F., Dong, G., Zhang, D., Liu, X., Jia, X., An, C., Ma, M., Xie, Y., Barton, L., Ren, X., Zhao, Z., Wu, X., and Jones, M. K.: Agriculture facilitated permanent human occupation of the Tibetan Plateau after 3600 B.P., Science, 347, 248–250, https://doi.org/10.1126/science.aaa7573, 2015.
Chen, F., Zhang, J., Liu, J., Cao, X., Hou, J., Zhu, L., Xu, X., Liu, X., Wang, M., Wu, D., Huang, L., Zeng, T., Zhang, S., Huang, W., Zhang, X., and Yang, K.: Climate change, vegetation history, and landscape responses on the Tibetan Plateau during the Holocene: a comprehensive review, Quat. Sci. Rev., 243, 106444, https://doi.org/10.1016/j.quascirev.2020.106444, 2020.
Fægri, K. and Iversen, J. (Eds.): Text book of pollen analysis (4th Edition), John Wiley and Sons Press, Chichester, UK, 328 pp., https://doi.org/10.1002/jqs.3390050310, 1989.
Fang, J., Piao, S., Tang, Z., Peng, C., and Ji, W.: Interannual variability in net primary production and precipitation, Science, 293, 1723, https://doi.org/10.1126/science.293.5536.1723a, 2001.
Gonsamo, A., Chen, J., Price, D. T., Kurz, W. A., Liu, J., Boisvenue, C., Hember, R. A., Wu, C., and Chang, K.: Improved assessment of gross and net primary productivity of Canada's landmass, J. Geophys. Res. Biogeosci., 118, 1546–1560, https://doi.org/10.1002/2013JG002388, 2013.
Grimm, E. C.: CONISS: A FORTRAN 77 program for stratigraphically constrained cluster analysis by the method of incremental sum of squares, Comput. Geosci., 13, 13–35, https://doi.org/10.1016/0098-3004(87)90022-7, 1987.
Grimm, E. C.: Tilia and Tilia-Graph Software, Illinois State Museum, Springfield, IL [code], https://www.neotomadb.org/apps/tilia (last access: 28 September 2024), 1991.
He, J., Yang, K., Tang, W., Lu, H., Qin, J., Chen, Y., and Li, X.: The first high-resolution meteorological forcing dataset for land process studies over China, Sci. Data, 7, 25, https://doi.org/10.1038/s41597-020-0369-y, 2020.
Herzschuh, U.: Reliability of pollen ratios for environmental reconstructions on the Tibetan Plateau, J. Biogeogr., 34, 1265–1273, https://doi.org/10.1111/j.1365-2699.2006.01680.x, 2007.
Herzschuh, U., Birks, H. J. B., Mischke, S., Zhang, C., and Böhner, J.: A modern pollen-climate calibration set based on lake sediments from the Tibetan Plateau and its application to a Late Quaternary pollen record from the Qilian Mountains, J. Biogeogr., 37, 752–766, https://doi.org/10.1111/j.1365-2699.2009.02245.x, 2010.
Hill, M. O. and Gauch, H. G.: Detrended correspondence analysis: an improved ordination technique, Vegetatio, 42, 41–58, https://doi.org/10.1007/BF00048870, 1980.
Ji, Y., Zhou, G., Luo, T., Dan, Y., Zhou, L., and Lu, X.: Variation of net primary productivity and its drivers in China's forests during 2000–2018, For. Ecosyst., 7, 15, https://doi.org/10.1186/s40663-020-00229-0, 2020.
Jin, Y., Zhou, K., Gao, J., Mu, S., and Zhang, X.: Identifying the priority conservation areas for key national protected terrestrial vertebrate species based on a random forest model in China, Aeta Ecol. Sin., 36, 7702–7712, 2016 (in Chinese).
Juggins, S.: rioja: Analysis of Quaternary Science Data, version 0.7–3, Comprehensive R Archive Network (CRAN) [code], https://doi.org/10.32614/CRAN.package.rioja, 2012.
Juggins, S.: Quantitative reconstructions in palaeolimnology: new paradigm or sick science?, Quat. Sci. Rev., 64, 20–32, https://doi.org/10.1016/j.quascirev.2012.12.014, 2013.
Juggins, S.: rioja: Analysis of quaternary science data, version 0.9–15.1, Comprehensive R Archive Network (CRAN) [code], https://doi.org/10.32614/CRAN.package.rioja, 2018.
Juggins, S. and Birks, H. J. B.: Quantitative Environmental Reconstructions from Biological Data, in: Tracking Environmental Change Using Lake Sediments, edited by: Birks, H. J. B., Lotter, A. F., Juggins, S., and Smol, J. P., Vol. 5: Data Handling and Numerical Techniques, Springer, Dordrecht, the Netherlands, 64 pp., https://doi.org/10.1007/978-94-007-2745-8_14, 2012.
Li, C. and Li, Y.: Study of modern pollen and stomata from surficial lacustrine sediments from the eastern edge of Tibetan Plateau, China, Rev. Palaeobot. Palynol., 221, 184–191, https://doi.org/10.1016/j.revpalbo.2015.07.006, 2015.
Li, J., Xie, G., Yang, J., Ferguson, D. F., Liu, X., Liu, H., and Wang, Y. F.: Asian Summer Monsoon changes the pollen flow on the Tibetan Plateau, Earth Sci. Rev., 202, 103114, https://doi.org/10.1016/j.earscirev.2020.103114, 2020.
Li, X.: Using “random forest” for classification and regression, Chin. J. Appl. Entomol., 50, 1190–1197, 2013 (in Chinese).
Liaw, A.: Random Forest: Breiman and Cutler's Random Forests for Classification and Regression, version 4.6–14, Comprehensive R Archive Network (CRAN) [code], https://cran.r-project.org/web/packages/randomForest/index.html (last access: 22 December 2024), 2018.
Liu, L., Wang, N., Zhang, Y., Yu, X., and Cao, X.: Performance of vegetation cover reconstructions using lake and soil pollen samples from the Tibetan Plateau, Veg. Hist. Archaeobot., 32, 157–169, https://doi.org/10.1007/s00334-022-00891-0, 2023.
Ma, Q., Zhu, L., Wang, J., Ju, J., Lü, X., Wang, Y., Guo, Y., Yang, R., Kasper, T., Haberzettl, T., and Tang, L.: Artemisia/Chenopodiaceae ratio from surface lake sediments on the central and western Tibetan Plateau and its application, Palaeogeogr. Palaeocl., 479, 138–145, https://doi.org/10.1016/j.palaeo.2017.05.002, 2017.
Ma, Q., Zhu, L., Ju, J., Wang, J., Wang, Y., Huang, L., and Haberzettl, T.: A modern pollen dataset from lake surface sediments on the central and western Tibetan Plateau, Earth Syst. Sci. Data, 16, 311–320, https://doi.org/10.5194/essd-16-311-2024, 2024.
Maher, L. J.: Statistics for microfossil concentration measurements employing samples spiked with marker grains, Rev. Palaeobot. Palynol., 32, 153–191, https://doi.org/10.1016/0034-6667(81)90002-6, 1981.
Nemani, R. R., Keeling, C. D., Hashimoto, H., Jolly, W. M., Piper, S. C., Tucker, C. J., Myneni, R. B., and Running, S. W.: Climate-driven increases in global terrestrial net primary production from 1982 to 1999, Science, 300, 1560–1563, https://doi.org/10.1126/science.1082750, 2003.
Ni, J.: Carbon storage in Chinese terrestrial ecosystems: approaching a more accurate estimate, Clim. Change, 119, 905–917, https://doi.org/10.1007/s10584-013-0767-7, 2013.
Nychka, D., Furrer, R., Paige, J., and Sain, S.: fields: Tools for spatial data, version 16.3.1, Comprehensive R Archive Network (CRAN) [code], https://doi.org/10.32614/CRAN.package.fields, 2025.
Oksanen, J, Blanchet, F. G., Friendly, M., Kindt, R., Legendre, P., McGlinn, D., Minchin, P. R., O'Hara, R. B., Simpson, G. L., Solymos, P., Stevens, M. H. H., Szoecs, E., and Wagner, H.: vegan: Community Ecology Package, version 2.0–4, Comprehensive R Archive Network (CRAN) [code], https://cran.r-project.org/web/packages/vegan/index.html (last access: 10 January 2025), 2019.
Pepin, N., Bradley, R. S., Diaz, H. F., Baraer, M., Caceres, E. B., Forsythe, N., Fowler, H., Greenwood, G., Hashmi, M. Z., Liu, X., Miller, J. R., Ning, L., Ohmura, A., Palazzi, E., Rangwala, I., Schöner, W., Severskiy, I., Shahgedanova, M., Wang, M. B., Williamson, S. N., and Yang, D.: Elevation-dependent warming in mountain regions of the world, Nat. Clim. Change, 5, 424–430, https://doi.org/10.1038/nclimate2563, 2015.
Prentice, I. C.: Multidimensional scaling as a research tool in Quaternary palynology: a review of theory and methods, Rev. Palaeobot. Palynol., 31, 71–104, https://doi.org/10.1016/0034-6667(80)90023-8, 1980.
Qin, F.: Modern pollen assemblages of the surface lake sediments from the steppe and desert zones of the Tibetan Plateau, Sci. China Earth Sci., 64, 425–439, https://doi.org/10.1007/s11430-020-9693-y, 2021.
Qin, F., Zhao, Y., and Cao, X.: Biome reconstruction on the Tibetan Plateau since the Last Glacial Maximum using a machine learning method, Sci. China Earth Sci., 65, 518–535, https://doi.org/10.1007/s11430-021-9867-1, 2022.
R Core Team: R, A language and environment for statistical computing, R Foundation for Statistical Computing [code], https://www.r-project.org (last access: 15 January 2025), 2019.
Shen, C., Liu, K., Tang, L., and Overpeck, J. T.: Quantitative relationships between modern pollen rain and climate in the Tibetan Plateau, Rev. Palaeobot. Palynol., 140, 61–77, https://doi.org/10.1016/j.revpalbo.2006.03.001, 2006.
Sun, H. (Eds.): The national physical atlas of China, China Cartographic Publishing House, Beijing, China, 283 pp., ISBN 9787503120398, 1999.
Tang, L., Mao, L., Shu, J., Li, C., Shen, C., and Zhou, Z. (Eds.): An Illustrated Handbook of Quaternary Pollen and Spores in China, Science Press, Beijing, China, 620 pp., ISBN9787030505682, 2016 (in Chinese).
Telford, R. J.: palaeoSig: significance tests for palaeoenvironmental reconstructions, version 1.1–2, Comprehensive R Archive Network (CRAN) [code], https://doi.org/10.32614/CRAN.package.palaeoSig, 2013.
Telford, R. J. and Birks, H. J. B.: Effect of uneven sampling along an environmental gradient on transfer-function performance, J. Paleolimnol., 46, 99–106, https://doi.org/10.1007/s10933-011-9523-z, 2011.
ter Braak, C. J. F. and Juggins S.: Weighted averaging partial least squares regression (WA-PLS): an improved method for reconstructing environmental variables from species assemblages, Hydrobiologia, 269, 485–502, https://doi.org/10.1007/BF00028046, 1993.
ter Braak, C. J. F. and Prentice, I. C.: A theory of gradient analysis, Adv. Ecol. Res., 18, 271–317, https://doi.org/10.1016/S0065-2504(03)34003-6, 1988.
ter Braak, C. J. F. and Verdonschot, P. F. M.: Canonical correspondence analysis and related multivariate methods in aquatic ecology, Aquat. Sci., 57, 255–289, https://doi.org/10.1007/BF00877430, 1995.
Tian, F., Cao, X., Zhang, R., Xu, Q., Ding, W., Liu, X., Pan, B., and Chen, J.: Spatial homogenization of soil-surface pollen assemblages improves the reliability of pollen-climate calibration-set, Sci. China Earth Sci., 63, 1758–1766, https://doi.org/10.1007/s11430-019-9643-0, 2020.
Tian, F., Wang, W., Rudaya, N., Liu, X., and Cao, X.: Wet mid–late Holocene in central Asia supported prehistoric intercontinental cultural communication: Clues from pollen data, Catena, 209, 105852, https://doi.org/10.1016/j.catena.2021.105852, 2022.
Tian, F., Cao, W., Liu, X., Liu, Z., and Cao, X.: Pollen assemblages of lake surface sediment across the Tibetan Plateau, National Tibetan Plateau/Third Pole Environment Data Center [data set], https://doi.org/10.11888/Paleoenv.tpdc.302470, 2025.
Walker, A. P., Zaehle, S., Medlyn, B. E., De Kauwe, M. G., Asao, S., Hickler, T., Parton, W., Ricciuto, D. M., Wang, Y., Wårlind, D., and Norby, R. J.: Predicting long-term carbon sequestration in response to CO2 enrichment: how and why do current ecosystem models differ?, Global Biogeochem. Cycles, 29, 476–495, https://doi.org/10.1002/2014GB004995, 2015.
Wang, B. (Eds.): The Asian Monsoon, Springer, Chichester, UK, 845 pp., https://doi.org/10.1007/3-540-37722-0, 2006.
Wang, F., Qian, N., Zhang, Y., and Yang, H. (Eds.): Pollen Flora of China, 2nd Edition, Science Press, Beijing, China, 461 pp., ISBN7030036352, 1995 (in Chinese).
Wu, K., Li, K., Jia, W., Stoof-Leichsenring, K. R., Herzschuh, U., Ni, J., Liao, M., and Tian, F.: Application of plant DNA metabarcoding of lake sediments for monitoring vegetation compositions on the Tibetan Plateau, Sci. China Earth Sci., 67, 3594–3609, https://doi.org/10.1007/s11430-023-1358-0, 2024.
Wu, Y. and Xiao, J.: A preliminary study on modern pollen rain of Zabuye Salt Lake area, Xizang, Plant Divers., 17, 72–78, https://journal.kib.ac.cn/EN/Y1995/V17/I01/1 (last access: 12 December 2024), 1995 (in Chinese).
Wu, Z. (Eds.): The vegetation of China, Science Press, Beijing, China, 1270 pp., ISBN 7030024222, 1995 (in Chinese).
Yang, G. (Eds.): China lake survey, Science Press, Beijing, China, 671 pp., ISBN 9787030614223, 2019 (in Chinese).
Yue, P., Lu, X., Ye, R., Zhang, C., Yang, S., Zhou, Y., and Peng, M.: Distribution of Stipa purpurea steppe in the Northeastern Qinghai-Xizang Plateau (China), Russ. J. Ecol., 42, 50–56, https://doi.org/10.1134/S1067413611010140, 2011.
Zhang, X.: Vegetation Map of China and Its Geographic Pattern-Illustration of the Vegetation Map of the People's Republic of China (1:1000000), Geology Press, Beijing, China, https://doi.org/10.12282/plantdata.0155, 2007 (in Chinese).
Zhao, M. and Running, S. W.: Drought-Induced Reduction in Global Terrestrial Net Primary Production from 2000 Through 2009, Science, 329, 940–943, https://doi.org/10.1126/science.1192666, 2010.