the Creative Commons Attribution 4.0 License.
the Creative Commons Attribution 4.0 License.
 | 14 Oct 2025
A consistent regional dataset of dissolved oxygen in the western Mediterranean Sea (2004–2023): CTD-O2WMED
Malek Belgacem
Katrin Schroeder
Marta Álvarez
Siv K. Lauvset
Jacopo Chiggiato
Mireno Borghini
Carolina Cantoni
Tiziana Ciuffardi
Stefania Sparnocchia
The Mediterranean Sea is experiencing rapid environmental changes, underscoring the urgent need for high-quality, long-term datasets to quantify trends and assess impacts on biogeochemical cycles. Over the past few years, a lot of work has been done to improve and ensure data quality in the western Mediterranean Sea (WMED), but reliable dissolved oxygen (O2) data remain scarce. This is a critical gap as oxygen is a key indicator of marine ecosystem health and plays a central role in carbon and nutrient cycling. To address this gap, we compiled and rigorously quality-controlled a new regional-scale WMED dataset of O2 data from sensors mounted on conductivity, temperature, and depth (CTD) probes: CTD-O2WMED. This product includes over 1000 previously unpublished high-resolution vertical profiles of CTD-O2 measurements mostly collected within Italian cruises between 2004 and 2023. The quality control (QC) process involved sensor post-calibration against discrete Winkler measurements, primary screening, and a secondary check based on crossover analysis with reference datasets. Combined, this ensures the consistency of the final corrected CTD-O2WMED across both space and time. CTD-O2WMED provides a robust observational foundation for assessing trends of dissolved oxygen variability, mainly associated with climate change, anomalies related to deoxygenation processes, and contributes to advancing our understanding of ventilation processes in the WMED. It also serves as a benchmark for calibrating Biogeochemical-Argo floats and for validating regional biogeochemical models. The dataset is publicly available at https://doi.org/10.1594/PANGAEA.982858 (Belgacem et al., 2025).
- Article
(9604 KB) - Full-text XML
-
Supplement
(1298 KB) - BibTeX
- EndNote


Dissolved oxygen (O2) in the ocean is primarily produced through photosynthesis by phytoplankton in the surface layer, especially in regions of high primary productivity. The subsequent export and remineralization of organic matter from the surface lead to oxygen consumption at depth, potentially giving rise to oxygen minimum zones (OMZs) or oxygen minimum layers (OMLs), where biological respiration exceeds oxygen supply. While OMZs are characteristic of certain oceanic regions, the Mediterranean Sea is generally well oxygenated and does not develop OMZs but rather OMLs (Álvarez et al., 2022). Nonetheless, localized low-oxygen events may become more frequent and intense in response to ongoing climate change and human activities driving eutrophication events (Grégoire et al., 2023).
Ocean warming and increased stratification reduce oxygen solubility and inhibit vertical mixing, respectively, thereby limiting the downward transport of oxygen-rich surface waters. These processes contribute to the expansion and intensification of low-oxygen zones, with important consequences for biogeochemical cycling, ecosystem functioning, and carbon export (Keeling et al., 2010). In the deep ocean, enhanced remineralization and reduced ventilation can further exacerbate oxygen loss. Under low-oxygen conditions, denitrification may also occur, altering the nitrogen-to-phosphorus (N : P) ratio and influencing both nutrient cycling and primary productivity.
Increased CO2 concentrations and stratification can also reshape biological communities, potentially lowering ecosystem resilience. These biogeochemical shifts affect the distribution of oxygen and other biogeochemical variables, particularly in semi-enclosed basins like the Mediterranean Sea. In recent decades, the region has undergone significant environmental changes, including recurrent marine heatwaves (Marullo et al., 2023; Martinez et al., 2023; Pastor and Khodayar, 2023), which influence oxygen distribution (Reale et al., 2022; Álvarez et al., 2023). The Mediterranean's semi-enclosed configuration, complex thermohaline circulation, and pronounced regional differences make it especially sensitive to climate variability (Powley et al., 2016; Yao et al., 2016; Testor et al., 2017; Margirier et al., 2020).
Two major events have notably impacted the thermohaline structure of the Mediterranean Sea. In the eastern Mediterranean (EMED), the Eastern Mediterranean Transient (EMT) of the mid-1990s shifted deep-water formation source from colder, less saline Adriatic Deep Water to warmer, saltier Aegean/Cretan Water. This new deep-water mass ventilated the Levantine Basin and the Ionian Sea around 1999 and reached the Sicily Channel by 2001 (Schroeder et al., 2006). When the Aegean contribution weakened, the Adriatic source regained dominance between 2000 and 2010. However, in subsequent years, it failed to reach the deepest Ionian layers, ventilating instead the 2000–3000 m depth range. In the western Mediterranean Sea (WMED), deep convection in the Gulf of Lion has traditionally ensured ventilation of the Western Mediterranean Deep Water (WMDW). A peak in deep-water renewal occurred during the Western Mediterranean Transition (WMT) in the year 2005 (Schroeder et al., 2016). Since then, a decline in both frequency and intensity of deep convection has been observed (Fourrier et al., 2020; Li and Tanhua, 2020), leading to reduced deep layer ventilation and an intensification of the oxygen minimum at intermediate depths, with implications for the uptake of atmospheric oxygen (Ulses et al., 2021). Long-term observational programs such as the MEDAR/MEDATLAS (Fichaut et al., 2003), Med-SHIP (Schroeder et al., 2015), RADMED (López-Jurado et al., 2015), and MOOSE network (Coppola et al., 2018) have provided crucial insights into these changes. Recently, machine learning techniques have been employed to reconstruct oxygen fields at higher spatial and temporal resolution using satellite and auxiliary data sources (Liu et al., 2025). Nevertheless, substantial uncertainties in the quantification and long-term impacts of O2 changes on Mediterranean Sea marine ecosystems still remain (Coppola et al., 2018; Álvarez et al., 2014).
To improve our understanding of regional dissolved oxygen dynamics and the impact of climate changes on biogeochemical trends, this study presents a quality-controlled compilation of CTD oxygen profiles collected by the Italian National Research Council (CNR) between 2004 and 2023 in the WMED. The dataset provides reliable CTD-based oxygen measurements that support assessments of water mass ventilation and long-term variability. This paper documents the dataset and outlines the quality control (QC) procedures, including calibration assessment against discrete Winkler measurements, first quality control flagging, and secondary quality corrections, to ensure the consistency of the CTD oxygen data product released, CTD-O2WMED.
2.1 The CNR data collection
The CTD-Oxygen in the WMED (CTD-O2WMED) dataset comprises 1382 dissolved oxygen profiles collected with CTD probes across 25 CNR research cruises (Table 1). Figure 1 shows the spatial distribution of these profiles, illustrating broad coverage throughout the northern WMED and along key hydrographic transects. The majority of measurements are concentrated in the eastern portion of the WMED, including the Ligurian and Tyrrhenian seas and the Tunisia–Sicily–Sardinia region.
Table 1Cruises contained in the CTD-O2WMED data product; for each cruise, the alias, expocode, research vessel, and date information are provided, along with the number of stations with CTD-O2 profiles (Nb). Refer to Table S1, Belgacem et al. (2020), and Ribotti et al. (2022) for additional cruise metadata.
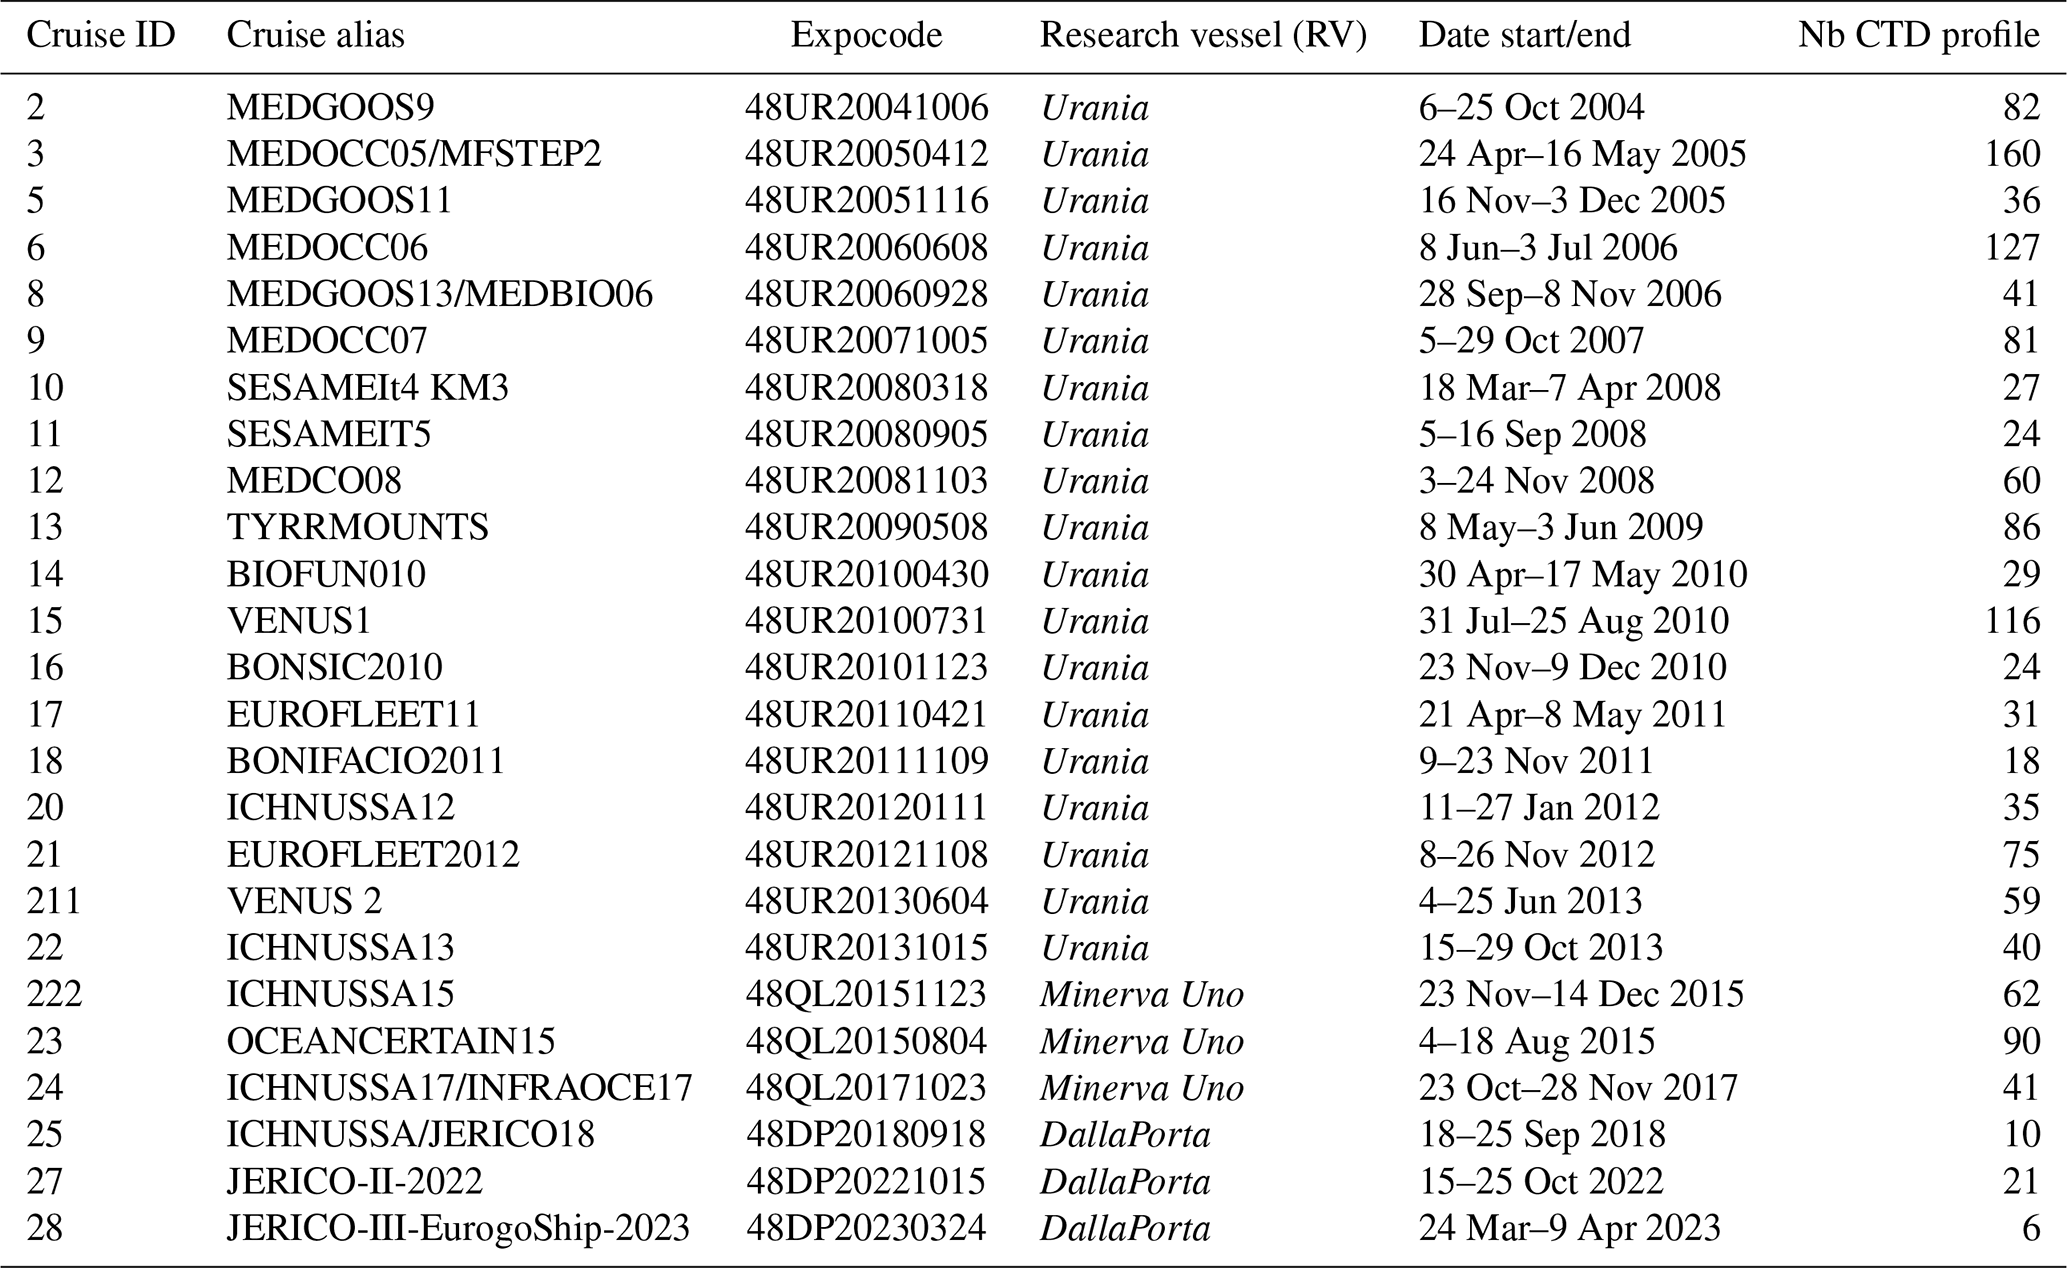
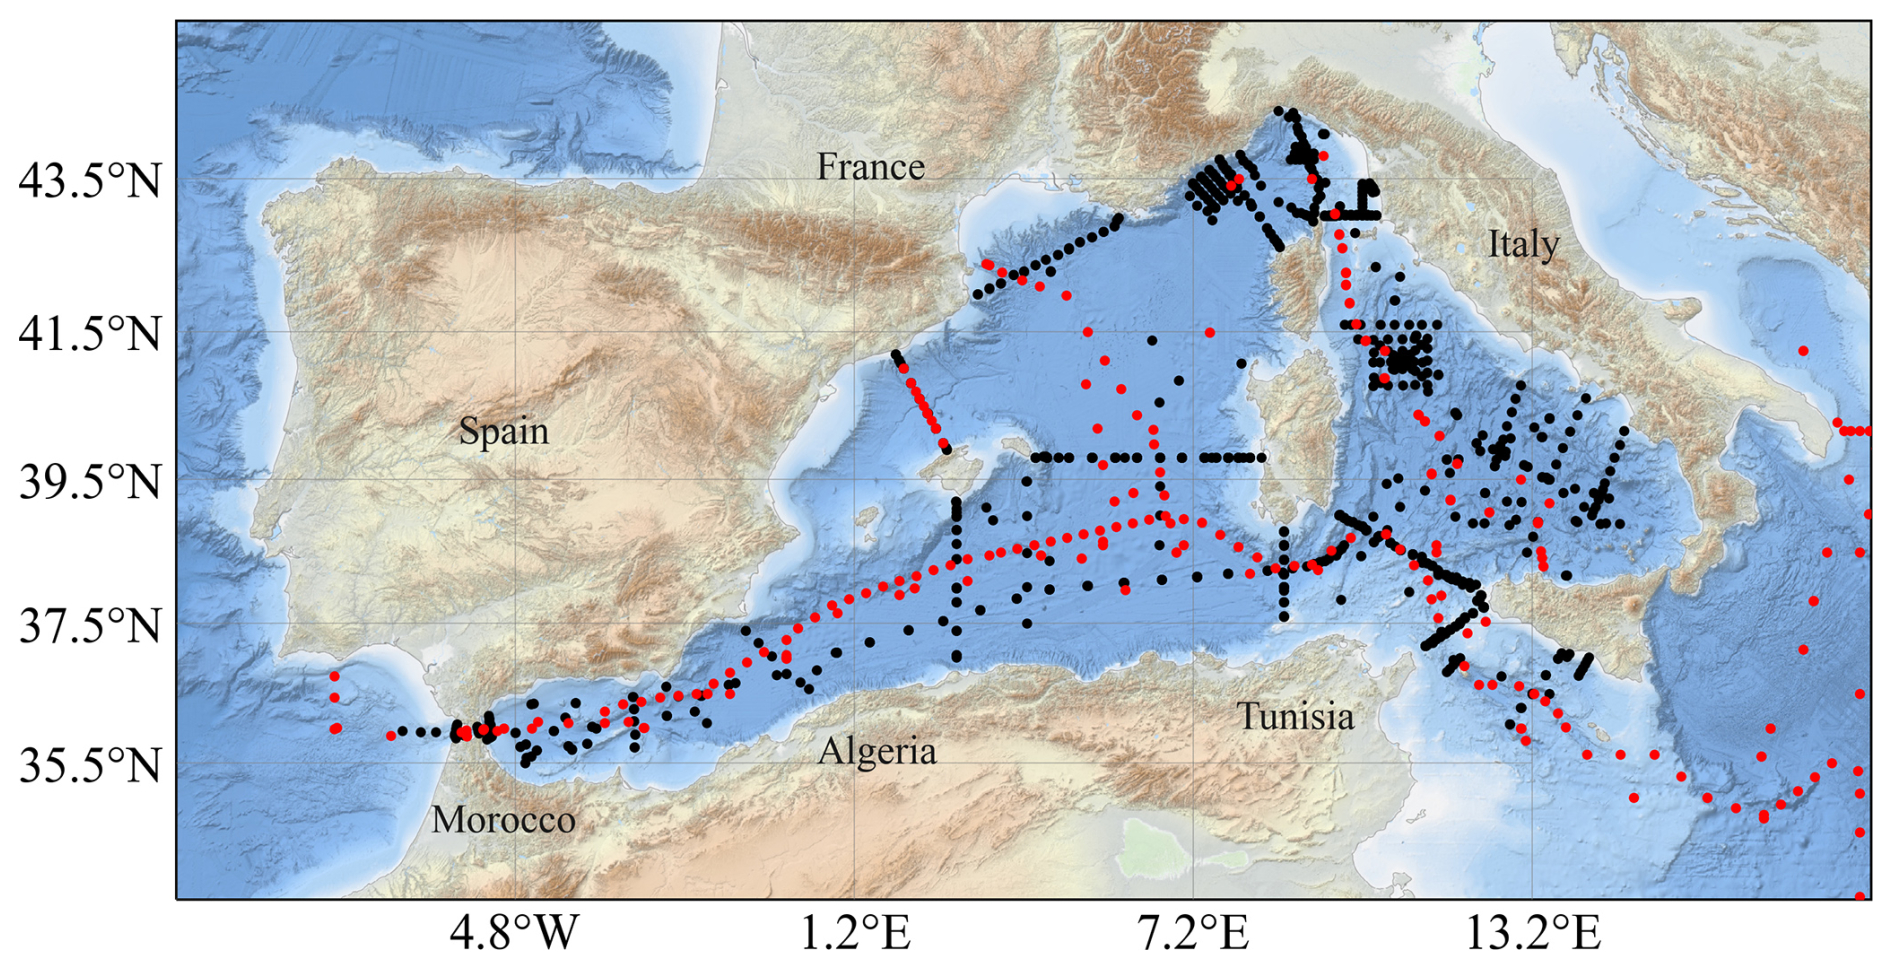
Figure 1Spatial distribution of cruise stations with CTD oxygen data (black dots) in the CTD-O2WMED dataset. The red markers indicate stations (discrete Winkler measurements) from the reference dataset.
Spanning the period from 2004 to 2023, the dataset provides robust temporal coverage, particularly from 2004 to 2015 (see Fig. 2a). Notably, the years 2005, 2006, 2010, and 2012 comprise the highest number of CTD stations, coinciding with monthly surveys (Fig. 2). While the temporal distribution remains consistent between 2004 and 2015 (except for 2014), the number of sampled stations decreases significantly after 2016.
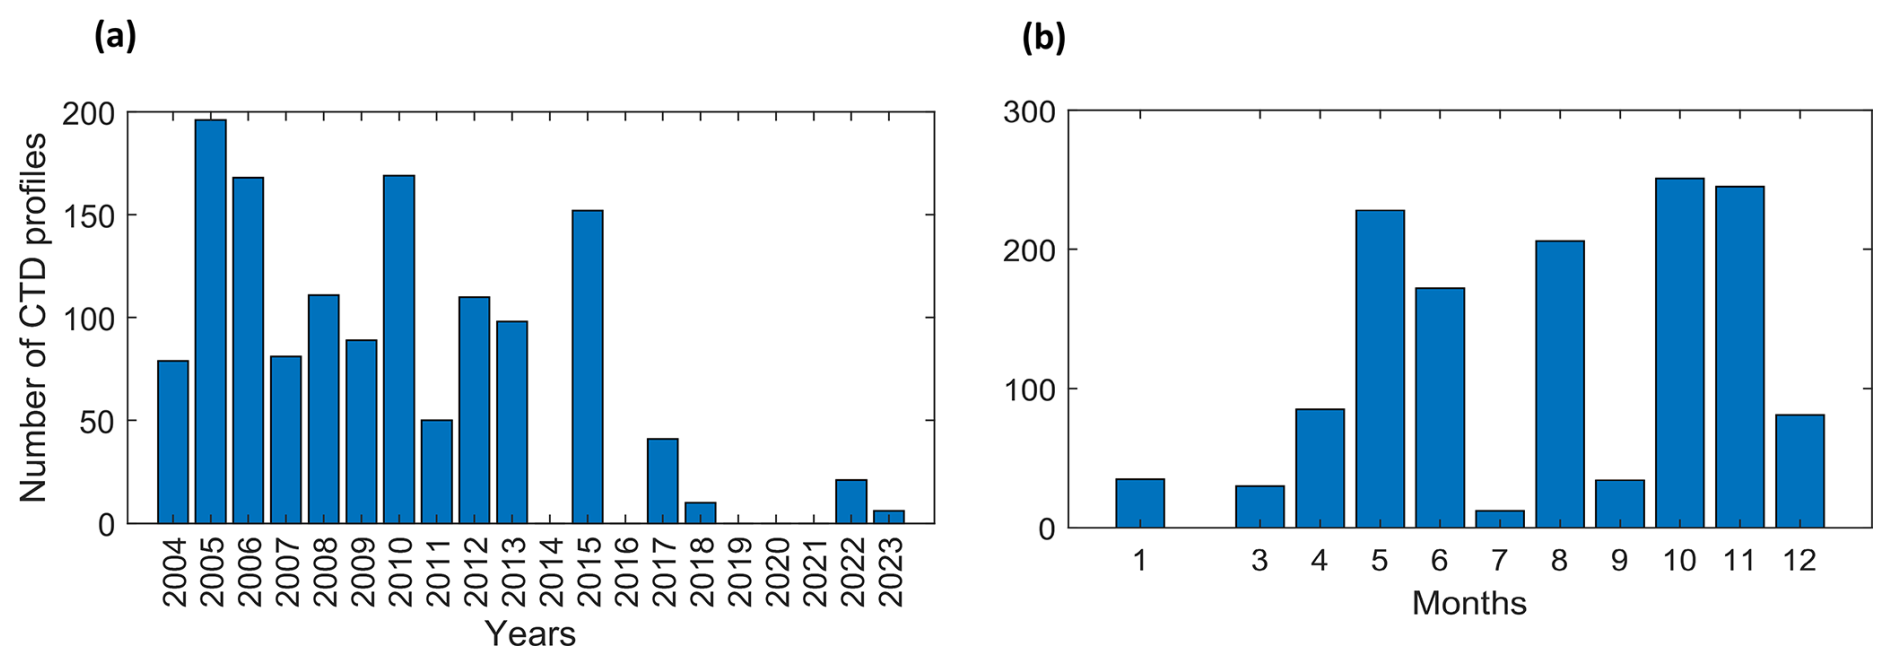
Figure 2Temporal information about CTD-O2WMED profiles: (a) annual and (b) monthly distributions.
2.2 Assessment of CTD-O2 post-calibration
CTD-O2, which stands for sensor-based dissolved oxygen, was measured using Sea-Bird SBE43 sensors mounted on the CTD rosette frame. For each cruise, all variables were checked and converted to standard units to ensure uniformity. Dissolved oxygen was the converted from milliliters per liter (mL L−1) to micromoles per kilogram (µmol kg−1) using potential density and the conversion factor 44.66 µmol O2 L−1, ensuring consistency across datasets. In addition, discrete samples collected at various depths from Niskin bottles were analyzed via Winkler titration on board. This dataset focuses exclusively on CTD sensor data, so the discrete data are not included in the final product.
The Gibbs Sea Water (GSW) toolbox (https://www.teos-10.org/pubs/gsw/html/gsw_contents.html, last access: June 2024) was used to compute conservative temperature (CT), absolute salinity (SA), and potential density to provide an accurate representation of seawater properties during the first quality check process.
In the second step, the CTD-O2 data from cruises listed in Table 1 were post-calibrated using Winkler discrete data following standard protocols (Grasshoff et al., 1983, 1999; Langdon, 2010) and accounting for sensor drift and hysteresis in line with the procedures by Janzen et al. (2007) and Uchida et al. (2010). We followed the Sea-Bird Electronics Application Note 64-2 (SBE 43 DO Sensor calibration and data correction, https://www.seabird.com, last access: January 2024). Residuals between the Winkler (O2 bottle) and sensor CTD (O2 sensor) measurements, matched based on pressure, were evaluated after post-calibration, following Uchida et al. (2010) (Fig. 3). When more than one SBE43 sensor was deployed during a cruise, the sensor with the lowest residuals relative to Winkler samples was used in the further assessment.
Figure 3a shows the residuals (O2 bottle – O2 sensor) plotted against pressure, with cruises color-coded by start date. Differences of up to ±10 µmol kg−1 are observed especially in the upper 800 dbars. Figure 3b summarizes residual distributions for each cruise using whisker plots, where it is easy to identify cruises with high variability (standard deviation of the mean residual >7 µmol kg−1): 48UR20041006, 48UR20050412, 48UR20080905, and 48QL20171023. For cruise 48UR20080905, only five Winkler samples were available, which limited the post-calibration quality. In cruise 48UR20050412, which comprised two legs, discrete samples from only one leg were used for the entire cruise calibration, further affecting quality of the CTD-O2 data. Figure 3c summarizes the cruise-level agreement using mean residuals and the percentage of residual values within ±2 µmol kg−1. Following Uchida et al. (2010), residuals within this threshold are considered acceptable. Cruises were categorized as follows: green encompass ≥40 % of residuals within ±2 µmol kg−1 (good agreement), blue 19 %–39 % of residuals within ±2 µmol kg−1 (moderate or uncertain agreement), and gray <19 % of residuals within ±2 µmol kg−1 (poor agreement and probably systematic bias in CTD-O2 data). 8 cruises showed good agreement, 11 were moderate, and the remainder exhibited systematic positive or negative biases, as pointed to by the mean value of the residuals (Fig. 3c). These deviations may reflect sensor drift, post-calibration issues, or bottle-handling errors.
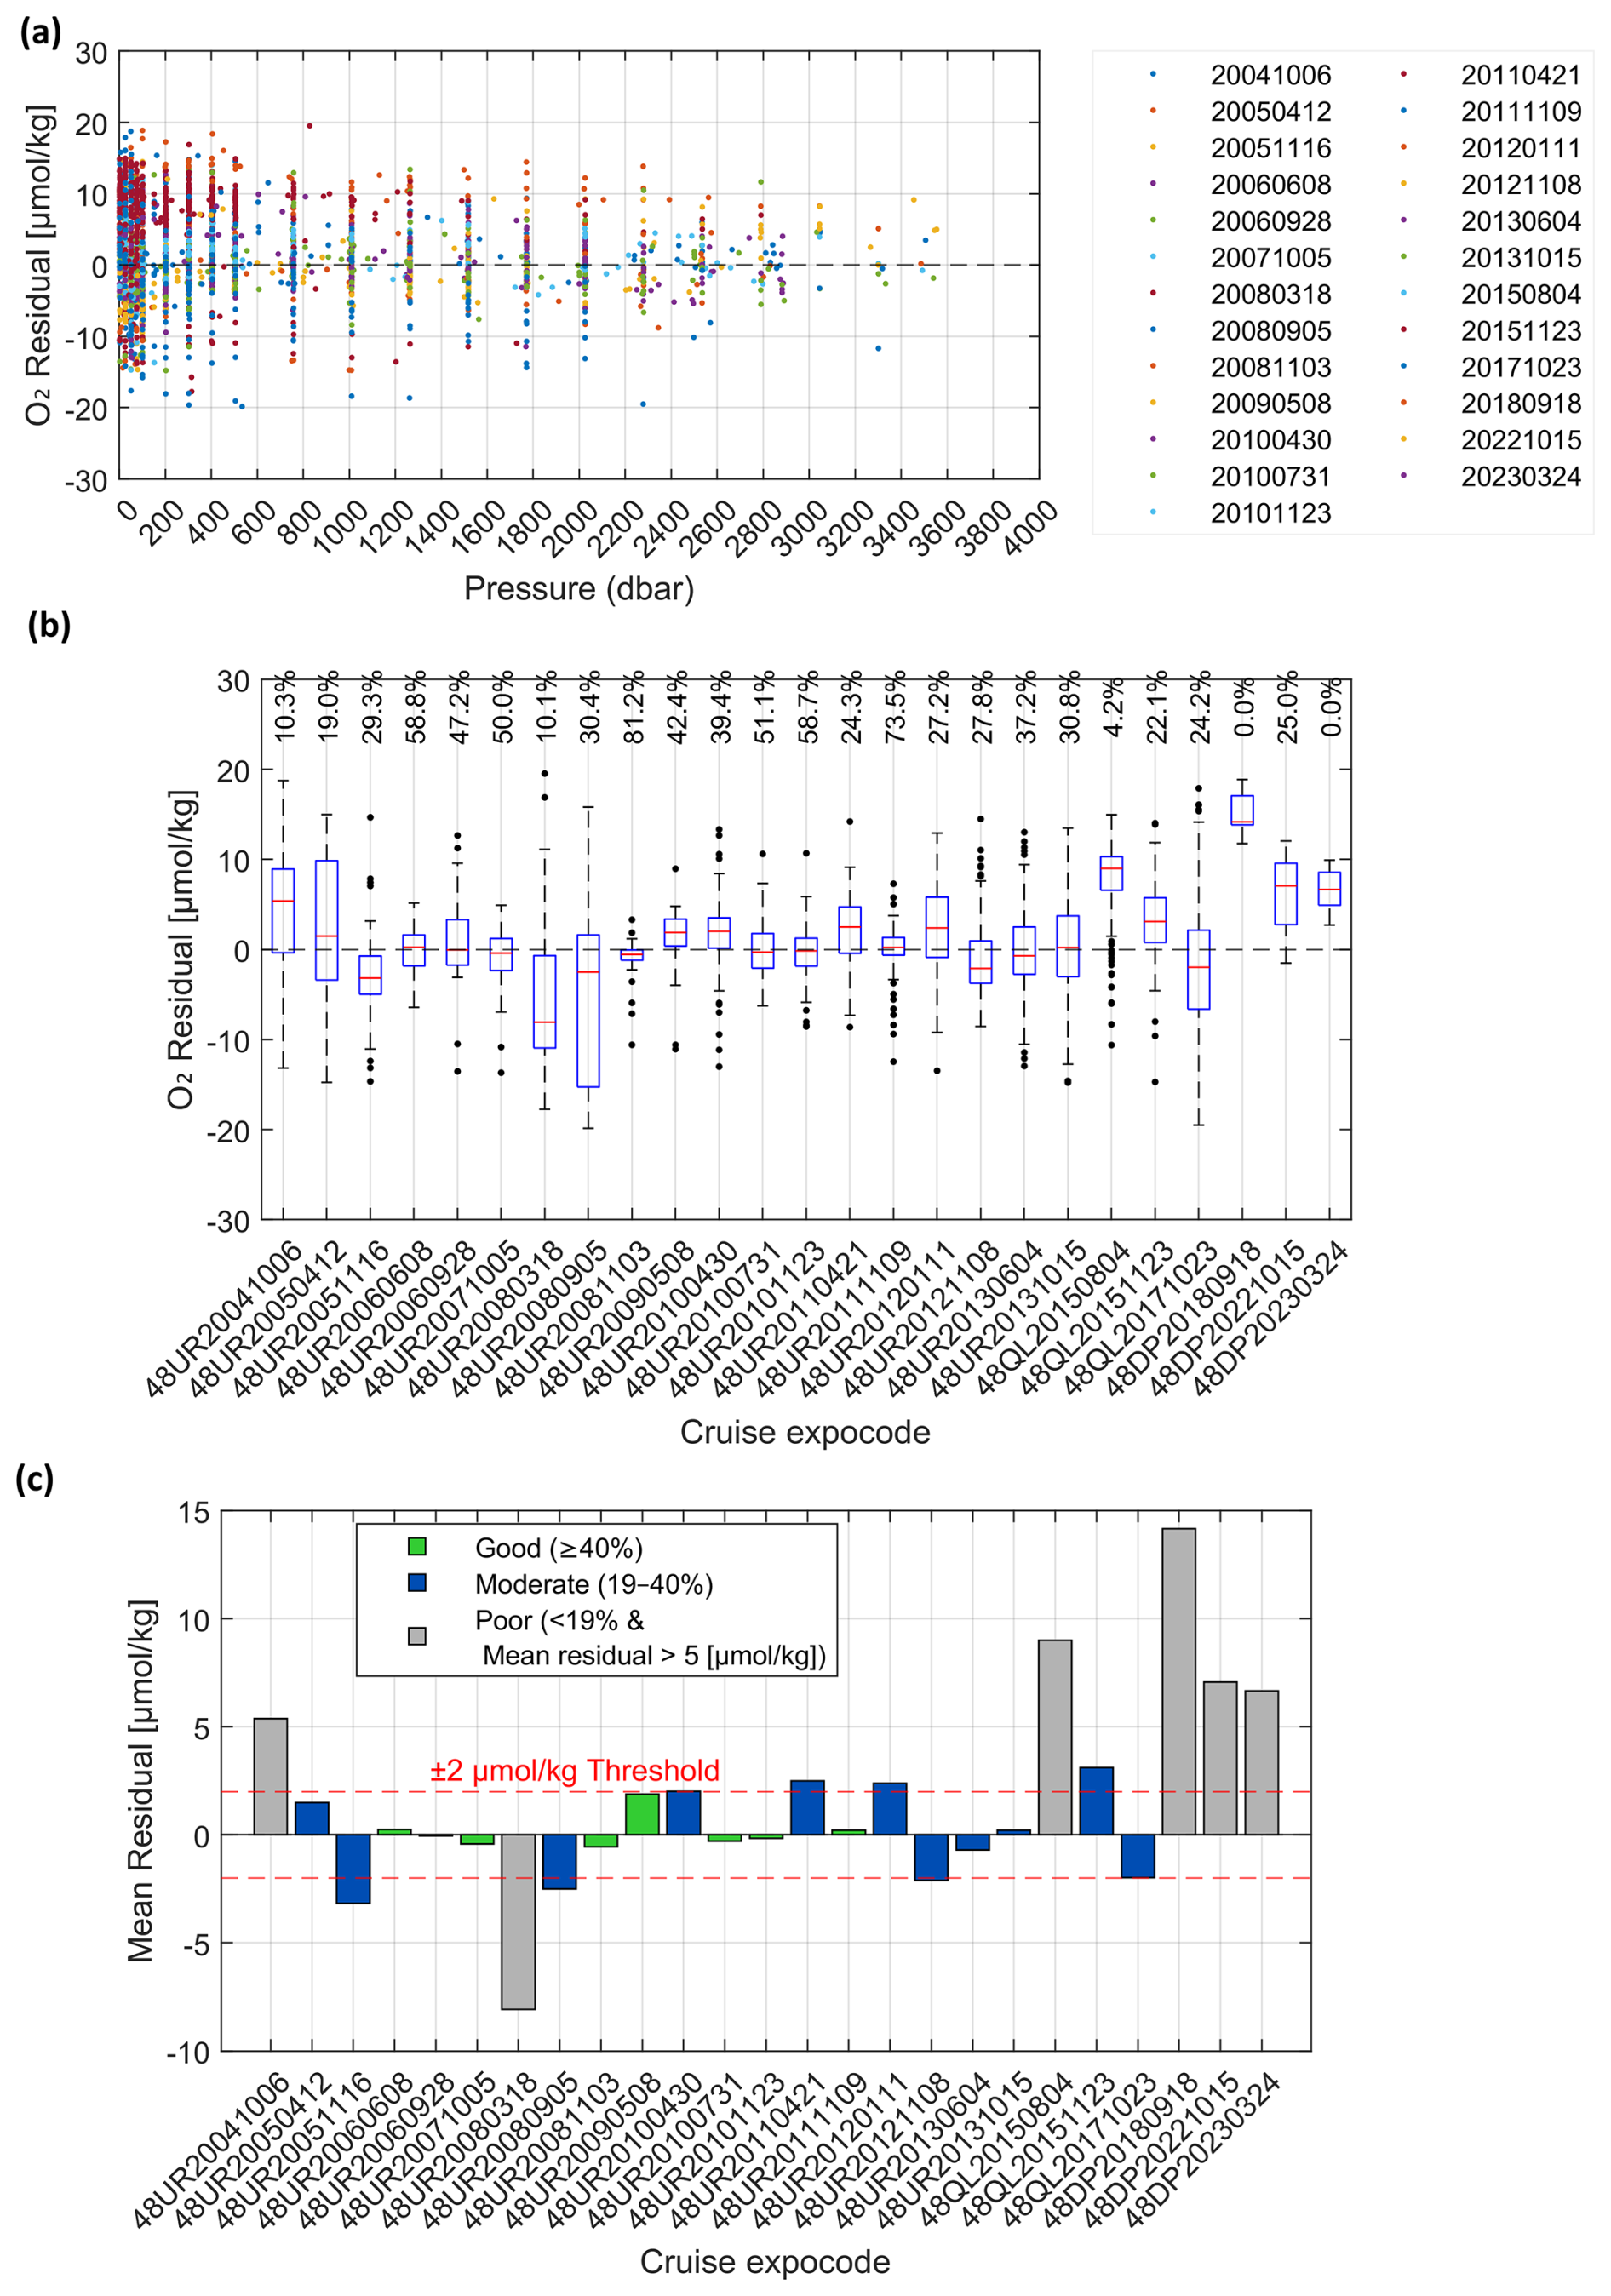
Figure 3Residual values by cruise, showing the difference between CTD oxygen data (O2 sensor) and Winkler oxygen data (O2 bottle) (a) against pressure with each cruise identified with the starting date; (b) whisker plot with additional information about the % of data with residual values within ±2 µmol kg−1 for each cruise identified with the expocode; and (c) general assessment of each cruise, identified with the expocode, depending on the value of the mean residual and the % of residual values within ±2 µmol kg−1.
3.1 Reference cruises with Winkler dissolved oxygen data in the WMED
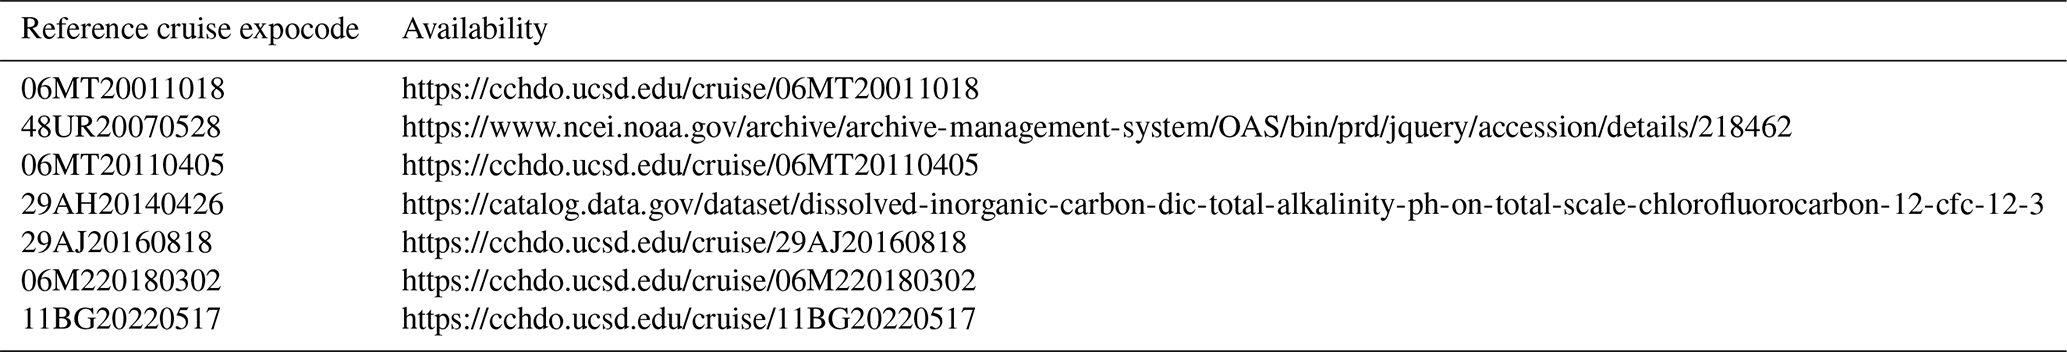
An external reference dataset for dissolved oxygen discrete measurements was used to compare the CNR CTD-O2WMED data. Discrete Winkler measurements on those reference cruises (Table 2, Fig. 4) were performed following the GO-SHIP (Global Ocean Ship-Based Hydrographic Investigations Program) protocol ensuring robust O2 data quality to better than 1 µmol kg−1 (Langdon, 2010). Among these reference, cruises 06MT20011018 and 06MT20110405 (Hainbucher et al., 2014) are significant surveys, contributing to the GLODAPv2 data product (Olsen et al., 2016, 2020). They underwent full quality control with no bias correction applied to the original data. Similarly, cruises 48UR20070528, 29AH20140426, and 06M220180302, which are being assembled into the consistent carbon and ancillary dataset CARIMED (CARbon, tracer, and ancillary data in the MEDsea; Álvarez et al., 2019), have been rigorously quality controlled. Cruises 29AJ20160818 and 11BG20220517 conducted in 2016 and 2022 (Tanhua, 2019a, b; Jullion, 2016; Schroeder, 2022; Schroeder et al., 2024) followed GO-SHIP protocols under the Med-SHIP (Mediterranean Sea repeat hydrography) framework, which emphasizes the collection of high-quality hydrographic and biogeochemical data for long-term climate studies (Schroeder et al., 2015, 2024). These seven reference cruises were selected based on data quality and geographic overlap with the CTD-O2WMED dataset. Figures 1 and 5 show the regional distribution of the reference data, which aligns well with the CTD-O2WMED cruise tracks, particularly in the Tyrrhenian Sea and Algerian Basin, which are the two most frequently sampled subregions.
Table 2Overview of reference cruise datasets with high-quality Winkler oxygen measurements, including expocode. The dataset covers the period from 2001 to 2022.
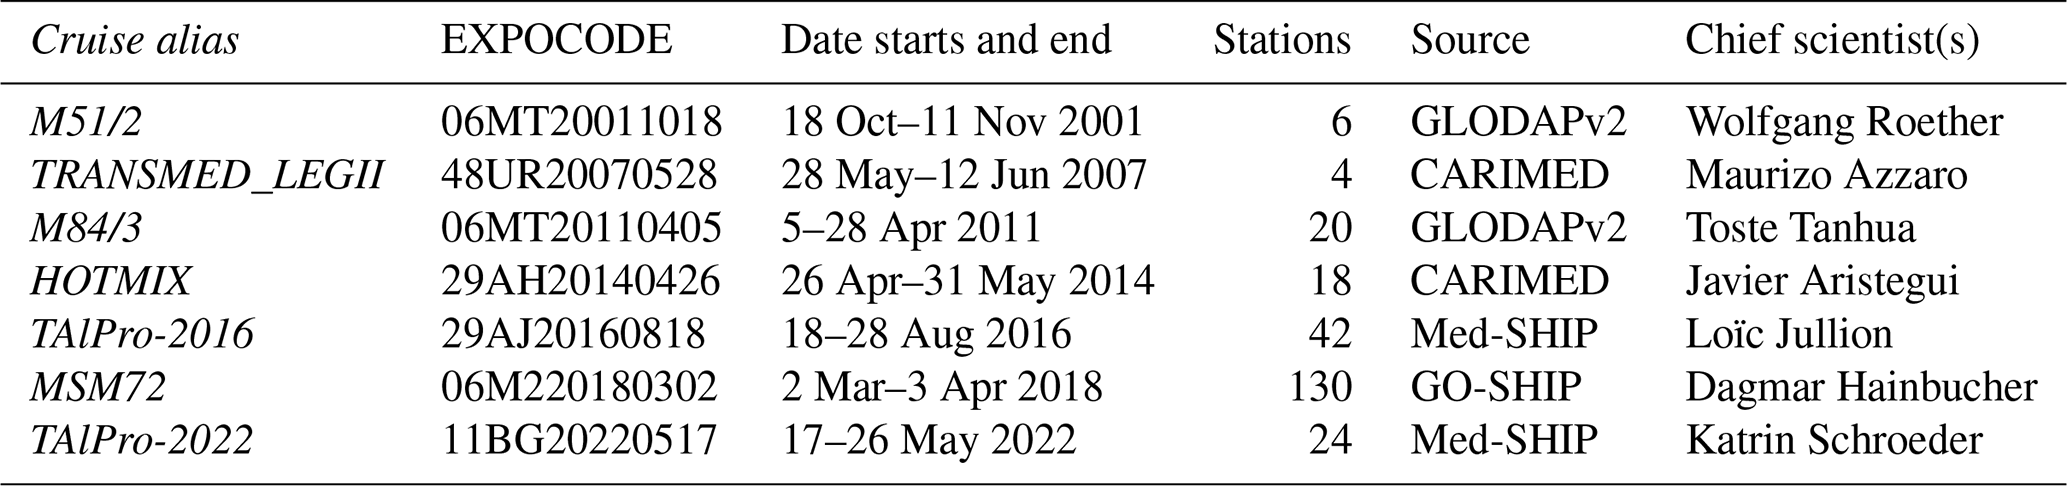
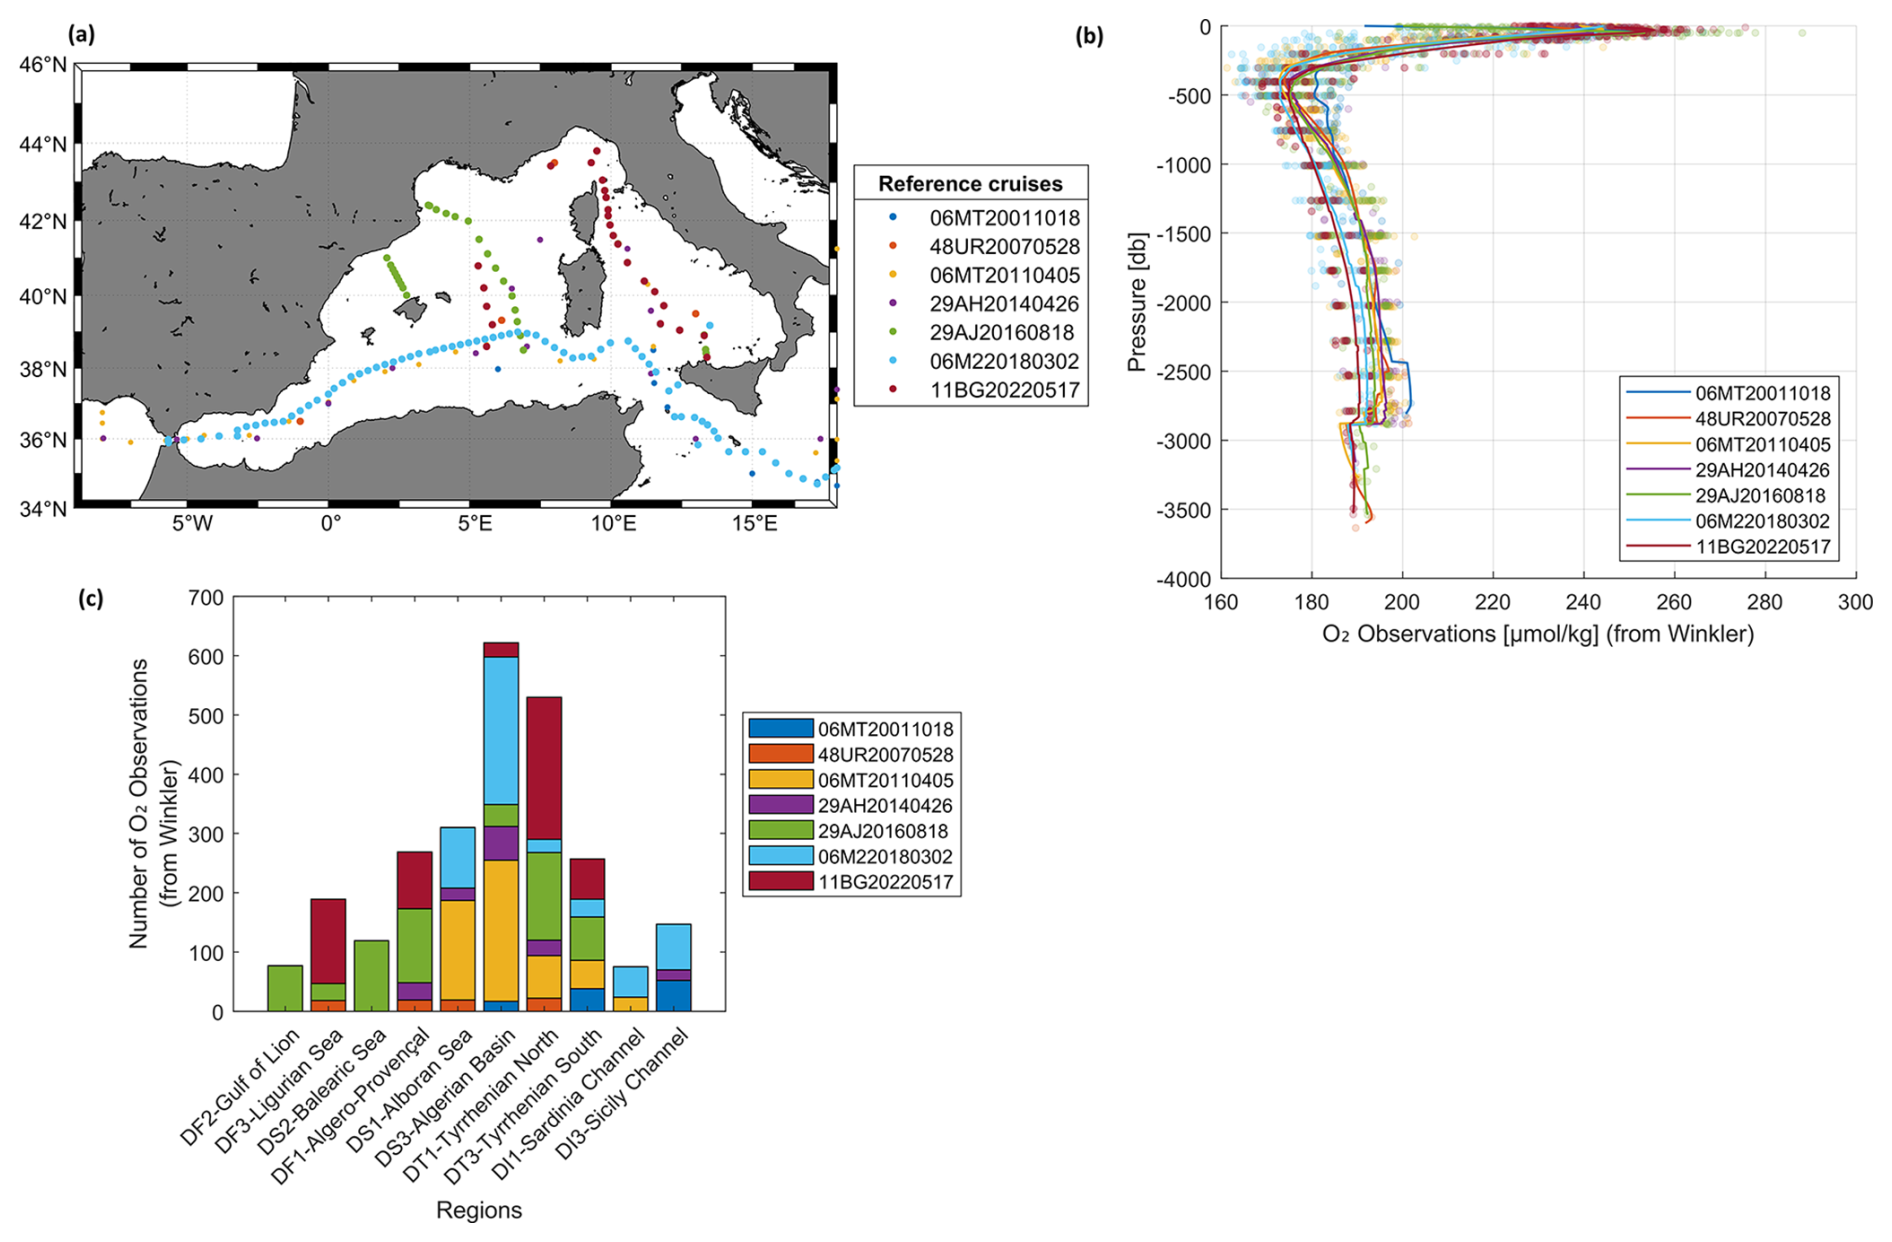
Figure 4Reference cruises: (a) map showing the location of reference stations; (b) vertical distribution of dissolved oxygen data from Winkler measurements, including the mean profile across all reference cruises; and (c) number of reference oxygen observations (Winkler measurements) per region.
3.2 Primary quality control of CTD-O2 data
Following unit conversion and post-calibration with Winkler measurements (Sect. 2.2), each cruise underwent an outlier screening process. Data quality flags were assigned following the World Ocean Circulation Experiment (WOCE) standards: flag 2 for acceptable values, flag 3 for questionable values, flag 4 for bad values, and flag 9 for missing or not measured data. Flagging was tailored to the expected accuracy and precision of CTD-O2 data for each individual cruise, which depends on the available measurements for Winkler oxygen and the stability of the CTD-O2 sensor. Note that metadata information was scarce for some cruises. Property–property plots was analyzed for each region, and CTD-O2 values identified as outliers in multiple plots were flagged as questionable. Approximately 0.2 % of the CTD-O2 data were flagged as outliers (flag 3). The first QC is inherently subjective, relying on the expertise of the analyst reviewing the data.
3.3 Overview and first assessment on CTD-O2 WMED data
To illustrate the regional oxygen distribution, Fig. 5a presents the vertical CTD-O2WMED profiles by pressure across 10 WMED subregions defined in Fig. 5b according to Manca et al. (2004). Gray lines show the full dataset, while blue lines indicate the range of oxygen concentrations in each subregion, revealing clear spatial and vertical patterns. The vertical distribution of dissolved oxygen in the WMED reflects a balance between air–sea gas exchange, biological activity, and regional circulation. Surface concentrations remain near atmospheric saturation due to gas exchange and photosynthesis activity. As organic matter sinks and is remineralized, oxygen is consumed at depth, generating vertical gradients. Unlike other ocean basins where pronounced OMZs develop, the WMED remain relatively well oxygenated thanks to episodic deep convection in the Gulf of Lion. This process ventilates the WMDW, which then spreads across subregions including the Algerian Basin and Ligurian Sea, known to be among the best-ventilated areas (Schneider et al., 2014).
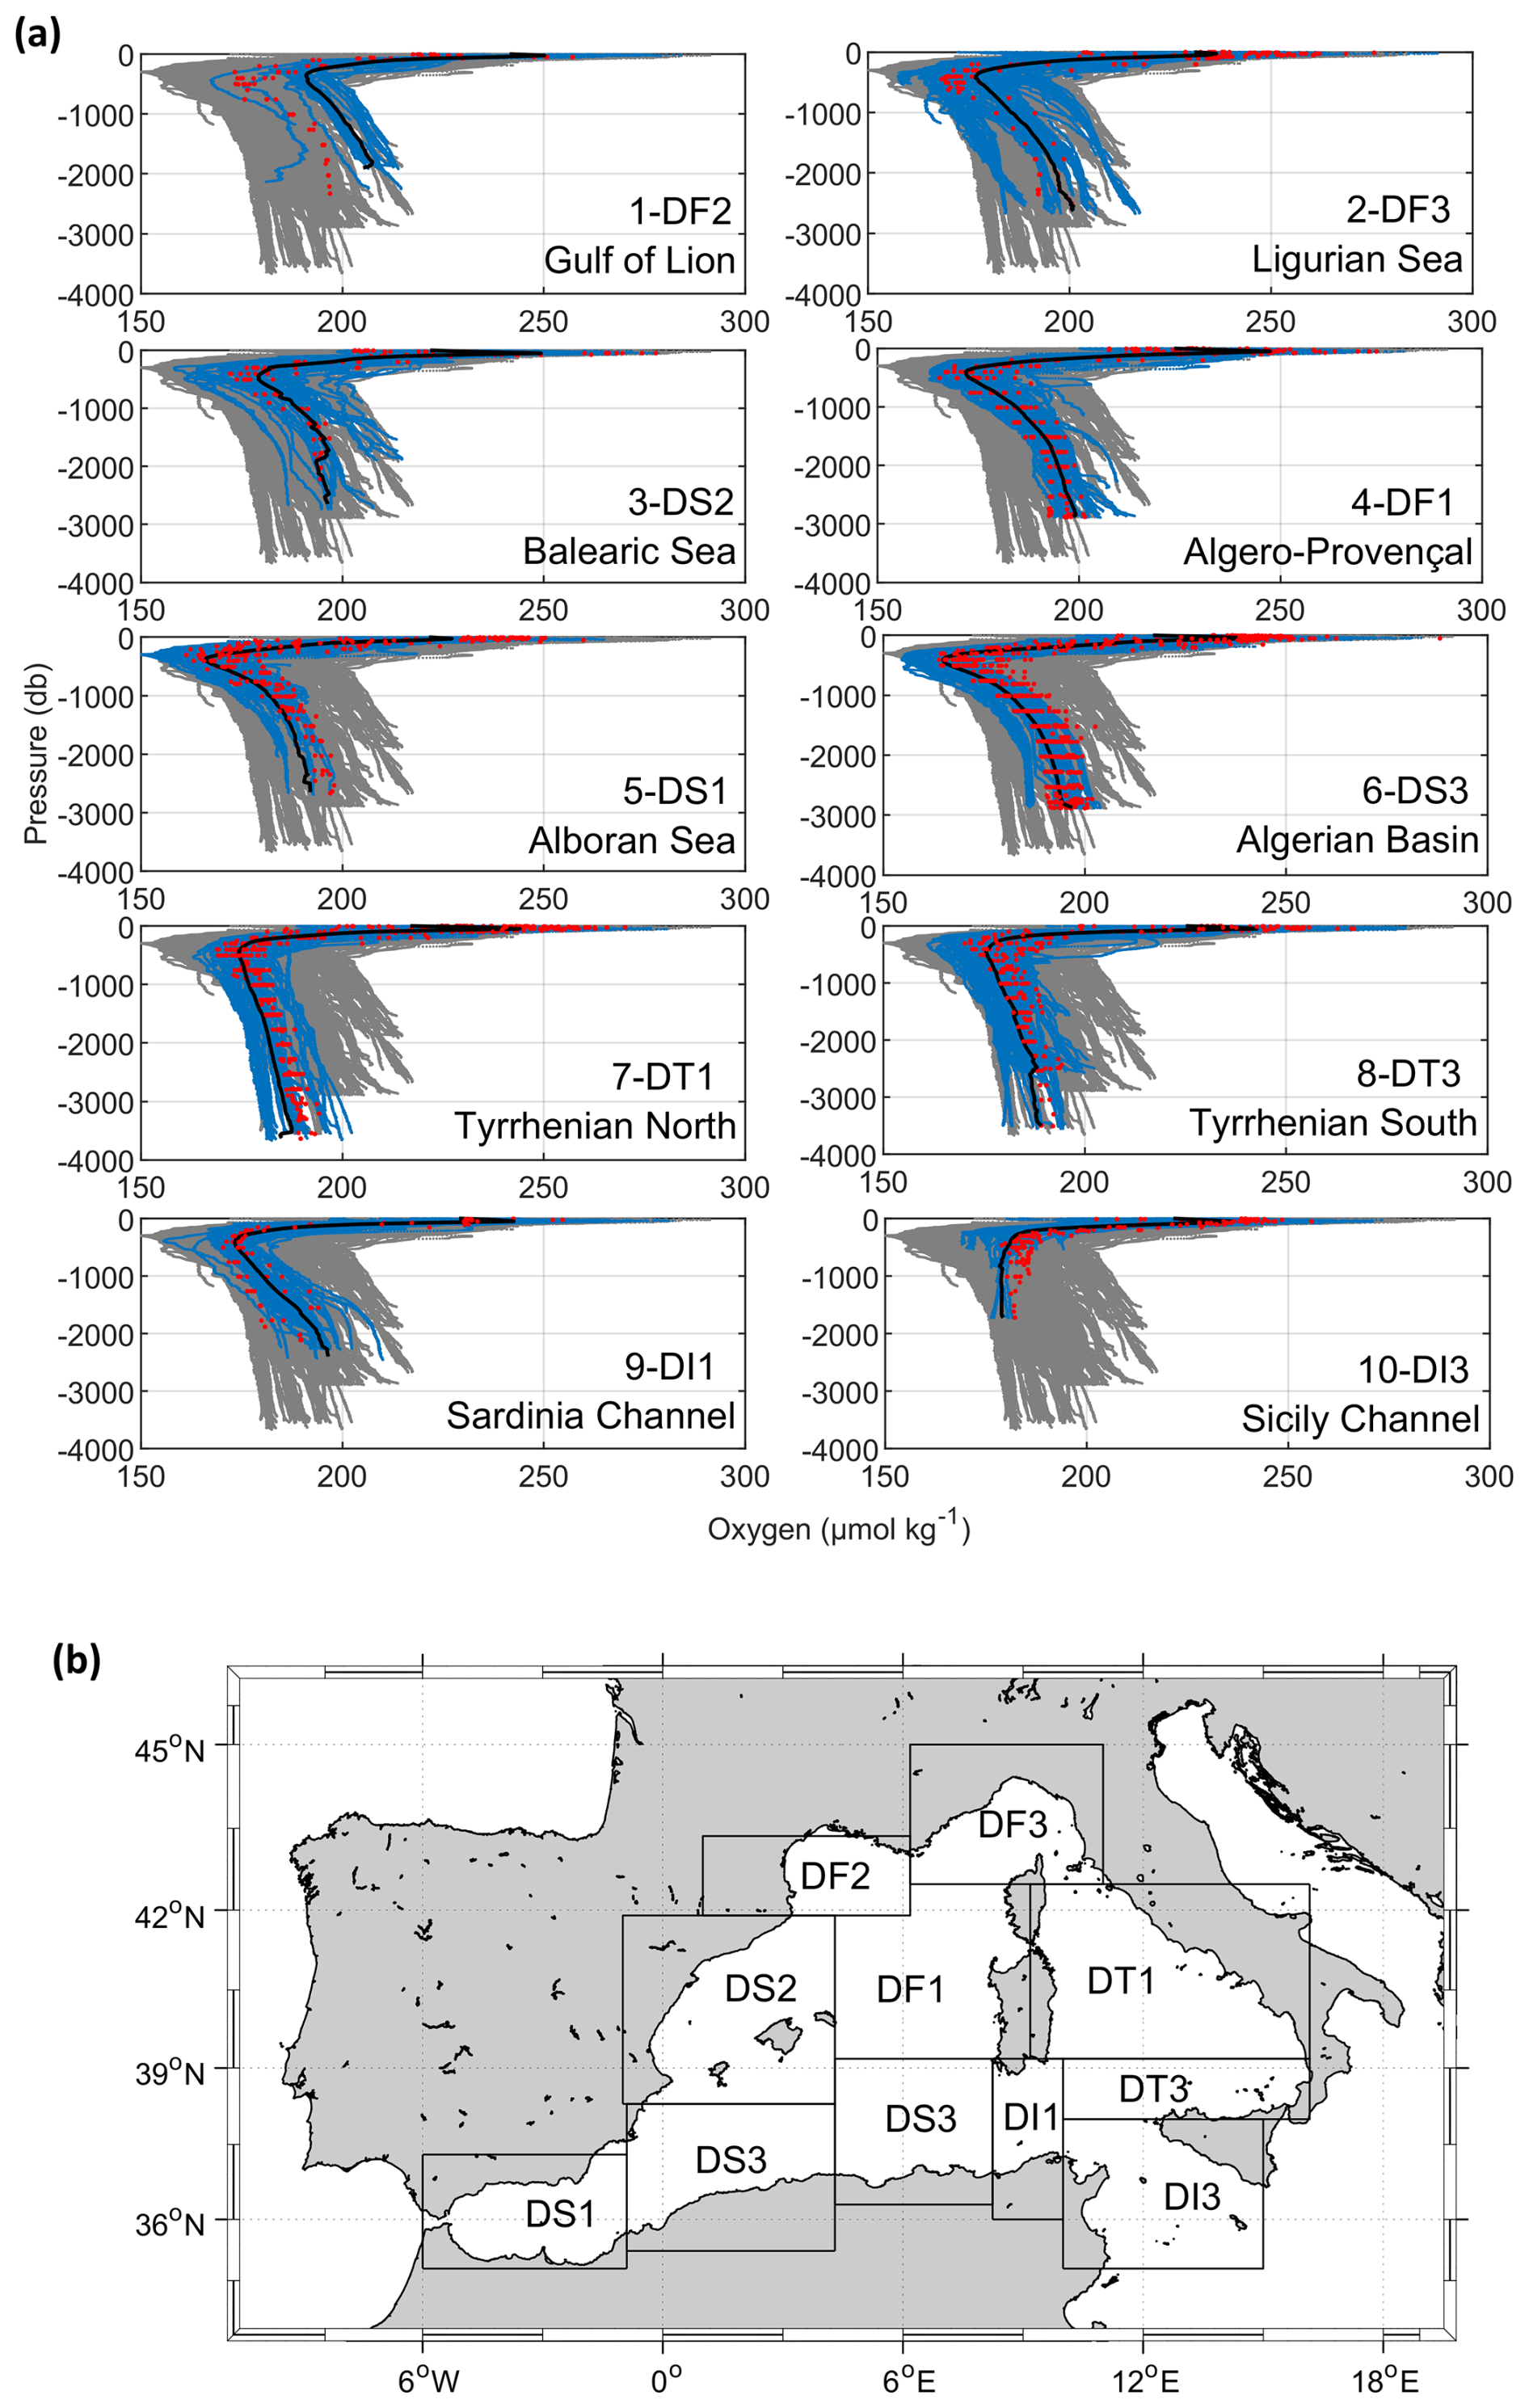
Figure 5(a) Vertical distribution of CTD-O2 (µmol kg−1) versus pressure across the WMED. Gray profiles represent individual stations from the full dataset after initial quality control (first QC). Blue shading shows the oxygen concentration envelope within each subregion (see Table S2), while black lines indicate the subregional mean profiles averaged over the entire period. Red dots represent selected reference profiles used for comparative analysis. (b) Map showing the geographic boundaries of the MEDAR/MEDATLAS subregions used in this study (see Table S2), adapted from Manca et al. (2004).
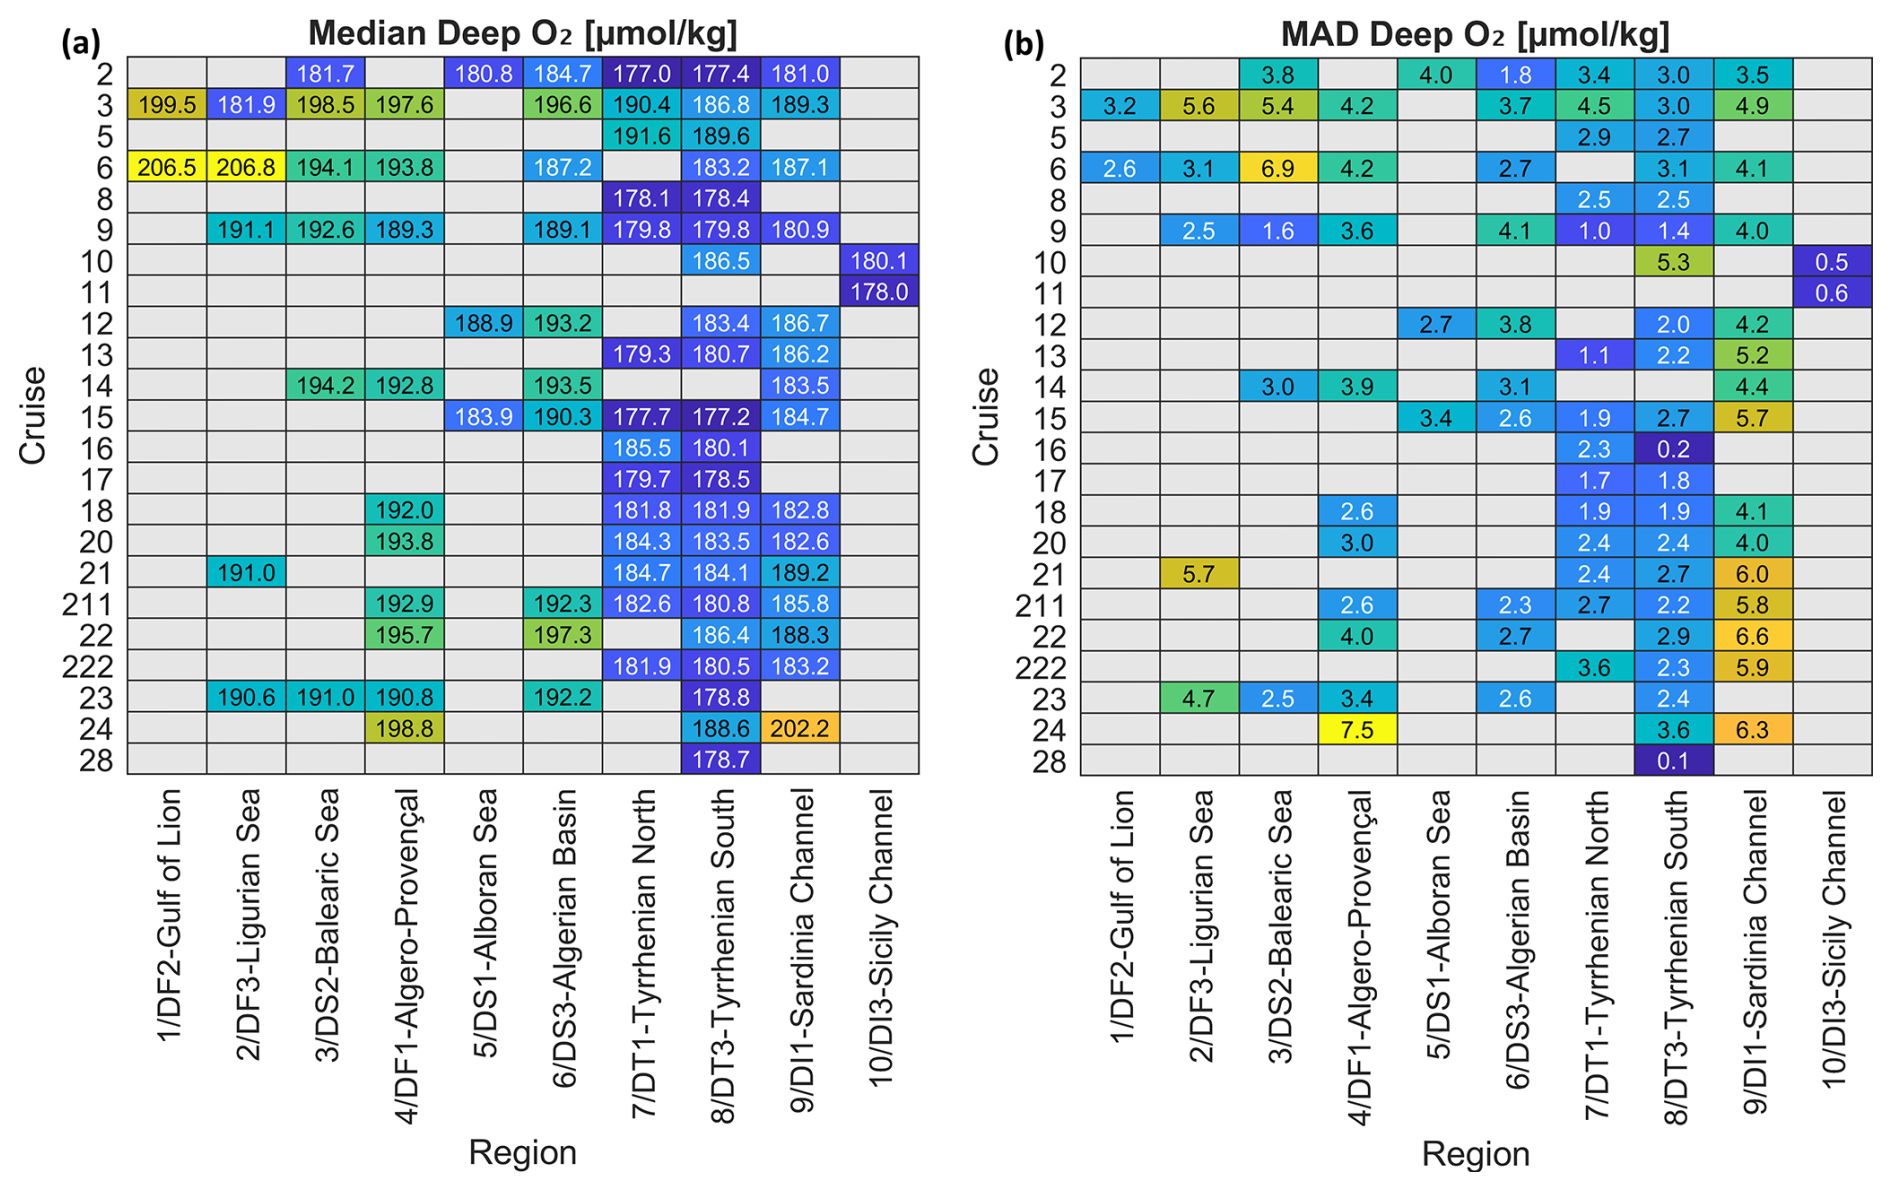
Figure 6Median and median absolute deviation (MAD) of CTD-O2WMED flagged as good data deeper than 800 dbar. Heatmaps show the (a) median and (b) MAD values organized by cruise ID (rows) (Table 1) and geographic subregion (Fig. 5) (columns). Gray cells indicate missing data. Theses metrics enable intercomparison of deep oxygen distribution and data quality across the CTD-O2WMED dataset (Table S3). The color gradient, blue to green to yellow, indicates low to high values.
In the WMED, a recurrent feature is the intermediate OML, typically found between 300 and 600 db. This layer coincides with the core of the Eastern Intermediate Water (EIW), which is warmer, saltier, and consistently lower in oxygen than surrounding waters (Tanhua et al., 2013; Coppola et al., 2018; Mavropoulou, 2020). The OML's depth, thickness, and intensity vary by region and year, depending on remineralization rates, mixing, and circulation (Coppola et al., 2018). In the Tyrrhenian subregion (DT3, DT1), the oxygen increases again below the OML, suggesting the influence of deeper, more oxygenated waters. In contrast, the lowest oxygen levels in the WMED are found in the Sicily Channel (DI3) and Tyrrhenian Sea (DT3, DT1), where the EIW is prominent and deep ventilation is absent. The Alboran (DS1) and Balearic (DS2) seas, by contrast, show relatively well oxygenated profiles throughout the water column. This reflects both the presence of WMDW and enhanced vertical transport due to mesoscale and the submesoscale processes that facilitate the downward movement of oxygen-rich surface waters (Middleton et al., 2025).
In order to assess the internal consistency and precision of the CTD-O2WMED data across CNR cruises, we computed for each cruise the median and median absolute deviation (MAD) of deep oxygen values flagged as good (depth >800 dbar, see Fig. 6 and Table S3). This approach minimizes the influence of atmospheric forcing, mesoscale variability, and residual outliers. Figure 6a illustrates the spatial variability in deep-water oxygen concentrations across the WMED. A pronounced east–west gradient is evident, with lower oxygen levels (blue tones) in eastern subregions such as the Tyrrhenian Sea, Sardinia Channel and Sicily Channel, and higher oxygen levels (green to yellow) in western regions, where deep convection processes in the Gulf of Lion enhance ventilation. The MAD was used as a proxy for precision, and overall MAD values ranged from 0.1 to 7.5 µmol kg−1. In well-sampled subregions (≥5 cruises) high MAD values or anomalous medians were used to identify potentially biased CTD-O2 cruises.
Table 3Summary of CTD-O2 quality control results by subregion.
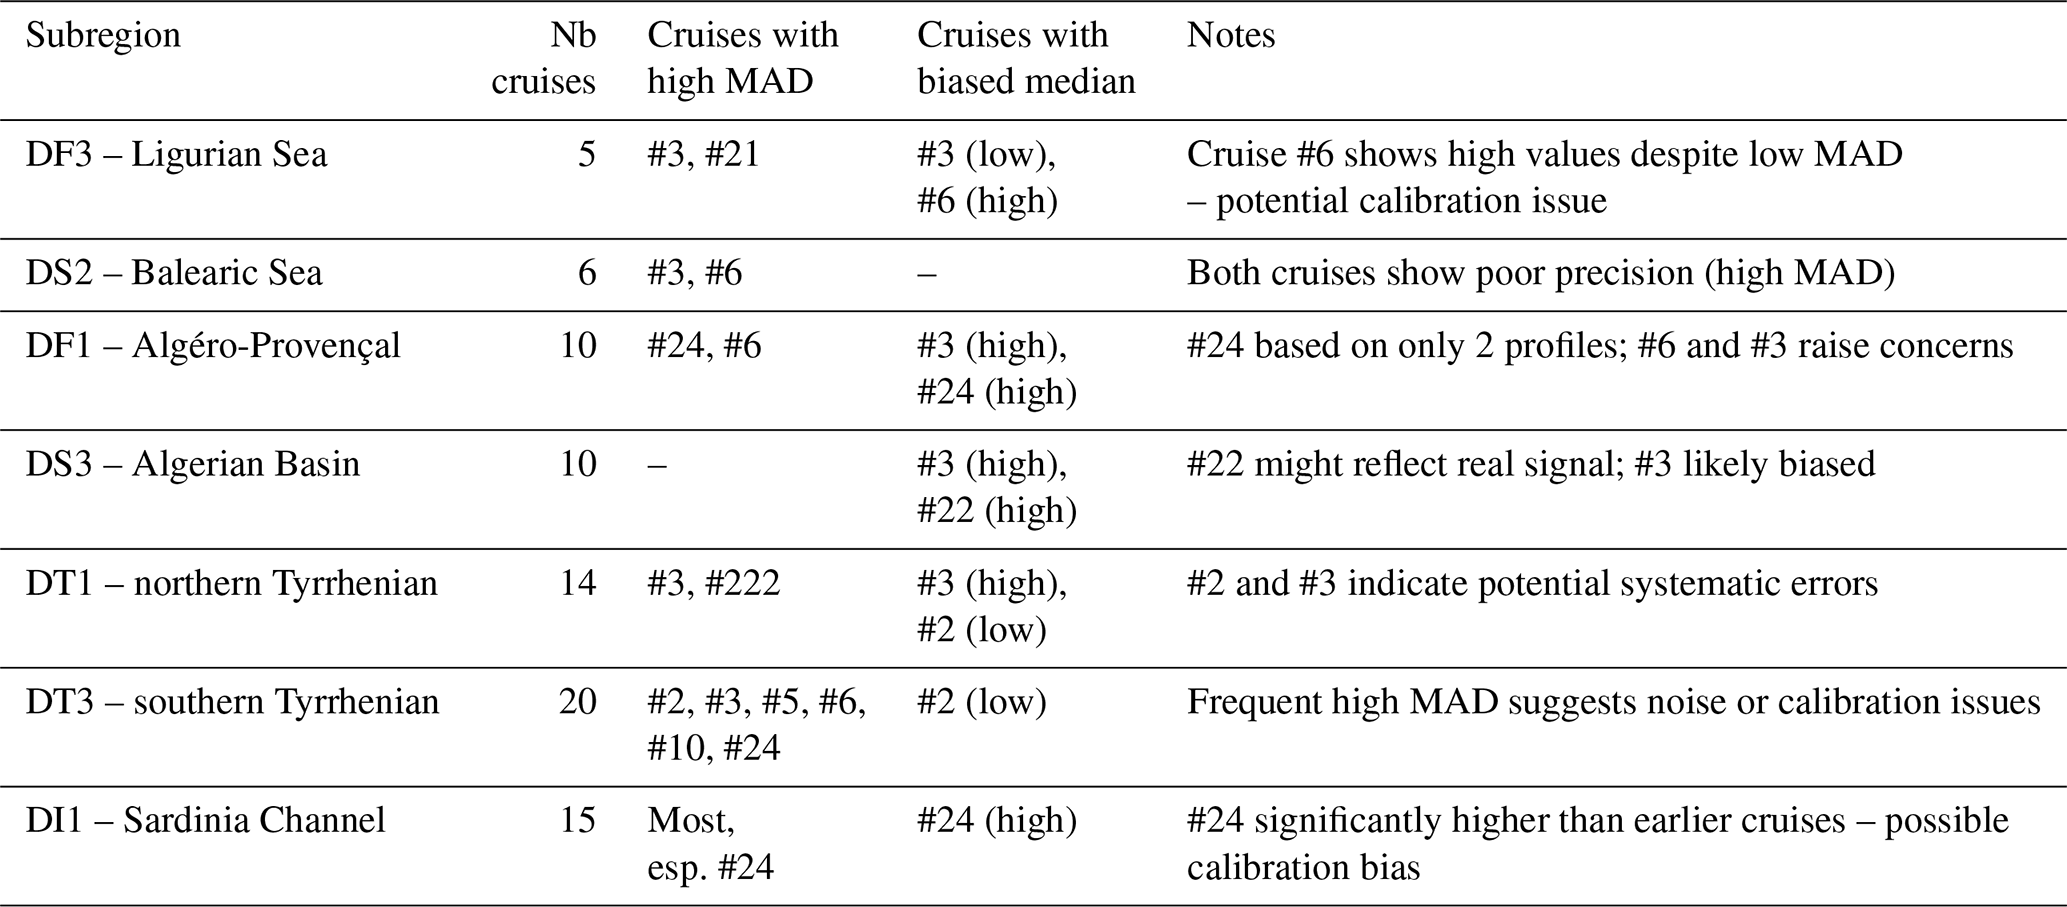
Below we summarize the findings by subregion:
-
Ligurian Sea (DF3): of the five cruises, cruise #3 (48UR20050412) and #21 (48UR20121108) had the highest MAD. Cruise #2 (48UR20041006) had a median consistent with the others, but that of cruise #3 was ∼10 µmol kg−1 lower, and that of cruise #6 was 16 µmol kg−1 higher despite a low MAD, suggesting possible bias or calibration errors.
-
Balearic Sea (DS2): among the six cruises, all but cruises #3 (48UR20050412) and #6 (48UR20060608) showed low MAD values. Cruise #3 and #6 had MADs of 5.4 and 6.9 µmol kg−1, respectively, indicating lower precision.
-
Algéro-Provençal region (DF1): 10 cruises sampled this subregion. Cruise #24 (48QL20171023) showed the highest MAD (7.5 µmol kg−1) and the highest median but was based on only two profiles, which likely explains the high uncertainty. Cruise #3 again exhibited an anomalously high median (197.6 µmol kg−1), and cruise #6 (48UR20060608) had a notably high MAD of 4.2 µmol kg−1.
-
Algerian Basin (DS3): 10 cruises generally agreed well (MAD: 1.8–4.1 µmol kg−1). Cruise #22 (48UR20131015, carried out in 2013) had elevated oxygen concentrations that may reflect real increases in deep oxygen. In contrast, cruise #3 (48UR20050412, carried out in 2005) showed a regionally high median, suggesting possible data quality issues.
-
Northern Tyrrhenian (DT1): among 14 cruises, MAD ranged from 1 to 4.5 µmol kg−1. Cruises #3 (48UR20050412) and #222 (48QL20151123) had higher MAD values, with cruise #3 also showing a high median, while cruise #2 (48UR20041006) recorded the lowest deep oxygen concentrations.
-
Southern Tyrrhenian (DT3): the most frequently sampled region, with 20 cruises. MAD ranged from 0.1 and 5.3 µmol kg−1. Elevated MAD values were observed for cruises #2 (48UR20041006), #3 (48UR20050412), #5 (48UR20051116), #6 (48UR20060608), #10 (48UR20080318), and #24 (48QL20171023), suggesting increased noise in the profiles.
-
Sardinia Channel (DI1): 15 cruises generally had consistent medians, though MAD values were higher (3.5 to 6.5 µmol kg−1). Recent cruises, particularly cruise #24 (48QL20171023), showed the highest median (202.2±6.3 µmol kg−1), significantly higher than earlier cruises, possibly indicating calibration issues.
Following an approach adapted from Olsen et al. (2016), large MAD values combined with anomalous medians and limited spatial coverage were used to identify cruises with low internal precision and potential systematic biases:
-
Cruise #3 (48UR20050412), recurring multiple subregions, consistently showed high MAD or biased medians.
-
Cruise #6 (48UR20060608) displayed unusually high medians (e.g., in DF3) and high MAD in DS2 and DT3.
-
Cruise #24 (48QL20171023) (in DS3 and DT1) and cruise #22 (48UR20131015) exhibited elevated deep oxygen values and large MAD values, raising concerns about data quality or calibration.
-
Cruise #2 (48UR20041006) (in DT1 and DT3) and cruise #5 (48UR20051116) showed both low median and high MAD values, pointing to a possible systematic error.
To support the regional assessment of data quality, a summary table (Table 3) compiles the number of cruises per subregion, highlights those with high MAD, and identifies cruises exhibiting anomalous median values. This table facilitates the identification of cruises with potential CTD-O2 bias issues and helps assess the overall initial internal consistency of the CTD-O2 dataset across the WMED.
3.4 Secondary quality control procedure
The secondary quality control (second QC) procedure involves comparing the CTD-O2 data from CNR cruises (Table 1) with selected reference cruises (Table 2). These reference datasets are assumed to be accurate and precise with low temporal variability, particularly in the deep ocean. However, this assumption may not fully hold for recent cruises due to strong spatial gradients and potential long-term trends in dissolved oxygen concentrations in the Mediterranean Sea.
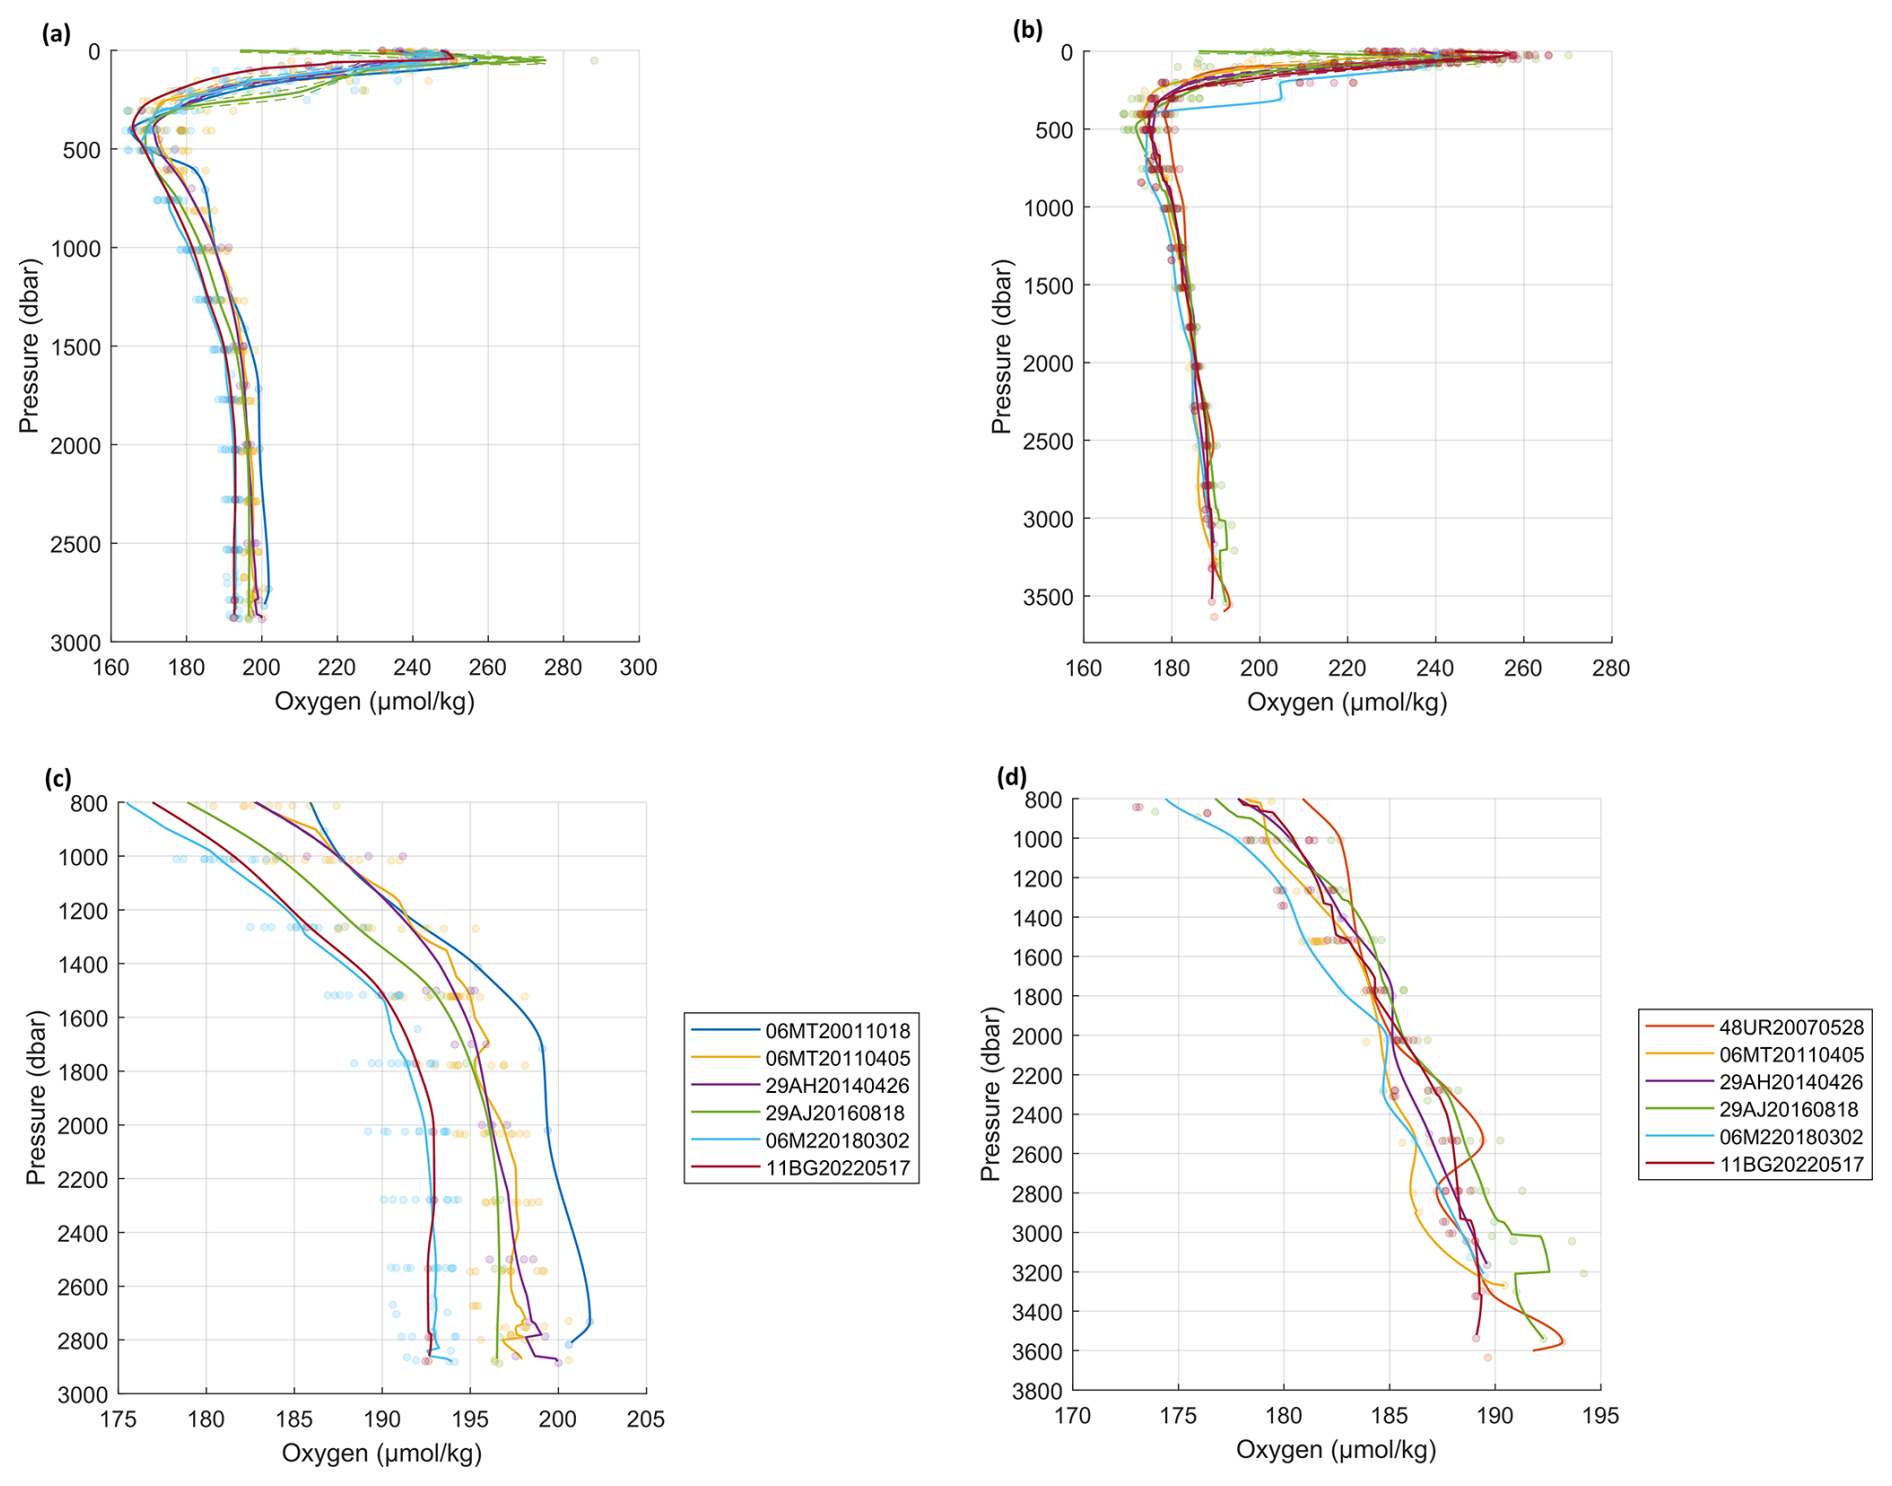
Figure 7Average vertical profiles of dissolved oxygen in (a) the Algerian Basin (region DS3) and (b) the Tyrrhenian Sea (region DT1). Panels (c) and (d) provide a zoomed-in view of the deep layers below 800 dbar. Colored dots represent discrete Winkler oxygen measurements, color-coded by cruise, while the solid-colored lines indicate cruise-specific mean profiles.
Global synthesis efforts like GLODAP (https://www.glodap.info, last access: June 2024) (Key et al., 2004; Olsen et al., 2016, 2019; Lauvset et al., 2024) and CARINA (Key et al., 2010) typically adopt a 1 % threshold in crossover analysis to identify measurement biases and ensure inter-cruise consistency for oxygen. However, applying this same threshold to the Mediterranean may not be appropriate due to its unique oceanographic variability. Here, we assess the validity of reference cruise data, determine appropriate consistency thresholds, and identify the most temporally stable depth range for the crossover analysis in the WMED.
3.4.1 Threshold limit for dissolved oxygen data in the WMED
GLODAP applies a consistency or threshold limit for O2 data of 1 % as commented previously. However, given the natural variability in the Mediterranean Sea deep waters, we first assessed the appropriate threshold for crossover analysis by comparing reference cruise data in two different regions, DS3 and DT1, two subregions with distinct deep-water dynamics. Winkler O2 data from these reference cruises were interpolated to standard pressure intervals (0–3600 dbar) using a piecewise cubic Hermite interpolation to obtain station profiles. Then, for each cruise and region, we calculated mean profiles (Fig. 7).
The Algerian Basin (region DS3, Fig. 7a) exhibited clear temporal variability. Deep O2 values (>1500 dbar) in cruises from 2018 to 2022 were 4–5 µmol kg−1 lower than those from earlier years – a 2 %–4 % deviation. These differences likely reflect reduced deep convection in recent years (Li and Tanhua, 2020; Schneider et al., 2014), consistent with long-term observations and tracer-based studies.
Reference cruises 06M220180302 and 11BG20220517 in DS3 consistently report 2 %–4 % lower deep O2 levels compared to earlier cruises (e.g., 06MT20110405, 29AH20140426, 29AJ20160818) (see Fig. S2), corroborating the results of Grégoire et al. (2023) and Laurent Coppola (personal communication, 2023), who linked the 2022 anomaly to weakened deep convection. In contrast, the Tyrrhenian Sea (region DT1, Fig. 7b), O2 profiles between 800 and 2500 dbar were remarkably consistent across cruises, suggesting more temporally stable conditions in deep waters. This is consistent with the region's known ventilation regime, which is dominated by lateral advection and double diffusion rather than convection (Durante et al., 2019). Small interannual variations, such as the modest O2 increases observed in 2007 and 2016, may reflect episodic ventilation events. These may also influence the development of a well-defined tracer minimum zone (TMZ) in the Tyrrhenian Sea (Li and Tanhua, 2020).
Figure 7c and d illustrate the variability in deep-ocean O2 concentrations in the WMED regions across cruises and support adopting a 2 % threshold to study the consistency of the CTD-O2WMED dataset in all subregions (Figs. S1 and S2 in the Supplement).
3.4.2 Defining a pressure range for the crossover analysis
The crossover results are evaluated in the water column region with the lowest temporal variability and the lowest vertical gradient in terms of depth, density, and/or potential temperature. Given the temporal changes in the Mediterranean Sea and particularly the WMED, we need to define our reference layer to evaluate the crossover results between cruises. Therefore, using the reference cruise O2 data to determine the most stable depth range for crossover calculations, we computed pairwise ratios of mean profile O2 values between the target reference cruise and other reference cruises in the subregion (e.g., / other reference cruises).
Results are shown in Figs. 8, S1, and S2. As an overview, the results in Fig. 8 clearly show that the deep and bottom waters in the WMED, below 2000 dbar, are not suitable to use as the most stable and reference layer since here the data are sparse and natural variability increases.
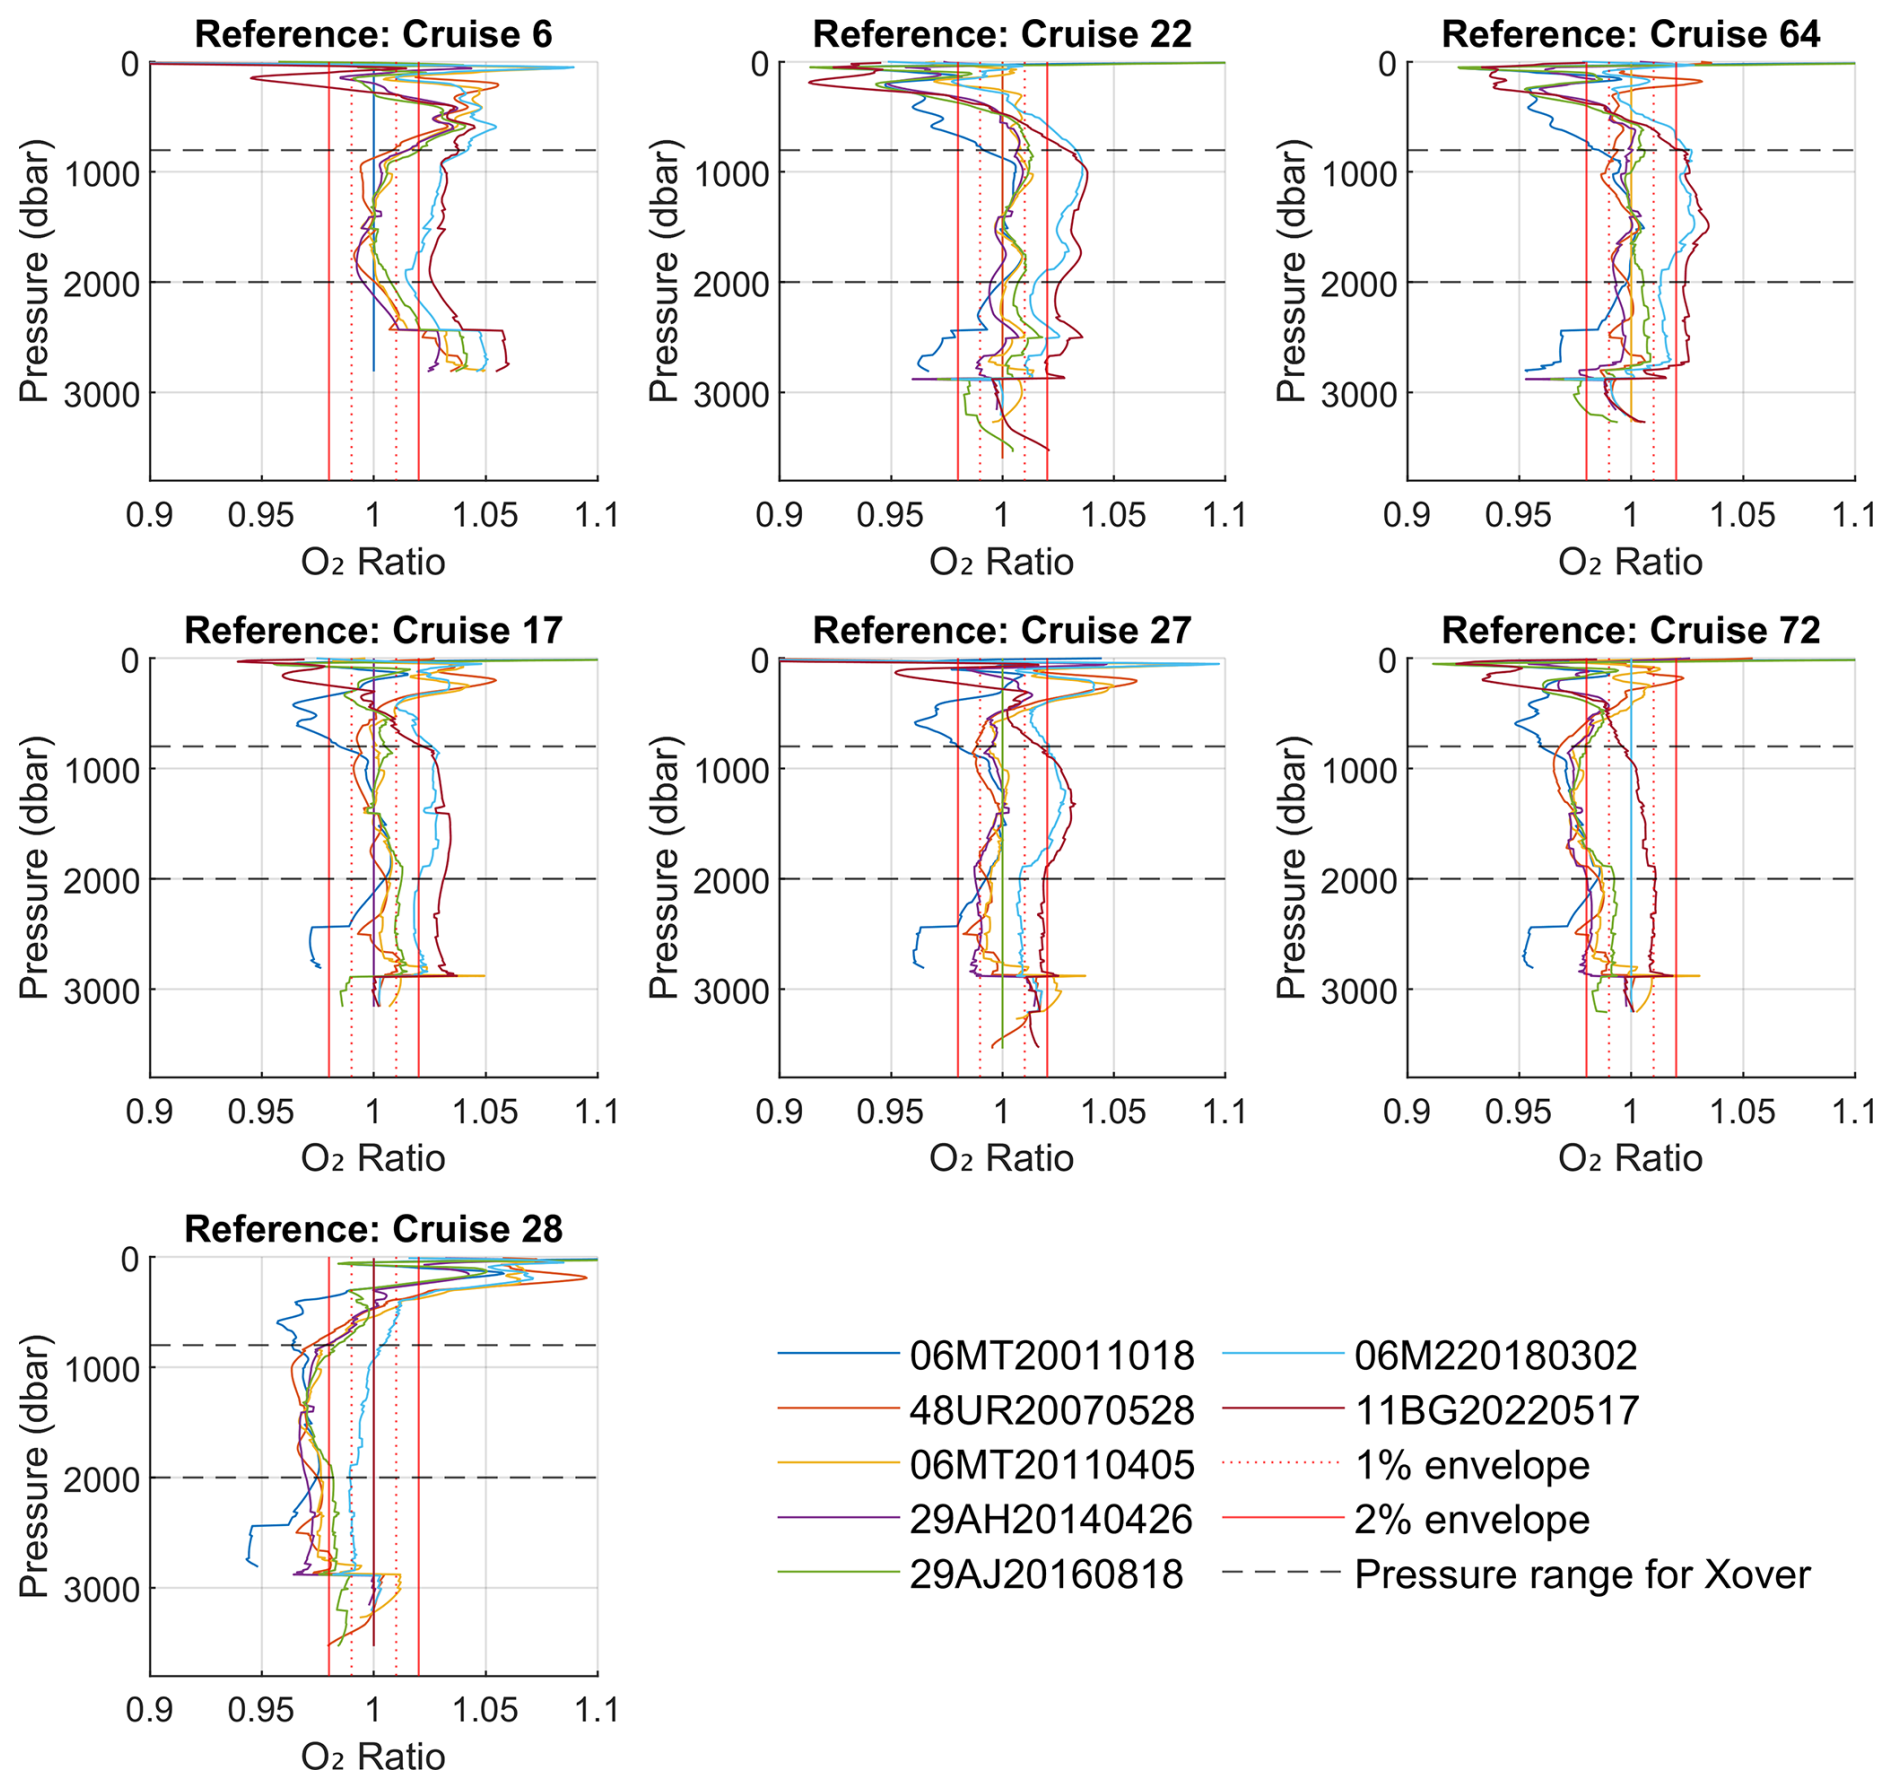
Figure 8Vertical distribution of the ratio between mean dissolved oxygen profiles from Winkler discrete measurements for the reference cruises, each tested reference cruise (indicated at the top of each subplot) and the other reference cruises (listed in the legend box). The solid red vertical line marks the ±2 % threshold limit, while the dashed red line indicates the ±1 % threshold. Similar composite figures for subregions DT1 and DS3 are provided in the Supplement (Figs. S1 and S2, respectively), focusing on the 800–2000 dbar depth range.
Below 800 db, in the Algerian Basin (region DS3, Fig. S2), 29.7 % of pairwise ratios fall within 1 %, and 60.5 % within 2 %, while 39 % exceed the 2 % threshold – indicating greater variability. In the Tyrrhenian Sea (region DT1, Fig. S1), 71.7 % of ratios fall within 1 %, and 98.7 % within 2 % – confirming greater stability.
The 800–2000 dbar range emerges as the most stable layer across cruises and regions and is selected as the reference one to evaluate the crossover analysis results. This layer corresponds to the TMZ described by Li and Tanhua (2020) and is less affected by long-term ventilation trends.
3.4.3 Crossover analysis
The crossover analysis was performed following Johnson et al. (2001) and Tanhua et al. (2010), taking advantage of the software tool provided in Lauvset and Tanhua (2015) and Tanhua (2010). CTD-O2WMED cruises were compared with reference cruises by pairing stations within a 2° radius (∼222 km). Interpolated profiles from each new cruise from CTD-O2WMED (C1) were compared to those from the reference cruise (C2) within this distance. Each crossover comprises a minimum of three stations from each cruise where CTD-O2 profiles were interpolated to standard density levels (sigma4) using Hermite interpolation. Using sigma4 as the vertical coordinate assures the comparison is made in the same water masses, thereby mitigating biases associated with variations in salinity. Mean difference profiles were computed at each crossover as the mean of different station pair differences; thus, one station in cruise C1 is compared to all stations in cruise C2, resulting in multiple mean difference profiles to finally calculate for each crossover pair the corresponding weighted mean and standard deviation profile, which are finally used to determine the weighted offset and standard deviation for the crossover pair. The weighting applied to the profiles is based on their variability, giving higher importance to parts of the profiles with lower variability (adapted from Tanhua et al., 2010, 2015). Figure 9 illustrates an example of a crossover pair and the corresponding offset between a CNR cruise and a reference cruise. The number of crossover stations is critical because low sample sizes increase uncertainty: as illustrated in Fig. 9a, 30 stations from C1 and 14 from C2 were compared. Additionally, while the number of crossover pairs is significant, the Mediterranean Sea has a limited number of reference cruises available. All calculated offsets for each cruise were therefore examined to determine the presence of any likely biases in the measurements.
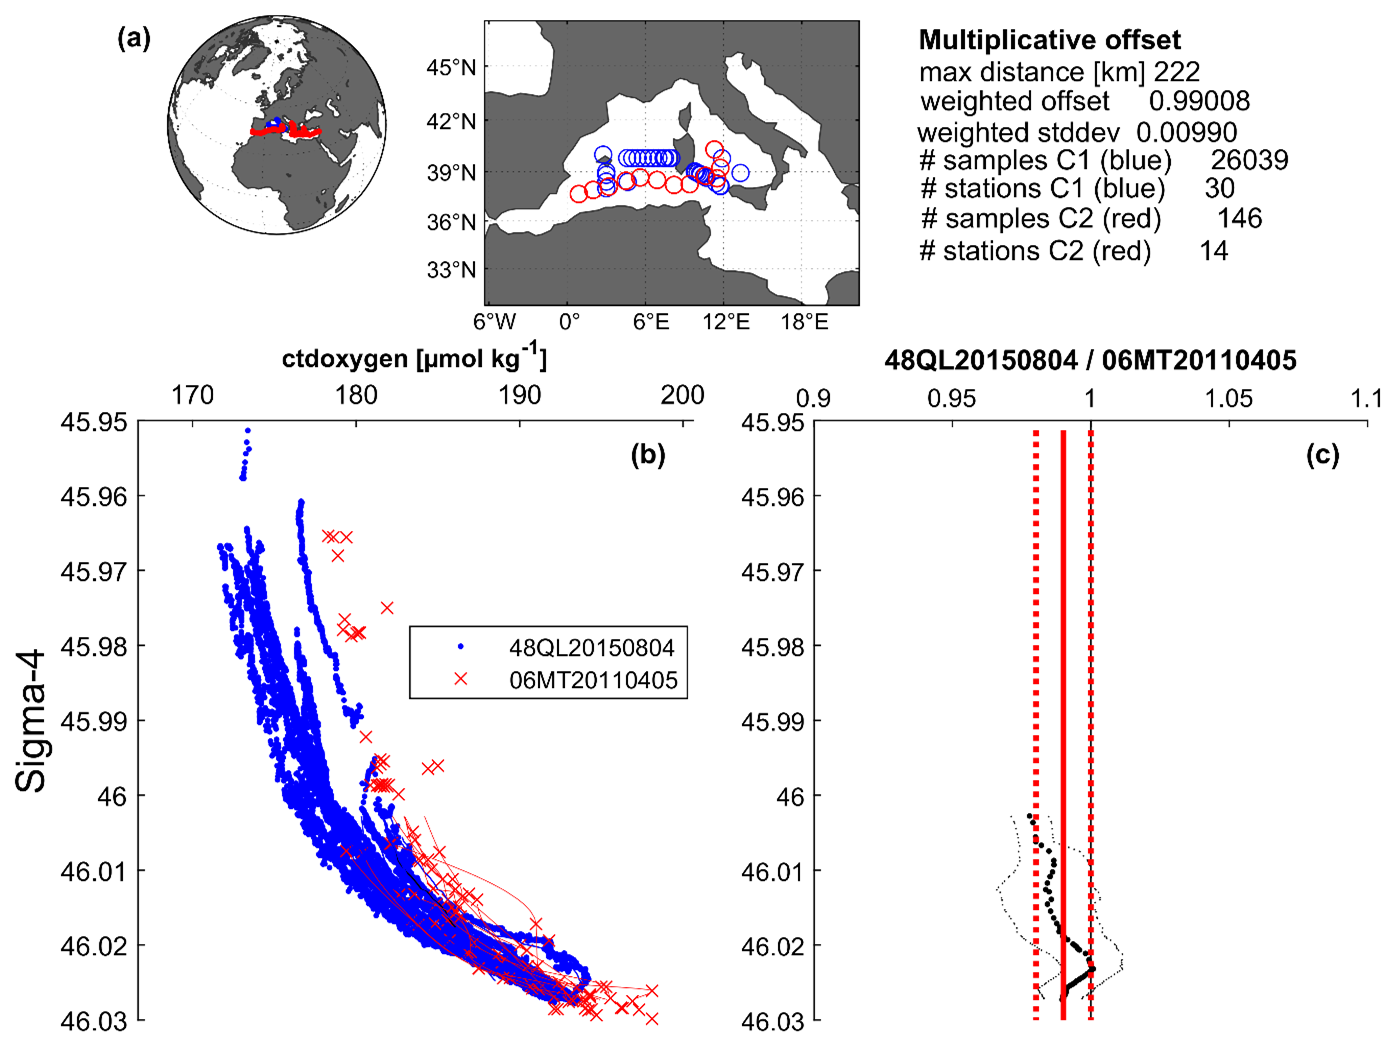
Figure 9Example of a crossover pair analysis to obtain the offset ratio (multiplicative offset) in dissolved oxygen between cruise 48QL20150804 and the reference cruise 06MT20110405. (a) Spatial distribution of stations included in the crossover analysis: target cruise (blue) and reference cruise (red), with accompanying summary statistics. (b) Vertical profiles with sigma4 of dissolved oxygen (µmol kg−1) from both cruises within a 2° radius and the 800–2000 dbar depth range. (c) Differences in dissolved oxygen between the two cruises: the thick black dotted line shows the mean offset profile, and thin black dotted lines represent the standard deviation; the solid red line indicates the weighted average offset, and red dotted lines show the weighted standard deviation, values that are shown in the summary statistics in panel (a).
In addition to the typical crossover analysis, we performed a regional crossover analysis using a simple modified clustering approach based on predefined WMED subregions (Table S2). Regional clusters included the Tyrrhenian Sea (DT1 and DT3), the Algerian Basin (DS3 and DF1), and the Alboran Sea (DS1). Clusters were set manually by defining each subregion subsets following the geographical limits in Table S2. This approach minimizes the impact of regional hydrographic differences.
3.4.4 Correction factors and final product consistency evaluation
For each cruise, a set of offsets was obtained after the crossover analysis, and the corresponding inverse values are the correction factors (CFs), which set the basis to obtain the final cruise CFs for CTD-O2 if needed. We applied a conservative approach: among the regional offsets, the CF closest to 1 (i.e., lowest absolute deviation) was selected (Table 3). This minimizes changes to the original data while improving internal consistency.
After applying the cruise CF, the final step involves evaluating the overall internal consistency of the CTD-O2WMED dataset. This is done using the weighted mean (WM) which is calculated from the absolute offsets (D) across all crossovers (L) after adjustment, weighted by the corresponding standard deviation (σ), following the approach described by Tanhua et al. (2009) and Belgacem et al. (2020).
This assessment provides a quantitative measure of the internal coherence of the final data product following earlier studies (Hoppema et al., 2009; Sabine et al., 2010; Tanhua et al., 2009). It is important to note that the evaluation is based on offsets relative to a selected reference dataset under the assumption that these reference cruise data represent the trueness state of dissolved oxygen in the WMED.
4.1 Overview of the secondary quality control results and impact on the CTD-O2 WMED dataset
This section describes the obtained crossover results and discusses the correction factor and the final adjustments applied, if needed, to each CNR WMED cruise to finally probe the increased consistency of the CTD-O2 WMED data product released. Each crossover result was evaluated, somehow subjectively, considering its quality, which would depend on the number of available stations, the calculated standard deviation of the offset, the depth range covered, and the regional variability. A total of 265 crossover results for each cruise including regional clusters were carefully inspected, and only the appropriate ones, following the conservative approach, were considered to obtain the correction factors (Fig. 10). The final correction factors applied are summarized in Table 4 and only applied when the offset exceeded the ±2 % threshold limit. Overall, only a few cruises exhibited deviations outside the ±2 % limit and thus required adjustments (Fig. 10). The analysis indicated that deep oxygen values from cruises #2 (48UR20041006), #8 (48UR20060928), #211 (48UR20130604), and #222 (48QL20151123) required upward correction to align with the reference dataset. Conversely, cruises #3 (48UR20050412), #5 (48UR20051116), and #24 (48QL20171023) showed slightly higher values compared to their respective reference and were adjusted downward. 14 cruises did not require any correction as their values were consistent with the reference dataset. Cruises #25 (48DP20180918), #27 (48DP20221015), and #28 (48DP20230324) were excluded from the crossover analysis due to an insufficient number of deep stations below 800 dbar, but their data remain part of the final dataset. The reader is encouraged to compare the descriptions with the corresponding plots in Fig. 10 and the crossover summary figures in Figs. S3–S9.
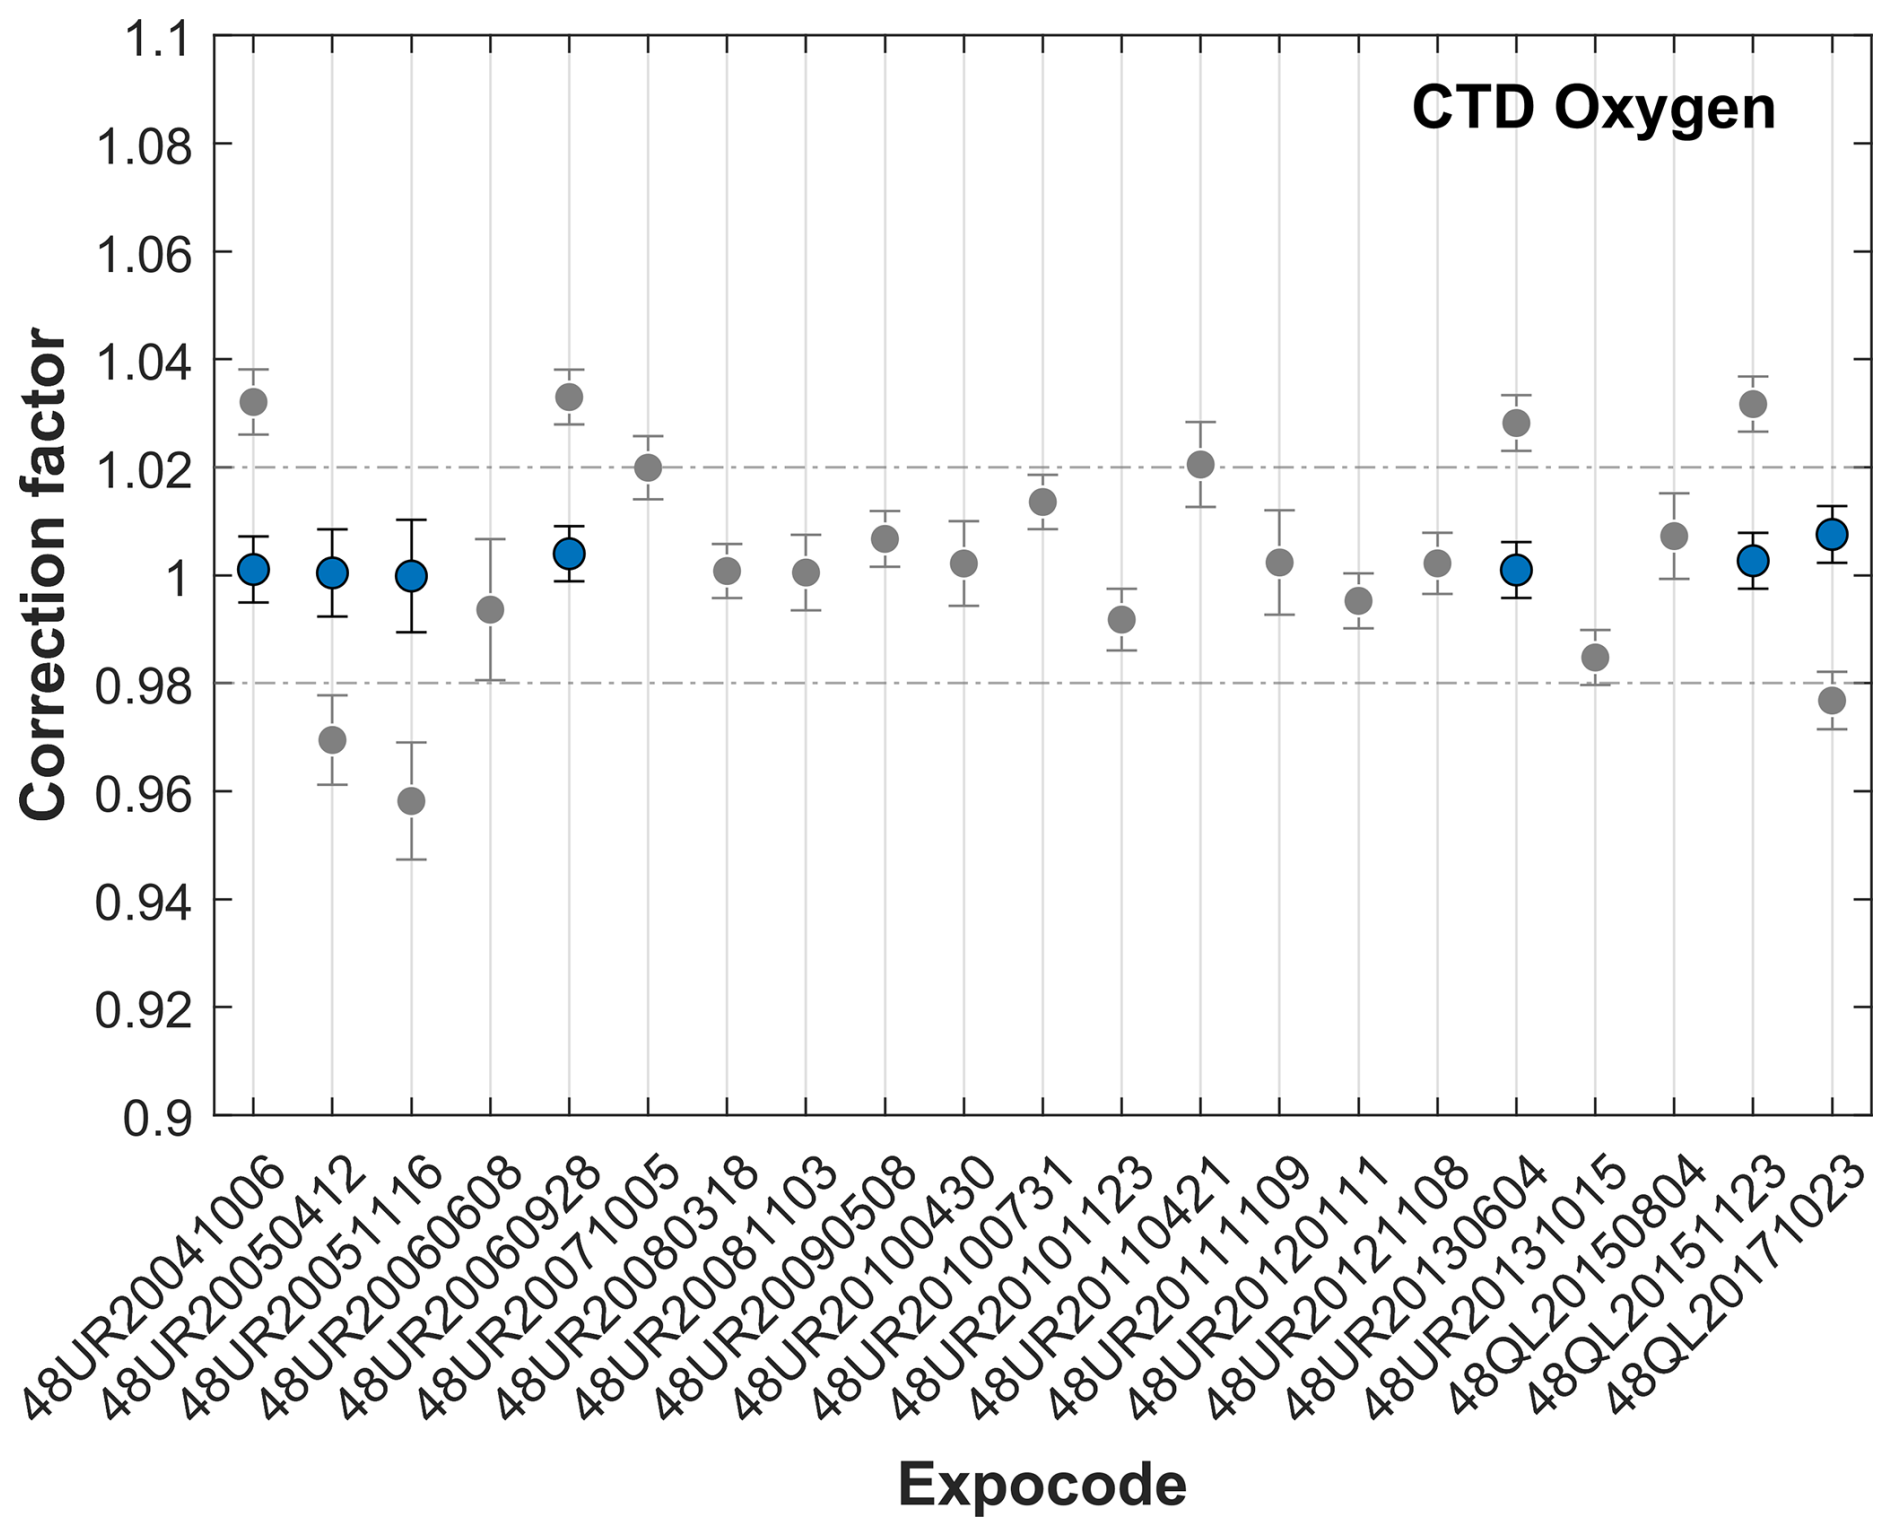
Figure 10Results of the crossover analysis for CTD dissolved oxygen, showing the recommended correction factors before (gray) and after (blue) adjustment (i.e., after applying the correction factor). Error bars represent the standard deviation of the absolute weighted offset. Corrections indicate the multiplicative factor to be applied to the original CTD oxygen data (see Table 4). The dashed line marks the ±2 % threshold limit of adjustment.
Table 4Summary of the recommended multiplicative correction factors for the CTD-O2WMED cruises derived from the second QC procedure.
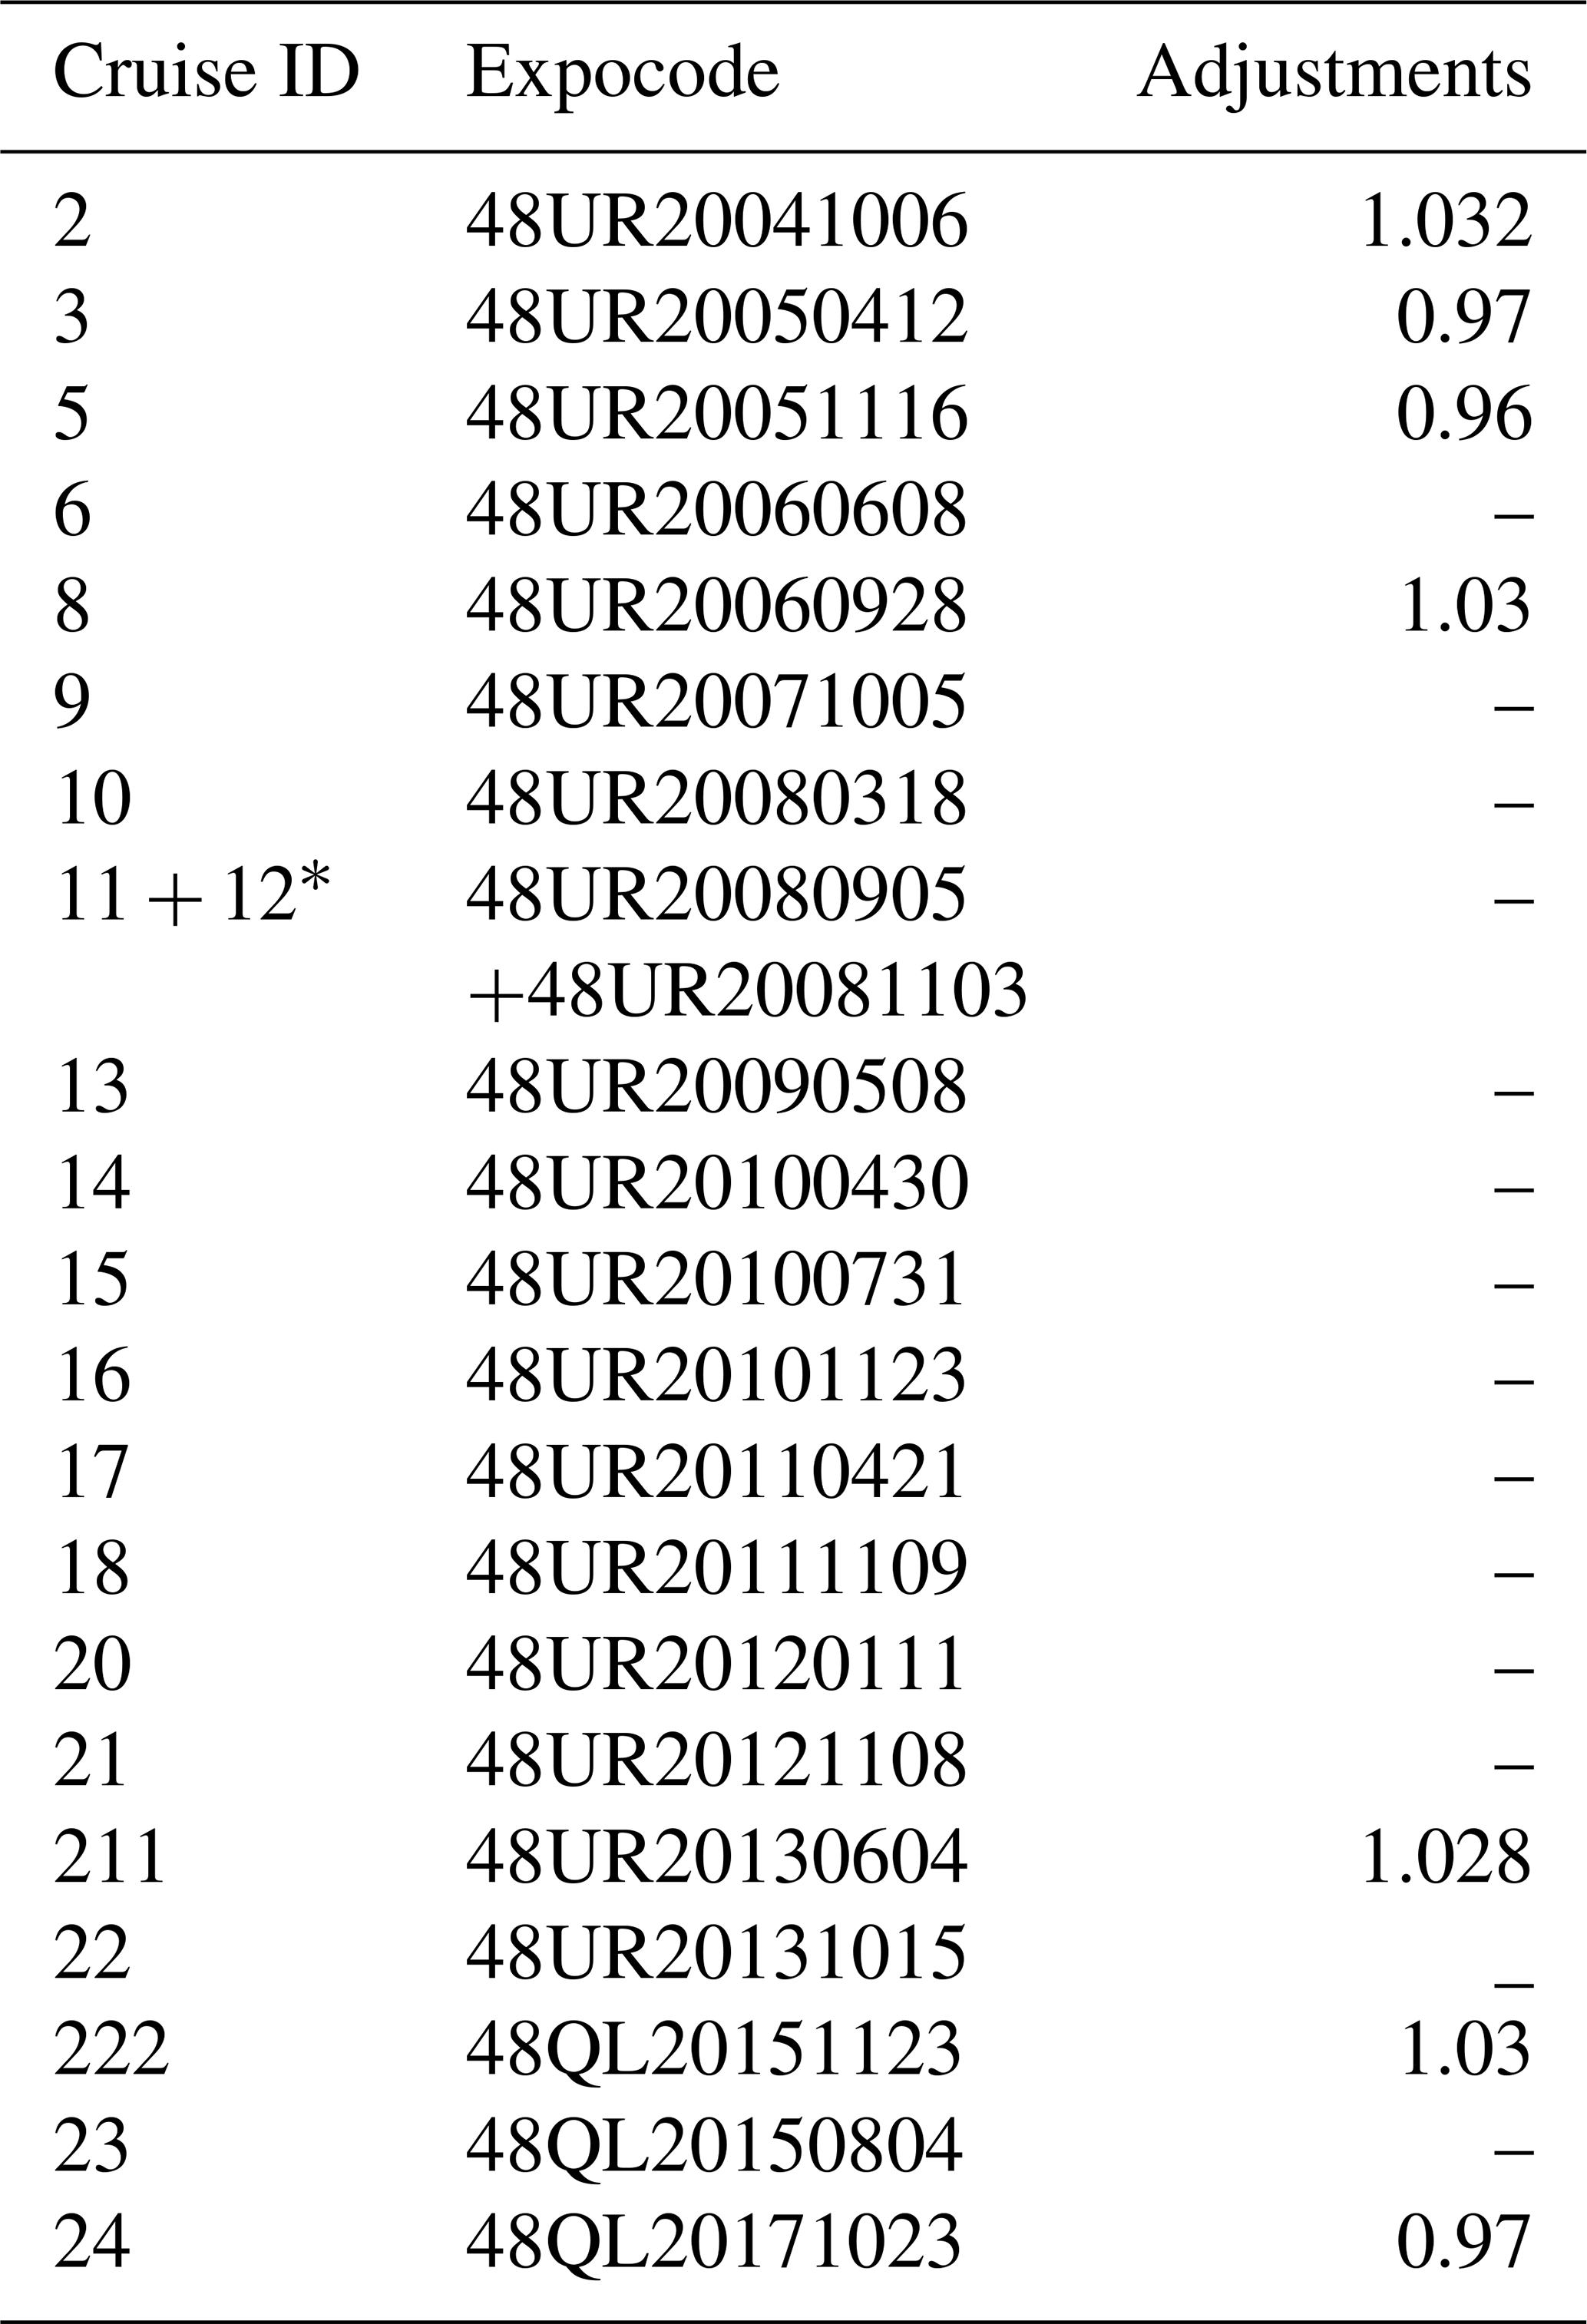
* Cruise #11 and cruise #12 were merged in the second QC.
After applying the correction factors listed in Table 4, the offsets were recalculated to validate the adjustments. As shown in Fig. 10, the corrected values (in blue) reduced the recalculated offsets and improved consistency. To assess the overall consistency of the adjusted CTD-O2WMED dataset, we computed the WM of the crossover offsets after adjustments (Fig. 11). The internal consistency of the final CTD-O2WMED dataset was estimated to be 0.998. These adjustments reduced potential biases linked to errors related to methodological discrepancies, resulting in improved coherence across the dataset.
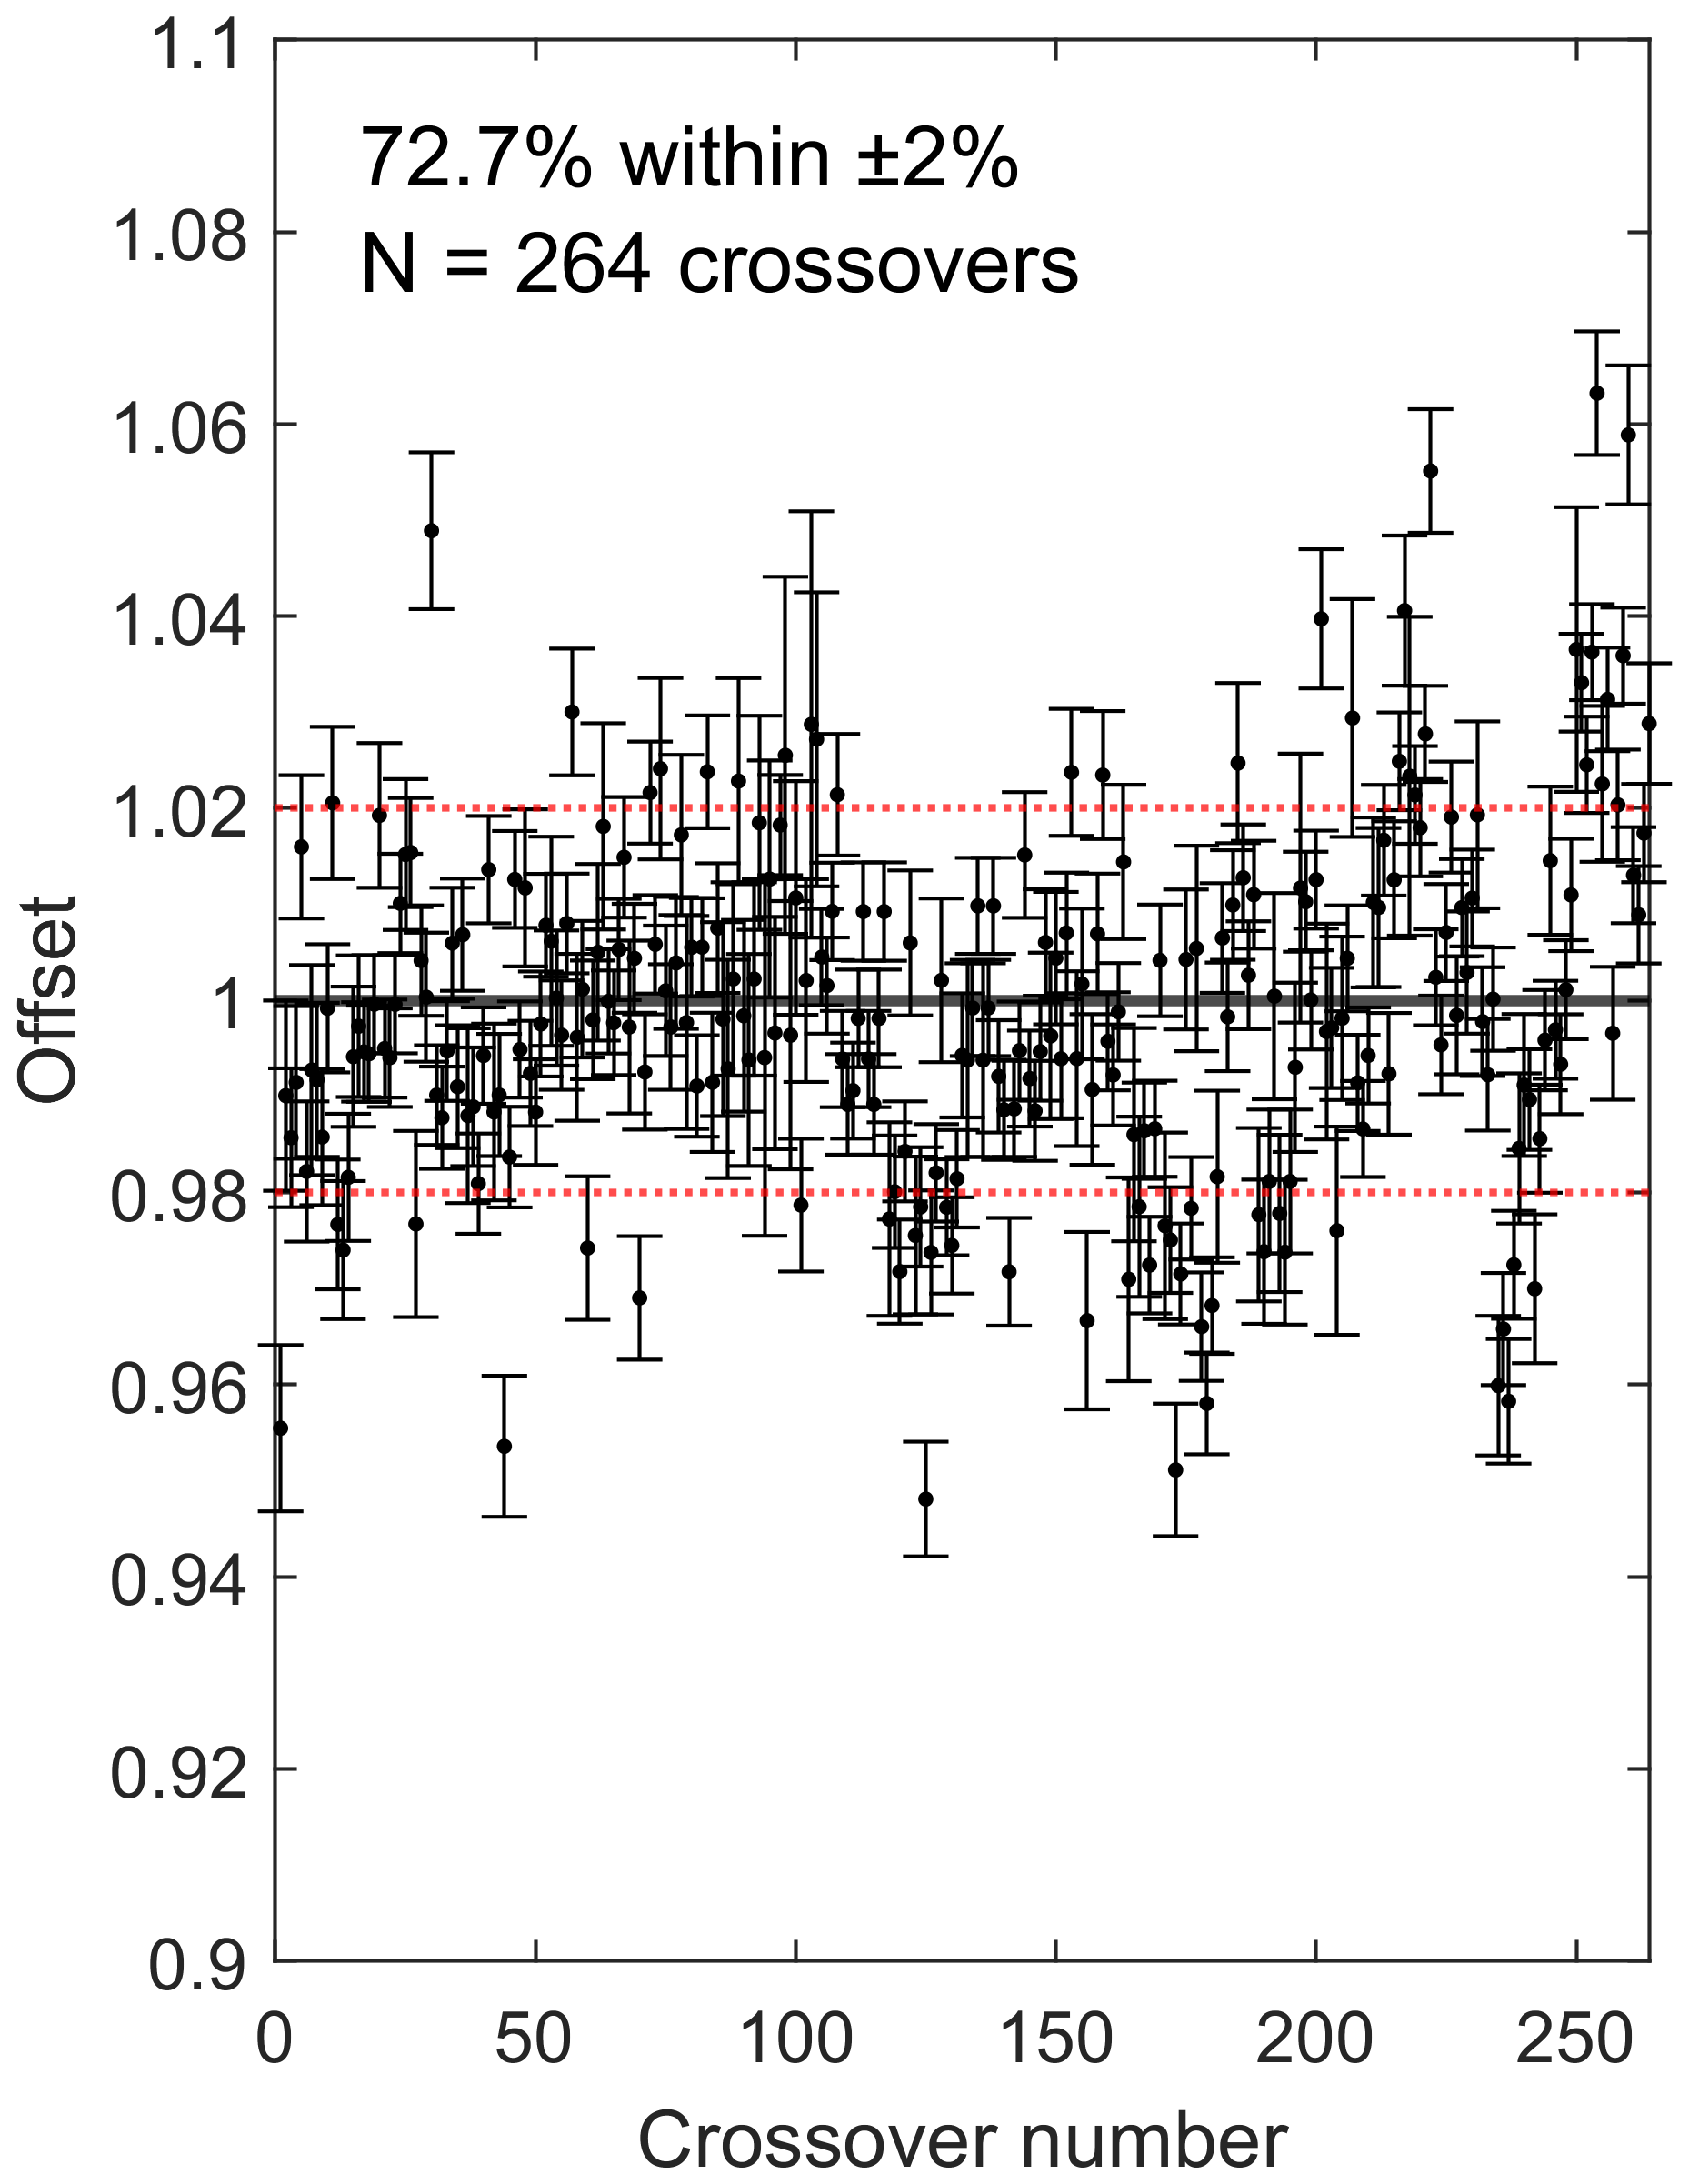
Figure 11Crossover results showing the weighted mean offset and standard deviation for the CTD-O2WMED cruises after applying the correction factors. The dashed red line marks the ±2 % threshold.
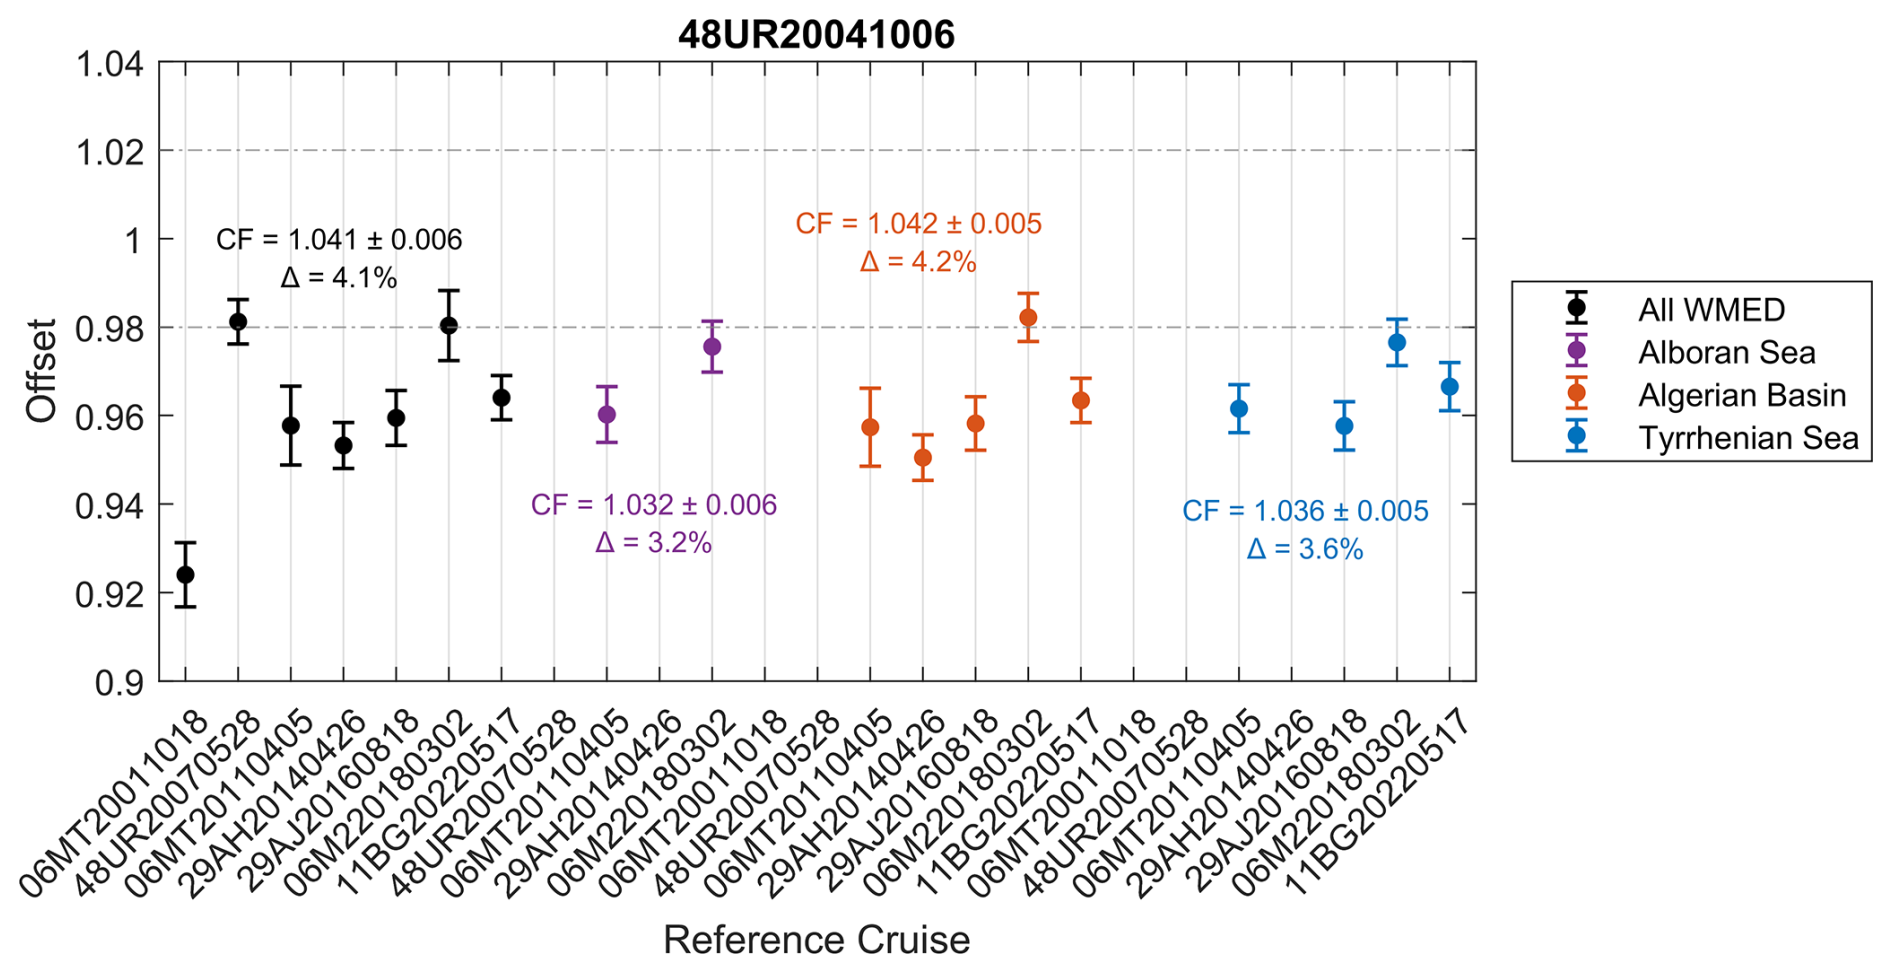
Figure 12Summary of CTD-O2 crossover results for cruise #2 (48UR20041006) relative to the reference cruises showed along the x axis arranged chronologically. Dashed gray lines indicate the ±2 % threshold. Black dots with error bars represent the weighted mean offsets and corresponding weighted standard deviation. Colored markers denote the subregions: purple for the Alboran Sea, orange for the Algerian Basin, and blue for the Tyrrhenian Sea. Annotated within the figure are the correction factor, standard deviation, and percentage change in the median offsets for each subregion.
4.2 Detailed description of each CNR WMED cruise corrected
This subsection provides a rationale for the proposed correction factors in Table 4. It includes interpretations of significant offsets even in cases where no final correction was applied but poor data quality was observed. Cruises not mentioned below were found to be consistent with the reference data and required no further review.
-
Cruise #2 (48UR20041006): two crossovers were found in the Alboran Sea, five in the Algerian Basin, and four in the Tyrrhenian Sea. A consistent mean offset of 0.96±0.005 across all regions suggests CTD-O2 values were ∼ 4 % lower than the reference cruises (Fig. 12). This is also supported by high residuals between Winkler and sensor data (>2 µmol kg−1, Fig. 3) and by the unusually low regional deep averages (Fig. 6). Given that deep WMED ventilation prior to 2004 was still stable, this is a 3.2 % increase. An adjustment of 1.032 is applied.
-
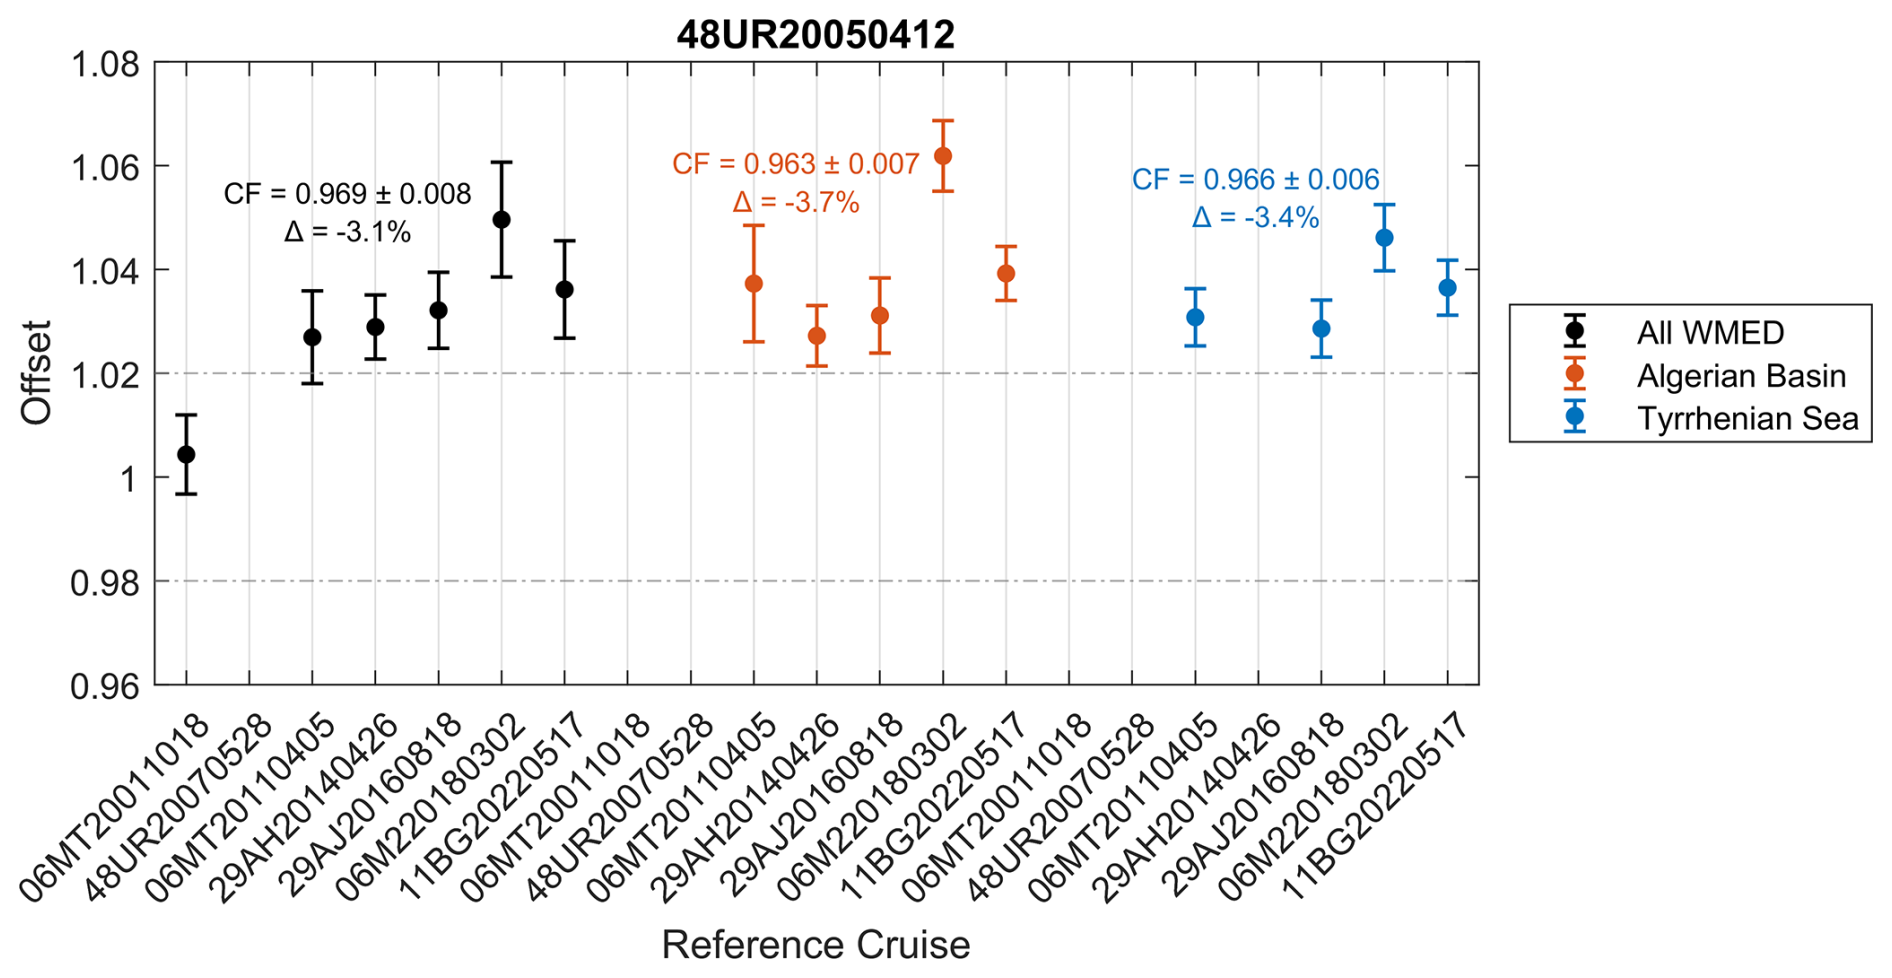
Cruise #3 (48UR20050412): this cruise has five crossovers in the Algerian Basin and four in the Tyrrhenian Sea, clearly indicating the need for a downward adjustment. As pointed out in Sect. 3.3, this cruise could be of low precision compared to cruises conducted in the same regions. Based on the agreement between the offsets in both subregions (Fig. 13) and despite one reference cruise in 2001 suggested agreement (but it involved only three stations; therefore, it is not robust). An overall offset of 1.03±0.008 was found, supporting an adjustment of 0.97 (−3 %).
-
Cruise #5 (48UR20051116): four crossovers in the Tyrrhenian Sea spanning the years 2011, 2016, 2018, and 2022 (Fig. S3) showed good agreement (weighted standard deviation of 0.01) but a median weighted offset of The suggested correction is ∼ 4 % lower. The quite large discrepancy may indicate potential issues with the sensor (Sect. 3.3, Table 3). An adjustment of 0.96 is applied.
-
Cruise #6 (48UR20060608): there were five crossovers in the Algerian Basin and four in the Tyrrhenian Sea (Fig. S4). While offsets seem to increase over time, seven of nine crossovers were lower than ±2 %. The Tyrrhenian Sea, a quite stable region for deep waters, showed low variability (weighted standard deviation of 0.005), indicating a good precision and good agreement between crossovers. The Algerian Basin was more variable and represented the direct effect of the Gulf of Lion (where deep-water convection may occur). Here, the weighted standard deviation was higher (∼ 0.01), persistent in all references except for the 2022 reference. Given the lack of consistency between subregions and trends similar to reference profiles (Fig. 7c), no adjustment is applied.
-
Cruise #8 (48UR20060928): four crossovers in the Tyrrhenian Sea showed good agreement (weighted standard deviation of 0.005), with reference cruises 06MT20110405, 29AJ20160818, 06M220180302, and 11BG20220517 (Fig. S5). Offsets were found to be between 0.96±0.005 and 0.97±0.005, and an increase of +3 % is recommended. And adjustment of 1.03 is applied.
-
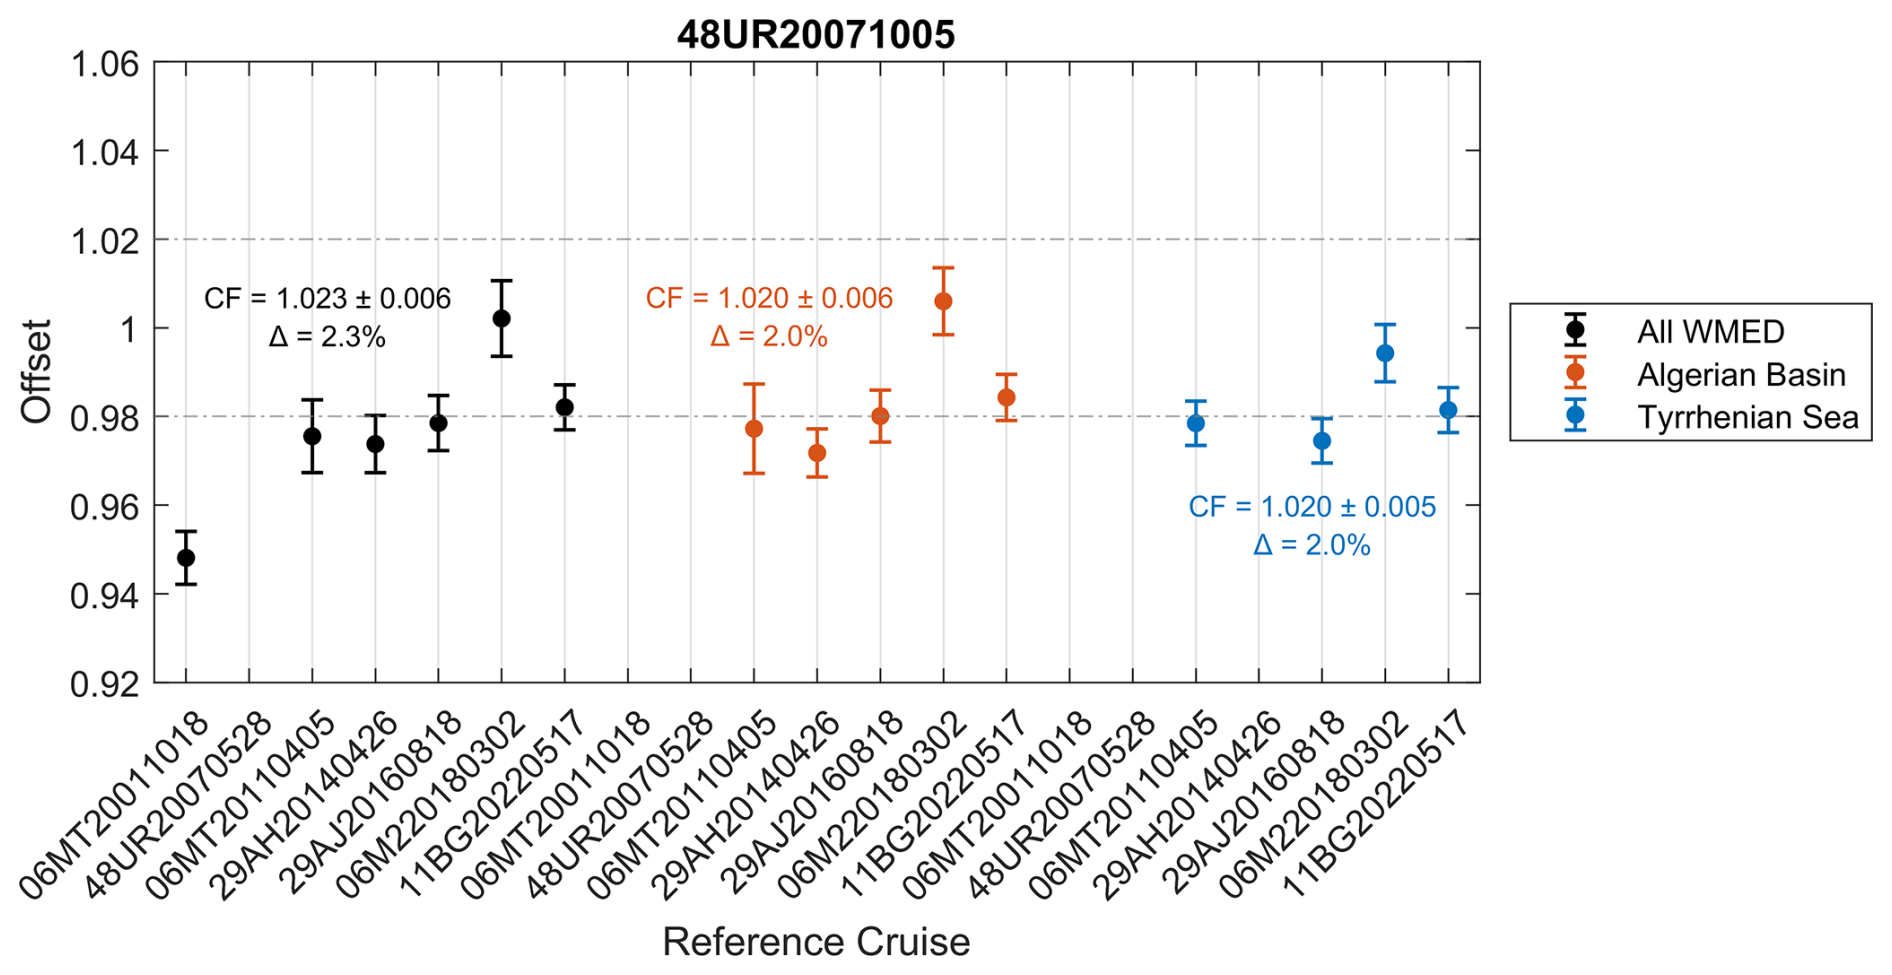
Cruise #9 (48UR20071005): crossovers in both the Algerian Basin (5) and Tyrrhenian Sea (4) showed consistent offsets of ±0.005, indicative of the good precision of the data. The largest offset (0.95±0.005) occurred with reference cruise 06MT20011018 (Fig. 14), likely due to limited station coverage. Both subregions show a consistent deviation about +2 % but, as all values remain within the ±2 % limit, no adjustment is recommended.
-
Cruise #15 (48UR20100731): two crossovers in the Alboran Sea with a median offset of 0.98±0.01, five crossovers in the Algerian Basin with an offset of 0.98±0.005, and four crossovers in the Tyrrhenian Sea showing an offset of 0.97±0.005 (Fig. S6). Following our conservative correction approach, the lowest observed percentage of change is 1.4 % in the Algerian Basin, suggesting a correction factor of 1.014, below the ±2 % threshold limit. Therefore, no adjustment is applied.
-
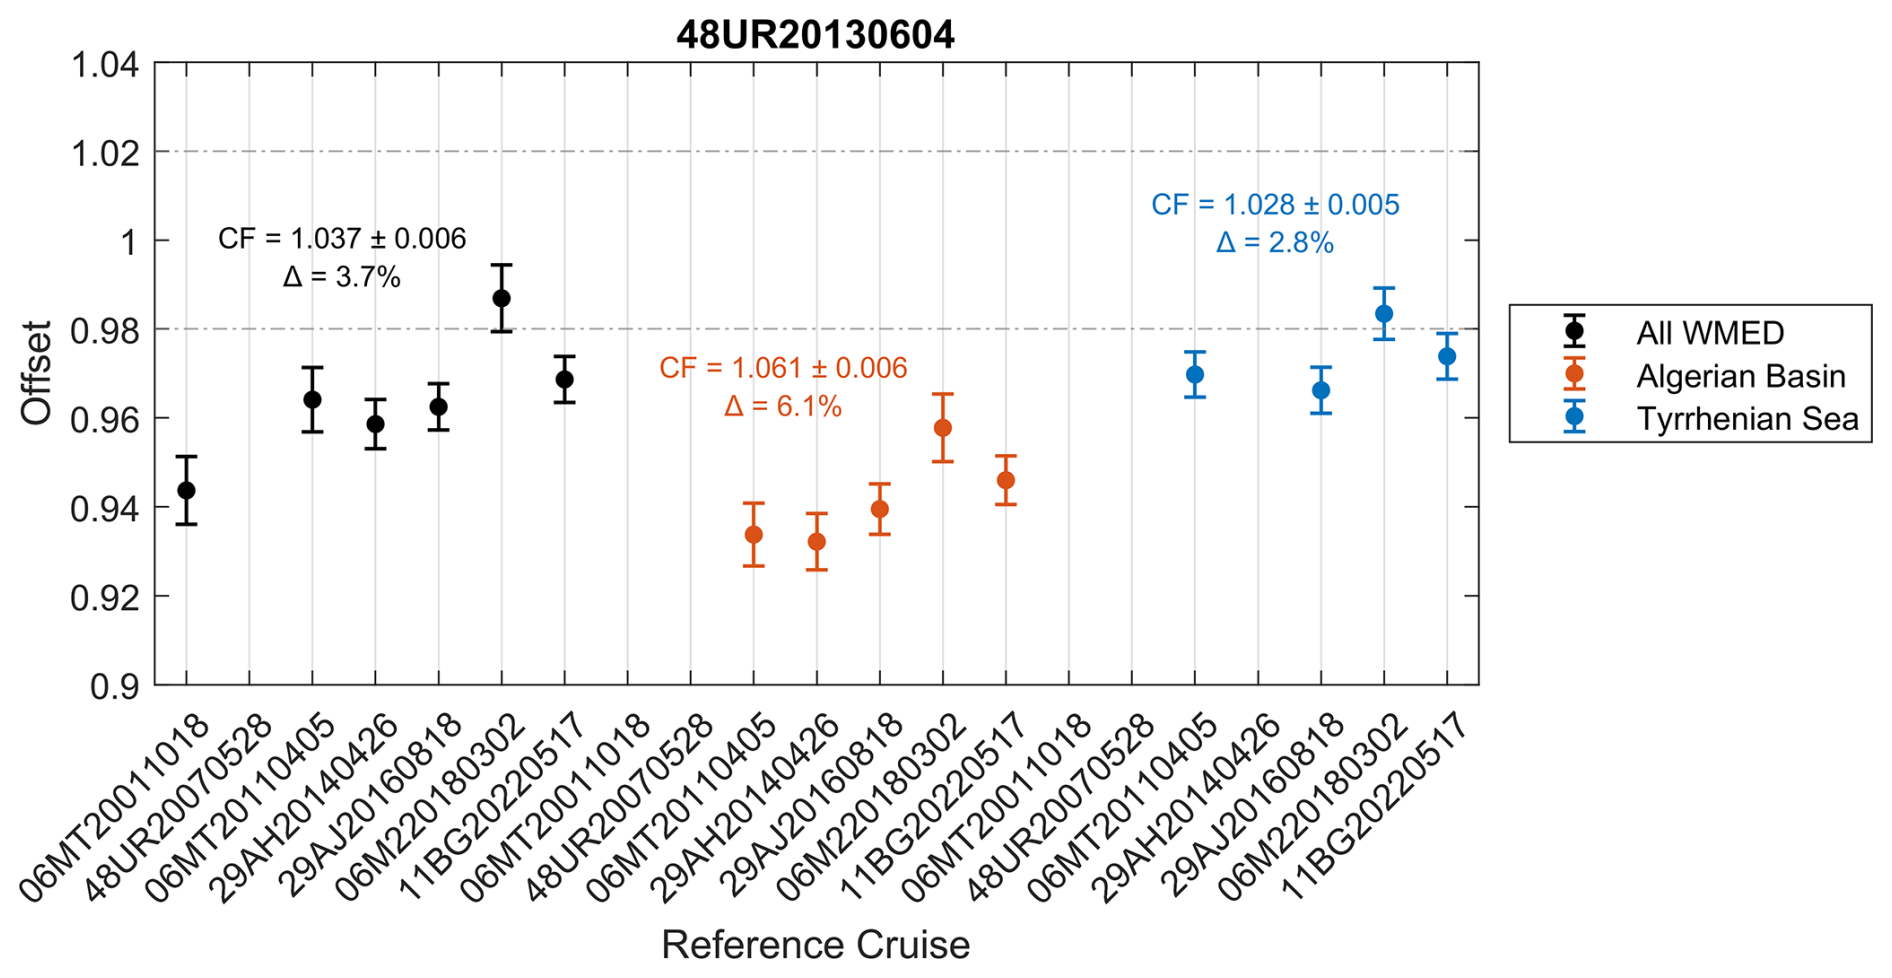
Cruise #211 (48UR20130604): the crossovers suggest a 6 % increase in the Algerian Basin and 2.8 % in the Tyrrhenian Sea (Fig. 15). Both median offsets indicate that oxygen data for this cruise are lower than the references, although data precision appears good. Despite the regional difference and following our conservative approach, we recommend applying an increase of +2.8 %, prioritizing the smaller offset to avoid overcorrection. An adjustment of 1.028 is applied.
-
Cruise #22 (48UR20131015): this cruise was carried out in the same year as cruise #211 (48UR20130604) but shows smaller offsets in both regions (Algerian Basin and Tyrrhenian Sea) (Fig. S7), suggesting its oxygen values are higher than the references and might require a small downward correction of −1.5 %, that is, within the ±2 % limit. No adjustment is applied.
-
Cruise #222 (48QL20151123): four crossovers in the Tyrrhenian Sea, spanning multiple years (Fig. S8), indicated a consistent underestimation of CTD-O2 data (offset 0.97±0.005). The data exhibit good precision, with a weighted standard deviation of 0.005. An upward correction of 3 % is recommended. A final adjustment of 1.03 is applied.
-
Cruise #24 (48QL20171023): four crossovers in the Tyrrhenian Sea (Fig. S9) show CTD-O2 values slightly higher than the reference cruises. The median offset suggests a decrease, indicating a correction factor of 0.97. Precision remains high with weighted standard deviation of 0.005. Additionally, as shown in Fig. 3, the residuals between Winkler and sensor measurements for this cruise was classified as poor, supporting the need for an adjustment of 0.97.
Table 5List of parameters for the CTD-O2WMED dataset for both original and adjusted versions.
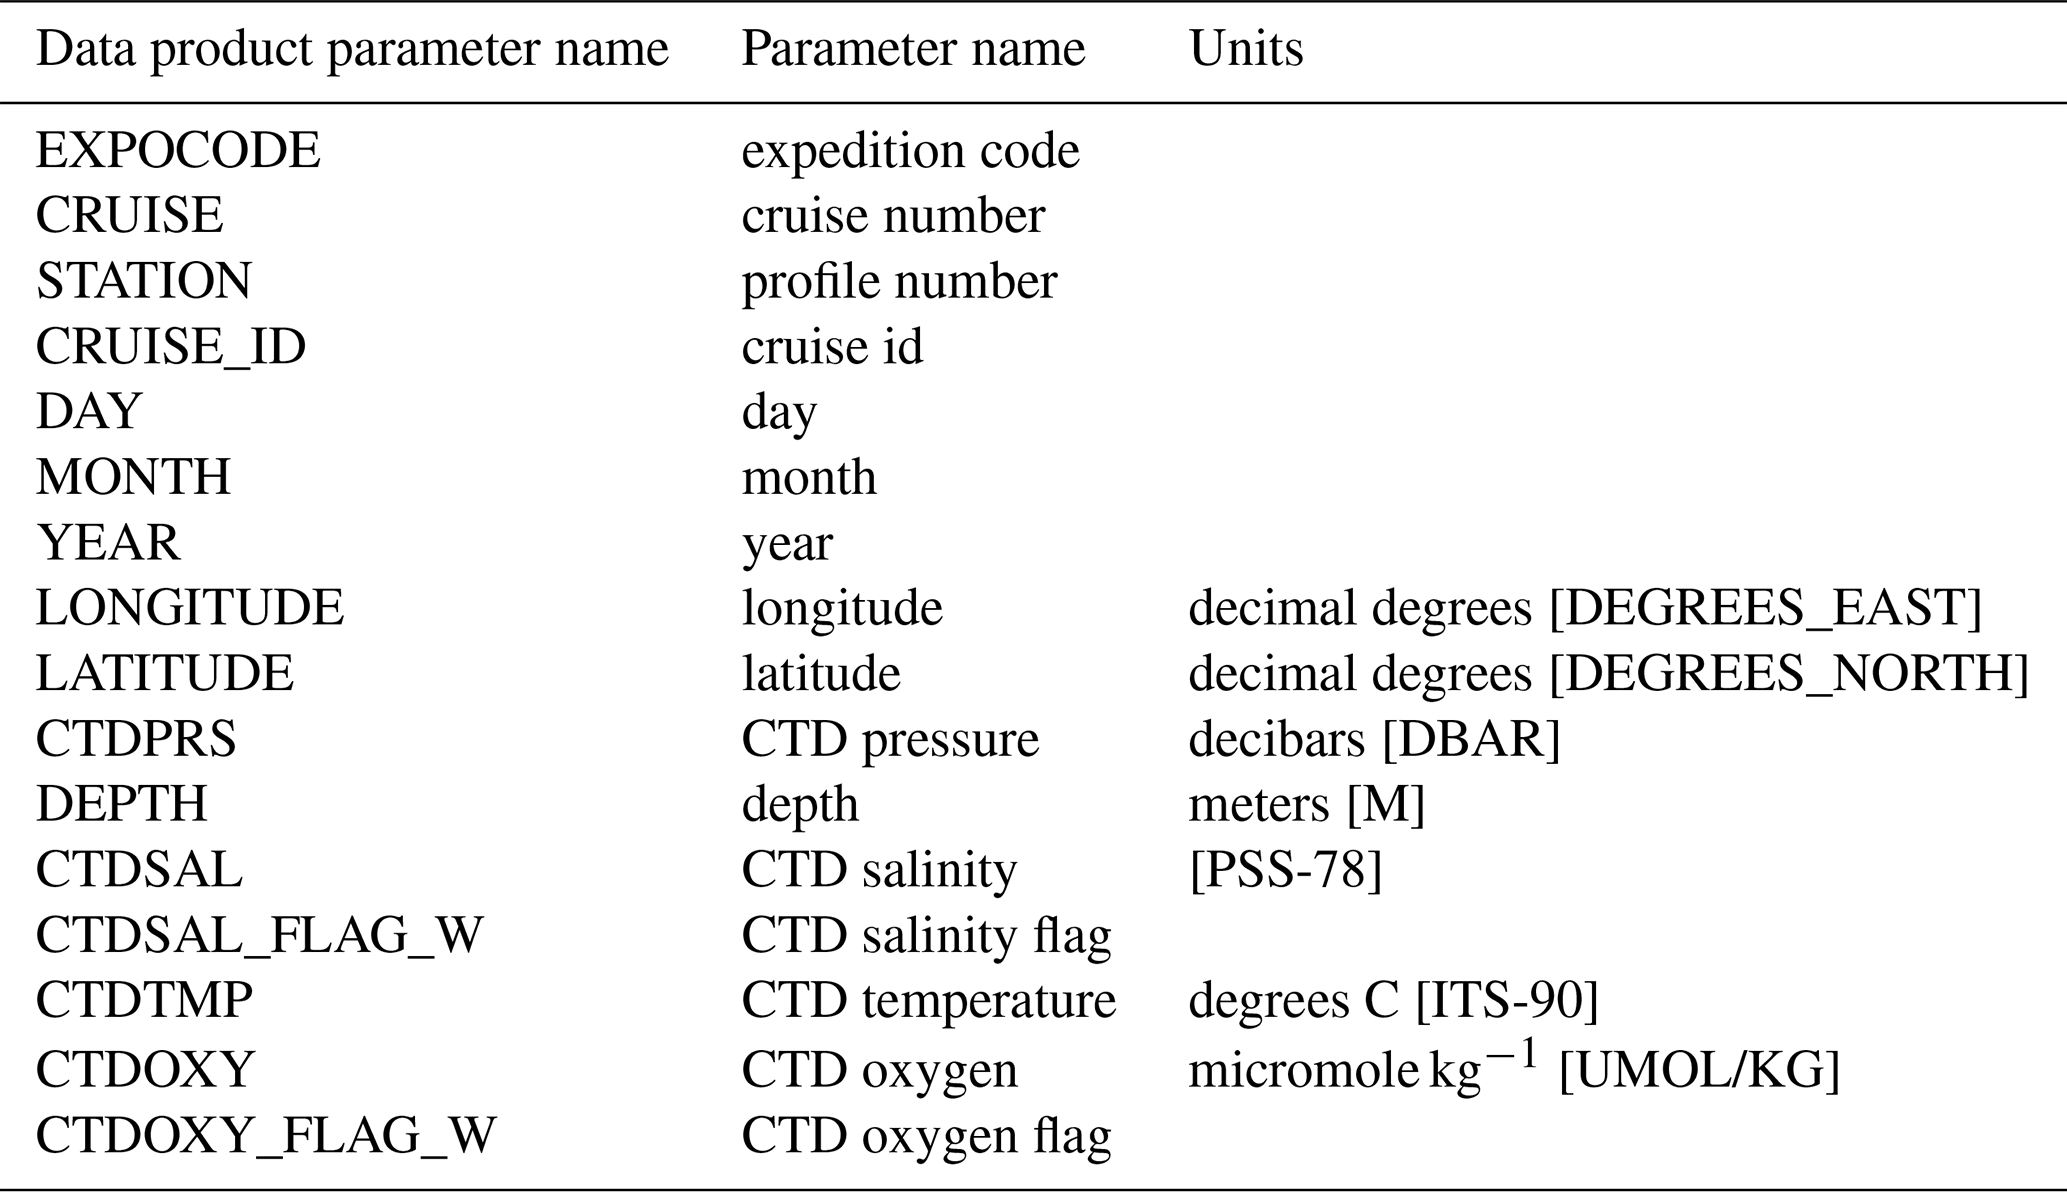
Table 6Reference dataset availability (last access: June 2025).
To resume, the CTD-O2WMED original version includes all cruises that have passed the first levels of quality checks but have not yet been corrected through crossover analysis (i.e., secondary quality control), so no adjustments were applied in the original version. However, the adjusted version of the dataset CTD-O2WMED adjusted builds upon the original dataset by incorporating the secondary quality control adjustments.
The CTD-O2WMED dataset (Belgacem et al., 2025) is available in PANGAEA (https://doi.org/10.1594/PANGAEA.982858).
Table 5 shows the variables included in the dataset, which is composed in two parts:
-
CTDO2_WMED_2004_2023_original: the first includes the aggregation of cruise data prior to correction, which has undergone calibration and first-level quality check;
-
CTDO2_WMED_2004_2023_adjusted: the second contains the adjusted data product, incorporating the final adjustments from the secondary quality control procedure.
The CTD-O2WMED is complementary to the data product CNR-DIN-WMED available at https://doi.org/10.1594/PANGAEA.904172 (Belgacem et al., 2019).
No special software is required to access the data. Note that data from the reference cruises used for crossover analysis are not included in the final product (see Table 6).
This study aimed to evaluate and enhance the consistency of a collection of CTD-O2 measurements of 25 cruises in the WMED with a relevant CNR Italian participation. A first quality control was applied followed by a secondary quality control procedure based on crossover analysis was adapted to the specificizes of the dataset and the WMED: the threshold limit was increased from 1 % to 2 %, recognizing the limitations in terms of accuracy and precision of our dataset and the known temporal variability in some WMED basins, and we determined it is more appropriate to study the consistency of CTD-O2 data in the 800–2000 dbar layer rather than the deep and bottom waters, which are much more variable. The methodology developed here provides a robust and transferable framework for quality control in regions with similarly complex hydrography.
The second QC procedure obtained a total of 265 crossover comparisons between the CTD-O2 data and Winkler measurements from a selection of reference cruises following GO-SHIP procedures with a higher precision and accuracy. While the majority of checked CTD-O2 cruise data fell within the ±2 % limit, a limited number showed systematic offsets that warranted correction. Adjustments were applied conservatively – only when deviations exceeded the defined threshold and using the smallest possible correction factor. Adjustments were recommended for seven cruises. Although these cruises are categorized as moderate in quality, they are retained in the final dataset as adjusted data. A few cruises (#25 (48DP20180918), #27 (48DP20221015), and #28 (48DP20230324)) were excluded from the crossover analysis due to insufficient deep profiles but remain part of the final dataset. The corrections led to a measurable improvement in the internal consistency of CTD-O2 data among cruises, as demonstrated by the weighted mean global offset of 0.998 calculated from post-adjustment crossover analysis.
The CTD-O2WMED original and corrected datasets are openly accessible to the scientific community through open-access repositories. Our product, despite limitations in temporal coverage, will substantially increase the availability and reliability of dissolved oxygen data for long-term studies in the WMED. It builds upon and complements earlier efforts in the region (Schneider et al., 2014; Coppola et al., 2017; Macias et al., 2018; Mavropoulou, 2020; Li and Tanhua, 2020; Cossarini et al., 2021; Friedland et al., 2021; Ulses et al., 2021; Belgacem et al., 2019, 2020). Recent advances in numerical modeling (Reale et al., 2022), machine learning (Fourrier et al., 2022), and autonomous platforms such as BGC-Argo floats and gliders in the WMED demand measurements to validate their results. The CTD-O2WMED dataset, in synergy with these emerging observation systems, provides a valuable foundation for assessing changes in the regional oxygen budget and it will support ongoing efforts to understand the WMED's response to climate-driven oceanographic changes and improve future projections.
The supplement related to this article is available online at https://doi.org/10.5194/essd-17-5315-2025-supplement.
MaB ran the analysis and wrote the manuscript. KS contributed to writing the manuscript. MA and SKL contributed to the analysis. JC contributed to specific parts of the manuscript. MiB and StS coordinated the technical aspects of most of the cruises. CC and TC assisted with some of the chemical analysis.
The contact author has declared that none of the authors has any competing interests.
Publisher's note: Copernicus Publications remains neutral with regard to jurisdictional claims made in the text, published maps, institutional affiliations, or any other geographical representation in this paper. While Copernicus Publications makes every effort to include appropriate place names, the final responsibility lies with the authors.
Malek Belgacem's postdoctoral fellowship was supported by the EuroGO-SHIP project, funded by the European Union under grant agreement no. 101 094 690. The data have been collected within the framework of several European projects, e.g., KM3NeT, EU GA no. 011937; SESAME, EU GA no. GOCE-036 949; PERSEUS, EU GA no. 287 600; OCEAN-CERTAIN, EU GA no. 603 773; COMMON SENSE, EU GA no. 228 344; EUROFLEETS, EU GA no. 228 344; EUROFLEETS2, EU GA no. 312 762; JERICO, EU GA no. 262 584; and the Italian PRIN 2007 program “Tyrrhenian Seamounts ecosystems” and the Italian RITMARE flagship project, both funded by the Italian Ministry of Education, University and Research.
We acknowledge the project PRIN PNRR 2022 – Prot. P2022LMCW2-SettorePE 10 – “CLOSER: CLimate forcing On Adriatic SEa deoxygenation: A multi-archive Reconstruction of Sapropel S1” (CUP B53D23033660001, funded by the Italian Ministry of Education). Marta Álvarez acknowledges the PRX23/00051 project funded by the Spanish Ministry of Science, Innovation and Universities from the “Salvador de Madariaga” program. The authors are deeply indebted to the captains, crew, and technical and research personnel involved in the cruise data collection at sea; without them, this work would not have been possible. We also thank the principal investigators of the cruises (Stefano Cozzi, Gabriella Cerrati, Stefano Aliani, Mario Astraldi, Maurizo Azzaro, Alberto Ribotti, Massimiliano Dibitet Jullion, Gina La Spada, Elena Mannini, Angelo Perilli, and Chiara Santinelli).
This research has been supported by the HORIZON Europe Framework Programme, EuroGO-SHIP project, funded by the European Union under grant agreement no. 101094690
This paper was edited by François G. Schmitt and reviewed by Toste Tanhua and Sabine Schmidt.
Álvarez, M., Sanleón-Bartolomé, H., Tanhua, T., Mintrop, L., Luchetta, A., Cantoni, C., Schroeder, K., and Civitarese, G.: The CO2 system in the Mediterranean Sea: a basin wide perspective, Ocean Sci., 10, 69–92, https://doi.org/10.5194/os-10-69-2014, 2014.
Álvarez, M., Velo, A., Tanhua, T., Key, R., and Heuven, S. V.: Carbon, tracer and ancillary data in the medsea, CARIMED: an internally consistent data product for the Mediterranean Sea, Tech. Rep. 2019, Instituto Español de Oceanografía, https://ciesm.org/online/archives/abstracts/pdf/42/CIESM_Congress_2019_Cascais_article_0008.pdf (last access: June 2024), 2019.
Álvarez, M., Catalá, T. S., Civitarese, G., Coppola, L., Hassoun, A. E. R., Ibello, V., Lazzari, P., Lefevre, D., Marcias, D., Santinelli, C., and Ulses, C: Chapter 11 – Mediterranean Sea general biogeochemistry, edited by: Schroeder, K. and Chiggiato, J., Oceanography of the Mediterranean Sea, https://doi.org/10.1016/B978-0-12-823692-5.00004-2, 2023.
Belgacem, M., Chiggiato, J., Borghini, M., Pavoni, B., Cerrati, G., Acri, F., Cozzi, S., Ribotti, A., Álvarez, M., Lauvset, S. K., and Schroeder, K.: Quality controlled dataset of dissolved inorganic nutrients in the western Mediterranean Sea (2004–2017) from R/V oceanographic cruises, PANGAEA [data set], https://doi.org/10.1594/PANGAEA.904172, 2019.
Belgacem, M., Chiggiato, J., Borghini, M., Pavoni, B., Cerrati, G., Acri, F., Cozzi, S., Ribotti, A., Álvarez, M., Lauvset, S. K., and Schroeder, K.: Dissolved inorganic nutrients in the western Mediterranean Sea (2004–2017), Earth Syst. Sci. Data, 12, 1985–2011, https://doi.org/10.5194/essd-12-1985-2020, 2020.
Belgacem, M., Schroeder, K., Lauvset, S. K, Álvarez, M., Chiggiato, J.o, Borghini, M., Cantoni, C., Ciuffardi, T., and Sparnocchia, S.: CTD-O2WMED: Quality controlled dataset of CTD dissolved oxygen profiles in the Western Mediterranean Sea (2004-2023) from R/V oceanographic cruises, PANGAEA [data set], https://doi.org/10.1594/PANGAEA.982858, 2025.
Coppola, L., Prieur, L., Taupier-Letage, I., Estournel, C., Testor, P., Lefevre, D., Belamari, S., and Taillandier, V.: Observation of oxygen ventilation into deep waters through targeted deployment of multiple Argo-O2 floats in the north-western Mediterranean Sea in 2013, J. Geophys. Res.-Oceans, 122, 6325–6341, https://doi.org/10.1002/2016JC012594, 2017.
Coppola, L., Legendre, L., Lefevre, D., Prieur, L., Taillandier, V., and Riquier, E. D.: Seasonal and inter-annual variations of dissolved oxygen in the northwestern Mediterranean Sea (DYFAMED site), Prog. Oceanogr., 162, 187–201, https://doi.org/10.1016/j.pocean.2018.03.001, 2018.
Cossarini, G., Feudale, L., Teruzzi, A., Bolzon, G., Coidessa, G., Solidoro, C., Di Biagio, V., Amadio, C., Lazzari, P., Brosich, A., and Salon, S.: High-resolution reanalysis of the Mediterranean Sea biogeochemistry (1999–2019), Front. Mar. Sci., 8, 741486, https://doi.org/10.3389/fmars.2021.741486, 2021.
Durante, S., Schroeder, K., Mazzei, L., Pierini, S., Borghini, M., and Sparnocchia, S.: Permanent thermohaline staircases in the Tyrrhenian Sea, Geophys. Res. Lett., 46, 1562–1570, 2019.
Fichaut, M., Garcia, M. J., Giorgetti, A., Iona, A., Kuznetsov, A., Rixen, M., and Medar Group: MEDAR/MEDATLAS 2002: A Mediterranean and Black Sea database for operational oceanography, Elsev. Oceanogr. Serie., 69, 645–648, https://doi.org/10.1016/S0422-9894(03)80107-1, 2003.
Fourrier, M., Coppola, L., Claustre, H., D'Ortenzio, F., Sauzéde, R., and Gattuso, J.-P.: A Regional Neural Network Approach to Estimate Water-Column Nutrient Concentrations and Carbonate System Variables in the Mediterranean Sea, CANYON-MED, Front. Mar. Sci., 7, 620, https://doi.org/10.3389/fmars.2020.00620, 2020.
Fourrier, M., Coppola, L., Lebrato, M., Testor, P., Bosse, A., D'Ortenzio, F., Taillandier, V., de Madron, X. D., Mortier, L., Prieur, L., and Gatti, J.: Impact of intermittent convection in the northwestern Mediterranean Sea on oxygen content, nutrients, and the carbonate system, J. Geophys. Res.-Oceans, 127, e2022JC018615, https://doi.org/10.1029/2022JC018615, 2022.
Friedland, R., Macias, D., Cossarini, G., Daewel, U., Estournel, C., Garcia-Gorriz, E., Grizzetti, B., Grégoire, M., Gustafson, B., Kalaroni, S., Kerimoglu, O., Lazzari, P., Lenhart, H., Lessin, G., Maljutenko, I., Miladinova, S., Müller-Karulis, B., Neumann, T., Parn, O., Pätsch, J., Piroddi, C., Raudsepp, U., Schrum, C., Stegert, C., Stips, A., Tsiaras, K., Ulses, C., and Vandenbulcke, L.: Effects of nutrient management scenarios on marine eutrophication indicators: a pan-European, multi-model assessment in support of the Marine Strategy Framework Directive, Front. Mar. Sci., 8, 596126, https://doi.org/10.3389/fmars.2021.596126, 2021.
Grasshoff, K., Ehrhardt, M., and Kremling, K.: Methods of Seawater Analysis, in: 2nd Edn., Verlag Chemie Weinhein, New York, 419 pp., https://doi.org/10.1002/9783527613984, 1983.
Grasshoff, K., Kremling, K., and Ehrhardt, M.: Methods of Seawater Analysis, 3rd edn., Wiley-VCH Verlag GmbH, Weinheim, 203–223, https://doi.org/10.1002/9783527613984, 1999.
Grégoire, M., Oschlies, A., Canfield, D. E., Castro, C., Ciglenečki, I., Croot, P., Salin, K., Schneider, B., Serret, P., Slomp, C., Tesi, T., and Yücel, M.: Ocean oxygen: the role of the Ocean in the oxygen we breathe and the threat of deoxygenation, EMB Future Science Brief No. 10, European Marine Board, Ostend, Belgium, 82 pp., https://doi.org/10.5281/zenodo.7941157, 2023.
Hainbucher, D., Rubino, A., Cardin, V., Tanhua, T., Schroeder, K., and Bensi, M.: Hydrographic situation during cruise M84/3 and P414 (spring 2011) in the Mediterranean Sea, Ocean Sci., 10, 669–682, https://doi.org/10.5194/os-10-669-2014, 2014.
Hoppema, M., Velo, A., van Heuven, S., Tanhua, T., Key, R. M., Lin, X., Bakker, D. C. E., Perez, F. F., Ríos, A. F., Lo Monaco, C., Sabine, C. L., Álvarez, M., and Bellerby, R. G. J.: Consistency of cruise data of the CARINA database in the Atlantic sector of the Southern Ocean, Earth Syst. Sci. Data, 1, 63–75, https://doi.org/10.5194/essd-1-63-2009, 2009.
Janzen, C., Murphy, D., and Larson, N.: Getting more mileage out of dissolved oxygen sensors in long-term moored applications, in: OCEANS 2007, IEEE, 29 September–4 October 2007, Vancouver, BC, Canada, https://doi.org/10.1109/OCEANS.2007.4449398, 2007.
Johnson, G. C., Robbins, P. E., and Hufford, G. E.: Systematic adjustments of hydrographic sections for internal consistency, J. Atmos. Ocean. Tech., 18, 1234–1244, https://doi.org/10.1175/1520-0426(2001)018<1234:SAOHSF>2.0.CO;2, 2001.
Jullion, L.: TAlPro2016: A Tyrrhenian Sea and Alger-Provençal component of the MedSHIP Programme, RV Angeles Alvariño, 18/08/16–29/08/16, Palermo (Italy) – Barcelona (Spain), Bremerhaven, EUROFLEETS2 Cruise Summary Report, https://epic.awi.de/id/eprint/49725/ (last access: June 2024), 2016.
Keeling, R. F., Körtzinger, A., and Gruber, N.: Ocean deoxygenation in a warming world, Annu. Rev. Mar. Sci., 2, 199–229, https://doi.org/10.1146/annurev.marine.010908.163855, 2010.
Key, R. M., Kozyr, A., Sabine, C. L., Lee, K., Wanninkhof, R., Bullister, J. L., Feely, R. A., Millero, F. J., Mordy, C., and Peng, T.-H.: A global ocean carbon climatology: Results from Global Data Analysis Project (GLODAP), Global Biogeochem. Cy., 18, GB4031, https://doi.org/10.1029/2004GB002247, 2004.
Key, R. M., Tanhua, T., Olsen, A., Hoppema, M., Jutterström, S., Schirnick, C., Van Heuven, S., Kozyr, A., Lin, X., Velo, A., Wallace, D. W. R., and Mintrop, L.: The CARINA data synthesis project: introduction and overview, Earth Syst. Sci. Data, 2, 105–121, https://doi.org/10.5194/essd-2-105-2010, 2010.
Langdon, C.: Determination of Dissolved Oxygen in Seawater by Winkler Titration using Amperometric Technique, in: The GO-SHIP Repeat Hydrography Manual: A Collection of Expert Reports and Guidelines, Version 1, edited by: Hood, E. M., Sabine, C. L., and Sloyan, B. M., IOCCP Report Number 14, ICPO Publication Series Number 134, 18 pp., Ocean Best Practices, https://doi.org/10.25607/OBP-1350, 2010.
Lauvset, S. K. and Tanhua, T.: A toolbox for secondary quality control on ocean chemistry and hydrographic data, Limnol. Oceanogr.-Meth., 13, 601–608, https://doi.org/10.1002/lom3.10050, 2015.
Lauvset, S. K., Lange, N., Tanhua, T., Bittig, H. C., Olsen, A., Kozyr, A., Álvarez, M., Azetsu-Scott, K., Brown, P. J., Carter, B. R., Cotrim da Cunha, L., Hoppema, M., Humphreys, M. P., Ishii, M., Jeansson, E., Murata, A., Müller, J. D., Pérez, F. F., Schirnick, C., Steinfeldt, R., Suzuki, T., Ulfsbo, A., Velo, A., Woosley, R. J., and Key, R. M.: The annual update GLODAPv2.:2023 the global interior ocean biogeochemical data product, Earth Syst. Sci. Data, 16, 2047–2072, https://doi.org/10.5194/essd-16-2047-2024, 2024.
Li, P. and Tanhua, T.: Recent Changes in Deep Ventilation of the Mediterranean Sea; Evidence From Long-Term Transient Tracer Observations, Front. Mar. Sci., 7, 594. https://doi.org/10.3389/fmars.2020.00594, 2020.
Liu, G., Yu, X., Zhang, J., Wang, X., Xu, N., and Ali, S.: Reconstruction of the three-dimensional dissolved oxygen and its spatio-temporal variations in the Mediterranean Sea using machine learning, J. Environ. Sci., https://doi.org/10.1016/j.jes.2025.01.010, 2025.
López-Jurado, J. L., Balbín, R., Alemany, F., Amengual, B., Aparicio-González, A., Fernández de Puelles, M. L., García-Martínez, M. C., Gazá, M., Jansá, J., Morillas-Kieffer, A., Moyá, F., Santiago, R., Serra, M., and Vargas-Yáñez, M.: The RADMED monitoring programme as a tool for MSFD implementation: towards an ecosystem-based approach, Ocean Sci., 11, 897–908, https://doi.org/10.5194/os-11-897-2015, 2015.
Macias, D., Garcia-Gorriz, E., and Stips, A.: Deep winter convection and phytoplankton dynamics in the NW Mediterranean Sea under present climate and future (horizon 2030) scenarios, Sci. Rep.-UK, 8, 6626, https://doi.org/10.1038/s41598-018-24965-0, 2018.
Manca, B., Burca, M., Giorgetti, A., Coatanoan, C., Garcia, M. J., and Iona, A.: Physical and biochemical averaged vertical profiles in the Mediterranean regions: an important tool to trace the climatology of water masses and to validate incoming data from operational oceanography, J. Marine Syst., 48, 83–116, https://doi.org/10.1016/j.jmarsys.2003.11.025, 2004.
Margirier, F., Testor, P., Heslop, E., Mallil, K., Bosse, A., Houpert, L., Mortier, L., Bouin, M.-N., Coppola, L., D'Ortenzio, F., Durrieu de Madron, X., Mourre, B., Prieur, L., Raimbault, P., and Taillandier, V.: Abrupt warming and salinification of intermediate waters interplays with decline of deep convection in the Northwestern Mediterranean Sea, Sci. Rep., 10, 20923, https://doi.org/10.1038/s41598-020-77859-5, 2020.
Martínez, J., Leonelli, F. E., García-Ladona, E., Garrabou, J., Kersting, D. K., Bensoussan, N., and Pisano, A.: Evolution of marine heatwaves in warming seas: the Mediterranean Sea case study, Front. Mar. Sci., 10, 1193164, https://doi.org/10.3389/fmars.2023.1193164, 2023.
Marullo, S., De Toma, V., di Sarra, A., Iacono, R., Landolfi, A., Leonelli, F., Napolitano, E., Meloni, D., Organelli, E., Pisano, A., Santoleri, R., and Sferlazzo, D.: Has the frequency of Mediterranean Marine Heatwaves really increased in the last decades?, EGU General Assembly 2023, Vienna, Austria, 23–28 April 2023, EGU23-4429, https://doi.org/10.5194/egusphere-egu23-4429, 2023.
Mavropoulou, A.-M.: Mediterranean Sea: Dissolved Oxygen, Temperature and Salinity Annual Variability and Monthly Climatology for the period 1960–2011, Zenodo [data set], https://doi.org/10.5281/zenodo.3878076, 2020.
Mavropoulou, A.-M., Vervatis, V., and Sofianos, S.: Dissolved oxygen variability in the Mediterranean Sea, J. Marine Syst., 208, 103348, https://doi.org/10.1016/j.jmarsys.2020.103348, 2020.
Middleton, L., Wu, W., Johnston, T. M. S., Tarry, D. R., Farrar, J. T., Poulain, P.-M., Özgökmen, T. M., Shcherbina, A. Y., Pascual, A., McNeill, C. L., Belgacem, M., Berta, M., Abbott, K., Worden, A. Z., Wittmers, F., Kinsella, A., Centurioni, L. R., Hormann, V., Cutolo, E., Tintoré, J., Ruiz, S., Casas, B., Cheslack, H., CALYPSO Collaboration, D'Asaro, E. A., and Mahadevan, A.: Observations of a splitting ocean cyclone resulting in subduction of surface waters, Sci. Adv., 11, eadu3221, https://doi.org/10.1126/sciadv.adu3221, 2025.
Olsen, A., Key, R. M., van Heuven, S., Lauvset, S. K., Velo, A., Lin, X., Schirnick, C., Kozyr, A., Tanhua, T., Hoppema, M., Jutterström, S., Steinfeldt, R., Jeansson, E., Ishii, M., Pérez, F. F., and Suzuki, T.: The Global Ocean Data Analysis Project version 2 (GLODAPv2) – an internally consistent data product for the world ocean, Earth Syst. Sci. Data, 8, 297–323, https://doi.org/10.5194/essd-8-297-2016, 2016.
Olsen, A., Lange, N., Key, R. M., Tanhua, T., Álvarez, M., Becker, S., Bittig, H. C., Carter, B. R., Cotrim da Cunha, L., Feely, R. A., van Heuven, S., Hoppema, M., Ishii, M., Jeansson, E., Jones, S. D., Jutterström, S., Karlsen, M. K., Kozyr, A., Lauvset, S. K., Lo Monaco, C., Murata, A., Pérez, F. F., Pfeil, B., Schirnick, C., Steinfeldt, R., Suzuki, T., Telszewski, M., Tilbrook, B., Velo, A., and Wanninkhof, R.: GLODAPv2.2019 – an update of GLODAPv2, Earth Syst. Sci. Data, 11, 1437–1461, https://doi.org/10.5194/essd-11-1437-2019, 2019.
Olsen, A., Lange, N., Key, R. M., Tanhua, T., Bittig, H. C., Kozyr, A., Álvarez, M., Azetsu-Scott, K., Becker, S., Brown, P. J., Carter, B. R., Cotrim da Cunha, L., Feely, R. A., van Heuven, S., Hoppema, M., Ishii, M., Jeansson, E., Jutterström, S., Landa, C. S., Lauvset, S. K., Michaelis, P., Murata, A., Pérez, F. F., Pfeil, B., Schirnick, C., Steinfeldt, R., Suzuki, T., Tilbrook, B., Velo, A., Wanninkhof, R., and Woosley, R. J.: An updated version of the global interior ocean biogeochemical data product, GLODAPv2.2020, Earth Syst. Sci. Data, 12, 3653–3678, https://doi.org/10.5194/essd-12-3653-2020, 2020.
Pastor, F. and Khodayar, S.: Marine heat waves: Characterizing a major climate impact in the Mediterranean, EGU General Assembly 2023, Vienna, Austria, 24–28 April 2023, EGU23-13058, https://doi.org/10.5194/egusphere-egu23-13058, 2023.
Powley, H. R., Krom, M. D., and Van Cappellen, P.: Circulation and oxygen cycling in the Mediterranean Sea: Sensitivity to future climate change, J. Geophys. Res.-Oceans, 121, 8230–8247, https://doi.org/10.1002/2016JC012224, 2016.
Reale, M., Cossarini, G., Lazzari, P., Lovato, T., Bolzon, G., Masina, S., Solidoro, C., and Salon, S.: Acidification, deoxygenation, and nutrient and biomass declines in a warming Mediterranean Sea, Biogeosciences, 19, 4035–4065, https://doi.org/10.5194/bg-19-4035-2022, 2022.
Ribotti, A., Sorgente, R., Pessini, F., Cucco, A., Quattrocchi, G., and Borghini, M.: Twenty-one years of hydrological data acquisition in the Mediterranean Sea: quality, availability, and research, Earth Syst. Sci. Data, 14, 4187–4199, https://doi.org/10.5194/essd-14-4187-2022 , 2022.
Sabine, C. L., Hoppema, M., Key, R. M., Tilbrook, B., van Heuven, S., Lo Monaco, C., Metzl, N., Ishii, M., Murata, A., and Musielewicz, S.: Assessing the internal consistency of the CARINA data base in the Pacific sector of the Southern Ocean, Earth Syst. Sci. Data, 2, 195–204, https://doi.org/10.5194/essd-2-195-2010, 2010.
Schneider, A., Tanhua, T., Roether, W., and Steinfeldt, R.: Changes in ventilation of the Mediterranean Sea during the past 25 year, Ocean Sci., 10, 1–16, https://doi.org/10.5194/os-10-1-2014, 2014.
Schroeder, K.: TAlPro2022 CRUISE REPORT R/V BELGICA Cruise n. 2022/12 (Version 1), Zenodo [code], https://doi.org/10.5281/zenodo.6918731, 2022.
Schroeder, K., Gasparini, G. P., Tangherlini, M., and Astraldi, M.: Deep and intermediate water in the western Mediterranean under the influence of the Eastern Mediterranean Transient, Geophys. Res. Lett., 33, L21607, https://doi.org/10.1029/2006GL027121, 2006.
Schroeder, K., Tanhua, T., Bryden, H., Alvarez, M., Chiggiato, J., and Aracri, S.: Mediterranean Sea Ship-based Hydrographic Investigations Program (Med-SHIP), Oceanography, 28, 12–15, https://doi.org/10.5670/oceanog.2015.71, 2015.
Schroeder, K., Chiggiato, J., Bryden, H. L., Borghini, M., and Ben Ismail, S.: Abrupt climate shift in the Western Mediterranean Sea, Sci. Rep.-UK, 6, 23009, https://doi.org/10.1038/srep23009, 2016.
Schroeder, K., Kovačević, V., Civitarese, G., Velaoras, D., Álvarez, M., Tanhua, T., Jullio, L., Coppola, L., Bensi, M., Ursella, L., Santinelli, C., Giani, M., Chiggiato, J., Aly-Eldeen, M., Assimakopoulou, G., Bachi, G., Bogner, B., Borghini, M., Cardin, V., Cornec, M., Giannakourou, A., Giannoudi, L., Gogou, A., Golbol, M., Or Hazan, O., Karthäuser, C., Kralj, M., Krasakopoulou, E., Matić, F., Mihanović, H., Muslim, S., Papadopoulos, V. P., Parinos, C., Paulitschke, A., Pavlidou, A., Pitta, E., Protopapa, M., Rahav, E., Raveh, O., Renieris, P., Reyes-Suarez, N. C., Rousselaki, E., Silverman, J., Souvermezoglou, E., Urbini, L., Zer, C., and Zervoudaki, S.: Seawater physics and chemistry along the Med-SHIP transects in the Mediterranean Sea in 2016, Sci. Data, 11, 52, https://doi.org/10.1038/s41597-023-02835-3, 2024.
Tanhua, T.: Matlab Toolbox to Perform Secondary Quality Control (2nd QC) on Hydrographic Data, ORNL CDIAC-158, Carbon Dioxide Inf. Anal. Center, Oak Ridge Natl. Lab., US Dep. Energy, Oak Ridge, Tennessee, 158, https://doi.org/10.1002/lom3.10050, 2010.
Tanhua, T.: Hydrochemistry of water samples during MedSHIP cruise Talpro, PANGAEA [data set], https://doi.org/10.1594/PANGAEA.902293, 2019a.
Tanhua, T.: Physical oceanography during MedSHIP cruise Talpro, PANGAEA [data set], https://doi.org/10.1594/PANGAEA.902330, 2019b.
Tanhua, T., Brown, P. J., and Key, R. M.: CARINA: nutrient data in the Atlantic Ocean, Earth Syst. Sci. Data, 1, 7–24, https://doi.org/10.5194/essd-1-7-2009, 2009.
Tanhua, T., Steinfeldt, R., Key, R. M., Brown, P., Gruber, N., Wanninkhof, R., Perez, F., Körtzinger, A., Velo, A., Schuster, U., van Heuven, S., Bullister, J. L., Stendardo, I., Hoppema, M., Olsen, A., Kozyr, A., Pierrot, D., Schirnick, C., and Wallace, D. W. R.: Atlantic Ocean CARINA data: overview and salinity adjustments, Earth Syst. Sci. Data, 2, 17–34, https://doi.org/10.5194/essd-2-17-2010, 2010.
Tanhua, T., Hainbucher, D., Schroeder, K., Cardin, V., Álvarez, M., and Civitarese, G.: The Mediterranean Sea system: a review and an introduction to the special issue, Ocean Sci., 9, 789–803, https://doi.org/10.5194/os-9-789-2013, 2013.
Testor, P., Bosse, A., Houpert, L., Margirier, F., Mortier, L., Legoff, H., Dausse, D., Labaste, M., Bouin, M.-N., Coppola, L., Koenig, Z., Damien, P., Estournel, C., Marsaleix, P., Taupier-Letage, I., Raimbault, P., Waldman, R., Bouin, M.-N., Giordani, H., Caniaux, G., Somot, S., Ducrocq, V., and Conan, P.: Multiscale observations of deep convection in the northwestern Mediterranean Sea during winter 2012–2013 using multiple platforms, J. Geophys. Res.-Oceans, 122, 1745–1776, https://doi.org/10.1002/2016JC012671, 2017.
Uchida, H. Johnson, G. C., and McTaggart, G. C.: CTD Oxygen Sensor Calibration Procedures, in: The GO-SHIP Repeat Hydrography Manual: A Collection of Expert Reports and Guidelines, Version 1, edited by: Hood, E. M., Sabine, C. L., and Sloyan, B. M., IOCCP Report Number 14; ICPO Publication Series Number 134, Ocean Best Practices, 17 pp., https://doi.org/10.25607/OBP-1344, 2010.
Ulses, C., D'Ortenzio, F., Coppola, L., Estournel, C., Testor, P., Marsaleix, P., Prieur, L., Taillandier, V., Dumas, F., Severin, T., and Conan, P.: Oxygen budget of the north-western Mediterranean deep-convection region, Biogeosciences, 18, 937–960, https://doi.org/10.5194/bg-18-937-2021, 2021.
Yao, M., Marcou, O., Goyet, C., Guglielmi, V., Touratier, F., and Savy, J.-P.: Time variability of the north-western Mediterranean Sea pH over 1995–2011, Mar. Environ. Res., 116, 51–60, https://doi.org/10.1016/j.marenvres.2016.02.016, 2016.
- Abstract
- Introduction
- Dissolved oxygen data collection
- Primary and secondary quality control methods
- Secondary quality control results, correction factors to improve the CTD-O2 WMED dataset
- Data availability
- Summary and conclusions
- Author contributions
- Competing interests
- Disclaimer
- Acknowledgements
- Financial support
- Review statement
- References
- Supplement