the Creative Commons Attribution 4.0 License.
the Creative Commons Attribution 4.0 License.
 | 07 Oct 2025
A database of glacier prokaryotic genomes and genes for the Three Poles
Yongqin Liu
Songnian Hu
Tao Yu
Yingfeng Luo
Zhihao Zhang
Yuying Chen
Shunchao Guo
Qinglan Sun
Guomei Fan
Linhuan Wu
Juncai Ma
Keshao Liu
Pengfei Liu
Junzhi Liu
Ruyi Dong
Glaciers cover 10 % of Earth's land area and are a pool of carbon and nitrogen for downstream ecosystems. Microbes, including bacteria, fungi, algae, and other microeukaryotes, are the primary inhabitants of glacier ecosystems and are key drivers of carbon and nitrogen transformation. Among them, prokaryotes (including bacteria and archaea) are the most diverse and abundant. Here, we present a dataset of supraglacial bacterial and archaeal (referred to as prokaryotic hereafter) communities across the Antarctic, Arctic, Tibetan Plateau, and other alpine regions. The dataset comprises 2039 amplicon sequencing data points, 999 cultured bacterial genomes, and 208 metagenomes, covering ice, snow, and cryoconite habitats. The dataset contains 64 510 prokaryotic amplicon sequencing phylotypes, with a higher diversity in the Tibetan glaciers than in the Antarctic and Arctic glaciers, which were respectively enriched with Gammaproteobacteria, Bacteroidota, and Alphaproteobacteria. The dataset also contains 62 595 715 unique genes and 4501 prokaryotic genomes, a 35.5 % expansion from previous publications. Genes were annotated for those associated with carbohydrate-active enzymes, nitrogen cycling, methane cycling, antimicrobial resistance, and microbial virulence, revealing the dynamic microbial functions in glacial habitats. This comprehensive dataset provides standardized prokaryotic diversity, taxonomy, community structure, and genetic functions of glacial microbiomes. The data can be leveraged to elucidate ecological principles governing the distribution of prokaryotes, to gain insights into the key functional genes for supraglacial microbiomes, to build mechanistic models, and to identify any potential biohazards for policymakers to make informed decisions regarding climate change. The dataset is available at the Global Glacier Genome and Gene Database (https://nmdc.cn/4gdb/, last access: 11 July 2025; DOI: https://doi.org/10.11888/Cryos.tpdc.300830, Liu et al., 2023).
- Article
(5580 KB) - Full-text XML
-
Supplement
(4983 KB) - BibTeX
- EndNote


Glaciers cover 10 % of Earth's land area (Cauvy-Fraunié and Dangles, 2019) and are mainly distributed in the Antarctic, Arctic, and Tibetan Plateau (the Three Poles) (Qiu, 2008). Glaciers store approximately three-quarters of Earth's fresh water (Boetius et al., 2015) and are also a pool of carbon and nitrogen. It has been estimated that 6 Pg of carbon is stored in global glaciers. These carbon may be released into downstream ecosystems with glacier runoff (Hood et al., 2015), influencing key elemental cycling in downstream ecosystems. Before carbons and nitrogen are released, they undergo extensive biological transformation (Guo et al., 2022), primarily microbially driven. Microbes, including bacteria, fungi, algae, and other microeukaryotes, are the main inhabitants of glacier ecosystems (Cauvy-Fraunié and Dangles, 2019), while bacteria are the most abundant and diverse. These microorganisms employ strategies to survive the glacial conditions, such as strong UV radiation, low temperature, and low-carbon and low-nitrogen nutrients (Ciccazzo et al., 2016). As microorganisms are the key driver of carbon and nitrogen transformation in glacier ecosystems, knowledge of their biogeography and functions can greatly enhance our understanding of the biogeochemical cycling in glacial ecosystems and aid in predicting the impact of climate change.
The glacier as a habitat is not homogeneous and is divided into supraglacial, englacial, and subglacial ecosystems. Compared with other glacier-related habitats, the microorganisms in supraglacial ecosystems are the most active due to their exposure to the external environment and ambient temperature. Supraglacial ecosystems can be further separated into snow, ice, and cryoconite holes (cylindrical depressions formed by the preferential melting of dark debris into the surface, typically comprising surface water and cryoconite at the bottom) (Cook et al., 2016), each of which has a distinct microbial composition (Anesio and Laybourn-Parry, 2012). Algae and Cyanobacteria are the primary producers in supraglacial ecosystems, with other heterotrophic microorganisms participating in the transformation and degradation of endogenous and exogenous nutrients (Hotaling et al., 2017; Anesio et al., 2017). Active metabolism is reported in glacial ecosystems; for instance, cryoconite is a source of methane but a sink of carbon dioxide, with a rate of 4.60 and −1.77 µmol m−2 d−1, respectively (Zhang et al., 2021). Furthermore, organisms with photosynthesis, nitrification, and denitrification functions are also widespread in glacier cryoconite (Cameron et al., 2012; Stibal et al., 2020).
It was estimated that the mean microbial abundance in glacier surface meltwater is 104 cells mL−1 (Stevens et al., 2022); this quantity may further increase with enhanced climate warming (Segawa et al., 2005). Some of these naturally occurring microorganisms are known as emerging contaminants, which are not commonly monitored in the environment but have the potential to enter the environment and cause known or suspected adverse ecological and/or human health effects (Taheran et al., 2018). A previous study cultivated hemolytic bacteria from Spitsbergen glacier meltwater with potential pathogenicity (Mogrovejo-Arias et al., 2020). Other emerging contaminants in glaciers, such as antibiotic resistance genes and microbial virulence factors, have also received increased attention (Mao et al., 2023).
Here, we present a glacier dataset of glacial prokaryotes (bacteria and archaea) across the Antarctic, Arctic, Tibetan Plateau, and other alpine regions. This dataset includes amplicon sequencing data from 2039 samples, 999 cultured bacterial genomes, and shotgun metagenomic sequencing from 224 samples (Fig. 1). From an ecological perspective, this dataset with standardized prokaryotic diversity, taxonomy, and community structure can improve understanding of the ecological principles governing the distribution of microorganisms across glaciers, as well as their partitioning across the various habitats in the supraglacial ecosystem. From a geochemical cycling perspective, the database can provide insights into the key functional genes for supraglacial microbiomes, which can be used to better comprehend carbon and nitrogen cycling and allow the building of a model to anticipate glacial carbon and nitrogen dynamics in the future. The dataset archives glacially specific microorganisms and unique genes in digital form, thus representing an invaluable resource for bioprospecting. Additionally, the dataset can be employed to identify any potential biohazards (pathogens and emerging contaminants) of glaciers and evaluate the impact of glacier melting on downstream ecosystems from a biosafety perspective, thereby assisting policymakers in making informed decisions regarding climate change.
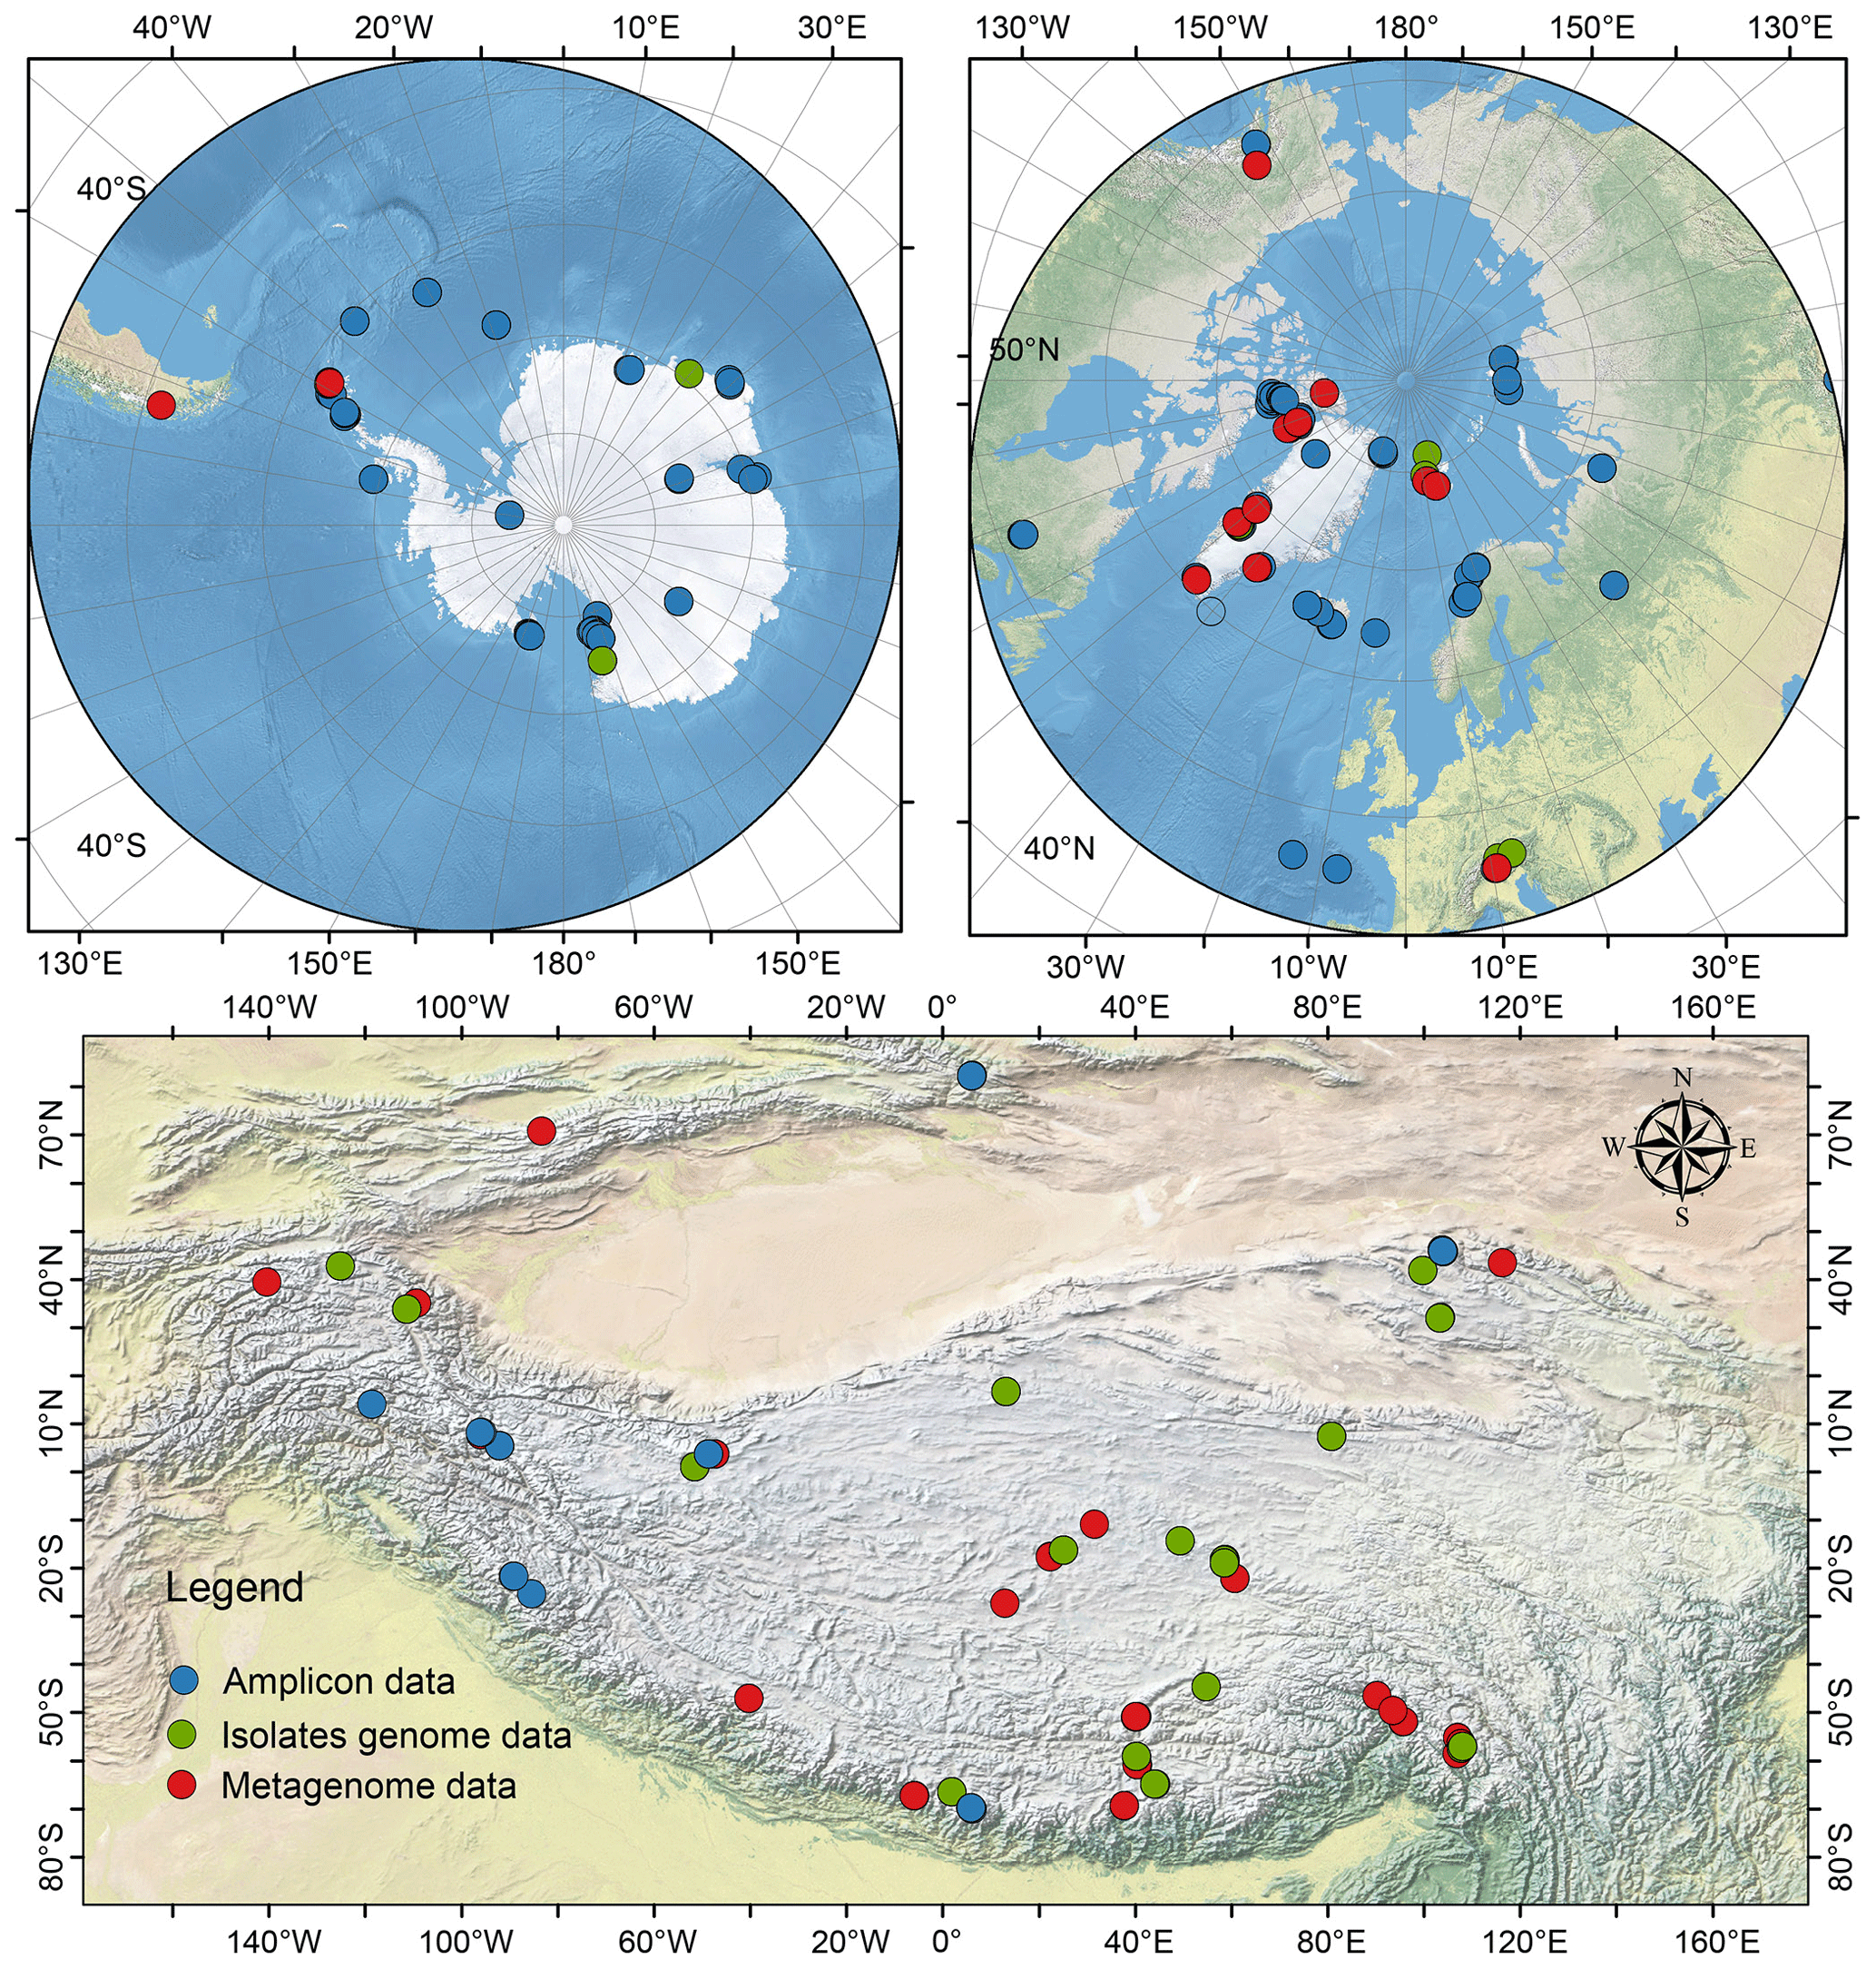
Figure 1The location of glacier samples across the Antarctic, Arctic, and Tibetan glaciers.
2.1 Data acquisition
Amplicon data. Based on the keywords of “glacier” OR “snow” OR “ice” OR “cryoconite” with sample type being DNA and instrument of Illumina, we retrieved 225 378 Short Read Archives (SRAs) initially. Then the results were filtered manually to remove non-supra-glacier habitats (such as glacier forefield, subglacial sediment, proglacial lakes, ice cave), metagenome data, and primers that do not amplify the V4 region of the 16S rRNA gene (i.e., those that amplify V3V4, V4, and V4V5 were retained) (Tables S1 and S2 in the Supplement).
Metagenome data. All articles containing the keyword “glacier metagenome” were retrieved using the Web of Science (searched on the 1 December 2022). Only studies with sequenced ice, snow, or cryoconite samples with raw sequence data uploaded on the NCBI (National Center for Biotechnology Information) Short Read Archive were kept. Additionally, a small amount of metagenome data without published articles were added from the Integrated Microbial Genomes & Microbiomes (IMG/M) database and the National Microbiology Data Center (NMDC) database based on a keyword search of the terms “ice”, “snow”, and “cryoconite”. In addition to metagenomes from the Antarctic, Arctic, and Tibetan Plateau, metagenomes from the Andes and Alps were also downloaded (Table S3).
Cultivated bacterial genome data. A total of 883 isolate genome data points of Tibetan Plateau glaciers were obtained from the TG2G dataset (Liu et al., 2022), and another 116 genomes of bacterial isolates from glaciers beyond the Tibetan Plateau were downloaded from the NCBI genome database based on a keyword search of the terms “Antarctic” and “Arctic”. After careful manual curation, only samples from ice, snow, and cryoconite habitats were kept (Table S4).
2.2 Amplicon sequencing data processing
Sequencing data were processed using the USEARCH v11 pipeline (Edgar, 2010) on a sequencing project basis. For each NCBI sequencing project, the reads associated with the project were first merged and quality-screened with a maximum expected error threshold of 0.5, while single-end reads were directly quality-screened using the same threshold. The quality-filtered reads from each bioproject were aligned with the SILVA reference alignment (release 128) to ensure that the V4 hypervariable region is covered, using the align.seqs command in mothur. After removing any sequences that do not cover the V4 region (using screen.seqs in mothur), the remaining sequences were dereplicated. After this pre-processing was completed for all bioprojects, the dereplicated sequences of different bioprojects were combined and dereplicated again. Then, these further dereplicated sequences were clustered with 97 % identity, and chimeric sequences were identified and removed using the cluster_otus command in USEARCH. The representative sequences were used as the references for operational taxonomic unit (OTU) table construction. Additionally, the representative sequences were taxonomically classified using the Bayesian classifier against the Silva database (release 132) (Quast et al., 2012). Then, mitochondria, chloroplast, and eukaryotic sequences were removed from the OTU table. After removing samples with fewer than 5000 reads, the final OTU table comprises 2039 samples and 64 510 OTUs. The sequencing depth (number of reads) ranges from 5036 to 1 492 659 per sample. We retained two datasets, one without rarefaction (Table S5) and another being subsampled (rarefied) to 5036 reads (Table S6).
We calculated the Shannon diversity, richness (number of phylotypes), evenness, and Good's coverage indices for both original and subsampled data using R. The alpha diversity indices (richness, evenness, and Shannon diversity) and the relative abundance of dominant taxonomic lineages were compared by region (Antarctic, Arctic, Tibetan Plateau, and other alpine regions) and habitat (snow, ice, and cryoconite) using Kruskal–Wallis one-way ANOVA, and multiple testing was performed based on Dunn's post hoc test using the Fisheries Stock Assessment (FSA) package in the R environment (Ogle et al., 2022). The community structure variations were visualized using a non-metric multidimensional scaling (NMDS) ordination plot based on the Hellinger-transformed Bray–Curtis distance matrix. Permutational analysis of variance (PERMANOVA) was used to test the significance of community differences in samples by region and habitat (Anderson, 2017) using the “vegan” package in R with 999 permutations. PERMDISP analysis was performed using the betadisper command in the vegan package. Core phylotypes were defined as occurring in more than 55 % of the samples with an average relative abundance >0.1 % in each habitat–region pair (Delgado-Baquerizo et al., 2018). If a phylotype was identified as a core phylotype for all habitats of a region, then it was designated as the core phylotype for the region.
2.3 Metagenome data processing
Metagenome data processing has been described previously (Liu et al., 2022). Briefly, it includes raw data quality-filtering, assembly, open reading frame prediction, and genome binning. Gene open reading frames (ORFs) for the metagenomic assemblies were predicted using Prodigal (Hyatt et al., 2010) and dereplicated by clustering in the 80 % aligned region with 95 % nucleotide identity using MMseqs2 (Steinegger and Söding, 2017) with the following parameters: easy-linclust -e 0.001, –min-seq-id 0.95, -c 0.80.
Metagenomic assemblies were binned using MetaBAT 2 (v2.12.1) (Kang et al., 2019), MaxBin 2 (v2.2.7) (Wu et al., 2016), and VAMB (v2.0.1) (Nissen et al., 2021) separately. The resulting bins (or MAGs) were then refined using RefineM (v0.0.20) (Parks et al., 2017) by removing contigs with divergent guanine–cytosine (GC) content, coverage, or tetranucleotide signatures. Then only MAGs meeting the medium and higher quality of MIMAG (Bowers et al., 2017a) were retained (completeness >50 %, contamination <10 %). The obtained MAGs were combined with the cultured bacterial genomes, and these genomes were dereplicated using the thresholds of 10 % aligned fraction and a genome-wide average nucleotide identity (ANI) threshold of 95 %. They were then taxonomically annotated using the Genome Taxonomy Database Toolkit (GTDB-Tk, v2.4) (Chaumeil et al., 2019) against the GTDB release R220.
2.4 Gene function annotation
The functions of the dereplicated genes were annotated using eggNOG-mapper (Huerta-Cepas et al., 2017) against the eggNOG orthologous groups (OGs) database (v5.0) (Huerta-Cepas et al., 2019). This includes the Kyoto Encyclopedia of Genes and Genomes (KEGG) functional orthologs (Kanehisa et al., 2017), the carbohydrate-active enzyme database (CAZy) (Levasseur et al., 2013), and the COG categories (Tatusov et al., 2003). Antibiotic resistance genes (ARGs) were annotated against the Comprehensive Antibiotic Resistance Database (CARD) (Jia et al., 2017) and Resistance Gene Identifier (RGI v3.1.4) (Alcock et al., 2020) with the loose model (–include_loose). Virulence factors were annotated by aligning gene sequences against the Virulence Factors Database (VFDB 2019) (Liu et al., 2019) with DIAMOND blastp (Buchfink et al., 2021) (e-value threshold of ).
The data introduced here are the first step in archiving global glacier microbial data. For this purpose, the data are deposited into the Global Glacier Genome and Gene Database (4GDB, https://nmdc.cn/4gdb/) and the National Tibetan Plateau Data Center (https://doi.org/10.11888/Cryos.tpdc.300830, Liu et al., 2023), which provides a comprehensive solution for glacier microbial studies, featuring an amplicon-sequencing phylotype table, representative sequences, taxonomic annotations, metagenomic raw sequences, assembled contigs, annotated gene sequences, sequences of metagenome-assembled genomes, and the growth characteristics of cultivated microorganisms, on a user-friendly website. The website is constructed under the OSI-approved CC BY 4.0 Open Source license (https://creativecommons.org/licenses/by/4.0/, last access: 11 July 2025), and all data can be accessed and reused freely, without any restrictions, for both academic and commercial purposes.
The 4GDB website is structured into three main sections, comprising amplicon sequencing, metagenome/genome sequences, and function prediction. The user-friendly web interface allows data filtering based on sample type, sample location, habitat type, gene type, and taxonomy, enabling seamless download of the filtered results. In conclusion, 4GDB (https://nmdc.cn/4gdb/downloadtemp, last access: 11 July 2025) provides an open-access genome- and gene-oriented resource platform that is regularly updated to include newly published and in-house-generated sequence data.
Tables S5 and S6 are deposited at https://figshare.com (last access: 11 July 2025; DOI: https://doi.org/10.6084/m9.figshare.28423781.v2, Ji, 2025).
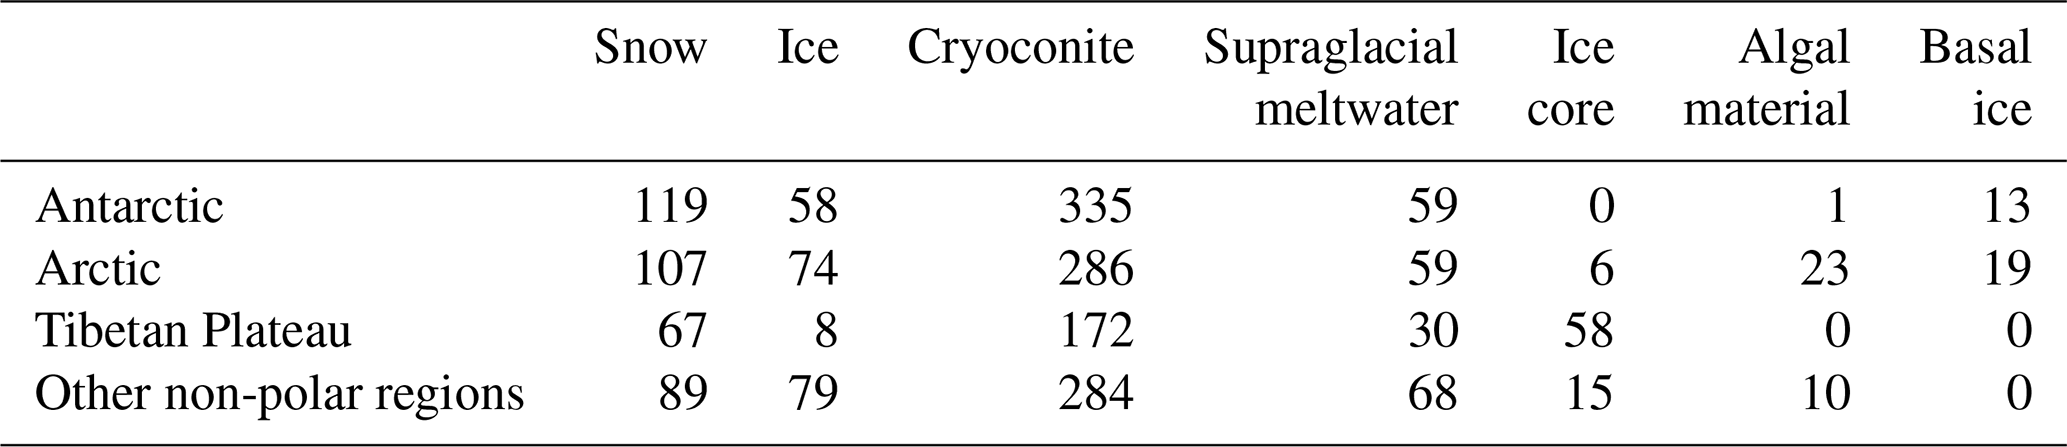
4.1 Amplicon-based dataset
A total of 2039 glacier-related samples were retained after quality-filtering, comprising 1077 from cryoconite sediments, 601 from snow or ice, 216 from glacial melting water (including cryoconite hole meltwater and supraglacial melting water), 79 from ice core, 34 from snow during algal blooming (algal material), and 32 from subglacial basal ice (Table 1). Spatially, 29 % of all samples (n = 574) were from the Antarctic, 28 % (n = 574) from Arctic glaciers, 16 % (n = 335) from the Tibetan Plateau (n = 335), and 27 % from other alpine regions (n = 545; the Alps, Kenya, Japan, and Montana Glacier National Park).
The retained datasets originate from 66 bioprojects, 8 of which missed sequencing platform information and 2 of which missed primer information (Table S2). Most of these bioprojects do not have environmental metadata and are therefore not included in the dataset. A variety of primers were used by these projects, amplifying the hypervariable regions V3V4, V4, and V4V5. These data were harmonized by retaining only the V4 region (sequence trimming). Surprisingly, four bioprojects that used primers 783F and 1046R (V5V6 region) were also retained. We speculate that incorrect primers may have been provided in the NCBI.
4.1.1 Prokaryotic diversity
Good's coverage index provides an estimation for the number of singletons in a sample, reflecting the coverage of the sequencing. The values of the index were 0.98 ± 0.02 and 0.96 ± 0.02 for the datasets without and with subsampling, respectively (Table S7). This indicates that the majority of the OTUs were identified. The amplicon sequencing dataset comprised 64 510 phylotypes. Due to the large variation in sequencing depth among samples, here we only presented patterns that are consistently observed in the original and subsampled OTU tables (Tables 2, 3, and S7). Across all habitats, the number of OTUs observed (prokaryotic richness) was significantly lower in other non-polar regions than those in the Three Poles (Antarctic, Arctic, and Tibetan Plateau). This pattern is also significantly observed for the alpha diversity indices, including the Chao1, ACE, and Gini Simpson, but not in the Shannon diversity. Specifically, the prokaryotic Shannon diversity of the Arctic glaciers was not significantly different from that of other non-polar glaciers. Across habitats (Table 3), supraglacial meltwater had the highest prokaryotic diversity compared with other habitats (except the ice core). The alpha diversity indices typically follow the order of supraglacial meltwater > snow > ice core > ice > cryoconite > algae-influenced snow > basal ice. This may reflect the strength of environmental filtering among the habitats.
We further compared the alpha diversity indices of the same habitats across different regions (Table S8). Due to the bias in the number of samples across habitats, here we only compared the diversity indices in cryoconite, snow, ice, and supraglacial water. For cryoconites, their prokaryotic diversity (Shannon diversity and Gini Simpson indices) was the highest in the Antarctic, which was followed by the Arctic, Tibetan Plateau, and other non-polar glaciers. For snow, its prokaryotic diversity (Richness, Chao1, and ACE indices) was the highest in Tibetan glaciers, followed by Antarctic, Arctic, and other non-polar glaciers. For ice, the diversity indices were not significantly different across all regions, with only significantly higher values of diversity than in the Arctic and Tibetan Plateau being observed in the Antarctic. For supraglacial meltwater, other non-polar glaciers demonstrated the highest diversity (Shannon diversity and Gini Simpson diversity indices, all P < 0.05), while the Antarctic had the lowest values. In summary, the biogeographic pattern for prokaryotic diversity in the same habitat differed among regions.
We further assessed the influence of the region amplified on the validity of the results. For each region–habitat pair, the alpha diversity indices were significantly different to a certain extent. However, those from Arctic basal ice, other non-polar glacier ice, and Tibetan Plateau supraglacial meltwater were less affected (Table S9). Nevertheless, the influence may be explained by the different sampling locations, which have distinct microbial compositions. We further tested the validity of the diversity comparison results using the data that were generated using the same primer set (Table S10). The influence of primer selection on prokaryotic diversity was inconsistent. For instance, primers targeting the V4 region resulted in a higher richness in supraglacial ice than primers targeting the V3V4 region in other alpine glaciers. In contrast, the primers targeting the V3V4 region resulted in a higher richness in the Antarctic and Arctic. Such inconsistency in microbial community assessment by different primers and platforms has been reported previously (Fredriksson et al., 2013; Tremblay et al., 2015). Thus, the homogenization method may not fully overcome the bias caused by primer selection. Nevertheless, we provided comprehensive information on the primer and regions amplified; thus users may choose to use the entire dataset or only those using the same primer for analysis.
Table 2Diversity metrics of the bacterial community in glacier microbiomes of global glaciers.
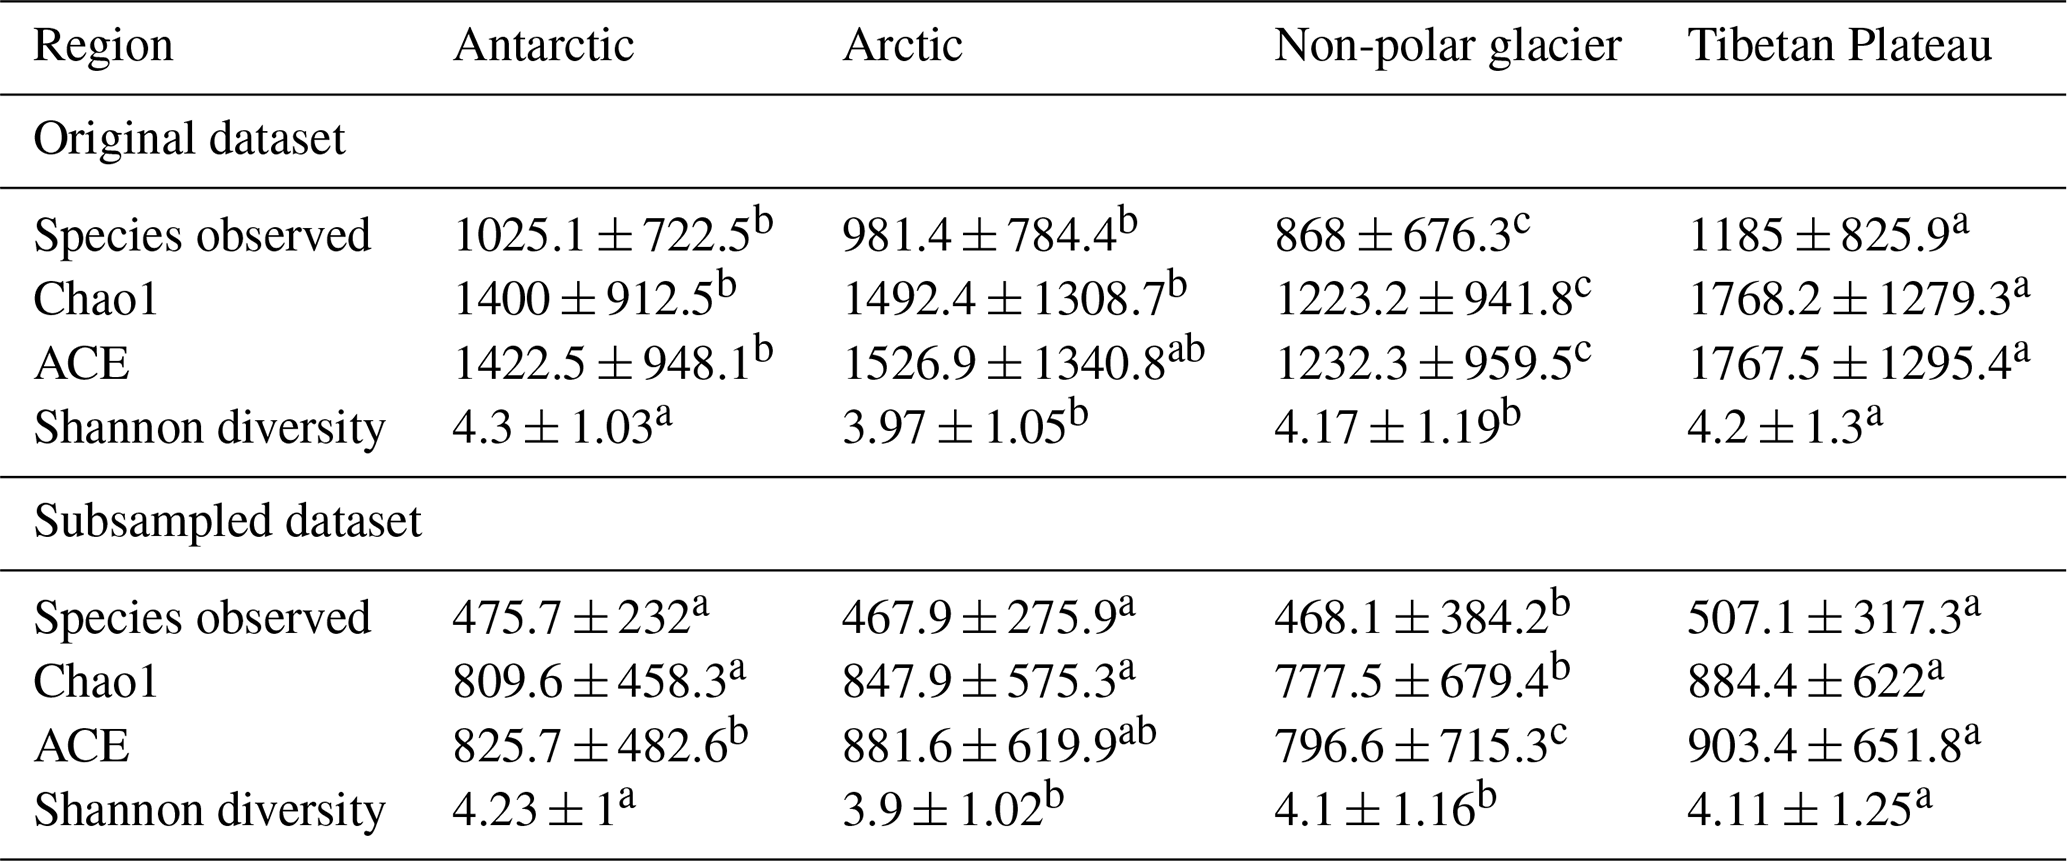
Statistical test is based on Kruskal–Wallis one-way ANOVA; multiple testing is performed based on Dunn's post hoc test. Different superscript letters within each row indicate significant pairwise differences between regions at P = 0.05, based on Kruskal–Wallis one-way ANOVA followed by Dunn's post hoc test (with Bonferroni correction). Values sharing the same letter are not significantly different.
Table 3Diversity metrics of the bacterial community in glacier microbiomes of different habitats.
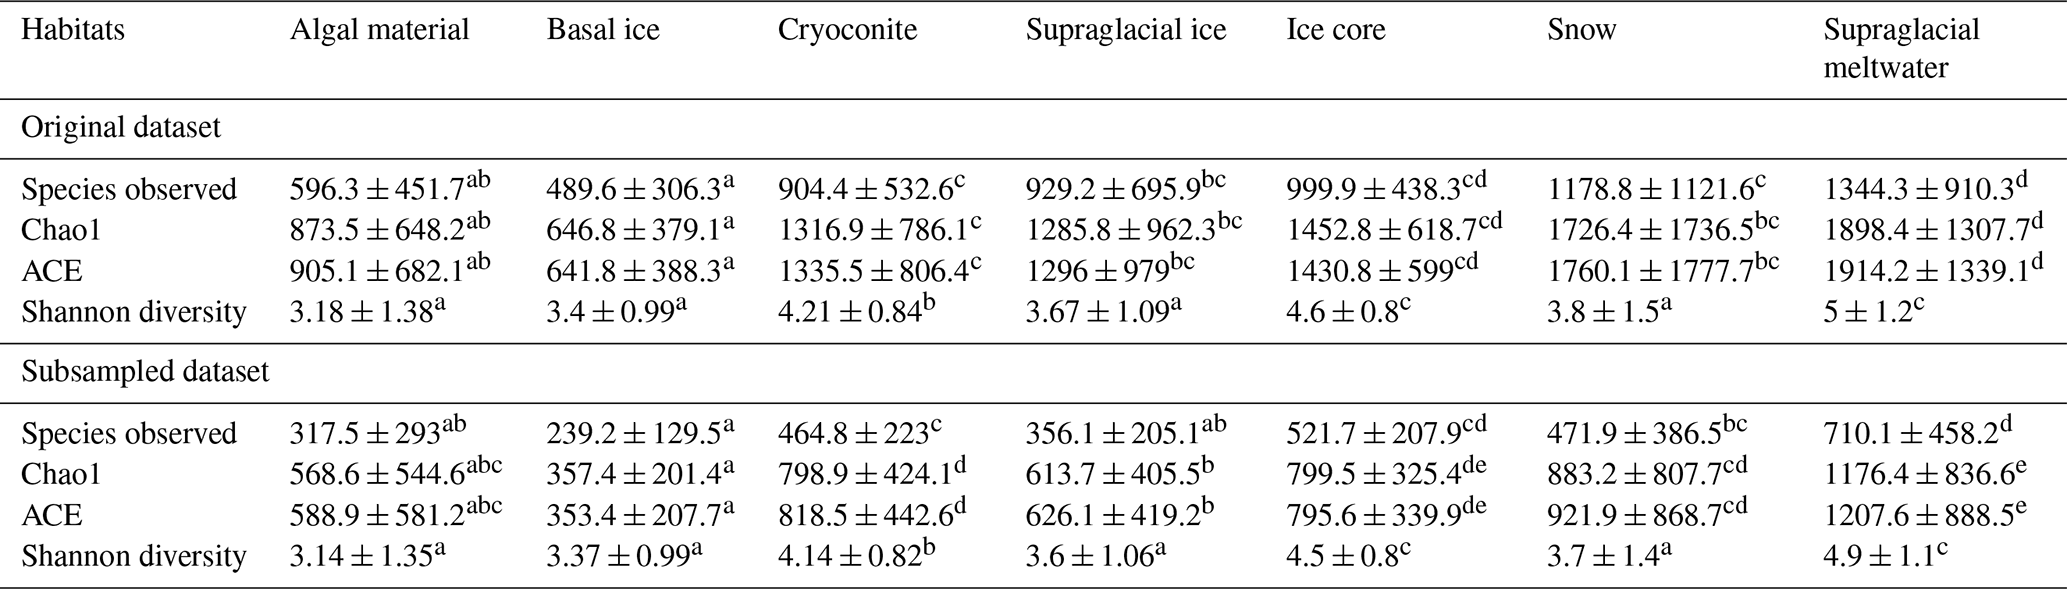
Statistical test is based on Kruskal–Wallis one-way ANOVA; multiple testing is performed based on Dunn's post hoc test. Different superscript letters within each row indicate significant pairwise differences between habitats at P = 0.05, based on Kruskal–Wallis one-way ANOVA followed by Dunn's post hoc test (with Bonferroni correction). Values sharing the same letter are not significantly different.
4.1.2 Prokaryotic taxonomy composition in the glaciers of the Three Poles
We identified 53 bacterial and archaeal phyla across the dataset. The glacier microbiomes had similar taxonomic composition, dominated by Proteobacteria (averaged 37.8 %), Cyanobacteria (22.2 %), Bacteroidetes (20.3 %), and Actinobacteria (9.2 %) (Fig. 2 and Tables S11). At the class level (Tables S12), the microbiome was dominated by Gammaproteobacteria (22.7 %, Proteobacteria), Oxyphotobacteria (22.1 %, Cyanobacteria), Bacteroidia (22.2 %, Bacteroidetes), Alphaproteobacteria (13 %, Proteobacteria), and Actinobacteria (class) (8.1 %, Actinobacteria).
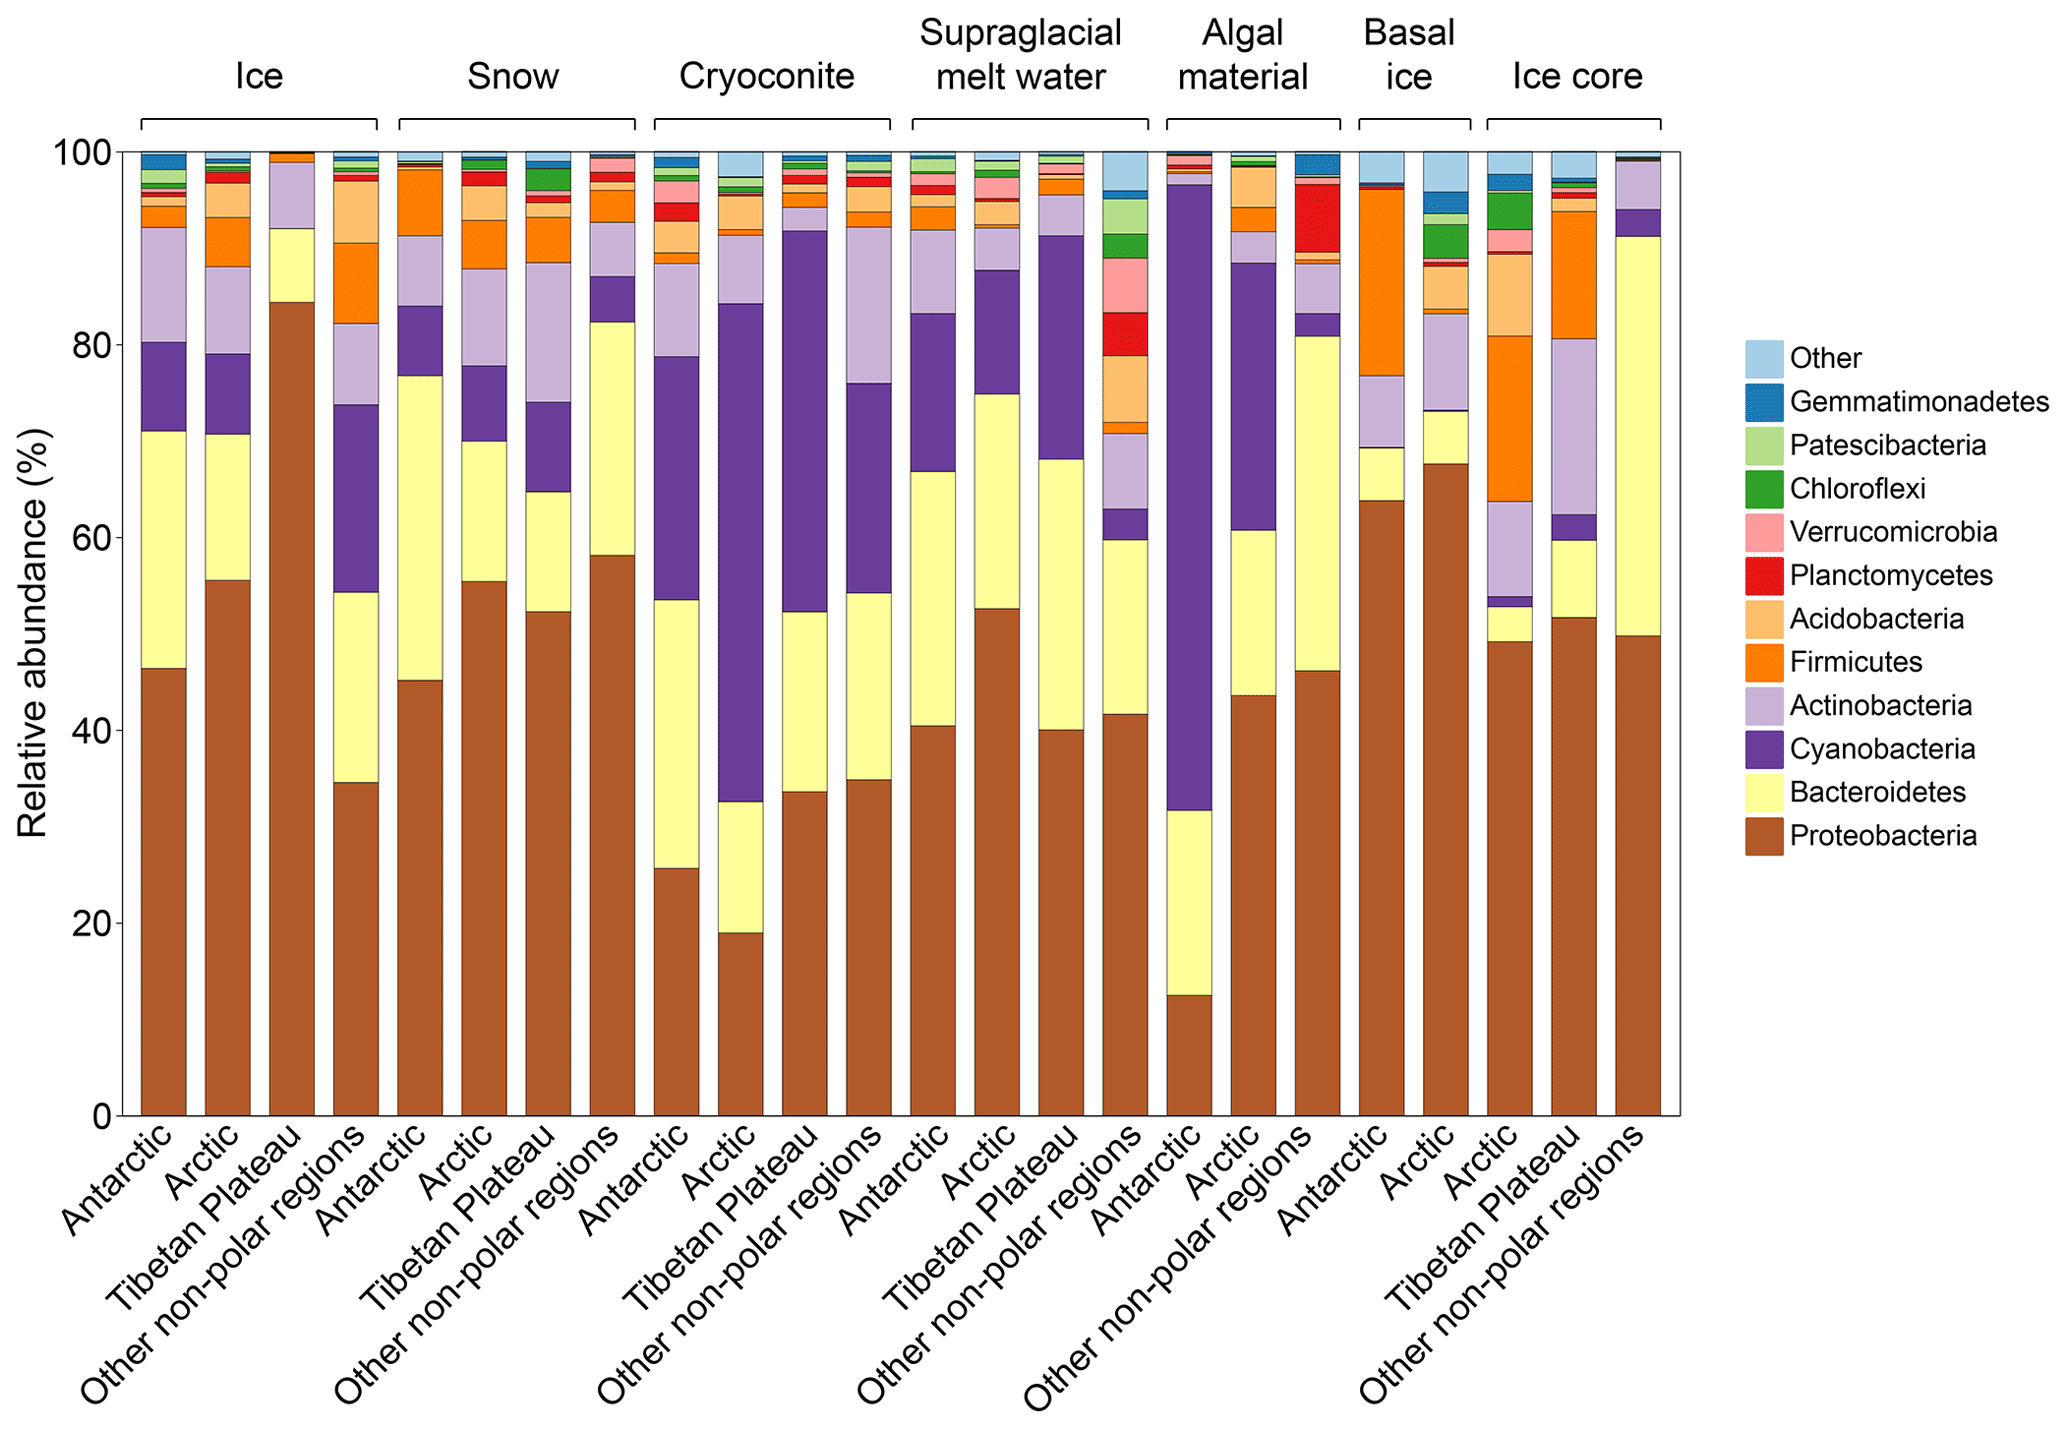
Figure 2Taxonomy composition of supraglacial ecosystems in glaciers of the Antarctic, Arctic, Tibetan Plateau, and other alpine regions. Taxonomy is inferred based on amplicon sequencing results.
4.1.3 Bacterial community structure in the glaciers of the Three Poles
The NMDS ordination plot revealed distinct prokaryotic communities among habitats (Fig. 3a). PERMANOVA analysis showed significantly different prokaryotic community structures among Antarctic, Arctic, Tibetan Plateau, and other non-polar glaciers (P < 0.001). The influence of location exhibited a higher R2 value (0.10535) than the influence of habitat (R2=0.06299), suggesting that spatial location may have a greater influence in shaping glacier microbiomes. PERMDISP analysis showed that snow samples exhibited a significantly (at the threshold of P = 0.05) higher dispersal from the centroid (67.4 %) compared to cryoconite (65.1 %). Comparatively, those of ice core and algae were lower (57.9 % and 58.9 %, respectively), possibly due to the low sample numbers.
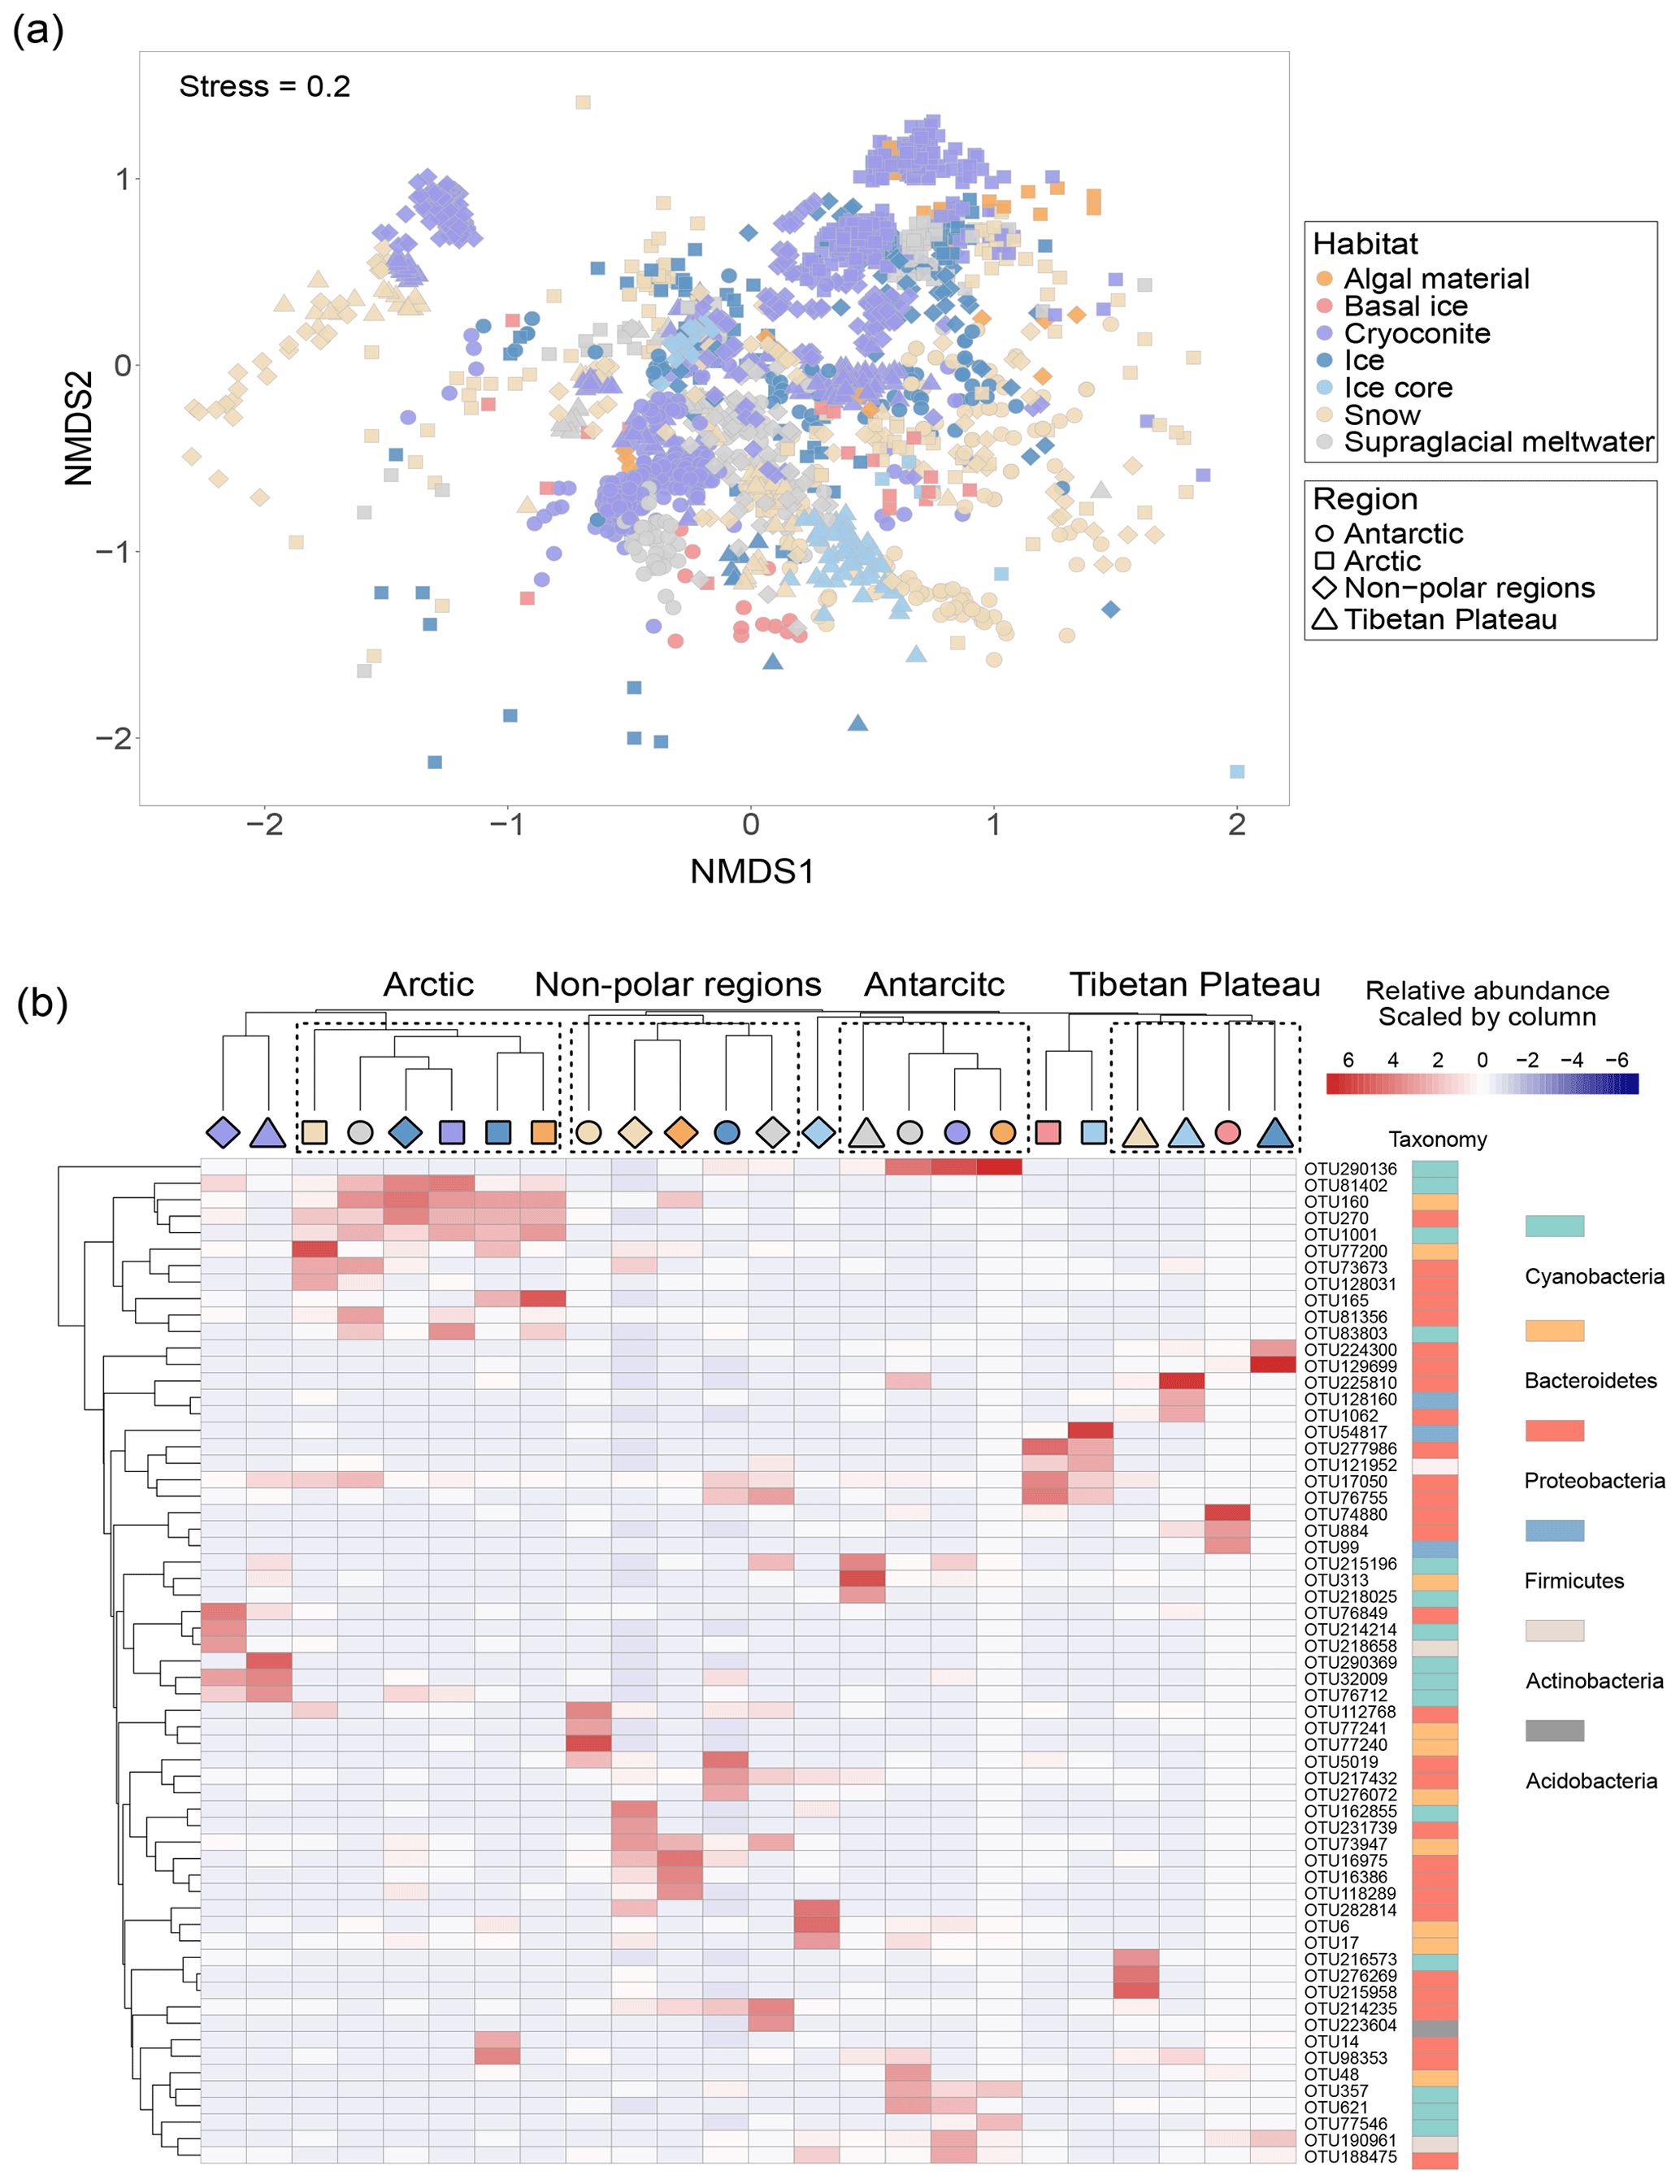
Figure 3The community structure of glacier microbiomes across the Antarctic, Arctic, and Tibetan Plateau. (a) Microbial community structure differences visualized using the non-metric multidimensional scaling ordination plot. (b) The heatmap highlights the distribution pattern of dominant phylotypes for each habitat–region pair.
We identified the top three most abundant phylotypes for each habitat–region pair (Fig. 3b and Table S13). These abundant phylotypes were mainly affiliated with Proteobacteria, Cyanobacteria, and Bacteroidetes. The distribution of these abundant phylotypes was clustered predominantly by geographical location, reflecting strong spatial effects. We then attempted to identify ubiquitous phylotypes for each region–habitat pair, defined as those present in more than 55 % of samples with a relative abundance greater than 0.1 %. However, we found no phylotypes that were common across any regions or habitats (Table S14). The number of ubiquitous phylotypes varied among region–habitat pairs, ranging from 9 in Arctic ice to 129 in Tibetan supraglacial meltwater. Notably, we did not identify any ubiquitous phylotypes in Arctic snow or other non-polar snow. Most of the ubiquitous phylotypes were classified as Gammaproteobacteria (29 % of the total), followed by Bacteroidetes (19 %), Alphaproteobacteria (16 %), Cyanobacteria (13 %), and Actinobacteria (11 %). This distribution may indicate their ability to disperse and adapt to different environmental conditions.
4.2 Metagenome and genome dataset
We acquired 226 glacier metagenome data points (Table S3) and 999 bacterial genomes from glacial environments (Table S4). After quality-filtering, assembly, gene prediction, and dereplication, 63 294 073 unique open reading frames (ORFs) were obtained. Of these dereplicated ORFs, 47.8 % (29 947 128) can be functionally annotated using eggNOG.
4.2.1 Overall features of glacier metagenome-assembled genomes
After binning, the dataset generated 3502 metagenome-assembled genomes of medium quality (genome completion ≥ 50 %, contamination < 10 %) and higher (Bowers et al., 2017b). After combining the genomes of cultivated glacier bacteria (999), this expanded the total genome number to 4501 from the previously published 3322 (Liu et al., 2022) (Table S15), a 35.5 % increase. The median genome size was 3.46 Mb, ranging from 0.42 to 10.49 Mb; the GC percentage was 60 %, ranging from 30 % to 76 %. The MAGs were taxonomically affiliated with 33 phyla, 79 classes, 154 orders, 271 families, and 549 genera (Fig. 4a). Additionally, 3470 (77.1 % of all MAGs) were unable to be classified at the species level (Fig. 4b), reflecting substantial genomic novelty in the glacier microbiome. These genomes were dereplicated into 1400 genomic OTUs (gOTUs), which are typically considered species.
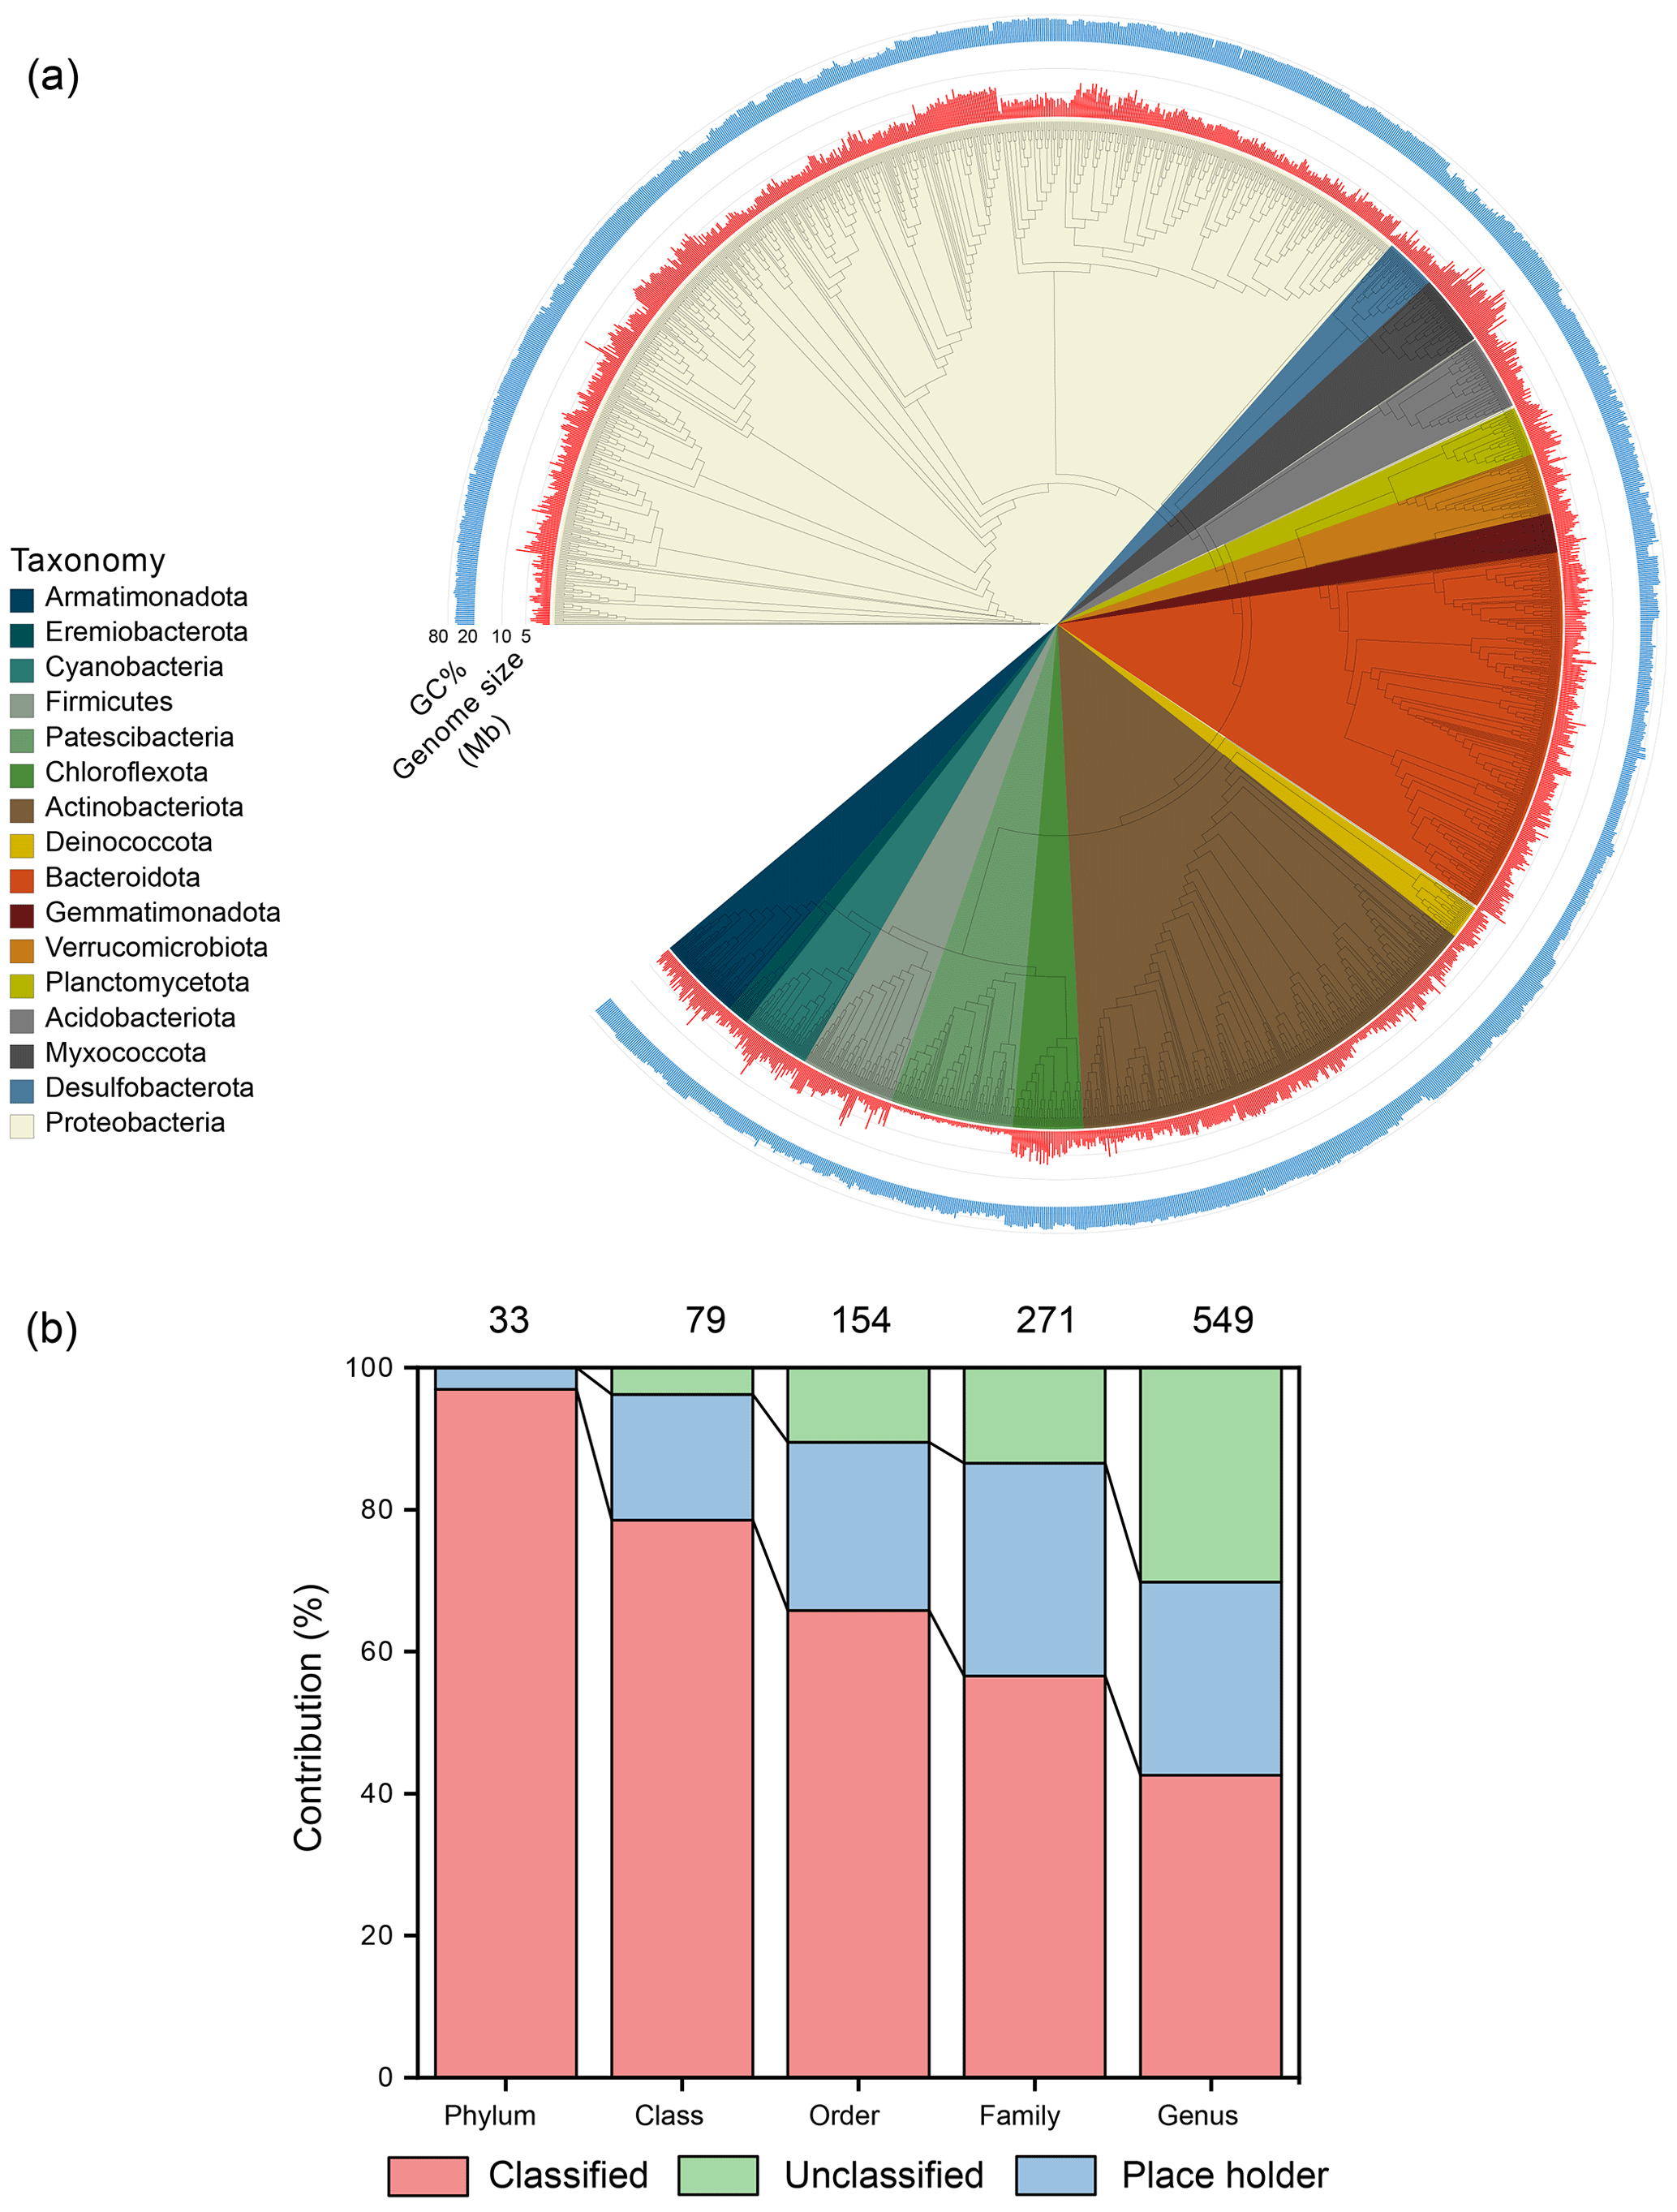
Figure 4Taxonomy classification of the obtained prokaryotic genomes. (a) The phylogenetic tree contains the representative bacterial genomic OTUs with genome size and GC percentage being shown. (b) The taxonomic classification of the obtained genomes. Classified refers to valid taxonomic classification, placeholders are genomes that have been deposited in the GTDB R220 database, and unclassified refers to genomes that have not been deposited in the GTDB database.
4.2.2 Key functional genes
Carbohydrate-active enzymes. The dataset contains 1 082 125 genes encoding carbohydrate-active enzymes (CAZymes; Fig. 5a), i.e., those enzymes involved in the metabolism of glycoconjugates, oligosaccharides, and polysaccharides (Zerillo et al., 2013). Genes associated with carbohydrate hydrolysis (GH) and biosynthesis (GT) were the most abundant, accounting for 45.2 % and 44.4 %, respectively. In contrast, those genes associated with non-hydrolytic cleavage of glycosidic bonds (PL), hydrolysis of carbohydrate esters (CEW), and assisting in degrading biomass substrates (AA) were relatively scarce, accounting for 0.8 %, 3.1 %, and 0.2 % of the predicted CAZymes, respectively. This indicates that the glacier microbiome is competent in a diverse range of carbon transformation processes, mediating the delivery of carbon to downstream ecosystems.
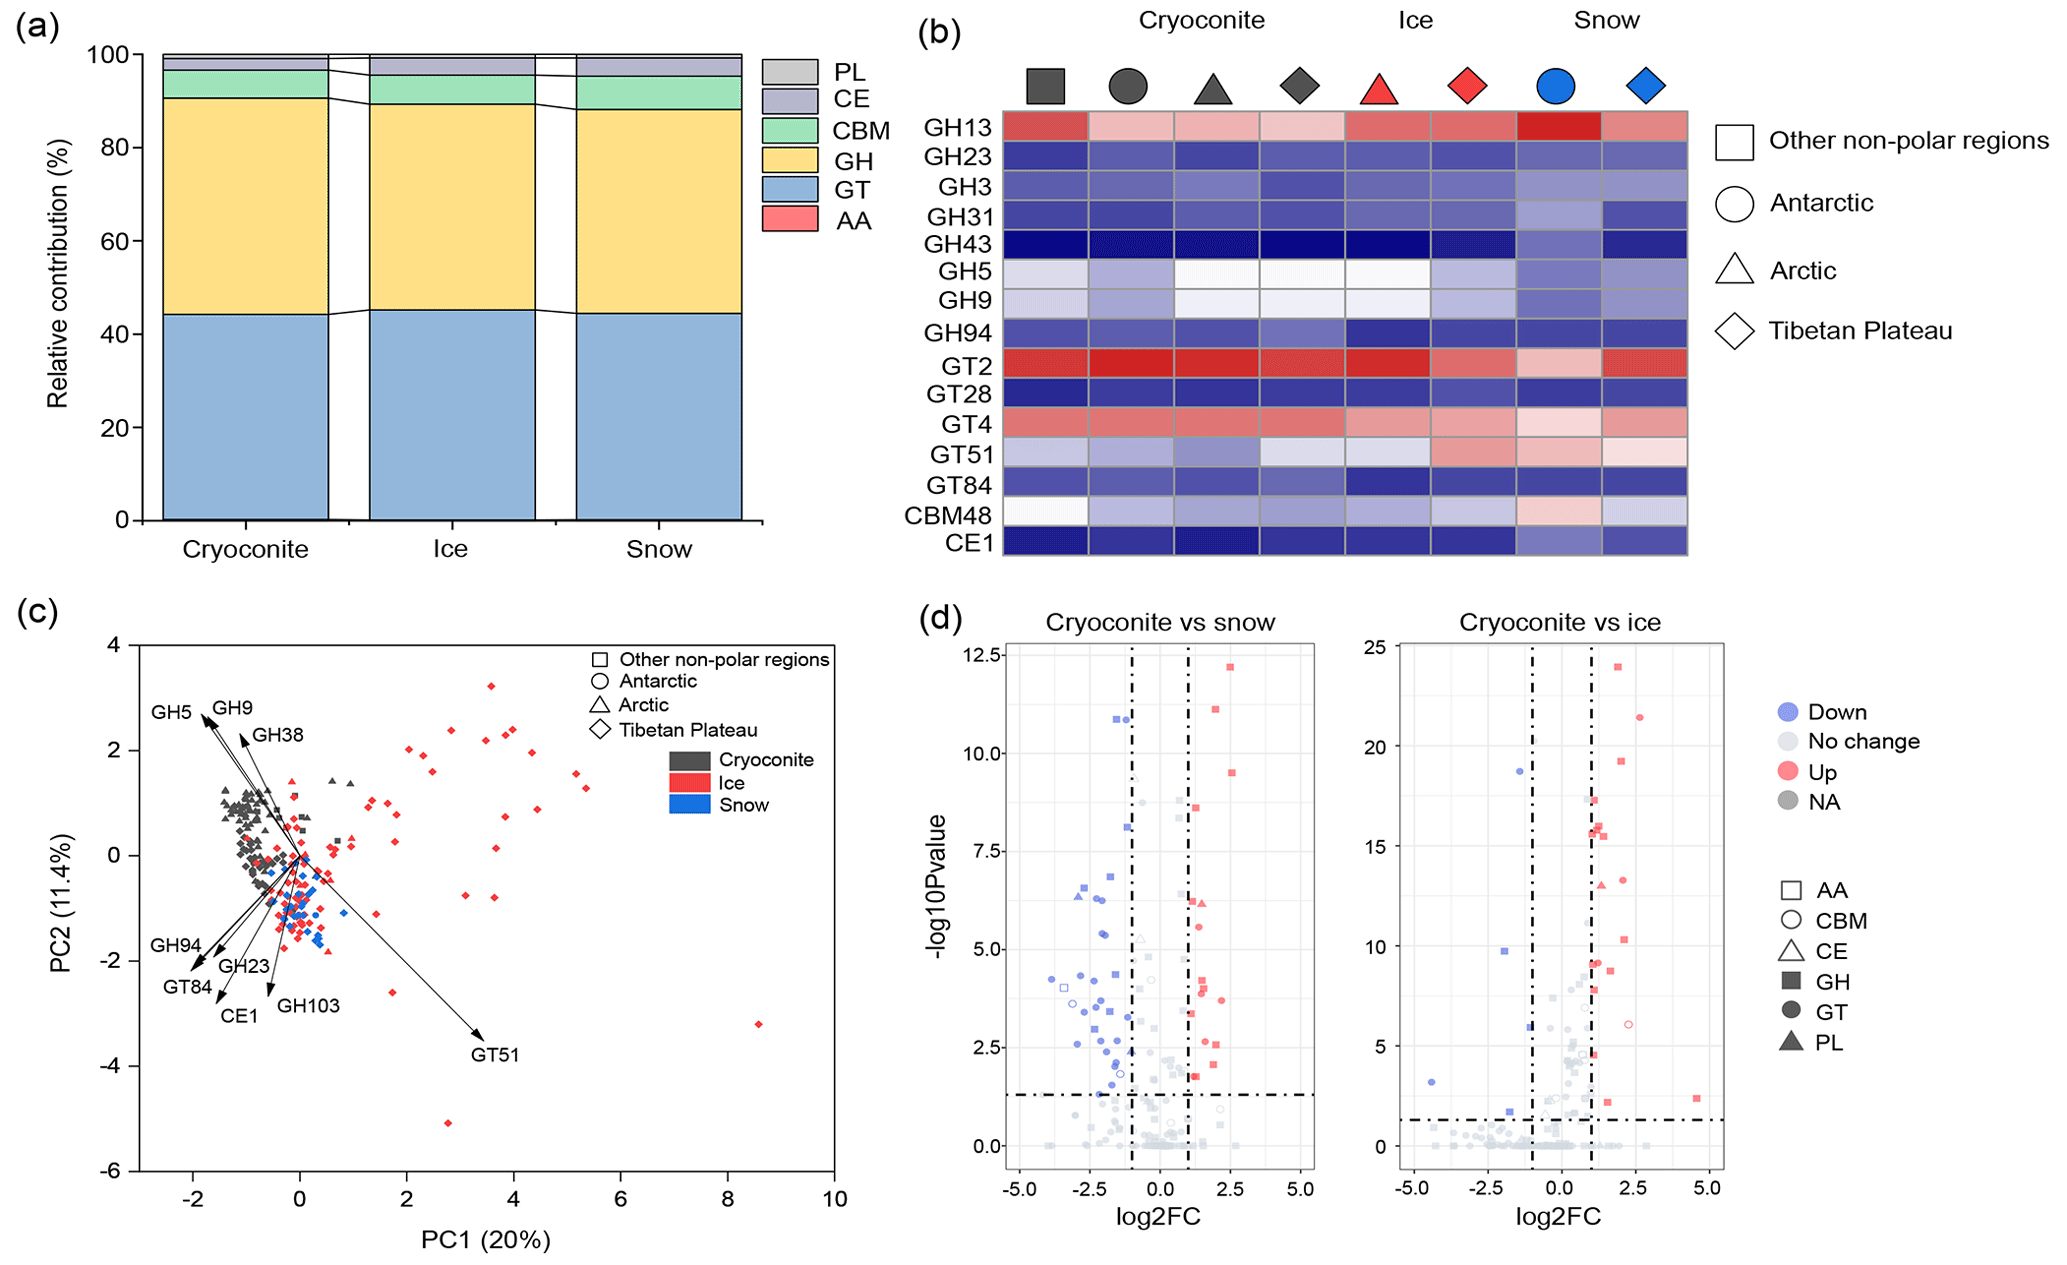
Figure 5The distribution of genes associated with carbohydrate-active enzymes (CAZymes) in glaciers. (a) The relative contributions of genes associated with different CAZymes in each habitat (GH: glycoside hydrolases; GT: glycosyl transferases; PL: polysaccharide lyases; CE: carbohydrate esterases; AA: auxiliary activities). (b) The most diverse CAZymes in each habitat–region combination. (c) PCA plots show the distribution of CAZymes across habitats and regions. (d) The selective enrichment of CAZymes between cryoconite and snow and between cryoconite and ice.
We further examined the distribution of CAZyme genes across different glaciers. At the CAZY family level, GT2, GT4, GH13, and GT51 were the most diverse across all habitats (Fig. 5b). PERMANOVA tests revealed significant composition differences by both habitat (pseudo-F = 10.014, P < 0.001) and region (pseudo-F = 5.038, P=0.002), with habitat exhibiting a greater influence on CAZY composition. Specifically, the principal component analysis (PCA) plot revealed that cryoconites harbor a greater number of genes classified as GH5 and GH9 (Fig. 5c). Furthermore, 30 GHs and 20 GTs exhibited a significantly higher contribution in cryoconites than in ice or snow (Fig. 5d). Comparatively, 15 GHs and 27 GTs exhibited a significantly higher contribution in ice or snow than in cryoconites. Thus, cryoconites exhibited higher capacity in the catabolism of organic carbon, whereas snow and ice are more prevalent in anabolism.
Nitrogen cycling. The dataset contained 138 421 unique genes associated with nitrogen cycling, most of which (99.3 %) were associated with nitrate reduction and/or denitrification pathways (Fig. 6a). These genes included the nirB gene responsible for the nitrite reduction to ammonia in the assimilatory nitrate reduction pathway, the narB and nirA genes responsible for sequential nitrate reduction to ammonia in dissimilatory nitrate reduction pathways, and the nirK gene responsible for nitrite reduction to nitric oxide in the denitrification pathway. This suggests that microbially driven nitrate reduction is widespread in glacial habitats for both nitrogen assimilation and energy supply, highlighting their potential roles in NOx formation. In comparison, genes involved in nitrogen fixation (nifH) and nitrification (hao) were relatively rare, with only 678 (0.49 % of the nitrogen cycling-related genes) and 240 (0.17 %) unique genes identified, respectively. This suggests that microorganisms capable of these high-energy demand processes only account for a small fraction of the glacial microbiome, which is consistent with the low nitrogen fixation rates reported in glacier-related habitats (Telling et al., 2011).
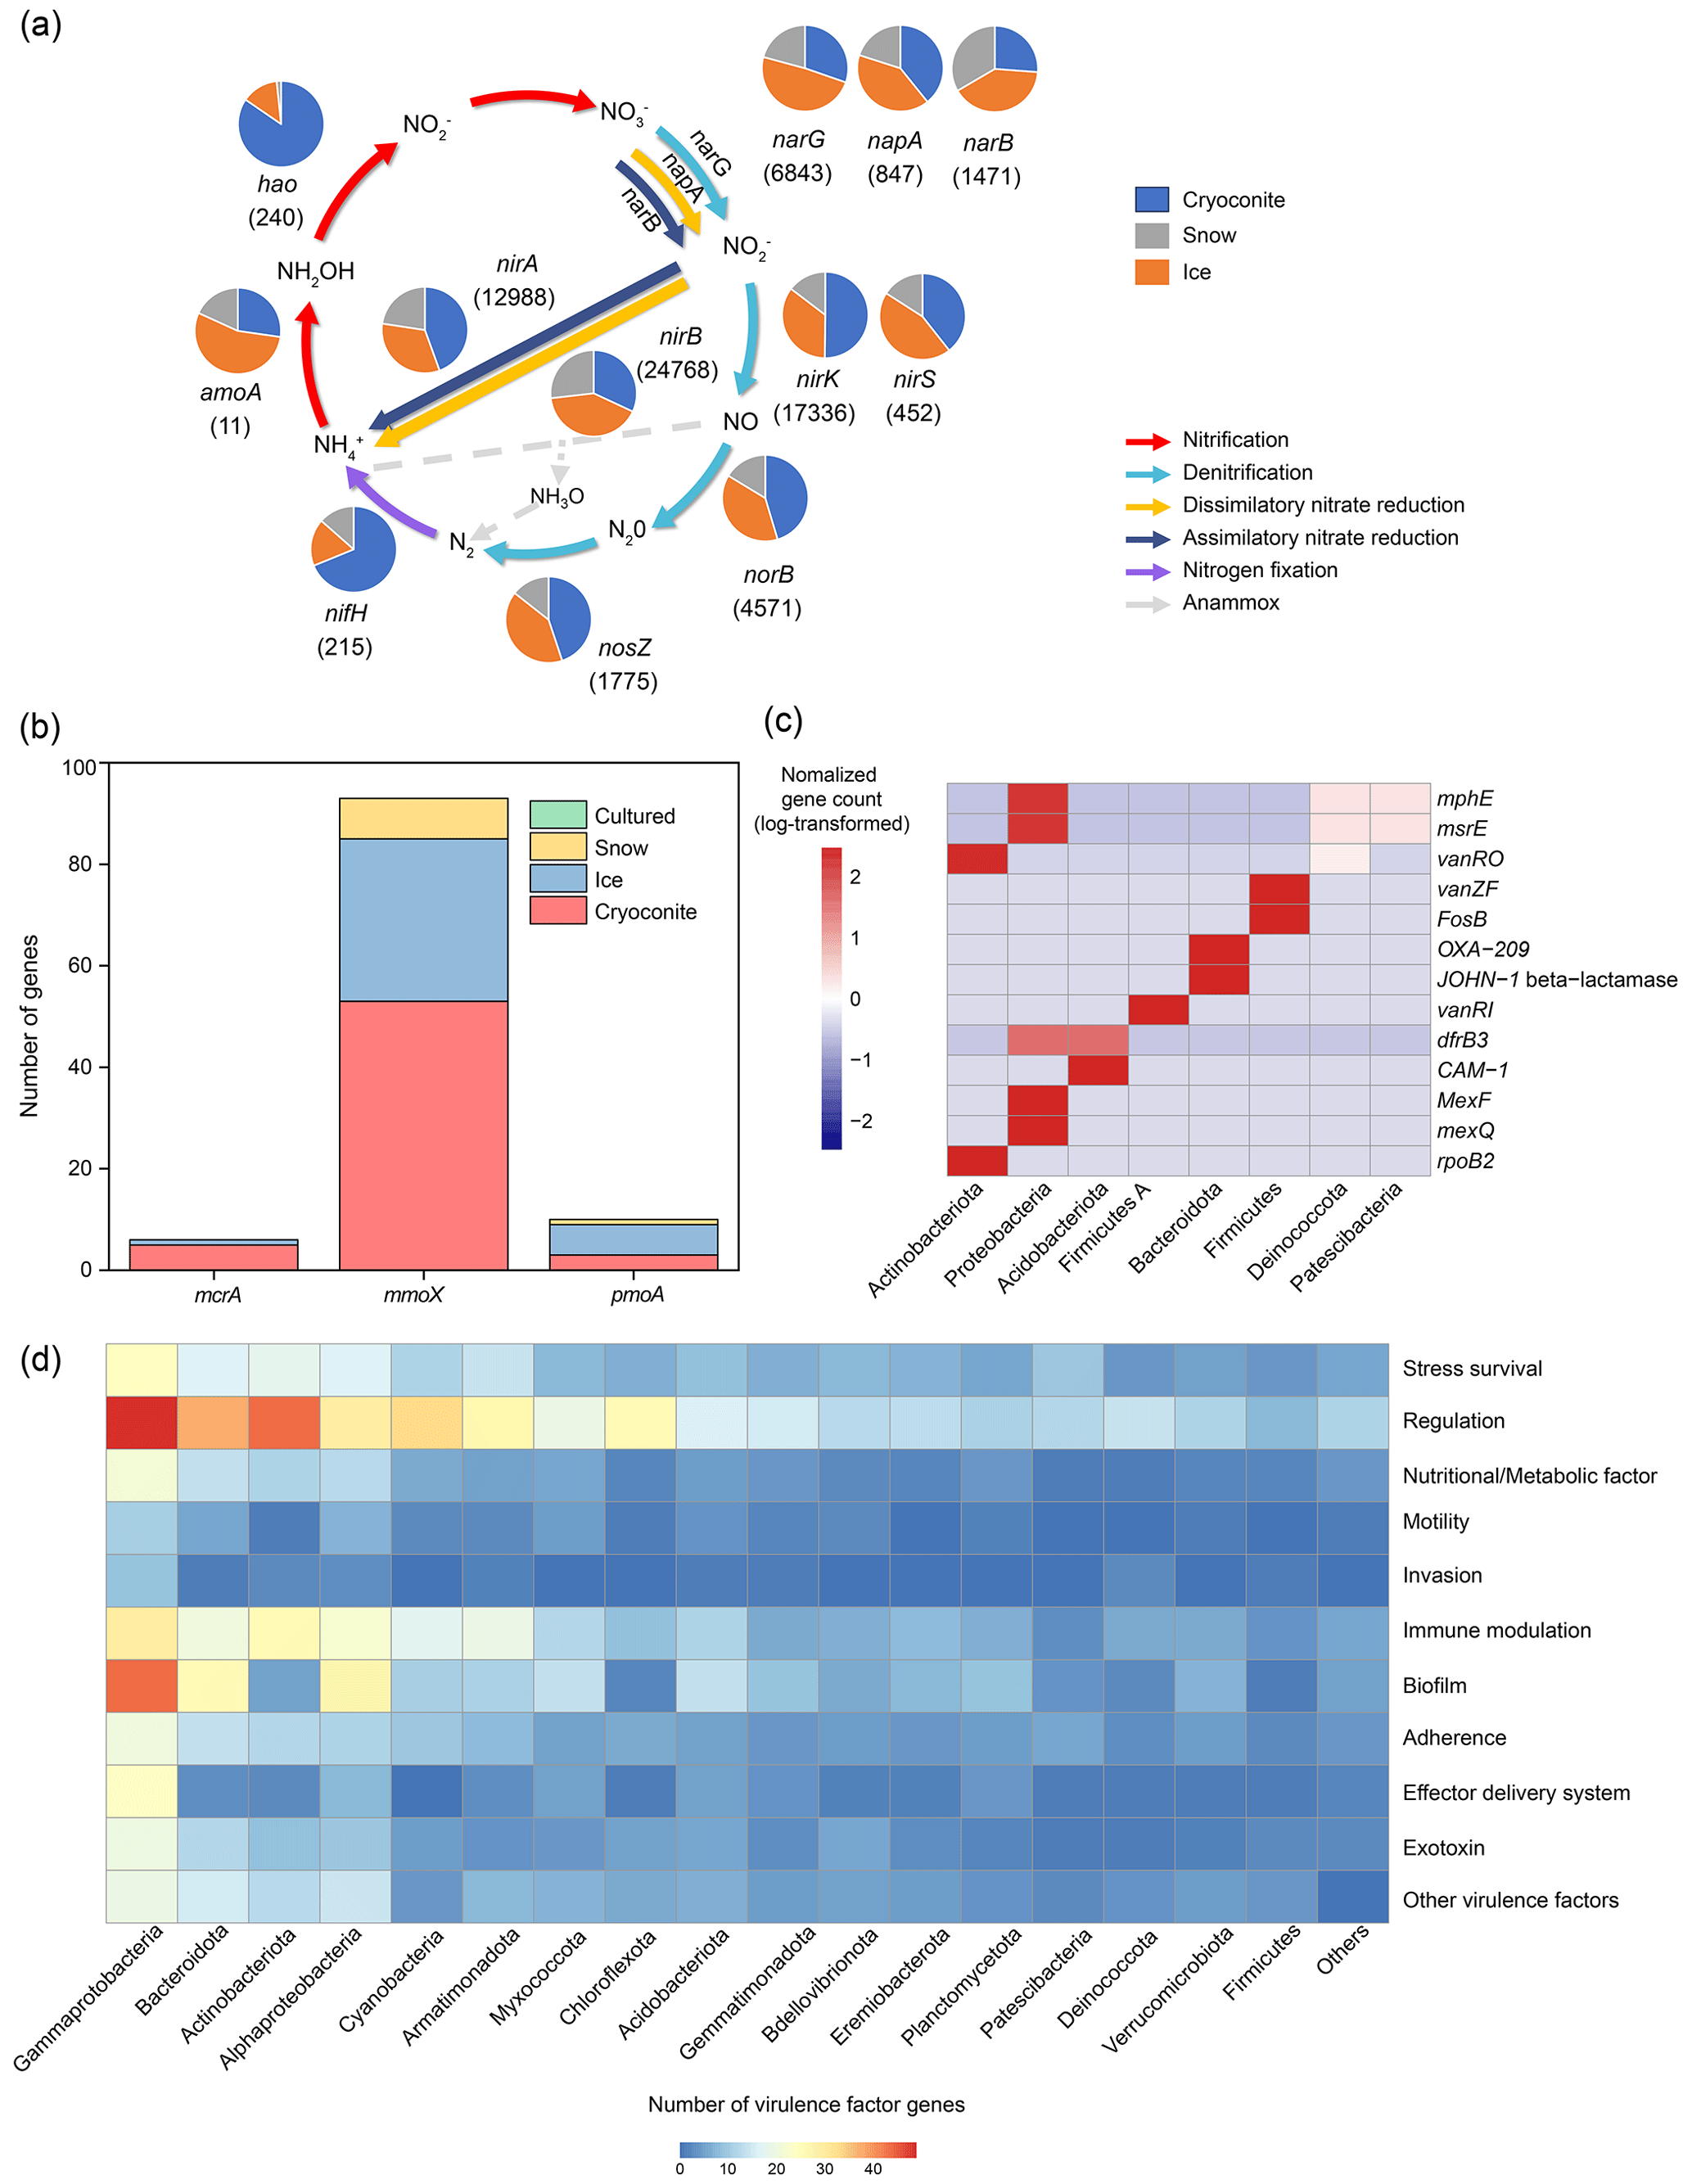
Figure 6Features of the functional genes across the glacier metagenomes from the Antarctic, Arctic, and Tibetan Plateau. (a) Nitrogen cycling (the numbers indicate the number of genes identified; genes of the anaerobic ammonium oxidation pathway are not identified in the glacier metagenomes), (b) methane cycling (the mcrA gene is responsible for methanogenesis, the mmoX gene is the soluble-form methane oxidation gene, and pmoA is the particulate-form methane oxidation gene, both of which are associated with methane oxidation), (c) genes associated with antibiotic resistance, and (d) the number of genes associated with virulence factors (the numbers have been square root-transformed).
The differences in gene distributions are apparent among habitats. Specifically, the genes associated with nitrogen fixation and denitrification were mainly present in cryoconites. The former could be explained by the high abundance of Cyanobacteria (Fig. 2), while the latter could be attributed to its anaerobic conditions. Thus, the cryoconite could be a potential source of N2O. Comparatively, amoA (in nitrification) was mainly identified from ice, while norB and nosZ (in denitrification) were also abundant. This suggests that ice could harbor greater functional diversity than snow, with the capacity for nitrogen transformation and influencing the nutrients discharged to downstream ecosystems.
Methane cycling. The dataset contained 154 methane cycling-related genes. Of these, 93 were the soluble form of methane oxidase (mmoX), accounting for 61 % of the total methane-cycling genes identified (Fig. 6b). More mmoX genes were identified from cryoconite (34.4 % of the total methane-cycling genes identified) than from ice (20.8 %) or snow (5.2 %). Conversely, genes associated with the particulate form of methane oxidation (pmoA, pmoB, and pmoC) were more frequently identified from ice (21.4 %) than from cryoconite (5.8 %) and snow (3.2 %). The two forms of methane monooxygenase (sMMO and pMMO) have distinct enzymatic characteristics and are expressed under different growth conditions. Specifically, sMMO is expressed under low-copper conditions (≤ 0.9 nmol Cu per mg of cell protein), while pMMO is expressed under relatively high copper–biomass ratios (Zhang et al., 2017). Furthermore, sMMO has a broader substrate range and can oxidize methane, short-chain alkane, alkene, and aromatic compounds, while pMMO can only oxidize alkanes of less than five carbons (Trotsenko and Murrell, 2008). Despite not being empirically measured, the cryoconite is expected to contain a higher concentration of copper than the ice, as the former is precipitated dust. Thus, the higher diversity of sMMO in the cryoconite could be associated with its ability to oxidize diverse alkanes, which may be present in soils. In comparison, high-affinity pMMO could oxidize methane at atmospheric levels, which may support microbial communities in the oligotrophic ice habitat. Only six unique methanogenesis-related genes (mcrA) were identified, almost exclusively in cryoconite metagenomes. This is consistent with the cryoconite as a methane source in the literature (Zhang et al., 2021).
Antimicrobial resistance genes. Using thresholds of 80 % identity and 80 % sequence coverage, we identified 1166 ORFs that exhibited high sequence similarity to 224 antibiotic resistance genes (ARG). Of these identified ARGs, MexF, beta-lactamase, and mexK were the most abundant, accounting for 8.1 %, 4.2 %, and 3.7 % of the ARGs identified, respectively (Table S16). The predominant antibiotic resistance mechanisms were antibiotic efflux and antibiotic inactivation, accounting for 44 % and 41 % of the total ARGs identified, respectively. These ARGs were predicted to confer resistance against 30 different antibiotics, with penam, tetracycline, and macrolide being the most commonly encountered resistant targets. Additionally, 54 % of the identified ARGs provided multiple-drug resistance, with the OprM, CpxR, and tolC genes conferring resistance to 16, 15, and 15 types of antibiotics, respectively. ARGs were identified in 566 genomes (13 % of the total genomes obtained). This low proportion of ARG-bearing genomes suggests that the glacier habitats are only weakly affected by antibiotic contamination. Of the genomes containing ARGs, 48.6 % and 34.1 % were affiliated with Proteobacteria and Firmicutes, respectively (Fig. 6c). However, the resistance mechanisms exhibited by these two bacterial phyla were markedly distinct, with antibiotic efflux (MexF) and antibiotic target alternation (vanZf)/inactivation (FosB) being the most common mechanisms for Proteobacteria and Firmicutes, respectively. Most of the genomes (n = 224) carried only a single ARG, while 7 genomes possessed more than 10 ARG genes, with Pseudomonas aeruginosa genomes hosting up to 48 ARGs.
Virulence factors. Using thresholds of 80 % identity and 80 % coverage, the dataset contains 66 822 virulence factor genes, accounting for 0.11 % of the total ORFs identified (Table S17). Virulence factors were predominately associated with adherence, motility, and immune modulation functions, while those associated with toxin production accounted for only 0.48 % (Fig. 6d). We did not detect any toxin genes from the genomes obtained using the same thresholds, with only those associated with regulation, effector delivery systems, and metabolic factors being identified from Proteobacteria, Actinobacteria, and Deinococcota genomes. Nevertheless, 878 potential toxin genes were identified from the genomes if the criteria were loosened, with sequence identity ranging from 20.1 % to 67.8 %, which may represent novel toxins without references in the dataset or non-toxin genes that are homologous to known toxin genes. These candidate toxin genes were most abundantly identified in Gammaproteobacteria, followed by Bacteroides (15.9 %) and Alphaproteobacteria (10.0 %).
The supplement related to this article is available online at https://doi.org/10.5194/essd-17-5165-2025-supplement.
YL conceptualized the paper; SH, YL, TY, ZZ, YC, KL, PL, JL, RD, and MJ analyzed the data; TY, SG, QS, GF, LW, and JM developed the website; MJ and YL prepared the manuscript with contributions from all authors.
The contact author has declared that none of the authors has any competing interests.
Publisher's note: Copernicus Publications remains neutral with regard to jurisdictional claims made in the text, published maps, institutional affiliations, or any other geographical representation in this paper. While Copernicus Publications makes every effort to include appropriate place names, the final responsibility lies with the authors.
This study was supported by the National Natural Science Foundation of China (42421001, Yongqin Liu; 42425607, Mukan Ji) and the Department of Science and Technology, Gansu, China (25RCKA021, Mukan Ji).
This paper was edited by Dalei Hao and reviewed by four anonymous referees.
Alcock, B. P., Raphenya, A. R., Lau, T. T. Y., Tsang, K. K., Bouchard, M., Edalatmand, A., Huynh, W., Nguyen, A. V., Cheng, A. A., Liu, S., Min, S. Y., Miroshnichenko, A., Tran, H. K., Werfalli, R. E., Nasir, J. A., Oloni, M., Speicher, D. J., Florescu, A., Singh, B., Faltyn, M., Hernandez-Koutoucheva, A., Sharma, A. N., Bordeleau, E., Pawlowski, A. C., Zubyk, H. L., Dooley, D., Griffiths, E., Maguire, F., Winsor, G. L., Beiko, R. G., Brinkman, F. S. L., Hsiao, W. W. L., Domselaar, G. V., and McArthur, A. G.: CARD 2020: antibiotic resistome surveillance with the comprehensive antibiotic resistance database, Nucleic Acids Res., 48, D517–D525, https://doi.org/10.1093/nar/gkz935, 2020.
Anderson, M. J.: Permutational Multivariate Analysis of Variance (PERMANOVA), Wiley StatsRef: Statistics Reference Online, https://doi.org/10.1002/9781118445112.stat07841, 2017.
Anesio, A. M. and Laybourn-Parry, J.: Glaciers and ice sheets as a biome, Trends Ecol. Evol., 27, 219–225, https://doi.org/10.1016/j.tree.2011.09.012, 2012.
Anesio, A. M., Lutz, S., Chrismas, N. A. M., and Benning, L. G.: The microbiome of glaciers and ice sheets, NPJ Biofilms Microbi., 3, 10, https://doi.org/10.1038/s41522-017-0019-0, 2017.
Boetius, A., Anesio, A. M., Deming, J. W., Mikucki, J. A., and Rapp, J. Z.: Microbial ecology of the cryosphere: sea ice and glacial habitats, Nat. Rev. Microbiol., 13, 677–690, https://doi.org/10.1038/nrmicro3522, 2015.
Bowers, R. M., Kyrpides, N. C., Stepanauskas, R., Harmon-Smith, M., Doud, D., Reddy, T. B. K., Schulz, F., Jarett, J., Rivers, A. R., Eloe-Fadrosh, E. A., Tringe, S. G., Ivanova, N. N., Copeland, A., Clum, A., Becraft, E. D., Malmstrom, R. R., Birren, B., Podar, M., Bork, P., Weinstock, G. M., Garrity, G. M., Dodsworth, J. A., Yooseph, S., Sutton, G., Glöckner, F. O., Gilbert, J. A., Nelson, W. C., Hallam, S. J., Jungbluth, S. P., Ettema, T. J. G., Tighe, S., Konstantinidis, K. T., Liu, W. T., Baker, B. J., Rattei, T., Eisen, J. A., Hedlund, B., McMahon, K. D., Fierer, N., Knight, R., Finn, R., Cochrane, G., Karsch-Mizrachi, I., Tyson, G. W., Rinke, C., Lapidus, A., Meyer, F., Yilmaz, P., Parks, D. H., Eren, A. M., Schriml, L., Banfield, J. F., Hugenholtz, P., and Woyke, T.: Minimum information about a single amplified genome (MISAG) and a metagenome-assembled genome (MIMAG) of bacteria and archaea, Nat. Biotechnol., 35, 725–731, https://doi.org/10.1038/nbt.3893, 2017a.
Bowers, R. M., Kyrpides, N. C., Stepanauskas, R., Harmon-Smith, M., Doud, D., Reddy, T. B. K., Schulz, F., Jarett, J., Rivers, A. R., Eloe-Fadrosh, E. A., Tringe, S. G., Ivanova, N. N., Copeland, A., Clum, A., Becraft, E. D., Malmstrom, R. R., Birren, B., Podar, M., Bork, P., Weinstock, G. M., Garrity, G. M., Dodsworth, J. A., Yooseph, S., Sutton, G., Glöckner, F. O., Gilbert, J. A., Nelson, W. C., Hallam, S. J., Jungbluth, S. P., Ettema, T. J. G., Tighe, S., Konstantinidis, K. T., Liu, W.-T., Baker, B. J., Rattei, T., Eisen, J. A., Hedlund, B., McMahon, K. D., Fierer, N., Knight, R., Finn, R., Cochrane, G., Karsch-Mizrachi, I., Tyson, G. W., Rinke, C., Kyrpides, N. C., Schriml, L., Garrity, G. M., Hugenholtz, P., Sutton, G., Yilmaz, P., Meyer, F., Glöckner, F. O., Gilbert, J. A., Knight, R., Finn, R., Cochrane, G., Karsch-Mizrachi, I., Lapidus, A., Meyer, F., Yilmaz, P., Parks, D. H., Murat Eren, A., Schriml, L., Banfield, J. F., Hugenholtz, P., Woyke, T., and The Genome Standards, C.: Minimum information about a single amplified genome (MISAG) and a metagenome-assembled genome (MIMAG) of bacteria and archaea, Nat. Biotechnol., 35, 725–731, https://doi.org/10.1038/nbt.3893, 2017b.
Buchfink, B., Reuter, K., and Drost, H. G.: Sensitive protein alignments at tree-of-life scale using DIAMOND, Nat. Methods, 18, 366–368, https://doi.org/10.1038/s41592-021-01101-x, 2021.
Cameron, K. A., Hodson, A. J., and Osborn, A. M.: Carbon and nitrogen biogeochemical cycling potentials of supraglacial cryoconite communities, Polar Biol., 35, 1375–1393, https://doi.org/10.1007/s00300-012-1178-3, 2012.
Cauvy-Fraunié, S. and Dangles, O.: A global synthesis of biodiversity responses to glacier retreat, Nat. Ecol. Evol., 3, 1675–1685, https://doi.org/10.1038/s41559-019-1042-8, 2019.
Chaumeil, P. A., Mussig, A. J., Hugenholtz, P., and Parks, D. H.: GTDB-Tk: a toolkit to classify genomes with the Genome Taxonomy Database, Bioinformatics, 36, 1925–1927, https://doi.org/10.1093/bioinformatics/btz848, 2019.
Ciccazzo, S., Esposito, A., Borruso, L., and Brusetti, L.: Microbial communities and primary succession in high altitude mountain environments, Ann. Microbiol., 66, 43–60, https://doi.org/10.1007/s13213-015-1130-1, 2016.
Cook, J., Edwards, A., Takeuchi, N., and Irvine-Fynn, T.: Cryoconite: The dark biological secret of the cryosphere, Prog. Phys. Geogr., 40, 66–111, https://doi.org/10.1177/0309133315616574, 2016.
Delgado-Baquerizo, M., Oliverio, A. M., Brewer, T. E., Benavent-Gonzalez, A., Eldridge, D. J., Bardgett, R. D., Maestre, F. T., Singh, B. K., and Fierer, N.: A global atlas of the dominant bacteria found in soil, Science, 359, 320–325, https://doi.org/10.1126/science.aap9516, 2018.
Edgar, R. C.: Search and clustering orders of magnitude faster than BLAST, Bioinformatics, 26, 2460–2461, https://doi.org/10.1093/bioinformatics/btq461, 2010.
Fredriksson, N. J., Hermansson, M., and Wilén, B. M.: The Choice of PCR Primers Has Great Impact on Assessments of Bacterial Community Diversity and Dynamics in a Wastewater Treatment Plant, Plos One, 8, e76431, https://doi.org/10.1371/journal.pone.0076431, 2013.
Guo, B. X., Liu, Y. Q., Liu, K. S., Shi, Q., He, C., Cai, R. H., and Jiao, N. Z.: Different dissolved organic matter composition between central and southern glaciers on the Tibetan Plateau, Ecol. Indic., 139, 108888, https://doi.org/10.1016/j.ecolind.2022.108888, 2022.
Hood, E., Battin, T. J., Fellman, J., O'Neel, S., and Spencer, R. G. M.: Storage and release of organic carbon from glaciers and ice sheets, Nat. Geosci., 8, 91–96, https://doi.org/10.1038/ngeo2331, 2015.
Hotaling, S., Finn, D. S., Giersch, J. J., Weisrock, D. W., and Jacobsen, D.: Climate change and alpine stream biology: progress, challenges, and opportunities for the future, Biol. Rev. Camb. Philos. Soc., 92, 2024–2045, https://doi.org/10.1111/brv.12319, 2017.
Huerta-Cepas, J., Forslund, K., Coelho, L. P., Szklarczyk, D., Jensen, L. J., von Mering, C., and Bork, P.: Fast genome-wide functional annotation through orthology assignment by eggNOG-Mapper, Mol. Biol. Evol., 34, 2115–2122, https://doi.org/10.1093/molbev/msx148, 2017.
Huerta-Cepas, J., Szklarczyk, D., Heller, D., Hernández-Plaza, A., Forslund, S. K., Cook, H., Mende, D. R., Letunic, I., Rattei, T., Jensen, L. J., von Mering, C., and Bork, P.: eggNOG 5.0: a hierarchical, functionally and phylogenetically annotated orthology resource based on 5090 organisms and 2502 viruses, Nucleic Acids Res., 47, D309–D314, https://doi.org/10.1093/nar/gky1085, 2019.
Hyatt, D., Chen, G. L., Locascio, P. F., Land, M. L., Larimer, F. W., and Hauser, L. J.: Prodigal: prokaryotic gene recognition and translation initiation site identification, BMC Bioinform., 11, 119, https://doi.org/10.1186/1471-2105-11-119, 2010.
Ji, M.: OTU tables with and without subsampling, figshare [data set], https://doi.org/10.6084/m9.figshare.28423781.v2, 2025.
Jia, B., Raphenya, A. R., Alcock, B., Waglechner, N., Guo, P., Tsang, K. K., Lago, B. A., Dave, B. M., Pereira, S., Sharma, A. N., Doshi, S., Courtot, M., Lo, R., Williams, L. E., Frye, J. G., Elsayegh, T., Sardar, D., Westman, E. L., Pawlowski, A. C., Johnson, T. A., Brinkman, F. S., Wright, G. D., and McArthur, A. G.: CARD 2017: expansion and model-centric curation of the comprehensive antibiotic resistance database, Nucleic Acids Res., 45, D566–D573, https://doi.org/10.1093/nar/gkw1004, 2017.
Kanehisa, M., Furumichi, M., Tanabe, M., Sato, Y., and Morishima, K.: KEGG: new perspectives on genomes, pathways, diseases and drugs, Nucleic Acids Res., 45, D353–D361, https://doi.org/10.1093/nar/gkw1092, 2017.
Kang, D. D., Li, F., Kirton, E., Thomas, A., Egan, R., An, H., and Wang, Z.: MetaBAT 2: an adaptive binning algorithm for robust and efficient genome reconstruction from metagenome assemblies, PeerJ, 7, e7359, https://doi.org/10.7717/peerj.7359, 2019.
Levasseur, A., Drula, E., Lombard, V., Coutinho, P. M., and Henrissat, B.: Expansion of the enzymatic repertoire of the CAZy database to integrate auxiliary redox enzymes, Biotechnol. Biofuels, 6, 41, https://doi.org/10.1186/1754-6834-6-41, 2013.
Liu, B., Zheng, D., Jin, Q., Chen, L., and Yang, J.: VFDB 2019: a comparative pathogenomic platform with an interactive web interface, Nucleic Acids Res., 47, D687–D692, https://doi.org/10.1093/nar/gky1080, 2019.
Liu, Y., Ji, M., Yu, T., Zaugg, J., Anesio, A. M., Zhang, Z., Hu, S., Hugenholtz, P., Liu, K., and Liu, P.: A genome and gene catalog of glacier microbiomes, Nat. Biotechnol., 40, 1341–1348, https://doi.org/10.1038/s41587-022-01367-2, 2022.
Liu, Y., Hu, S., Yu, T., Luo, Y., Zhang, Z., Chen, Y., Guo, S., S, Q., Fan, G., Wu, L., Ma, J., Liu, K., Liu, P., Liu, J., and Ji, M.: A database of glacier microbiomes for the Three Poles, National Tibetan Plateau Data Center, National Tibetan Plateau Data Center [data set], https://doi.org/10.11888/Cryos.tpdc.300830, 2023.
Mao, G., Ji, M., Jiao, N., Su, J., Zhang, Z., Liu, K., Chen, Y., and Liu, Y.: Monsoon affects the distribution of antibiotic resistome in Tibetan glaciers, Environ. Pollut., 317, 120809, https://doi.org/10.1016/j.envpol.2022.120809, 2023.
Mogrovejo-Arias, D. C., Brill, F. H. H., and Wagner, D.: Potentially pathogenic bacteria isolated from diverse habitats in Spitsbergen, Svalbard, Environ. Earth Sci., 79, 109, https://doi.org/10.1007/s12665-020-8853-4, 2020.
Nissen, J. N., Johansen, J., Allesøe, R. L., Sønderby, C. K., Armenteros, J. J. A., Grønbech, C. H., Jensen, L. J., Nielsen, H. B., Petersen, T. N., Winther, O., and Rasmussen, S.: Improved metagenome binning and assembly using deep variational autoencoders, Nat. Biotechnol., 39, 555–560, https://doi.org/10.1038/s41587-020-00777-4, 2021.
Ogle, D. H., Doll, J. C., Wheeler, P., and Dinno, A.: FSA: Fisheries Stock Analysis [code], https://doi.org/10.32614/CRAN.package.FSA, 2022.
Parks, D. H., Rinke, C., Chuvochina, M., Chaumeil, P. A., Woodcroft, B. J., Evans, P. N., Hugenholtz, P., and Tyson, G. W.: Recovery of nearly 8,000 metagenome-assembled genomes substantially expands the tree of life, Nat. Microbiol., 2, 1533–1542, https://doi.org/10.1038/s41564-017-0012-7, 2017.
Qiu, J.: China: The thrid pole, Nature, 454, 393–396, https://doi.org/10.1038/454393a, 2008.
Quast, C., Pruesse, E., Yilmaz, P., Gerken, J., Schweer, T., Yarza, P., Peplies, J., and Glöckner, F. O.: The SILVA ribosomal RNA gene database project: improved data processing and web-based tools, Nucleic Acids Res., 41, D590–D596, https://doi.org/10.1093/nar/gks1219, 2012.
Segawa, T. K., Ushida, K., Agata, K., Okada, N., and Kohshima, S.: Seasonal change in bacterial flora and biomass in mountain snow from the Tateyama mountains, Japan, analyzed by 16S rRNA gene sequencing and real-time PCR, Appl. Environ. Microbiol., 71, 123–130, https://doi.org/10.1128/AEM.71.1.123-130.2005, 2005.
Steinegger, M. and Söding, J.: MMseqs2 enables sensitive protein sequence searching for the analysis of massive data sets, Nat. Biotechnol., 35, 1026–1028, https://doi.org/10.1038/nbt.3988, 2017.
Stevens, I. T., Irvine-Fynn, T. D. L., Edwards, A., Mitchell, A. C., Cook, J. M., Porter, P. R., Holt, T. O., Huss, M., Fettweis, X., Moorman, B. J., Sattler, B., and Hodson, A. J.: Spatially consistent microbial biomass and future cellular carbon release from melting Northern Hemisphere glacier surfaces, Commun. Earth Environ., 3, 275, https://doi.org/10.1038/s43247-022-00609-0, 2022.
Stibal, M., Bradley, J. A., Edwards, A., Hotaling, S., Zawierucha, K., Rosvold, J., Lutz, S., Cameron, K. A., Mikucki, J. A., Kohler, T. J., Sabacka, M., and Anesio, A. M.: Glacial ecosystems are essential to understanding biodiversity responses to glacier retreat, Nat. Ecol. Evol., 4, 686–687, https://doi.org/10.1038/s41559-020-1163-0, 2020.
Taheran, M., Naghdi, M., Brar, S. K., Verma, M., and Surampalli, R. Y.: Emerging contaminants: Here today, there tomorrow!, Environ. Nanotechnol. Monit. Manag., 10, 122–126, https://doi.org/10.1016/j.enmm.2018.05.010, 2018.
Tatusov, R. L., Fedorova, N. D., Jackson, J. D., Jacobs, A. R., Kiryutin, B., Koonin, E. V., Krylov, D. M., Mazumder, R., Mekhedov, S. L., Nikolskaya, A. N., Rao, B. S., Smirnov, S., Sverdlov, A. V., Vasudevan, S., Wolf, Y. I., Yin, J. J., and Natale, D. A.: The COG database: an updated version includes eukaryotes, BMC Bioinform., 4, 41, https://doi.org/10.1186/1471-2105-4-41, 2003.
Telling, J., Anesio, A. M., Tranter, M., Irvine-Fynn, T., Hodson, A., Butler, C., and Wadham, J.: Nitrogen fixation on Arctic glaciers, Svalbard, J. Geophys. Res.-Biogeo., 116, G03039, https://doi.org/10.1029/2010JG001632, 2011.
Tremblay, J., Singh, K., Fern, A., Kirton, E. S., He, S., Woyke, T., Lee, J., Chen, F., Dangl, J. L., and Tringe, S. G.: Primer and platform effects on 16S rRNA tag sequencing, Front. Microbiol., 6, 00771, https://doi.org/10.3389/fmicb.2015.00771, 2015.
Trotsenko, Y. A. and Murrell, J. C.: Metabolic aspects of aerobic obligate methanotrophy, Adv. Appl. Microbiol., 63, 183–229, https://doi.org/10.1016/S0065-2164(07)00005-6, 2008.
Wu, Y. W., Simmons, B. A., and Singer, S. W.: MaxBin 2.0: an automated binning algorithm to recover genomes from multiple metagenomic datasets, Bioinformatics, 32, 605–607, https://doi.org/10.1093/bioinformatics/btv638, 2016.
Zerillo, M. M., Adhikari, B. N., Hamilton, J. P., Buell, C. R., Levesque, C. A., and Tisserat, N.: Carbohydrate-Active Enzymes in Pythium and their role in plant cell wall and storage polysaccharide degradation, Plos One, 8, 0072572, https://doi.org/10.1371/journal.pone.0072572, 2013.
Zhang, S., Karthikeyan, R., and Fernando, S. D.: Low-temperature biological activation of methane: structure, function and molecular interactions of soluble and particulate methane monooxygenases, Rev. Environ. Sci. Biotechnol., 16, 611–623, https://doi.org/10.1007/s11157-017-9447-9, 2017.
Zhang, Y. L., Kang, S. C., Wei, D., Luo, X., Wang, Z. Z., and Gao, T. G.: Sink or source? Methane and carbon dioxide emissions from cryoconite holes, subglacial sediments, and proglacial river runoff during intensive glacier melting on the Tibetan Plateau, Fundam. Res., 1, 232–239, https://doi.org/10.1016/j.fmre.2021.04.005, 2021.