the Creative Commons Attribution 4.0 License.
the Creative Commons Attribution 4.0 License.
 | 02 Oct 2025
A new dataset of rain cells based on observations of Tropical Rainfall Measuring Mission (TRMM) precipitation radar, visible/infrared scanner and microwave imager
Zhenhao Wu
Jian Shang
Chunguan Cui
Peng Zhang
Songyan Gu
Yunfei Fu
Understanding the characteristics of the rain cell, the most basic unit in the natural precipitation system, is helpful in improving the cognition of the precipitation system. In this study, based on the merged precipitation profile data, reflectance and infrared data, and microwave brightness temperature data observed by the Tropical Rainfall Measuring Mission (TRMM) precipitation radar (PR), visible and infrared scanner (VIRS) and TRMM microwave imager (TMI), rain cells were identified in the PR swath. For the identified valid rain cells, two fitting methods (the minimum bounding rectangle (MBR) and the best fit ellipse (BFE)) were applied to fit the external frame. Then, the geometric and physical parameters of rain cells were also calculated. By analyzing the geometric parameters (length, width, height, and so on) and physical parameters (rain rate, visible reflectance and thermal infrared brightness temperature from cloud top, and microwave brightness temperature from cloud column) of two rain cells (weak rain cell and strong rain cell), the results indicate that the strong rain cell is filled with deep convective precipitation and has low thermal infrared brightness temperature at the cloud top, while the weak rain cell is mainly characterized by stratiform precipitation with low rain rate. Compared to the BFE method, the area of the external frame calculated by the MBR method is generally larger. The filling ratio of the BFE method is slightly higher than that of the MBR method. In general, the results indicate that the rain cell definition parameters using the two fitting methods are reasonable and intuitive. The data used in this paper are freely available at https://doi.org/10.5281/zenodo.15387988 (Wu and Fu, 2025).
- Article
(7262 KB) - Full-text XML
- BibTeX
- EndNote


Precipitation is an important part of the global energy and water cycle (Houze, 1997; Oki and Kanae, 2006; Lau and Wu, 2010). In the water cycle, the rain cell that constitutes a precipitation system can be considered the most basic unit in different definitions. The investigation of the three-dimensional structure of rain cell is helpful to understand the thermodynamic structure and microphysical processes within precipitation systems (Houze, 1981; Zipser and Lutz, 1994; Yuter and Houze, 1995; Fu and Liu, 2001). Austin and Houze (1972) found subsynoptic scale precipitation regions that each had rather clearly definable characteristics and behavior when they studied the precipitation patterns in New England. Based on radar observations and rain gauge records, they also divided precipitation pattern into synoptic areas, large mesoscale areas, small mesoscale areas and cells. The rain cell with area of about 10 km2 in radar echo was regarded as a single cumulus convective unit in their study (Gagin et al., 1986; Capsoni et al., 1987).
More studies were done by defining the threshold of rain cell, such as an area where rain rates were greater than a given threshold (Goldhirsh and Musiani, 1986). For example, Capsoni et al. (1987) defined rain cell as the connected region with rain rate greater than 5 mm h−1 based on S-band radar observation near Milan in 1980. Awaka (1989) modified rain rate threshold to 0.4 mm h−1. Meanwhile, many studies exposed the relationship between rain rate threshold and rain cell size based on ground-based radar data (Konrad, 1978; Sauvageot et al., 1999; Feral et al., 2000; Begum and Otung, 2009). Feral et al. (2000) adopted elliptic fitting method to investigate the geometric characteristics and directional distribution of rain cell. The statistical results also revealed that the major axis length was twice longer than the minor axis length and the direction distribution was uniform in the majority of the rain cells.
Since the late 1990s, observations from precipitation radar (PR), visible and infrared scanner (VIRS) and TRMM microwave imager (TMI) aboard the TRMM satellite have provided a wealth of data for systematic study of cloud and precipitation (Kummerow et al., 1998, 2000; Nesbitt et al., 2000; Viltard et al., 2000; Liu and Fu, 2001; He et al., 2006; Schumacher and Houze, 2003; Li and Fu, 2005; Liu and Fu, 2010; Fu, 2014). With the massive data observed by PR, VIRS and TMI, Nesbitt et al. (2006), Liu et al. (2007, 2008), and Liu and Zipser (2013) made spick-and-span studies in the field of rain cell identification and its parameters with elliptic fitting method. Their rain cell data were also widely used for analyzing the temporal and spatial distribution characteristics of rain cells (Zhou et al., 2013; Yokoyama et al., 2014; Ni et al., 2016), such as the finding that line-shaped convective systems occurred more frequently over ocean, and showed higher frequency in the subtropics (Liu and Zipser, 2013). To continue revealing the characteristics of rain cell parameters, Fu et al. (2020) defined the geometric and physical parameters of rain cells, using the minimum bounding rectangle (MBR) fitting method to calculate the corresponding parameters for the rain cells identified within the PR scan width. The rain cell data generated from MBR method were applied to study the morphological characteristics of rain cells over the Tibetan Plateau in summer (Chen et al., 2021). Cai et al. (2024) adopted three methods, minimum circumscribed ellipse, minimum bounding rectangle and direct indexing area, for rain cell fitting. They also compared the geometric characteristics generated from the three methods.
However, the identified rain cell data need to include reflectance and infrared temperature observed by VIRS and microwave bright temperature measured by TMI, which will give full play to the advantages of TRMM instruments. For the above purposes, this study merges the observation data from PR, VIRS and TMI at the pixel resolution of PR, and then calculates the geometric parameters of the identified rain cells by using two fitting methods (MBR and BFE). Finally, a new dataset with precipitation parameters, visible/infrared and microwave signals of rain cells is produced. The structure of this study is as follows: Sect. 2 describes data and data merging methods, Sect. 3 introduces rain cell identification method and defines the geometric and physical parameters of rain cells, Sect. 4 analyzes two typical rain cells in geometric and physical parameters. Access to the datasets is introduced in Sect. 5, and conclusions are presented in Sect. 6.
The TRMM was jointly developed by the US National Aeronautics and Space Administration (NASA) and the Japan Aerospace Exploration Agency (JAXA) and launched on 27 November 1997. The TRMM is a non-solar synchronous polar-orbiting satellite with an orbital inclination of 35° and observes regions between 38° S and 38° N (Simpson et al., 1996; Kummerow et al., 1998, 2000). The satellite carries five instruments: PR, VIRS, TMI, the Lightning Imaging Sensor (LIS), and the Cloud and Earth Radiant Energy Sensor (CERES). This study mainly involves the measurements of TRMM PR, VIRS, and TMI.
2.1 PR data 2A25
The PR was the first spaceborne precipitation radar onboard the TRMM. It is a single-frequency microwave radar operating at 13.8 GHz (Kummerow et al., 1998; Kozu et al., 2001). PR scans in the cross-track direction at a scanning inclination of 17°. There are 49 pixels on each scanning line. The horizontal resolution is about 4.3 km at nadir (5.0 km after the orbital boost), and the scanning width is 215 km (245 km after the orbital boost). It can detect the three-dimensional structure of precipitation from mean sea level to 20 km (a total of 80 layers) with a vertical resolution of 0.25 km.
The 2A25 data are the second-level data product of the TRMM PR, which are generated by inverting the echo signals detected by the PR. This dataset mainly includes scanning time, geographic information, three-dimensional rain rate, rain type and so on (Awaka et al., 1997). The detection sensitivity of the PR is about 17 dBZ, corresponding to the rain rate of about 0.4 mm h−1 (Schumacher and Houze, 2003). Therefore, when the rain rate of the pixels is lower than 0.4 mm h−1, a default value is assigned, and those pixels are not included in the calculation.
2.2 VIRS data 1B01
The VIRS scans in the cross-track direction with a scanning angle of 45°. There are 261 pixels on each scanning line. The scanning width is 720 km (833 km after the orbital boost), and the horizontal resolution is 2.2 km at nadir (2.4 km after the orbital boost). It has five channels from the visible to the far infrared band: CH1 (0.63 µm), CH2 (1.6 µm), CH3 (3.7 µm), CH4 (10.8 µm) and CH5 (12.0 µm). The 1B01 is a first-level data product of VIRS, which includes the reflectance at CH1 and CH2, the infrared radiation brightness temperature at CH3, CH4, and CH5 after correcting and calibrating the VIRS detection results.
2.3 TMI data 1B11
The TMI is a nine-channel passive microwave radiometer with five frequencies spanning from 10 to 85 GHz. The microwave signal frequencies are 10.65, 19.35, 21.3, 37.0, and 85.5 GHz, with 21.3 GHz being a single vertical polarization channel. The other four frequencies are dual horizontal (H) and vertical (V) polarization channels. The scanning width is 760 km (878 km after the orbital boost). The horizontal resolution of each frequency channel (effective field of view of beam, Kummerow et al., 1998) varies from 63 km × 37 km at 10.65 GHz to 7 km × 5 km at 85.5 GHz. The 1B11 data contain the calibrated TMI-detected microwave brightness temperature at multiple channels.
2.4 The merged data of 2A25, 1B01 and 1B11
To comprehensively analyze the parameters of precipitation, cloud top spectral signal and particle phase in precipitation systems, the rain rate profile and echo profile of 2A25, the reflectance and infrared temperature of 1B01, and the microwave brightness temperature of 1B11 were collocated in PR horizontal resolution to produce a merged dataset. The reason for that is the difference spatial resolutions of the three instruments, but the time lag of observation among the three instruments to the same target is less than 1 min, i.e., the quasi-synchronous observations (Liu et al., 2008; Fu et al., 2011; Sun and Fu, 2021). Statistics show about 7 VIRS pixels within 1 PR pixel. It was found that the spectral signals of VIRS changed weakly after merging; the mean change was less than 0.7 %, and the mean square deviation was less than 2.5 % (Fu et al., 2011). Because TMI channels have different spatial resolutions that are larger than PR pixel resolution, the nearest neighbor method was used to obtain microwave brightness temperature at PR pixel resolution, i.e., each PR pixel was assigned the microwave brightness temperatures of nine channels from a TMI pixel closest to the PR pixel (Liu et al., 2008).
3.1 The algorithm of rain cell identification
The definition of rain cell in this study is the same as that proposed by Fu et al. (2020), i.e., a rain cell consists of at least four connected rain pixels within the swath of PR's scan. This also eliminates those tiny rain cells smaller than four rain pixels. In the process of identifying rain cells, the eight-connected domain method is used. According to the working mode of PR, its swath consists of 49 pixels (from number 1 to 49), so if the identified rain cell has pixels at the PR swath edge (the first pixel and 49th pixel), the rain cell is not included. If the identified rain cell is at the beginning or end of the PR swath, the rain cell is also eliminated. The advantage of this is to avoid the truncation effect of PR swath. For the identified rain cells, this study utilizes the minimum bounding rectangle (MBR) fitting method and the best fit ellipse (BFE) fitting method to calculate the geometric parameters. The two methods can fit an ellipse and a rectangle frame with the smallest area covering the target object (rain cell), as done by Nesbitt et al. (2006) and Fu et al. (2020), respectively. There are differences in the geometric parameters calculated by the MBR and BFE fitting methods, such as the area of the external frame and spatial morphology index of rain cell. However, the physical parameters are unaffected by both methods. The rain cell parameters calculated in this study by the two fitting methods can be used by studies according to their own preferences.
3.2 The definitions of rain cell parameters
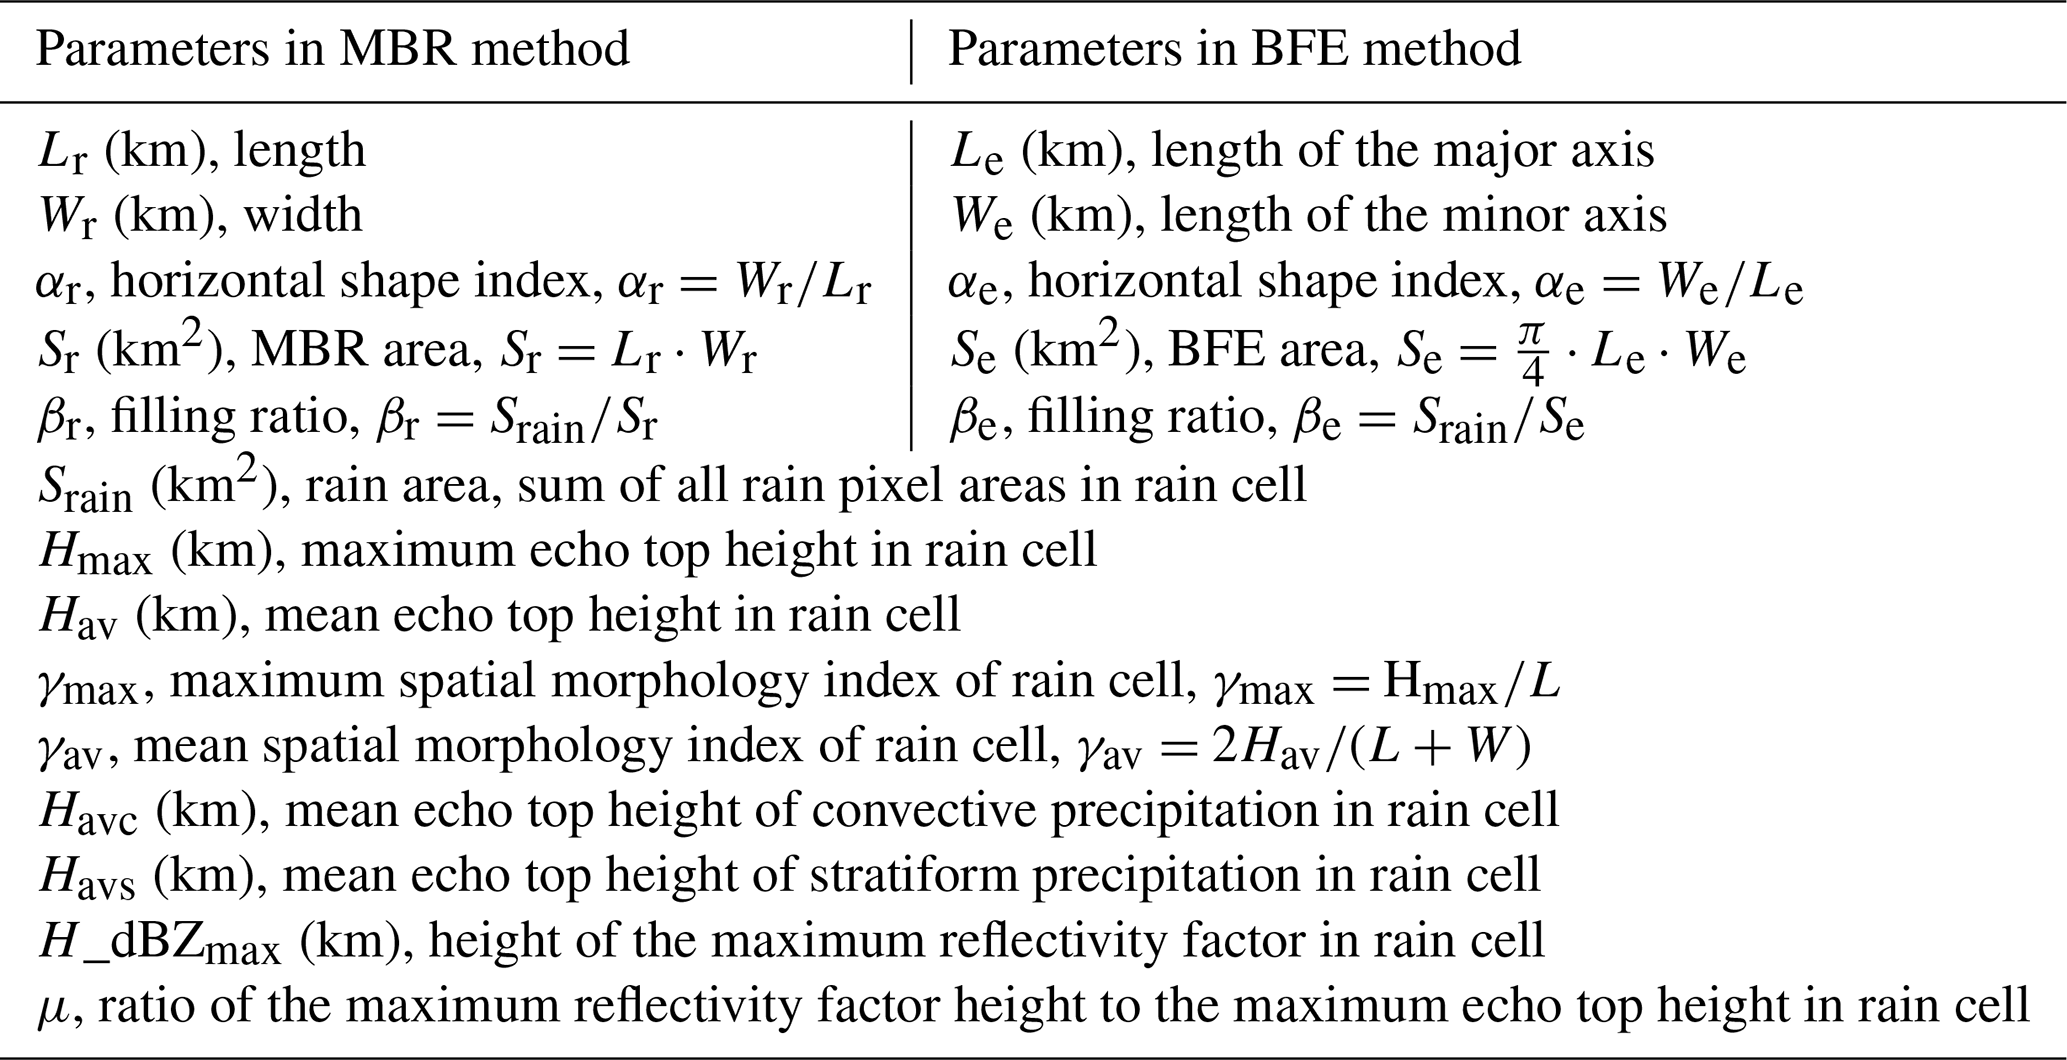
The definitions of geometric and physical parameters describing the identified rain cell were almost the same as that of Fu et al. (2020). The specific geometric parameters are listed in Table 1, in which the first six parameters describe the horizontal geometry of rain cells and the rest describe the vertical geometry. These parameters have a clear physical meaning, such as α, which represents the horizontal shape of a rain cell, a small (large) α indicates that the horizontal shape of rain cell is more like a strip (square) precipitation system, and it has more (less) correlation with a frontal precipitation system. The variable β expresses the ratio of a rain cell's area (Srain) to the area of a rectangle or ellipse frame (S), and characterizes the effectiveness of both methods used to fit the external frame of rain cells. A large (small) β indicates a larger (smaller) number of rain pixels inside the rectangle or ellipse frame. The variables γmax and γav represent the three-dimensional spatial shape of a rain cell. Small γmax (γav) indicates a “squatty” appearance of a rain cell, in contrast to a “lanky” appearance for larger γmax (γav).
Table 1Geometric parameter definitions of rain cell by the minimum bounding rectangle (MBR) method and the best fit ellipse (BFE) method.
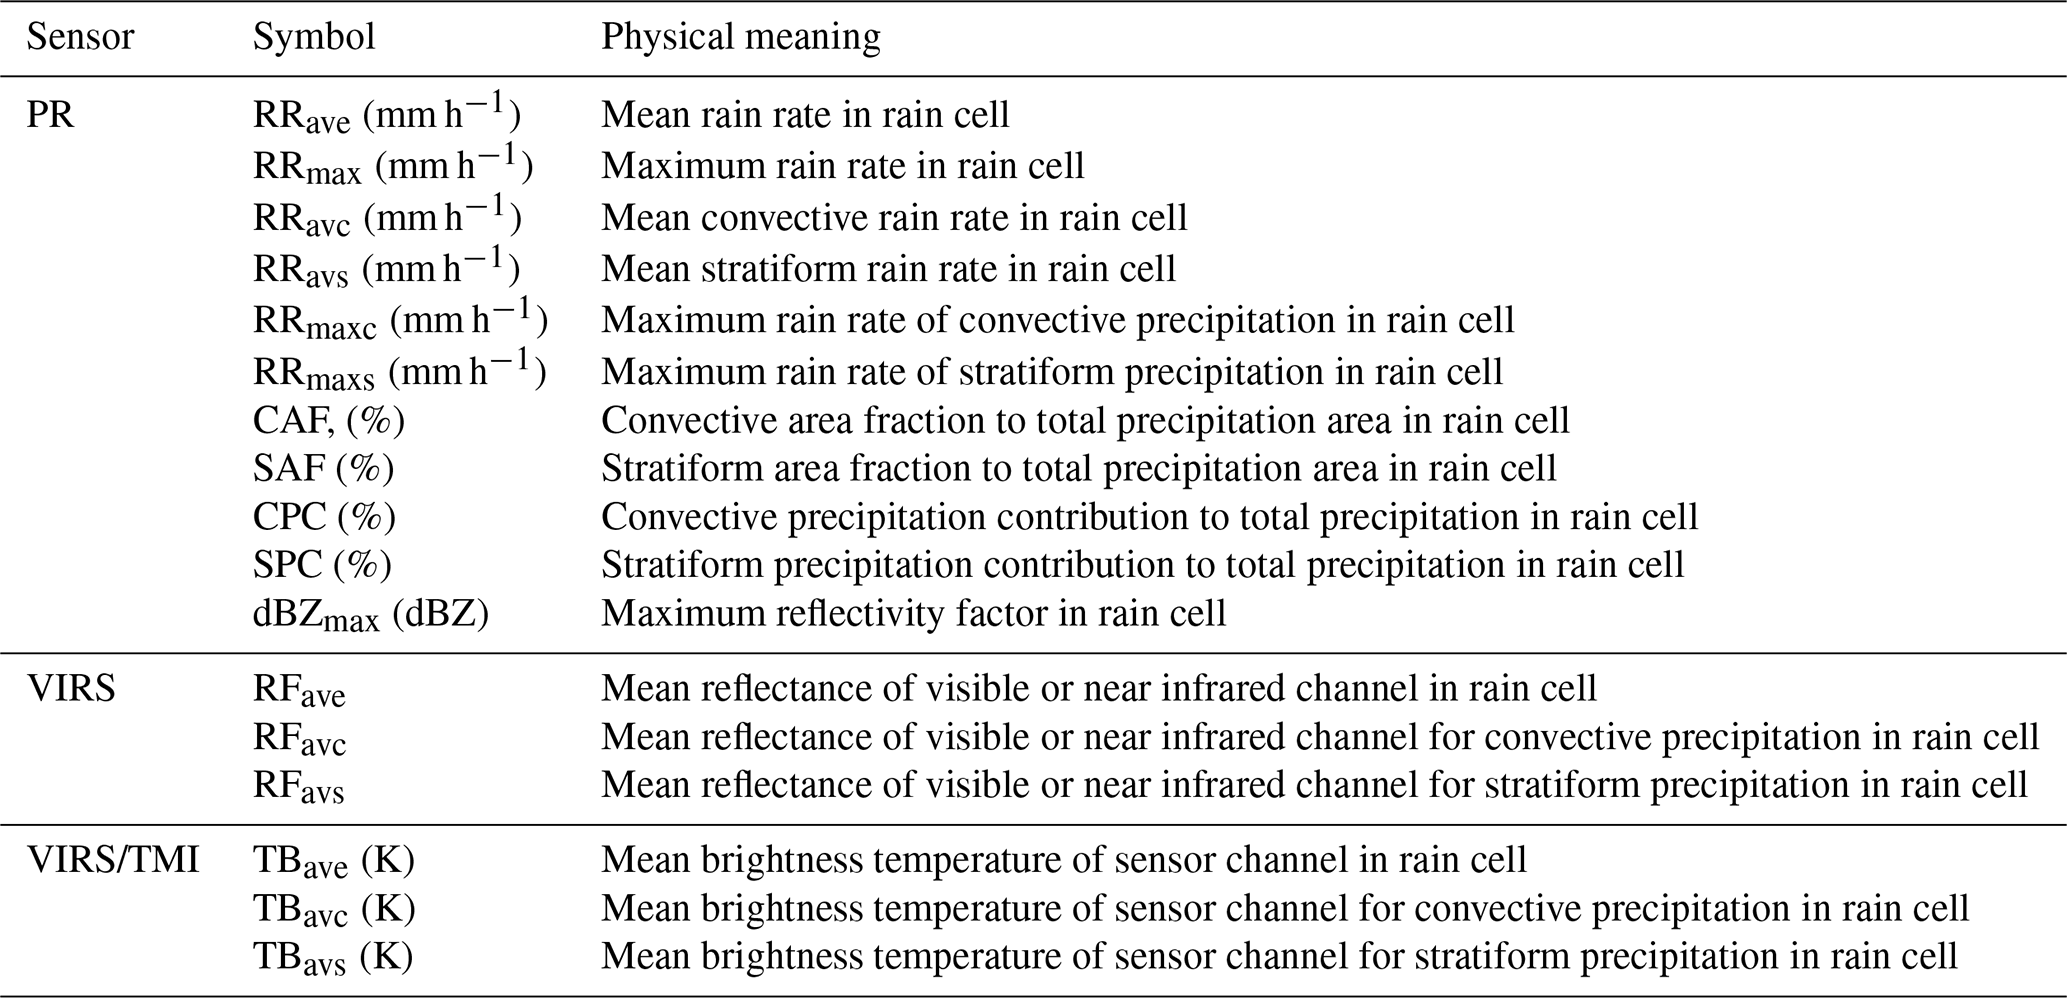
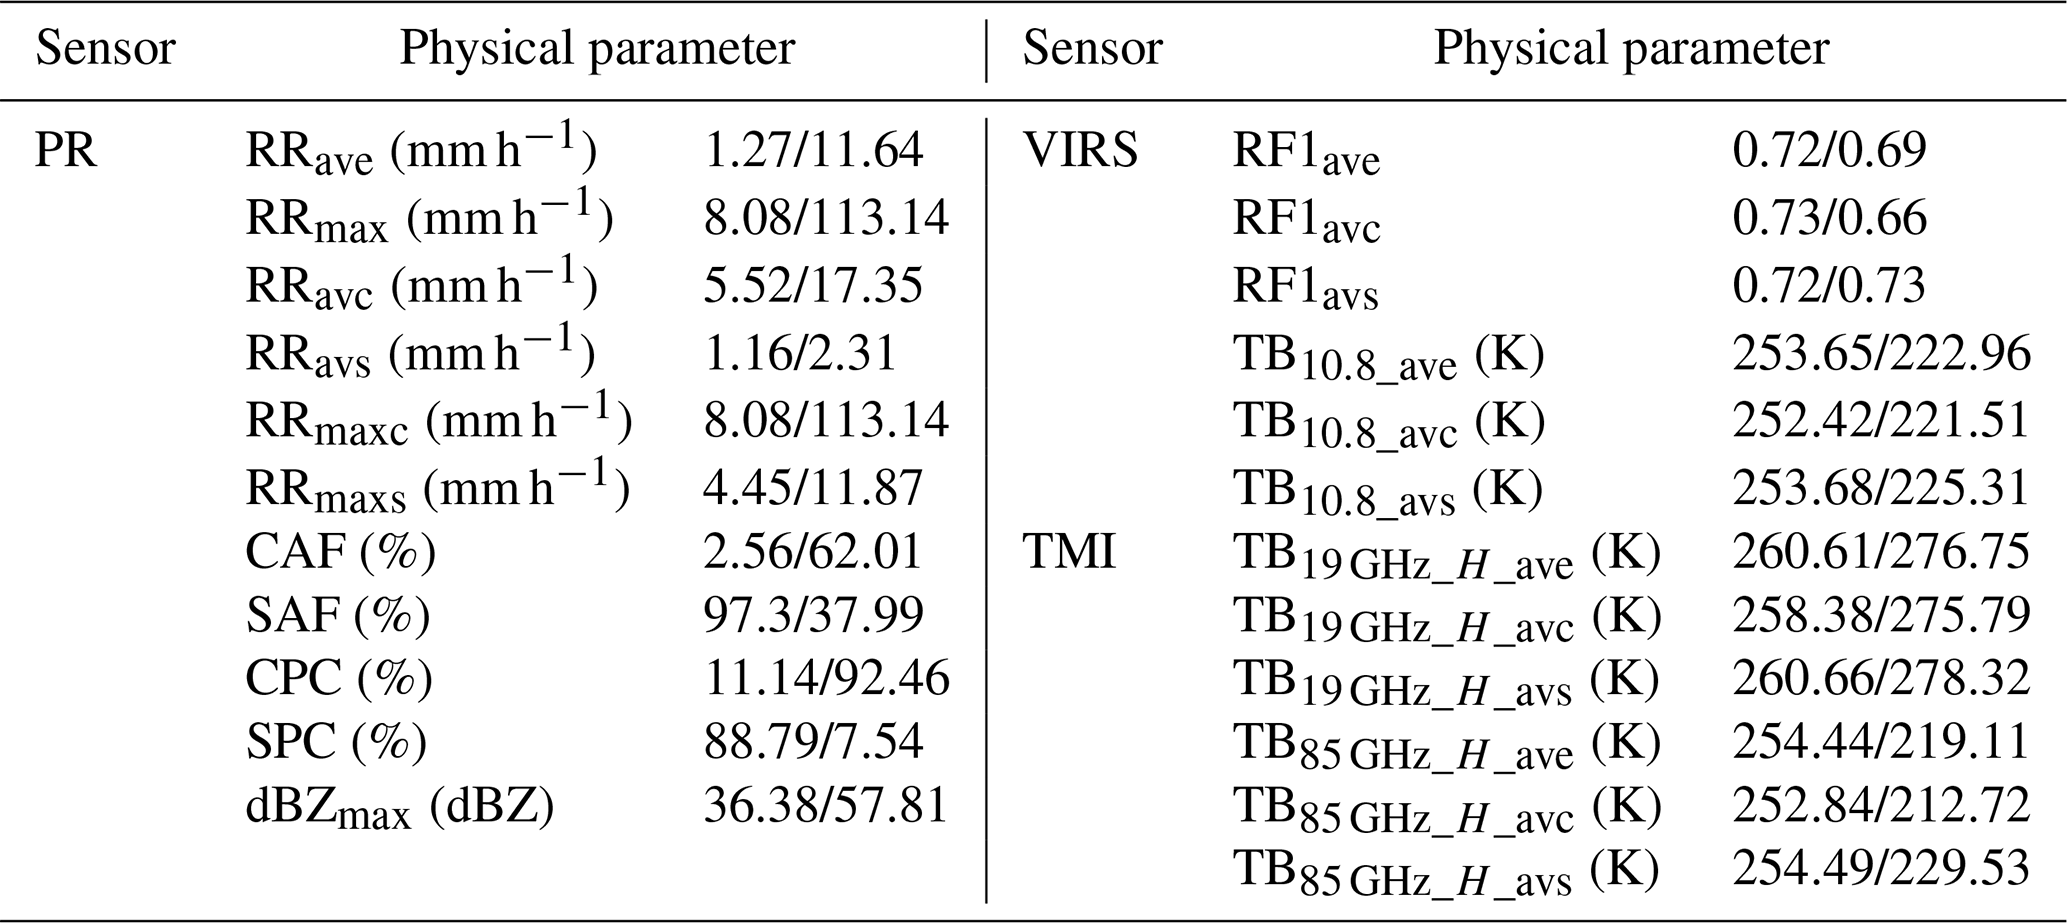
The physical parameter definitions of rain cells are listed in Table 2 including rain type, rain rate profile, reflectivity factor profile, mean rain rate, visible reflectance and infrared brightness temperature, microwave brightness temperature and so on. These parameters are significant for characterizing the intensity, the inhomogeneity, and the evolution stage of rain cell.
Table 2Physical parameter definitions of rain cell by the minimum bounding rectangle (MBR) method and the best fit ellipse (BFE) method.
4.1 Precipitation parameters of rain cell
In order to better understand the geometric and physical parameters of rain cells using the MBR and BFE fitting methods, two rain cells are analyzed below. One identified rain cell A occurred on 2 June 1999 in the southern Tibetan Plateau (TRMM orbit 08691), and the other, rain cell B, on 13 June 2003 in the eastern Tibetan Plateau (TRMM orbit 31787). Figure 1 shows the distribution of rain rate and rain type for the two rain cells. The frames of both methods are also plotted, which clearly shows the length and width of the frame from the MBR fitting method, and the long and short axes of the frame from the BFE fitting method. Table 3 lists the statistics of parameters for the two rain cells. Figure 1a shows that rain cell A applying the MBR fitting method has length 291.25 km (Lr), width 140.68 km (Wr), rain area 10 223.50 km2 (Srain), MBR area 40 971.84 km2 (Sr), and filling ratio 0.25 (βr). The horizontal shape index is 0.48 (αr), which indicates rain cell A with a strip like shape. The rain cell A applying the BFE fitting method (Fig. 1c) has length 345.88 km (Le), width 144.08 km (We), rain area 10 223.50 km2 (Srain), BFE area 39 140.42 km2 (Se), and filling ratio 0.26 (βe). The horizontal shape index is 0.42 (αe), which also indicates rain cell A with a strip like shape. Rain cell B, shown in Fig. 1b and d applying the MBR and BFE fitting method, has parameters listed in Table 3 that show it is slightly strip-shape.
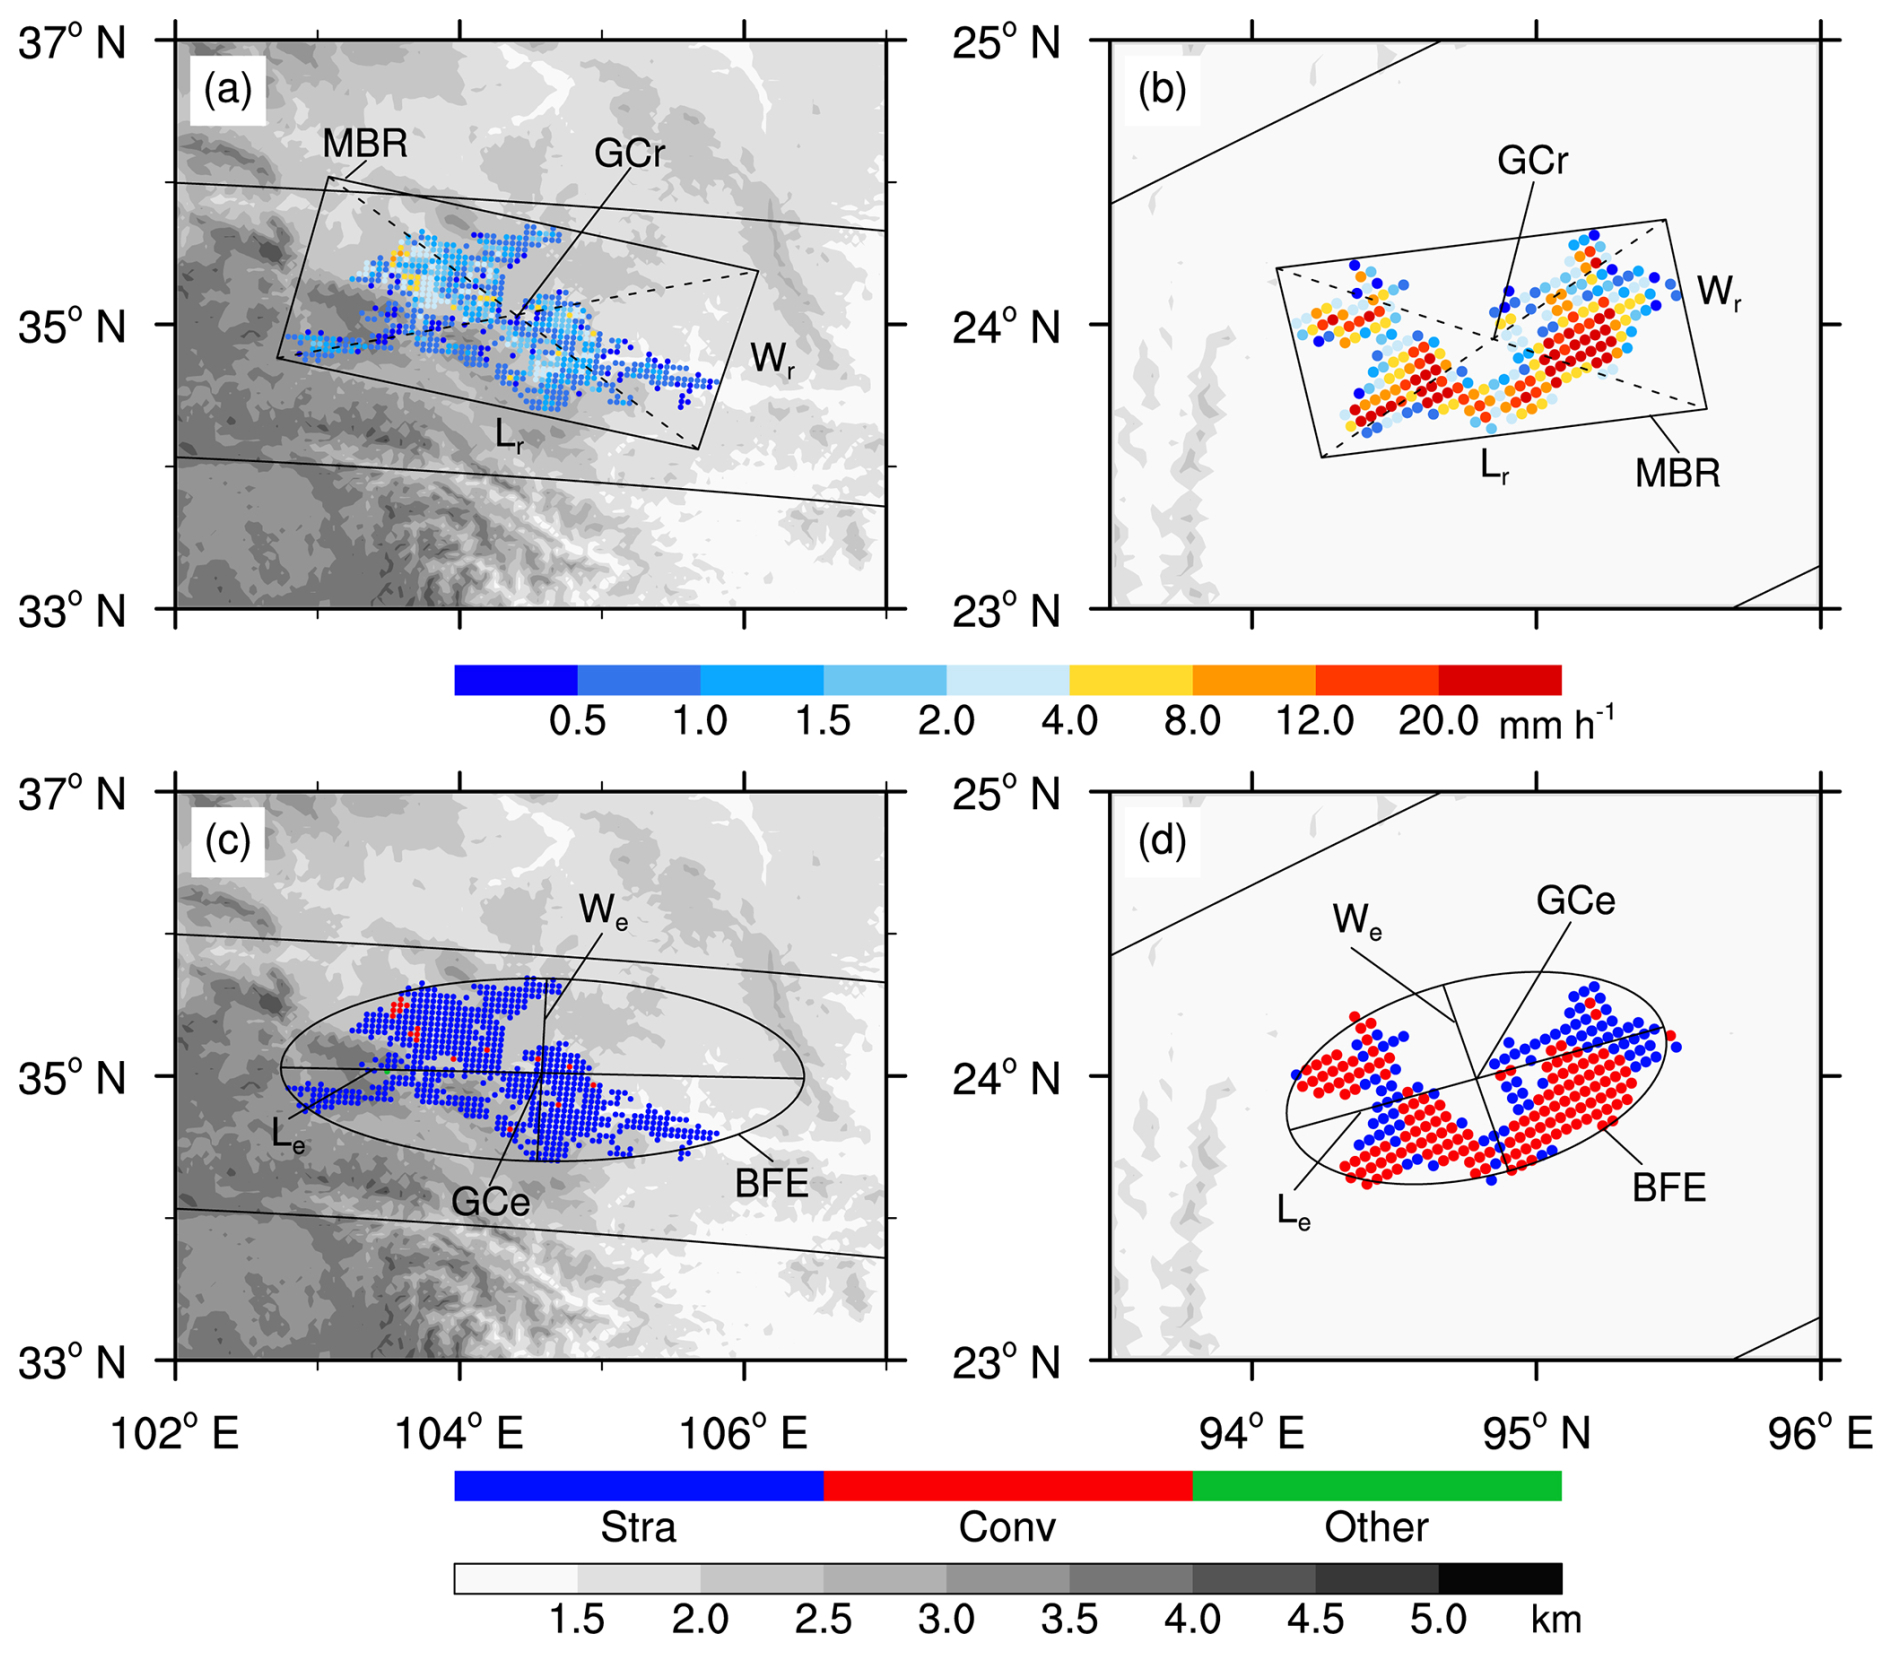
Figure 1Two rain cells occurred on 2 June 1999 and 13 June 2003 measured by PR: rain rate (a, b) and rain type (c, d, blue, red and green represent for stratiform, convective and other precipitation, respectively). The two rain cells in up panel were identified by MBR method, in bottom by BFE method. GCr and GCe represent for geometric center of rain cell identified by MBR method and BFE method, respectively. The gray level in the figure represents the elevation of the terrain.
The vertical parameters of both rain cells are also listed in Table 3. The variables γmax and γav are affected by the fitting method. Comparing rain cell A and B, the latter has higher echo tops (Hmax=17.75 km, Hav=9.47 km), and shows a “lanky” appearance (γmax=0.11, γav=0.08 in the MBR fitting method; γav=0.07 in the BFE fitting method). In rain cell B, the mean echo top height of convective precipitation (10.39 km) and stratiform precipitation (7.96 km) is also higher than those in rain cell A (Havc=5.76 km, Havs=5.58 km), which indicates that rain cell B has stronger updraft velocity and a deeper precipitating cloud. The ratio of the maximum reflectivity factor height to the maximum echo top height, μ, is 0.37 and 0.15 for rain cell A and B, respectively. By combining γmax and μ, it can be concluded that rain cell B is a deep precipitation system with large particles in the lower part of the cloud.
The physical parameters of both rain cells are listed in Table 4. PR observation shows that the mean rain rate RRave and the maximum rain rate RRmax of rain cell B are 11.64 and 113.14 mm h−1, respectively, while rain cell A is a relatively weak rain cell. The defined physical parameters also show that the mean convective rain rate of rain cell A is 5.52 mm h−1, and that of rain cell B is 17.35 mm h−1. Meanwhile, the mean stratiform rain rate of rain cell A and rain cell B are 1.16 and 2.31 mm h−1, respectively. The convective area fraction to total precipitation area (CAF) and stratiform area fraction to total precipitation area (SAF) are 2.56 % and 97.3 % for rain cell A, and 62.01 % and 37.99 % for rain cell B, respectively. The convective precipitation contribution to total precipitation (CPC) and stratiform precipitation contribution to total precipitation (SPC) are 11.14 % and 88.79 % for rain cell A, and 92.46 % and 7.54 % for rain cell B, respectively. This indicates that rain cell B is a convective rain cell while rain cell A is a stratiform rain cell. Rain cell B reaches the maximum reflectivity factor at an altitude of 2.75 km, while rain cell A reaches its maximum at 3.25 km. However, the dBZmax of rain cell B is 57.81 dBZ, which is much higher than that of rain cell A (36.38 dBZ). This reflects that there are relatively large particles at the bottom of rain cell B in the cloud.
Table 3The geometric parameters of rain cell A and B calculated by MBR method and BFE method.
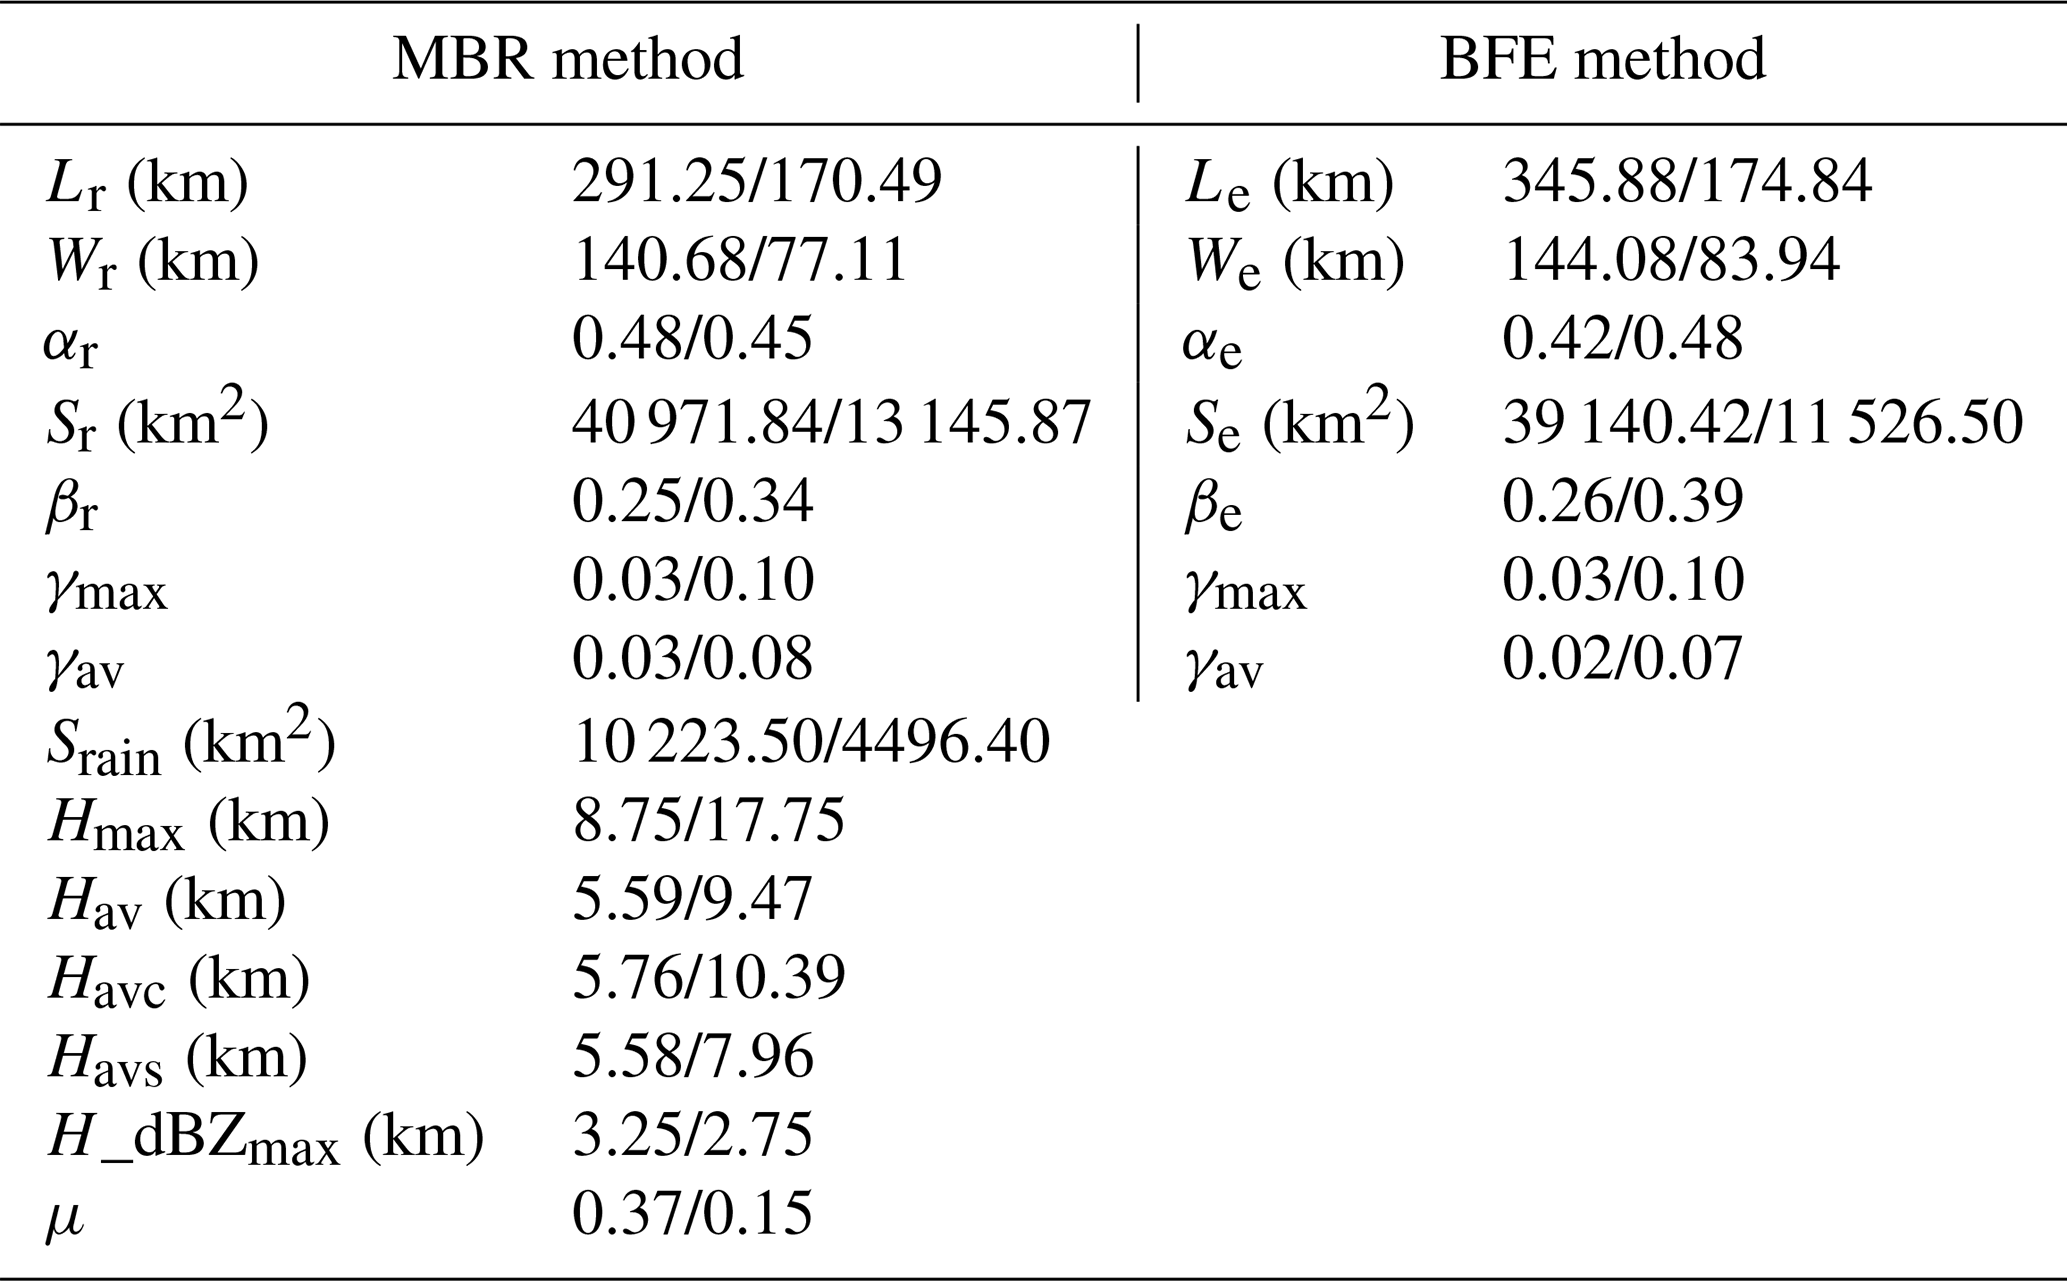
Table 4The physical parameters of rain cell A and B calculated by MBR method and BFE method.
4.2 VIRS and TMI signals of rain cell
Since TRMM PR, VIRS, and TMI observed the same target in spatiotemporal synchronization, the spatial distributions of visible reflectance (0.63 µm) and far-infrared brightness temperature (10.8 µm) for the two rain cells are shown in Fig. 2. The figure also shows the external frames of rain cells using the MBR and BFE fitting methods. It indicates many strips of reflectance (larger than 0.8) and a uniform distribution of brightness temperature (varying from 240 to 250 K) for rain cell A, while rain cell B consists of two convective clouds with reflectance greater than 0.85 and brightness temperature lower than 220 K. Table 4 also shows the calculated mean visible reflectance RF1ave for the two rain cells (0.72 for rain cell A and 0.69 for rain cell B, respectively). The RF1avc (RF1avs) for rain cell A is 0.73 (0.72), and for rain cell B, it is 0.66 (0.73). The large reflectance values indicate that the cloud optical thickness at the top of the two rain cells is large. The mean brightness temperature at VIRS channel 10.8 µm (TB10.8_ave) is 253.65 and 222.96 K for the two rain cells, indicating that rain cell B has a higher cloud top, i.e., the ice phase is distributed at the cloud top, while the cloud top of rain cell A has an ice-liquid mixed phase. The values of TB10.8_avc are lower than those of TB10.8_avs, which indicates that the cloud top height of convective rain pixels is higher than that of stratiform rain pixels. The signals of VIRS channels can be used to retrieve cloud parameters. The retrieval algorithms have been studied and reviewed by many authors (Nakajima and King, 1990; Rossow and Garder, 1993; Han et al., 1994; Rossow and Schiffer, 1999; Fu, 2014). In addition, the relationship between the precipitation of PR and the brightness temperature of VIRS can be extended to the infrared brightness temperature of geostationary satellites, thereby improving the precipitation forecasting capability of geostationary satellites.
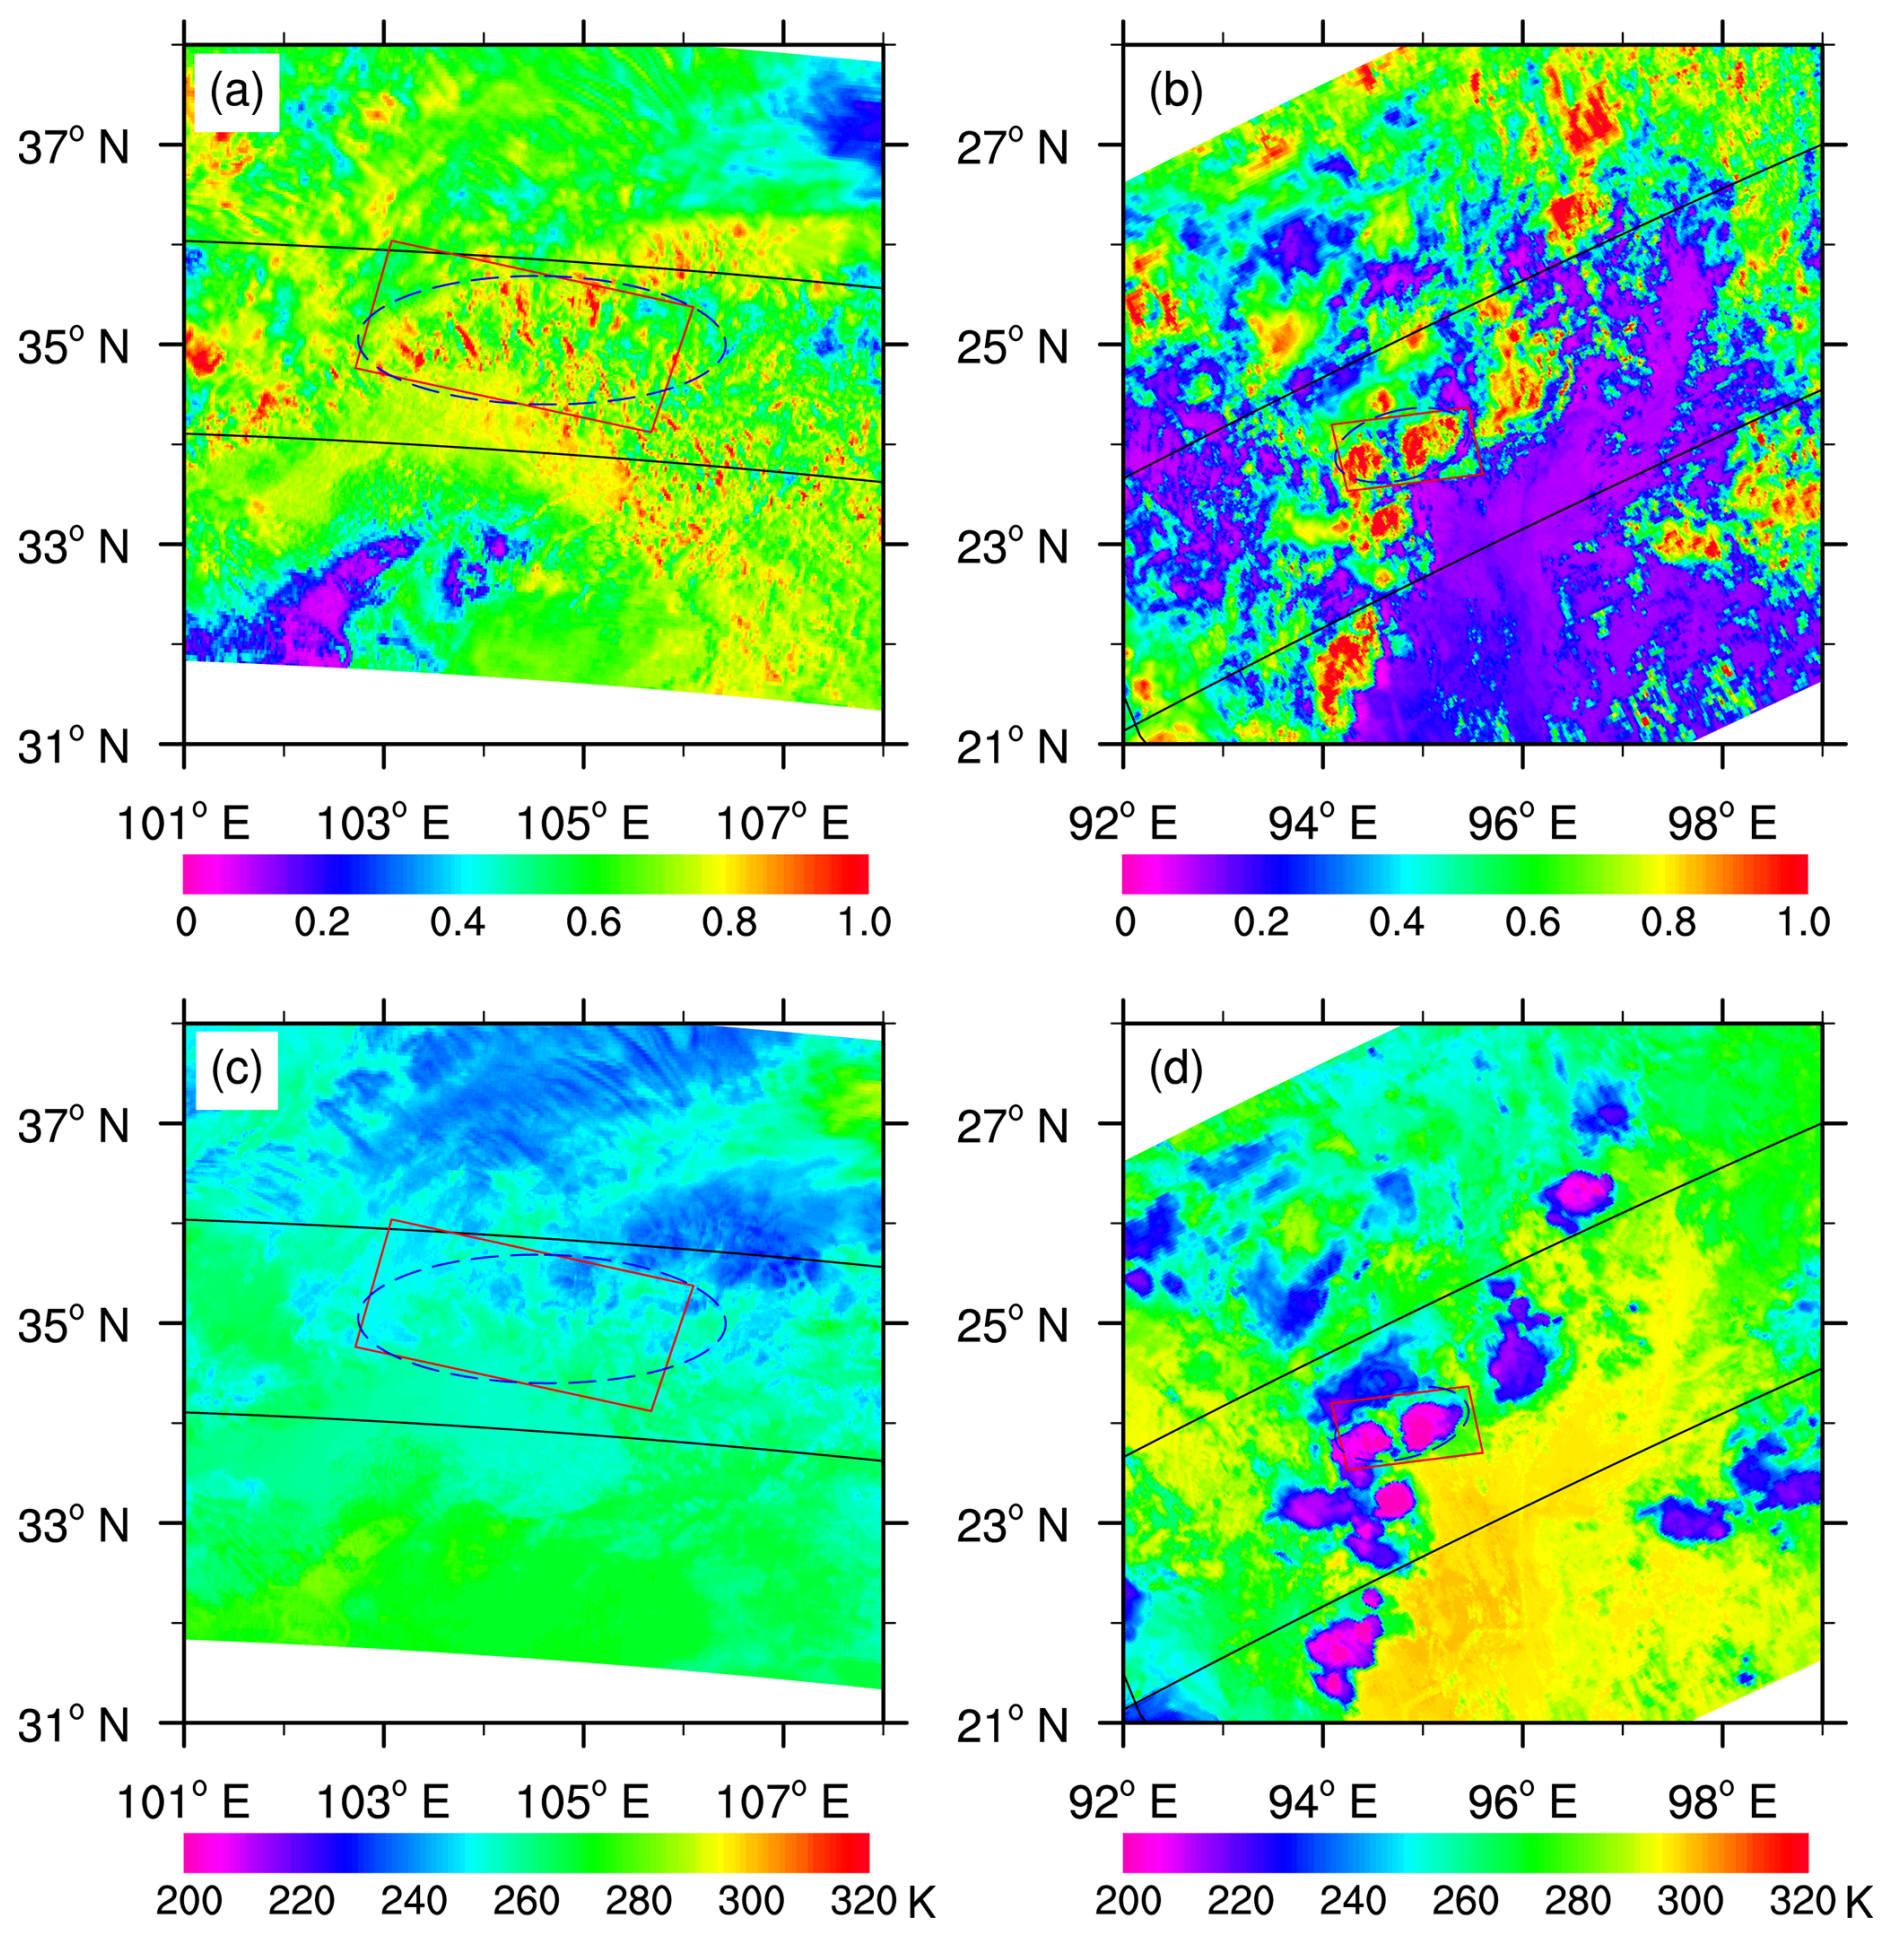
Figure 2The reflectance distribution of visible channel at 0.63 µm (a, b) and brightness temperature distribution of far-infrared channel at 10.8 µm (c, d) for the two cases observed by VIRS (Visible and Infrared Scanner). The solid black line is PR (Precipitation Radar) scanning track. The red solid rectangle and blue dash ellipse represent for the area of rain cell identified by MBR method and BFE method, respectively.
Similar to Fig. 2, the distribution of microwave brightness temperature observed by nine channels of TMI is shown. However, for simplicity, Fig. 3 only plots the distribution of brightness temperature at the TMI horizontal polarization channels 19.4 and 85 GHz. At channel 19.4 GHz, rain cell A shows relatively lower brightness temperature (from 250 to 280 K), while rain cell B has higher brightness temperature (from 260 to 290 K). Because the low-frequency microwave channel is easily affected by the radiation from the land surface, it can be judged that the temperature of land surface in rain cell A is lower than that in rain cell B. The brightness temperature of microwave high frequency channels is mainly affected by the composition of ice phase inside cloud, such as ice particles and supercooled water, while the influence of land surface radiation on these channels is weak. The more content of ice phase composition inside the cloud, the lower brightness temperature at these high frequency channels. According to this principle, rain cell B shows low brightness temperature at 85 GHz in Fig. 3d because the rain cell belongs to a deep convective precipitation system. Because rain cell A has more stratiform precipitation and fewer ice particles, its brightness temperature at the same channel is higher. In Table 4, the mean brightness temperature at channel 19.4 and 85 GHz also indicates the difference between the two rain cells and between the two rain types. The microwave brightness temperature of TMI channels can be used to retrieve cloud parameters such as ice water, liquid water, or rain rate based on retrieval algorithms of previous studies (Grody, 1976; Grody et al., 1980; Liu and Curry, 1993; Petty, 1994a, b; Wang et al., 2009; Fu, 2021). The rain rate from PR can also help optimize the passive microwave inversion of precipitation results. The related algorithms can be extended to the same microwave instruments on different platforms in the future.
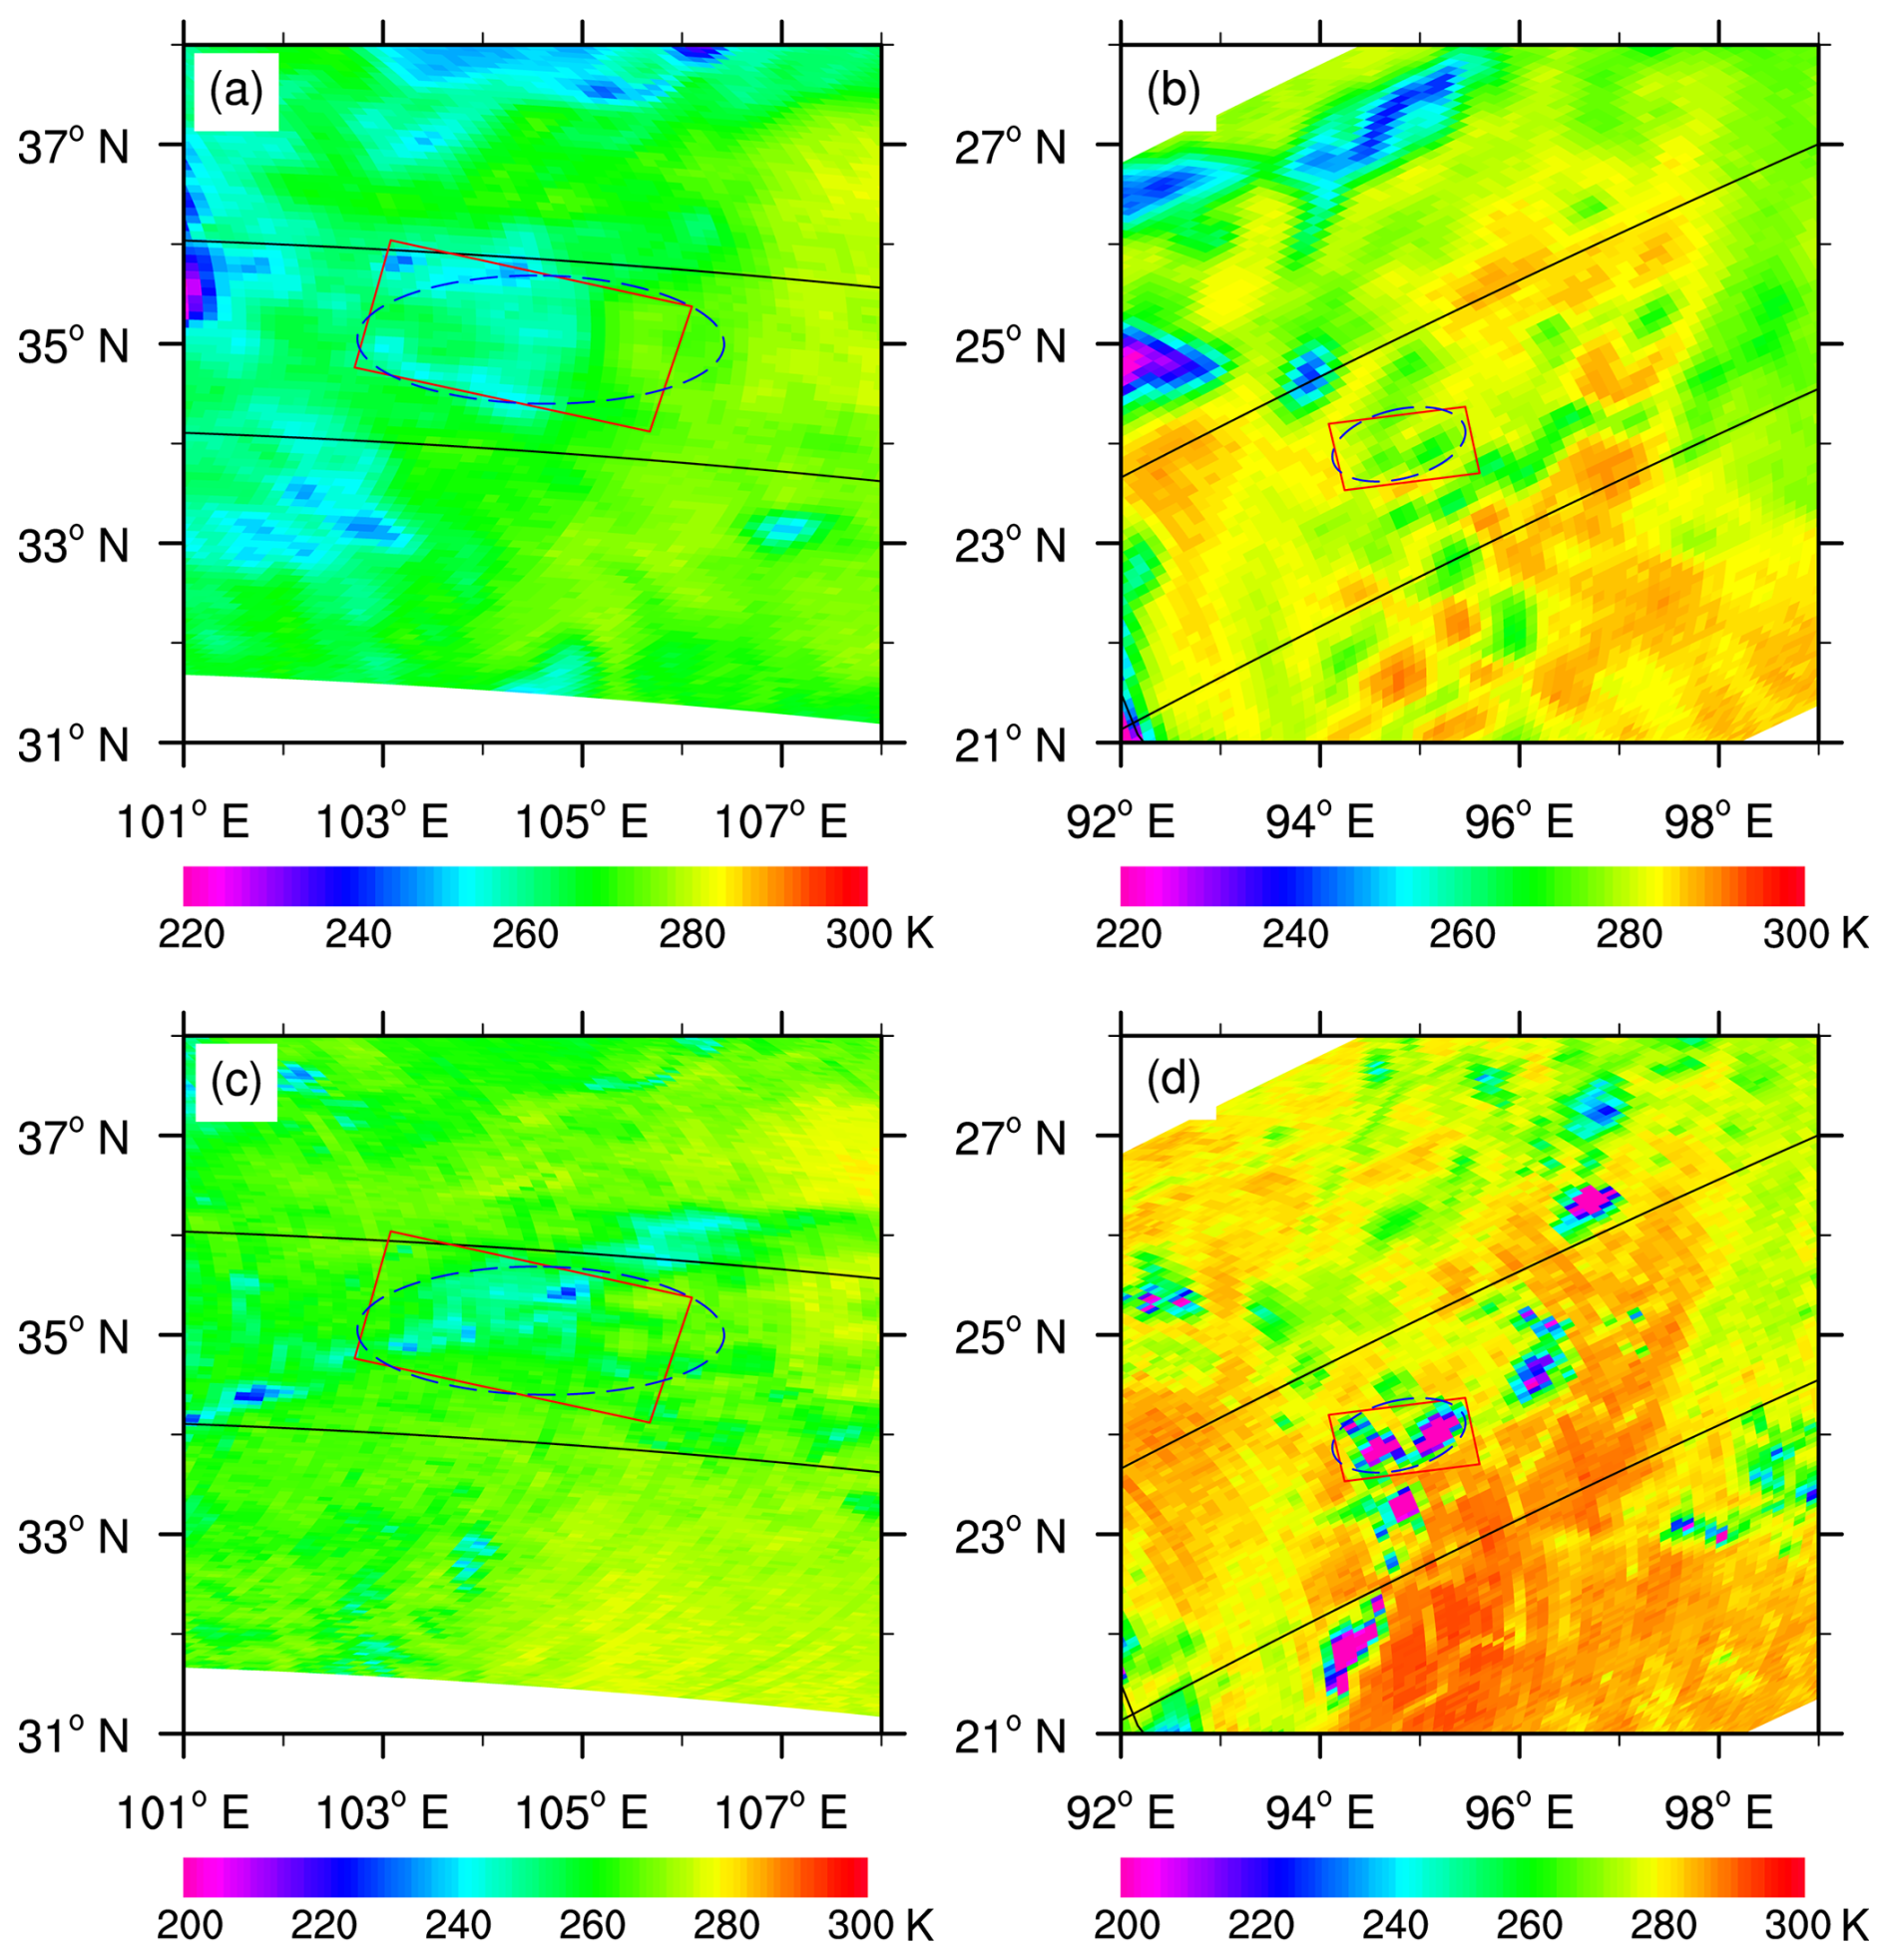
Figure 3The brightness temperature distribution of microwave horizontal polarization channel at 19 GHz (a, b) and at 85 GHz (c, d) for the two cases observed by TMI (TRMM Microwave Imager). The solid black line is PR (Precipitation Radar) scanning track. The red solid rectangle and blue dash ellipse represent for the area of rain cell identified by MBR method and BFE method, respectively.
In order to visually display the parameter distributions of rain cells A and B using the MBR and BFE fitting methods, Fig. 4 shows the distribution of rain rate, reflectance at VIRS visible channel, brightness temperature at VIRS thermal infrared channel, and microwave brightness temperatures at TMI low-frequency and high-frequency channels. It must be pointed out that both VIRS and TMI signals in Fig. 4 correspond to PR precipitation pixels (that is, signals corresponding to each PR pixel's resolution), and these signals are not provided if no precipitation exists in the rain cell. Therefore, the rain cell data established in this study facilitate the study of the relationships among precipitation, visible/infrared, and microwave signals. The combination of multi-source data can effectively enhance the understanding of precipitation systems.
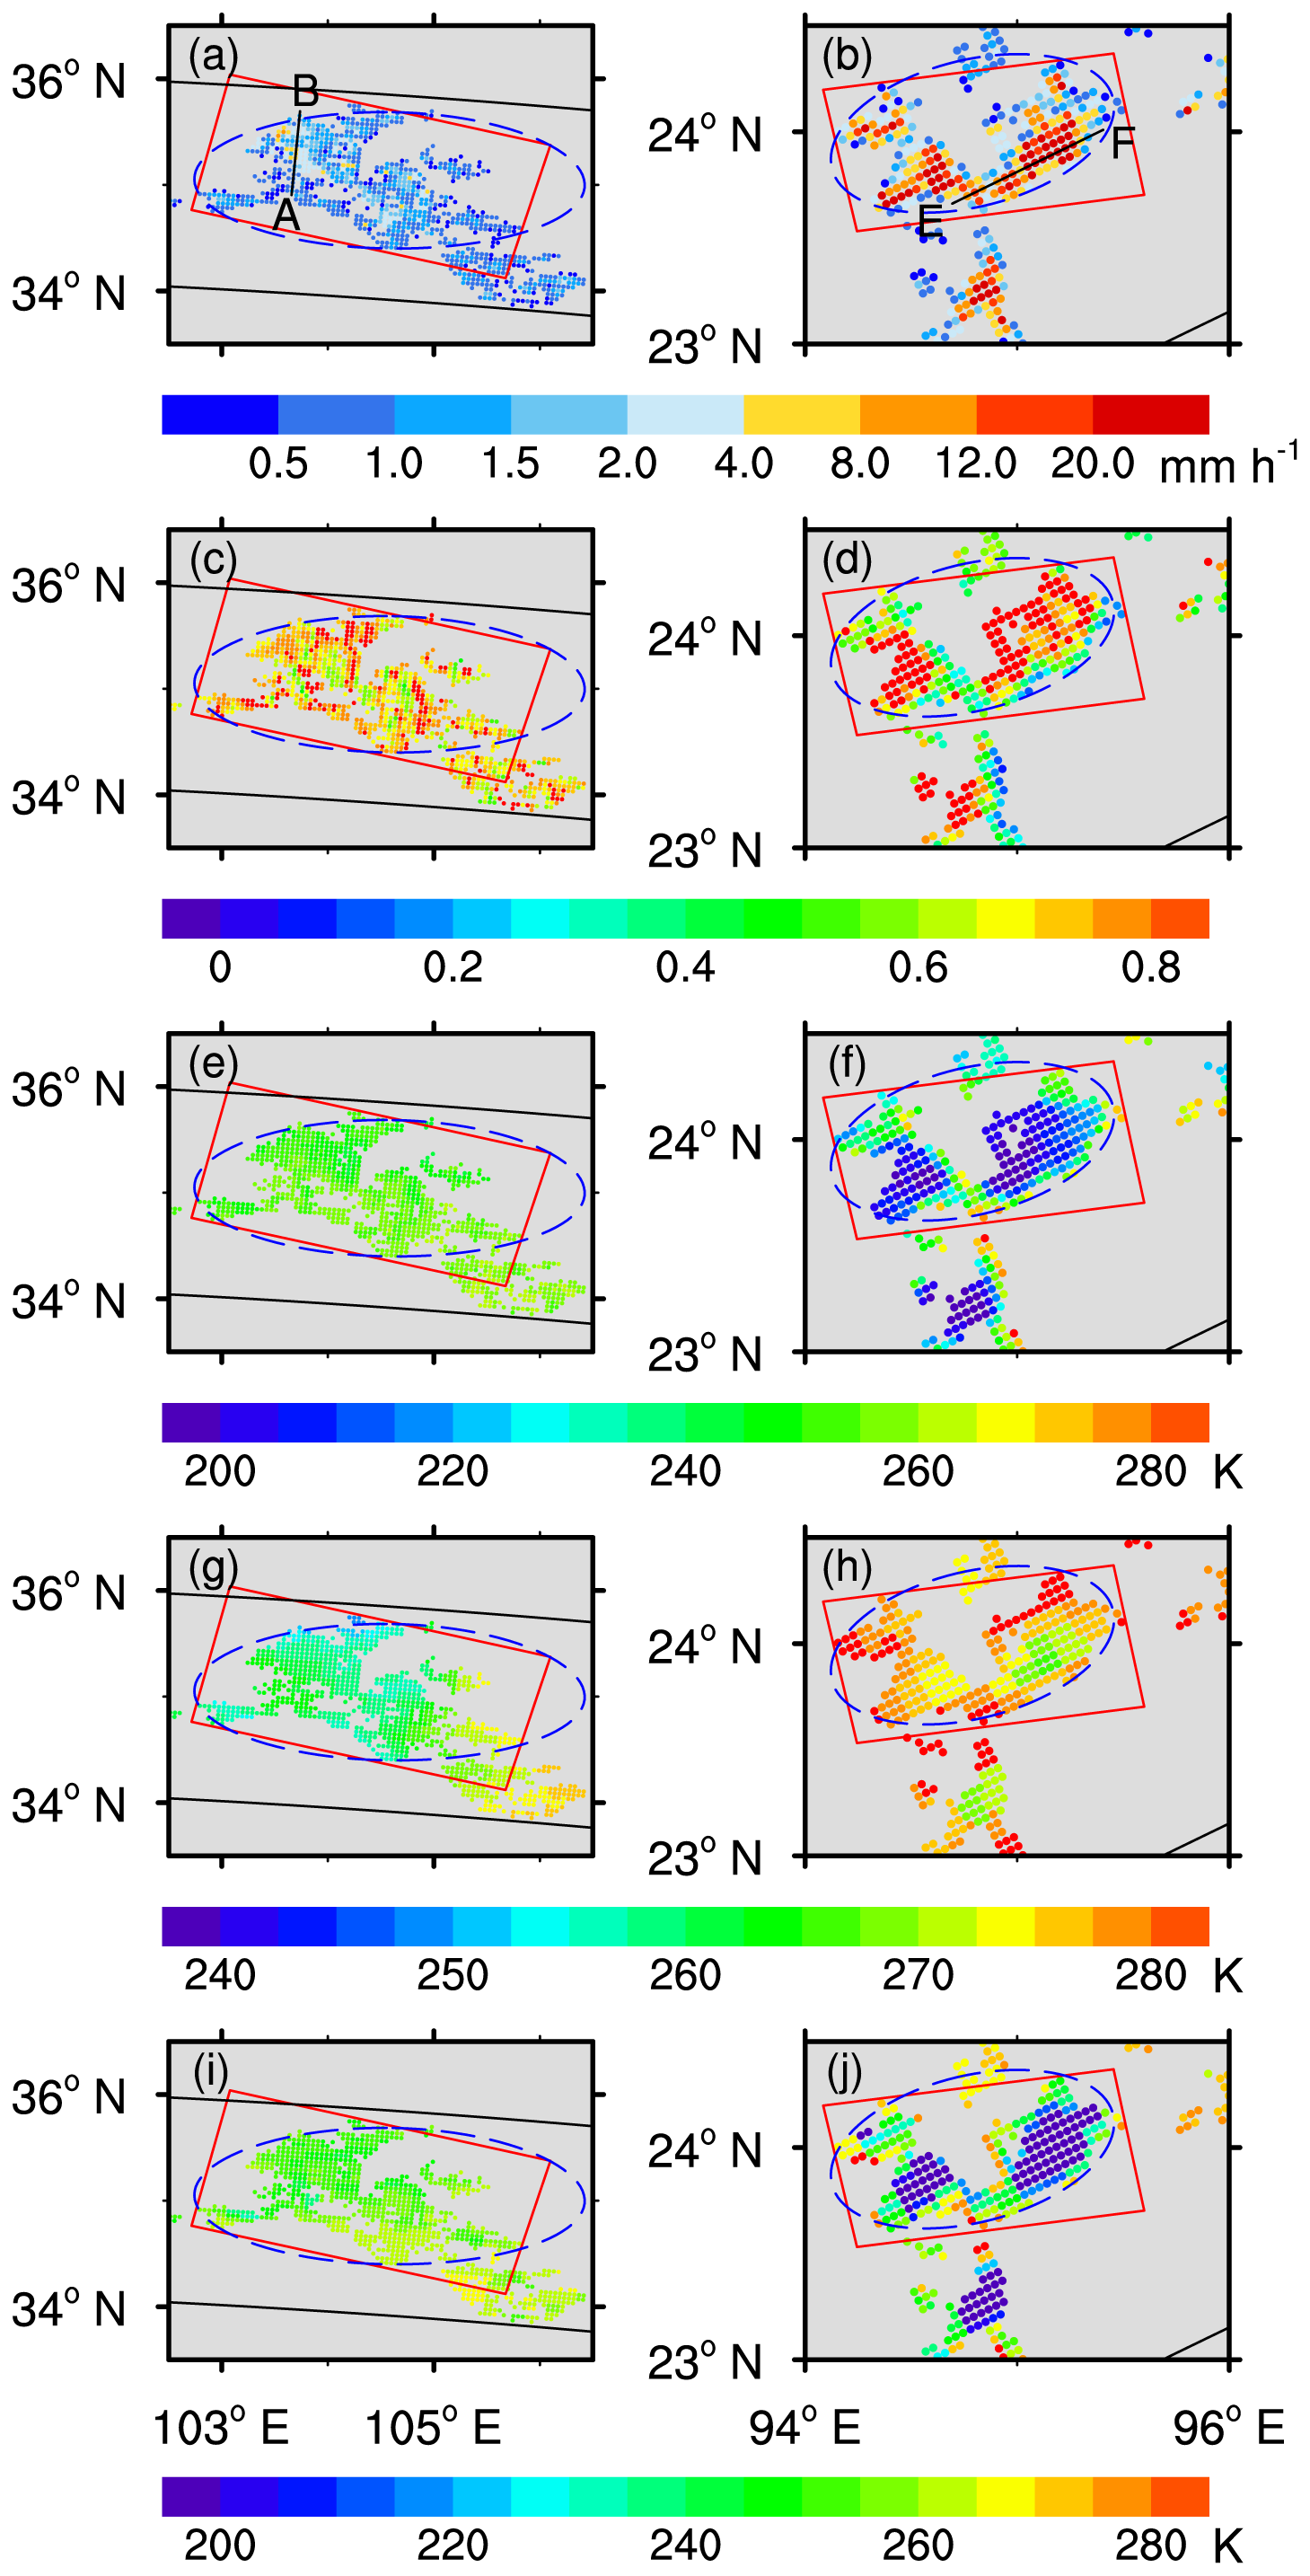
Figure 4The distributions of near-surface rain rate (a, b), reflectance at channel 0.63 µm (c, d), brightness temperature at far-infrared channel 10.8 µm (e, f), brightness temperature at horizontal channel 19 GHz (g, h) and at 85 GHz (i, j) for the two cases based on the merged data.
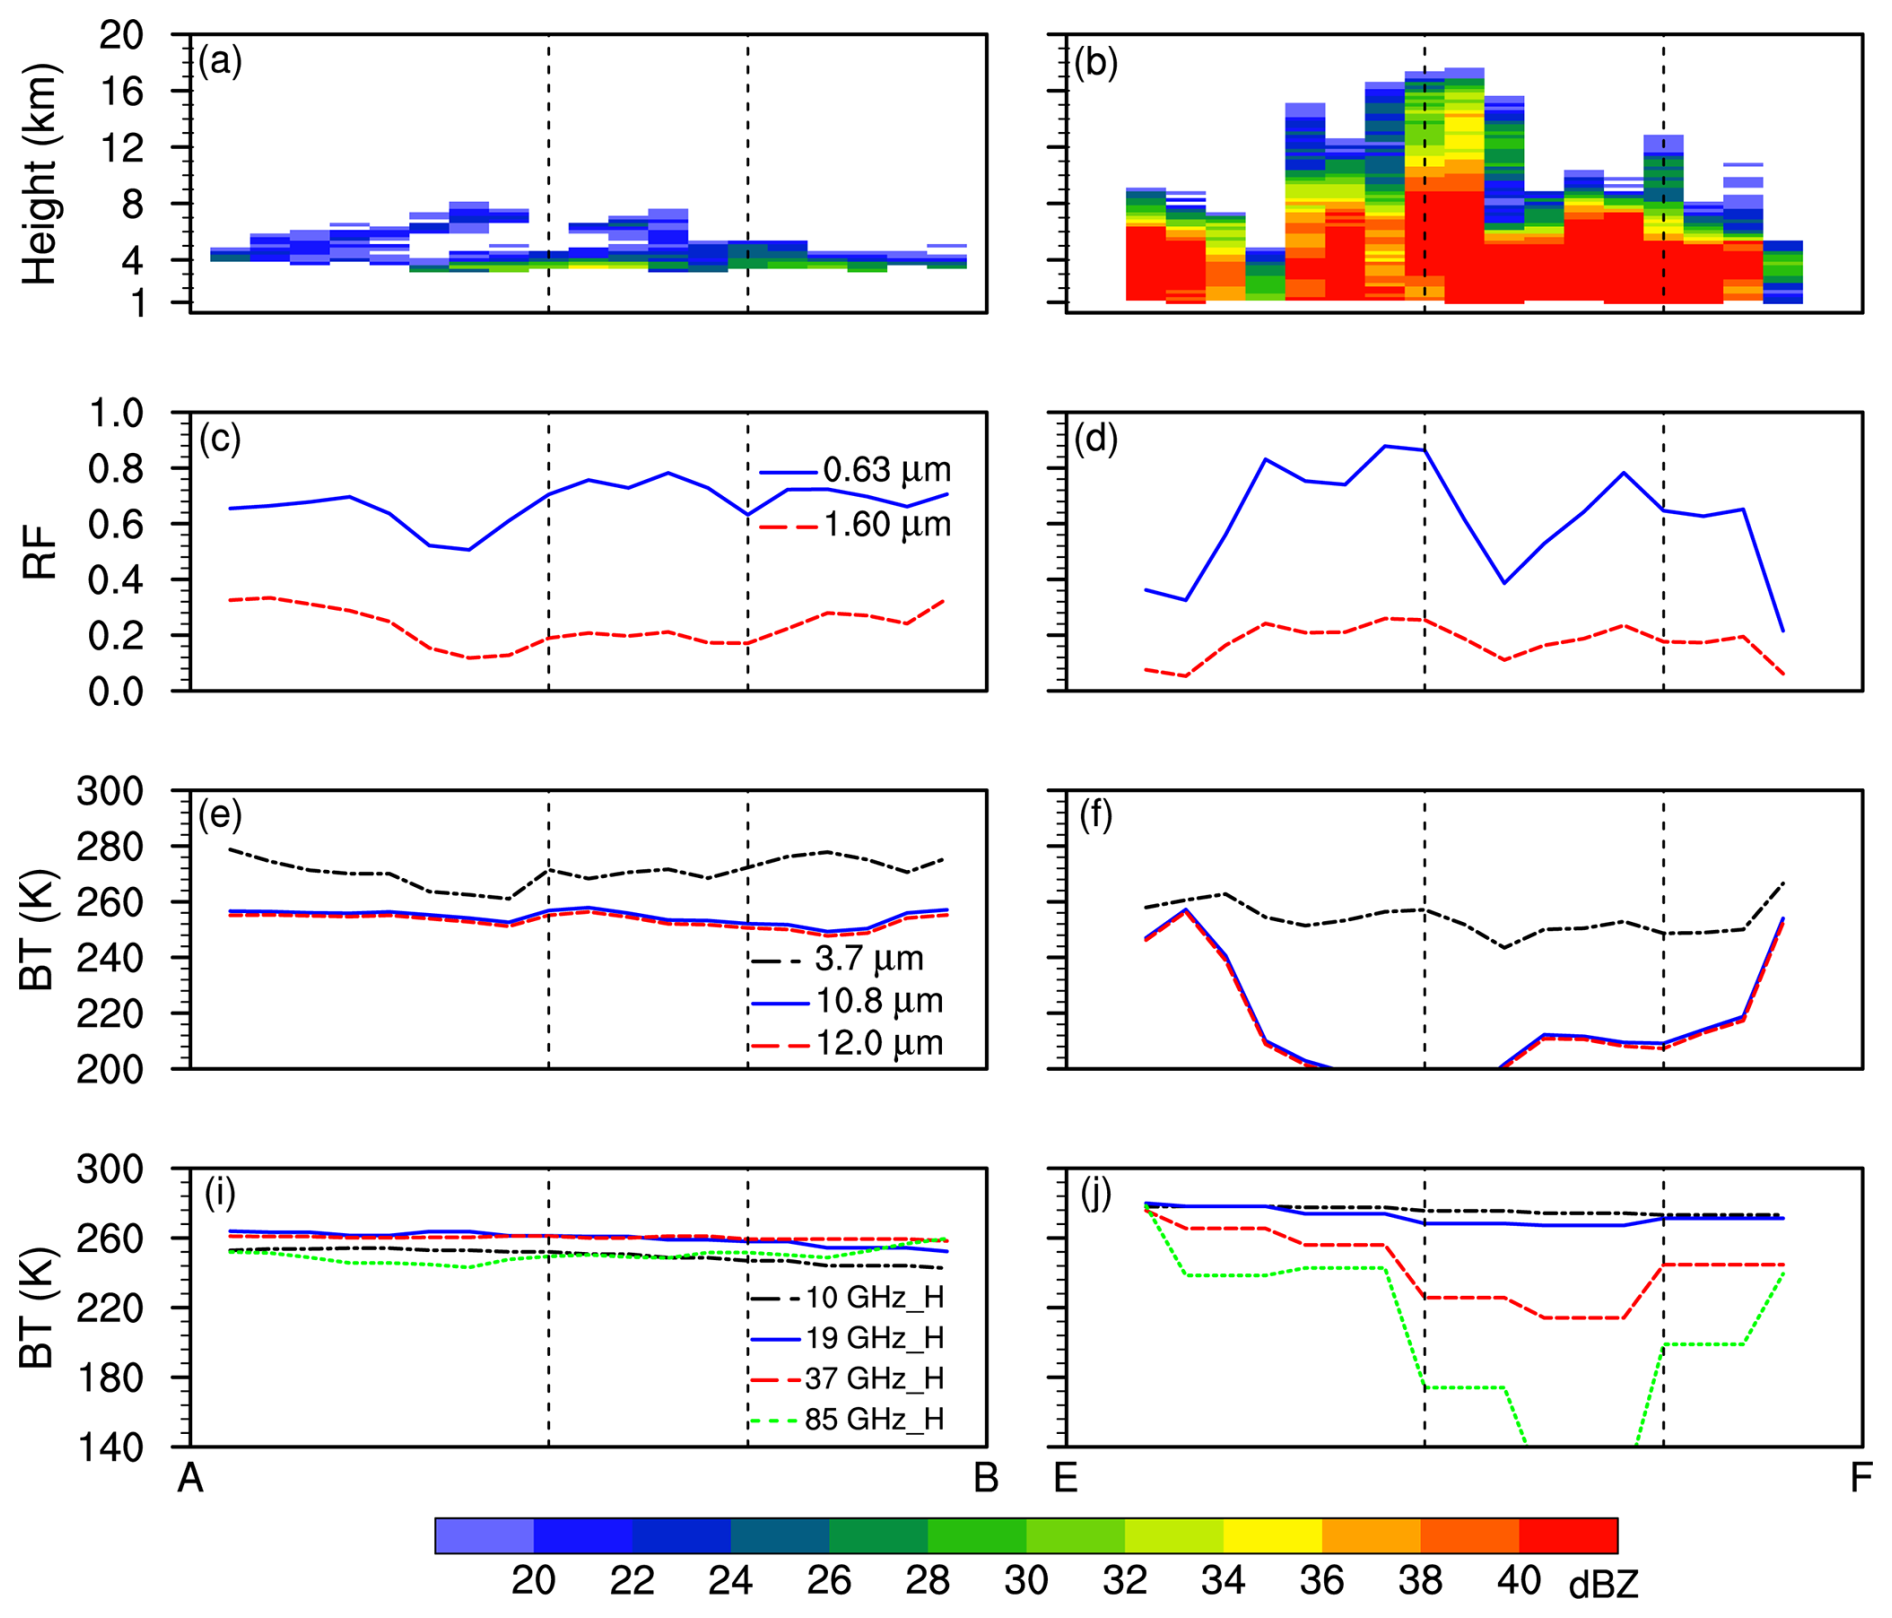
Figure 5The vertical cross sections of reflectivity factor (a, b), reflectance at VIRS channel 0.63 and 1.60 µm (c, d), infrared brightness temperature at VIRS channel 3.7, 10.8 and 12.0 µm (e, f), microwave brightness temperature at TMI horizontal channel 10, 19, 37 and 85 GHz along AB line and EF line as shown in Fig. 4a and b.
A simple application is shown in Fig. 5, which displays the multi-parameter distribution along the AB line and EF line in Fig. 4a and b, respectively. The vertical cross sections of reflectivity factor (Fig. 5a and b) show that rain cell A is a shallow and weak precipitation system, while rain cell B is deep convective precipitation system. The strong echo (greater than 38 dBZ) of rain cell B reaches higher altitude, nearly 16 km. The visible reflectance (Fig. 5c and d) from the cloud tops of the two rain cells varies between 0.4 and 0.8, and the reflectance of the strong echo region in rain cell B is higher (greater than 0.6). The near-infrared reflectance (Fig. 5c and d) varies from 0.1 to 0.4, which means there are a lot of ice particles inside the cloud of the two rain cells. The infrared brightness temperature at VIRS channel 3.7 µm (Fig. 5e and f) shows higher values in rain cell A, relatively lower in rain cell B. At VIRS channels 10.8 and 12.0 µm, rain cell A has uniform brightness temperatures, while rain cell B exhibits the characteristics of a deep convective cloud top, with low brightness temperature. For the four horizontal polarization channels of TMI (Fig. 5i and j), the microwave brightness temperature of rain cell A is uniformly distributed, and the brightness temperature of each channel has little difference. In rain cell B, the brightness temperature at low-frequency channels, 10 and 19 GHz, is also evenly distributed, and the brightness temperature at the two channels is higher than that in rain cell A, but the brightness temperature at the 37 and 85 GHz channels changes significantly. Corresponding to the strong echo region in Fig. 5b, the brightness temperature of these two channels is low, indicating that there are more ice particles inside the cloud in strong echo region of rain cell B. The results indicate that the established new data can be used to analyze the spectral signals and microwave characteristics of precipitating clouds.
The rain cell dataset used in this study, which applies the fitting methods of MBR and BFE together with the defined geometric and physical parameters to describe rain cell characteristics, is accessible at https://doi.org/10.5281/zenodo.15387988 (Wu and Fu, 2025).
In order to study the characteristics of geometric and physical parameters of rain cells, the basic units in natural precipitation systems, this study was inspired by earlier studies and made full use of the advantages of TRMM PR, VIRS, and TMI observations, i.e., the precipitation profile of PR reflecting precipitation structure, the visible and infrared signals of VIRS representing cloud top information, and the microwave signals of TMI reflecting hydrometeors in cloud columns. By matching and merging these data at PR pixels, the minimum bounding rectangle (MBR) fitting method and the best fit ellipse (BFE) fitting method were applied to calculate the geometric parameters of rain cells. Thus, combining these with physical parameters, a new rain cell dataset was established.
In this study, the geometric parameters (length, width, height, etc.) and physical parameters (rain rate, visible reflectance and thermal infrared brightness temperature from cloud top, and microwave brightness temperature from cloud column) of the two rain cells (weak and strong rain cells) using the MBR and BFE fitting methods were calculated. The results show that the weak rain cell shows stratiform precipitation with low rain rate, while the strong rain cell exhibits vertically deep convective precipitation and has low thermal infrared brightness temperature at the cloud top. All these indicate that the rain cell definition parameters using the two fitting methods are reasonable and intuitive.
It must be noted that the difference between the MBR fitting method and the BFE fitting method is only in the geometric parameters of the rain cell, and the difference is minor, such as slight differences in the area of the external frame of the rain cell, as well as the spatial morphology index of the rain cell. The physical parameters of the rain cell are not affected by the fitting method.
The new rain cell data in this study can be used to study the characteristics of the geometric and physical parameters of rain cells. Although a lot of achievements have been made in this field, a systematic and in-depth analysis is still needed, such as the regional differences of these parameters and the characteristics of climate change. It can also be used to analyze the relationship between the physical and geometric parameters of rain cells, and this relationship exhibits regional differences. The effective radius of cloud particles, optical thickness, liquid water path, and other parameters in rain cells can be obtained by combining retrieval algorithms of visible and near-infrared reflectance. These parameters can be used to analyze the characteristics of cloud physical parameters in rain cells. Parameters such as cloud water and ice water in column, cloud temperature, and rain rate in rain cells can also be retrieved using microwave brightness temperature retrieval algorithms, and the relationships among these parameters can be analyzed. The previously mentioned studies are expected to yield results shortly.
ZW and YF prepared the data in the standardized format. ZW uploaded the data in the data repository and prepared the manuscript with contribution from YF. All the authors discussed the concepts and edited the manuscript.
The contact author has declared that none of the authors has any competing interests.
Publisher's note: Copernicus Publications remains neutral with regard to jurisdictional claims made in the text, published maps, institutional affiliations, or any other geographical representation in this paper. While Copernicus Publications makes every effort to include appropriate place names, the final responsibility lies with the authors. Also, please note that this paper has not received English language copy-editing.
We would like to acknowledge the National Aeronautics and Space Administration (NASA) for providing TRMM PR, VIRS and TMI datasets.
This research has been supported by the National Natural Science Foundation of China (grant nos. 42230612 and 42275140) and The Second Tibetan Plateau Scientific Expedition and Research (STEP) program (grant no. 2019QZKK0104).
This paper was edited by Lukas Gudmundsson and reviewed by three anonymous referees.
Austin, P. M. and Houze, R. A.: Analysis of the structure of precipitation patterns in New England, J. Appl. Meteorol., 11, 926–935, https://doi.org/10.1175/1520-0450(1972)011<0926:Aotsop>2.0.Co;2, 1972.
Awaka, J.: A three-dimensional rain cell model for the study of interference due to hydrometeor scattering, J. Commun. Res. Lab., 36, 13–44, 1989.
Awaka, J., Iguchi, T., Kumagai, H., and Okamoto, K.: Rain type classification algorithm for TRMM precipitation radar, IEEE International Geoscience and Remote Sensing Symposium Proceedings, Remote Sensing – A Scientific Vision for Sustainable Development, Singapore, 3–8 August 1997, https://doi.org/10.1109/IGARSS.1997.608993, 1997.
Begum, S. and Otung, I. E.: Rain cell size distribution inferred from rain gauge and radar data in the UK, Radio. Sci., 44, RS2015, https://doi.org/10.1029/2008RS003984, 2009.
Cai, H. K., Mao, Y. Q., Zhu, X. H., Fu, Y. F., and Zhou, R. J.: Comparison of the minimum bounding rectangle and minimum circumscribed ellipse of rain cells from TRMM, Adv. Atmos. Sci., 41, 484–499, https://doi.org/10.1007/s00376-023-2281-9, 2024.
Capsoni, C., Fedi, F., Magistroni, C., Paraboni, A., and Pawlina, A.: Data and theory for a new model of the horizontal structure of rain cells for propagation applications, Radio. Sci., 22, 395–404, https://doi.org/10.1029/RS022i003p00395, 1987.
Chen, Y. L., Zhang, A. Q., Fu, Y. F., Chen, S. M., and Li, W. B.: Morphological characteristics of precipitation areas over the Tibetan Plateau measured by TRMM PR, Adv. Atmos. Sci., 38, 677–689, https://doi.org/10.1007/s00376-020-0233-1, 2021.
Han, Q., Rossow, W. B., and Lacis, A. A.: Near-global survey of effective droplet radii in liquid water clouds using ISCCP data, J. Climate, 7, 465–497, https://doi.org/10.1175/1520-0442(1994)007<0465:NGSOED>2.0.CO;2, 1994.
Feral, L., Mesnard, F., Sauvageot, H., Castanets, L., and Lemorton, J.: Rain cells shape and orientation distribution in south-west of France, Phys. Chem. Earth B: Hydrol. Oceans Atmos., 25, 1073–1078, https://doi.org/10.1016/s1464-1909(00)00155-6, 2000.
Fu, Y. F.: Cloud parameyers retrieved by the bispectral reflectance algorithm and associated applications, J. Meteorol. Res-Prc., 28, 965–982, https://doi.org/10.1007/s13351-014-3292-3, 2014 (in Chinese).
Fu, Y. F.: Research progress on retrieval algorithms of cloud liquid water over ocean based on remote sensing by satellite-borne passive microwave instruments, Torrential Rain and Disasters, 40, 217–230, https://doi.org/10.3969/j.issn.1004-9045.2021.03.001, 2021 (in Chinese).
Fu, Y. F. and Liu, G. S.: The variability of tropical precipitation profiles and its impact on microwave brightness temperatures as inferred from TRMM data, J. Appl. Meteorol., 40, 2130–2143, https://doi.org/10.1175/1520-0450(2001)040<2130:Tvotpp>2.0.Co;2, 2001.
Fu, Y. F., Liu, P., Liu, Q., Ma, M., Sun, L., and Wang, Y.: Climatological Characteristics of VIRS Channels for Precipitating Cloud in Summer Over the Tropics and Subtropics, J. Atmos. Environ. Optics., 6, 129–140, https://doi.org/10.3969/j.issn.1673-6141.2011.02.009, 2011 (in Chinese).
Fu, Y. F., Chen, Y., Zhang, X., Wang, Y., Li, R., Liu, Q., Zhong, L., Zhang, Q., and Zhang, A.: Fundamental characteristics of tropical rain cell structures as measured by TRMM PR, J. Meteorol. Res.-Prc., 34, 1129–1150, https://doi.org/10.1007/s13351-020-0035-5, 2020.
Gagin, A., Rosenfeld, D., Woodley, W. L., and Lopez, R. E.: 1986: Results of seeding for dynamic effects on rain-cell properties in FACE-2, J. Appl. Meteor. Climatol., 25, 3–13, https://doi.org/10.1175/1520-0450(1986)025<0003:ROSFDE>2.0.CO;2, 1986.
Goldhirsh, J. and Musiani, B.: Rain cell size statistics derived from radar observations at Wallops Island, Virginia, IEEE T. Geosci. Remote. Sens., GE-24, 947–954, https://doi.org/10.1109/TGRS.1986.289711, 1986.
Grody, N. C.: Remote sensing of atmospheric water content from satellites using microwave radiometry, IEEE T. Antenn. Propag., 24, 155–162, https://doi.org/10.1109/TAP.1976.1141324, 1976.
Grody, N. C., Grubel, A., and Shen, W. C.: Atmospheric water content over the tropical Pacific derived from the Nimbus-6 scanning microwave spectrometer, J. Appl. Meteor., 19, 986–996, https://doi.org/10.1175/1520-0450(1980)019<0986:AWCOTT>2.0.CO;2, 1980.
He, H. Z., Cheng, M. H., and Zhou, F. X.: 3D structure of rain and cloud hydrometeors for Typhoon Kujira (0302), Chinese J. Atmos. Sci., 30, 491–503, https://doi.org/10.3878/j.issn.1006-9895.2006.03.12, 2006 (in Chinese).
Houze, R. A.: Structures of atmospheric precipitation systems: A global survey, Radio. Sci., 16, 671–689, https://doi.org/10.1029/RS016i005p00671, 1981.
Houze, R. A.: Stratiform Precipitation in Regions of Convection: A Meteorological Paradox?, B. Am. Meteorol. Soc., 78, 2179–2196, https://doi.org/10.1175/1520-0477(1997)078<2179:SPIROC>2.0.CO;2, 1997.
Konrad, T. G.: Statistical models of summer rainshowers derived from fine-scale radar observations, J. Appl. Meteorol., 17, 171–188, https://doi.org/10.1175/1520-0450(1978)017<0171:SMOSRD>2.0.Co;2, 1978.
Kozu, T., Kawanishi, T., Kuroiwa, H., Oikawa, M., Kumagai, H., Okamoto, K., Okumura, M., Nakatsuka, H., and Nishikawa, K.: Development of precipitation radar onboard the Tropical Rainfall Measuring Mission (TRMM) satellite, IEEE T. Geosci. Remote. Sens., 39, 102–116, https://doi.org/10.1109/36.898669, 2001.
Kummerow, C., Barnes, W., Kozu, T., Shiue, J., and Simpson, J.: The Tropical Rainfall Measuring Mission (TRMM) Sensor Package, J. Atmos. Ocean. Tech., 15, 809–817, https://doi.org/10.1175/1520-0426(1998)015<0809:TTRMMT>2.0.Co;2, 1998.
Kummerow, C., Simpson, J., Thiele, O., Barnes, W., Chang, A. T. C., Stocker, E., Adler, R. F., Hou, A., Kakar, R., Wentz, F., Ashcroft, P., Kozu, T., Hong, Y., Okamoto, K., Iguchi, T., Kuroiwa, H., Im, E., Haddad, Z., Huffman, G., Ferrier, B., Olson, W. S., Zipser, E., Smith, E. A., Wilheit, T. T., North, G., Krishnamurti, T., and Nakamura, K.: The Status of the Tropical Rainfall Measuring Mission (TRMM) after two years in orbit, J. Appl. Meteorol. Climatol., 39, 1965–1982, https://doi.org/10.1175/1520-0450(2001)040<1965:Tsottr>2.0.Co;2, 2000.
Lau, K. M. and Wu, H. T.: Characteristics of precipitation, cloud, and latent heating associated with the Madden-Julian oscillation, J. Climate, 23, 504–518, https://doi.org/10.1175/2009jcli2920.1, 2010.
Li, R. and Fu, Y. F.: Tropical precipitation estimated by GPCP and TRMM PR observations, Adv. Atmos. Sci., 22, 852–864, https://doi.org/10.1007/BF02918685, 2005.
Liu, C. T. and Zipser, E. J.: Regional variation of morphology of organized convection in the tropics and subtropics, J. Geophys. Res.-Atmos., 118, 453–466, https://doi.org/10.1029/2012JD018409, 2013.
Liu, C. T., Zipser, E. J., and Nesbitt, S. W.: Global distribution of tropical deep convection: different perspectives from TRMM infrared and radar data, J. Climate, 20, 489–503, https://doi.org/10.1175/JCLI4023.1, 2007.
Liu, C. T., Zipser, E. J., Cecil, D. J., Nesbitt, S. W., and Sherwood, S.: A cloud and precipitation feature database from nine years of TRMM observations, J. Appl. Meteorol. Climatol., 47, 2712–2728, https://doi.org/10.1175/2008jamc1890.1, 2008.
Liu, G. S. and Curry, J. A.: Determination of characteristic features of cloud liquid water from satellite microwave measurements, J. Geophys. Res., 98, 5069–5092, https://doi.org/10.1029/92JD02888, 1993.
Liu, G. S. and Fu, Y. F.: The characteristics of tropical precipitation profiles as inferred from satellite radar measurements, J. Meteor. Soc. Japan, 79, 131–143, https://doi.org/10.2151/jmsj.79.131, 2001.
Liu, Q. and Fu, Y. F.: Comparison of radiative signals between precipitating and non-precipitating clouds in frontal and typhoon domains over East Asia, Atmos. Res., 96, 436–446, https://doi.org/10.1016/j.atmosres.2010.02.003, 2010.
Nakajima, T. and King, M. D.: Determination of the optical thickness and effective particle radius of clouds from reflected solar radiation measurements. Part I: Theory, J. Atmos. Sci., 47, 1878–1893, https://doi.org/10.1175/1520-0469(1990)047<1878:DOTOTA>2.0.CO;2, 1990.
Nesbitt, S. W., Zipser, E. J., and Cecil, D. J.: A census of precipitation features in the tropics using TRMM: Radar, ice scattering, and lightning observations, J. Climate, 13, 4087–4106, https://doi.org/10.1175/1520-0442(2000)013<4087:ACOPFI>2.0.Co;2, 2000.
Nesbitt, S. W., Cifelli, R., and Rutledge, S. A.: Storm morphology and rainfall characteristics of TRMM precipitation features, Mon. Wea. Rev., 134, 2702–2721, https://doi.org/10.1175/MWR3200.1, 2006.
Ni, X., Liu, C., Zhang, Q., and Cecil, D. J.: Properties of hail storms over China and the United States from the Tropical Rainfall Measuring Mission, J. Geophys. Res.-Atmos., 121, 12031–12044, https://doi.org/10.1002/2016JD025600, 2016.
Oki, T. and Kanae, S.: Global hydrological cycles and world water resources, Science, 313, 1068–1072, https://doi.org/10.1126/science.1128845, 2006.
Petty, G. W.: Physical retrievals of over-ocean rain rate from multichannel microwave imagery. Part I: Theoretical characteristics of normalized polarization and scattering indices, Meteorl. Atmos. Phys., 54, 79–99, https://doi.org/10.1007/BF01030053, 1994a.
Petty, G. W.: Physical retrievals of over-ocean rain rate from multichannel microwave imagery. Part II: Algorithm implementation, Meteorl. Atmos. Phys., 54, 101–121, https://doi.org/10.1007/BF01030054, 1994b.
Rossow, W. B. and Garder, L. C.: Cloud detection using satellite measurements of infrared and visible radiances for ISCCP, J. Climate, 6, 2341–2369, https://doi.org/10.1175/1520-0442(1993)006<2341:CDUSMO>2.0.CO;2, 1993.
Rossow, W. B. and Schiffer, R. A.: Advances in understanding clouds from ISCCP, Bull. Amer. Meteor. Soc., 80, 2261–2288, https://doi.org/10.1175/1520-0477(1999)080<2261:AIUCFI>2.0.CO;2, 1999.
Sauvageot, H., Mesnard, F., and Tenório, R. S.: The relation between the area-average rain rate and the rain cell size distribution parameters, J. Atmos. Sci., 56, 57–70, https://doi.org/10.1175/1520-0469(1999)056<0057:TRBTAA>2.0.Co;2, 1999.
Schumacher, C. and Houze, R. A.: The TRMM precipitation radar's view of shallow, isolated rain, J. Appl. Meteorol., 42, 1519–1524, https://doi.org/10.1175/1520-0450(2003)042<1519:TTPRVO>2.0.CO;2, 2003.
Simpson, J., Kummerow, C., Tao, W.-K., and Adler, R. F.: On the Tropical Rainfall Measuring Mission (TRMM), Meteorol. Atmos. Phys., 60, 19–36, https://doi.org/10.1007/BF01029783, 1996.
Sun, L. and Fu, Y.: A new merged dataset for analyzing clouds, precipitation and atmospheric parameters based on ERA5 reanalysis data and the measurements of the Tropical Rainfall Measuring Mission (TRMM) precipitation radar and visible and infrared scanner, Earth Syst. Sci. Data, 13, 2293–2306, https://doi.org/10.5194/essd-13-2293-2021, 2021.
Viltard, N., Kummerow, C., Olson, W. S., and Hong, Y.: Combined use of the radar and radiometer of TRMM to estimate the influence of drop size distribution on rain retrievals, J. Appl. Meteorol., 39, 2103–2114, https://doi.org/10.1175/1520-0450(2001)040<2103:Cuotra>2.0.Co;2, 2000.
Wang, Y., Fu, Y. F., Liu, G. S., Liu, Q., and Sun, L.: A new water vapor algorithm for TRMM Microwave Imager (TMI) measurements based on a log linear relationship, J. Geophys. Res., 114, D21304, https://doi.org/10.1029/2008JD011057, 2009.
Wu, Z. H. and Fu, Y. F.: A new dataset of rain cell generated from observations of the Tropical Rainfall Measuring Mission (TRMM) precipitation radar and visible and infrared scanner and microwave imager, Zenodo [data set], https://doi.org/10.5281/zenodo.15387988, 2025.
Yokoyama, C., Zipser, E. J., and Liu, C.: TRMM-Observed shallow versus deep convection in the eastern pacific related to large-scale circulations in reanalysis datasets, J. Climate, 27, 5575–5592, https://doi.org/10.1175/JCLI-D-13-00315.1, 2014.
Yuter, S. E. and Houze, R. A.: Three-Dimensional kinematic and microphysical evolution of florida cumulonimbus. Part II: frequency distributions of vertical velocity, reflectivity, and differential reflectivity, Mon. Weather Rev., 123, 1941–1963, https://doi.org/10.1175/1520-0493(1995)123<1941:Tdkame>2.0.Co;2, 1995.
Zhou, Y., Lau, W. K. M., and Liu, C. T.: Rain characteristics and large-scale environments of precipitation objects with extreme rain volumes from TRMM observations, J. Geophys. Res.-Atmos., 118, 9673–9689, https://doi.org/10.1002/jgrd.50776, 2013.
Zipser, E. J. and Lutz, K. R.: The vertical profile of radar reflectivity of convective cells: A strong indicator of storm intensity and lightning probability?, Mon. Weather Rev., 122, 1751–1759, https://doi.org/10.1175/1520-0493(1994)122<1751:Tvporr>2.0.Co;2, 1994.