the Creative Commons Attribution 4.0 License.
the Creative Commons Attribution 4.0 License.
 | 29 Sep 2025
Multidecadal satellite-derived Portuguese Burn Severity Atlas (1984–2022)
Joana Parente
Oscar Gonzalez-Pelayo
Akli Benali
Long-term burn severity assessment can support better pre- and post-fire management plans. In this study, the Portuguese Burn Severity Atlas was created, containing historical fires in Portugal from 1984 to 2022. As prerequisites, fire data were gathered and delimited for all years. Due to the availability of satellite images, for different years, different imageries from Landsat sensors (30 m) were applied. Exploratory analysis showed that burn severity estimates are significantly affected by the time lag between the satellite imagery acquisition and the fire date. We explicitly incorporated the effect of time lag into the degradation of burn severity estimates in the selection of the most suitable pre- and post-fire satellite images for each fire. Using Google Earth Engine, burn severity estimates were calculated for fires that were equal to or larger than 100 ha and that occurred from 1984 to 2022 with known dates (valid fires). Different indices were calculated, such as the differenced normalized burn ratio (dNBR), the relative dNBR (RdNBR), the relativized burn ratio (RBR), and a burn severity index that combines the dNBR with the enhanced vegetation index (dNBR-EVI). Overall, in Portugal, 4.85×10⁶ ha burned over the 38-year period (1984–2022), with the burned area covering 3.29×10⁶ ha being caused by valid fires (68 %). Among these, a total area of 3.18×10⁶ ha had burn severity estimates via the applied indices (97 % of valid and 66 % of all fires). Results show that Portugal has experienced, on average, “high” burn severity throughout this period, with large percentages of dNBR pixels between 0.419 and 0.66 (32 %) and >0.66 (21 %). Estimates from different burn severity indices provided a more complete representation of the burn severity impacts. This atlas can be accessed at https://doi.org/10.5281/zenodo.12773611 (Jahanianfard et al., 2025) and can be used by researchers to have a better understanding of historical fires and their corresponding impacts on vegetation cover, air, soil, and water quality, as well as to identify the most influential environmental and climatic drivers of burn severity.
- Article
(9218 KB) - Full-text XML
- BibTeX
- EndNote


Fires are global widespread natural, dynamic, and periodically disturbing phenomena (Whitman et al., 2020; Fernández-Guisuraga et al., 2023b; Kurbanov et al., 2022; Jain et al., 2020), with more than half of the surface land at risk of being affected (Alonso-González and Fernández-García, 2021). Fires expose terrestrial ecosystems, resulting in various impacts on forest ecology and structure, soil erosion, loss of biodiversity, and endangerment of human life and infrastructures. Over the last 20 years, fires have burned, on average, 0.4 × 10⁹ ha of land annually, with a cumulative total of 7.2 × 10⁹ ha of burned area globally (Kurbanov et al., 2022).
According to statistics provided by the European Commission (2018), approximately 50 000 fires have burned from 1980 to 2018, with an annual average of 0.5 × 10⁶ ha, especially in five Mediterranean European member states: Spain, Portugal, Italy, Greece, and France (Fernández-Guisuraga et al., 2023a). In these countries, the occurrence of extreme fires is getting more frequent and more intense, with larger burned areas, as their fire regime has shifted from “fuel-limited” to “drought-driven” (Pausas and Fernández-Muñoz, 2012). The fire regime shift has heterogeneous extent, seasonality, and frequency (Morresi et al., 2022). Its two main causes are the accumulation of flammable fuels and the consequences of global warming such as prolonged and more frequent droughts and heatwaves (Fernández-Guisuraga et al., 2023a). The accumulation of flammable fuels is caused by land use change, agricultural farming abandonment in rural zones, and the lack or absence of adaptive management (Moreira et al., 2020). Moreover, increasing global warming will likely lead to prolonged fire seasons, which may contribute to an increase in the number, frequency, and area of fires (Moreira et al., 2020; Miller et al., 2023; Holsinger et al., 2021; Fernández-Guisuraga et al., 2021). However, it is still unclear whether this predicted increase will lead to an increase in burn severity (Soverel et al., 2011; Morresi et al., 2022; Fernández-Guisuraga et al., 2023b; Parks et al., 2016).
Burn severity can be defined as the extent to which fire induces ecological and visible changes in soil, vegetation, and fuels (Key and Benson, 2006; Key, 2006; Lentile et al., 2006; Veraverbeke et al., 2010). The estimation of burn severity provides insights into forming better pre- and post-fire management strategies, including fuel treatments and post-fire recovery plans (Chu and Guo, 2014; Miller et al., 2023; García-Llamas et al., 2019). Burn severity estimates are highly time-sensitive since post-fire conditions depend on pre-fire conditions (Miller et al., 2023). A delayed estimation of burn severity will most likely lead to its poor estimation due to environmental responses such as forest recovery, tree and/or seedling recruitment, resprouting, vegetation regrowth, and ash removal by wind or precipitation (Miller et al., 2023; Dos Santos et al., 2020; Keeley et al., 2008; Keeley, 2009; Chu and Guo, 2014; Key, 2006). Hence, burn severity can be assessed during three periods based on different time lags, which are the difference between the dates of fire occurrence and burn severity estimation, categorized as rapid assessment (less than 2 weeks), initial assessment (1 to 8 weeks), and extended assessment (2 to 12 months). Beyond timeline differences, each assessment captures distinct stages of burn severity. For instance, delayed mortality and survivorship of vegetation are generally undetected during rapid assessment. Vegetation may still be senescent, stressed, or dying at this stage, leading to underestimation or overestimation of burn severity. Exclusively, burn severity estimation during rapid assessment is normally performed to assist post-fire responses to large fires. However, during the rapid assessment, the influence of environmental responses to burn severity is minimized. Estimates obtained during the initial assessment are considered to be the first opportunity to have a complete ecological evaluation as, for instance, some signs of delayed mortality and survivorship of vegetation can be detected slightly during initial assessment while vegetation may still be senescent. During the extended assessment, environmental responses are the most influential in relation to burn severity estimates while vegetation survivorship and delayed mortality are more easily detectable and when vegetation has normally returned to its stress-free green state. Overall, burn severity estimates obtained during the extended assessment are normally considered to be suitable as the final reference (Key, 2006).
The most reliable approach to estimate burn severity is via field assessment (Key and Benson, 2006) by measuring the observable fire-induced changes such as the extent of fire-consumed vegetation, stems of vegetation being charred, soil being exposed, and loss of chlorophyll in leaves (Keeley, 2009). These fire-induced changes correspond to structural, thermal, and spectral alterations in soil and vegetation (Miller et al., 2023). One of the most used metrics is the Composite Burn Index (CBI) (Key and Benson, 2006; García-Llamas et al., 2019), which visually ranks the burn severity from 0 (unburned) to 3 (high severity) (Parks et al., 2018; Fernández-Guisuraga et al., 2023a; Addison and Oommen, 2018). The reason for the CBI's popularity is due to its rapid protocol and its overall estimation of fire-induced damage to vegetation and soil, especially when assessing the burn severity of large fires. However, burn severity field assessments have multiple drawbacks as they are intensive; logistically challenging; highly resource-dependent, especially in inaccessible and/or remote burned areas; and have limited capability in capturing the burn severity heterogeneity over large burned areas. Moreover, the impacts of historical fires and the evolution of burn severity cannot be measured via field assessment (Miller et al., 2023).
The emergence of remote sensing (RS), especially via application of satellite imagery, over the past decades has facilitated obtaining free-of-charge remotely sensed burn severity estimates as an alternative option to expensive and time-consuming field severity observations (Miller et al., 2023; Holsinger et al., 2021; Fernández-Guisuraga et al., 2021; Miller and Thode, 2006; Parks et al., 2014; Fernández-García et al., 2018). The capability of capturing spectral information in the visible, near-infrared (NIR), and shortwave infrared (SWIR) parts of the electromagnetic spectrum (Key and Benson, 2006) has enabled the detection of fire-induced structural, thermal, and spectral changes to the land surface (Miller et al., 2023). Satellite sensors have different optical bands, spatial resolutions, temporal revisiting frequencies, and time spans (Lentile et al., 2006). Thus, there are tradeoffs in the application of different satellite RS sensors and in the availability of clear-sky imagery (Miller et al., 2023). Moreover, caution should be taken when using RS products as they may acquire top-of-the-canopy reflectance, with limited capability to estimate the burn severity of the understory strata (García-Llamas et al., 2019; Mihajlovski et al., 2023). Last but not least, RS-derived burn severity estimates “must be linked to ground-truth data” (García-Llamas et al., 2019; Miller et al., 2023; Chu and Guo, 2014).
Multiple studies have found moderate correlations between satellite-derived RS and ground burn severity indices, providing higher confidence in RS-derived burn severity estimates. However, the strength of these correlations varies from one region to another and can be influenced by environmental factors such as fuel, vegetation type, and topography (Fernández-Guisuraga et al., 2021). In this context, mono- (only post-fire image) and bi-temporal (both pre- and post-fire images) indices derived from the normalized burn ratio (NBR), such as the differenced normalized burn ratio (dNBR), the relative differenced normalized burn ratio (RdNBR), the relativized burn ratio (RBR), and a burn severity index that combines the dNBR with the enhanced vegetation index (EVI) (Gao et al., 2000) (dNBR-EVI) (Fernández-García et al., 2018), have been applied. The dNBR (Key and Benson, 2006) is considered to be the “standard” index for burn severity quantification (Alonso-González and Fernández-García, 2021), specifically in the Mediterranean regions (Fernández-García et al., 2022; Miller and Thode, 2006; Picotte et al., 2016; Fernández-Guisuraga et al., 2023a; Chu and Guo, 2014; Keeley et al., 2008; Fernández-García et al., 2018). The RdNBR provides a relative measurement of burn severity based on the pre-fire state of vegetation (Miller and Thode, 2006) and has proven to be more sensitive than the dNBR, especially in areas with low vegetation cover density (Parks et al., 2014). However, the calculation of the RdNBR presents some difficulties due to its formula and its “numerically unstable” range resulting from pre-fire NBRs with very low values (Fernández-Guisuraga et al., 2023a). Another relative measure of burn severity without the calculation difficulties is the RBR (Parks et al., 2014). According to Fernández-Guisuraga et al. (2023a), the RBR showed better correlation with the CBI in Mediterranean ecosystems in comparison to the dNBR. Additionally, according to Fernández-García et al. (2018), their proposed index, known as the dNBR-EVI, exhibits the best correlation with the CBI in Mediterranean regions in comparison to the NBR, dNBR, RdNBR, and RBR. Moreover, the dNBR-EVI has been claimed to show no signal saturation in high-severity areas as saturation is a known issue for NBR-derived indices in regions with high burn severity (Fernández-García et al., 2018; Santis et al., 2010; Fernández-Guisuraga et al., 2023a).
The estimation of the burn severity of historical fires can be performed using satellite-derived RS indices. This feature can enable the evaluation of changes or trends in burn severity patterns over a specific period (Lutz et al., 2011; Picotte et al., 2016). The first project devoted to the creation of a burn severity atlas was the Monitoring Trends in Burn Severity (MTBS), which provided dNBR and RdNBR maps for large fires from 1984 to the present in the USA using Landsat imagery (Eidenshink et al., 2007; Picotte et al., 2020). There have been records of burn severity atlases created for parts of some countries such as Canada (Picotte et al., 2016; Whitman et al., 2020; Guindon et al., 2021). Moreover, the MOSEV dataset provides 20 years of burn severity maps using Moderate Resolution Imaging Spectroradiometer (MODIS) imagery and products (Alonso-González and Fernández-García, 2021). Although this dataset provides daily global coverage, it has considerable limitations such as the spatial resolution (500 m); the limited capability of mapping burn severity heterogeneity, especially at the regional scale (Alonso-González and Fernández-García, 2021); the absence of burn severity estimates for fires before the year 2000; and low burned-area mapping accuracy (Moreno-Ruiz et al., 2020).
To the best of our knowledge, detailed long-term estimates of burn severity are missing for European countries, such as Portugal, the most “fire-prone” country in the European Mediterranean basin (Oliveira et al., 2011). Portugal is characterized by a Mediterranean-type climate (Ermitão et al., 2023; Parente et al., 2023) and a drought-driven fire regime (Pausas and Fernández-Muñoz, 2012) and is dominated by shrubs and pines, eucalypts, and evergreen oaks forests (Fernandes et al., 2016). During the last few decades, Portugal has been significantly affected by fires, such as catastrophic fires in 2003, 2005, and 2017 (Nitzsche et al., 2023; Beighley and Hyde, 2018). Thus, the main objective of this study is to create a high-resolution multidecadal burn severity atlas for mainland Portugal, entitled the Portuguese Burn Severity Atlas, aimed at providing estimates of immediate fire impacts.
The study area consists of mainland Portugal (37° N to 42° N latitude and 6° W to 10° W longitude) (Parente et al., 2016), covering around 90 000 km2 of southern Europe (Rego and Bacao, 2010), generally with a Mediterranean climate consisting of warm, dry summers and cold, wet winters (Nunes et al., 2016), with elevation ranging from sea level to approximately 2000 m (Mora and Vieira, 2020), and with the domination of different vegetation types within its extent (e.g., farmland and evergreen oak (Quercus suber, Q. rotundifolia) woodlands in the south, forests of pine (Pinus pinaster) and eucalypt (Eucalyptus globulus) in the north, and shrublands and deciduous oak forests in the center) (Tonini et al., 2017).
To estimate the burn severity of historical fires in Portugal (1984–2022), it is necessary to primarily gather fire data containing the start and end dates (Sdate and Edate), the burned perimeters, and the extents (Sect. 2.1). Then, we selected an RS sensor or a family of sensors to have coherency over the study period (Sect. 2.2). The next steps were to select burn severity indices well correlated with ground observations, specifically in the Mediterranean regions (Fernández-Guisuraga et al., 2023a) (Sect. 2.3); to assign a sampling period to select RS imagery (Sect. 2.4); to quantify the influence of time lag on burn severity estimates and accordingly apply the necessary adaptation to the sampling period (Sect. 2.5); and, finally, to calculate the burn severity estimate for each of the fires with the most suitable pair of images (Sect. 2.6).
2.1 Fire data
We focused the work on fires equal to or larger than 100 ha, which were responsible for 75 % of the total burned area in Portugal (Divisão de Defesa da Floresta Contra Incêndios (DGRF), 2006; Fernandes, 2009). Only fires with known start (Sdate) and/or end dates (Edate) were kept and considered to be valid.
The fire perimeters were supplied by the Instituto da Conservação da Natureza e das Florestas (ICNF) (2021). The fire perimeters were derived through semi-automatic supervised classification of satellite imagery, with subsequent manual editing for refinement (Oliveira et al., 2011). Any discrepancies were identified and rectified by comparing the mapped fire perimeters with field statistics at the national level. The Sdates and Edates for most of the fires were also obtained from the ICNF. However, after conducting an exploratory analysis, errors were detected in the provided fire dates.
For the period from 1984 to 2000, uncertainties regarding the fire dates (Sdate and Edate) are greater than for the subsequent years up to the present. Hence, the Monthly Fire Atlas (Neves et al., 2023) was used to provide dates for fires of this duration, using the day-of-year (DOY) dataset, corresponding to a band representing the day of year closest to the Edate of each individual fire. However, there were still cases in which multiple fires were marked as one, resulting in inaccuracies regarding the dates. Hence, additional functions to analyze satellite imagery and manual corrections were implemented to discard any fires or proportions of their perimeters which did not have visible fire scars in false-color composite (R: SWIR, B: NIR, and G: RED) images acquired on the date mentioned in the DOY band or where the fire scar also appeared in the image acquired prior to this date.
For fires from 2001 to 2022, Sdates and Edates were redetermined by combining data from MODIS and the Visible Infrared Imaging Radiometer Suite (VIIRS) thermal anomalies following the method developed by Benali et al. (2016). The data were cross-referenced with data reported by the ICNF. Moreover, visual analysis of images from various sensors, particularly for fires occurring after 2017, were also incorporated to confirm and/or update the fire dates.
Between 1984 and 2022, a total number of 37 581 perimeters representing historical fires, with a total burned area of 4.85 × 10⁶ ha, were recorded in mainland Portugal – 2.00 × 10⁶ ha between 1984 to 2000 and 2.85 × 10⁶ ha between 2001 to 2022. Within this atlas, 5099 perimeters (14 %) are considered to be valid fires, accounting for a total burned area of 3.29 × 10⁶ ha (68 %) – 0.95 × 10⁶ ha between 1984 to 2000 and 2.34 × 10⁶ ha between 2001 to 2022 – for all vegetation types, distributed within the extent of mainland Portugal. For an overview of the frequency of valid fires within the mainland of Portugal, Fig. A1 is provided in Appendix A. The frequencies of fires in the northern and central regions are higher in comparison to those in other regions based on the level-2 Nomenclature of Territorial Units for Statistics (presented as NUTS2) frontier classification (Registo Nacional de Dados Geográficos – Direção-Geral do Território (DGT), 2024; Meneses et al., 2018).
2.2 RS imagery: access and processing
The Portuguese Burn Severity Atlas spans across several years (1984–2022), overlapping with the acquisition period of several sensors. Atmospherically corrected surface reflectance images from the Landsat series of sensors were used as the reference to calculate burn severity indices. This choice was based on Landsat's long-available data archive, especially Landsat-5, going back as far as 1984; the high spatial resolution (30 m); the consistency between sensors, with a revisiting frequency of 16 d; and the provision of required bands for burn severity indices (NIR, SWIR, red, and blue bands – Sect. 2.3).
For fires from 1984 to 2001 and from 2003 to 2011, imageries from the Landsat-5 Thematic Mapper (TM) were applied. For 2002, images from both the Landsat-5 TM and the Landsat-7 Enhanced Thematic Mapper Plus (ETM+) were available; however, it was observed that there were more available clear-sky images from Landsat-7 in comparison to Landsat-5 imagery. Thus, for 2002, imagery from Landsat-7 was used to estimate burn severity. For 2012, there is no Landsat imagery available, except from Landsat-7. This sensor suffered a technical failure in its scan line corrector (SLC) in May 2003, resulting in multiple gaps within its imageries since this time (Key and Benson, 2006). These gaps reduce the quality and availability of satellite imagery (providing 46 % of the area of valid fires for 2012 with burn severity estimates). Hence, for only 2012, in addition to burn severity estimates obtained from Landsat-7, estimates from the atmospherically corrected surface reflectance imagery of MODIS aboard Terra, with a spatial resolution of 500 m, were provided. This addition aims to give users the option to choose between the spatial resolution superiority of estimates with Landsat-7 or more areas with burn severity estimates via MODIS. In this regard, additional exploratory analysis was conducted to evaluate the comparability of the Landsat-7- versus the MODIS-derived dNBR following the approach by Alonso-González and Fernández-García (2021). Our analysis showed no correlation, with details provided in Fig. A2 in Appendix A. Hence, for the statistics provided in this study, such as the sum of the area with burn severity estimates, Landsat-7-derived estimates of 2012 were utilized. For the years 2013 to 2022, imageries from the Landsat-8 Operational Land Imager (OLI) were applied. In Table 1, the applied sensors for each year are summarized.
In the past, conduction of bi-temporal burn severity estimates, such as the dNBR, by manually gathering pre- and post-fire images was difficult and time-consuming. However, with the emergence of cloud-based processors such as Google Earth Engine (GEE), through “an internet-based application programming interface (API) written in JavaScript” (Perez and Vitale, 2023), this process is now feasible and free and can be semi-automated (Yilmaz et al., 2023; Whitman et al., 2020) when fire data are available (Parks et al., 2018). In this study, all the processes of image acquisition, calculation of the burn severity indices, and generation of burn severity maps were performed within the GEE platform. One of the biggest limitations of GEE is its optimization when performing heavy processing (Carille et al., 2024). To overcome this limitation, separate functions were defined in our code to process images and to generate burn severity estimates. The GEE datasets of different Landsat sensors are also summarized in Table 1.
Table 1Summary of sensors used for each year and their characteristics (availability date, corresponding bands, GEE dataset).
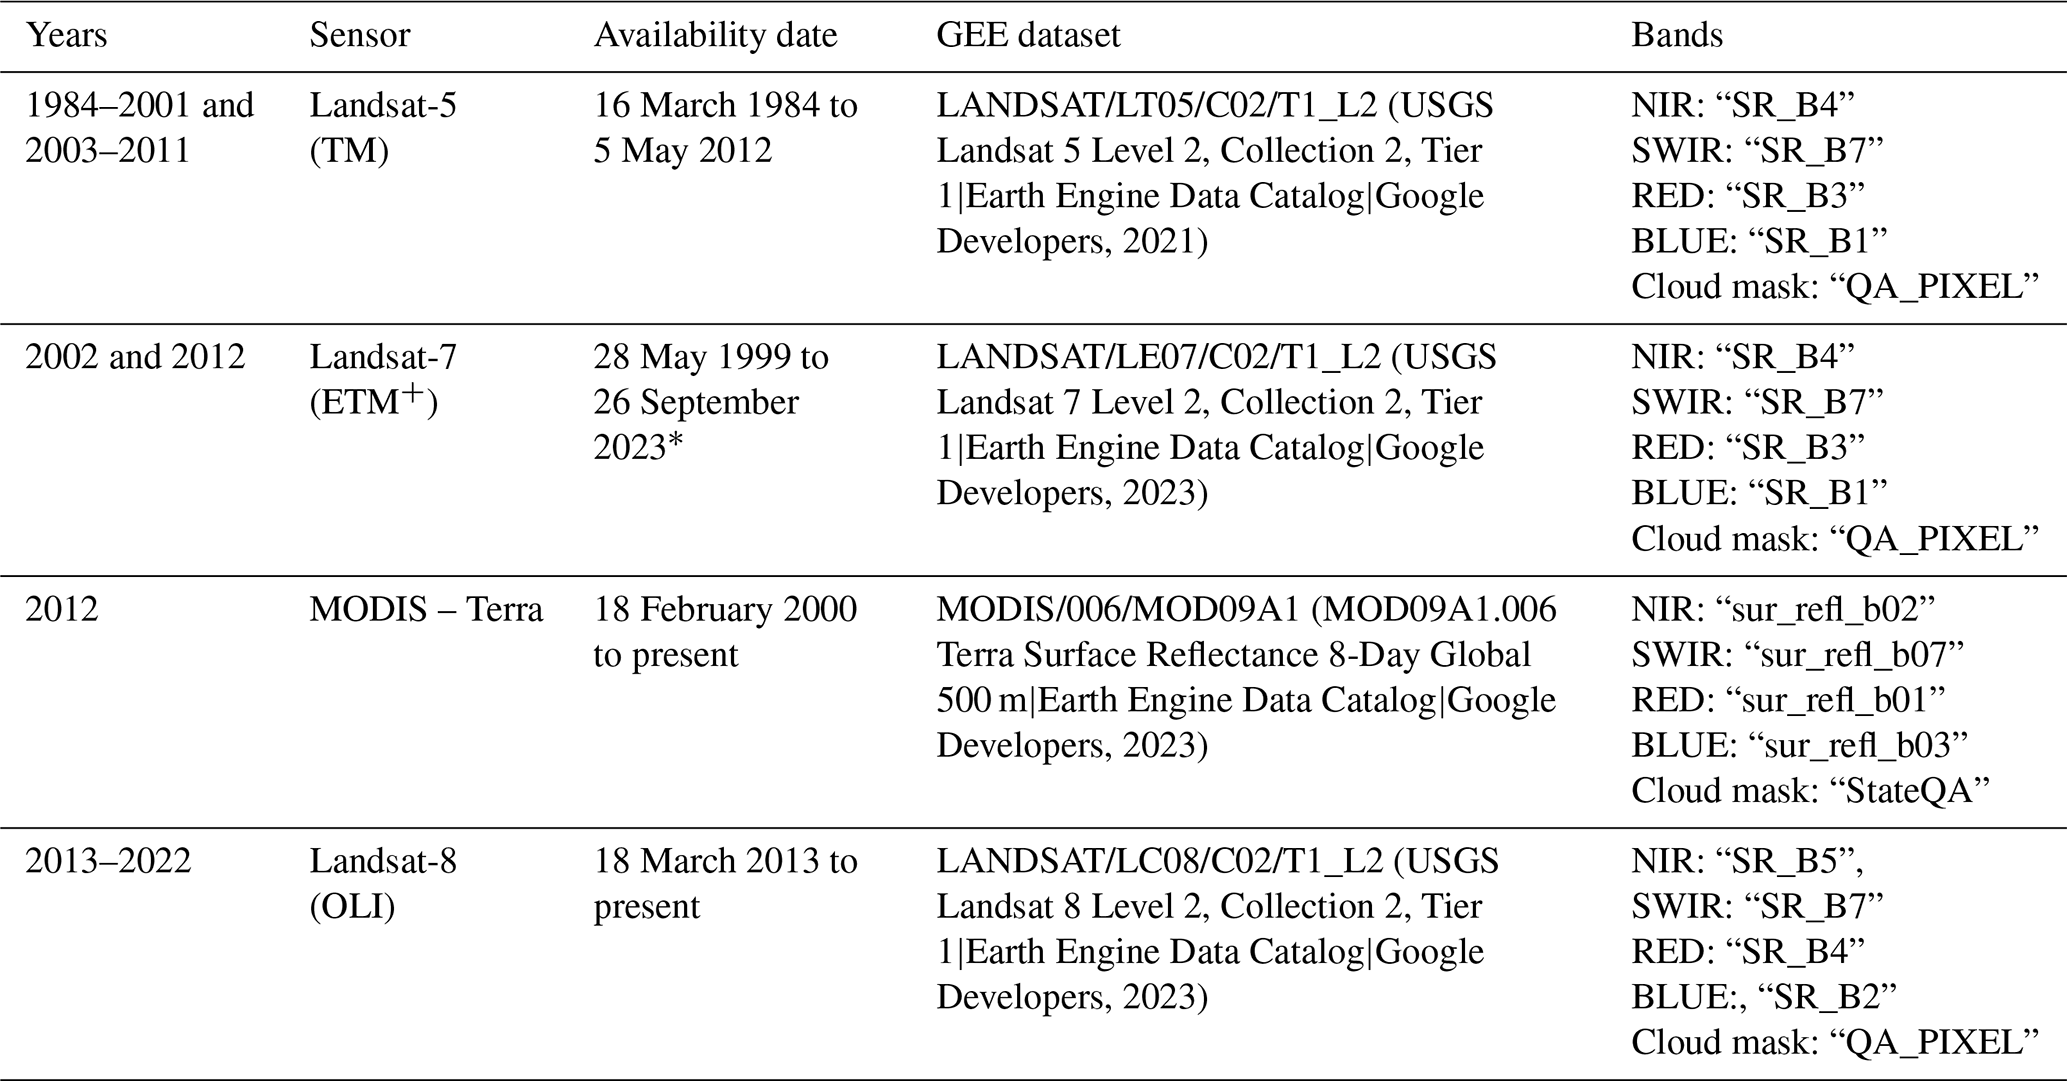
* With gaps within its imagery since May 2003.
2.3 RS burn severity indices
The Portuguese Burn Severity Atlas is created using bi-temporal NBR-derived burn severity indices as the dNBR, RdNBR, RBR, and dNBR-EVI. The NBR is calculated via the normalized difference of NIR and SWIR optical bands based on the principle that healthy vegetation has high NIR reflection, while burned and/or dead vegetation has high SWIR reflection (Key and Benson, 2006; Whitman et al., 2020). The burn severity indices, along with their formulas, are summarized in Table 2.
The atlas includes the corresponding offset values, i.e., the mean value for each of these indices outside the burned area, that are representative of the unburned environment surrounding the burned areas. They are incorporated to isolate fire-induced changes from the unburned environment (Key, 2006; Miller and Thode, 2006; Parks et al., 2014, 2018), to minimize the impacts of differences in pre- and post-fire imagery due to phenology or precipitation conditions (Parks et al., 2018), and to improve the comparison of burn severity estimates across fires (Parks et al., 2014). The offset was estimated by calculating the mean values of pixels located within 180 m outside the burned area for all of the years following the formula of each corresponding burn severity index (Parks et al., 2018). For 2012 fires with estimates obtained from MODIS, a buffer of 500 m was used (see Sect. 2.2).
Table 2Summary of burn severity indices and their corresponding formulas. NIR, SWIR, RED, and BLUE refer to the satellite bands of the NIR, SWIR, red, and blue bands, respectively.
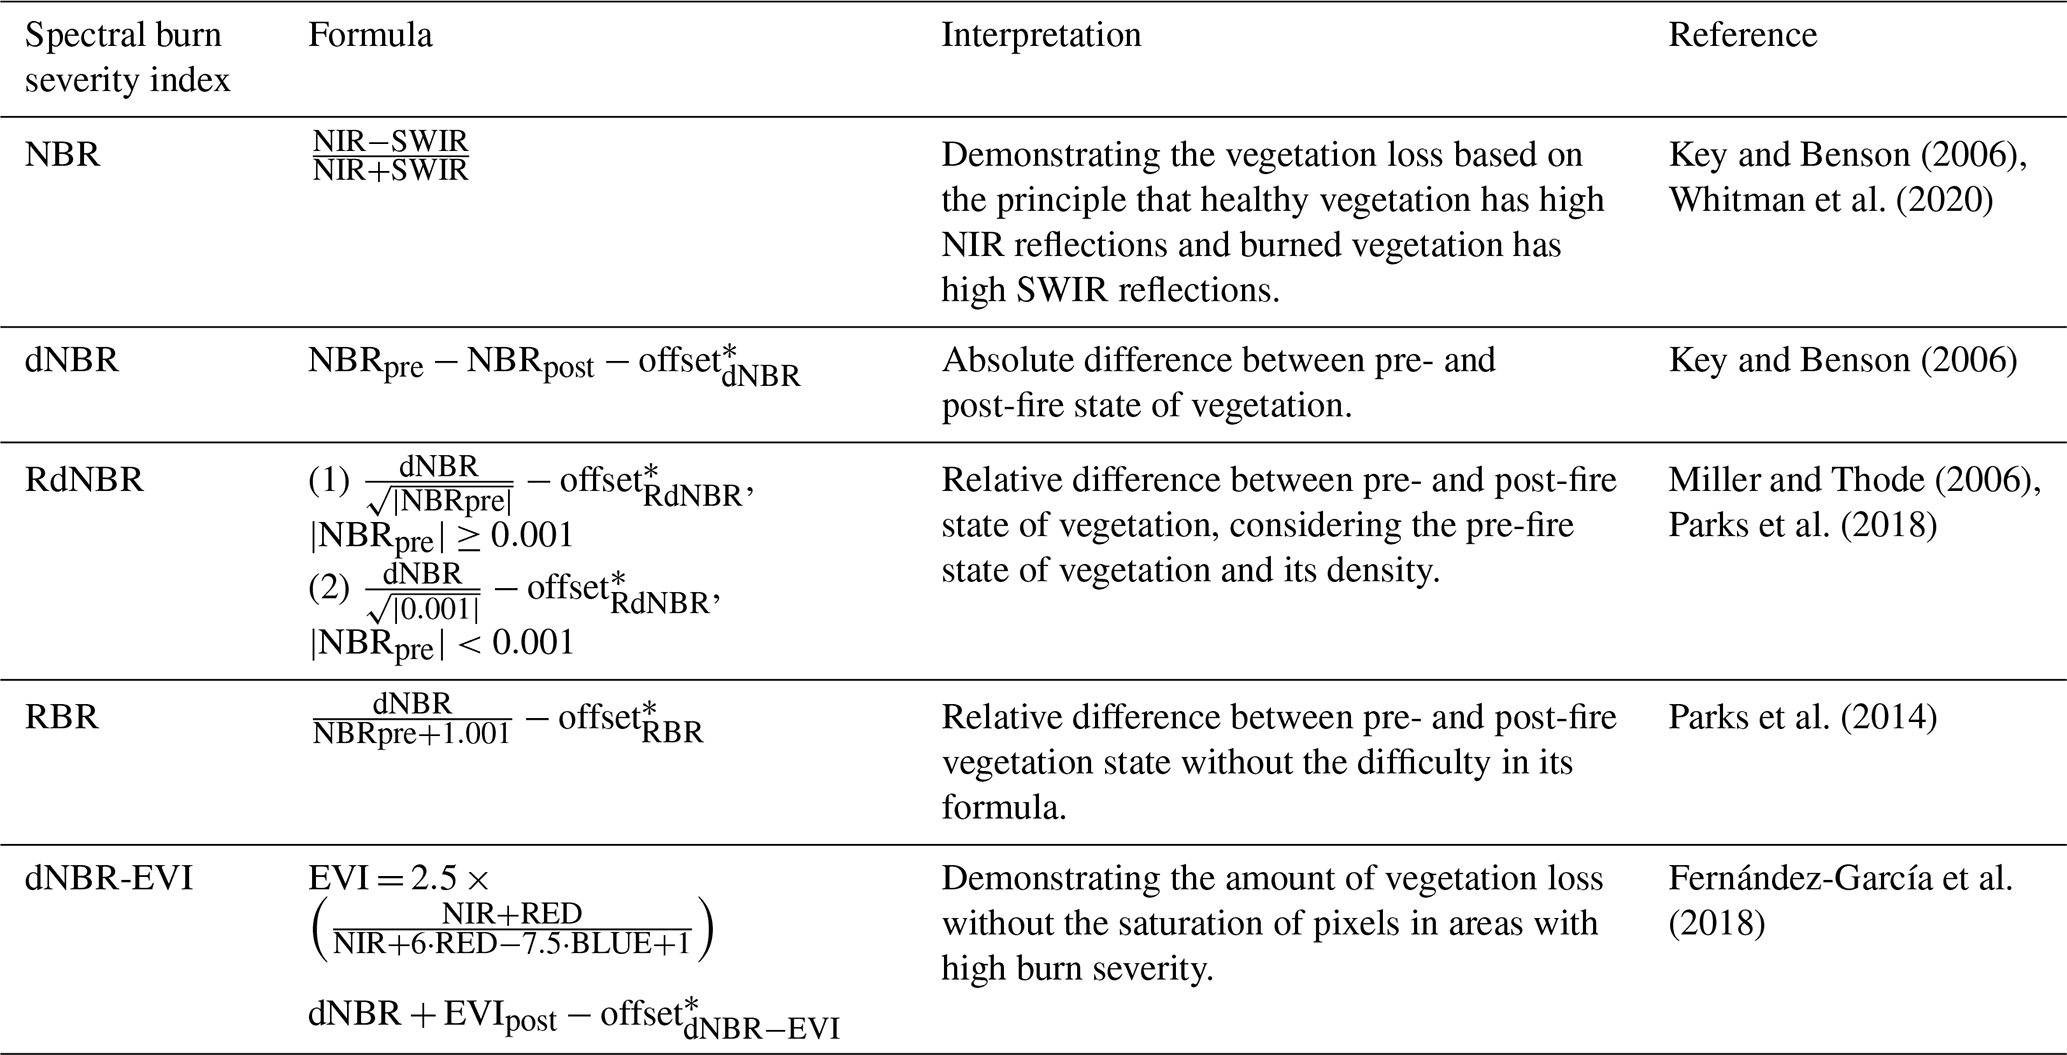
* The offset refers to the corresponding mean value of the burn severity index within the buffer (180 m except, for year 2012, during which it is 500 m) outside the burned area.
2.4 RS imagery sampling period
Considering the fact that the Landsat series have a revisit frequency of 16 d, few clear images are available annually in cloudy regions, especially with older satellites like Landsat-5 (Gao et al., 2006). Thus, a longer sampling period is often needed; however, there is no guaranteed window. The probability of clear images during rapid assessment (< 2 weeks) is low. In the initial assessment (1 to 8 weeks), clear Landsat images may be obtained, but the probability is not high, and assessing delayed consequences like tree mortality or tree survivorship is challenging (Key, 2006). In the extended assessment period (2 to 12 months), the probability of acquiring clear images is higher; however, as mentioned above, RS-derived burn severity indices are strongly affected by time lag (Morresi et al., 2022).
To address these issues, along with the objective of estimating the immediate fire impacts, we set our test sampling periods as follows: 1 d to 120 d before each fire's Sdate and 3 d to 120 d after each fire's Edate as the pre- and post-fire sampling periods, respectively. The 1 d before Sdate and 3 d after Edate were defined to avoid images with active fires or smoke contamination. To minimize seasonal differences, we capped the sampling period at 120 d, though some variation in seasons may still have occurred.
2.5 Quantification of time lag influence
To produce the most accurate and representative burn severity estimates from satellite imagery for each fire, the most suitable pre- and post-fire images are required, meaning images with the lowest time lag or with the lowest difference between fire events and their acquisition dates. Hence, it is crucial to understand and quantify the impact of the time lag on burn severity estimates.
Valid fires from 2013 to 2018 were chosen to be analyzed, and the Landsat-8 (OLI) imagery was used. Primarily, for each fire, two image collections (ICs) were created in GEE. IC is a GEE data type that stores a set of images taken within the bounds of any area of interest within the assigned sampling period (Carille et al., 2024). In this case, IC corresponds to images overlapping with the burned area during our sampling period (each temporal buffered fire date of ±120 d), resulting in one IC for pre-fire images and one IC for post-fire images (preIC and postIC, respectively). Each IC was filtered to only have images with actual coverage over at least 90 % of the burned area, with at least 90 % of the covering pixels being cloud- or cirrus-free not only over the burned area but also within a 2 km buffer around it. This filter was used to account for contaminated pixels within the border and to exclude the impacts of shadow contamination of cloud and/or cirrus within the burned-area surroundings. The NBR values of all of the available processed pre- and post-fire images were calculated, hereafter referred to as pre-NBR and post-NBR, respectively.
For each fire, the dNBRs from all of the possible combinations of pre- and post-NBRs were calculated in MATLAB R2021b. A subset of fires was created with at least one dNBR estimation with both pre- and post-NBRs, with time lags equal to or less than 7 d and with the lowest cloud contamination, referred to as the reference dNBR. We assigned this threshold under the assumption that significant dNBR degradation was unlikely to occur within 7 d. To quantify the variation in the dNBR caused by time lag, the difference between the reference dNBR and the lagged dNBRs, calculated by lagged pre- or/and post-NBRs, was estimated at the pixel scale, with corresponding results shown in Sect. 3.2 and Fig. 4. The time lags of both pre- and post-NBRs used for reference dNBR calculation were considered to be the basis of dates instead of the fires' Sdates and Edates.
Using simple linear regression analyses, we modeled the median of pixel-by-pixel dNBR difference (dependent variable) as function of pre- or post-fire time lags (independent variables). After 110 d, the dNBR degradation was too high (higher than 0.1), leading to inaccurate burn severity estimates (different discrete dNBR classification according to European Forest Fire Information Service (hereafter EFFIS) (European Commission, 2018; Llorens et al., 2021). Thus, we reduced our sampling period to ±110 d. From the found correlation and adaptation of our sampling period, a function represented in Eq. (1) was developed to calculate the “suitability” property, which penalizes potential RS images based on their time lag – assigning values from 100 (for an image with a 0 d lag) to 0 (for an image with a 111 d lag).
2.6 Burn severity calculation
RS burn severity indices were generated using pre- and post-NBRs derived from images with the highest suitability. Thereafter, it was observed that a significant number of fires had a large proportion of their areas with missing values. To address this issue, an iteration process was introduced. Within this process, following the computation of the burn severity indices with the pair of images with highest suitability, a comparison was made between the area with dNBR estimates and the original burned area. For fires with a missing data extent larger than 70 ha, the burn severity indices were recalculated with the pairs of images with the lower suitability, filling the missing data areas. We performed multiple trials, and the lowest possible value obtained was 70 ha without GEE code freezing during an acceptable amount of computation time. To optimize GEE performance, a maximum of four iterations was set; thus, areas without burn severity estimates after the fourth iteration were disregarded (Fig. 1). Details of the scenarios used for the iteration process are shown in Fig. A3, along with examples of each of these scenarios, presented in Figs. A4 to A7 in the Appendix. Additionally, a confidence map was generated for each fire, defined as the average suitability of the pair of images used to estimate the burn severity metric in a given pixel. The annual burn severity maps are provided on an absolute scale, along with their associated confidence maps.
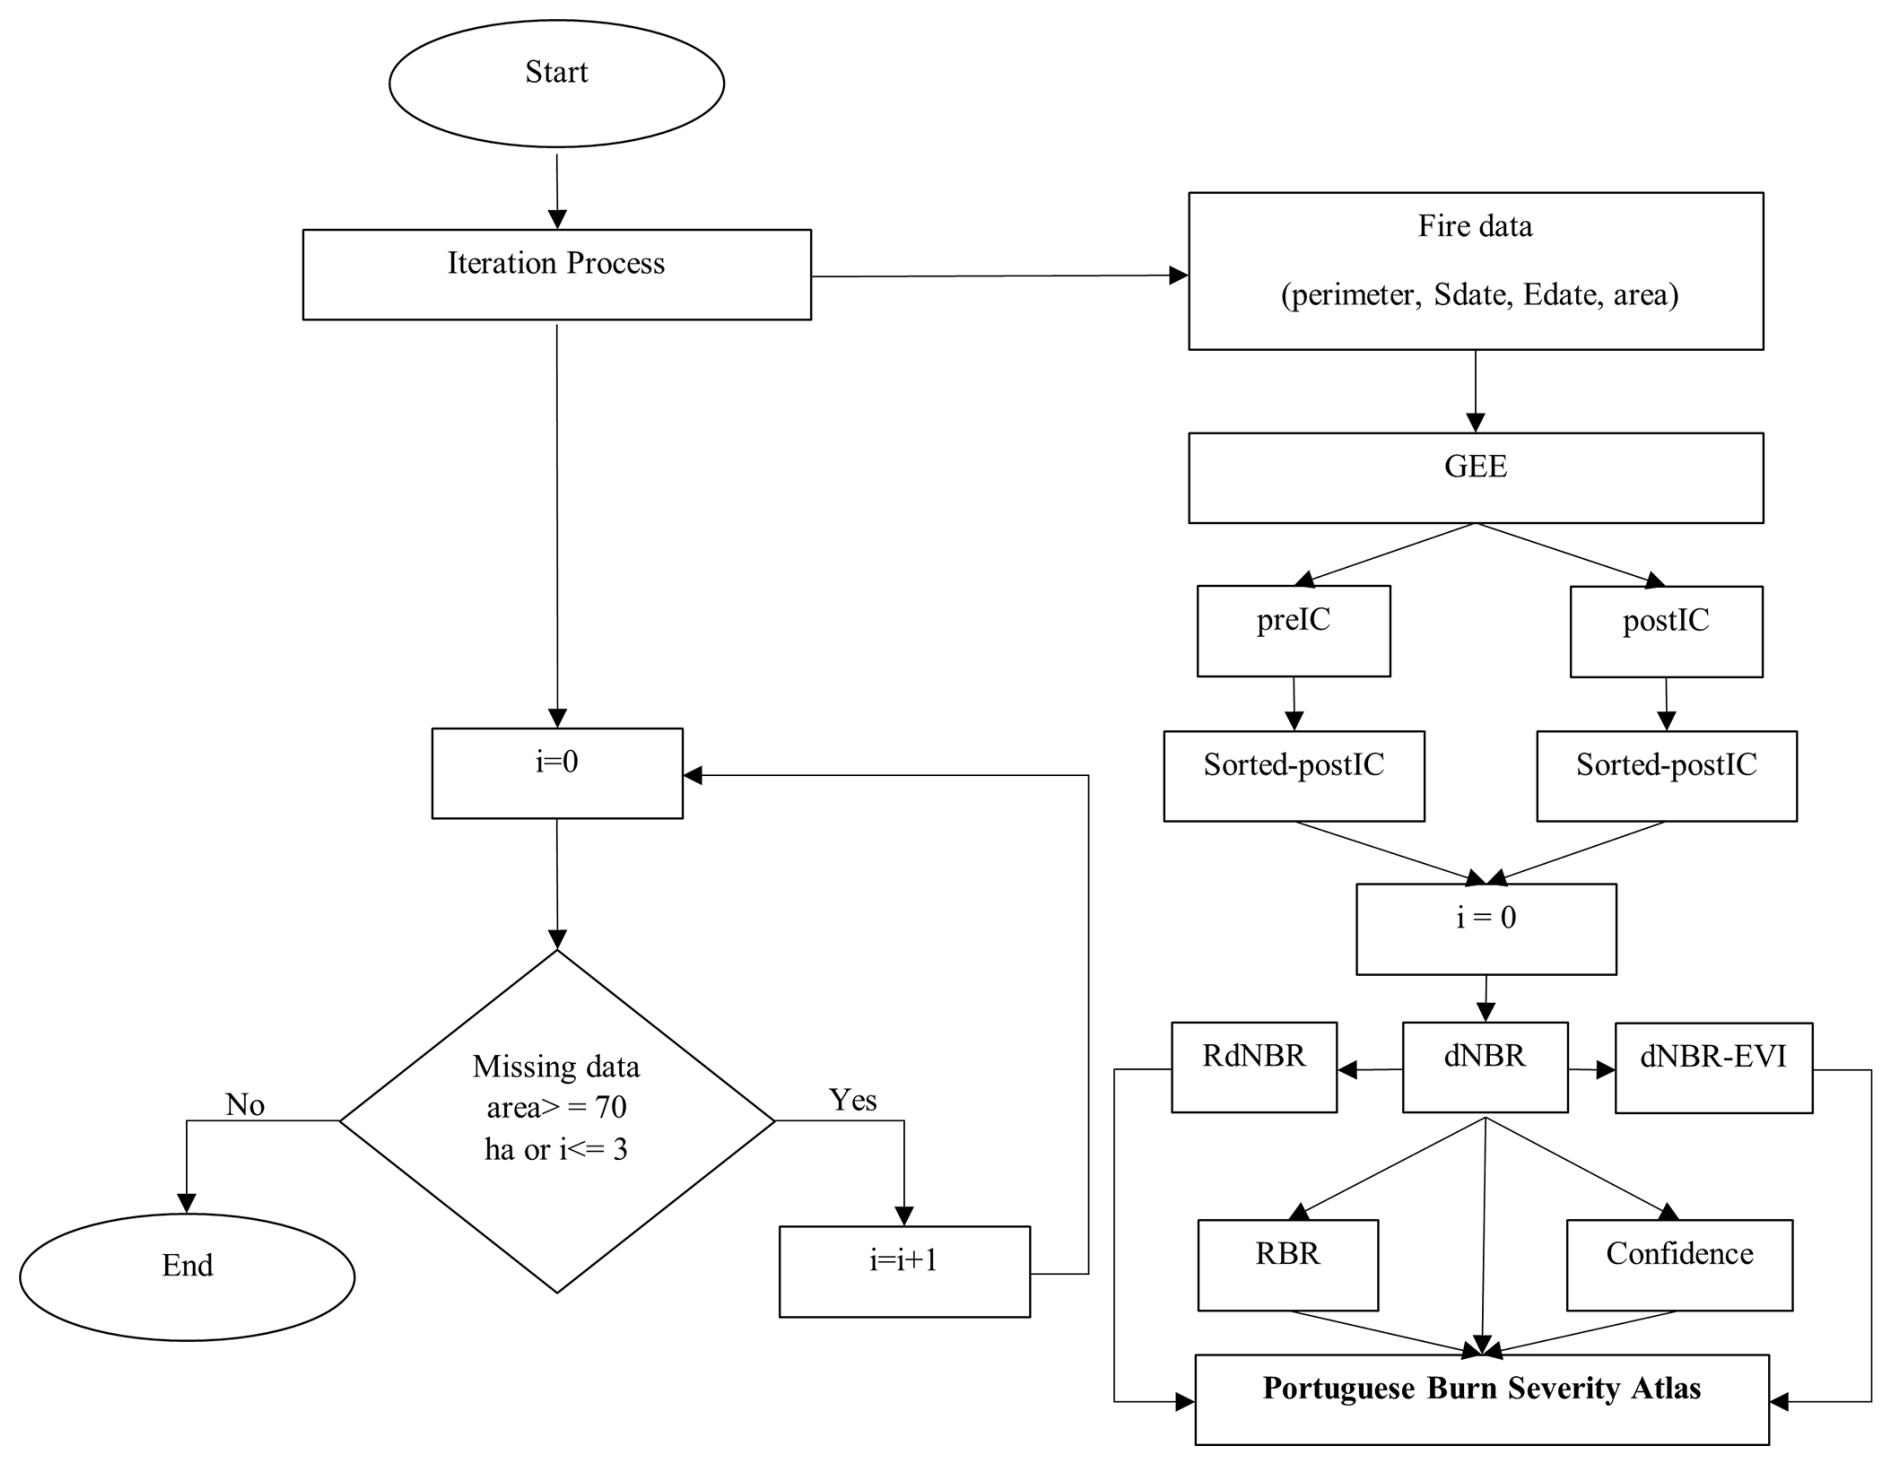
Figure 1Flowchart demonstrating the iteration process used for the calculation of burn severity indices and to have estimates for the largest proportion of the fire area as possible. PreIC and postIC are our abbreviated versions of pre-fire image collection and post-fire image collection, respectively. Sorted pre- and postICs were sorted based on the suitability of images from highest to lowest.
3.1 Overview
The coverage of the Portuguese Burn Severity Atlas corresponds to 3.18 × 10⁶ ha, accounting for 66 % and 97 % of all and valid fires, respectively. From 1984 to 2000, 0.94 × 10⁶ ha of burned area had burn severity estimates (19 % of all and 29 % of valid), while, for the fires of 2001 to 2022, 2.24 × 10⁶ ha of burned area had burn severity estimates (46 % of all and 68 % of valid). The use of several iterations improved the coverage of the atlas by 12 %, adding 0.38 × 10⁶ ha of estimated burn severity extent to the 2.8 × 10⁶ ha obtained by using only one iteration (the details are summarized in Table B1, presented in Appendix B).
Figure 2a represents the spatial distribution of the annual burn severity estimates of the valid fires between 1984 to 2022, using the dNBR as the standard burn severity index. For pixels that burned several times, the average dNBR value is presented. To facilitate the interpretation of the burn severity estimates, color classifications were applied to dNBR pixel values according to the thresholds assigned by the EFFIS (European Commission, 2018; Llorens et al., 2021). Different burn severity classes can be observed, highlighting its heterogeneity throughout Portugal. High dNBR values (≧ 0.42) are concentrated in the southern and southwestern parts of the Centro region, northeastern Vale do Tejo, and the Algarve region. Very low dNBR values (between −0.1 to 0.1) are mainly distributed in northeastern Centro and scattered around the Norte regions, with isolated observations in Alentejo and Vale do Tejo. The histogram of the dNBR pixel counts of all of the years (without pixel averaging), along with the corresponding cumulative distribution function (CDF) – secondary y-axis – and mean dNBR value, is presented in Fig. 2b. In the Portuguese Burn Severity Atlas, the “unburned or regrowth of vegetation” class, with dNBR ≦ 0.1, represents 9 % of the total dNBR pixel values. Most of the area had burn severity estimates with dNBR values ranging from 0.2 to 0.7, with the highest number being associated with high burn severity (32 %). The mean dNBR pixel value is 0.45, with a corresponding CDF of 0.64 that can be interpreted as high burn severity, and 21 % had very high burn severity, with a CDF of 0.88 at a dNBR pixel value equal to 0.7. Thus, results show that Portugal has had, on average, high burn severity throughout this 38-year study period.
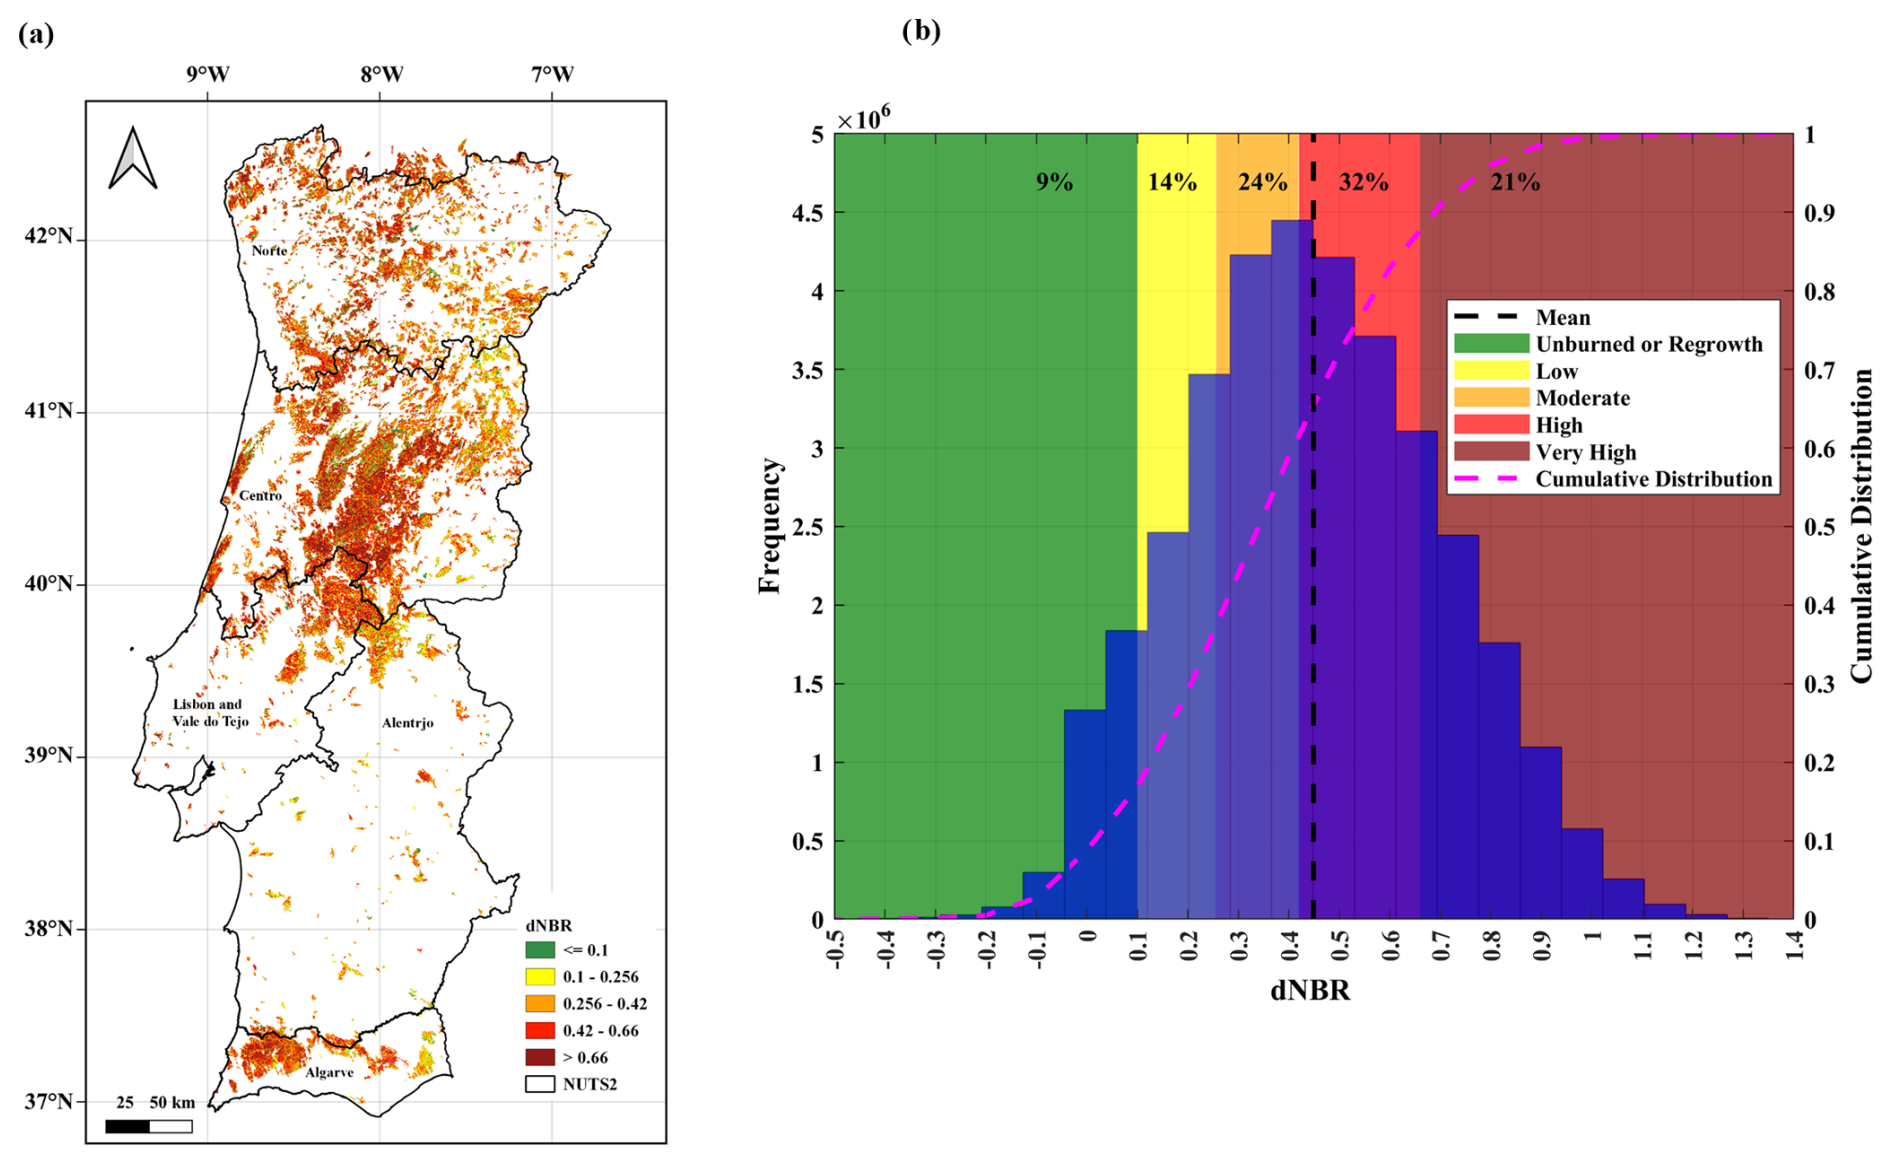
Figure 2(a) The spatial distribution of the overlaid dNBR pixel value of all of the years (1984 to 2022) is presented, with the average pixel value being presented for areas which burned more than once. The Nomenclature of Territorial Units for Statistics (presented as NUTS2) frontier dataset (Registo Nacional de Dados Geográficos – Direção-Geral do Território (DGT), 2024; Meneses et al., 2018) was applied to demonstrate the extent of mainland Portugal and its five regions. (b) The histogram shows the distribution and frequency of all annual dNBR pixel counts, with no averaging. On the secondary y axis, the cumulative distribution of the dNBR pixel value is presented. The dNBR classification according to the EFFIS (European Commission, 2018; Llorens et al., 2021), combined with the percentage of pixel counts within these classes, is also shown (b).
For a temporal overview, in Fig. 3, the annual burned extent is shown with red bars. Although there is no apparent trend, the largest burned extents were registered in 2003, 2005, and 2017, representing the largest fire seasons, with a large difference in comparison to the 1980s and 1990s. The highest percentage of valid burned area occurred in 2017, for which 99.8 % had burn severity estimates. For most of the years, this atlas provides burn severity estimates for more than 90 % of the area, with the exception of 2012, 2007, 2006, and 2011, with values varying between 45.7 % and 80.6 %. The variation of area with burn severity estimates (pink line) highlights the lack of burn severity estimates for annual valid fires. For recent years – 2013 onwards – this variation is almost constant (on average, ≈ 98.8 %).
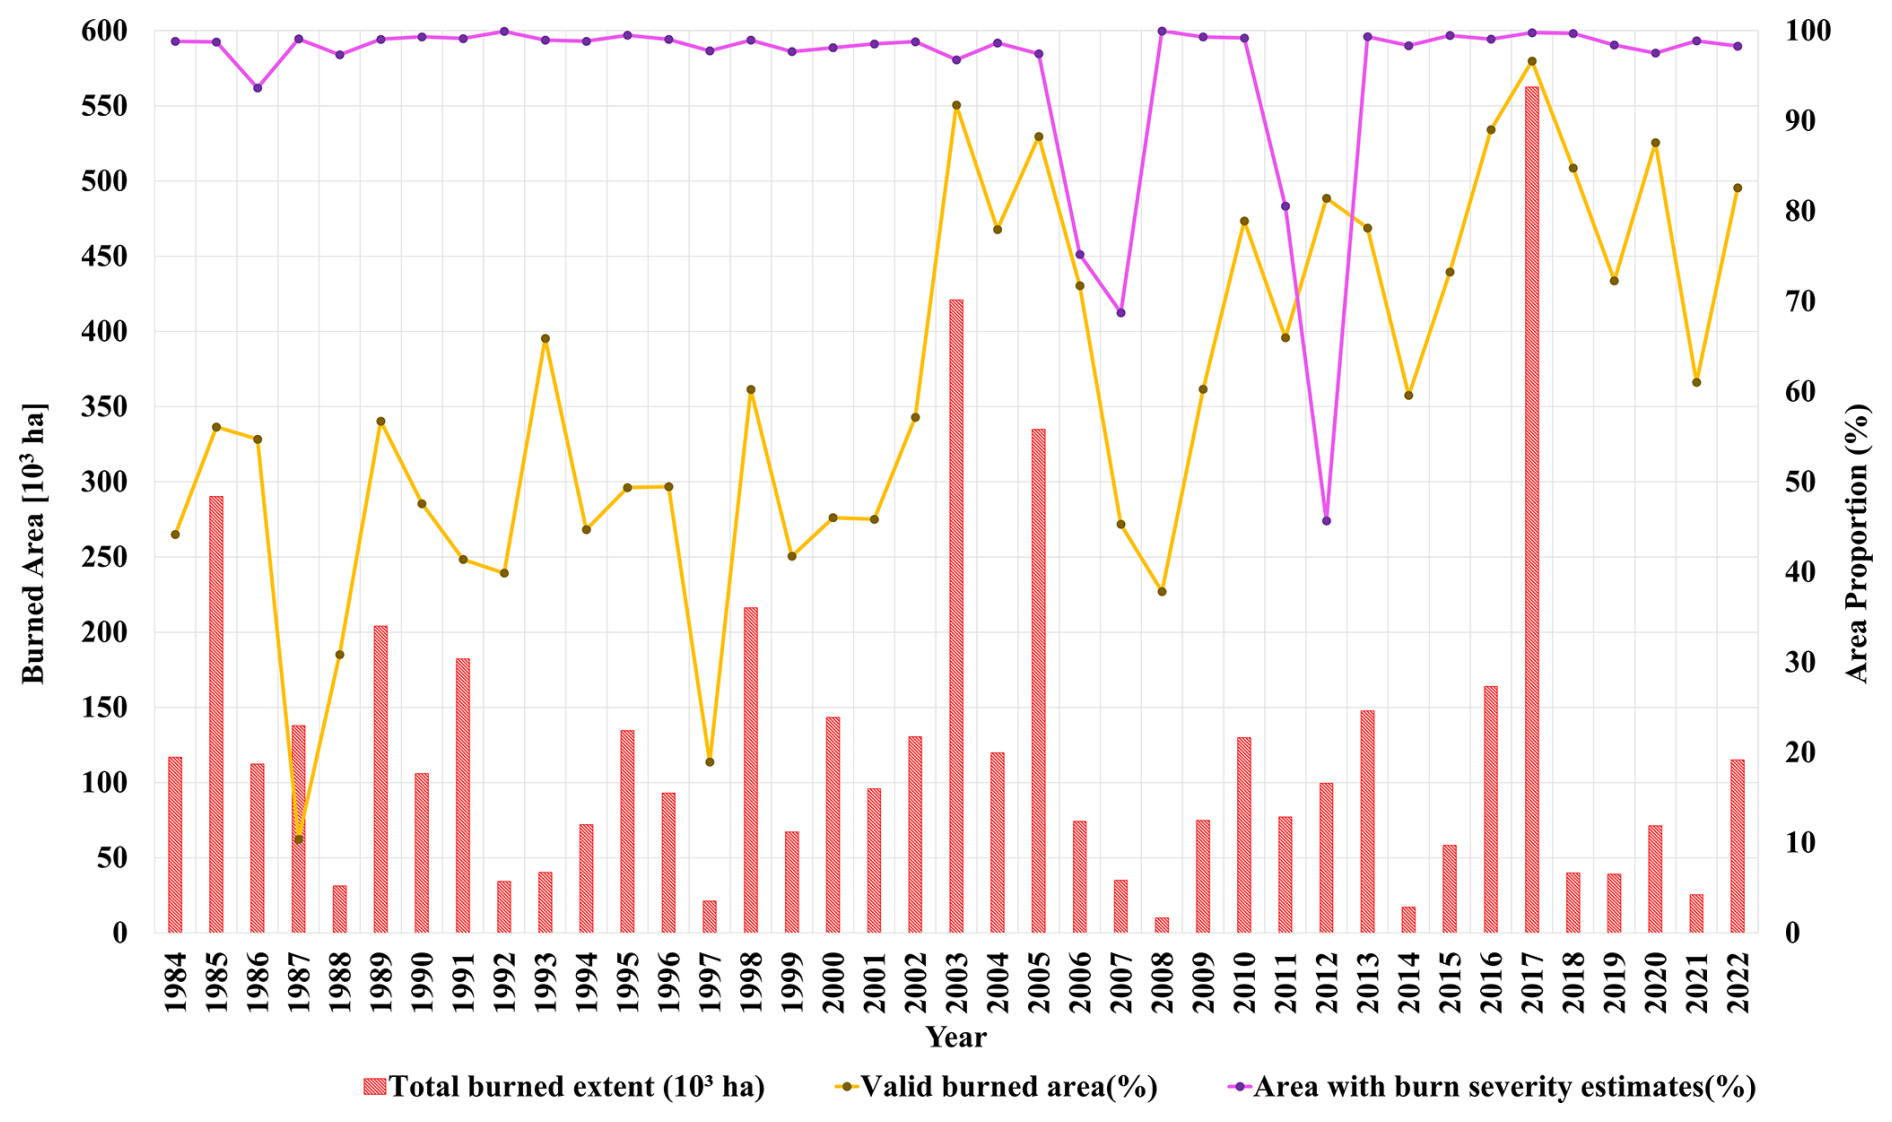
Figure 3Timeline of total burned extents of fires from 1984 to 2022. On the left y axis is the annual burned area in units of 103 ha, and on the secondary y axis, the percentages of valid burned area and areas with burn severity estimates are shown.
3.2 Influence of time lag on dNBR estimates
Figure 4 shows the pixel-by-pixel variability of the difference between lagged dNBRs and reference dNBRs. With the increase in both pre- and post-fire time lags, their variability increases, and, hence, the degradation of the dNBR estimates increases. The magnitudes of the impacts of pre- and post-fire lags are different as, with the increase in post-fire time lag, the variability in dNBR difference is larger than with the increase in pre-fire time lag. On average, the increase in pre-fire time lags leads to positive differences, which means that the dNBR tends to be overestimated, and with increasing post-fire time lags, the dNBR tends to be underestimated.
The linear regressions using time lag and the dNBR difference had and , with a similar slope of 0.0009 and a p value < 0.01. A slope of 0.0009 means that, on average, the dNBR is degraded by 0.0009 for each added lag day. As the slopes were similar for both pre- and post-fire instances, a single suitability function was adopted. Both regressions had very small (near-zero) offset values (−0.012 and 0.001, respectively), and, hence, they were not used in the suitability function.
The fire-by-fire confidence variability of burn severity estimates through each iteration is shown in Fig. 5. No trend regarding the variation in confidence throughout the atlas years is observed. On average, high confidence values (>80 %) for the first iteration were obtained for most of the years, except for 2007 and 2010, for which Landsat-5 TM images were used, and for 2012, for which Landsat-7 ETM+ was used (see Table 1). The range of the confidence variability of the first iteration in 2007 is the largest. As expected, for the second to fourth iterations, the variability ranges are higher than the first iteration, and, on average, the lowest confidence values (<65 %) were observed for 2012 and 2011. Two isolated fires showed confidence values <30 % for both the second to fourth iterations and the first iteration in 2011 and 2012, respectively. Concurrently, the fire-by-fire variability analysis performed on both pre- and post-fire time lags of the first and second to fourth iterations follows these results. As for fires before 2000, DOY is used for the fire dates (see Sect. 2.1); the variability in the post-fire time lag for most years of this duration is equal to 0. Additionally, this analysis highlighted that, on average, both pre- and post-fire time lags from the first iterations were less than ±50 d. For recent years – 2013 onwards and especially via the first iteration – both pre- and post-fire time lags are, on average, less than ±20 d (fire-by-fire boxplot is presented in Fig. B1, presented in Appendix B).
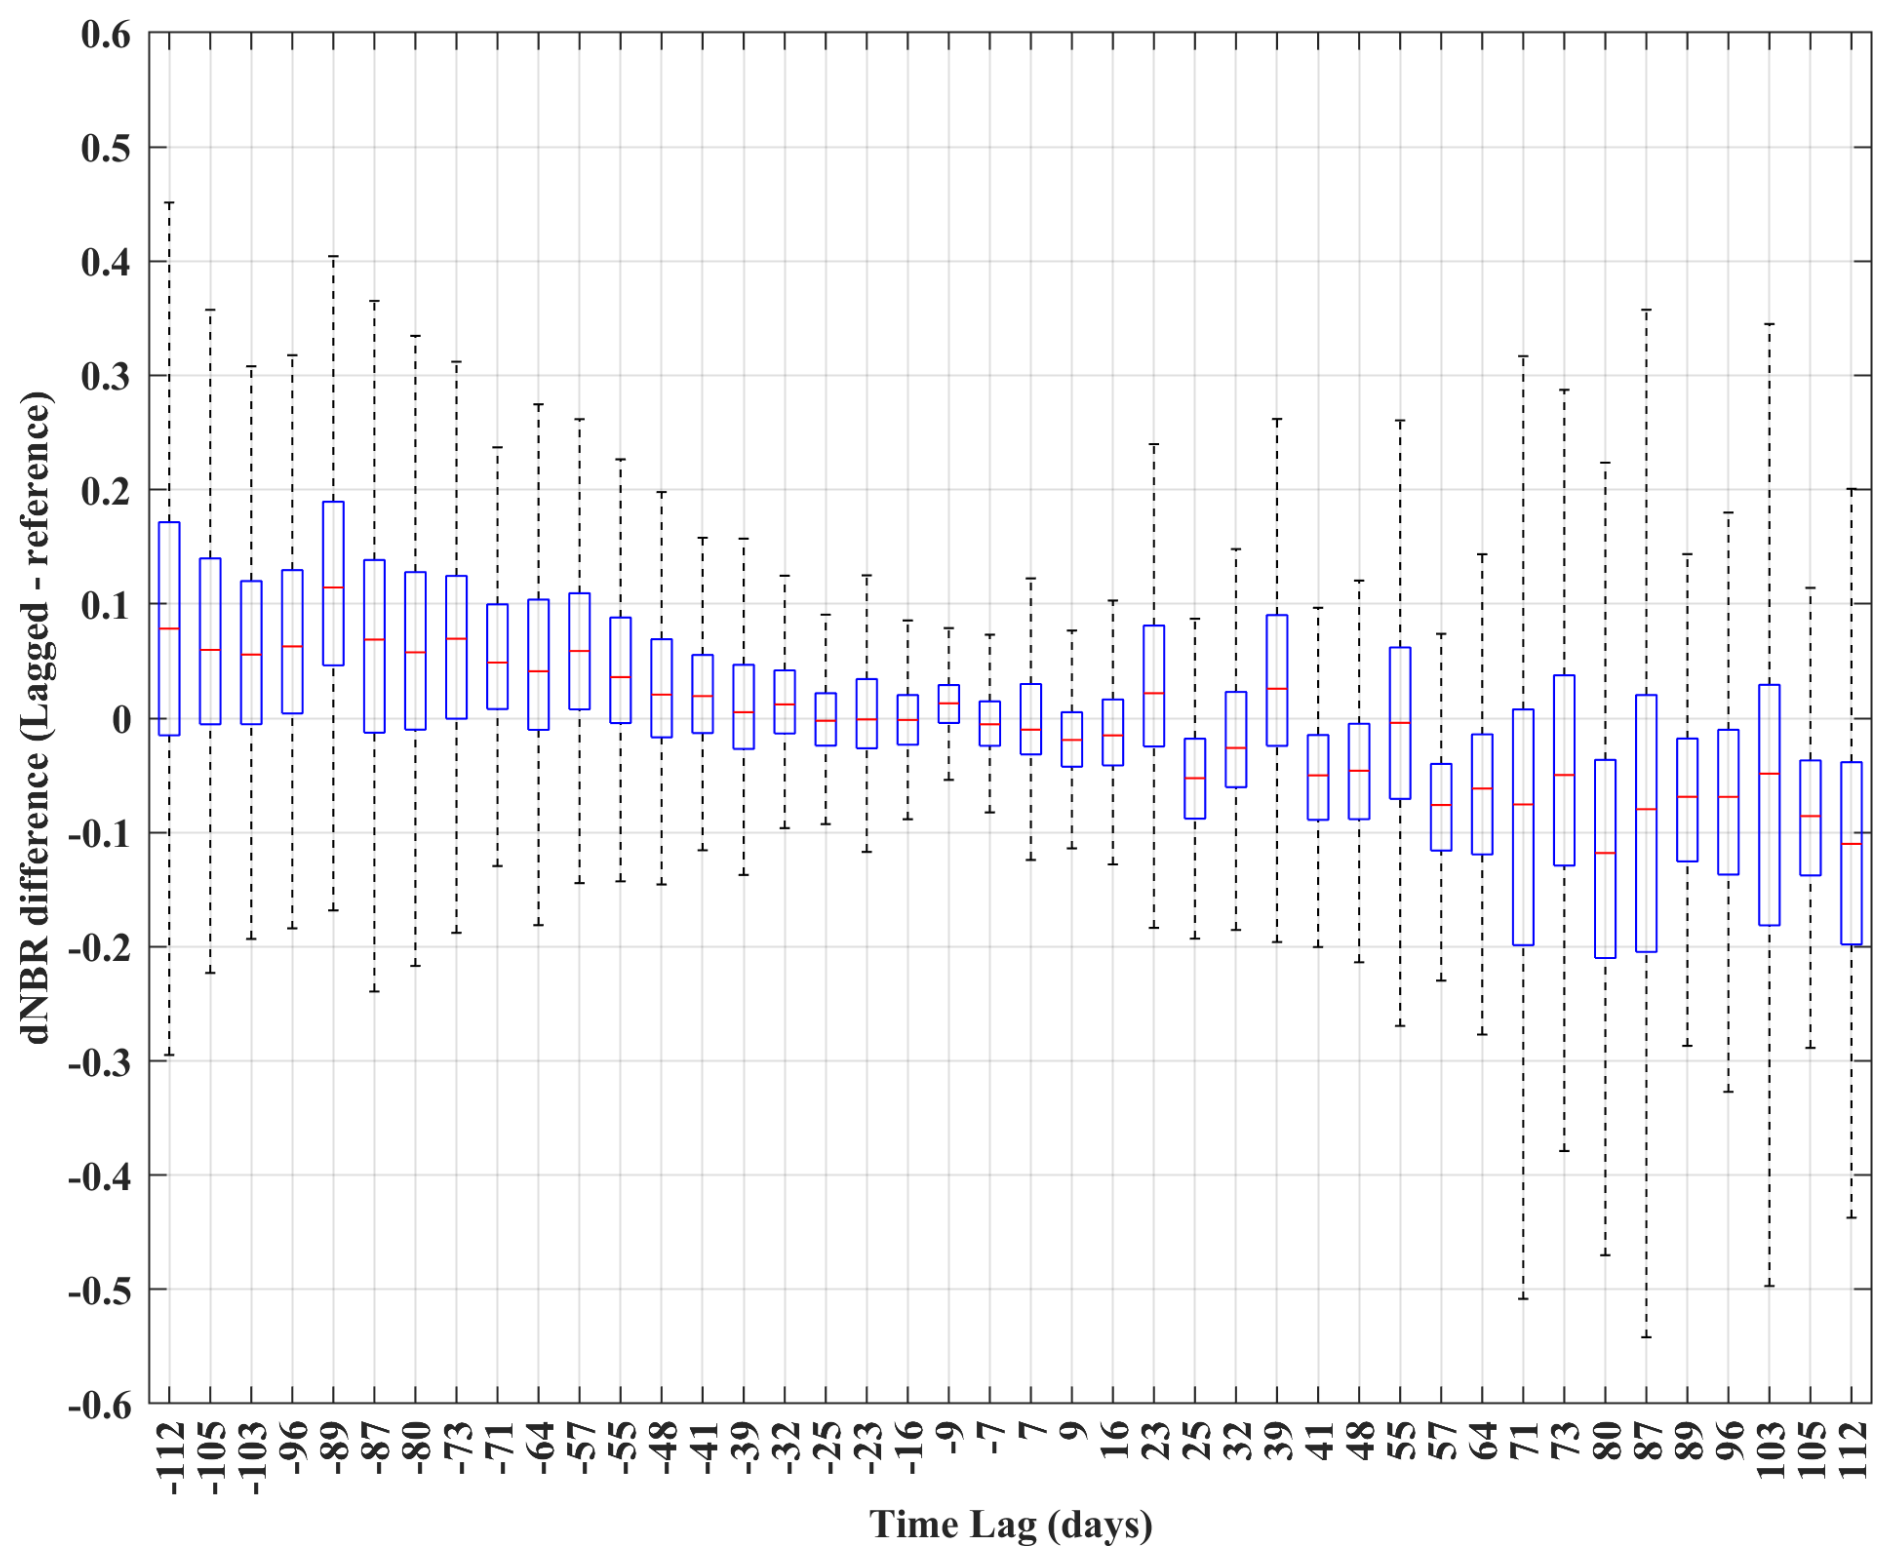
Figure 4Boxplot presenting the dispersion of pixel-by-pixel difference of dNBRs versus the time lag. The time lag, calculated as the difference between time lags of reference NBRs, is shown on the x axis, and the negative values represent pre-fire time lags, while the positive ones represent the post-fire time lags. The median (50th percentile) is presented as the central line (red). The height of the box represents the interquartile range (IQR), which stands for the difference between the first quartile (25th percentile or Q1), shown at the bottom of the box, and third quartile (75th percentile or Q3), shown at the top of the box. The lower whiskers extend to the smallest data points (≥ Q1 − IQR × 1.5), and the upper whiskers extend to the largest data points (≤ Q3 + IQR × 1.5) of the pixel-by-pixel difference between lagged and reference dNBRs per each unique value of time lag.
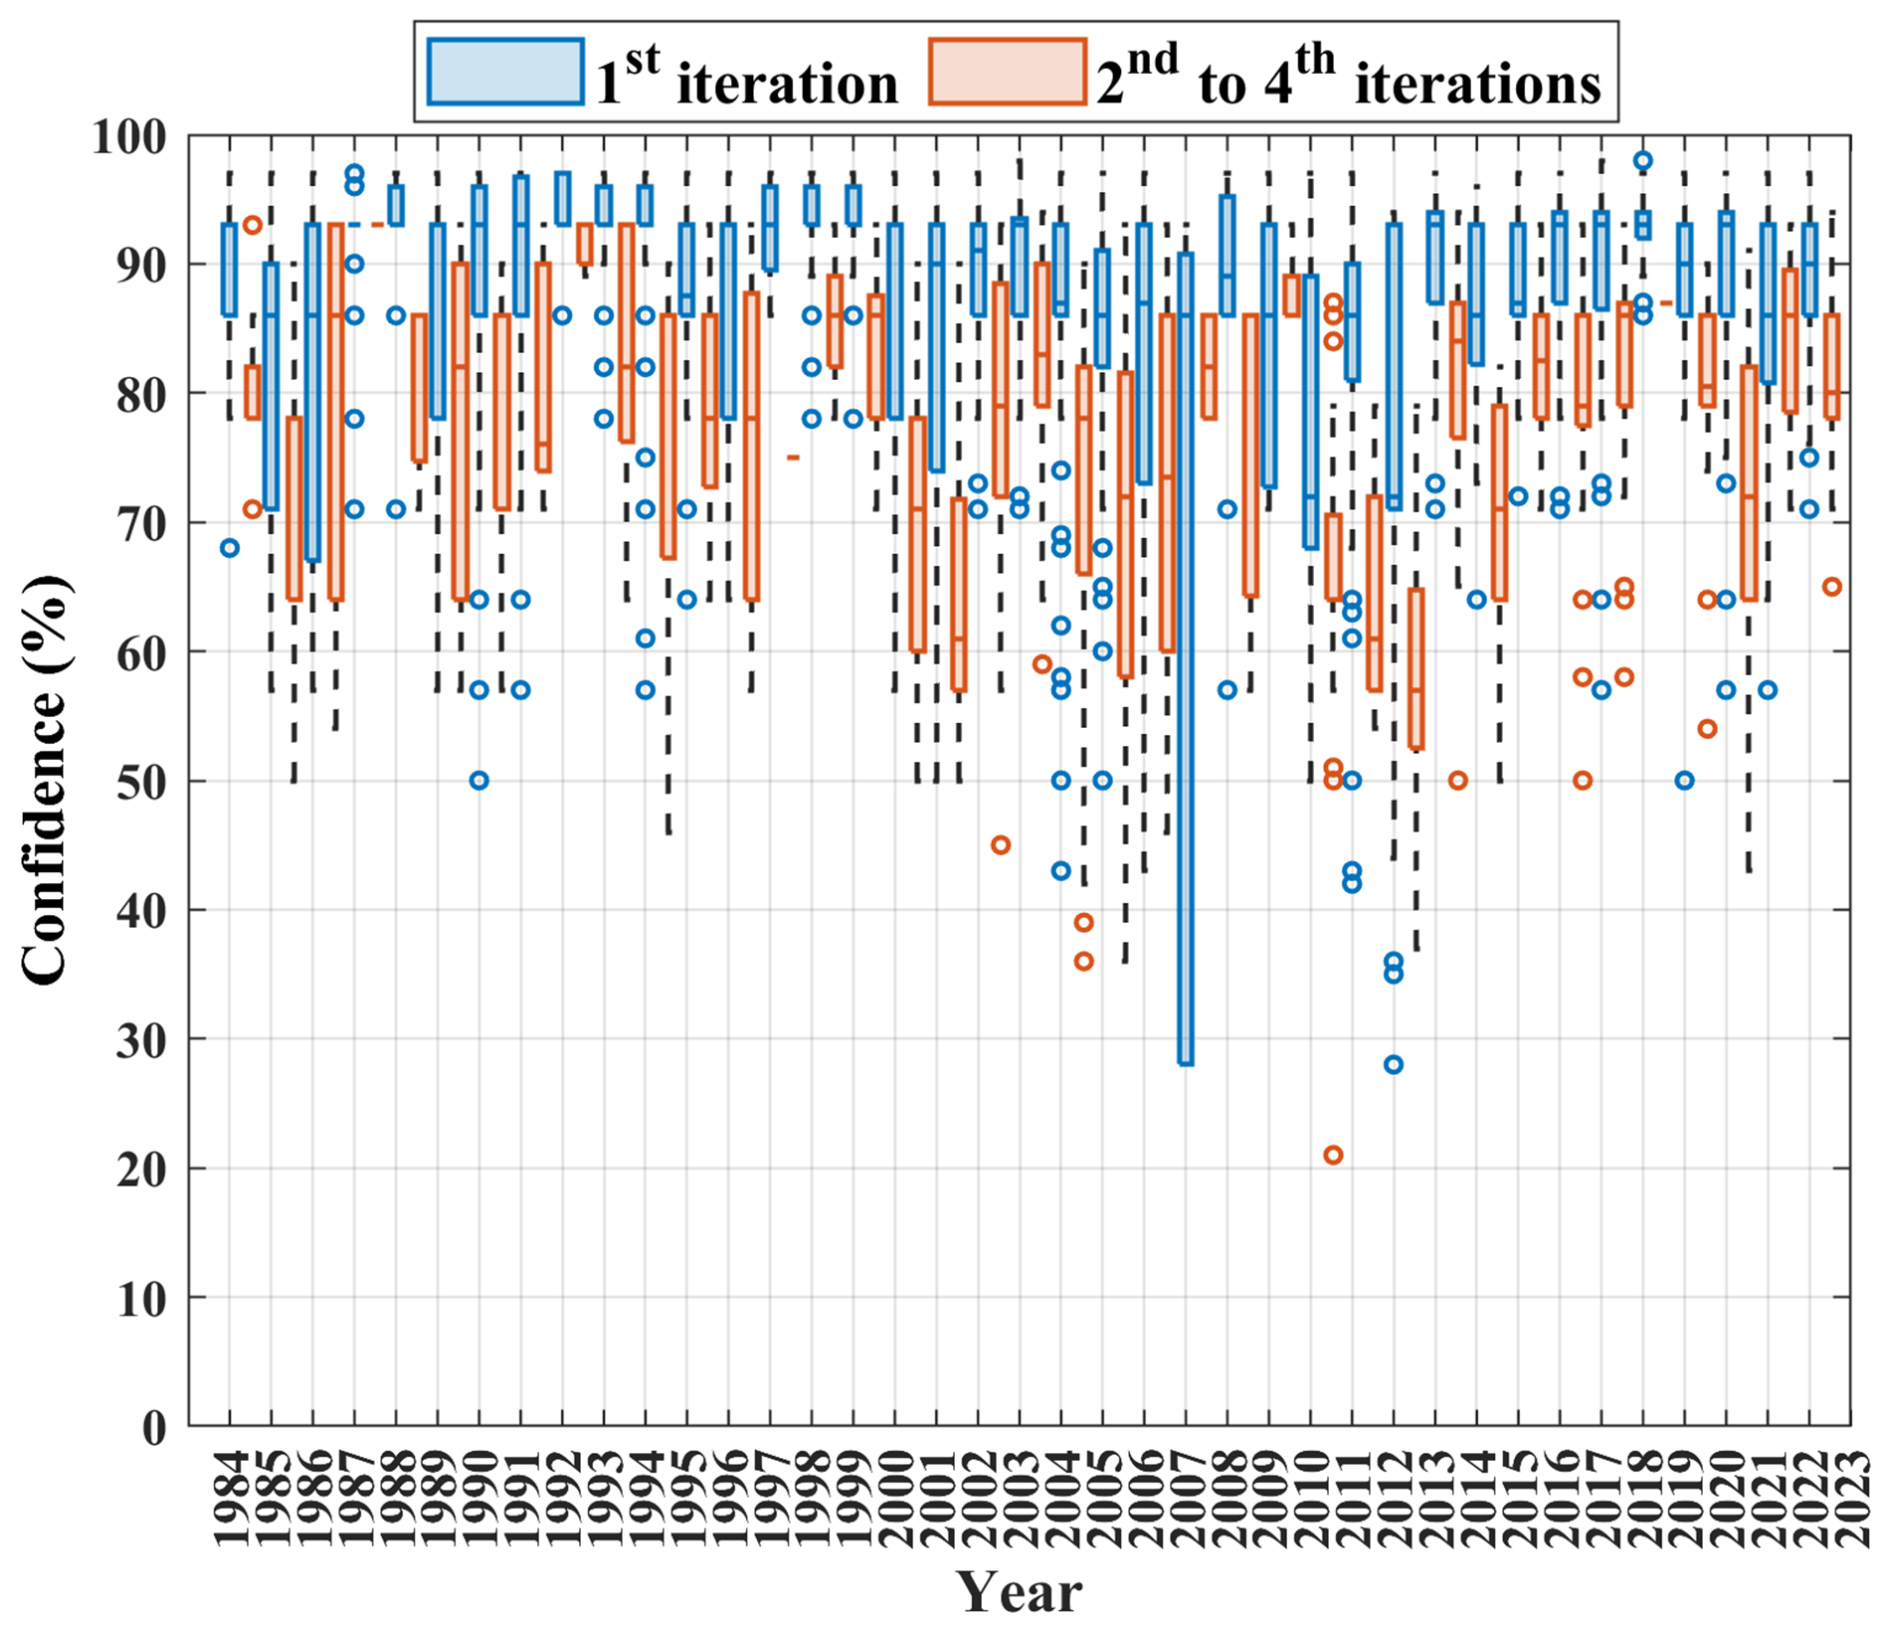
Figure 5Fire-by-fire confidence variability over the years obtained through the first iteration or second to fourth iterations. The median (50th percentile) is shown as the central line within the boxes. The first quartile (25th percentile or Q1) forms the bottom of the box, while the third quartile (75th percentile or Q3) forms the top. The interquartile range (IQR), calculated as the difference between the third and first quartiles (Q3–Q1), is represented as the height of the boxes. The upper whisker extends to the largest data point (≤ Q3 + IQR×1.5), while the lower whisker extends to the smallest data point (≥ Q1 − IQR×1.5) The outliers are shown as circular points.
3.3 Burn severity according to the different indices
The burn severity estimates of two very large fires (area ≧ 10 000 ha) that occurred in 2017 and 2003, with different indices (dNBR, RBR, RdNBR, and dNBR-EVI), are provided in Fig. 6a.1 and b.1 as examples. Overall, the dNBR and dNBR-EVI have very similar distributions, while the RdNBR has the highest range in contrast to the RBR, suggesting higher sensitivity to burn severity variation.
Throughout these figures, patches with low dNBR pixel values (<0.1) were coincident with low values for the different burn severity indices, except for the dNBR-EVI, where these patches had pixel values mostly ranging from 0.1 to 0.256. Via the RBR, pixel values larger than 0.42 were not observed, and the RdNBR index showed most of the pixel values, mainly within the range of 0.66 to 2.00, suggesting its tendency towards higher pixel values.
In the second panels of Fig. 6 (panels a.2 and b.2), the histograms of the different burn severity indices are provided. The frequencies of the dNBR, dNBR-EVI, and RBR exhibit nearly symmetric distribution shapes, while the histogram representing the RdNBR is skewed to the left, suggesting a bias towards higher pixel values. RBR histograms show a central tendency towards lower pixel values with a narrow spread, highlighting the point that, with lower range, the RBR is less sensitive to burn severity variation. The histograms demonstrating the distributions of the dNBR and dNBR-EVI exhibit almost similar spread ranges and almost similar central tendencies, with pixel values larger than the central tendency of the RBR histogram. The RdNBR histograms display a widespread range and a central tendency towards larger pixel values. Although RdNBR pixel values lower than −2 and greater than 2 are common, the number of out-of-range RdNBR pixels is sufficiently low such that they were not observable in the histograms. As a result, the x axis was limited to the range of −1 to 2.
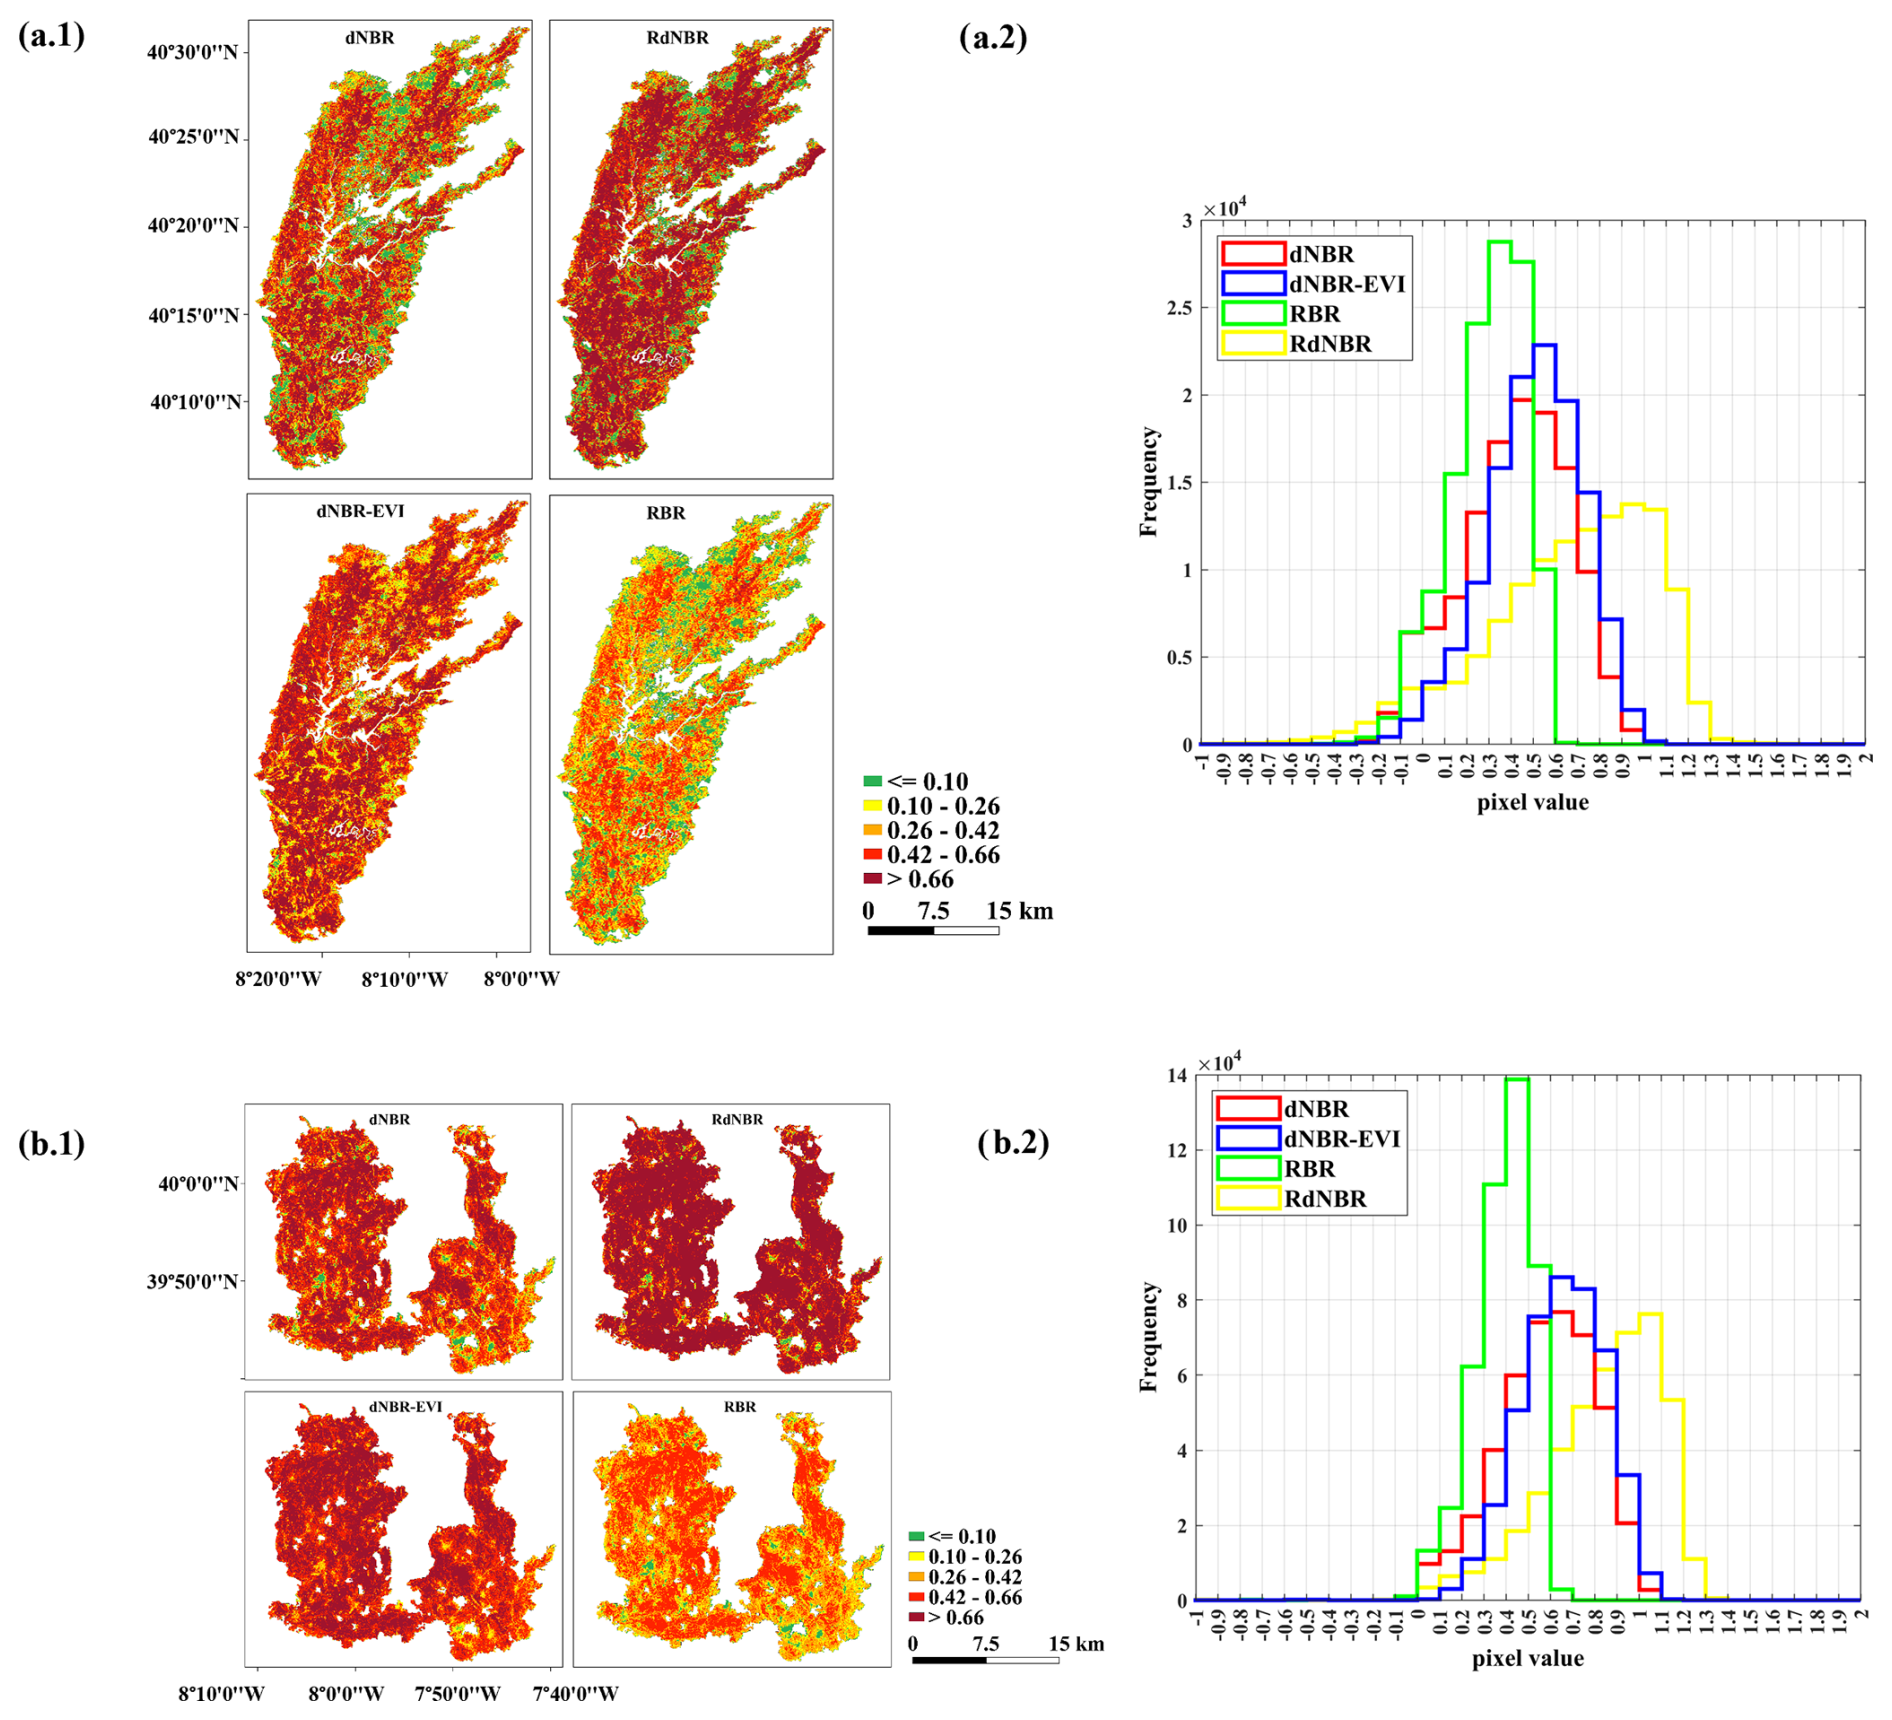
Figure 6Burn severity estimates via the dNBR, dNBR-EVI, RBR, and RdNBR for two large fires (area ≧ 10 000 ha) as examples are presented in (a.1) and (b.1). The thresholds applied are in accordance with the EFFIS classification for the dNBR (European Commission, 2018; Llorens et al., 2021). However, to facilitate the comparison of different severity indices, the same color classification was applied to all of the indices. In the second panel, the histograms represent the distribution of different burn severity estimates via different indices.
The Portuguese Burn Severity Atlas includes estimates for 66 % of the total burned area between 1984 to 2022. The remaining 34 % of burned area without burn severity estimates was mainly due to the exclusion of fires <100 ha, the exclusion of fires merged into one, and the lack of satellite imagery to estimate burn severity. When considering only the fires with start and end dates, only 3 % of the burned area did not have burn severity estimates due to either a lack of Landsat imagery with clear pixels within our sampling period or the limitations in GEE performing heavier processing and stopping the code after the fourth iteration. Within this study, the focus was on large fires (≧ 100 ha); however, this can be considered to be a limitation of our atlas. As our developed methodology can be applied to smaller fires (<100 ha), the exploration of the burn severity of small fires could be a research opportunity for future studies.
As can be seen in Fig. 2b, 9 % of the dNBR pixel values are lower than 0.1. According to the EFFIS (European Commission, 2018) burn severity discrete classification (European Commission, 2018; Llorens et al., 2021), dNBR pixel values less than 0.1 can be considered to be in the class of unburned or regrowth of vegetation. This can be caused by either commission errors in the burned-area mapping or the high regrowth potential of Portuguese vegetation cover, especially within the first month following the fire occurrence (Neves et al., 2023).
Results show that, in almost 40 years, Portugal has, on average, experienced high burn severity. Mateus and Fernandes (2014) detailed the following reasons behind the high-severity fire regime in Portugal: (1) the dominance of highly flammable Eucalyptus globus, especially in the Centro and Norte regions, accounting for 77 % of all forest fires; (2) the fact that 90 % of all forest fires occur within the months of June to September as the result of droughts; (3) dry conditions of dominant vegetation types due to seasonal weather patterns; (4) high productivity of understory plants, specifically shrubs; (5) the dominance of stand-replacing and crown fires; and, most importantly, (6) prioritizing fire suppression over prevention.
No visible trend was observed regarding the annual burned-area extent over the years studied (Fig. 3); however, the three largest fire seasons were in 2003, 2005, and 2017. Many fire research studies focused on these 3 years, not only because of their huge magnitude of burned extent but also due to their different drivers (Beighley and Hyde, 2018) and consequences (Nitzsche et al., 2024). Oliveira et al. (2021) also found no trend regarding the burned extent over the years in Portugal while highlighting that 2017 was “the worst year” in terms of the burned area. For these 3 years, more than 98 % of valid fires had burn severity estimates, although imageries from different sensors – Landsat-5 TM and Landsat-8 OLI – were applied due to different satellite availability dates (Table 1).
More reliable fire data since 2001 are available for Portugal as better means of data record technologies from various sources have been applied (Nunes et al., 2016). For recent years – 2013 onwards – higher percentages of burned area with severity estimates (on average, ≈ 99 %) and with no drastic variations were obtained, for which only images from Landsat-8 OLI sensor were used. Hence, our omission errors for fires following 2001 are less than the ones prior to this year. Although both Landsat-5 TM and Landsat-8 OLI sensors have a similar temporal resolution, it was observed that, via Landsat-8 OLI, more images with clear pixels – minimum reflectance contamination such as cloud, cirrus, shadow, and smoke – were available during the sampling period of ±110 d. This can be explained due to the difference in terms of the “daily image acquisition rate” of Landsat-8 OLI and Landsat-5 TM. The image acquisition rate is defined as the number of images acquired by each sensor on a daily basis. Landsat-5 TM acquires 225 to 250 images per day, which varies based on various factors such as the amount of sunlit land (Loveland and Dwyer, 2012), while Landsat-8 OLI acquires 725 images per day (Loveland and Irons, 2016). This point can be confirmed by the time series boxplot of fire-by-fire confidence (%), i.e., the average of the suitability of pre- and post-fire images, showing smaller range variations with high average values (>80 %) for recent years (Fig. 5). Higher confidence is the result of a greater suitability value, which occurs when time lag decreases (Eq. 1). Thus, in recent years, the time lag variation range should also be smaller, which is confirmed by Fig. B1 (mentioned in Sect. 3.2).
Burn severity estimates were obtained from different Landsat sensors to ensure “spectral consistency” over the long study period (Fernández-Guisuraga and Fernandes, 2024). This objective was achieved for all years. For 2012, aside from Landsat-7, estimates were also provided by MODIS Terra imagery. According to the Landsat sensors' availability dates (Table 1), no images from this family of sensors were available for this year, aside from Landsat-7 ETM+ with SLC failure. One possible alternative would be to use images from the Earth Observation-1 Advanced Land Imager (hereafter EO-1 ALI), available from November 2000 to March 2017 with a spatial resolution of 30 m (Chander et al., 2009). Although EO-1 had the capability of imaging with global coverage, it was an experimental and mission-based satellite (Hoang and Koike, 2018), and, according to the USGS website (EarthExplorer, 2025), there were no images available for Portugal in 2012. Hence, in addition to MODIS-derived estimates for 2012, burn severity estimates via Landsat-7 ETM+ are included in the second version of the atlas, providing approximately 46 % of the area of valid fires for 2012 with estimates. The rest (54 %) do not have estimates due to either gaps caused by the SLC failure or a lack of cloud-free imagery. Users can now choose between having estimates for the year 2012 with
-
Landsat-7 data, with a high resolution (30 m), covering about 37 % of total burned-area extent, or
-
MODIS data, with a moderate resolution (500 m), covering about 81 % of the total burned-area extent.
According to Alonso-González and Fernández-García (2021), the burn severity estimates obtained by Landsat-8 and MODIS at the global scale are comparable despite the big difference in their resolution (Alonso-González and Fernández-García, 2021). However, as our issue is with 2012, a comparability assessment was performed between Landsat-7 and MODIS for the years 2002 and 2012 (area = 107 000 ha and n = 170 fires) (see Fig. A2). Our analysis revealed that the correlation between the estimates (dNBR) from these sensors is weak (Pearson's correlation coefficient (R) = 0.37 and significance of correlation (P) = 0), and estimates via MODIS have a tendency to underestimate burn severity. Hence, caution should be taken if using the estimates from MODIS for 2012. The influence of different Landsat sensors' characteristics on burn severity estimates cannot be discarded. No assessment was performed in this regard as the sensors' availability dates do not overlap (Table 1). However, there are multiple studies which used burn severity estimates from different Landsat sensors, and no incoherency has been reported (Singleton et al., 2019; Guindon et al., 2021; Mueller et al., 2020). Through the development of this atlas, bands from atmospherically corrected surface reflectance images from Level 2, Collection 2, Tier 1 (Table 1) with the most similar wavelengths between different Landsat sensors were used to minimized any possible inconsistency in the bands' reflectance (Whitman et al., 2020). As stated by Vogelmann et al. (2016), although there are minor changes to Landsat sensors, their spectral characteristics are still “reasonably comparable”, and other factors such as smoke and haze are more influential with regard to having impacts on spectral signals in comparison to differences in sensors' characteristics. While Poursanidis et al. (2015) claimed that the Landsat-8 OLI sensor provides more accurate results in comparison to the Landsat-5 TM, these claims were made in relation to land cover mapping and not burn severity estimation.
We define RS images with quality as images with small time lags and, preferably, with little to no reflectance contaminations (e.g., cloud, cirrus, shadow, and smoke). Via the application of images with high quality, the most reliable burn severity estimates can be obtained (Miller et al., 2023; Dos Santos et al., 2020; Keeley et al., 2008). However, the number of high-quality images over each individual fire perimeter is scarce, especially when considering the older sensors (Gao et al., 2006). To increase the coverage of burn severity estimates, we considered an extensive sampling period (±110 d) and incorporated an iteration process, improving the coverage of our atlas by 12 %. To the best of our knowledge, no other studies in the literature have applied such a process before. However, mean compositing of different scenes to obtain burn severity or other types of atlases has been practiced (Parks et al., 2018; Whitman et al., 2020; Neves et al., 2023).
Due to our relatively long sampling period and because no specific scene acquisition row and/or path were determined when applying Landsat imagery, the occurrence of seasonal variations and “mismatched phenology” between the pre- and post-fire images could have happened (Parks et al., 2018; Key, 2006; Storey et al., 2005; Lutes et al., 2006) as phenology is not constant throughout the year (Balata et al., 2022). On average, the worst pre- and post-fire time lags of this atlas were lower than ±50 d for the first iterated burn severity estimations (Fig. B1); thus, on average, the seasonality influences have been minimized, although no further assessment was performed in this regard. More research related to seasonality and phenology analysis is necessary (Key, 2006; Howe et al., 2022; Parks et al., 2018). In this atlas, we have calculated the offset values of burn severity indices of individual fires according to their corresponding formulas (Table 2). As indicated by Parks et al. (2018), offset values are accounted for to differentiate between phenology variations between pre- and post-fire images. Hence, they can be applied to minimize the impacts caused by any possible “mismatched phenology” between pre- and post-fire images. As a suggestion for future studies, the lack of knowledge regarding the degree of seasonality influencing the quality of burn severity estimates can be highlighted. Such analysis can be conducted by using the offset values and time lags provided by this atlas.
The definitions related to sampling periods are ambiguous. Our sampling period is ±110 d to avoid and minimize capturing environmental and ecological responses. In many studies related to the “trend and evolution analysis of burn severity”, such as the one performed by Dillon et al. (2006), the burn severity estimates calculated within 6 months or ±180 d from the ignition date were excluded. Dillon et al. (2006) classified this sampling period as the “initial assessment”. On the other hand, by the definition provided by Key (2006), our sampling period is categorized as an extended assessment. Thus, we have called our sampling period a rapid to extended assessment.
As burn severity estimates are highly time-sensitive, with the increase in time lag, the accuracy of RS estimates decreases and is degraded as environmental responses are cumulated over fire impacts (Key, 2006). To have an understanding of this degradation, we modeled the variation in the dNBR as the standard burn severity index, caused by the increase in time lags (Fig. 4). The dNBR tends to increase with the increase in the pre-fire time lag, which leads to an overestimation of burn severity. In Portugal, as in all Mediterranean-climate areas, vegetation vigor is lower before fire occurrence as a result of high temperatures and solar radiation and low water availability (Verbyla et al., 2008; Chu and Guo, 2014; Pascolini-Campbell et al., 2022; Fernández-Guisuraga et al., 2023b). Generally, the pre-NBR tends to decrease as the fire season approaches (Alonso-González and Fernández-García, 2021). Thus, with the increase in pre-fire time lag, burn severity is overestimated as the amount of vegetation considered to be burned is overestimated. The dNBR tends to decrease with the increase in the post-fire time lag, which leads to an underestimation of burn severity. This can result from the fire scars becoming less visible due to environmental and ecological responses such as resprouting, especially in Portugal, where vegetation tends to regrow within the first month after the fire (Neves et al., 2023) and/or via ashes being removed by rain and wind (Key, 2006; González-Pelayo et al., 2023, 2024).
Burn severity estimates via different indices reveal varying degrees of post-fire impacts across the landscape (Parks et al., 2014; Miller and Thode, 2006; Fernández-García et al., 2018). Combining information from multiple indices could offer a more comprehensive understanding of burn severity. Thus, in this atlas, we provided burn severity estimates using four dNBR-derived indices. For instance, as can be observed from the examples provided in Fig. 6, for the same fires, each of the used indices can contribute to a better interpretation of burn severity. In summary, the RdNBR is more sensitive to vegetation type than the dNBR; its tendency towards higher pixel values can be interpreted to be due to the low fuel load of vegetation cover (Miller and Thode, 2006) for the chosen fires. However, more in-depth analysis is needed to confirm this point. Within these examples, the RBR was observed to be more prone to signal saturation. Signal saturation of dNBR-derived indices is defined as an incapability of indices to measure very high burn severity, with their values reaching a certain point where they are no longer capable of discerning subtle differences in terms of burn severity (Veraverbeke et al., 2012). Thus, caution should be taken when interpreting the dNBR-derived burn severity maps as they are subjected to signal saturation (Fernández-García et al., 2018; Santis et al., 2010; Fernández-Guisuraga et al., 2023a), especially the RBR. Moreover, as stated by Fernández-Guisuraga et al. (2023a), any interpretation of RS burn severity estimates must be accompanied by and confirmed with ground truth data, specifically for relative forms like the RdNBR and RBR. This is crucial because burn severity often varies across vertical strata, and satellite-derived reflections are differently sensitive to the impacts at each layer. Aggregating these impacts into a single metric can obscure important ecological details (Fernández-Guisuraga et al., 2023a; Miller and Thode, 2006; Parks et al., 2014; Cansler and McKenzie, 2012).
In this atlas, no data regarding the ground burn severity assessment are included and analyzed. The provision of the means of interpretation for the burn severity degrees or classes of our maps is not within the scope of this study. Thus, no classification thresholds for any of the burn severity indices are proposed, and the means of interpretation of burn severity must only align with users' objectives. As an example of means towards the interpretation of burn severity, in this study, the thresholds assigned by the EFFIS are mentioned. The thresholds of the EFFIS are assigned only for the dNBR index and not for other indices, and they are obtained from the comparison between dNBR pixel values and ground burn severity estimates considering the dominant environmental and climatic conditions within the Mediterranean regions (Llorens et al., 2021). In other studies, based on the correlations between the CBI and dNBR and the RdNBR and RBR, different thresholds have been introduced but only for specific parts of the USA (Alonso-González and Fernández-García, 2021; Parks et al., 2018). In Spain and specifically in the province of Valencia, by comparing the CBI and dNBR, the RdNBR, and the RBR, the classification thresholds for the interpretation of these indices were introduced (Botella-Martínez and Fernández-Manso, 2017) and have been furthered utilized for the interpretation of burn severity estimates by the ICNF for fires which burned in Monchique and Portimão in Portugal (ICNF, 2021). Moreover, there is a study that was conducted by Fernández-García et al (2022) which considers a total number of 23 fires, among which only 4 fires were located in Portugal (Fernández-García et al., 2022). Although there are studies comparing burn severity observations with estimates, they are isolated and limited, and, hence, they cannot be incorporated at a large scale, which, in our case, is the mainland of Portugal. Hence, our maps have all been presented in their continuous raw forms, and no classifications have been applied to them. We acknowledge the lack of validation as a limitation of our atlas, and we encourage future studies to validate the burn severity estimates of the Portuguese Burn Severity Atlas.
The Portuguese Burn Severity Atlas can be used as the foundation of many future research projects and presents numerous research opportunities. With 97 % of burn severity estimates for valid fires from 1984 to 2022 within the sampling period of ±110 d, we can confidently state that the characterization of long-term burn severity patterns (Singleton et al., 2019; Gale and Cary, 2022), burn-severity-heterogeneity-related analyses (Lutz et al., 2011; Buonanduci et al., 2023), analyses isolating burn severity environmental and climate variables (Miller et al., 2009), post-fire recovery studies (Oliveira et al., 2011; Alonso-González and Fernández-García, 2021; Whitman et al., 2020), and fire consequence studies (Wells et al., 2021; Petratou et al., 2023; Amerh et al., 2022; Vieira et al., 2023; Singh et al., 2022) can be conducted. Moreover, as suggestions for future research and via this atlas, we can highlight the gap of knowledge in the interpretation of RS burn severity estimates, especially the relative forms in the Mediterranean regions. Secondly, the most influential burn severity drivers, both environmental and climatic, need to be distinguished, and, accordingly, more informed pre- and post-fire management plans should be formed to minimize future fire impacts in Portugal. Last but not least, we encourage the execution of trend analysis of burn severity evolution to assess whether the burn severity in mainland Portugal has changed over the years.
The maps of the Portuguese Burn Severity Atlas can be accessed at https://doi.org/10.5281/zenodo.12773611 (Jahanianfard et al., 2025) (version 2, with corrections to fires before 2001 and inclusion of Landsat-7 estimates for 2012). The annual maps are provided in subfolders entitled as the corresponding year. Annual fire perimeters (shapefile), along with a table of details for the pairs of images used for each iteration, the confidence, and the offset values of burn severity indices, are also stored within these subfolders.
The GEE code can be accessed at https://code.earthengine.google.com/042de010edb5abdd14247f65a23a6193?noload=true (last access: 15 April 2025), with the fire data already having been shared as assets; however, it is necessary to have a GEE account to access the code. The code can also be accessed at https://github.com/DinaJahanianfard/Portuguese-Burn-Severity-Atlas_v2/commit/7aee76ea5b3df0db8cd047a4b8cf6624bf965d50 (https://doi.org/10.5281/zenodo.17160468, Jahanianfard, 2025), with no account or registration needed.
In this study, a comprehensive Portuguese Burn Severity Atlas was developed, spanning from 1984 to 2022, derived from Landsat satellite imagery (30 m resolution). This atlas contains burn severity estimates for 66 % of the 4.85 × 10⁶ ha burned between 1984 and 2022 and for 97 % of the valid fires, with a total burn area of 3.18 × 10⁶ ha. The atlas illustrates that Portugal has, on average, experienced high burn severity over the study period.
Through an iteration process, we expanded the coverage of the atlas, providing burn severity estimates for an additional 12 % of the valid fire area, totaling 0.38 × 10⁶ ha. Furthermore, we developed a semi-automated code in Google Earth Engine (GEE) that can be easily updated and modified by users to generate burn severity estimates for any region worldwide using any desired sampling period, with only the requirement of fire data.
Our findings regarding the relationship between the dNBR and time lag indicate that increasing pre-fire time lags results in the overestimation of burn severity, while increasing post-fire time lags leads to its underestimation.
The analysis of burn severity estimates using different indices reveals distinctive characteristics. Notably, the RdNBR tends to indicate higher burn severity, while the RBR shows a tendency towards signal saturation compared to other indices. However, further investigation is necessary to validate these findings, particularly in the context of defining thresholds for interpreting burn severity classes in Mediterranean regions.
Ultimately, the burn severity maps provided in this atlas offer numerous opportunities for research across various disciplines. They enable investigations into burn severity heterogeneity, trend analysis, studies of environmental and climatic drivers of burn severity, and studies related to air and water quality and soil erosion.
To perform the exploratory analysis of comparability for Landsat-7 and MODIS, dNBR estimates of valid fires for 2012 and 2002 were used, with the sum of the area of 107 000 ha corresponding to 170 individual fires. The dNBR estimates were resampled to 500 m via an averaging approach, and the correlation was conducted following Alonso-González and Fernández-García (2021). Our analysis showed that estimates from these two sensors may not be interchangeable due to weak and insignificant correlation (Pearson's correlation coefficient R=0.37 and significance of correlation P=0), with estimates of MODIS having a tendency towards underestimation of burn severity. Figure A2 represents the obtained results.
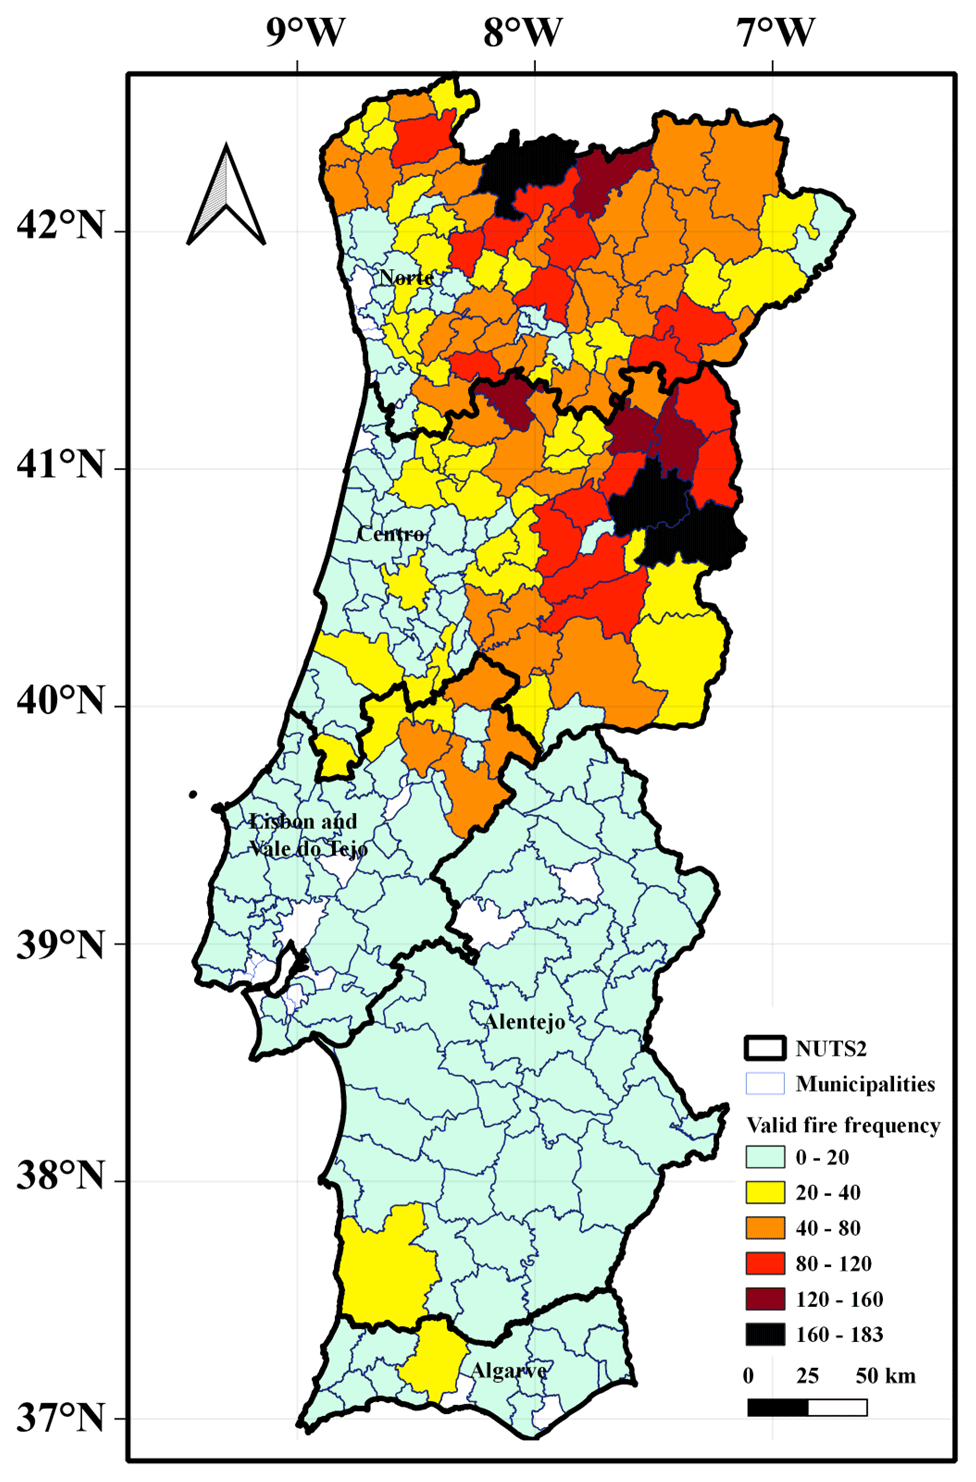
Figure A1Fire frequency of valid fires, presented in accordance with the Nomenclature of Territorial Units for Statistics (NUTS2) frontiers (Registo Nacional de Dados Geográficos – Direção-Geral do Território (DGT), 2024; Meneses et al., 2018), demonstrating the extent of mainland Portugal and its five regions.
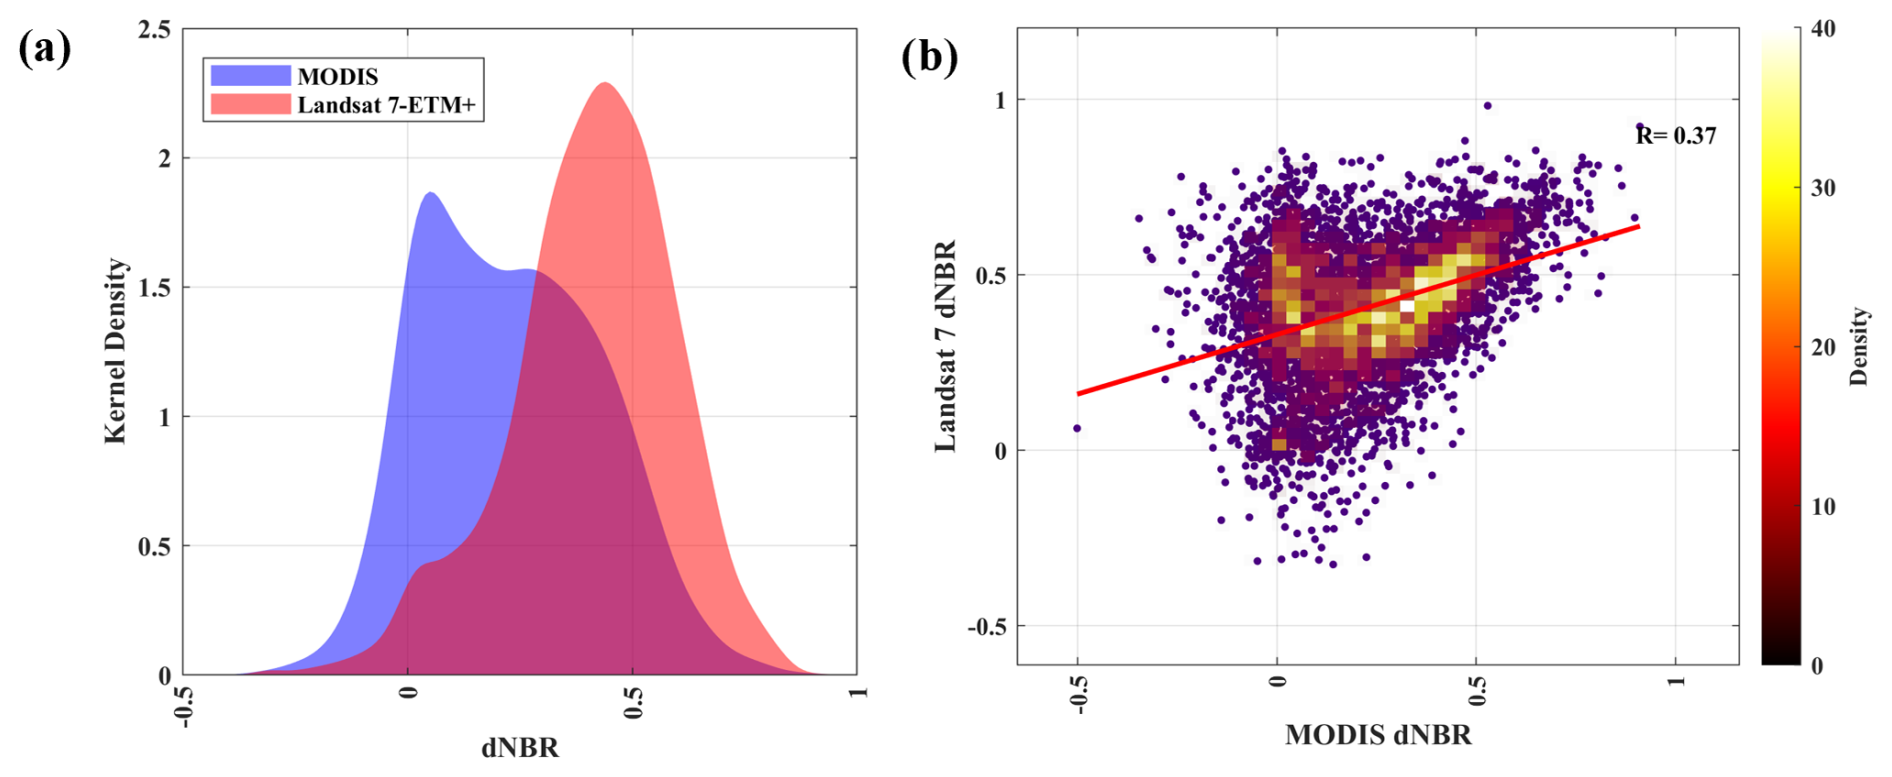
Figure A2The relationship between dNBR estimates from Landsat-7 and MODIS sensors is demonstrated via Gaussian kernel densities (a) and a scatterplot (b) over the sum of the area of 107 000 ha and over 170 individual fires burned in 2002 and 2012. Pearson's correlation coefficient is represented as R in (b). The red line in (b) represents the linear regression performed based on a pixel-by-pixel correlation obtained via Landsat-7 (dependent variable) versus MODIS (independent variable) (R2=0.13 and p value = 0).
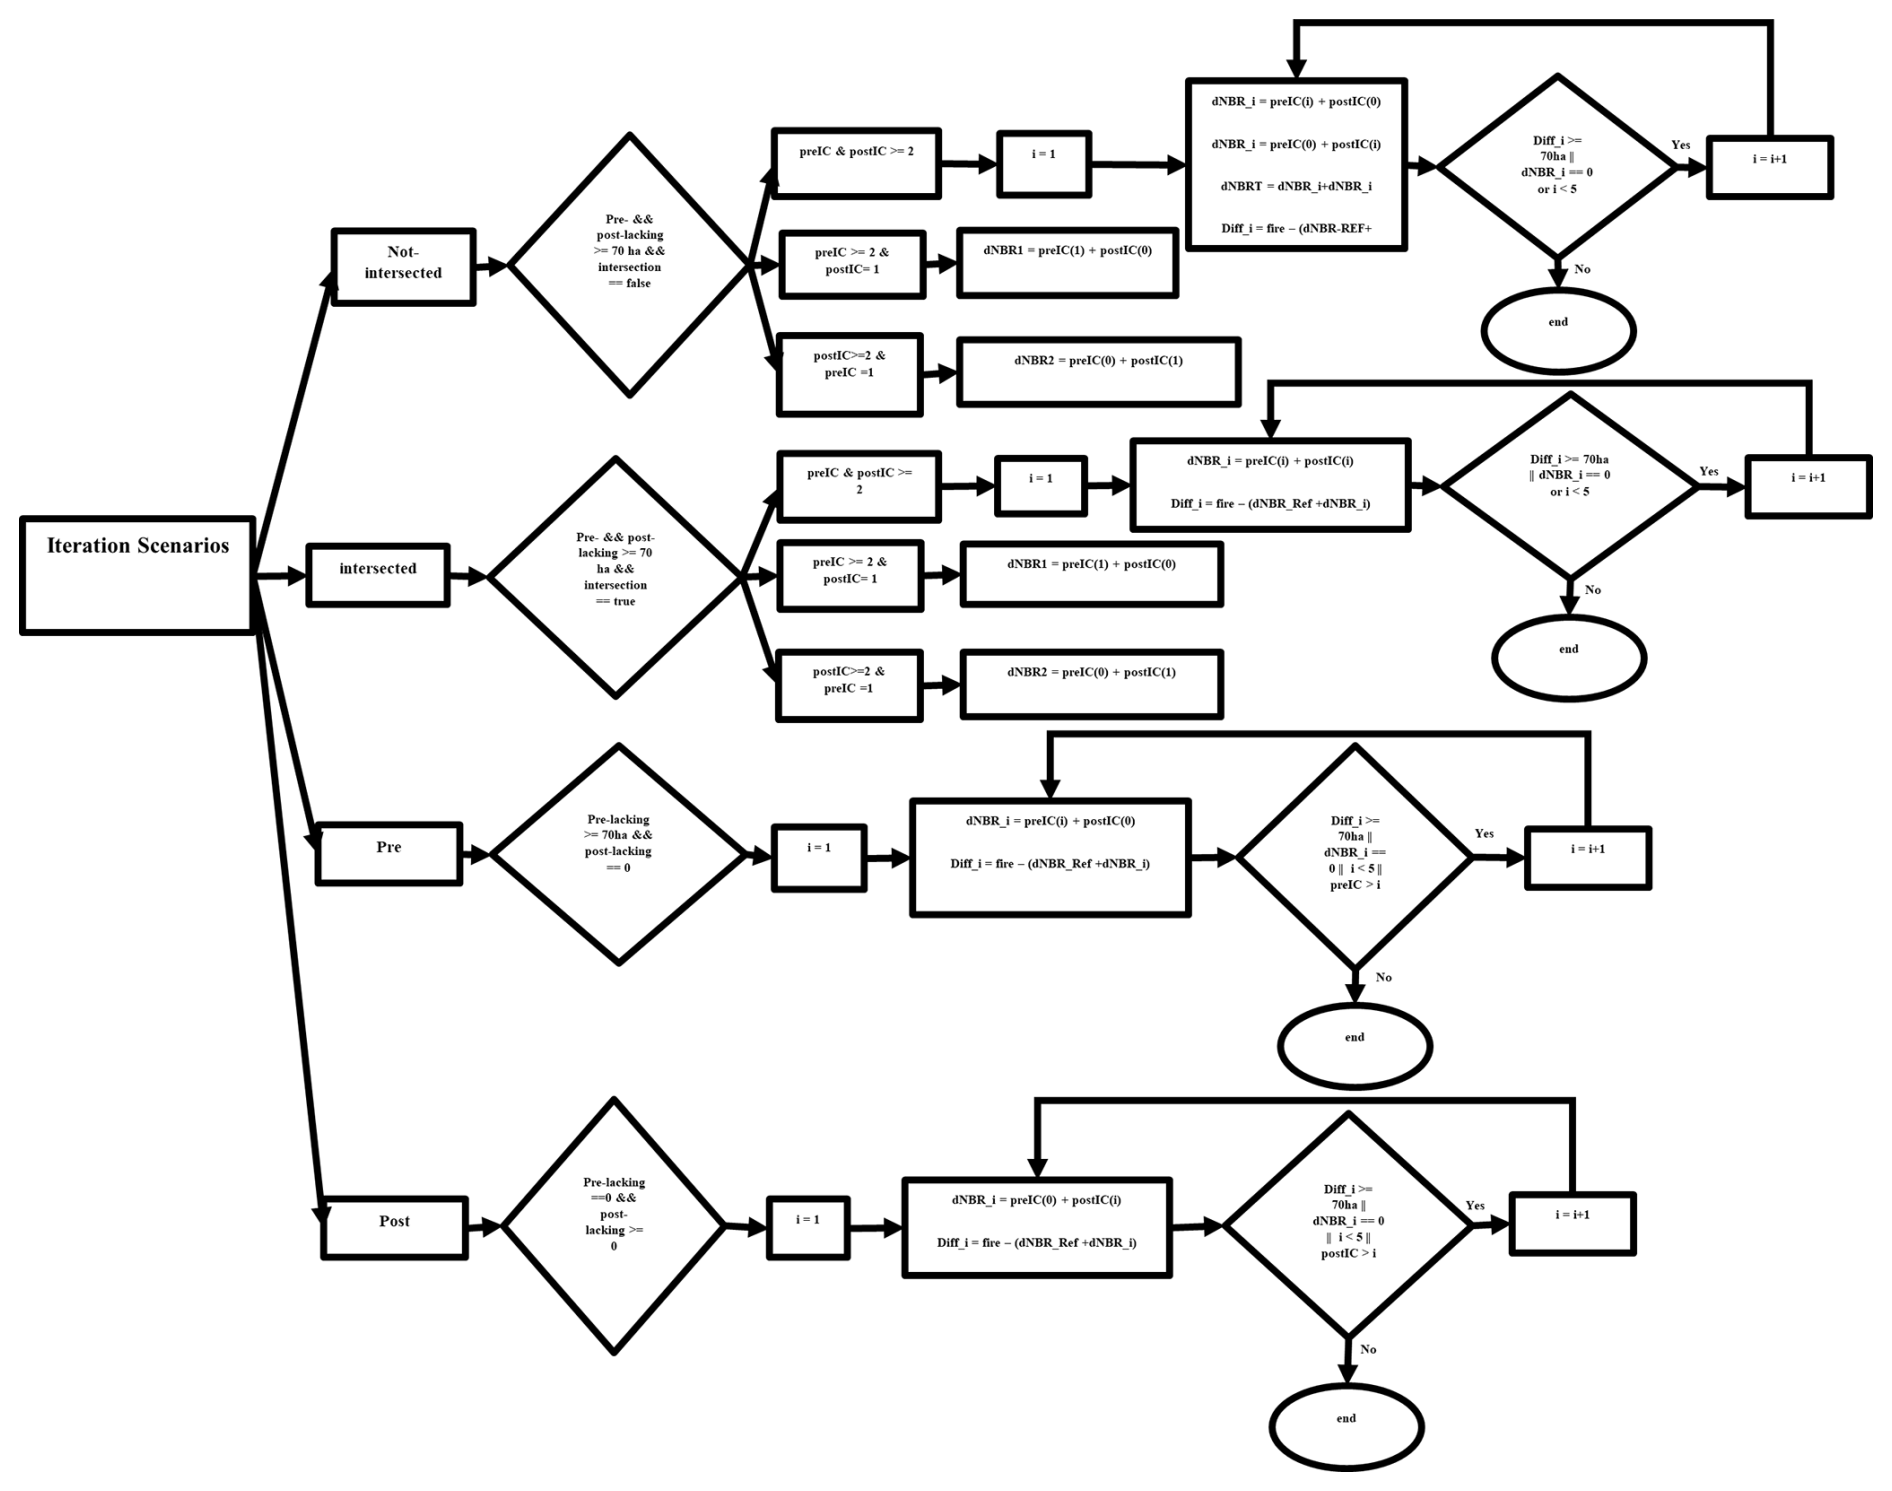
Figure A3Flowchart representing the iteration scenarios. PreIC and postIC stand for the pre- and post-fire image collections in GEE, and their size or the number of images within each IC is shown (e.g., PreIC ≦ 3, meaning that the number of images within this IC is less than or equal to 3). All the ICs are sorted from images from the highest suitability to the lowest, and the first image, shown as, for example, PostIC(0), is the first image within the sorted post-fire IC with the highest suitability.
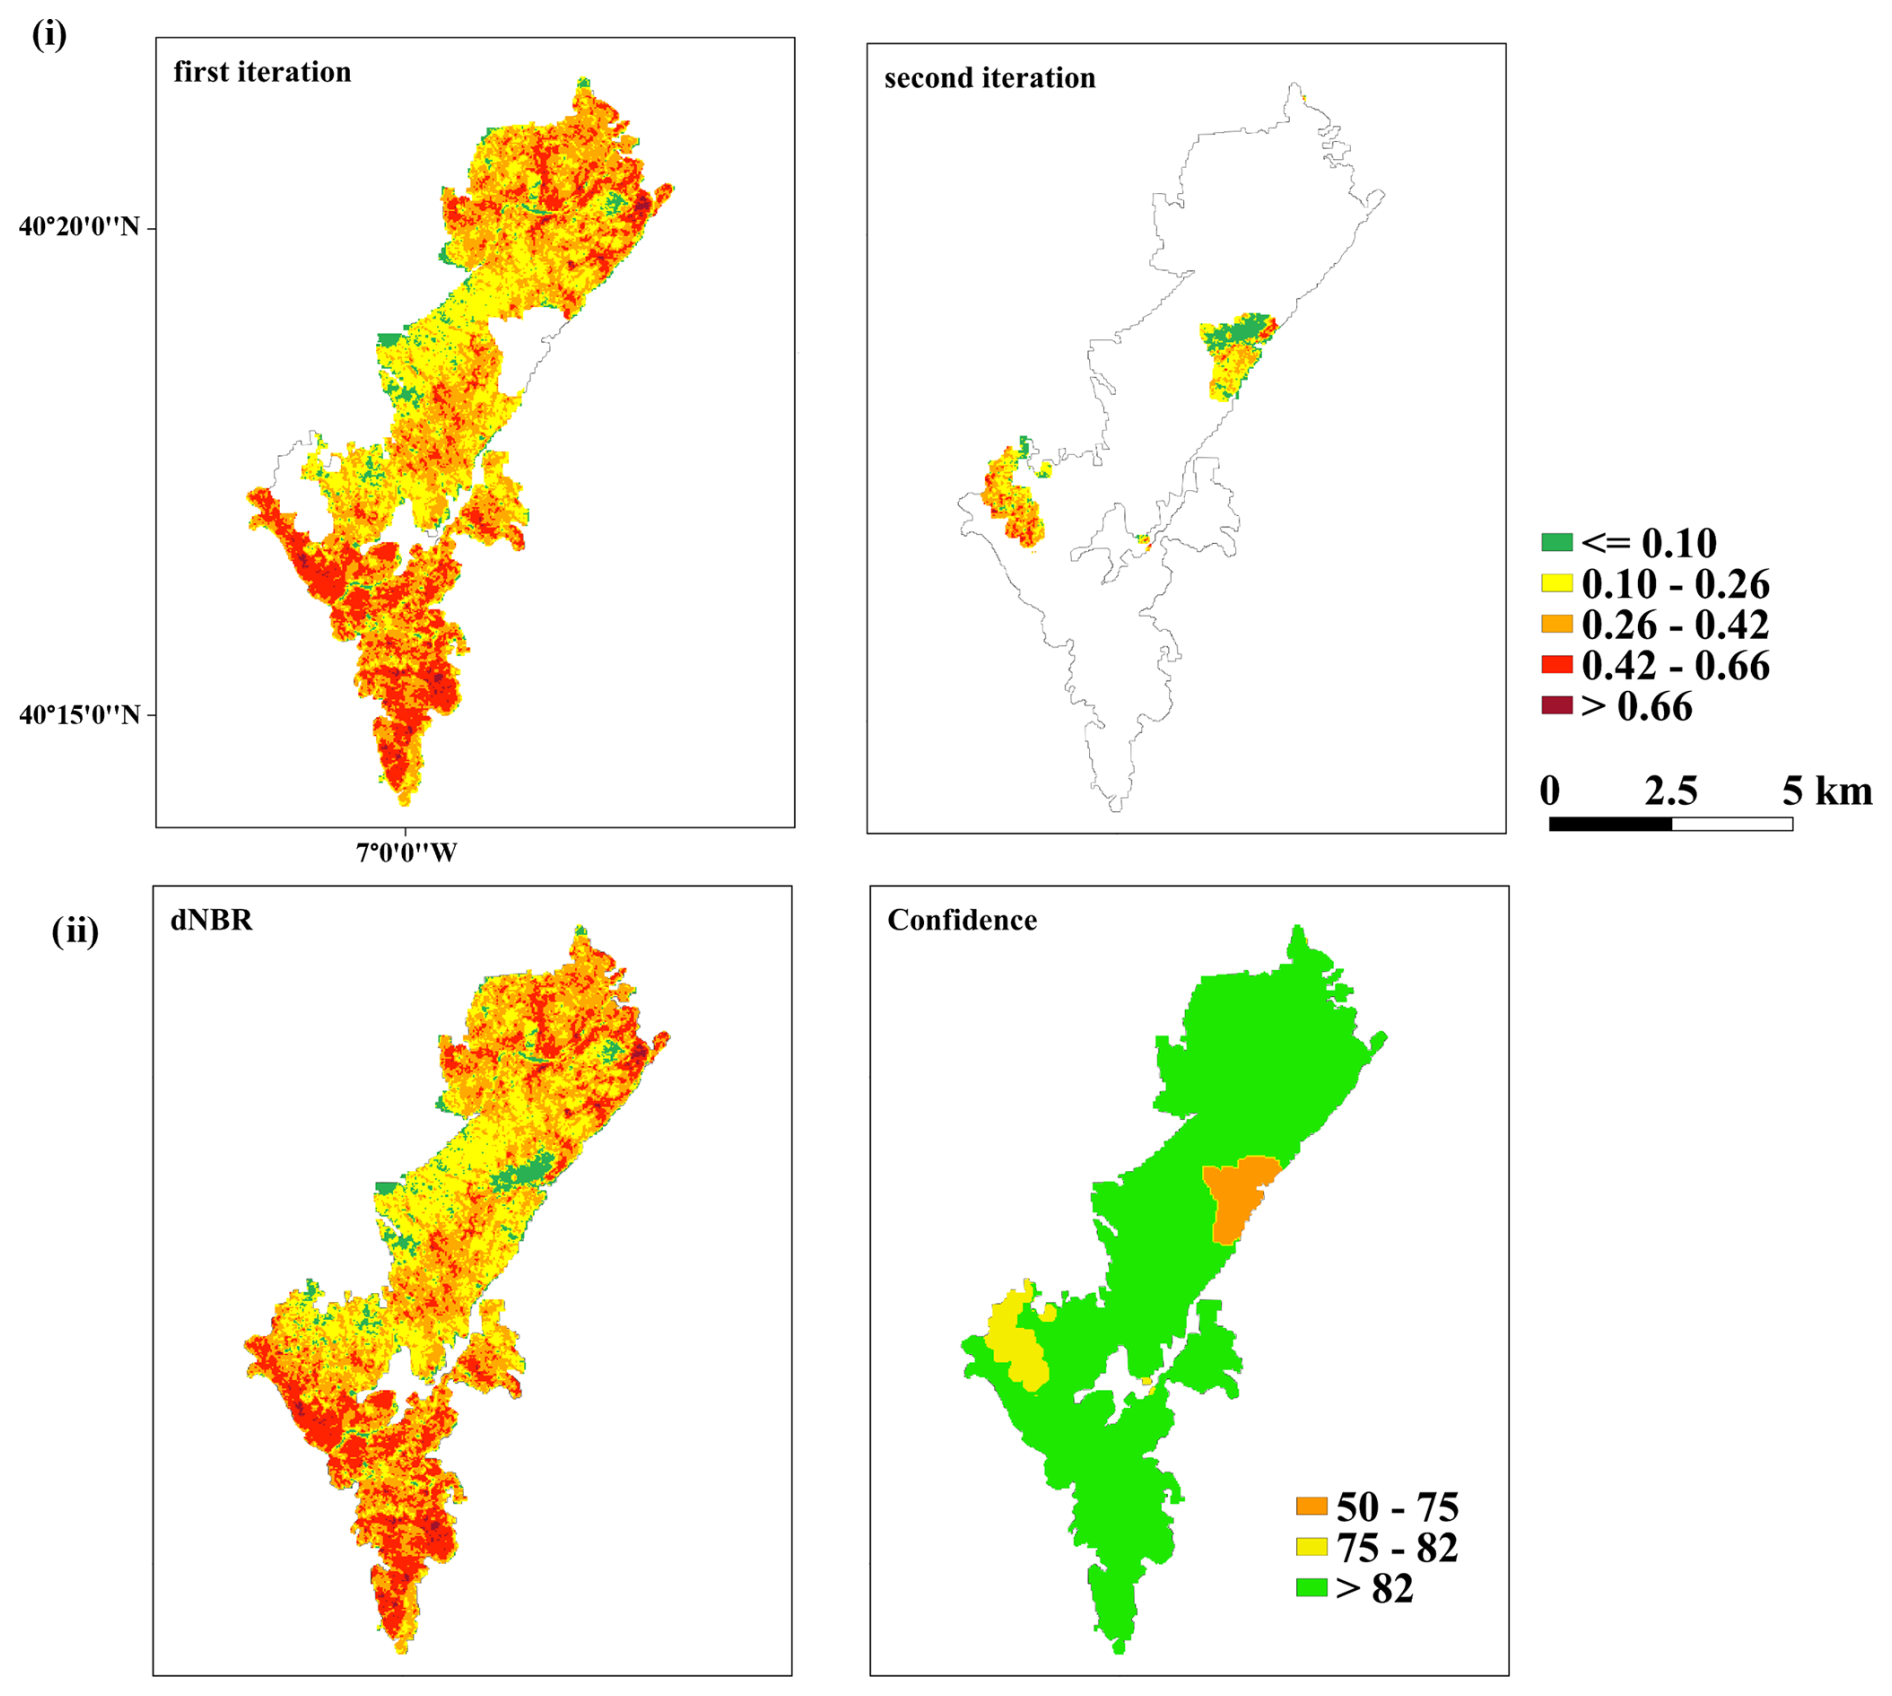
Figure A4Scenario: not_intersected. The dNBR estimation for the whole area of this fire (area = 4029 ha, year = 2003, ID = 2904) was obtained through three iterations, changing the pre- and post-fire images (the first iteration was with the highest-suitability pre- and post-fire images, covering an area of 3730 ha; the second iteration included changing the pre-fire image, covering an area of 160 ha; and the third iteration included changing the post-fire image, covering an area of 165 ha). Panel (i) shows the iteration steps, while (ii) shows the final dNBR and confidence maps of this fire.
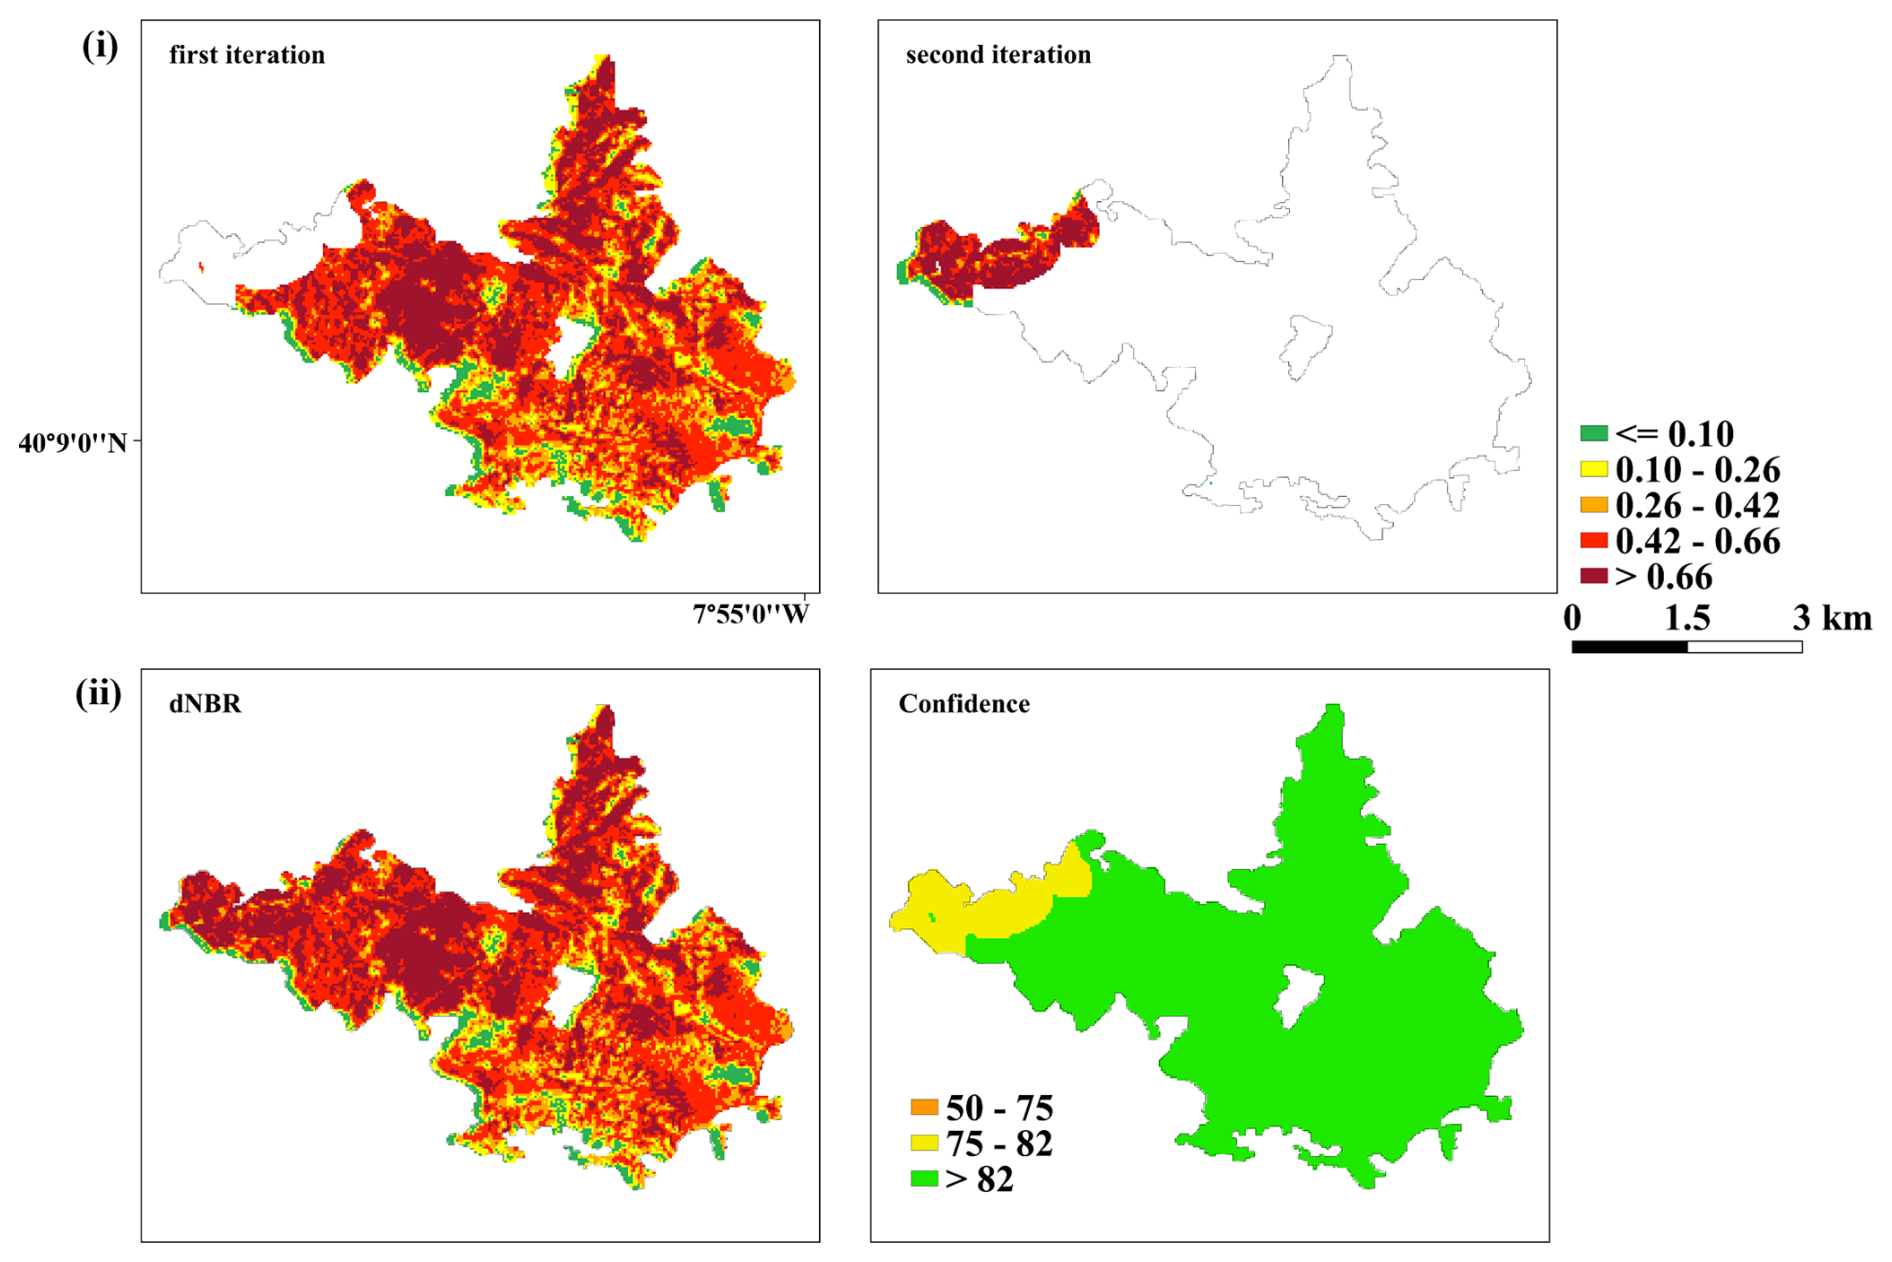
Figure A5Scenario: intersected. The dNBR estimation for the whole area of this fire (area = 2071 ha, year = 2003, ID = 2180) was obtained through two iterations. The first iteration included pre- and post-fire images with the highest suitability, covering an area of 1903 ha, and the second iteration included the second highest pre-and post-fire images, covering an area of 168 ha. Panel (i) shows the iteration steps, while (ii) shows the final dNBR and confidence maps of this fire.
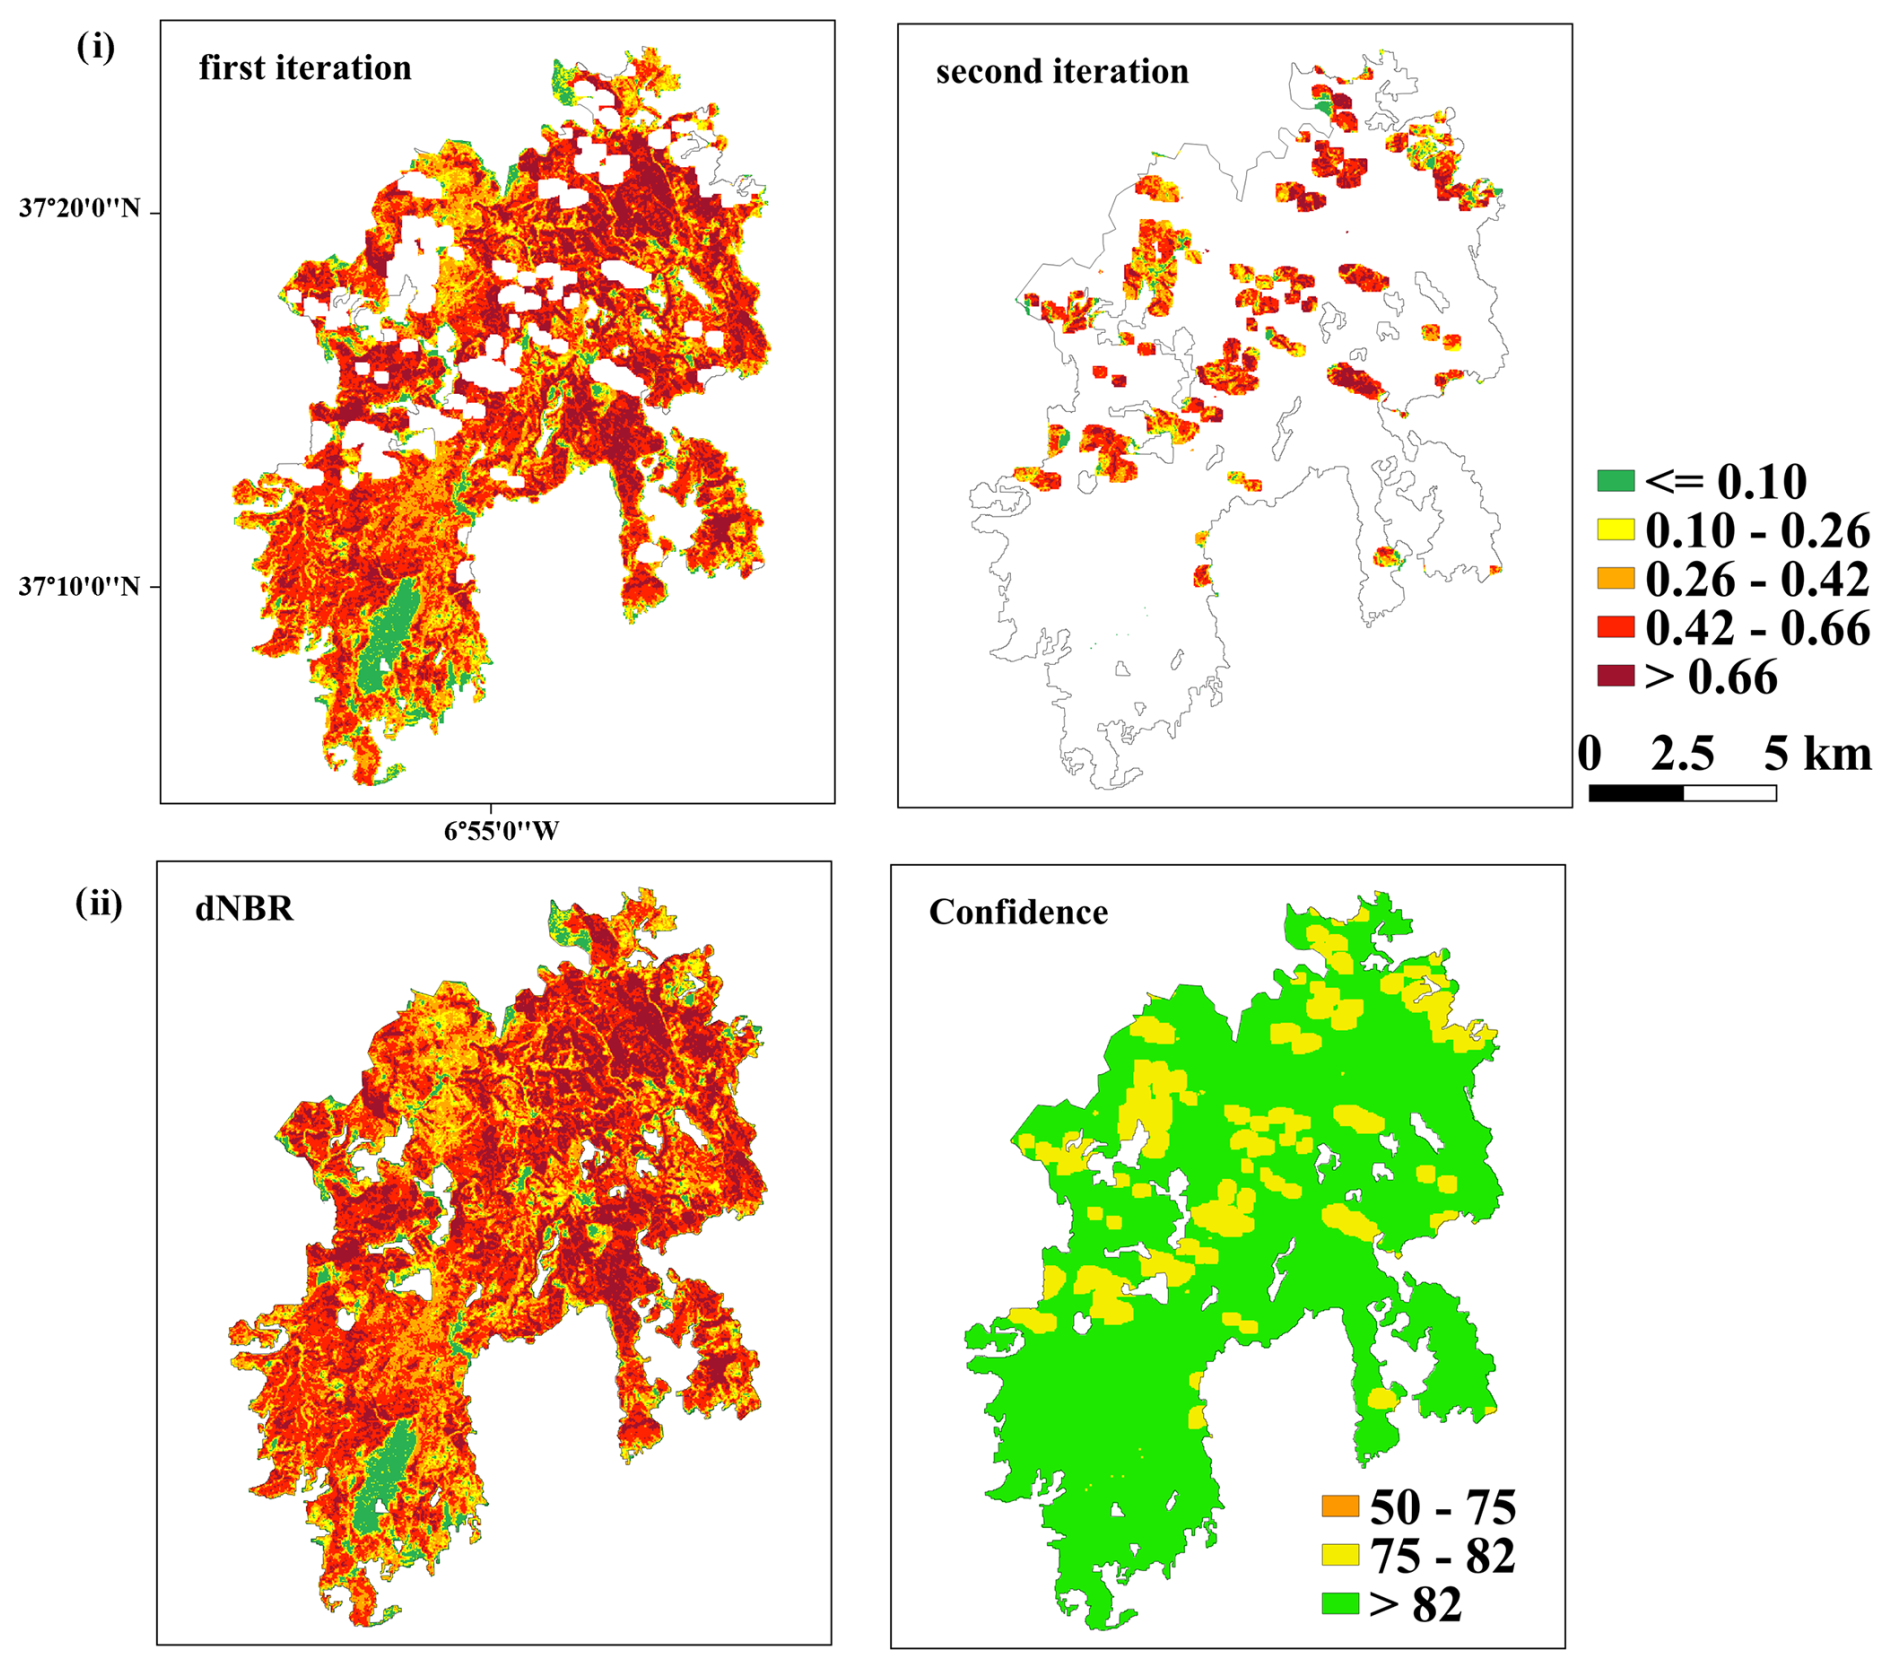
Figure A6Scenario: Pre. The dNBR estimation for the whole area of this fire (area = 13 770 ha, year = 2003, ID = 2933) was obtained through two iterations. The first iteration was with the highest-suitability pre- and post-fire images, covering an area of 11 631 ha, and the second iteration was with the second-highest-suitability pre-fire image and the highest-suitability post-fire image, covering an area of 2143 ha. Panel (i) shows the iteration steps, while (ii) shows the final dNBR and confidence maps of this fire.
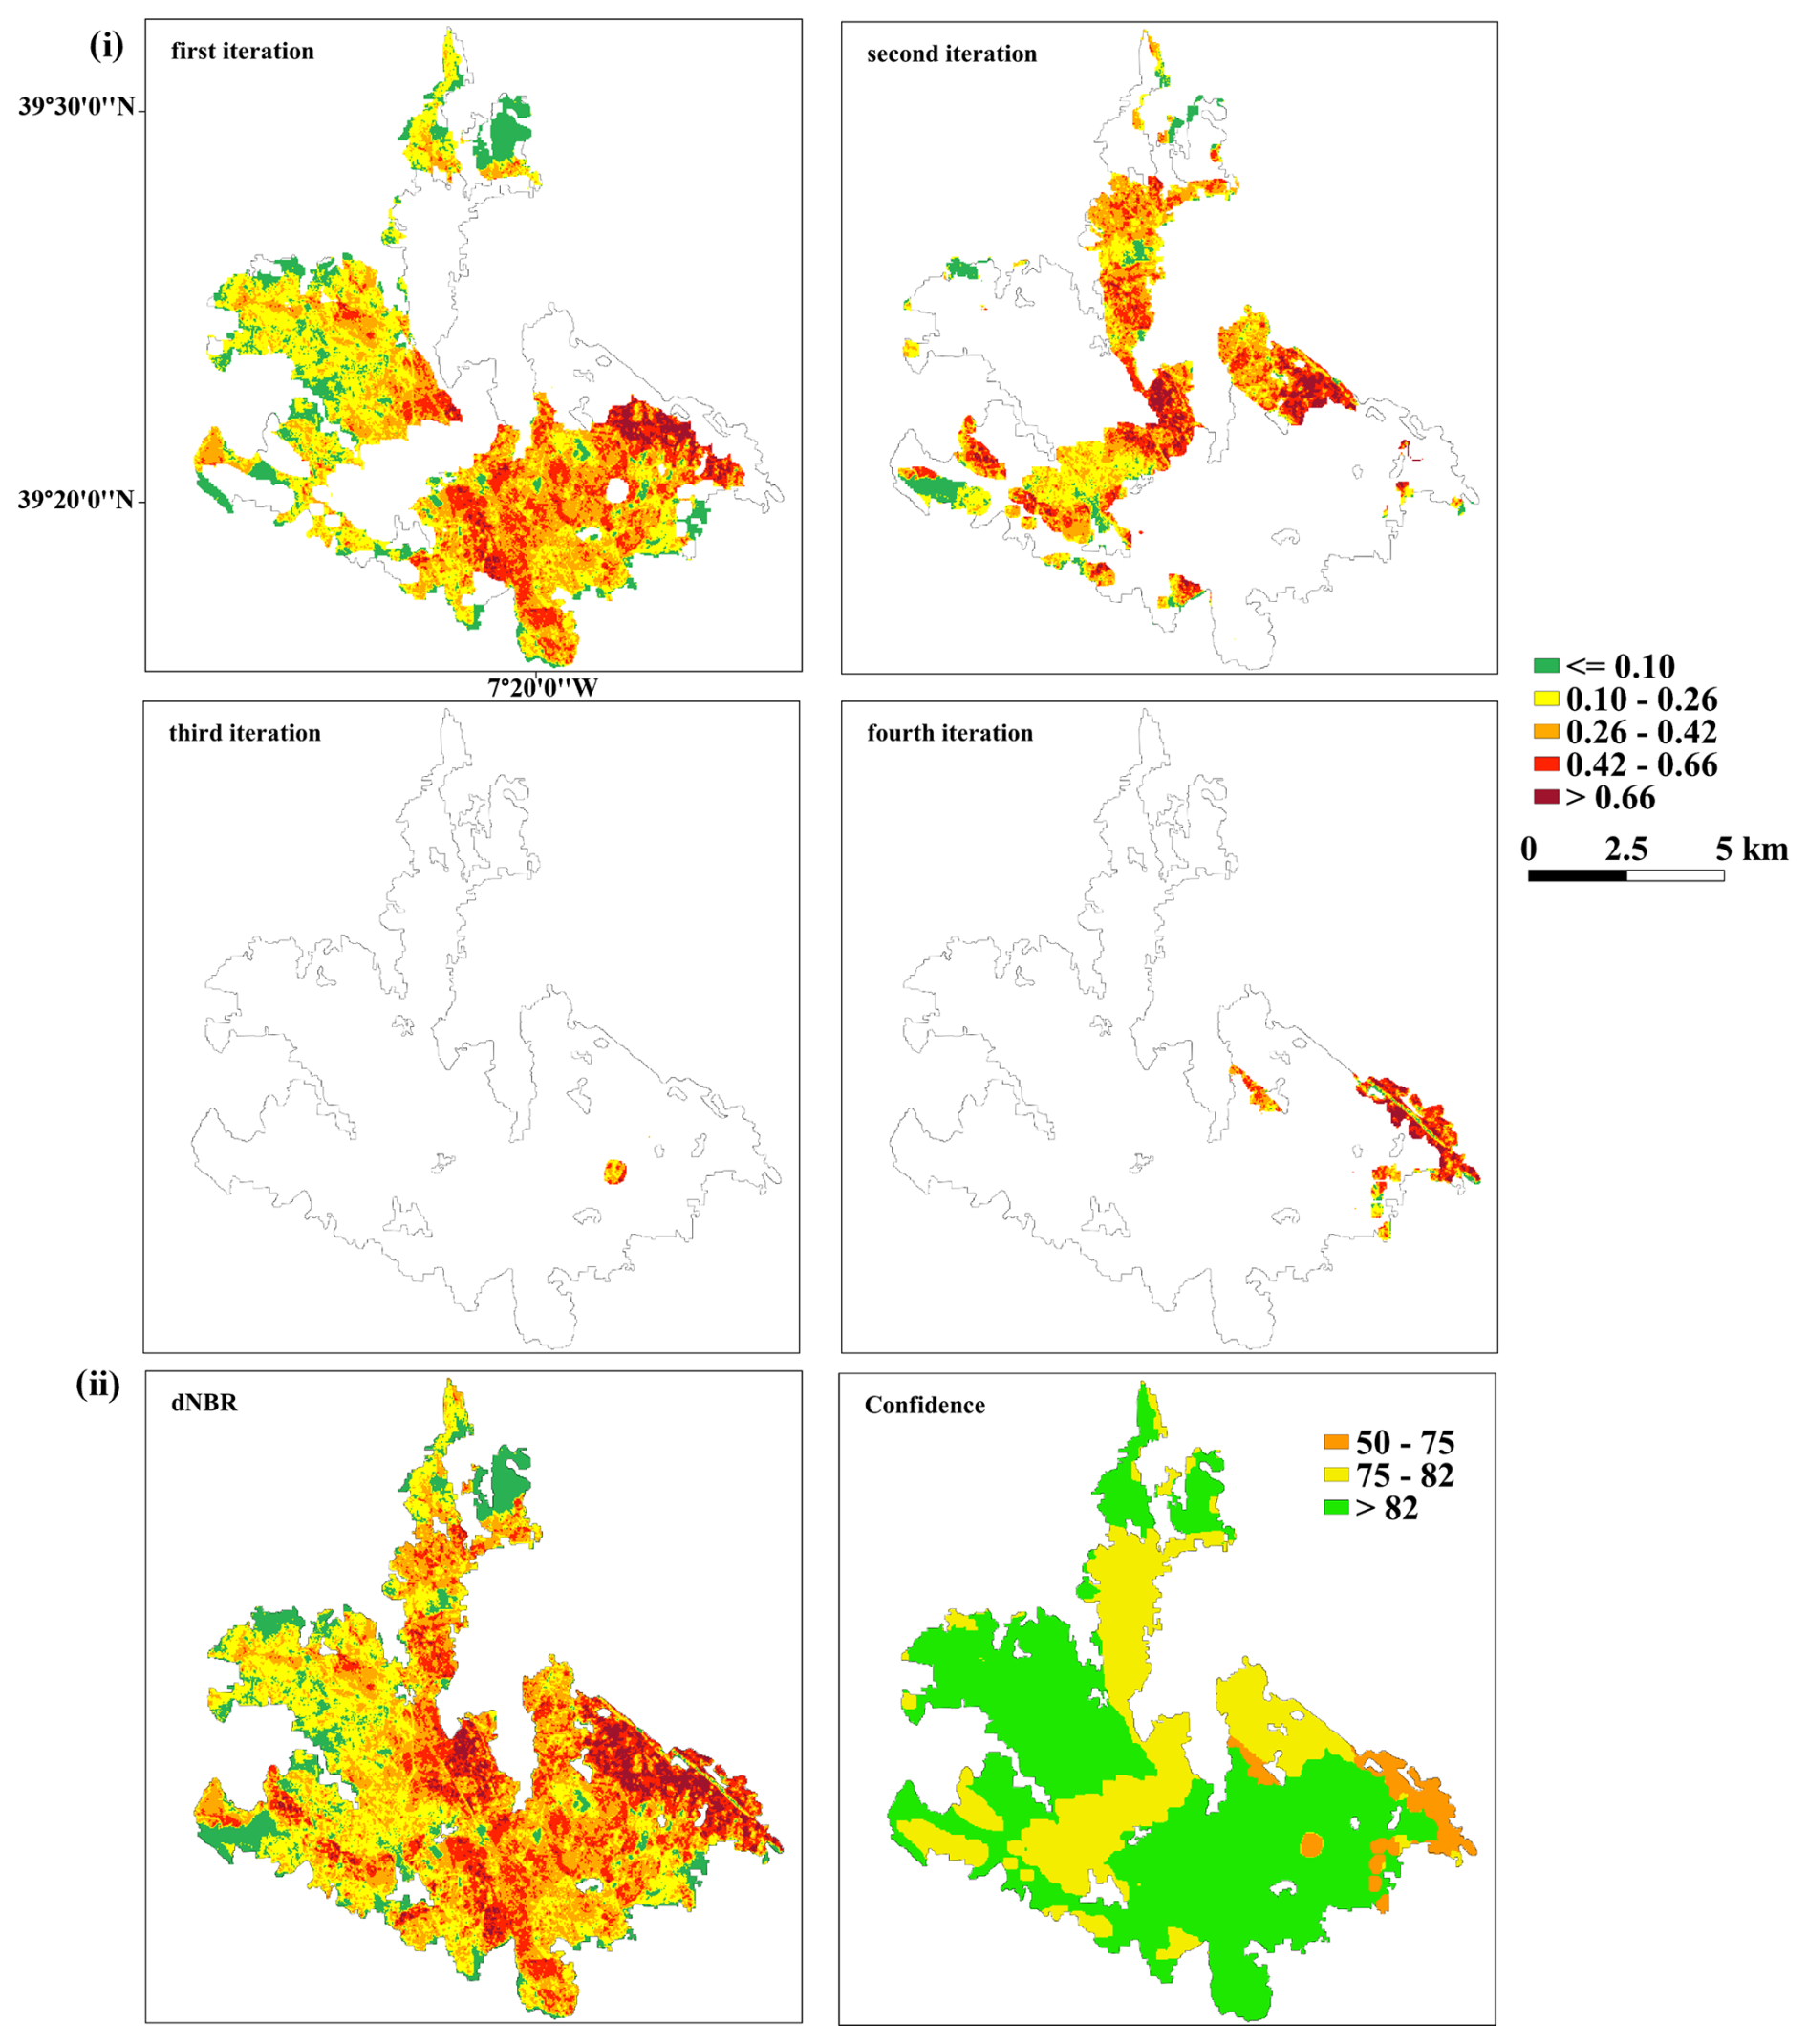
Figure A7Scenario: Post. The dNBR estimation for the whole area of this fire (area = 8571 ha, year = 2003, and ID = 2416) was obtained through four iterations. The first iteration included the highest-suitability pre- and post-fire images, covering an area of 5568 ha; the second iteration included the highest-suitability pre-fire image and the second-highest-suitability post-fire image, covering an area of 2626 ha; the third iteration included the highest-suitability pre-fire image and the third-highest-suitability post-fire image, covering an area of 30 ha; and the fourth iteration was with the highest-suitability pre-fire image and fourth-highest-suitability post-fire image, covering an area of 347 ha). Panel (i) shows the iteration steps, while (ii) shows the final dNBR and confidence maps of this fire.
Table B1Annual table summarizing all data regarding total area of burned areas, total area of valid burned areas, total area with dNBR estimation, number of all and valid burned areas, and percentages of areas with dNBR estimations.
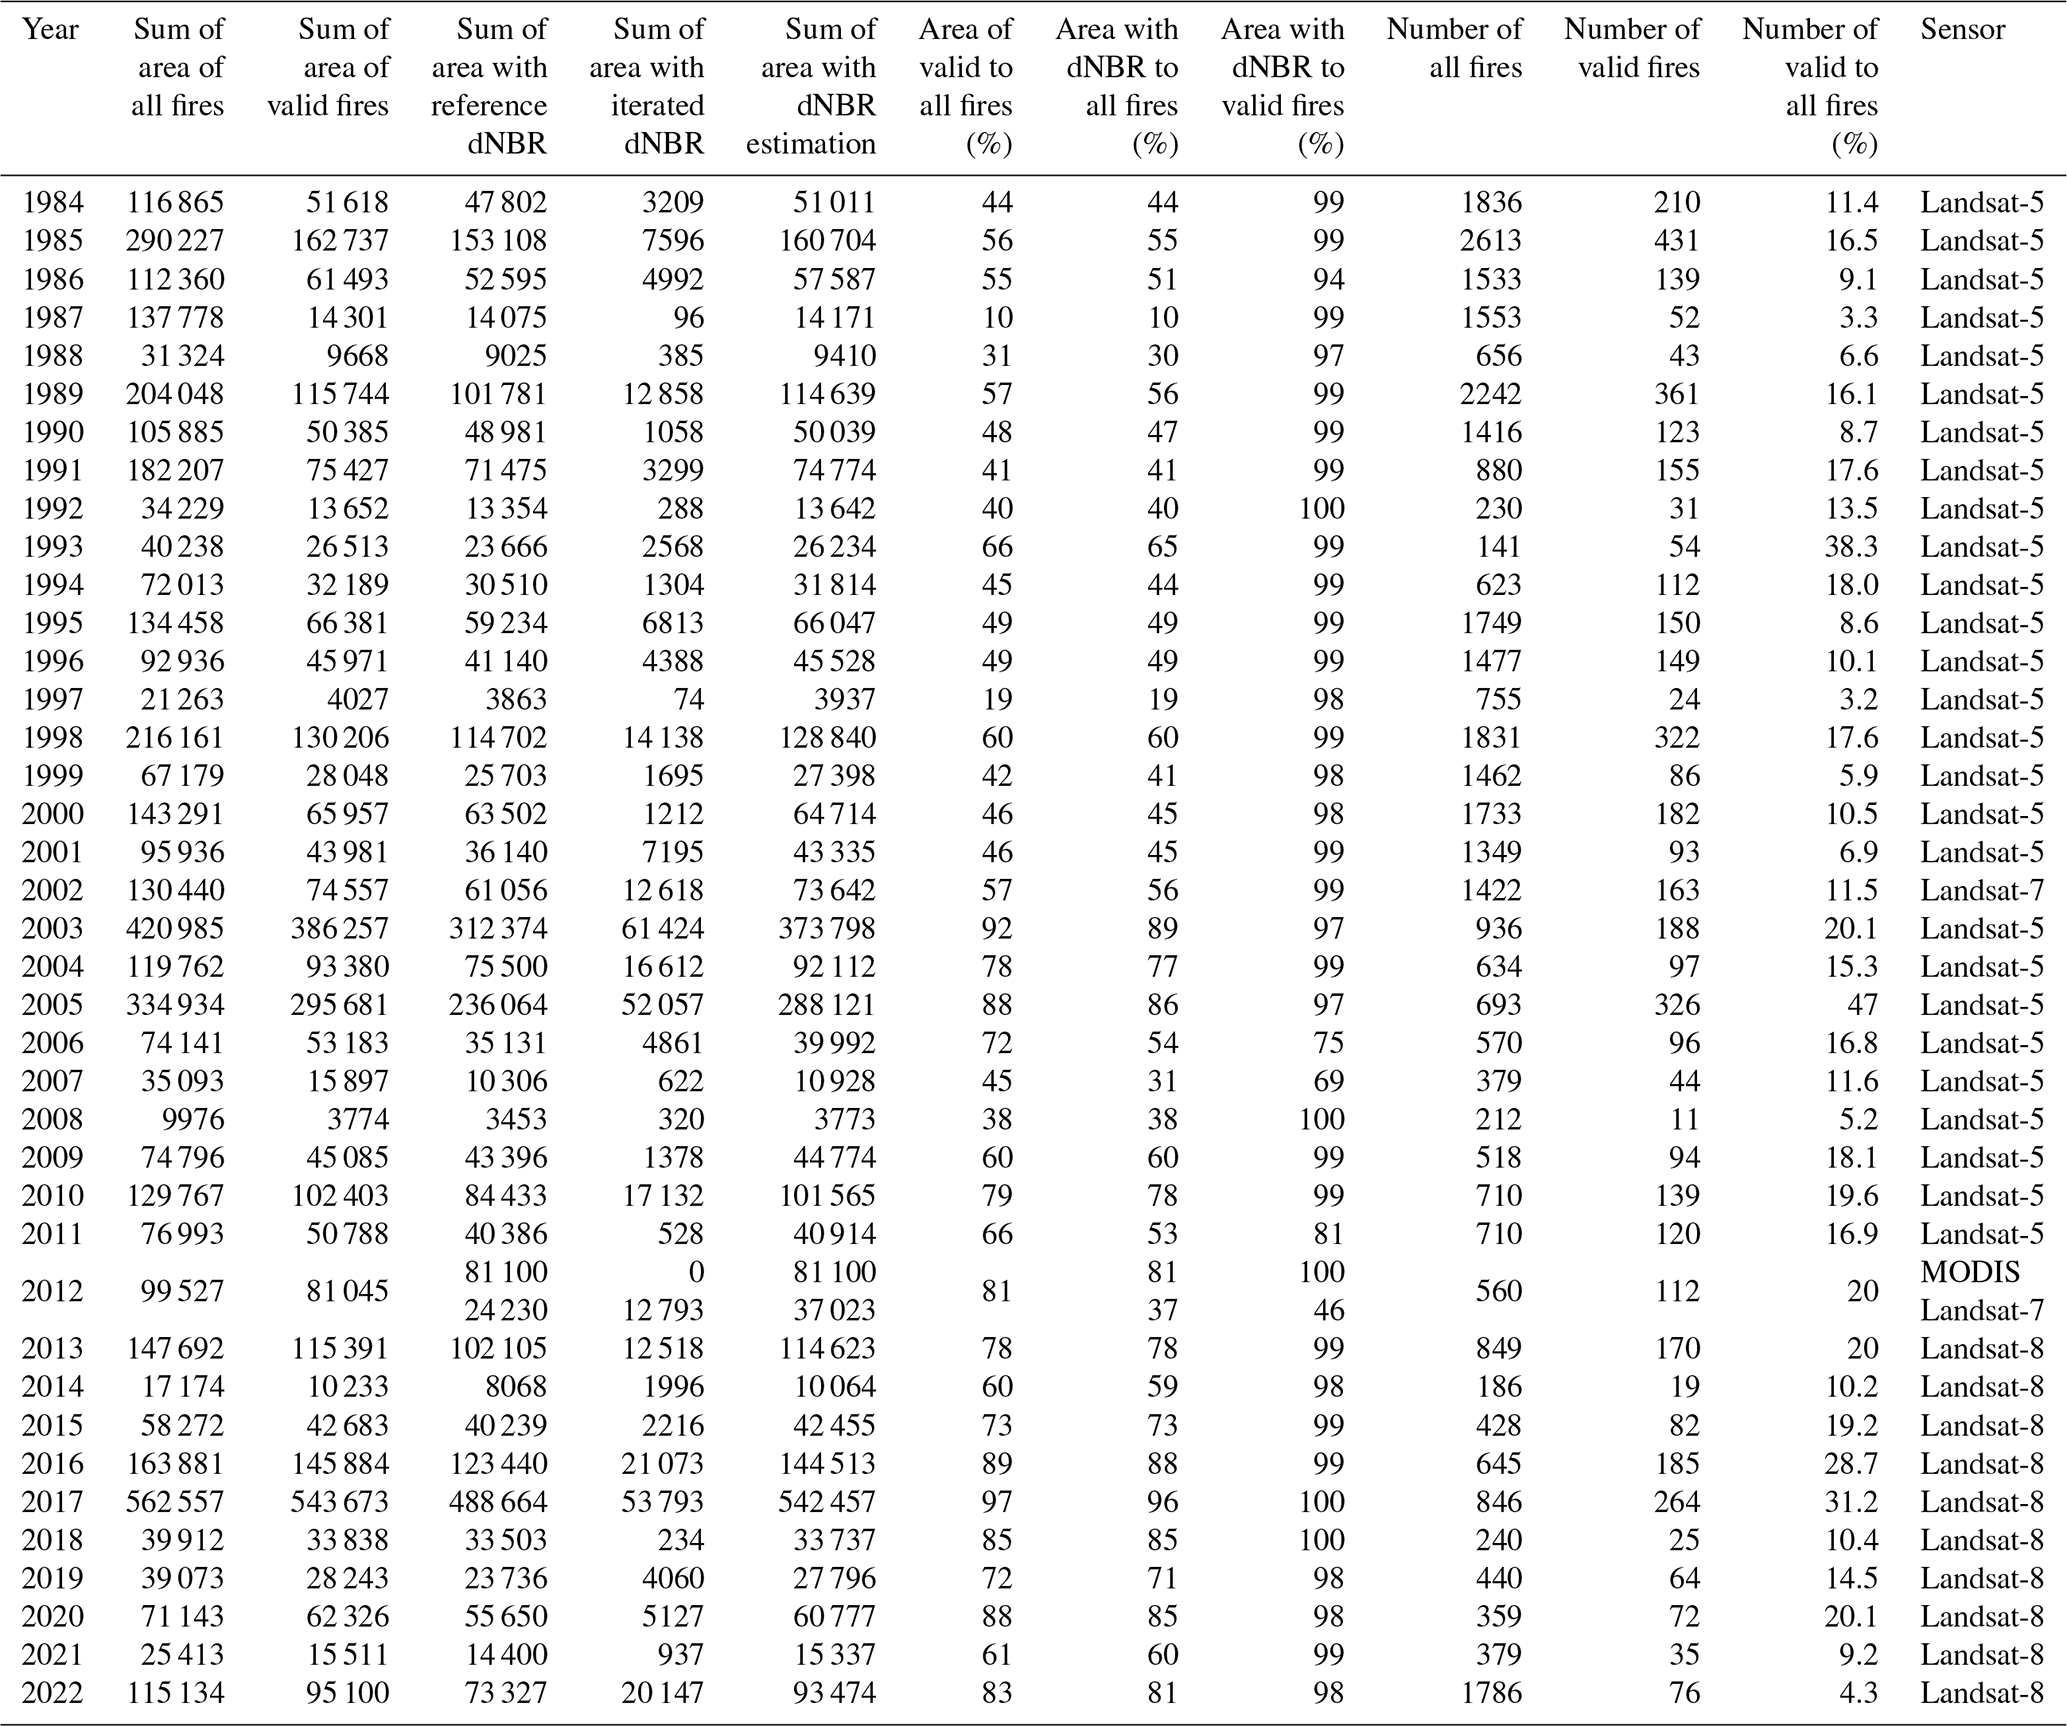
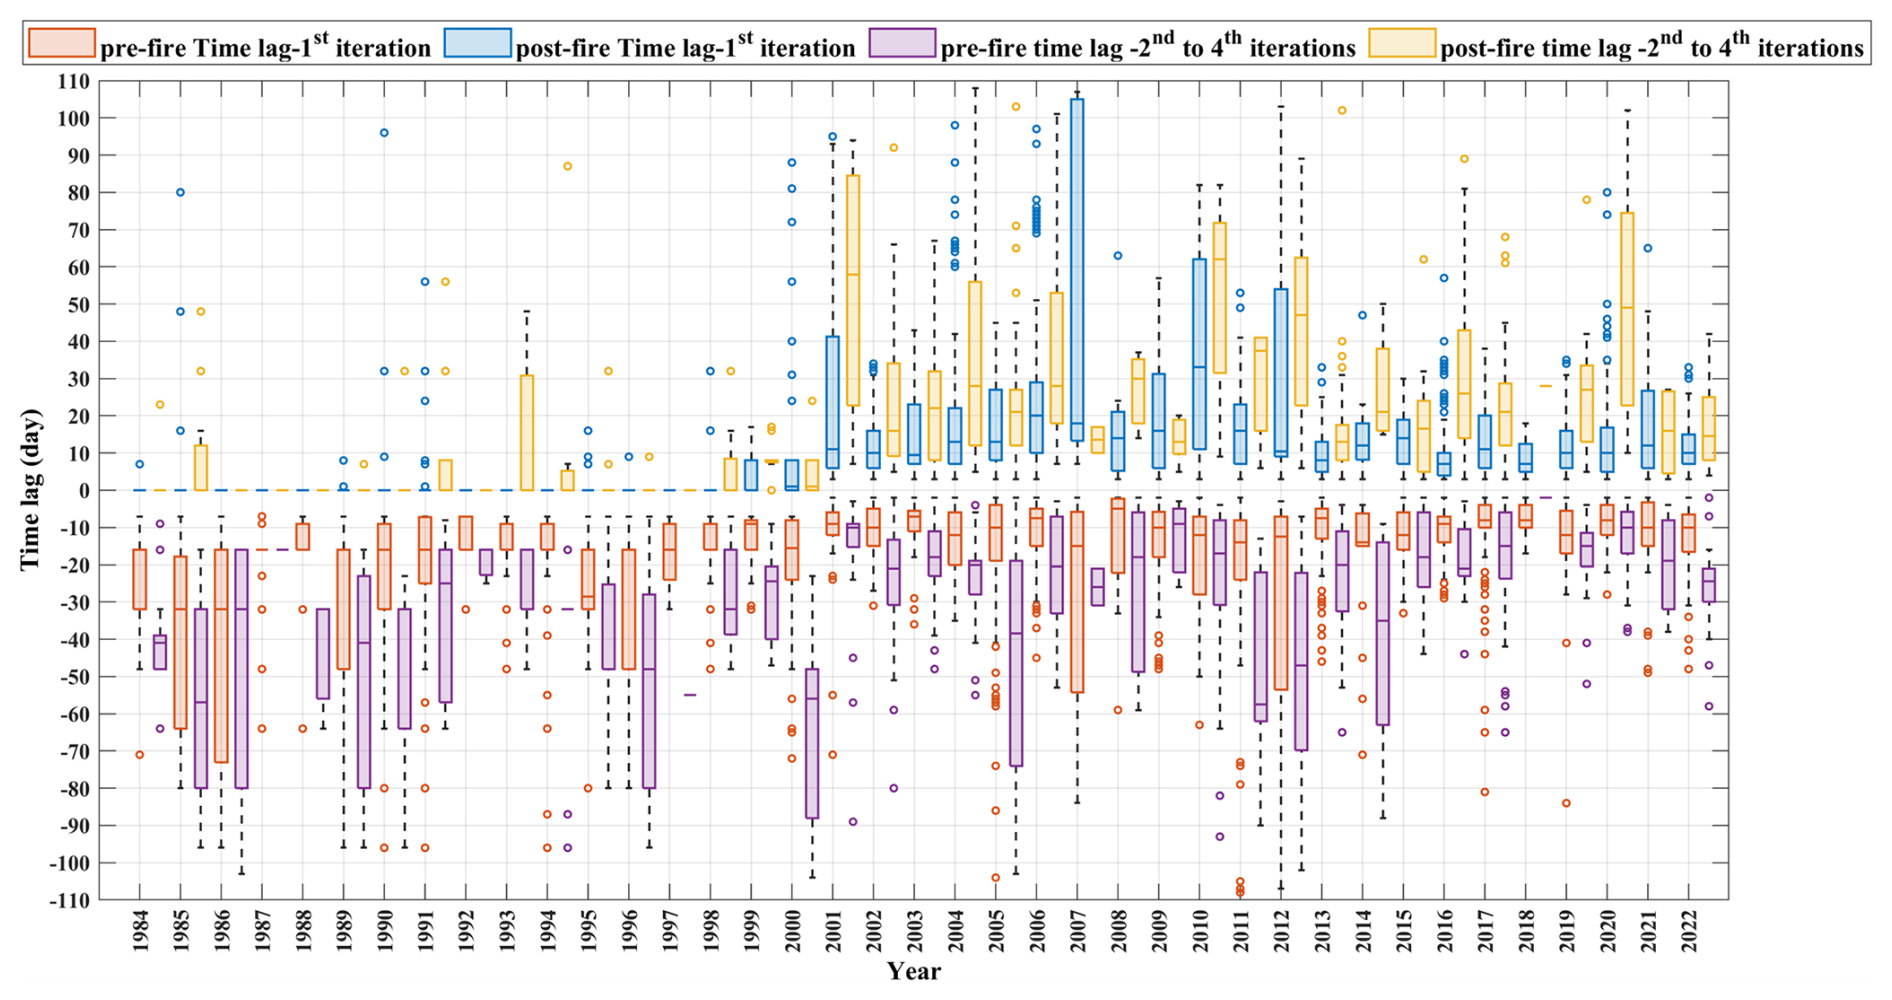
Figure B1The annual variability in pre- and post-fire time lags in units of days is presented for both the first and second to fourth iterations. Negative values represent pre-fire time lags, and positive ones show post-fire time lags.
DJ and AB designed the study. AB and JP provided the initial corrected fire data. DJ applied secondary corrections to the fire data, developed the code in GEE, developed and processed the severity maps, and wrote the first draft of the paper. AB, OGP, and JP reviewed and provided comments on the first draft. DJ applied the comments and finalized the paper.
The contact author has declared that none of the authors has any competing interests.
Publisher's note: Copernicus Publications remains neutral with regard to jurisdictional claims made in the text, published maps, institutional affiliations, or any other geographical representation in this paper. While Copernicus Publications makes every effort to include appropriate place names, the final responsibility lies with the authors.
This article is part of the special issue “Methodological innovations for the analysis and management of compound risk and multi-risk, including climate-related and geophysical hazards (NHESS/ESD/ESSD/GC/HESS inter-journal SI)”. It is not associated with a conference.
We thank Bruno Aparício, Chiara Bruni, and Beatriz Lourenço for their contributions in applying the primary correction to the fire data for the fires of 2001 to 2022. We acknowledge the Portuguese Foundation for Science and Technology (FCT) for the funding through FRISCO (grant no. PCIF/MPG/0044/2018), the project through which the initial idea of a burn severity atlas for Portugal was first introduced. Special thanks are given to FCT for the financial support of Dina Jahanianfard through the national PhD grant (https://doi.org/10.54499/2021.08094.BD). Thanks are due to FCT/MCTES for the financial support for CESAM (UIDP/50017/2020, UIDB/50017/2020, and LA/P/0094/2020) and to the University of Aveiro for the assistant research contract of Oscar González-Pelayo (grant no. CDLCTTRI-97-ARH/2018, REF. 190-97-ARH/2018). The Forest Research Centre, a research unit, was funded by FCT (UIDB/00239/2020). Akli Benali was funded by FCT through a CEEC contract (CEECIND/03799/2018/CP1563/CT0003).
Dina Jahanianfard is supported by the Portuguese Foundation for Science and Technology (FCT-Fundação para a Ciência e Tecnologia) with a PhD grant reference (https://doi.org/10.54499/2021.08094.BD).
This paper was edited by Aloïs Tilloy and reviewed by Emma McClure and two anonymous referees.
Addison, P. and Oommen, T.: Utilizing satellite radar remote sensing for burn severity estimation, Int. J. Appl. Earth Obs., 73, 292–299, https://doi.org/10.1016/j.jag.2018.07.002, 2018.
Alonso-González, E. and Fernández-García, V.: MOSEV: a global burn severity database from MODIS (2000–2020), Earth Syst. Sci. Data, 13, 1925–1938, https://doi.org/10.5194/essd-13-1925-2021, 2021.
Amerh, A., Simon, A., Atta, T., and Richard, D.: A review of the effects of forest fire on soil properties, J. Forestry Res., 33, 1419–1441, https://doi.org/10.1007/s11676-022-01475-4, 2022.
Balata, D., Gama, I., Domingos, T., and Proença, V.: Using satellite NDVI time-series to monitor grazing effects on vegetation productivity and phenology in heterogeneous Mediterranean forests, Remote Sens., 14, https://doi.org/10.3390/rs14102322, 2022.
Beighley, M. and Hyde, A. C.: Portugal wildfire management in a new era assessing fire risks, resources and reforms, University of Lisbon, https://www.isa.ulisboa.pt/en/cef/news/north-american-report-on-the-portuguese-wildfires (last access: 1 May 2024), 2018.
Benali, A., Russo, A., Sá, A. C. L., Pinto, R. M. S., Price, O., Koutsias, N., and Pereira, J. M. C.: Determining fire dates and locating ignition points with satellite data, Remote Sens., 8, https://doi.org/10.3390/rs8040326, 2016.
Botella-Martínez, M. A. and Fernández-Manso, A.: Estudio de la severidad post-incendio en la comunidad Valenciana comparando los índices dNBR, RdNBR y RBR a partir de imágenes landsat 8, Rev. Teledetec., 2017, 33–47, https://doi.org/10.4995/raet.2017.7095, 2017.
Buonanduci, M. S., Donato, D. C., Halofsky, J. S., Kennedy, M. C., and Harvey, B. J.: Consistent spatial scaling of high-severity wildfire can inform expected future patterns of burn severity, Ecol. Lett., 26, 1687–1699, https://doi.org/10.1111/ele.14282, 2023.
Cansler, C. A. and McKenzie, D.: How robust are burn severity indices when applied in a new region? Evaluation of alternate field-based and remote-sensing methods, Remote Sens., 4, 456–483, https://doi.org/10.3390/rs4020456, 2012.
Carille, J. A., Crowley, M. A., Saah, D., and Clinton, N. E.: Cloud-based remote sensing with Google Earth Engine, edited by: Cardille, J. A., Crowley, M. A., Saah, D., and Clinton, N. E., Springer Nature Switzerland AG, 105–109, https://doi.org/10.1007/978-3-031-26588-4, 2024.
Chander, G., Markham, B. L., and Helder, D. L.: Summary of current radiometric calibration coefficients for Landsat MSS, TM, ETM+, and EO-1 ALI sensors, Remote Sens. Environ., 113, 893–903, https://doi.org/10.1016/j.rse.2009.01.007, 2009.
Chu, T. and Guo, X.: Remote sensing techniques in monitoring post-fire effects and patterns of forest recovery in boreal forest regions: A review, Journal of Remote Sensing, 6, 470–520, https://doi.org/10.3390/rs6010470, 2014.
Dillon, G. K., Holden, Z. A., Morgan, P., Crimmins, M. A., Heyerdahl, E. K., and Luce, C. H.: Both topography and climate affected forest and woodland burn severity in two regions of the western US, 1984 to 2006, Ecosphere, 2, https://doi.org/10.1890/ES11-00271.1, 2006.
Divisão de Defesa da Floresta Contra Incêndios (DGRF): Incêndios florestais, relatório de 2005, Lisboa, 2006.
Dos Santos, S. M. B., Bento-Gonçalves, A., Franca-Rocha, W., and Baptista, G.: Assessment of burned forest area severity and postfire regrowth in Chapada Diamantina national park (Bahia, Brazil) using dNBR and RdNBR spectral indices, Geosciences, 10, https://doi.org/10.3390/geosciences10030106, 2020.
EarthExplorer: Online platform-the U.S. Geological Survey, https://earthexplorer.usgs.gov/, last access: 9 January 2025.
Eidenshink, J., Schwind, B., Brewer, K., Zhu, Z.-L., Quayle, B., Howard, S., Falls, S., and Falls, S.: A project for monitoring trends in burn severity, Fire Ecol., 3, 3–21, https://doi.org/10.4996/fireecology.0301003, 2007.
Ermitão, T., Páscoa, P., Trigo, I., Alonso, C., and Gouveia, C.: Mapping the most susceptible regions to fire in Portugal, Fire, 6, https://doi.org/10.3390/fire6070254, 2023.
European Commission: JRC Technical Report Forest Fires in Europe, Middle East and North Africa 2018, European Commission, 1–178, https://doi.org/10.2760/561734, 2018.
Fernandes, P. M.: Combining forest structure data and fuel modelling to classify fire hazard in Portugal, Ann. For. Sci., 66, 415, https://doi.org/10.1051/forest/2009013, 2009.
Fernandes, P. M., Monteiro-Henriques, T., Guiomar, N., Loureiro, C., and Barros, A. M. G.: Bottom-Up Variables Govern Large-Fire Size in Portugal, Ecosystems, 19, 1362–1375, https://doi.org/10.1007/s10021-016-0010-2, 2016.
Fernández-García, V., Santamarta, M., Fernández-Manso, A., Quintano, C., Marcos, E., and Calvo, L.: Burn severity metrics in fire-prone pine ecosystems along a climatic gradient using Landsat imagery, Remote Sens. Environ., 206, 205–217, https://doi.org/10.1016/j.rse.2017.12.029, 2018.
Fernández-García, V., Beltrán-Marcos, D., Fernández-Guisuraga, J. M., Marcos, E., and Calvo, L.: Predicting potential wildfire severity across Southern Europe with global data sources, Science of the Total Environment journal, 829, https://doi.org/10.1016/j.scitotenv.2022.154729, 2022.
Fernández-Guisuraga, J. M. and Fernandes, P. M.: Prescribed burning mitigates the severity of subsequent wildfires in Mediterranean shrublands, Fire Ecol., https://doi.org/10.1186/s42408-023-00233-z, 2024.
Fernández-Guisuraga, J. M., Suárez-Seoane, S., García-Llamas, P., and Calvo, L.: Vegetation structure parameters determine high burn severity likelihood in different ecosystem types: A case study in a burned Mediterranean landscape, J. Environ. Manage., 288, https://doi.org/10.1016/j.jenvman.2021.112462, 2021.
Fernández-Guisuraga, J. M., Fernandes, P. M., Marcos, E., Beltr, D., Sarricolea, P., Farris, M., and Calvo, L.: Caution is needed across Mediterranean ecosystems when interpreting wall-to-wall fire severity estimates based on spectral indices, Forest Ecol. Manag., 546, https://doi.org/10.1016/j.foreco.2023.121383, 2023a.
Fernández-Guisuraga, J. M., Martins, S., and Fernandes, P. M.: Characterization of biophysical contexts leading to severe wildfires in Portugal and their environmental controls, Sci. Total Environ. J., 875, 162575, https://doi.org/10.1016/j.scitotenv.2023.162575, 2023b.
Gale, M. G. and Cary, G. J.: What determines variation in remotely sensed fire severity? Consideration of remote sensing limitations and confounding factors, Int. J. Wildland Fire, 31, 291–305, https://doi.org/10.1071/WF21131, 2022.
Gao, F., Masek, J., Schwaller, M., and Hall, F.: On the blending of the Landsat and MODIS surface reflectance: Predicting daily Landsat surface reflectance, IEEE T. Geosci. Remote Sens., 44, 2207–2218, https://doi.org/10.1109/TGRS.2006.872081, 2006.
Gao, X., Huete, A. R., Ni, W., and Miura, T.: Optical-biophysical relationships of vegetation spectra without background contamination, Remote Sens. Environ., 74, 609–620, https://doi.org/10.1016/S0034-4257(00)00150-4, 2000.
García-Llamas, P., Suárez-Seoane, S., Fernández-Guisuraga, J. M., Fernández-García, V., Fernández-Manso, A., Quintano, C., Taboada, A., Marcos, E., and Calvo, L.: Evaluation and comparison of Landsat 8, Sentinel-2 and Deimos-1 remote sensing indices for assessing burn severity in Mediterranean fire-prone ecosystems, Int. J. Appl. Earth Obs., 80, 137–144, https://doi.org/10.1016/j.jag.2019.04.006, 2019.
González-Pelayo, O., Prats, S. A., AMD, V., DCS, V., Maia, P., and Keizer, J. J.: Impacts of barley (Hordeum vulgare L.) straw mulch on post-fire soil erosion and ground vegetation recovery in a strawberry tree (Arbutus unedo L.) stand, Ecol. Eng., 195, https://doi.org/10.1016/j.ecoleng.2023.107074, 2023.
González-Pelayo, O., Prats, S. A., van den Elsen, E., Malvar, M. C., Ritsema, C., Bautista, S., and Keizer, J. J.: The effects of wildfire frequency on post-fire soil surface water dynamics, Eur. J. For. Res., 143, 493–508, https://doi.org/10.1007/s10342-023-01635-z, 2024.
Guindon, L., Gauthier, S., Manka, F., Parisien, M., Whitman, E., Bernier, P., Beaudoin, A., Villemaire, P., and Skakun, R.: Trends in wildfire burn severity across Canada, 1985 to 2015, Canadian Journal of Forest Research, 1244, 1230–1244, 2021.
Hoang, N. T. and Koike, K.: Comparison of hyperspectral transformation accuracies of multispectral Landsat TM, ETM+, OLI and EO-1 ALI images for detecting minerals in a geothermal prospect area, ISPRS J. Photogramm. Remote Sens., 137, 15–28, https://doi.org/10.1016/j.isprsjprs.2018.01.007, 2018.
Holsinger, L. M., Parks, S. A., Saperstein, L. B., Loehman, R. A., Whitman, E., Barnes, J., and Parisien, M. A.: Improved fire severity mapping in the North American boreal forest using a hybrid composite method, Remote Sens. Ecol. Conserv., 1–14, https://doi.org/10.1002/rse2.238, 2021.
Howe, A. A., Parks, S. A., Harvey, B. J., Saberi, S. J., Lutz, J. A., and Yocom, L. L.: Comparing Sentinel-2 and Landsat 8 for burn severity mapping in Western North America, Remote Sens., 14, 1–21, https://doi.org/10.3390/rs14205249, 2022.
ICNF: Tojeiro – Monchique e Portimão|Relatório de Estabilização de Emergência Pós-incêndio, ICNF, 2021.
Instituto da Conservação da Natureza e das Florestas (ICNF): Territórios ardidos, https://sig.icnf.pt/portal/home/, last access: 10 March 2021.
Jahanianfard, D.: DinaJahanianfard/Portuguese-Burn-Severity-Atlas_v2: Multidecadal satellite-derived Portuguese Burn Severity Atlas (1984–2022) (Version v2), Zenodo [code], https://doi.org/10.5281/zenodo.17160468, 2025.
Jahanianfard, D., Parente, J., Gonzalez-Pelayo, O., and Benali, A.: Multidecadal satellite-derived Portuguese Burn Severity Atlas (1984–2022), Zenodo [data set], https://doi.org/10.5281/zenodo.12773611, 2025.
Jain, P., Coogan, S. C. P., Subramanian, S. G., Crowley, M., Taylor, S., and Flannigan, M. D.: A review of machine learning applications in wildfire science and management, Environ. Rev., 28, 478–505, https://doi.org/10.1139/er-2020-0019, 2020.
Keeley, J. E.: Fire intensity, fire severity and burn severity: A brief review and suggested usage, Int. J. Wildland Fire, 18, 116–126, https://doi.org/10.1071/WF07049, 2009.
Keeley, J. E., Brennan, T., and Pfaff, A. H.: Fire severity and ecosystem responses following crown fires in California shrublands, Ecol. Appl., 18, 1530–1546, https://doi.org/10.1890/07-0836.1, 2008.
Key, C. H.: Ecological and sampling on defining landscape fire severity, Fire Ecol., 2, 34–59, 2006.
Key, C. H. and Benson, N. C.: Landscape Assessment (LA) sampling and analysis methods, USDA For. Serv.-Gen. Tech. Rep. RMRS-GTR, 1–62, https://research.fs.usda.gov/treesearch/24066 (last access: 1 November 2020), 2006.
Kurbanov, E., Vorobev, O., Lezhnin, S., Sha, J., Wang, J., Li, X., Cole, J., Dergunov, D., and Wang, Y.: Remote sensing of forest burnt area, burn severity, and post-fire recovery: A review, Remote Sens., 14, https://doi.org/10.3390/rs14194714, 2022.
Lentile, L. B., Holden, Z. A., Smith, A. M. S., Falkowski, M. J., Hudak, A. T., Morgan, P., Lewis, S. A., Gessler, P. E., and Benson, N. C.: Remote sensing techniques to assess active fire characteristics and post-fire effects, Int. J. Wildland Fire, 15, 319–345, https://doi.org/10.1071/WF05097, 2006.
Llorens, R., Sobrino, J. A., Fernández, C., Fernández-Alonso, J. M., and Vega, J. A.: A methodology to estimate forest fires burned areas and burn severity degrees using Sentinel-2 data. Application to the October 2017 fires in the Iberian Peninsula, Int. J. Appl. Earth Obs., 95, https://doi.org/10.1016/j.jag.2020.102243, 2021.
Loveland, T. R. and Dwyer, J. L.: Landsat: Building a strong future, Remote Sens. Environ., 122, 22–29, https://doi.org/10.1016/j.rse.2011.09.022, 2012.
Loveland, T. R. and Irons, J. R.: Landsat 8: The plans, the reality, and the legacy, Remote Sens. Environ., 185, 1–6, https://doi.org/10.1016/j.rse.2016.07.033, 2016.
Lutes, D. C., Keane, R. E., Caratti, J. F., Key, C. H., Benson, N. C., Sutherland, S., and Gangi, L. J.: FIREMON: Fire Effects Monitoring and Inventory System, Rocky Mountain Research Station. 1 CD, https://doi.org/10.2737/RMRS-GTR-16, 2006.
Lutz, J. A., Key, C. H., Kolden, C. A., Kane, J. T., and van Wagtendonk, J. W.: Fire frequency, area burned, and severity: A quantitative approach to defining a normal fire year, Fire Ecol., 7, 51–65, https://doi.org/10.4996/fireecology.0702051, 2011.
Mateus, P. and Fernandes, P. M.: Forest fires in Portugal: Dynamics, causes and policies, in: Forest Context and Policies in Portugal, World Forests, edited by: Reboredo, F., Springer International Publishing Switzerland, 97–115, https://doi.org/10.1007/978-3-319-08455-8, 2014.
Meneses, B. M., Reis, E., and Reis, R.: Assessment of the recurrence interval of wildfires in mainland Portugal and the identification of affected LUC patterns identification of affected LUC patterns, Journal of Maps, 5647, https://doi.org/10.1080/17445647.2018.1454351, 2018.
Mihajlovski, B., Fernandes, P. M., Pereira, J. M. C., and Guerra-Hernández, J.: Comparing forest understory fuel classification in Portugal using discrete airborne laser scanning data and satellite multi-source remote sensing data, Fire, https://doi.org/10.3390/fire6090327, 2023.
Miller, C. W., Harvey, B. J., Kane, V. R., Moskal, L. M., and Alvarado, E. C.: Different approaches make comparing studies of burn severity challenging: A review of methods used to link remotely sensed data with the Composite Burn Index, Int. J. Wildland Fire, 1–27, https://doi.org/10.1071/WF22050, 2023.
Miller, J. D. and Thode, A. E.: Quantifying burn severity in a heterogeneous landscape with a relative version of the delta Normalized Burn Ratio (dNBR), Remote Sens. Environ., 109, 66–80, https://doi.org/10.1016/j.rse.2006.12.006, 2006.
Miller, J. D., Knapp, E. E., Key, C. H., Skinner, C. N., Isbell, C. J., Creasy, R. M., and Sherlock, J. W.: Calibration and validation of the relative differenced Normalized Burn Ratio (RdNBR) to three measures of fire severity in the Sierra Nevada and Klamath Mountains, California, USA, Remote Sens. Environ., 113, 645–656, https://doi.org/10.1016/j.rse.2008.11.009, 2009.
MOD09A1.006 Terra Surface Reflectance 8-Day Global 500 m|Earth Engine Data Catalog|Google Developers, https://developers.google.com/earth-engine/datasets/catalog/MODIS_006_MOD09A1, last access: 24 October 2023, https://doi.org/10.5067/MODIS/MOD09A1.006
Mora, C. and Vieira, G.: The climate of Portugal, in: Landscapes and Landforms of Portugal. World Geomorphological Landscapes, Springer, Cham, 33–46, https://doi.org/10.1007/978-3-319-03641-0_2, 2020.
Moreira, F., Ascoli, D., Safford, H., Adams, M. A., Moreno, J. M., Pereira, J. M. C., Catry, F. X., Armesto, J., Bond, W., González, M. E., Curt, T., Koutsias, N., McCaw, L., Price, O., Pausas, J. G., Rigolot, E., Stephens, S., Tavsanoglu, C., Vallejo, V. R., Van Wilgen, B. W., Xanthopoulos, G., and Fernandes, P. M.: Wildfire management in Mediterranean-type regions: Paradigm change needed, Environ. Res. Lett., 15, https://doi.org/10.1088/1748-9326/ab541e, 2020.
Moreno-Ruiz, J. A., Garc, R., and Arbelo, M.: MODIS Sensor capability to burned area mapping – Assessment of performance and improvements provided by the latest standard products in boreal regions, Sensors, https://doi.org/10.3390/s20185423, 2020.
Morresi, D., Marzano, R., Lingua, E., Motta, R., and Garbarino, M.: Mapping burn severity in the western Italian Alps through phenologically coherent reflectance composites derived from Sentinel-2 imagery, Remote Sens. Environ., 269, 112800, https://doi.org/10.1016/j.rse.2021.112800, 2022.
Mueller, S. E., Thode, A. E., Margolis, E. Q., Yocom, L. L., Young, J. D., Iniguez, J. M., Survey, U. S. G., Collins, F., Field, L., Trail, D., and Fe, S.: Climate relationships with increasing wildfire in the southwestern US from 1984 to 2015, Forest Ecol. Manage., 460, 117861, https://doi.org/10.1016/j.foreco.2019.117861, 2020.
Neves, A. K., Campagnolo, M. L., Silva, J. M. N., and Pereira, J. M. C.: A Landsat-based atlas of monthly burned area for Portugal, 1984–2021, Int. J. Appl. Earth Obs., 119, https://doi.org/10.1016/j.jag.2023.103321, 2023.
Nitzsche, N., Schuurman, J., Dias, L., Nunes, J. P., and Parente, J.: Post-fire water contamination risk assessment in Portugal, EGU General Assembly 2023, Vienna, Austria, 24–28 Apr 2023, EGU23-572, https://doi.org/10.5194/egusphere-egu23-572, 2023.
Nitzsche, N., Nunes, J. P., and Parente, J.: Assessing post-fire water quality changes in reservoirs: Insights from a large dataset in Portugal, Sci. Total Environ., 912, 169463, https://doi.org/10.1016/j.scitotenv.2023.169463, 2024.
Nunes, A. N., Lourenço, L., and Meira, A. C. C.: Exploring spatial patterns and drivers of forest fires in Portugal (1980–2014), Sci. Total Environ., 573, 1190–1202, https://doi.org/10.1016/j.scitotenv.2016.03.121, 2016.
Oliveira, S., Gonçalves, A., and Zêzere, J. L.: Reassessing wildfire susceptibility and hazard for mainland Portugal, Sci. Total Environ., 762, 143121, https://doi.org/10.1016/j.scitotenv.2020.143121, 2021.
Oliveira, S. L. J., Pereira, J. M. C., and Carreiras, J. M. B.: Fire frequency analysis in Portugal (1975–2005), using Landsat-based burnt area maps, Int. J. Wildland Fire, https://doi.org/10.1071/WF10131, 2011.
Parente, J., Pereira, M. G., and Tonini, M.: Space-time clustering analysis of wildfires: The influence of dataset characteristics, fire prevention policy decisions, weather and climate, Sci. Total Environ., 559, 151–165, https://doi.org/10.1016/j.scitotenv.2016.03.129, 2016.
Parente, J., Nunes, J. P., Baartman, J., and Föllmi, D.: Testing simple approaches to map sediment mobilisation hotspots after wildfires, Int. J. Wildland Fire, 32, 886–902, https://doi.org/10.1071/WF22145, 2023.
Parks, S. A., Dillon, G. K., and Miller, C.: A new metric for quantifying burn severity: The relativized burn ratio, Remote Sens., 6, 1827–1844, https://doi.org/10.3390/rs6031827, 2014.
Parks, S. A., Miller, C., Abatzoglou, J. T., Holsinger, L. M., Parisien, M. A., and Dobrowski, S. Z.: How will climate change affect wildland fire severity in the western US?, Environ. Res. Lett., 11, https://doi.org/10.1088/1748-9326/11/3/035002, 2016.
Parks, S. A., Holsinger, L. M., Voss, M. A., Loehman, R. A., and Robinson, N. P.: Mean composite fire severity metrics computed with google earth engine offer improved accuracy and expanded mapping potential, Remote Sens., 10, 1–15, https://doi.org/10.3390/rs10060879, 2018.
Pascolini-Campbell, M., Lee, C., Stavros, N., and Fisher, J. B.: ECOSTRESS reveals pre-fire vegetation controls on burn severity for Southern California wildfires of 2020, Global Ecol. Biogeogr., 31, 1976–1989, https://doi.org/10.1111/geb.13526, 2022.
Pausas, J. G. and Fernández-Muñoz, S.: Fire regime changes in the Western Mediterranean Basin: From fuel-limited to drought-driven fire regime, Climatic Change, 110, 215–226, https://doi.org/10.1007/s10584-011-0060-6, 2012.
Perez, M. and Vitale, M.: Landsat-7 ETM+, Landsat-8 OLI, and Sentinel-2 MSI surface reflectance cross-comparison and harmonization over Mediterranean basin area, Remote Sens., 15, https://doi.org/10.3390/rs15164008, 2023.
Petratou, D., Nunes, J. P., Guimarães, M. H., and Prats, S.: Decision-making criteria to shape mulching techniques for fire-prone landscapes, Landscape Ecol., https://doi.org/10.1007/s10980-023-01659-1, 2023.
Picotte, J. J., Peterson, B., Meier, G., and Howard, S. M.: 1984–2010 trends in fire burn severity and area for the conterminous US, Int. J. Wildland Fire, 25, 413–420, https://doi.org/10.1071/WF15039, 2016.
Picotte, J. J., Bhattarai, K., Howard, D., Lecker, J., Epting, J., Quayle, B., Benson, N., and Nelson, K.: Changes to the Monitoring Trends in Burn Severity program mapping production procedures and data products, Fire Ecol., 16, https://doi.org/10.1186/s42408-020-00076-y, 2020.
Poursanidis, D., Chrysoulakis, N., and Mitraka, Z.: Landsat 8 vs. Landsat 5: A comparison based on urban and peri-urban land cover mapping, Int. J. Appl. Earth Obs., 35, 259–269, https://doi.org/10.1016/j.jag.2014.09.010, 2015.
Registo Nacional de Dados Geográficos – Direção-Geral do Território (DGT): Carta Administrativa Oficial de Portugal, https://snig.dgterritorio.gov.pt/rndg/srv/por/catalog.search#/metadata/198497815bf647ecaa990c34c42e932e, last access: 6 February 2024.
Rego, F. and Bacao, F.: Size-dependent pattern of wildfire ignitions in Portugal: when do ignitions turn into big fires?, Landscape Ecology, 1405–1417, https://doi.org/10.1007/s10980-010-9491-0, 2010.
Santis, A. De, Asner, G. P., Vaughan, P. J., and Knapp, D. E.: Mapping burn severity and burning efficiency in California using simulation models and Landsat imagery, Remote Sens. Environ., 114, 1535–1545, https://doi.org/10.1016/j.rse.2010.02.008, 2010.
Singh, S., Singh, H., Sharma, V., Shrivastava, V., Kumar, P., Kanga, S., Sahu, N., Meraj, G., Farooq, M., and Singh, S. K.: Impact of forest fires on air quality in Wolgan Valley, New South Wales, Australia – A mapping and monitoring study using Google Earth Engine, Forests, https://doi.org/10.3390/f13010004, 2022.
Singleton, M. P., Thode, A. E., Sánchez Meador, A. J., and Iniguez, J. M.: Increasing trends in high-severity fire in the southwestern USA from 1984 to 2015, Forest Ecol. Manage., 433, 709–719, https://doi.org/10.1016/j.foreco.2018.11.039, 2019.
Soverel, N. O., Coops, N. C., Perrakis, D. D. B., Daniels, L. D., and Gergel, S. E.: The transferability of a dNBR-derived model to predict burn severity across 10 wildland fires in western Canada, Int. J. Wildland Fire, 20, 518–531, https://doi.org/10.1071/WF10081, 2011.
Storey, J., Scaramuzza, P., and Schmidt, G.: Landsat 7 scan line corrector-off gap-filled product development, in: PECORA 16 Conference Proceedings, 23–27, https://pubs.usgs.gov/publication/70259127, 2005.
Tonini, M., Pereira, M. G., Parente, J., and Orozco, C. V.: Evolution of forest fires in Portugal: from spatio-temporal point events to smoothed density maps, Nat. Hazards, 85, 1489–1510, https://doi.org/10.1007/s11069-016-2637-x, 2017.
USGS Landsat 5 Level 2, Collection 2, Tier 1|Earth Engine Data Catalog|Google Developers, https://doi.org/10.5066/P9IAXOVV, https://developers.google.com/earth-engine/datasets/catalog/LANDSAT_LT05_C02_T1_L2#terms-of-use, last access: 10 December 2021.
USGS Landsat 7 Level 2, Collection 2, Tier 1|Earth Engine Data Catalog|Google Developers, https://doi.org/10.5066/P9C7I13B, https://developers.google.com/earth-engine/datasets/catalog/LANDSAT_LE07_C02_T1_L2, last access: 24 October 2023.
USGS Landsat 8 Level 2, Collection 2, Tier 1|Earth Engine Data Catalog|Google Developers, https://doi.org/10.5066/P9OGBGM6, https://developers.google.com/earth-engine/datasets/catalog/LANDSAT_LC08_C02_T1_L2, last access: 24 October 2023.
Veraverbeke, S., Verstraeten, W. W., Lhermitte, S., and Goossens, R.: Illumination effects on the differenced Normalized Burn Ratio's optimality for assessing fire severity, Int. J. Appl. Earth Obs., 12, 60–70, https://doi.org/10.1016/j.jag.2009.10.004, 2010.
Veraverbeke, S., Hook, S., and Hulley, G.: An alternative spectral index for rapid fire severity assessments, Remote Sens. Environ., 123, 72–80, https://doi.org/10.1016/j.rse.2012.02.025, 2012.
Verbyla, D. L., Kasischke, E. S., and Hoy, E. E.: Seasonal and topographic effects on estimating fire severity from Landsat TM/ETM + data, Int. J. Wildland Fire, 17, 527–534, 2008.
Vieira, D. C. S., Borrelli, P., Jahanianfard, D., Benali, A., Scarpa, S., and Panagos, P.: Wildfires in Europe: Burned soils require attention, Environ. Res., 217, 114936, https://doi.org/10.1016/j.envres.2022.114936, 2023.
Vogelmann, J. E., Gallant, A. L., Shi, H., and Zhu, Z.: Perspectives on monitoring gradual change across the continuity of Landsat sensors using time-series data, Remote Sens. Environ., 185, 258–270, https://doi.org/10.1016/j.rse.2016.02.060, 2016.
Wells, A. G., Hawbaker, T. J., Hiers, J. K., Kean, J., Loehman, R. A., and Steblein, P. F.: Predicting burn severity for integration with post-fire debris-flow hazard assessment: a case study from the Upper Colorado River Basin, USA, Int. J. Wildland Fire, 1315–1331, https://doi.org/10.1071/WF22200, 2021.
Whitman, E., Parisien, M. A., Holsinger, L. M., Park, J., and Parks, S. A.: A method for creating a burn severity atlas: An example from Alberta, Canada, Int. J. Wildland Fire, 29, 995–1008, https://doi.org/10.1071/WF19177, 2020.
Yilmaz, O. S., Acar, U., Sanli, F. B., Gulgen, F., and Ates, A. M.: Mapping burn severity and monitoring CO content in Türkiye's 2021 Wildfires, using Sentinel-2 and Sentinel-5P satellite data on the GEE platform, Earth Sci. Inform., 221–240, https://doi.org/10.1007/s12145-023-00933-9, 2023.
- Abstract
- Introduction
- Data and methods
- Results
- Discussion
- Data availability
- Code availability
- Conclusion
- Appendix A: Supporting material for the methods
- Appendix B: Supporting material for the results
- Author contributions
- Competing interests
- Disclaimer
- Special issue statement
- Acknowledgements
- Financial support
- Review statement
- References