the Creative Commons Attribution 4.0 License.
the Creative Commons Attribution 4.0 License.
 | 26 Sep 2025
Data for modern soil chronometry using fallout radionuclides
Joshua D. Landis
We describe environmental gamma spectrometry data for >700 soil samples collected from >35 high-resolution quantitative soil profiles spanning global sites. The data are collected for the purpose of modern soil chronometry based on fallout radionuclides (FRNs) 7Be and 210Pb, using the Linked Radionuclide Accumulation model (LRC). Cumulative gamma counting time for samples in the database exceeds 6.5 years. This is a living database to be augmented as data become available and corrected with improvements in data reduction, or identification of errors. Versions and changes will be indexed. Special attention is paid to measurement uncertainties in the dataset, and to how atmospheric or excess 210Pb is defined in both geochemical and mathematical terms for use in the LRC model. Basic familiarity with gamma spectrometry and radionuclide decay chains is assumed. The data set can be accessed at https://doi.org/10.17632/cfxkpn6hj9.1 (Landis, 2025).
- Article
(5565 KB) - Full-text XML
- BibTeX
- EndNote


We describe high-precision measurements of environmental radionuclides collected for the purpose of developing modern soil chronometry. Numerous problems such as atmospheric pollutant deposition and carbon sequestration require knowledge of the rates of soil processes that influence metals and carbon through time, but an appropriate chronometry system spanning years to centuries of environmental change has not been available until recent efforts to validate fallout radionuclide (FRN) chronometry (Landis, 2023; Landis et al., 2016, 2024a, b, c). Historically, the impediment to adoption of FRNs in soil systems has been the availability of sufficient instrumental resources to provide long counting times that are necessary for measurement of short-lived 7Be, in datasets large enough to develop appropriate age models (Kaste et al., 2011). Here, we report the fallout radionuclides 7Be and 210Pb, together with bomb pulse 241Am and 137Cs, and ancillary radiogenic isotopes including 226Ra, 228Th, 228Ra, and others, that are used to construct and verify the Linked Radionuclide Accumulation model (LRC). These radionuclides are all measured concurrently by gamma spectrometry in the Fallout Radionuclide Analytics facility (FRNA) at Dartmouth College. The data are accessible at https://doi.org/10.17632/cfxkpn6hj9.1 (Landis, 2025).
LRC is an empirical age model that dates soil organic and mineral matter based on a mass balance comparison between the soil accumulative 7Be : 210Pb ratio (Racc) and the 7Be : 210Pb atmospheric flux ratio (RD) (Landis et al., 2016). The data presented currently include more than 700 samples from over 35 high-resolution quantitative soil pits collected using field methods adapted for this purpose, and more are being added each month (Fig. 1). The method is confirmed by accurately dating the bomb-pulse peak in 241Am (or 137Cs where appropriate) which is known to have occurred in 1963–1964 (Health and Safety Laboratory, 1977). The method is further corroborated by both novel 228Th : 228Ra chronometry and 14C approaches and yields uncertainties on the order of 10 % up to 100 years and 20 % up to 200 years (Landis, 2023; Landis et al., 2024a).
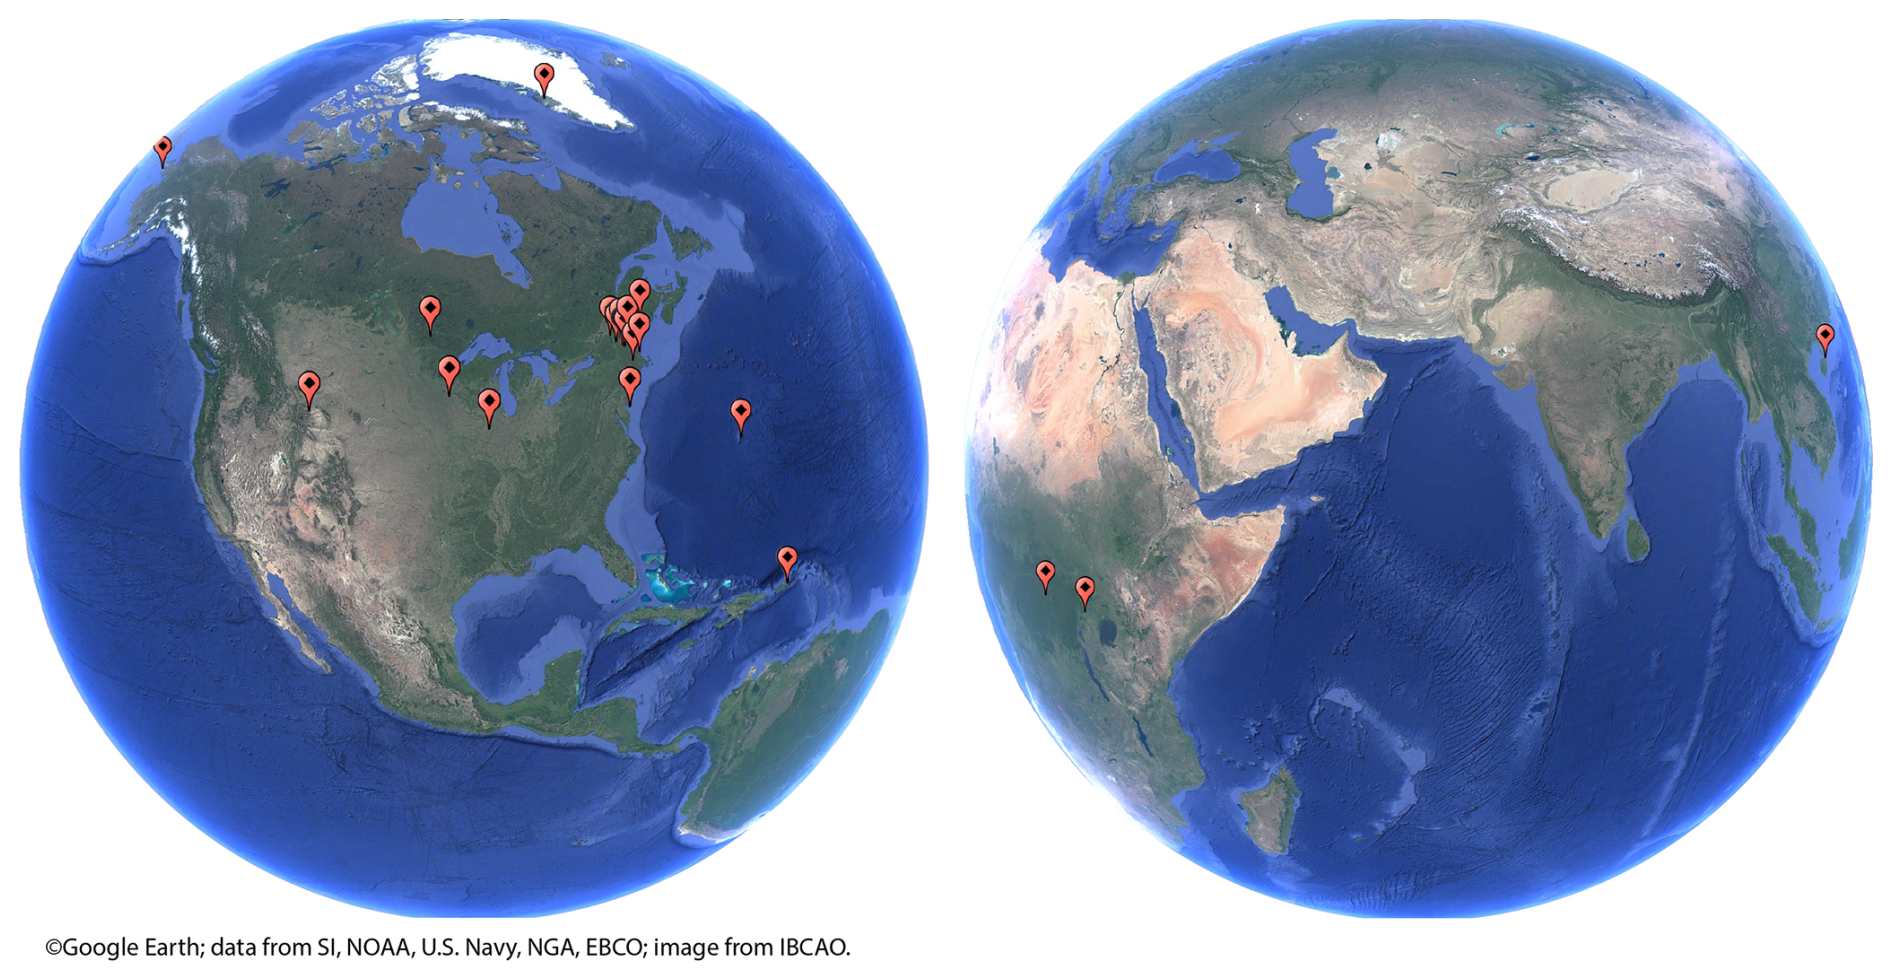
Figure 1Site map for soils collected for modern soil chronometry.
The majority of sampled soils are what we refer to as “reference”, selected to minimize the potential for historical disturbance through development, land use, natural erosion or tree throw over the past 150 years or more. Additional sites may include experimental designs examining hillslope and alluvial or fluvial processes and should not be taken as representative of reference conditions, i.e. with an expectation that the nuclear bomb-pulse can be accurately dated. Implementation of the LRC model is described elsewhere (Landis et al., 2016). Additional details and challenges of environmental gamma spectrometry (Cutshall et al., 1983; Landis et al., 2012; Murray et al., 1987, 2018) or theories of related FRN age models can also be found elsewhere (Arias-Ortiz et al., 2018; Barsanti et al., 2020; Sanchez-Cabeza and Ruiz-Fernández, 2012). Any brief discussion of these topics here is intended only to contextualize the data and thereby provide an entry point for non-specialist readers. A basic understanding of gamma spectrometry and radionuclide decay chains is assumed.
Finally, data validation is discussed with respect to both analytical problems such as instrument calibration, as well as geochemical problems, namely the susceptibility of Rn to diffuse out of samples in the laboratory as well as from soils in situ. A priority of this manuscript is to demonstrate that routine environmental gamma spectrometry is capable percent-level precision that is expected from other capital analytical platforms such as inductively-coupled plasma optical or mass spectrometry used for elemental and isotopic analyses (ICPOES, ICPMS).
2.1 Instrumentation
Data are collected with six Mirion (formerly Canberra) Broad Energy intrinsic germanium detectors (BEGe) with carbon fiber endcaps and ultra-low background cryostats which are cooled with liquid nitrogen. The detectors are shielded with 10 cm of ultra-low background lead. Data acquisition is performed with Mirion DSA-1000 or Lynx digital signal processors running with Genie 2K software v.3. The specific BEGe detector design is important because it provides excellent efficiency at low gamma energies for 210Pb acquisition without sacrificing efficiencies at high energies. Carbon fiber provides good transmission of the low energy 210Pb emission which is otherwise attenuated by an aluminum endcap. Samples are typically run using a standardized four-day count time. Of two detector models, BEGe 3830 (38 cm2 detector active area, 30 mm thickness) and larger BEGe 5030 (50 cm2, 30 mm), the latter saves one day of counting and accomplishes in three days what the 3830 accomplishes in four.
2.2 Sample preparation and geometry
Foliage, litter, and soil samples are oven dried at 60°. Bulk soils are sieved or hand-picked to remove clasts and debris > 2 mm in diameter. Fine roots > 1 mm diameter or > 2 cm in length are removed by hand. Foliage and leaf litter (Oi and Oe horizon) are typically milled to <1 mm using a Wiley mill with stainless steel blades. Soil samples are loosely disaggregated as necessary by agate mortar and pestle and packed into 110 cm3 polyethylene petri dishes with snap closures. The petris are sealed with common electrical tape and rested for >2 weeks to allow for 222Rn ingrowth, although we will show that this approach does not quantitatively retain Rn (see also Murray et al., 1987, 2018). Our handling of the problem of Rn emanation from both laboratory samples and soils in situ is discussed below.
2.3 Calibration and Sample Self-Absorption
Gamma detector calibration is based on geometric efficiency, which is the proportion of photons emitted by the sample that are recorded by the detector, absent sample self-absorption of photons. Net efficiency includes self-absorption, which is dependent on each sample's specific elemental composition. We measure net efficiency directly by using a series of soils/sediment doped 1 % by weight with either uranium ore BL5 or thorium ore OKA2 which are available from Natural Resources Canada Certified Reference Material Project. Geometric efficiency for the standards is then calculated as the quotient of net efficiency and the standard self-absorption coefficient at each photopeak energy (described below). Geometric efficiencies are representative of the detector-sample geometric relationship and applicable to all sample unknown measurements. Efficiencies for photopeaks not represented in the standards are estimated by regression from adjacent photopeaks in the U or Th standards (e.g., 7Be, 241Am, or 137Cs; these are not known to have coincidence summing effects). Reported uncertainties on the standard activities is 0.2 % for U and 1.0 % for Th, and secular equilibrium is assumed for both.
Net efficiency for individual samples is calculated as the product of geometric efficiency determined from standards and the sample self-absorption at each energy of interest (Landis et al., 2012). To do this, self-absorption for each sample is measured using a planar uranium ore source (same diameter as sample) placed directly on top of the sample. This is performed as a second data acquisition following the sample “long count” which does not use the point source. Self-absorption at all energies is calculated using the method of (Cutshall et al., 1983), or in the case of non-uranium series radionuclides, is estimated by linear regression from the U-series photopeaks.
Calibration uncertainty estimated from geometric efficiencies of 6 standards of bulk density ranging from 0.5 to 200 g cm−3 is less than 2 % relative standard deviation for each of our detectors. Uncertainty of sample self-absorption derived from peak integration (below) contributes <1 %. Thus, our net efficiency calibration uncertainties are ∼2 % at the 1σ level.
2.4 Peak integration and activity calculation
A semi-automated peak integration routine is implemented in Excel worksheets (Fig. 2) (Landis et al., 2012). For each detector, peak shape parameters are measured across all energies either within the collected sample spectrum using peaks > 10 000 counts or using prior collection of a high-activity point source spectrum, by least-squares fitting of peaks using the Solver tool and unknowns μ, σ, L, H as below, where x is the channel energy, μ is the peak centroid, σ is Gaussian peak width, and L and H are low and high energy transitions of peak tails to logarithmic rather than Gaussian form.
The peak shape model is then used to estimate the partial area of analyte peaks that are integrated digitally by summation of peak channel count rates. Partial peak integration reduces measurement uncertainty by avoiding peak tails which contribute disproportionately to integration error.
Finally, radionuclide activity A [Bq kg−1] is calculated following Eq. (2), where R is the integrated count rate (gross minus off-peak background count rate), f is the measured attenuation coefficient, ε* is detector geometric efficiency, p is the partial peak integration area, γ is photopeak yield constant, and m is the sample mass [kg−1] (Fig. 2).
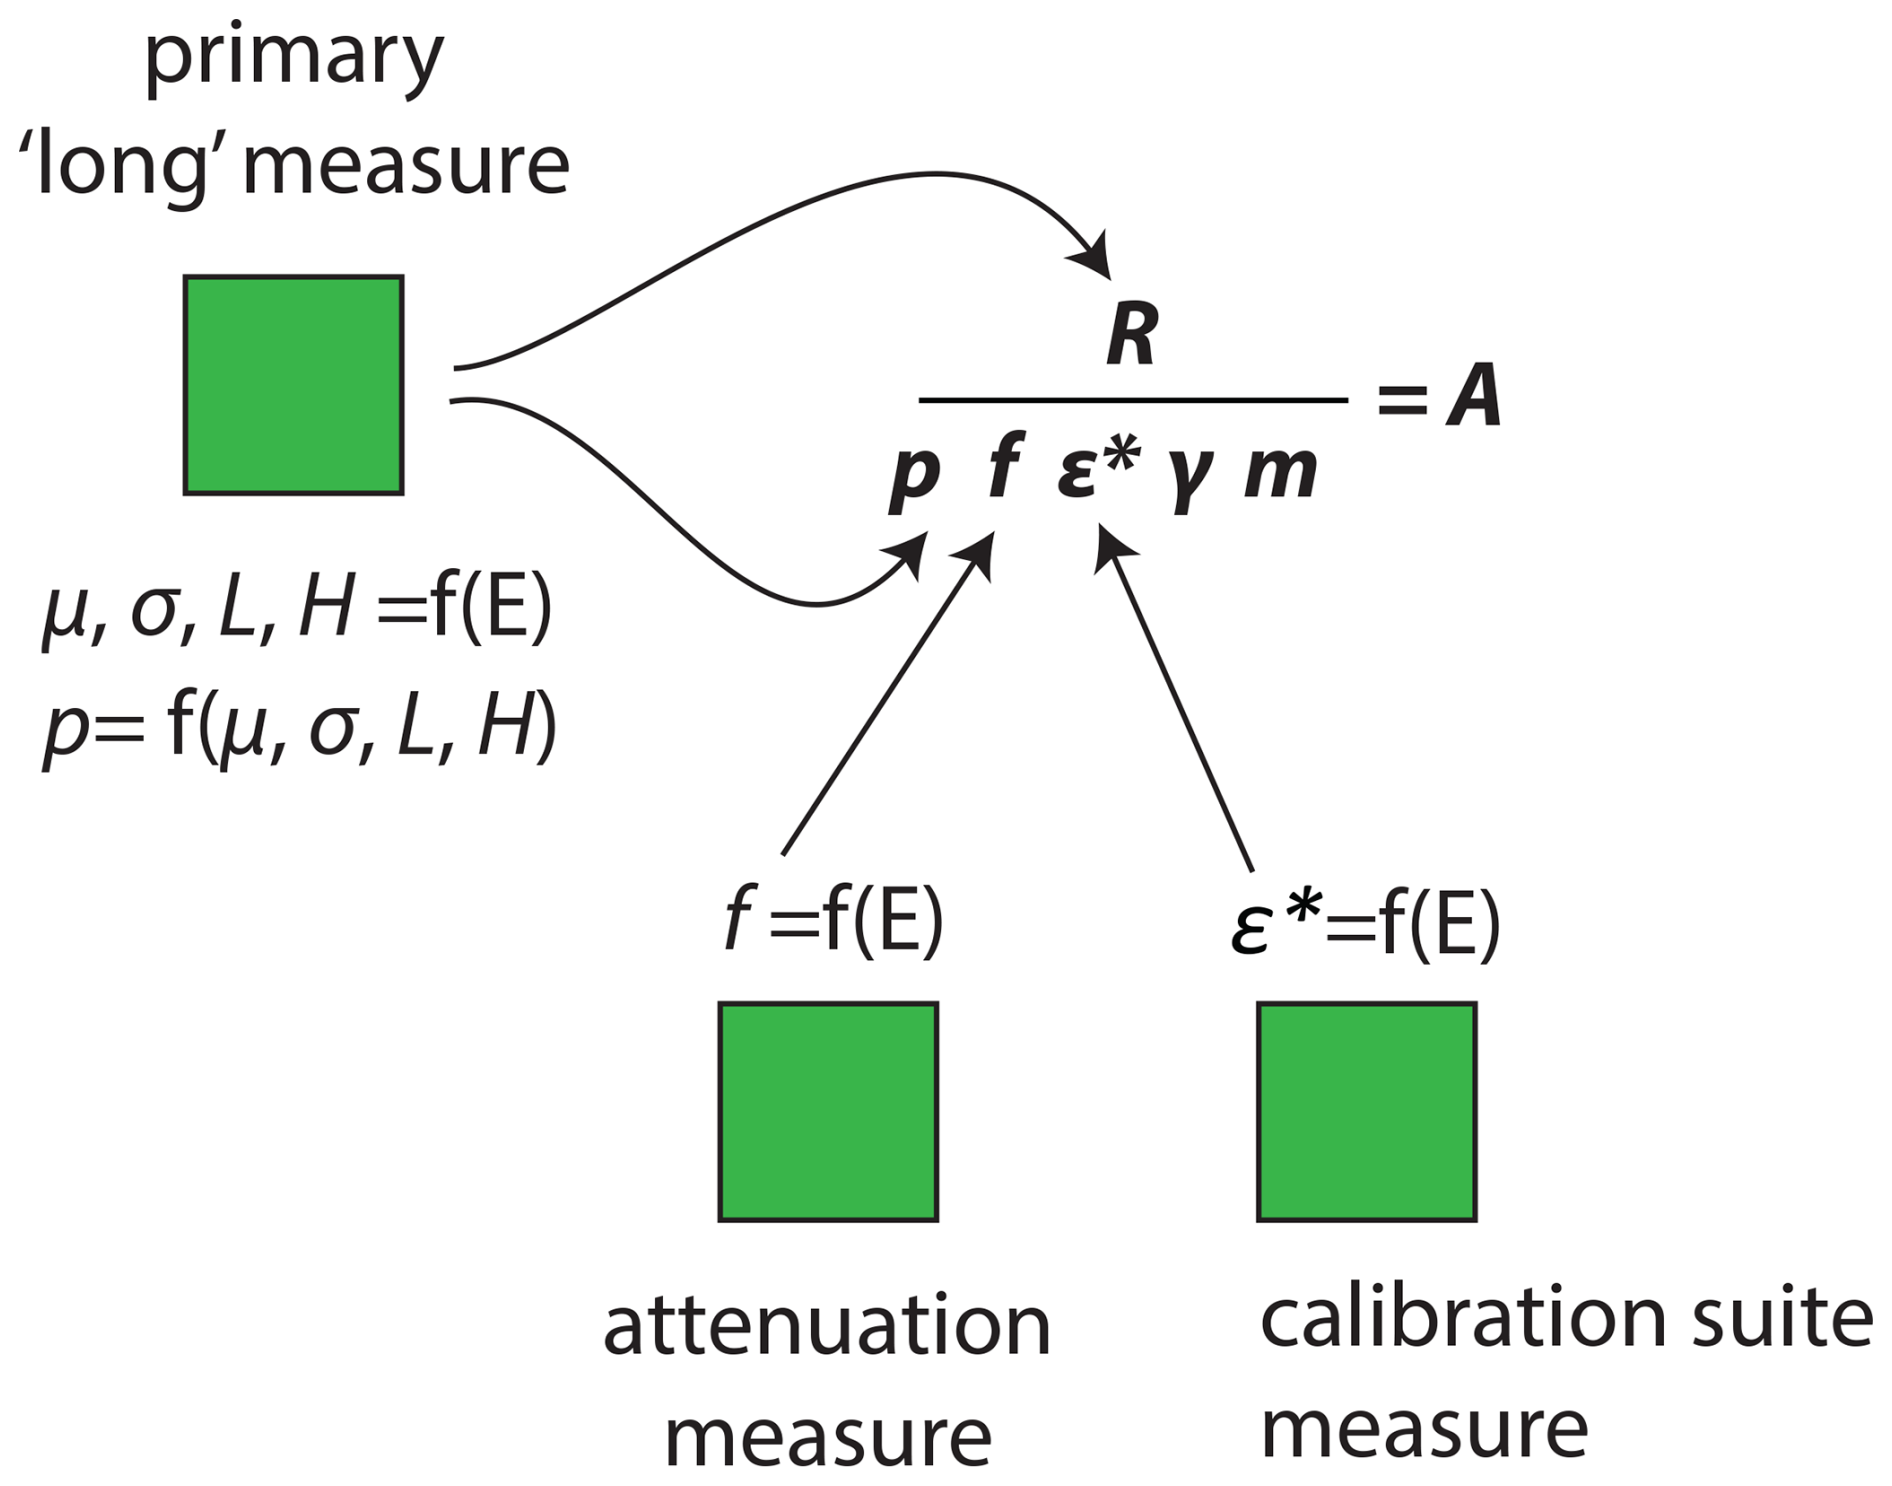
Figure 2Work flow for gamma spectrometry data reduction. Three Excel-based templates are used to process sample, attenuation, and calibration spectra. Required metrics for the fundamental calculation of Eq. (2), the parameters μ, σ, L, H, f, and ε*, are determined as functions of photopeak energy (E).
2.5 Spectral Background Correction
In addition to off-peak background subtraction, all radionuclide peaks are also corrected for on-peak background contributions which are measured with composite background spectra totaling hundreds of days of count time. Backgrounds for each peak may variously include impurities in the detector housing and shielding, ambient Rn in the laboratory, artifacts of the gamma spectrum, and ambient construction materials in the laboratory facility.
2.6 Data Quality and Verification
Environmental gamma spectrometry is capable of producing percent-level precision on par with other capital analytical platforms such as ICP-MS. Precision in gamma spectrometry measures of radionuclide activity is easily documented because many radionuclides emit photons at multiple energies. These typically have variable coincidence summing effects that require correction at each energy, as well as sample self-absorption factors that also require correction at each energy. Concordance among measures of multiple photopeaks spanning the energy spectrum thus provides a robust estimate of precision.
For quality control measures we recommend reporting multi-line means and uncertainties for three radionuclides: 222Rn measured at 214Pb (295, 352 keV) and 214Bi (609 keV); 228Ra measured with up to four emission lines from 228Ac (209, 338, 463, 911 keV); and 228Th measured by 212Pb (238 keV), 208Tl (538 keV), and possibly 224Ra (241 keV) (Fig. 3).
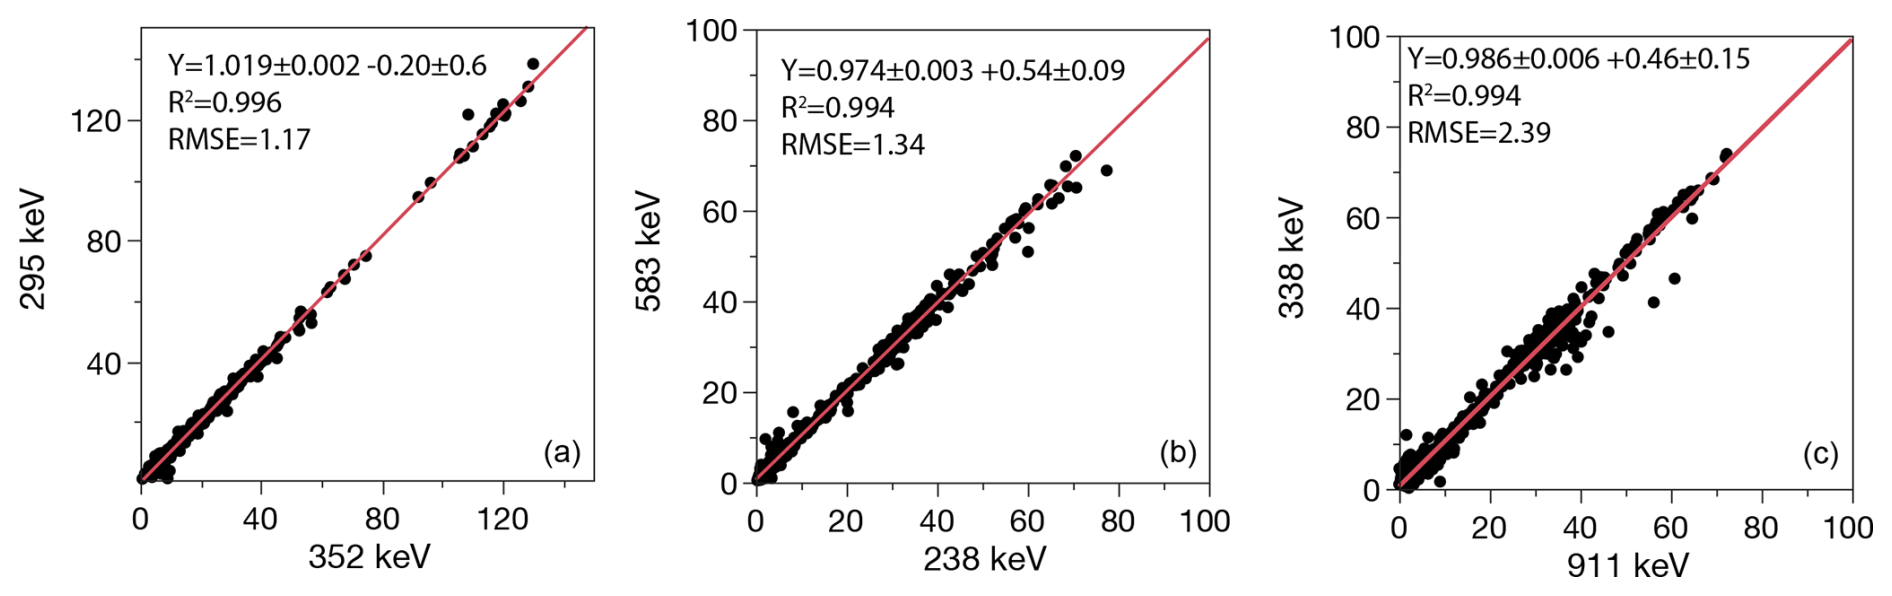
Figure 3Correlations of multiple photopeaks for (a) 222Rn, (b) 228Th, (c) 228Ra. Lines show linear best fits.
The coefficient of variance (CV) or relative standard deviation (RSD) for multiple emission peaks for each of 222Rn, 228Th, and 228Ra provides an assessment of measurement accuracy and precision in the gamma spectrum (Fig. 4). These are in the 1 %–5 % range for typical crustal activity concentrations of 20 Bq kg−1. 222Rn is important because it is often used as an indirect measure of 226Ra, with integration uncertainties 5–10 times lower (Fig. 4a), but also with this important caveat, that the actual values of the two measures may differ substantially due to geochemical disequilibrium caused by Rn leakage (Sect. 3.5).
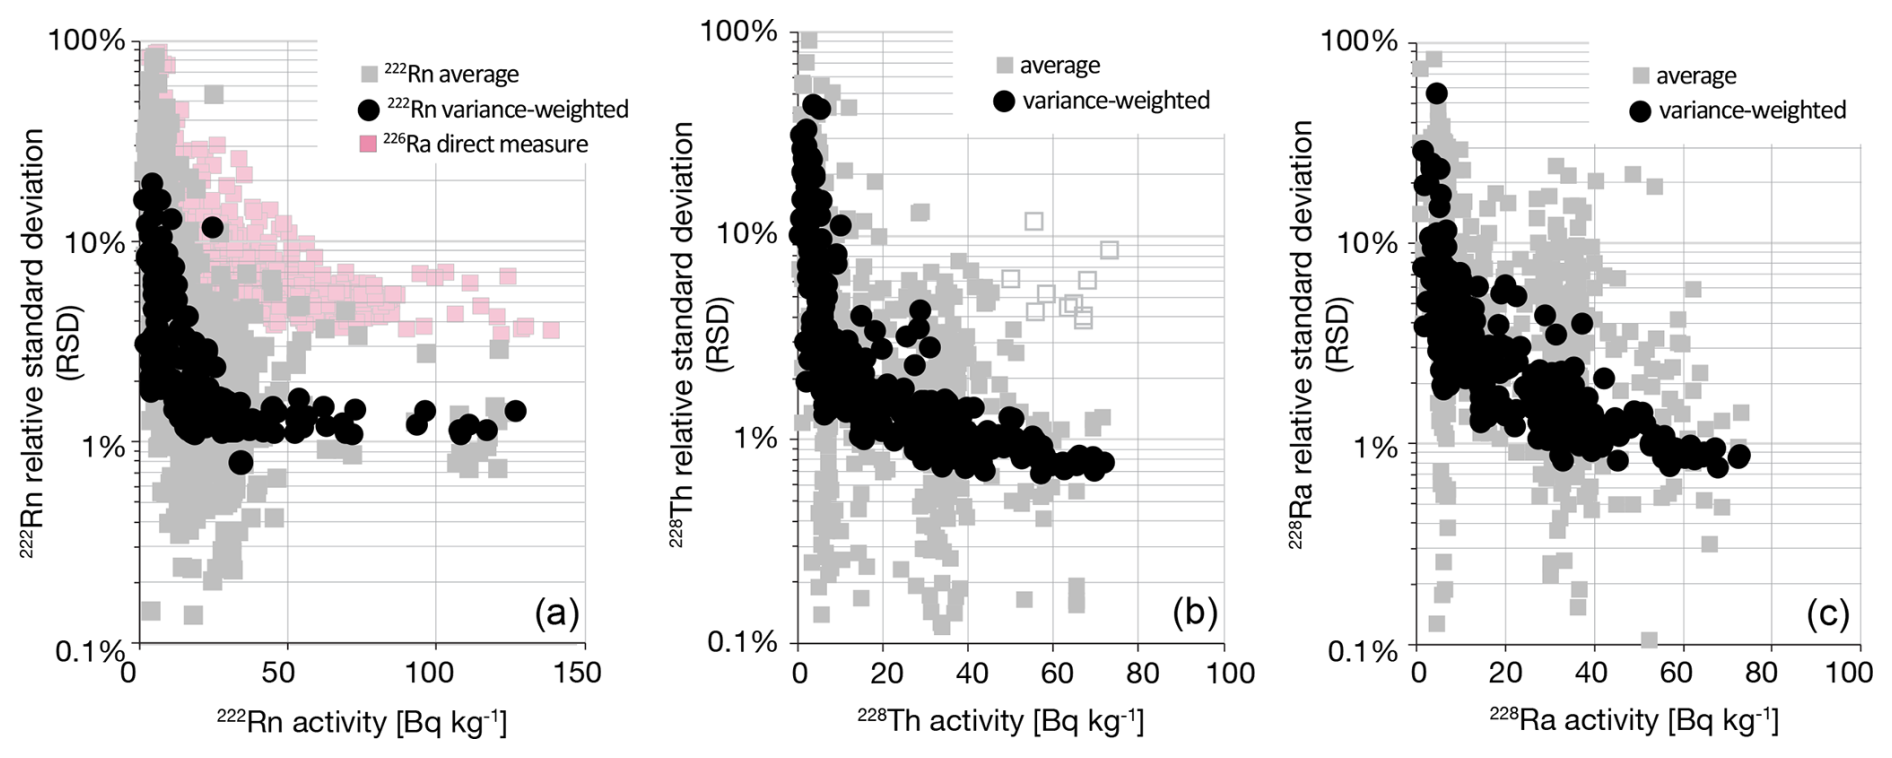
Figure 4Average and variance-weighted average activities for radionuclides measured at multiple energies in the gamma spectrum, including (a) 222Rn, with comparison to direct measure of 226Ra; (b) 228Th; (c) 228Ra. 226Ra measurement is possible at a single emission line which is compromised by low photon yield and photopeak convolution with 235U, resulting in uncertainties 5–10 times higher than possible with, e.g., 222Rn daughter radionuclides.
2.7 Peak interference deconvolution
Multiple important radionuclides in the gamma spectrum suffer significant peak-peak overlap that requires deconvolution. Most notable are 7Be which has interference from both 228Ac (478 keV) and 214Pb (280 keV) (Landis et al., 2012), and 226Ra which has interference from 235U at 185 keV and which approximately doubles its analytical uncertainty (Zhang et al., 2009). Our 7Be deconvolution regime is verified elsewhere using repeat measures of a single natural sample, since the known half-life of 7Be can be exploited to predict its change in concentration over monthly timescales (Landis et al., 2012). The 226Ra deconvolution regime can be tested against certified reference materials; however, the reported uncertainties for 226Ra in available standards typically exceeds 10 % and are therefore of limited use in verifying robust measurement of this radionuclide (more below in Sect. 8).
Deconvolution can also be tested using the measure of 224Ra (half-life 3.6 d, 241 keV) as a proxy for its parent radionuclide 228Th because of its photopeak overlap with 214Pb at 242 keV. The peak deconvolution procedure is evaluated with the expectation that radioactive equilibrium is maintained, i.e., with a slope of 1 in correlation between the parent and daughter (Fig. 5). Here the slope = 0.985 ± 0.006 which shows a systematic error of just 1.5 ± 0.6 %.
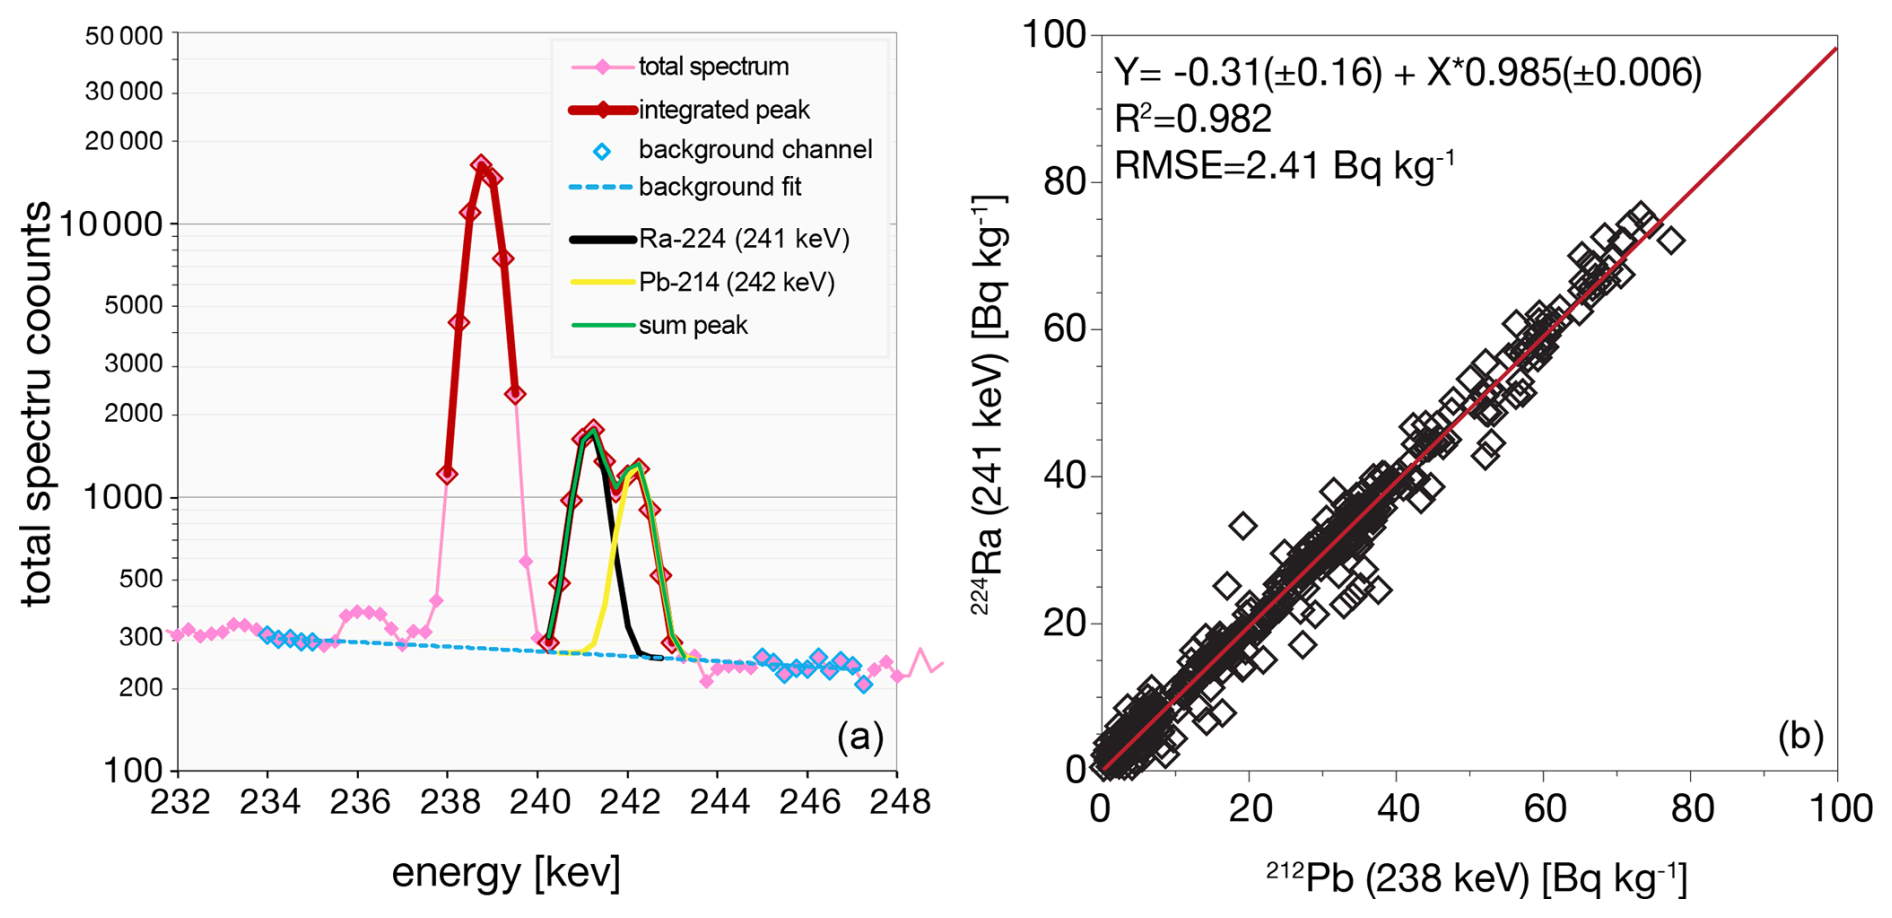
Figure 5(a) Measurement of 224Ra is possible in the gamma spectrum but requires deconvolution of its 241 keV emission from 214Pb at 242 keV. (b) Accuracy of the 224Ra deconvolution procedure can be tested against 212Pb (via 220Rn) measured at 238 keV.
3.1 7Be and problem of detection
The defining limitation in LRC age model development is the problem of 7Be detection. The combination of low natural abundance, low photon yield (10.5 %), and short half-life (54 d) requires extraordinary efforts in both the logistics of sample collection and availability of instrument time to make these measurements possible. Samples should be measured within 1 month of collection and must be counted for 4 d or more per sample to define the 7Be soil depth profile (Fig. 6). Following these protocols 7Be may be detected to soil depths of 10 or more centimeters in humid or moist climates, which has important implications both for how soils are perceived to function and how age models are applied to soils (Landis et al., 2016).
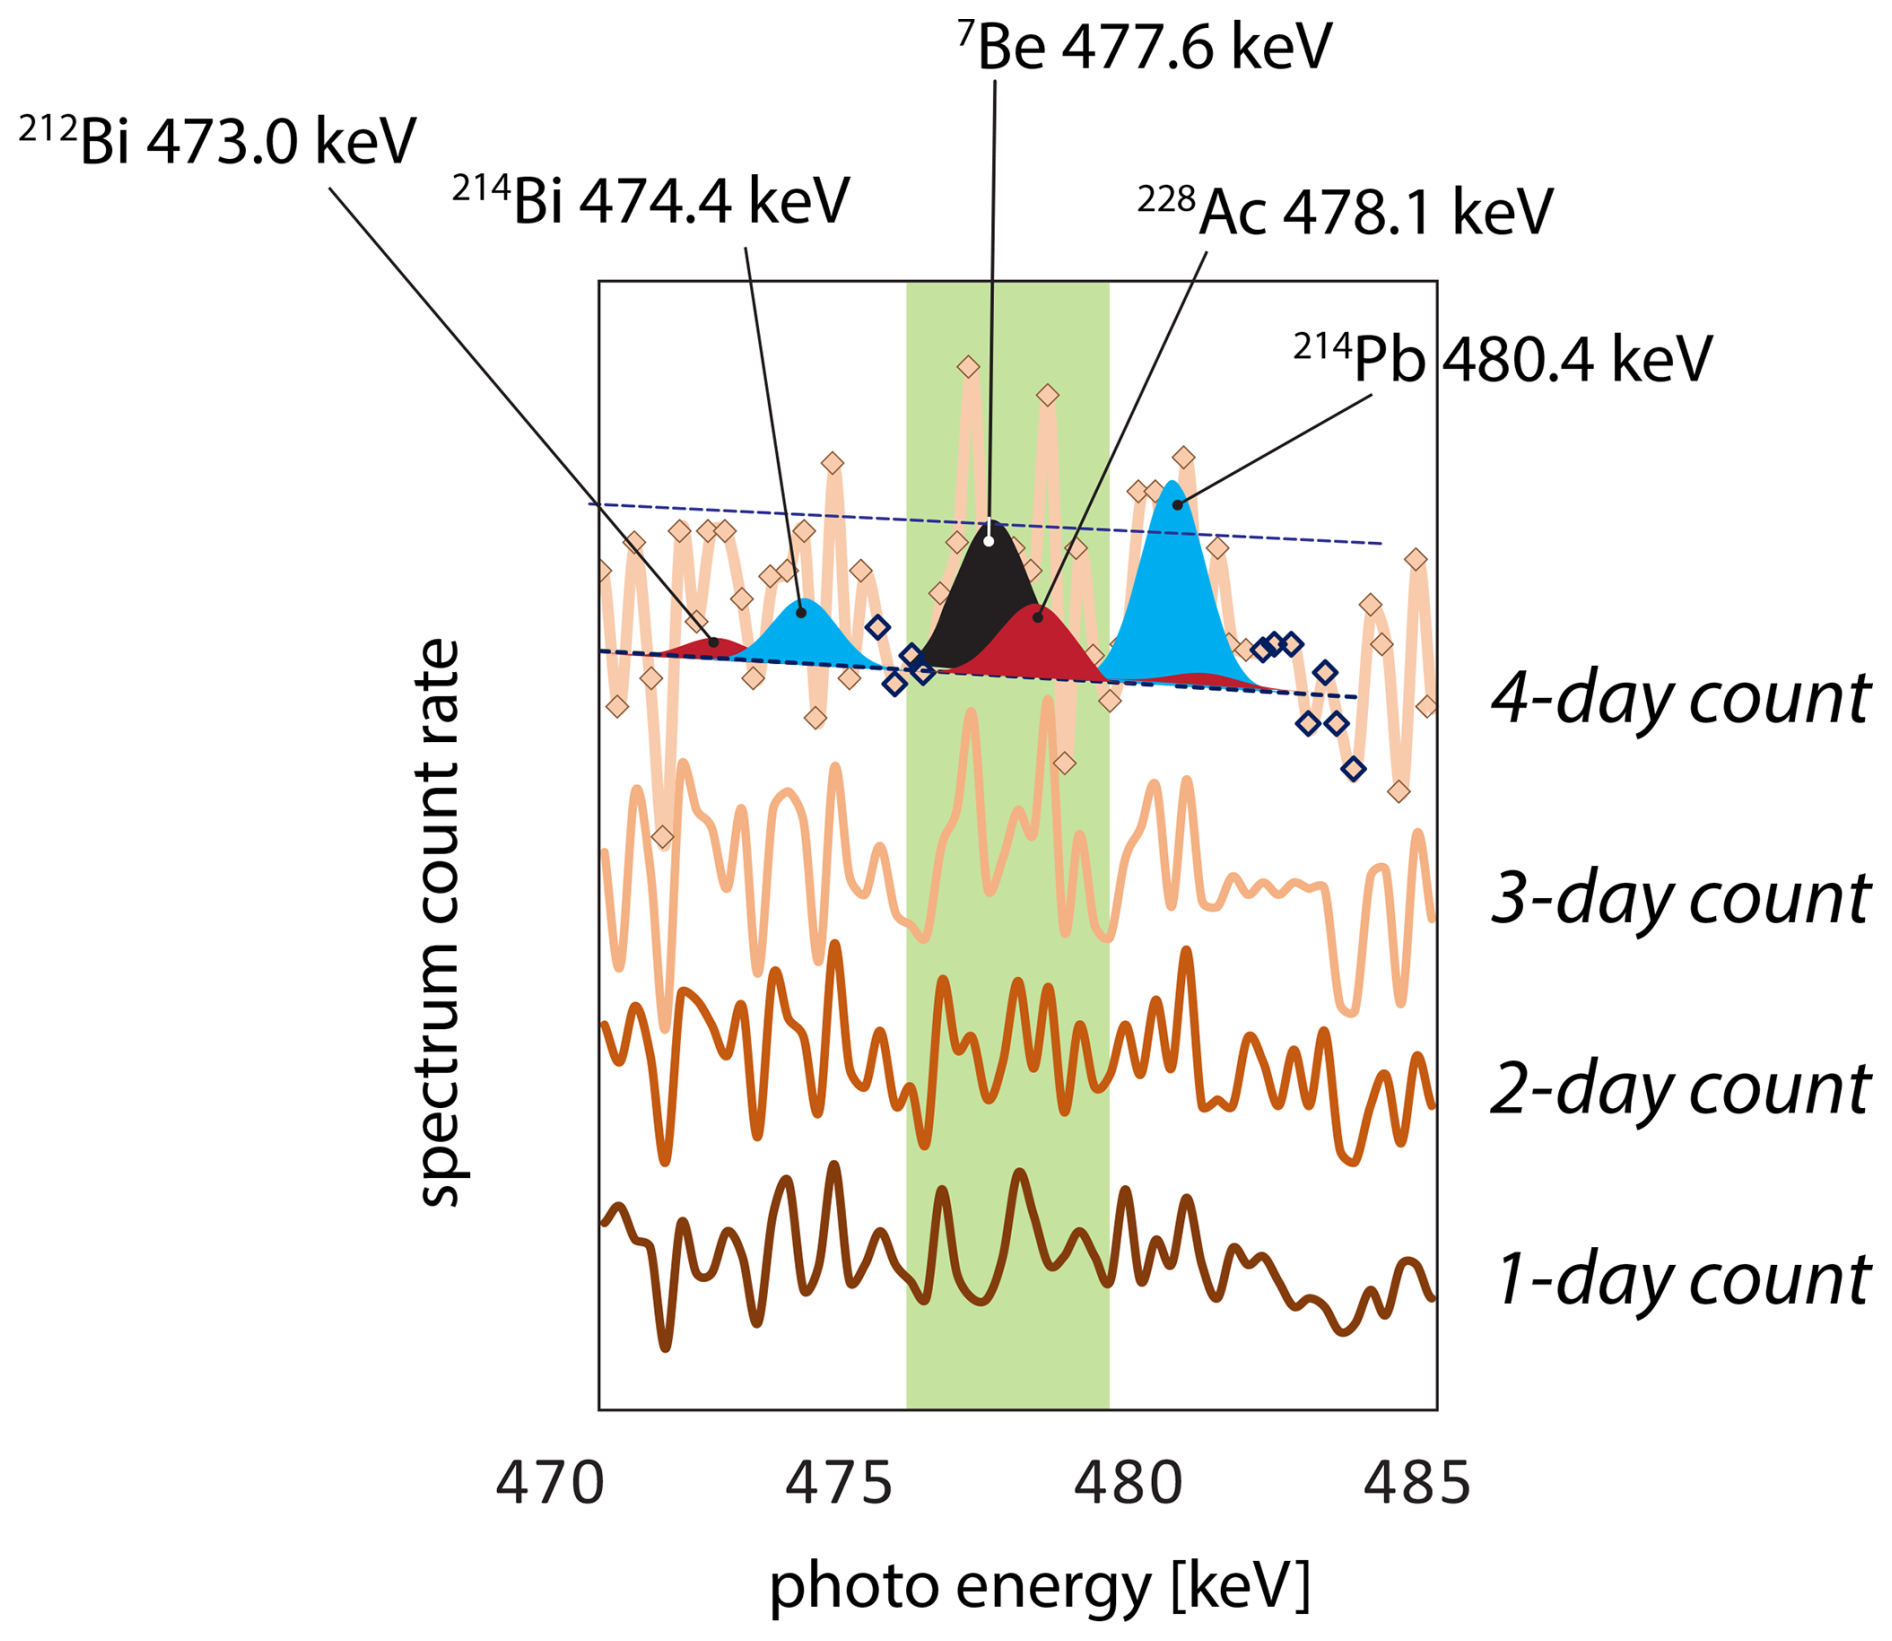
Figure 6Elapsed measurement of the 7Be gamma photoregion over 1, 2, 3, and 4 d count times. The measured sample is soil from 5 cm depth, and 7Be activity is quantified as 1.8±1.0 Bq kg−1 after 4 d. The modeled 7Be peak is shown in black, U-series peaks in blue, and Th-series peaks in red. MDL is shown with dashed line.
3.2 241Am and problem of detection
Demonstrating accuracy of LRC requires concordance with independent chronometers, and bomb-pulse 241Am is the prime candidate due to its long half-life, limited solubility or bioavailability (in contrast to 137Cs), and potential for its concurrent measurement in the gamma spectrum. The bomb-pulse has a well-known history of activity in the atmosphere (Appleby et al., 1991; Health and Safety Laboratory, 1977). Abundance of 241Am is low, however, rarely exceeding 1 Bq kg−1 in temperate soils, and is altogether undetectable in equatorial soils where fallout deposition was 10-times lower than mid-latitudes (Chaboche et al., 2021). Alternate measurement of Pu isotopes by ICPMS or AMS is becoming routine and may offer an alternative where 241Am cannot be measured (e.g. Alewell et al., 2017).
3.3 137Cs and problem of geochemical mobility
In contrast to 241Am, 137Cs is easily measured in the gamma spectrum. However, it can be subject to biological cycling as a K analog especially where soil K may be deficient (Kaste et al., 2021). As a result, the shape of Am and Cs profiles can diverge remarkably (Fig. 7). 241Am is always the preferred measure of bomb pulse. Still, where 241Am and 137Cs profiles appear consistent, 137Cs may provide constraints on shape of the 241Am profile when the latter is detection limited if it can be shown, e.g. by regression, that there is no systematic bias between the 241Am and 137Cs depth profiles or mass distributions.
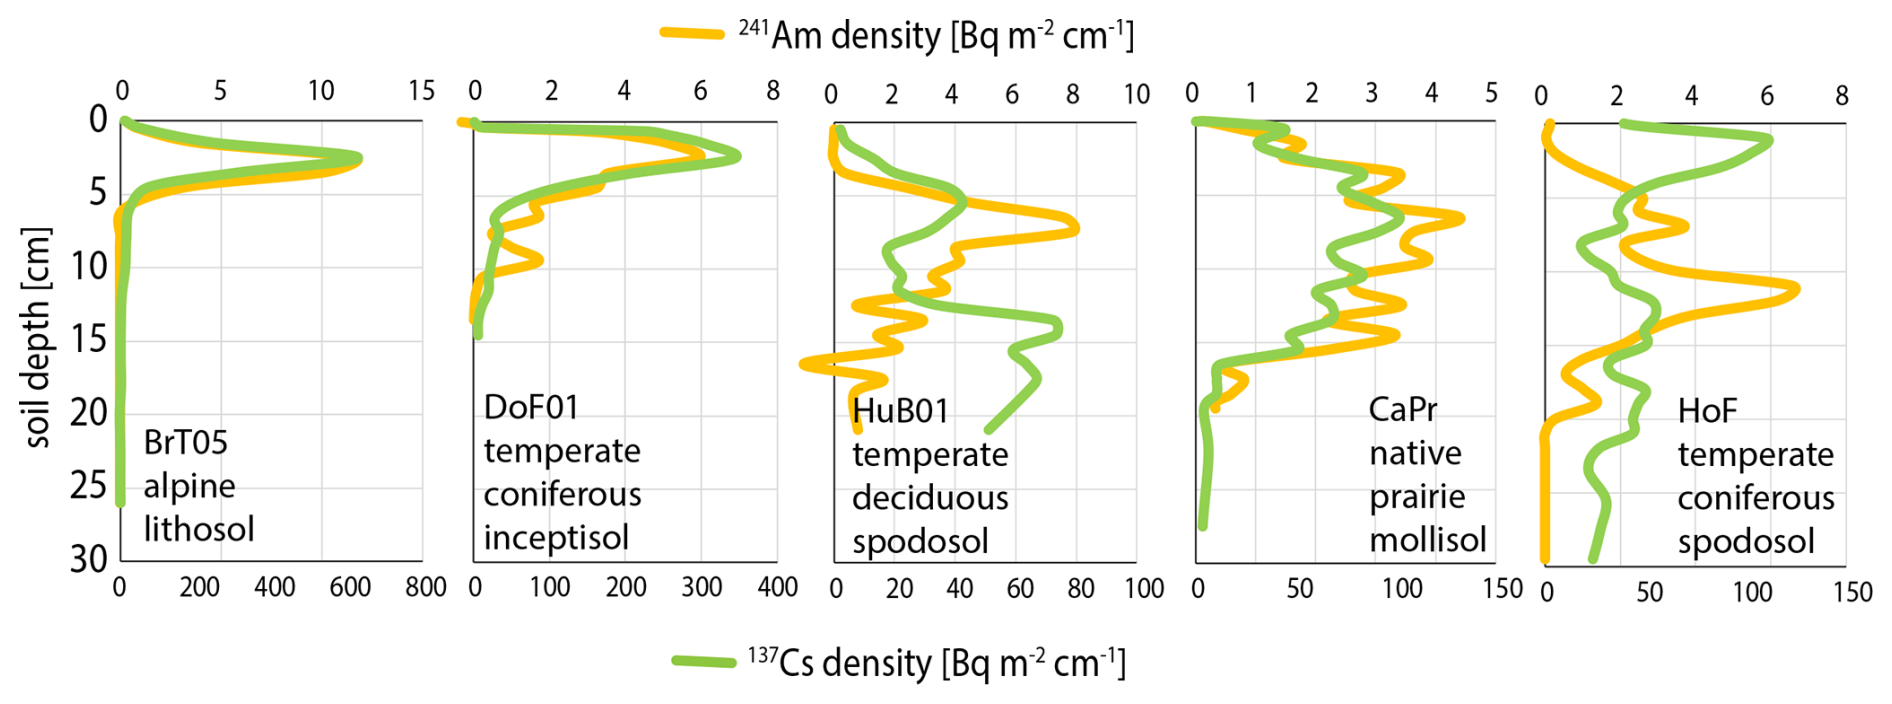
Figure 7Depth profiles of 241Am and 137Cs in diverse soils. In all cases the cumulative 241Am date is consistent with bomb-pulse peak of 1963–1964. Assigned calendar years are as follows: BrT05 = 1970.1, DoF01 = 1965.3, HuB01 = 1964.4, CaPr01 = 1964.2, HoF01 = 1958.1. In some cases, 137Cs follows 241Am closely, in others (especially spodosol) their divergence is pronounced and 137Cs follows a “leaky cycle” whereby some portion may be strongly retained near the soil surface while any escaping this surface peak is rapidly flushed through the soil profile below.
3.4 Total 210Pb
Total 210Pb is the sum of both atmospheric (excess) and geogenic (supported) sources and is easily measured in gamma spectrum with BEGe detectors. The strongest source of error is self-absorption since this can vary by a factor of 2–3 through the soil profile. However, the low photon yield (4 %) can make measurement of supported 210Pb challenging in soils with typical crustal uranium abundance. The four-day count time is thus important for providing adequate precision for defining 210Pbex at the tail of its depth distribution (where 210Pbex is calculated as 210Pbtotal minus 222Rn; see below).
3.5 226Ra, the problem of radon emanation, and defining supported 210Pb
The measure of 226Ra is important, in principle, for defining the activity of 210Pb that is supported in soil by secular equilibrium with U-bearing minerals and organic matter (discussed in detail in Sect. 4). However, here we show that, due to endemic radioactive disequilibrium in soils, indirect measure of 222Rn should be preferred over direct measure of 226Ra for estimating supported 210Pb. Secular equilibrium requires that radionuclides in a decay chain have equal activities, and we should observe this in the abbreviated chain 226Ra > 222Rn ≫ 214Bi > 214Pb ≫ 210Pb provided that gaseous Rn can be retained within the sample (≫ indicates omitted radionuclide). Instead, we observe that 214Pb and 214Bi (indirect measures of 222Rn) underestimate 226Ra even in samples that are sealed and rested for the ingrowth period required for Rn to achieve equilibrium (5 half-lives or about 20 d) (Fig. 8). The obvious conclusion is that Rn emanates from packed soil samples during routine measure. Disequilibrium between 222Rn and 226Ra is difficult to assess in a single sample, because of high uncertainties on the 226Ra measure due in part to significant overlap from the primary 235U emission at 185.7 keV (Zhang et al., 2009).
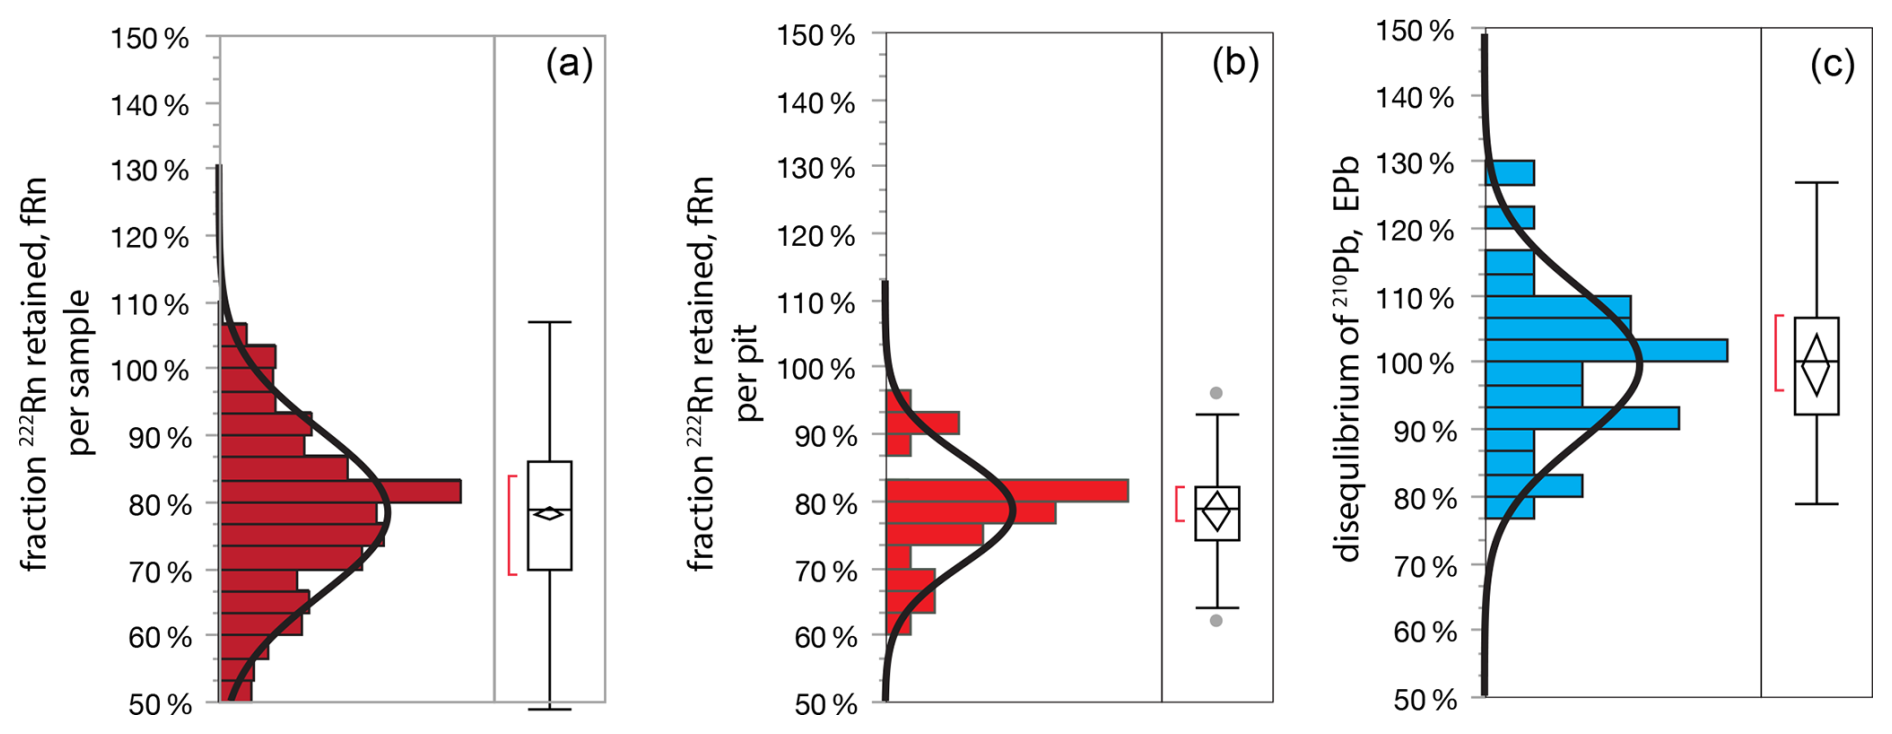
Figure 8Rn retention by soils, (a) fraction 222Rn retained per sample in laboratory, calculated as . The mean 222Rn disequilibrium factor fRn in this dataset on a per-sample basis is 77±15 % (SD, n=472, omitting samples with 226Ra < 20 Bq kg−1). (b) Fraction 222Rn retained per soil pit, (c) laboratory disequilibrium between 210Pb and 222Rn in deep soils, per soil pit, calculated as ePb = .
In this dataset we quantify disequilibrium between 222Rn and 226Ra as fRn, or fraction Rn, which is simply the ratio of the two measures. (We acknowledge that the problem is somewhat more complicated because the effective volume of Rn in the detector shield will be greater than volume of the sample itself, due to its diffusion from the sample container into surrounding air). Among all soil pits the mean measured fRn = 79±1 % (± RSE, n=30) (Fig. 8). Importantly, the variance of fRn within a single pit is much smaller than among pits [p<0.0001], which means that fRn is a property of the geochemistry of individual soils (with respect to hosting of Ra in primary vs. secondary minerals, grain size, susceptibility to chemical weathering, geologic age, etc.).
3.6 Experimental confirmation of 226Ra accuracy and 222Rn emanation
Affirming the accuracy of 226Ra measurements is foundational for understanding Rn emanation, and therefore for interpreting 210Pb in the soil profile. Here we confirm the accuracy of direct 226Ra measurements (186 keV) against certified reference materials (CRMs) (Fig. 9). Performance is excellent with standard 4 d count times (Fig. 9a). We note that analytical uncertainties thus achieved are typically far better than those of the certification process itself. This reflects the difficulties in robust measure of 226Ra which requires long count times and corrections for self-absorption and deconvolution (Tasker et al., 2019).
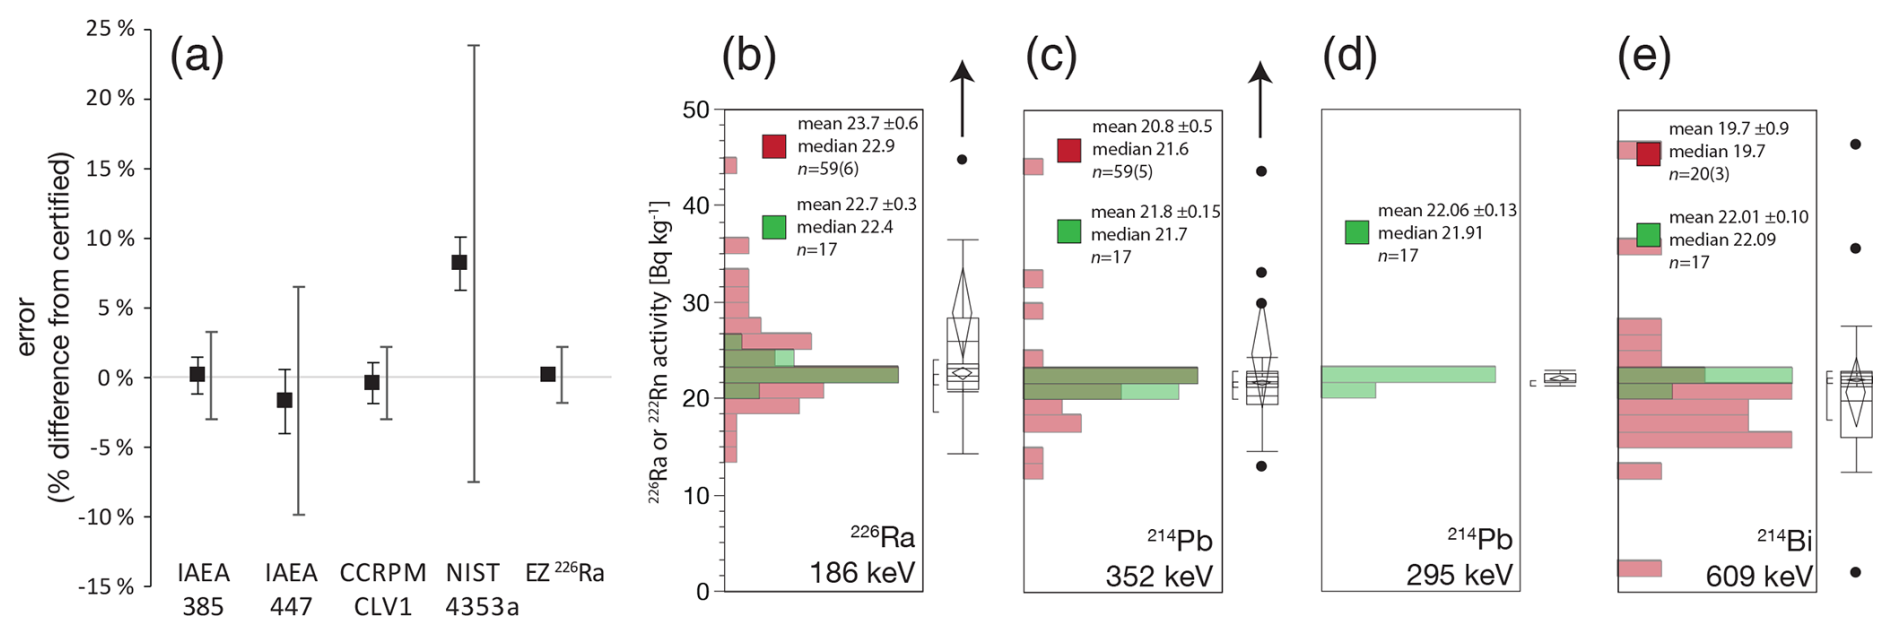
Figure 9(a) FRNA values for 226Ra determination in certified reference materials IAEA-385 (Irish sea sediment), IAEA-447 (moss-soil), CCRMP CLV-1 (spruce needle), NIST-4353a (Rocky Flats soil). Eckert and Ziegler single isotope solution (EZ 226Ra) is used as an in-house calibration material. Error bars are 1σ standard deviations for analysis at FRNA, larger error bars show certification uncertainties. (b–e) Distributions of results for IAEA-385 certification measurements (red) and FRNA analysis (green) for individual emission lines of 226Ra and the 222Rn daughters 214Pb and 214Bi.
The IAEA-385 material is the most rigorously-calibrated soil standard available to date and is critical to our ability to validate high-quality gamma spectrometry (International Atomic Energy Agency, 2013; Pham et al., 2008). Even so, the original recommended 226Ra activity of 22.7 ± 0.7 Bq kg−1 (Pham et al., 2005) is 3.6 % higher than the eventual certification value of 21.9 Bq kg−1. The lower value derives from the averaging of direct 226Ra measurements with lower estimates from 214Pb (352 keV) and 214Bi (609 keV) (Fig. 9b–e). The latter should be viewed as suspect since both Rn emanation and coincidence summing losses can bias the 222Rn daughters too low. FRNA measurements appear to confirm a systematic 222Rn loss of 3.4 % as the difference between 226Ra activities (22.7 ± 0.3) and 222Rn (21.98 ± 0.07) [p=0.0186].
For analysis of sample unknowns we sought to confirm the accuracy of our 226Ra measures and therefore that Rn disequilibrium is due to Rn loss and not an analytical artifact (Syam et al., 2020). We performed an experiment with NIST-traceable 226Ra standard solution (Eckert and Ziegler; certified uncertainty <2 %). which is important to verify that 226Ra is measured accurately and with high enough activity to measure it with percent-level precision (here approximately 360 Bq kg−1). A second calibrated 228Ra solution was prepared by dissolution of thorium ore OKA-2. Accuracy of both Ra source calibrations was previously confirmed by isotope-dilution thermal ionization mass spectrometry (Landis et al., 2018). Briefly, both the 226Ra and 228Ra standard solutions were co-precipitated in a wet synthesis of MnO2 from KMnO4 and MnCl2 at pH ∼ 9. To replicate a typical soil sample in 110 cm3 petri geometry, the synthesized Ra-MnO2 was air dried onto a bed of quartz sand. The Ra-Mn-sand thus produced represents a worst-case scenario for Rn emanation because all Ra is contained in amorphous or microcrystalline secondary mineral.
Samples were packed into our standard polypropylene petri as for a soil sample. The petri was first closed with electrical tape and measured serially to observe Rn ingrowth. Yields of both 226Ra and 228Ra are within error of 100 % of certified or expected values (Fig. 10). Short-lived 220Rn (aka thoron, half-life = 56 s) is fully retained by the sample, but grows in following the half-life of intermediary 224Ra (3.6 d) which is expelled from the initial suspension of MnO2 by alpha recoil.
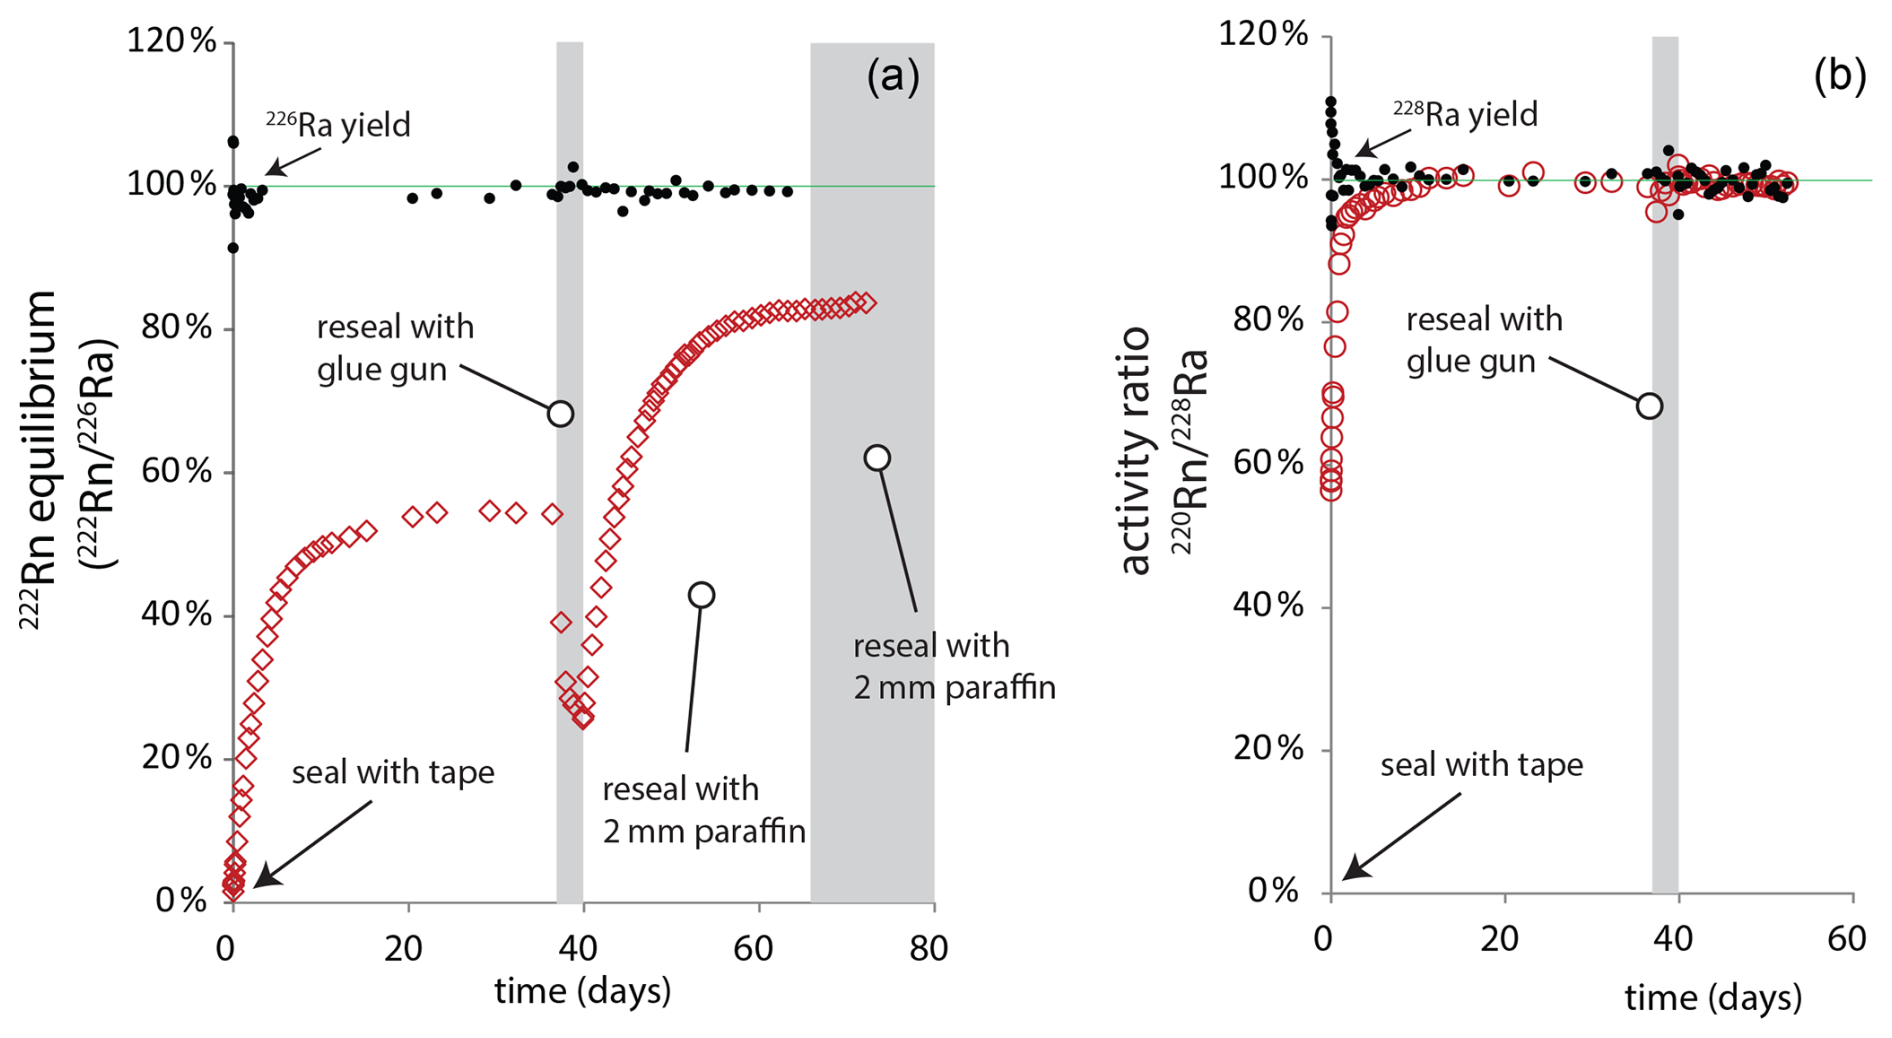
Figure 10Experimental confirmation of 222Rn emanation from 110 cm3 soil laboratory samples, (a) 222Rn and 226Ra source, (b) 220Rn and 228Ra source. Closed symbols show yield of 226Ra or 228Ra from the experiment, open symbols show corresponding Rn yield or equilibrium as the activity ratio.
In contrast, for long-lived 222Rn we observed an equilibrium fRn of just 55 % after approximately thirty days. The sample was then resealed using hot glue, but this reduced Rn retention, presumably due to porosity in the glue that visibly forms upon cooling. Finally, the sample was encased in 2 mm of paraffin wax. This final step increased fRn to 85 %, but the impracticality of the method coupled with imperfect Rn retention is a fatal strike against its routine use in our laboratory.
Our subsequent efforts to seal samples under vacuum in aluminized Mylar bags improve Rn retention up to 90 %–95 % for our 110 cm3 petri (Mauring and Gäfvert, 2013), but we have not standardized this approach due to remaining uncertainty in precise quantification of retention, the creation of additional laboratory waste and, in the face of these problems, the uncertain value of improving the indirect measure of 226Ra to defining 210Pbex (see below).
FRN age models are based on the atmospheric component of 210Pb, which in soils and sediment must be separated mathematically from 210Pb that is supported by in situ production from U-series decay in soil minerals. By convention atmospheric 210Pb is measured as the excess over that which is supported (210PbS) by its long-lived radioactive precursor 226Ra, i.e., 210Pbex = 210Pb minus 226Ra, with the assumption that 226Ra = 210PbS. Due to analytical constraints described above, 226Ra is routinely measured indirectly using 222Rn with the assumption that equilibrium is maintained between the two. We have already shown this is not accomplished in typical sample preparation.
Further, there is the problem of Rn emanation from soils in situ: the very process that produces excess 210Pb in the atmosphere yields a 210Pb deficit in soil. This means that supported 210Pb in soils is likely to be overestimated if measured by 226Ra. This leaves two open questions, (1) what is the correct metric for supported 210Pb in situ, and (2) how do we measure this in routine data collection in the laboratory? To clarify these problems, we introduce the term Pb enrichment, ePb, which is the ratio of 210Pb to 222Rn in deep soil samples believed free of atmospheric 210Pb. Importantly, for all soil pits we have measured ePb = 102±3 % (± RSE, n=30) which means that supported 210Pb is typically in equilibrium with measured 222Rn. This is best illustrated in the soil depth profile where total 210Pb converges asymptotically with 222Rn, whereas both are overestimated by 226Ra (Fig. 11). Interestingly, this implies that Rn loss from the measured sample is comparable to loss in the soil in situ, and further that, as observed above, Rn emanation from standard laboratory samples relates to a physical property of the soil itself.
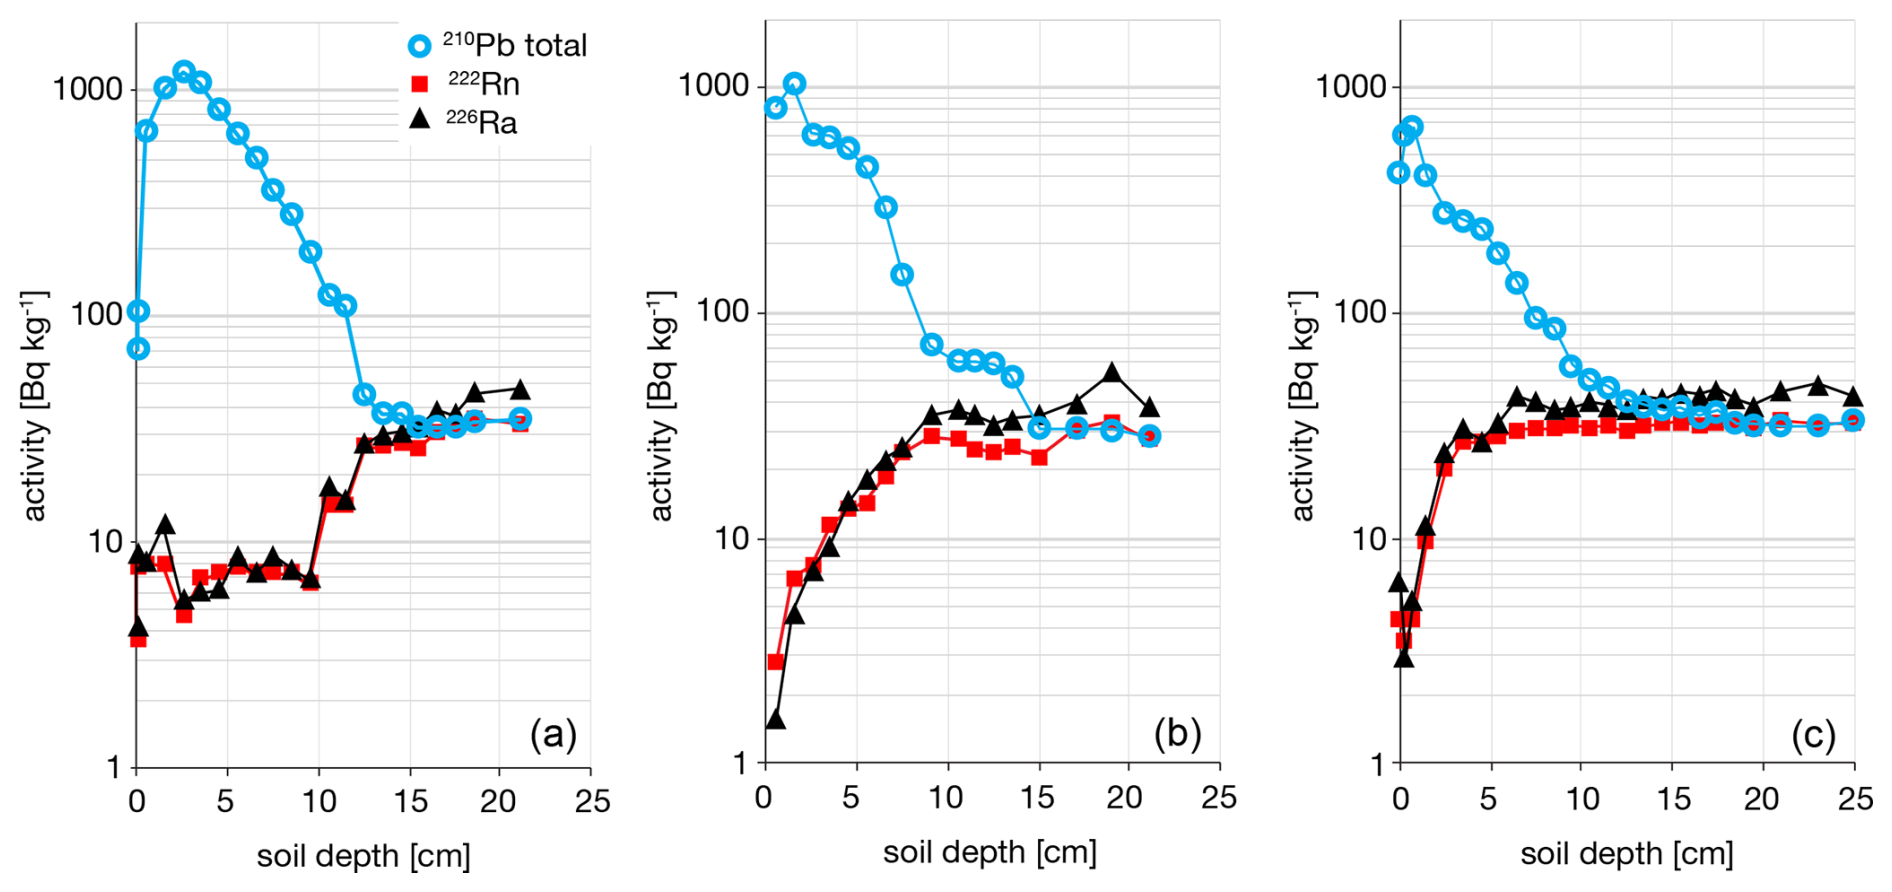
Figure 11Defining excess 210Pb in soils. (a) Hubbard Brook Experimental Forest (HuB01), (b) Experimental Lakes Area soil 302-1, (c) Harvard Forest LTER (HaF01). Total 210Pb typically converges with 222Rn at depth which indicates that 222Rn is an appropriate estimate of supported 210Pb.
We therefore conclude the following regarding the definition of 210Pbex in soils,
-
226Ra is not an appropriate direct measure of supported 210Pb due to chronic emanation of 222Rn from the soils in situ.
-
in situ 222Rn emanation in the soil profile can be assessed directly by gamma measurements, as an asymptotic difference between 226Ra and 210Pb in deep soils.
-
measure of 222Rn by daughters 214Pb and 214Bi provides excellent precision and reproducibility among multiple emission lines, 5–10 times better than possible with direct measure of 226Ra.
-
Rn emanation from the laboratory sample is both pronounced and systematic, despite sealing of containers and incubating >18 d following standard practice.
-
nonetheless, 222Rn measured in the sample typically converges with 210Pb, or is asymptotic with 210Pb, suggesting that 222Rn measure in the laboratory sample is the best available option for defining 210Pbex in soil.
For defining 210Pbex at each soil depth we use the following expression. The calculation therefore uses a direct measure of 222Rn at each depth to accommodate changes in soil organic matter, mineral abundance, and bulk density, but assumes a correction for Rn emanation rate for the full the soil profile (Landis et al., 2016):
Calculation of 210Pbex is not provided in the dataset but can be performed following Eq. (3). Propagated uncertainties in 210Pbex when calculated by Eq. (3) are shown in Fig. 12.
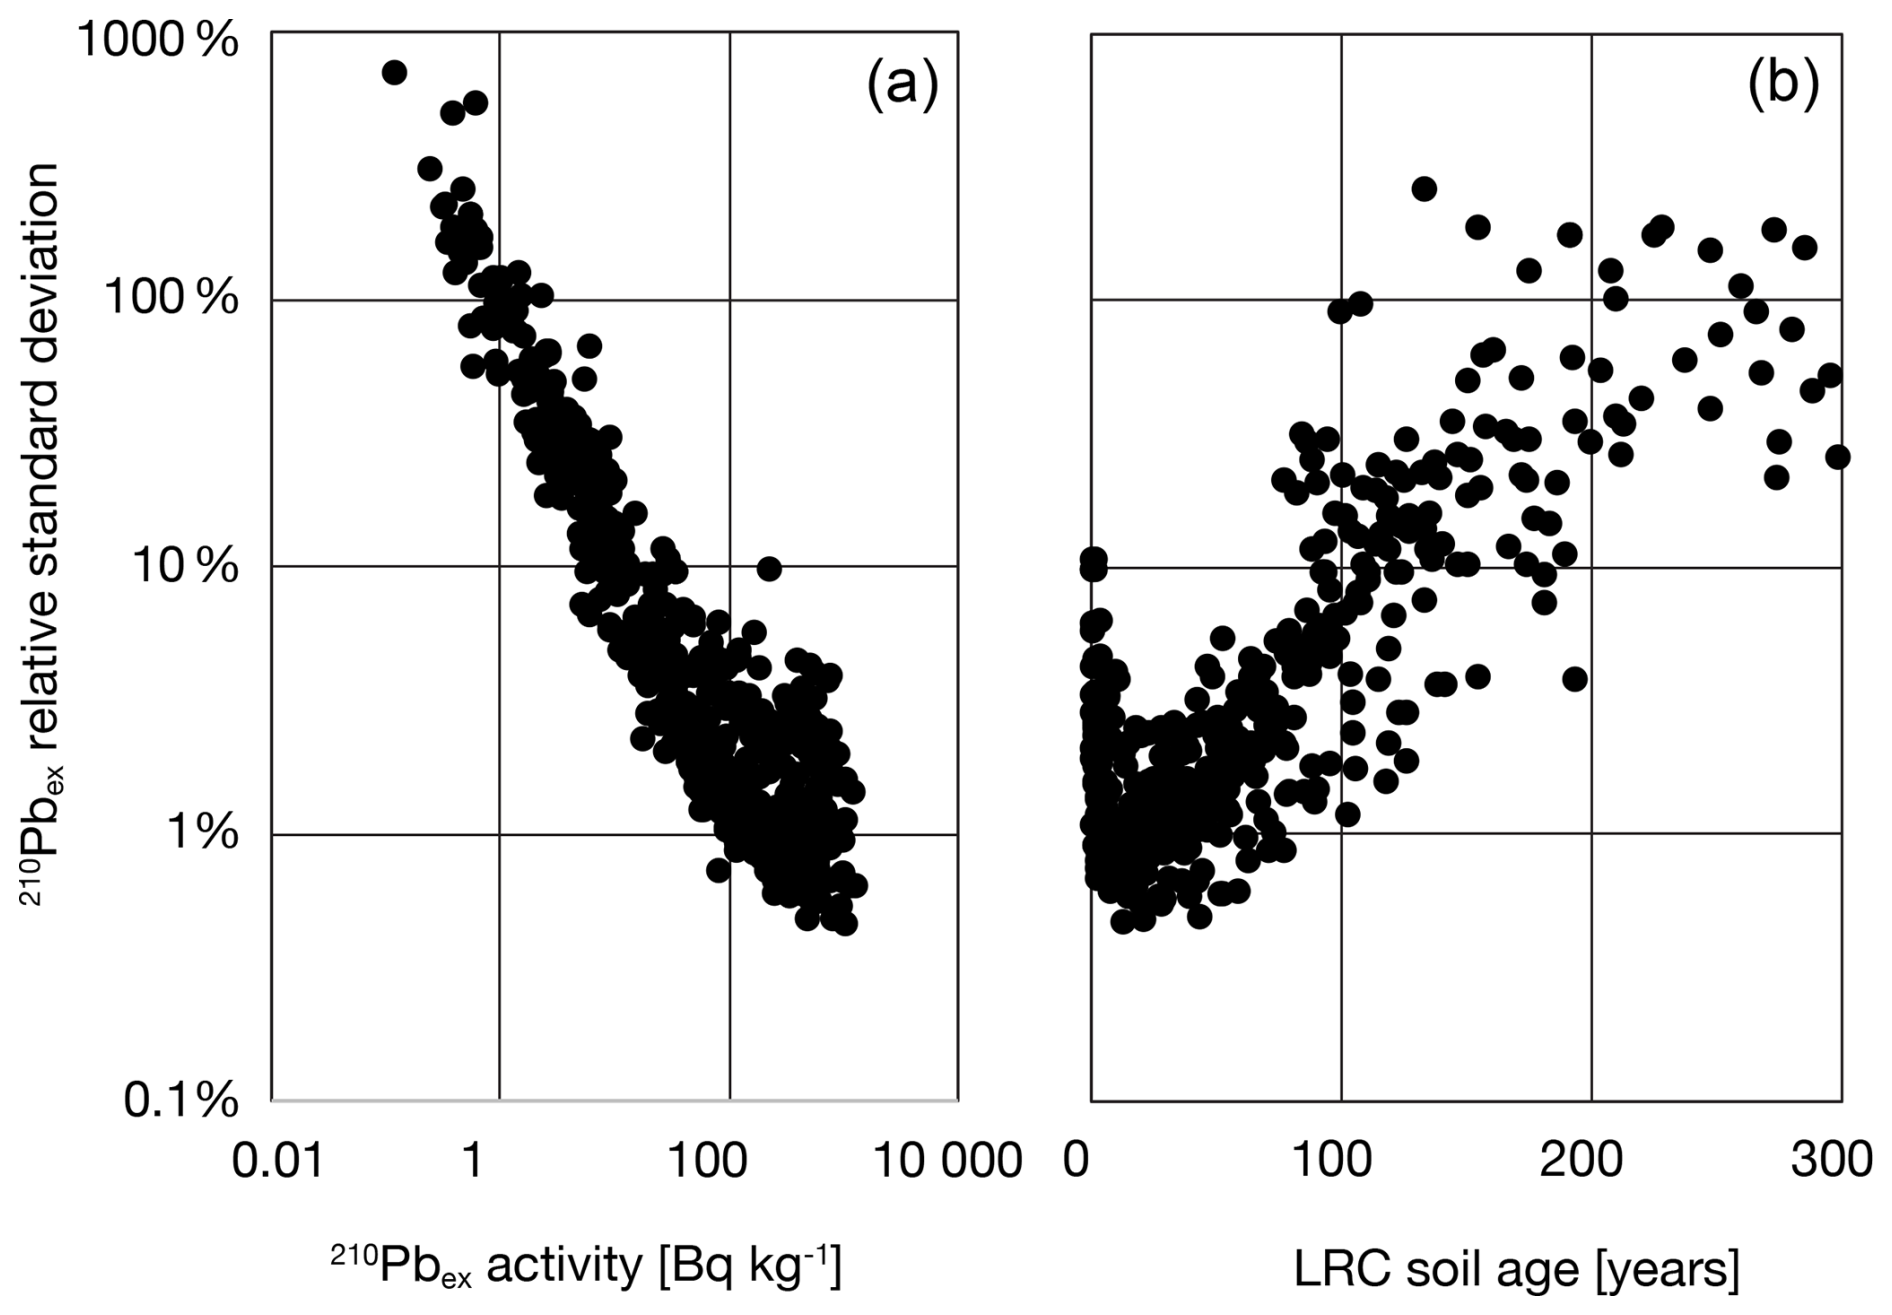
Figure 12Propagated uncertainties for 210Pbex as function of (a) total 210Pbex activity, (b) LRC soil age.
Demonstrating concordance of LRC ages with independent chronometers is important for verifying both the suitability of soils for chronometry and veracity of data production (Landis et al., 2024b). We report 241Am activities for this purpose, but it should be noted that peak bomb-pulse deposition is indicated at the layer of maximum 241Am density (Bq m−2 cm−1) rather than activity concentration since the latter is skewed by changes in bulk density, especially at the soil surface. 241Am density is readily calculated from the data provided. In some cases, the shape of 241Am bomb-pulse peak can be grossly distorted due to acceleration and deceleration of colloid migration in the soil profile (Landis et al., 2024a), and in these cases the cumulative 241Am curve becomes an alternate tool for identifying peak bomb fallout since the history of 241Am in the atmosphere is well known (Appleby et al., 1991; Health and Safety Laboratory, 1977).
Our reported uncertainties for radionuclide activities are internal estimates which are propagated from uncertainties on peak integration; this includes background subtraction, partial-peak integration fraction, and deconvolution where needed. These provide a direct assessment of measurement quality related to total radionuclide activity, spectral complexity, and related Poisson statistics. Uncertainties due to efficiency calibration and self-absorption correction are not included in reported uncertainties because they are fixed and therefore easily consolidated in a second step by propagating an additional 2 % uncertainty as described in Sect. 2.3. We have not established the extent to which calibration uncertainties may autocorrelated across different radionuclide energies. These external uncertainties are therefore assessed here for user consideration, for example, when comparing measurements in this dataset to those from other laboratories.
Z-scores to assess radionuclide uncertainty estimates
The accuracy of reported integration uncertainties can be assessed using multiple emission lines for a single radionuclide, since each must conform to the same true mean activity value. We show this by means of Z-score, which is the difference between emission line activities, normalized by the propagated uncertainty for the difference. The standard deviation of Z should be equal to 1 if the estimated integration uncertainties accurately represent the true distribution of random error in the measurements (Fig. 13). We observe standard deviations in Z of 0.8, 1.2, and 1.4 for 222Rn, 228Th, and 228Ra, respectively. These are close to 1 which implies that the integration uncertainties are robust. In the case of 228Th and 228Ra the real uncertainties are somewhat underestimated which means that uncertainties in calibration contribute an additional error, and one that is similar in scale to uncertainties in integration, i.e., if similar errors are propagated the result is a 40 % higher than either, .
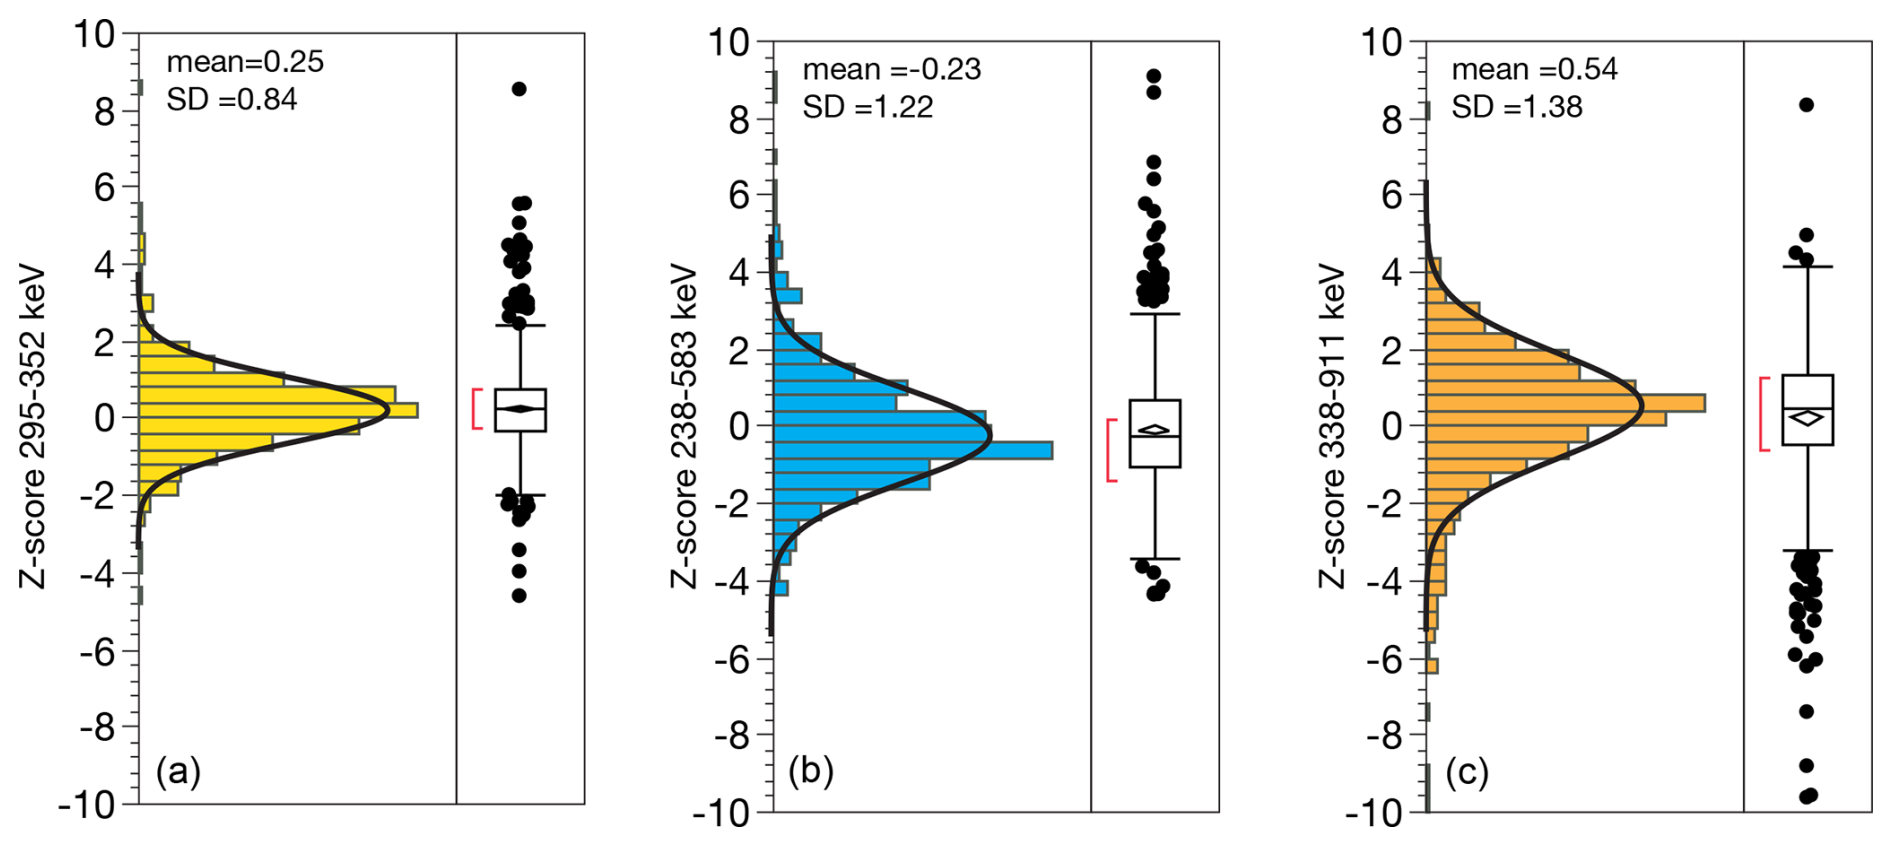
Figure 13Distribution of Z-scores for multiple emission lines of (a) 222Rn (295, 352 keV); (b) 228Th (238, 583 keV); (c) 228Ra (338, 911 keV). Z expresses the difference between two measures in units of σ, calculated as the difference between two measures of activity, divided by propagated uncertainty of the two measures.
On the other hand, our prior assessment suggests that integration uncertainties are overestimated by on the order of 30 %, based on the unique experiment of measuring radioactive decay of 7Be since the true value of the sample is known based on its rate of decay, and estimated uncertainties can be evaluated against the observed dispersion of measurements around this known value (Landis et al., 2012). Overestimation of integration errors is consistent with our observed Z<1 for the 222Rn lines comparison above. That uncertainties for 228Th and 228Ra are greater than for 222Rn suggests that the interaction of coincidence-summing and self-absorption effects yields higher error in calibration, since these are not handled independently in our calibration routine, i.e., by using a Th point source instead of U for Th-series photopeaks. Future work is required to determine whether one 228Ra measurement may be preferred over others (e.g., among the 228Ac photopeaks at 209, 338, and 911 keV).
The 228Th : 228Ra ratio is an important metric for evaluating accuracy of gamma measurements since it can generally be assumed to have an equilibrium value of 1 due to short half-lives of 1.9 and 5.8 years, respectively. To ensure this is true we omit samples with LRC ages <20 years or 228Ra <10 Bq kg−1 since these may have true 228Th : 228Ra disequilibrium due to variable uptake of Th and Ra during plant growth (Landis, 2023). The mean 228Th : 228Ra ratio for the data set is 1.015±0.038 SD, ±0.002 SE (n=390), showing a minor bias of 1.5 % which is within typical calibration uncertainty. Importantly, the standard deviation for Z (for the difference between 228Th : 228Ra and 1) = 1.20, which shows that the estimates of uncertainties are reasonable (Fig. 14).
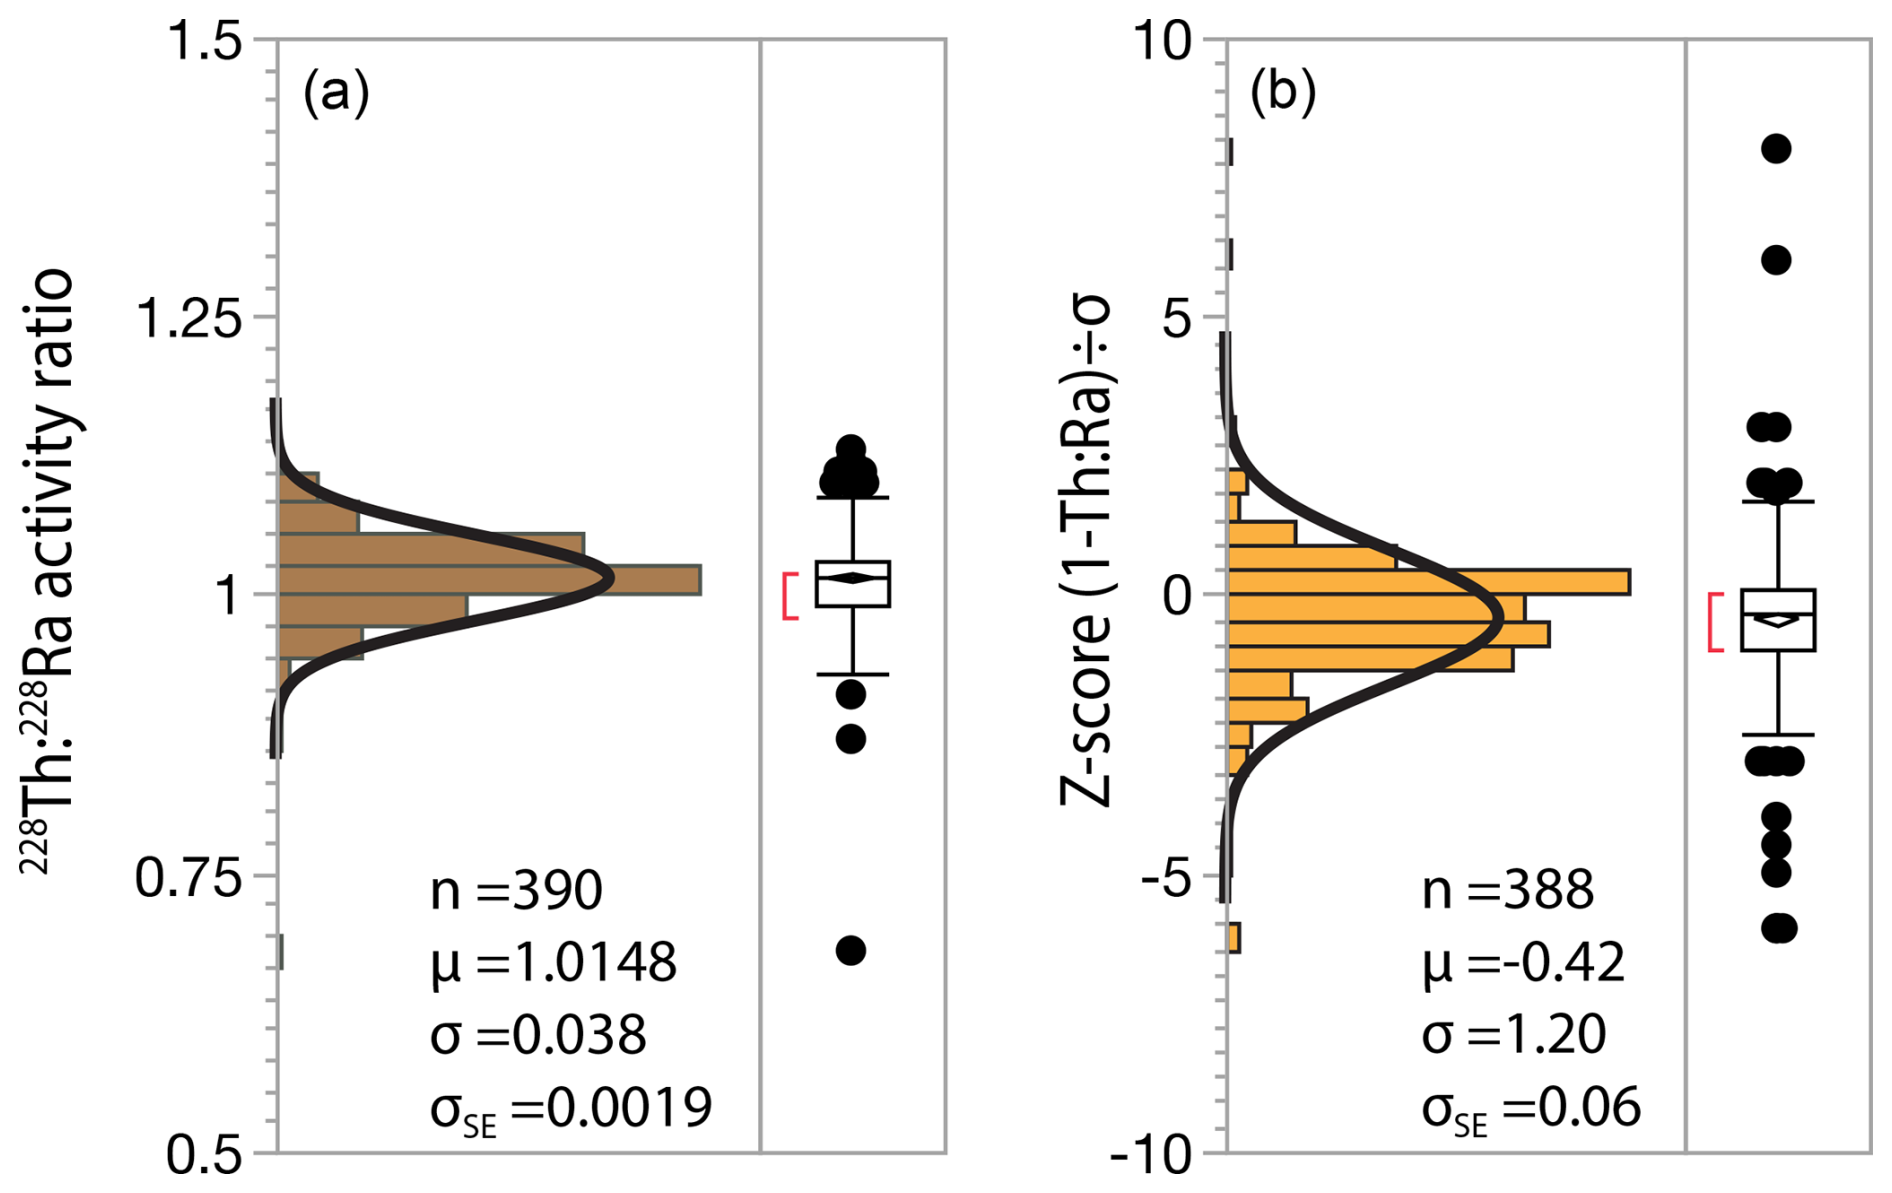
Figure 14Assessing analytical accuracy using the measured 228Th : 228Ra ratio in soils. (a) Measured 228Th : 228Ra ratio for all soils, (b) Z-score for difference between measured ratio and 1.
Availability of a few high-quality certified reference materials provides a means for external validation of environmental gamma data. We recommend IAEA-385 (sediment), IAEA-447 (moss soil), and NRC CLV-1 (spruce twig), since these have rigorous quality control and uncertainties low enough (typically <5 %) to allow verification of high-precision methods. Performance of our methods against these standards for radionuclides in addition to 226Ra is reported elsewhere with errors against certified values <5 % (Landis et al., 2012, 2016).
Detection limit applies to total radioactivity in the detector shield [Bq], which is the product of mass and concentration. This means that detection is inversely dependent on sample bulk density since the sample volume is fixed. Detection is also inversely dependent on sample count time following Poisson counting statistics. Finally, detection is also influenced by composition of the sample with respect to other elements and radionuclides because these influence photopeak backgrounds through Compton scattering. Because detection limits thus vary based on sample mass, composition, and count time they are not easily compiled and compared. We instead defer to reported uncertainties so that the value or weight of each datum can be independently assessed by users on this basis. Given this caveat, estimated detection limits for four-day count times, 100 g samples, and approximately crustal-average U and Th content are approximately as follows: 7Be (0.5 Bq kg−1); 210Pb (1.5 Bq kg−1); 137Cs (0.3 Bq kg−1); 241Am (0.15 Bq kg−1); 186Ra (2.5 Bq kg−1); 222Rn (0.2 Bq kg−1); 228Th (0.2 Bq kg−1); 228Ra (1.0 Bq kg−1).
Multiple data reduction generations are represented in the database, with notable differences being the introduction of new photopeaks such as 209, 338, and 583 keV in later versions. Data fields are empty in preceding analyses.
In some rare cases (e.g., deep peat cores), samples that are unable to fill a 110 cm3 petri are run instead in 10 cm3 petris. The lower volume incurs a corresponding loss in data quality due to low total activity and resulting counting statistics. Data quality for the smaller 10 cm3 petri is poor and our use of them is rare. These data are not reported in this database at the present time, but may be provided upon request.
The error #NUM! in some uncertainty estimates is a peak integration error typically resulting for integration of small peaks that are near detection. This can propagate through deconvolution regimes, i.e. error in uncertainty of 228Ac integration will produce error in uncertainty for 7Be. For purposes of error propagation, the error can reasonably be estimated by assuming 100 % relative uncertainty, i.e., equal to the value. Future work aims to eliminate this error.
The reported data are tabular in form and may be downloaded (below) as an Excel spreadsheet. Row one is data identifier 1. Row two is data identifier 2, and row three is column units or identifier 3. Subsequent rows list data per sample. Reported metadata and data include the following across columns:
-
column A: pit code: unique identifier for the soil pit.
-
column B: sample name: unique identifier for the soil pit depth interval.
-
column C: sample description: including horizon and/or depth interval.
-
column D: horizon code: soil taxonomic horizon description.
-
column E: interval mass [kg m−2]: total mass of fine soil fraction (<2 mm) for the collected depth interval.
-
column F: soil depth [cm]: starts at soil surface = 0 rather than at mineral soil surface.
-
column G: Racc; accumulative 7Be : 210Pb ratio for overlying soil layers used in implementation of LRC model.
-
column H: propagated uncertainty (1σ) for Racc.
-
column I: relative standard deviation (RSD) of Racc.
-
column J: count time [s] for collected gamma spectrum.
-
columns K-AP: paired columns with activity concentrations [Bq kg−1] and internal uncertainties for the following radionuclide: 210Pb (46 keV), 7Be (477 keV), 241Am (60 keV), 137Cs (662 keV), 234Th (63 keV), 226Ra (186 keV), 222Rn (295, 352, 609 keV), 228Th (238, 538 keV), 228Ra (338, 911 keV), 40K (1460 keV).
The data described in this manuscript are freely available to the public (https://doi.org/10.17632/cfxkpn6hj9.1; Landis, 2025).
The central limitation to advancing chronometry of modern terrestrial biogeochemistry, including atmosphere-soil interaction and soil processes, is availability of required radionuclide data. We hope that by providing a large, open-access dataset we can help catalyze interest among new research groups and funding agencies in making new investments towards similar data acquisition efforts.
The author has declared that there are no competing interests.
Publisher's note: Copernicus Publications remains neutral with regard to jurisdictional claims made in the text, published maps, institutional affiliations, or any other geographical representation in this paper. While Copernicus Publications makes every effort to include appropriate place names, the final responsibility lies with the authors. Also, please note that this paper has not received English language copy-editing.
This paper was edited by Xingchen (Tony) Wang and reviewed by two anonymous referees.
Alewell, C., Pitois, A., Meusburger, K., Ketterer, M., and Mabit, L.: 239+240Pu from “contaminant” to soil erosion tracer: Where do we stand?, Earth Sci. Rev., https://doi.org/10.1016/j.earscirev.2017.07.009, 2017.
Appleby, P. G., Richardson, N., and Nolan, P. J.: 241Am dating of lake sediments, Hydrobiologia, 214, 35–42, https://doi.org/10.1007/BF00050929, 1991.
Arias-Ortiz, A., Masqué, P., Garcia-Orellana, J., Serrano, O., Mazarrasa, I., Marbà, N., Lovelock, C. E., Lavery, P. S., and Duarte, C. M.: Reviews and syntheses: 210Pb-derived sediment and carbon accumulation rates in vegetated coastal ecosystems – setting the record straight, Biogeosciences, 15, 6791–6818, https://doi.org/10.5194/bg-15-6791-2018, 2018.
Barsanti, M., Garcia-Tenorio, R., Schirone, A., Rozmaric, M., Ruiz-Fernández, A. C., Sanchez-Cabeza, J. A., Delbono, I., Conte, F., De Oliveira Godoy, J. M., Heijnis, H., Eriksson, M., Hatje, V., Laissaoui, A., Nguyen, H. Q., Okuku, E., Al-Rousan, S. A., Uddin, S., Yii, M. W., and Osvath, I.: Challenges and limitations of the 210Pb sediment dating method: Results from an IAEA modelling interlaboratory comparison exercise, Quat. Geochronol., 59, https://doi.org/10.1016/j.quageo.2020.101093, 2020.
Chaboche, P. A., Saby, N. P. A., Laceby, J. P., Minella, J. P. G., Tiecher, T., Ramon, R., Tassano, M., Cabral, P., Cabrera, M., da Silva, Y. J. A. B., Lefevre, I., and Evrard, O.: Mapping the spatial distribution of global 137Cs fallout in soils of South America as a baseline for Earth Science studies, Earth Sci. Rev., https://doi.org/10.1016/j.earscirev.2021.103542, 2021.
Cutshall, N. H., Larsen, I. L., and Olsen, C. R.: Direct analysis of 210Pb in sediment samples: self-absorption corrections, Nucl. Instrum. Methods Phys. Res. A, 206, 309–312, 1983.
Health and Safety Laboratory: 90Sr and 89Sr in monthly deposition at world land sites, U.S. Energy Research and Development Administration, New York, 1977.
International Atomic Energy Agency: Reference Sheet for Certified Reference Material IAEA-385 natural and artificial radionuclides in sediment from the Iris Sea, IAEA, Vienna, https://nucleus.iaea.org/sites/AnalyticalReferenceMaterials/Shared Documents/ReferenceMaterials/Radionuclides/IAEA-385/RS_IAEA-385_V5.3.pdf (last access: 22 September 2025), 2013.
Kaste, J. M., Bostick, B. C., Heimsath, A. M., Steinnes, E., and Friedland, A. J.: Using atmospheric fallout to date organic horizon layers and quantify metal dynamics during decomposition, Geochim. Cosmochim. Acta, 75, 1642–1661, https://doi.org/10.1016/j.gca.2011.01.011, 2011.
Kaste, J. M., Volante, P., and Elmore, A. J.: Bomb 137Cs in modern honey reveals a regional soil control on pollutant cycling by plants, Nat. Commun., 12, https://doi.org/10.1038/s41467-021-22081-8, 2021.
Landis, J. D.: Age-Dating of Foliage and Soil Organic Matter: Aligning 228Th : 228Ra and 7Be : 210Pb Radionuclide Chronometers over Annual to Decadal Time Scales, Environ. Sci. Technol., 57, 15047–15054, https://doi.org/10.1021/acs.est.3c06012, 2023.
Landis, J. D.: Data for Modern Soil Chronometry using Fallout Radionuclides, Mendeley Data, V1, https://doi.org/10.17632/cfxkpn6hj9.1, 2025.
Landis, J. D., Renshaw, C. E., and Kaste, J. M.: Measurement of 7Be in soils and sediments by gamma spectroscopy, Chem. Geol., 291, 175–185, https://doi.org/10.1016/j.chemgeo.2011.10.007, 2012.
Landis, J. D., Renshaw, C. E., and Kaste, J. M.: Beryllium-7 and lead-210 chronometry of modern soil processes: The Linked Radionuclide aCcumulation model, LRC, Geochim. Cosmochim. Acta, 180, 109–125, https://doi.org/10.1016/j.gca.2016.02.013, 2016.
Landis, J. D., Sharma, M., Renock, D., and Niu, D.: Rapid desorption of radium isotopes from black shale during hydraulic fracturing. 1. Source phases that control the release of Ra from Marcellus Shale, Chemical Geology, https://doi.org/10.1016/j.chemgeo.2018.06.013, 2018.
Landis, J. D., Taylor, V. F., Hintellman, H., and Hrenchuck, L.: Predicting behavior and fate of atmospheric mercury in soils: age-dating METAALICUS Hg isotope spikes with fallout radionuclide chronometry, Environ. Sci. Technol., 20009–20018, https://doi.org/10.1021/acs.est.4c01544, 2024a.
Landis, J. D., Obrist, D., Zhou, J., Renshaw, C. E., McDowell, W. H., Nytch, C. J., Palucis, M. C., Del Vecchio, J., Lopez, F. M., and Taylor, V. F.: Quantifying soil accumulation of atmospheric mercury using fallout radionuclide chronometry, Nat. Commun., 15, 5430, https://doi.org/10.1038/s41467-024-49789-7, 2024b.
Landis, J. D., Hicks Pries, C., Renshaw, C. E., von Fromm, S., Spinola, D., Portes, R., McDowell, W. H., Nytch, C. J., Zhou, J., Obrist, D., Palucis, M. C., and McFarlane, K.: Direct measurement of soil carbon sequestration over years to centuries, Research Square [preprint] (Version 1), https://doi.org/10.21203/rs.3.rs-5505878/v1, 2024c.
Mauring, A. and Gäfvert, T.: Radon tightness of different sample sealing methods for gamma spectrometric measurements of 226Ra, Applied Radiation and Isotopes, 81, 92–95, https://doi.org/10.1016/j.apradiso.2013.03.022, 2013.
Murray, A. S., Marten, R., Johnston, A., and Martin, P.: Analysis for naturally occuring radionuclides at environmental concentrations by gamma spectrometry, J. Radioanal. Nucl. Chem., 115, 263–288, 1987.
Murray, A. S., Helsted, L. M., Autzen, M., Jain, M., and Buylaert, J. P.: Measurement of natural radioactivity: Calibration and performance of a high-resolution gamma spectrometry facility, Radiat. Meas., 120, 215–220, https://doi.org/10.1016/j.radmeas.2018.04.006, 2018.
Pham, M. K., Sanchez-Cabeza, J. A., and Povinec, P. P.: Report on the worldwide intercomparison exercise IAEA-385 radionuclides in Irish sea sediment, Monaco, 1–77, https://nucleus.iaea.org/sites/AnalyticalReferenceMaterials/Shared Documents/ReferenceMaterials/Radionuclides/IAEA-385/IAEA_AL_151.pdf (last access: 22 September 2025), 2005.
Pham, M. K., Sanchez-Cabeza, J. A., Povinec, P. P., Andor, K., Arnold, D., Benmansour, M., Bikit, I., Carvalho, F. P., Dimitrova, K., Edrev, Z. H., Engeler, C., Fouche, F. J., Garcia-Orellana, J., Gascó, C., Gastaud, J., Gudelis, A., Hancock, G., Holm, E., Legarda, F., Ikäheimonen, T. K., Ilchmann, C., Jenkinson, A. V., Kanisch, G., Kis-Benedek, G., Kleinschmidt, R., Koukouliou, V., Kuhar, B., LaRosa, J., Lee, S. H., LePetit, G., Levy-Palomo, I., Liong Wee Kwong, L., Llauradó, M., Maringer, F. J., Meyer, M., Michalik, B., Michel, H., Nies, H., Nour, S., Oh, J. S., Oregioni, B., Palomares, J., Pantelic, G., Pfitzner, J., Pilvio, R., Puskeiler, L., Satake, H., Schikowski, J., Vitorovic, G., Woodhead, D., and Wyse, E.: A new Certified Reference Material for radionuclides in Irish sea sediment (IAEA-385), Applied Radiation and Isotopes, 66, 1711–1717, https://doi.org/10.1016/j.apradiso.2007.10.020, 2008.
Sanchez-Cabeza, J. A. and Ruiz-Fernández, A. C.: 210Pb sediment radiochronology: An integrated formulation and classification of dating models, Geochim. Cosmochim. Acta, 82, 183–200, https://doi.org/10.1016/j.gca.2010.12.024, 2012.
Syam, N. S., Lim, S., Lee, H. Y., and Lee, S. H.: Determination of radon leakage from sample container for gamma spectrometry measurement of 226Ra, J. Environ. Radioact., 220–221, https://doi.org/10.1016/j.jenvrad.2020.106275, 2020.
Tasker, T. L., Burgos, W. D., Ajemigbitse, M. A., Lauer, N. E., Gusa, A. V., Kuatbek, M., May, D., Landis, J. D., Alessi, D. S., Johnsen, A. M., Kaste, J. M., Headrick, K. L., Wilke, F. D. H., McNeal, M., Engle, M., Jubb, A. M., Vidic, R. D., Vengosh, A., and Warner, N. R.: Accuracy of methods for reporting inorganic element concentrations and radioactivity in oil and gas wastewaters from the Appalachian Basin, U.S. Based on an inter-laboratory comparison, Environ. Sci. Process Impacts, 21, 224–241, https://doi.org/10.1039/c8em00359a, 2019.
Zhang, W., Ungar, K., Chen, J., St-Amant, N., and Tracy, B. L.: An accurate method for the determination of 226Ra activity concentrations in soil, J. Radioanal. Nucl. Chem., 280, 561–567, https://doi.org/10.1007/s10967-009-7452-3, 2009.
- Abstract
- Introduction
- Methods
- Radionuclide measurements
- Defining excess Pb-210 (210Pbex)
- Demonstrating LRC concordance with bomb pulse 241Am
- Assessing uncertainties on radionuclide measurements
- Spectrum accuracy evaluated using 228Th : 228Ra
- Certified Reference Materials
- Detection limits
- Data versions, omissions, and error codes in the database
- Reported data fields
- Data availability
- Conclusions
- Competing interests
- Disclaimer
- Review statement
- References