the Creative Commons Attribution 4.0 License.
the Creative Commons Attribution 4.0 License.
 | 10 Sep 2025
A geospatial inventory dataset of study sites in a Korean Quaternary paleoecology database
Soo Hyun Kim
Ecological insights beyond human-observable timescales are derived from records preserved in geological sediments worldwide. Nonetheless, significant regional data gaps persist in global syntheses of these records as open data practices are still emerging. Korean Quaternary paleoecological data remain underrepresented in global research efforts, despite a growing body of site-level research. Here, we organize an inventory of 328 paleoecological study sites (72 paleo-sites with paleoproxy-based records from sediments and 256 surface sites with modern pollen samples) in South Korea, compiled from 66 research articles published from 2003 to 2023. We have built three datasets (https://doi.org/10.6084/m9.figshare.28236596.v2, Kim and Byun, 2025) related to this inventory: (1) Publication Metadata, which provide citation details of the 66 articles; (2) the Site Inventory, which contains metadata about geospatial coordinates, depositional environments, chronological ranges, age coverage, and proxies; and (3) Geochronology Data, which include chronological details (dating methods, ages, and depth points) for each site. The sites span 33.2508 to 33.4808° N and 126.1486 to 129.2132° E, with elevations from −156 to 1867.5 m. Sediment samples were collected by coring or trenching from six depositional environments: open coastal zone, estuary, lagoon, river, volcanic cone, and other. A total of 812 chronological controls were analyzed, and most are based on radiocarbon dating. Pollen, diatoms, and grain size have been widely applied, with multi-proxy approaches increasingly common in recent studies. To enhance accessibility, we have developed GeoEcoKorea (https://www.geoecokorea.org, last access: 28 August 2025), an open-access platform featuring interactive maps where each site marker displays site-level metadata and links to bibliographic information and uncalibrated geochronological datasets, when available. In addition to promoting FAIR (findable, accessible, interoperable, and reusable) data practices, our platform aims to foster more collaborative and inclusive data-sharing cultures, enable regional syntheses of long-term ecosystem dynamics, and contribute Korean paleoecological data to global-scale reconstruction of past environmental changes.
- Article
(5580 KB) - Full-text XML
-
Supplement
(507 KB) - BibTeX
- EndNote


Quaternary paleoecologists and paleoclimatologists investigate environmental changes over the last ∼ 2.5 million years by reconstructing long-term variability in ecosystems, climate, and other components of the Earth system. These reconstructions are based on proxy records from geological archives, particularly sediments in terrestrial depositional settings such as lakes, mires, and coastal marine systems. Proxies serve as indirect indicators of past environmental conditions – for example, fossil pollen for vegetation history and charcoal for fire history (Prentice, 1988; Whitlock and Larsen, 2002). A wide variety of proxies, including biological (e.g., fossil pollen and diatom), chemical (stable isotopes and elemental concentrations), and physical indicators (grain size and magnetic susceptibility), have been used to infer different aspects of past environments (Bradley, 2013).
Yet no single proxy alone can resolve the complexity of environmental conditions, particularly when shaped by networks of interacting processes within the Earth system (Birks and Birks, 2006; Mann, 2002). To improve interpretability, Quaternary studies use multi-proxy strategies that combine proxies reflecting different environmental drivers acting at varying magnitudes. Some proxies respond to a narrow range of conditions, while others are sensitive to multiple extrinsic (e.g., climate variability and ecological disturbances) and intrinsic factors (proxy-specific sensitivity) and may respond to either their combined effects or a single dominant driver, depending on which prevailed at a given time (Birks and Birks, 2006; Mann, 2002). For example, during the Holocene (the recent ∼ 11 700 years), fossil pollen records used to reconstruct past vegetation changes require different interpretive approaches depending on whether the study area is known to have had early, intensive human settlement activity or whether natural vegetation communities can be assumed to have responded primarily to climatic changes. In such a case, pairing pollen-based reconstructions with charcoal or archeological records has often allowed for disentangling anthropogenic land use impacts from climatic signals at the study site (e.g., Abraham et al., 2023; Kozáková et al., 2015; Yang et al., 2020).
In tandem with multi-proxy approaches, multi-site syntheses have led to the large-scale compilation of proxy-based datasets over recent decades. These efforts have underpinned global-scale synthesis projects – for example, reconstructions of Holocene mean surface temperature and land cover and land use changes (Gaillard et al., 2010; Kaufman et al., 2020). Broad-scale paleodata syntheses have also enabled the quantification of ecological parameters that are unmeasurable through direct observation – such as biome-specific residence and recovery times and pollen-taxon-specific climate fidelity in North America as well as subcontinental-scale rates of vegetation changes during the past ∼ 20 000 years (Mottl et al., 2021; Wang et al., 2020; Wang et al., 2023). In addition, growing efforts to integrate high-volume paleodata have driven the development of open-source computational tools, such as neotoma2 for acquiring data from open-access repositories, R-Fossilpol for processing pollen datasets into standardized and reproducible formats, and R-Ratepol for estimating the rate of compositional change within palynological assemblages (Flantua et al., 2023; Mottl et al., 2021; Vidaña and Goring, 2023). These advances have been made possible by a rich set of high-resolution proxy records that enable effective analyses of environmental variability in the recent geological past (Farley et al., 2018; Williams et al., 2018).
Such multi-proxy and multi-site approaches underscore the importance of systematically preserving and archiving well-recovered proxy data to enable immediate and broad reuse. For this purpose, the FAIR (findable, accessible, interoperable, and reusable) guiding principles have been proposed as a model for open data sharing across the geosciences (Wilkinson et al., 2016). It is encouraging to see the growing practice of open-access data in many scientific communities, and the Neotoma Paleoecology Database (https://www.neotomadb.org/, 28 August 2025) is one of the most remarkable contributions to the field (Williams et al., 2018). Research-community-based support is available throughout Neotoma's suite of services, from providing servers and curating data uploads to providing a user-friendly interface for global data search and downloads. The Neotoma community also advises regional communities building and governing their own data while leveraging and becoming affiliated with Neotoma for global networking. With this possibility in mind, this paper is the first step towards developing a Korea-based research community database for regional Quaternary paleoenvironmental data. The goal is to build a new data system that supports detailed hypothesis testing at regional to global scales by incorporating geological and ecological characteristics of previously investigated sites while also accounting for societal and cultural factors in conducting research.
Late Quaternary studies in Korea have been multidisciplinary from an early stage, led by pioneering researchers across fields such as archeology, biology, Earth science education, geochemistry, paleoclimatology, palynology, physical geography, and sedimentology. Since the 2000s, a few review articles have been published about progress in related topics within Korea (Park, 2008; Nahm, 2018; Kim et al., 2024). Nonetheless, there has been little interest or practical support for publishing data associated with the original publications in open and FAIR data resources, which is consistent with the low representation of data from Korea in Neotoma (Fig. 1) and in a recent global synthesis (Herzschuh et al., 2023).
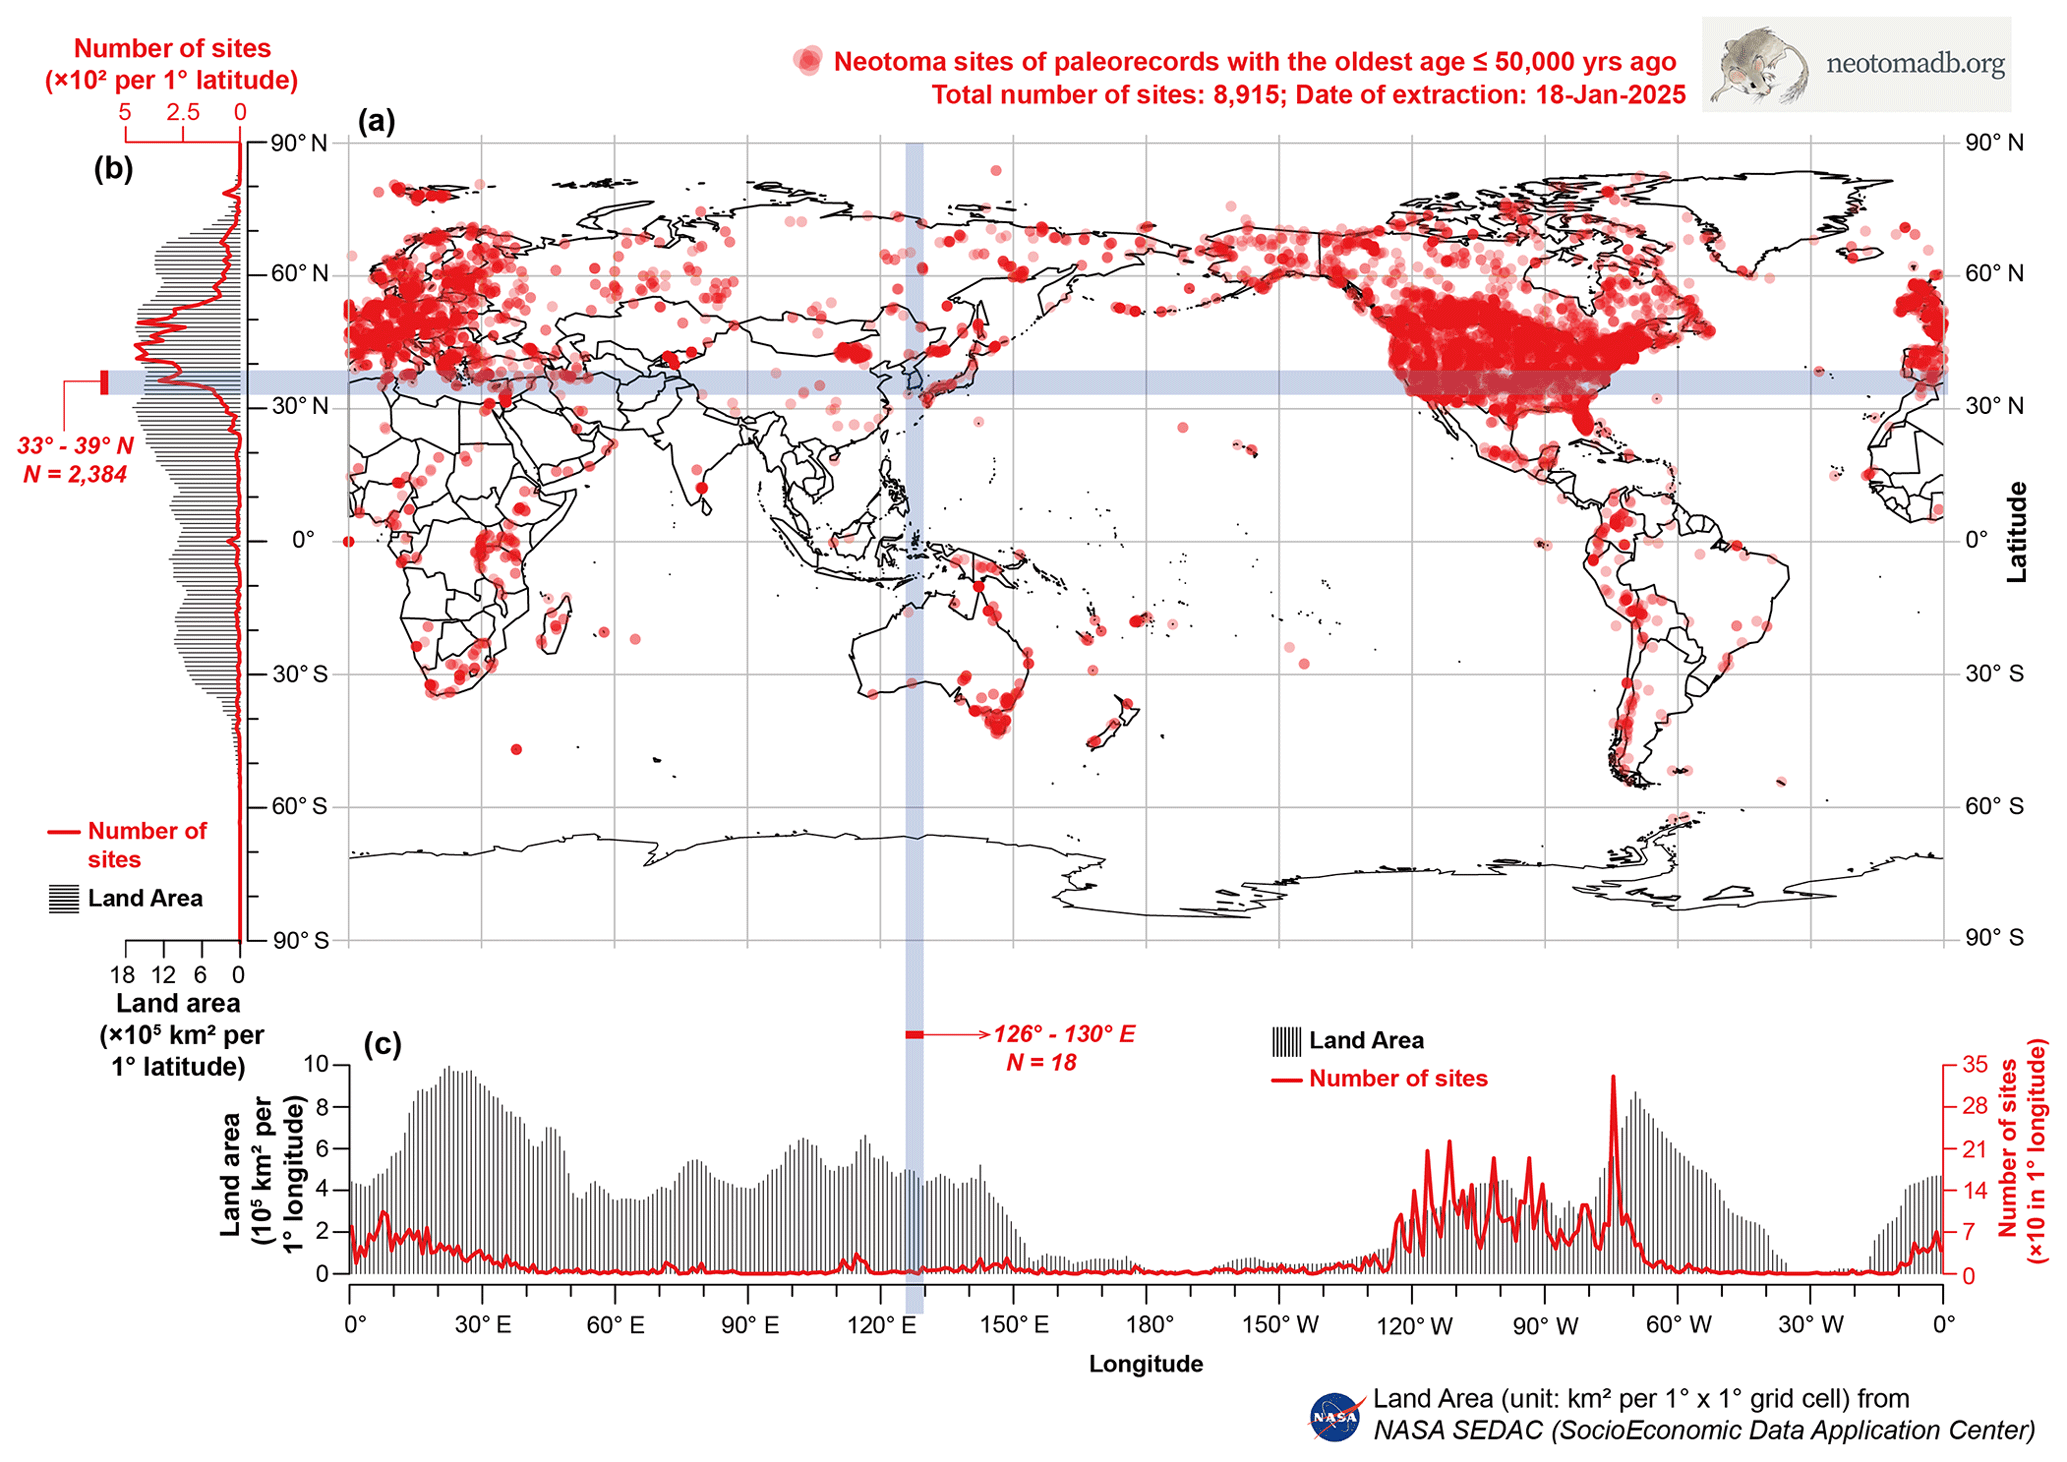
Figure 1Global distribution of sites with paleorecords (age range: ≤ 50 000 years ago) uploaded to the Neotoma Paleoecology Database (total sites: 8915; extraction date: 18 January 2025). These records were selected based on the availability of data within the last 50 000 years, excluding sites having only modern data–surface samples, pollen traps, and datasets with the oldest age being after 1950 CE. * The blue band indicates the Korean Peninsula and spatial gaps in site coverage. (b) Number of sites and total land area (105 km2) per 1° latitude. Land area represents the sum of land areas (unit: 105 km2) across all longitudes within each 1° latitudinal band. (c) Number of sites and total land area (unit: 105 km2) per 1° longitude. The land area estimates in (b) and (c) are derived from 1° resolution datasets of the Gridded Population of the World, Version 4 (GPWv4): Land and Water area, Revision 11 (Center for International Earth Science Information Network – CIESIN – Columbia University, 2021).
In this paper, we present the first public inventory of site-level metadata from paleoecological and paleoenvironmental research in South Korea (33 to 38° N, 124 to 132° E), comprising a total of 328 study sites compiled from 66 peer-reviewed publications over the past 20 years (2003–2023). Our dataset provides metadata on study sites and sediment and modern surface samples, including latitude, longitude, elevation, site description, proxy type, and chronological control. We compare the spatial coverage of the current dataset with that of the global-scale database and explore the significance of compiling data into a regional database (Fig. 1), highlighting the importance of understanding regional contexts through collaboration with domestic researchers who have knowledge of the local data and study sites (following the approach of Flantua et al., 2015). Using this inventory dataset as a reference, we continue our efforts to collaborate with the authors of the referenced publications and deposit the raw data into a relational database, which will be made accessible through GeoEcoKorea (GEK, https://geoecokorea.org, last access: 28 August 2025), an online platform offering open access to the database in both English and Korean.
We compiled 66 research papers published between 2003 and 2023 that presented proxy data from sediments and surface pollen samples in South Korean territory. The literature search followed four steps.
-
Step 1. Initial journal search: we searched three peer-reviewed Quaternary research journals (The Holocene; Palaeogeography, Palaeoclimatology, Palaeoecology; and Quaternary Science Reviews) using four keywords, “Korea”, “sediments”, “proxy”, and “pollen”,
-
Step 2. Author search: we compiled the names of all coauthors from the articles identified in the first step.
-
Step 3. Expanded journal search: using Google Scholar and DBpia (a Korean academic journal database, https://www.dbpia.co.kr/, last access: 28 August 2025), we examined additional journal articles by the authors identified in the second step.
-
Step 4. Compilation of research articles: we gathered articles related to Korean Quaternary proxy records published up to 2023 in the journals discovered in the first and third steps.
To evaluate the relevance of the compiled articles, we reviewed their abstracts and result sections. For proxy-based records, we selected articles that provided reliable age dating information, such as the names of accelerator mass spectrometry (AMS) laboratories where dating was conducted. This emphasis on accurate and precise geochronological reporting led to the exclusion of articles published before 2003, resulting in 66 publications.
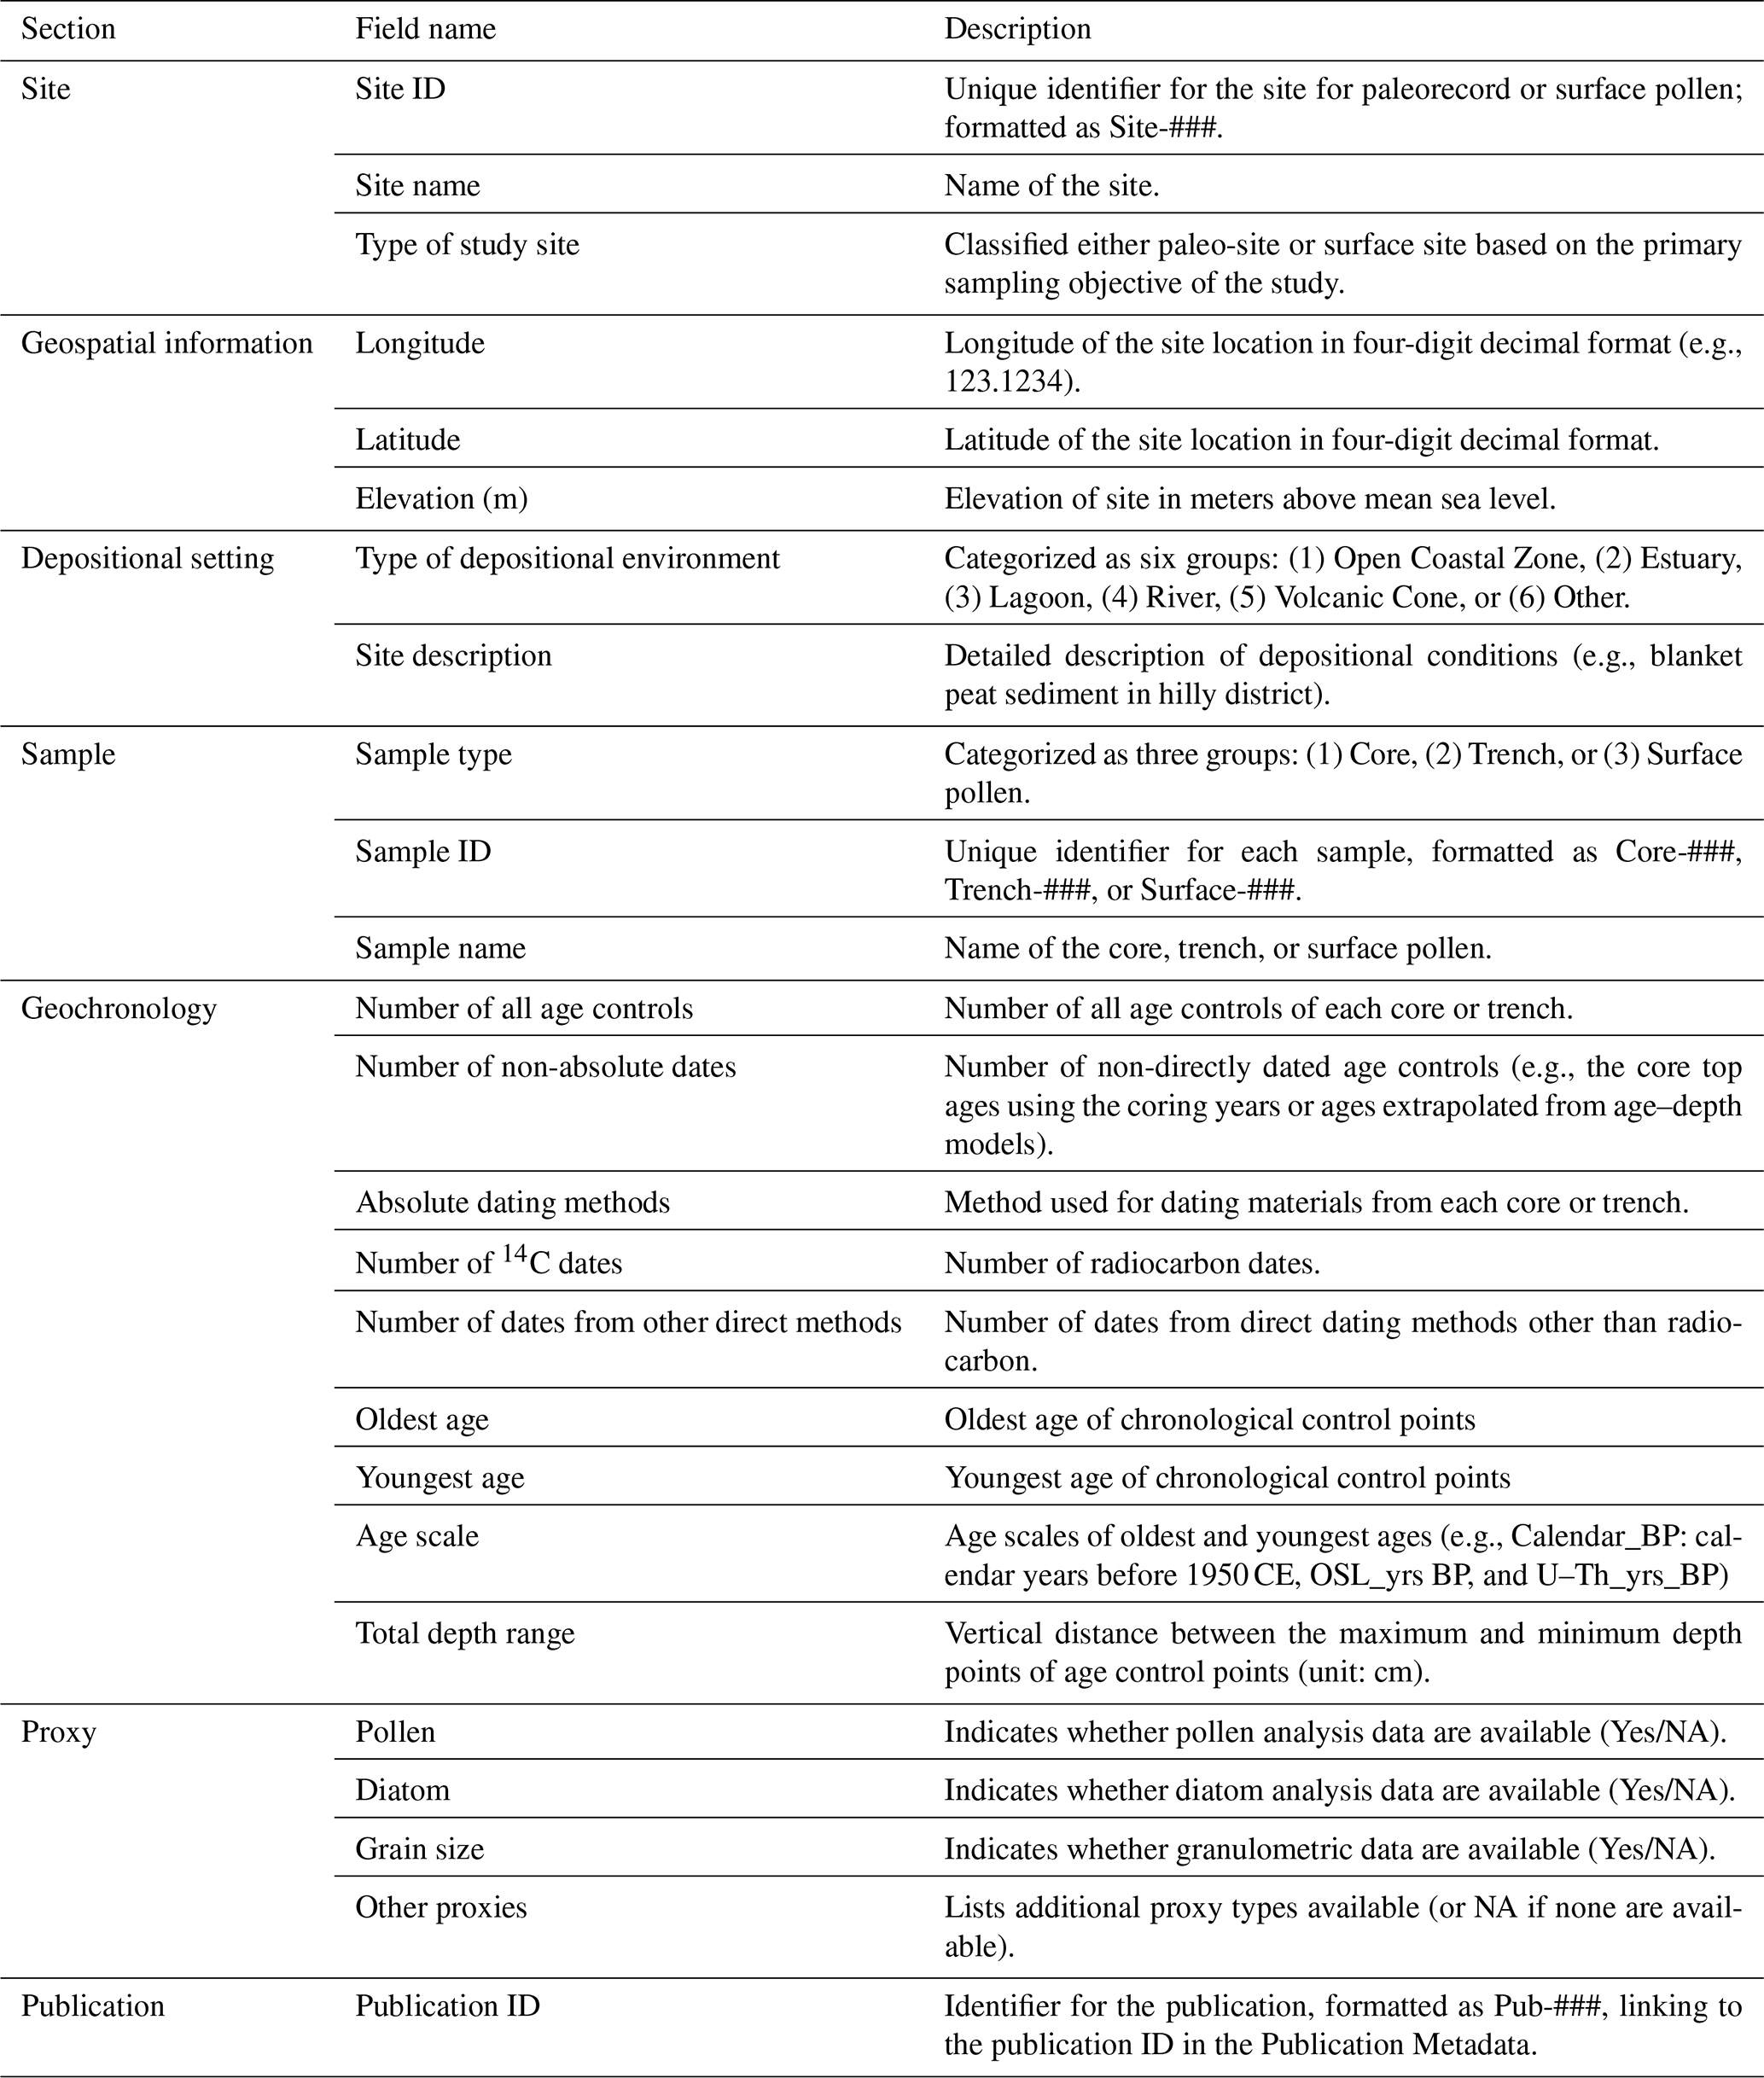
From the selected publications, we developed three datasets: I. Publication Metadata, II. Site Inventory, and III. Geochronology Data. The first two datasets are linked through a publication ID and the last two datasets through a site ID (Fig. 2). The Site Inventory dataset serves as the core of the other two datasets, including key information on study site and sample metadata (Table 1). The Publication Metadata contain citation details of the 66 articles covering study sites in the inventory dataset. The Geochronology Data comprise chronological information used for sediment records of the sites. Each dataset is accompanied by a Supplement worksheet titled “column description”, which defines the structure and format of the data fields (see the “Data availability” section).
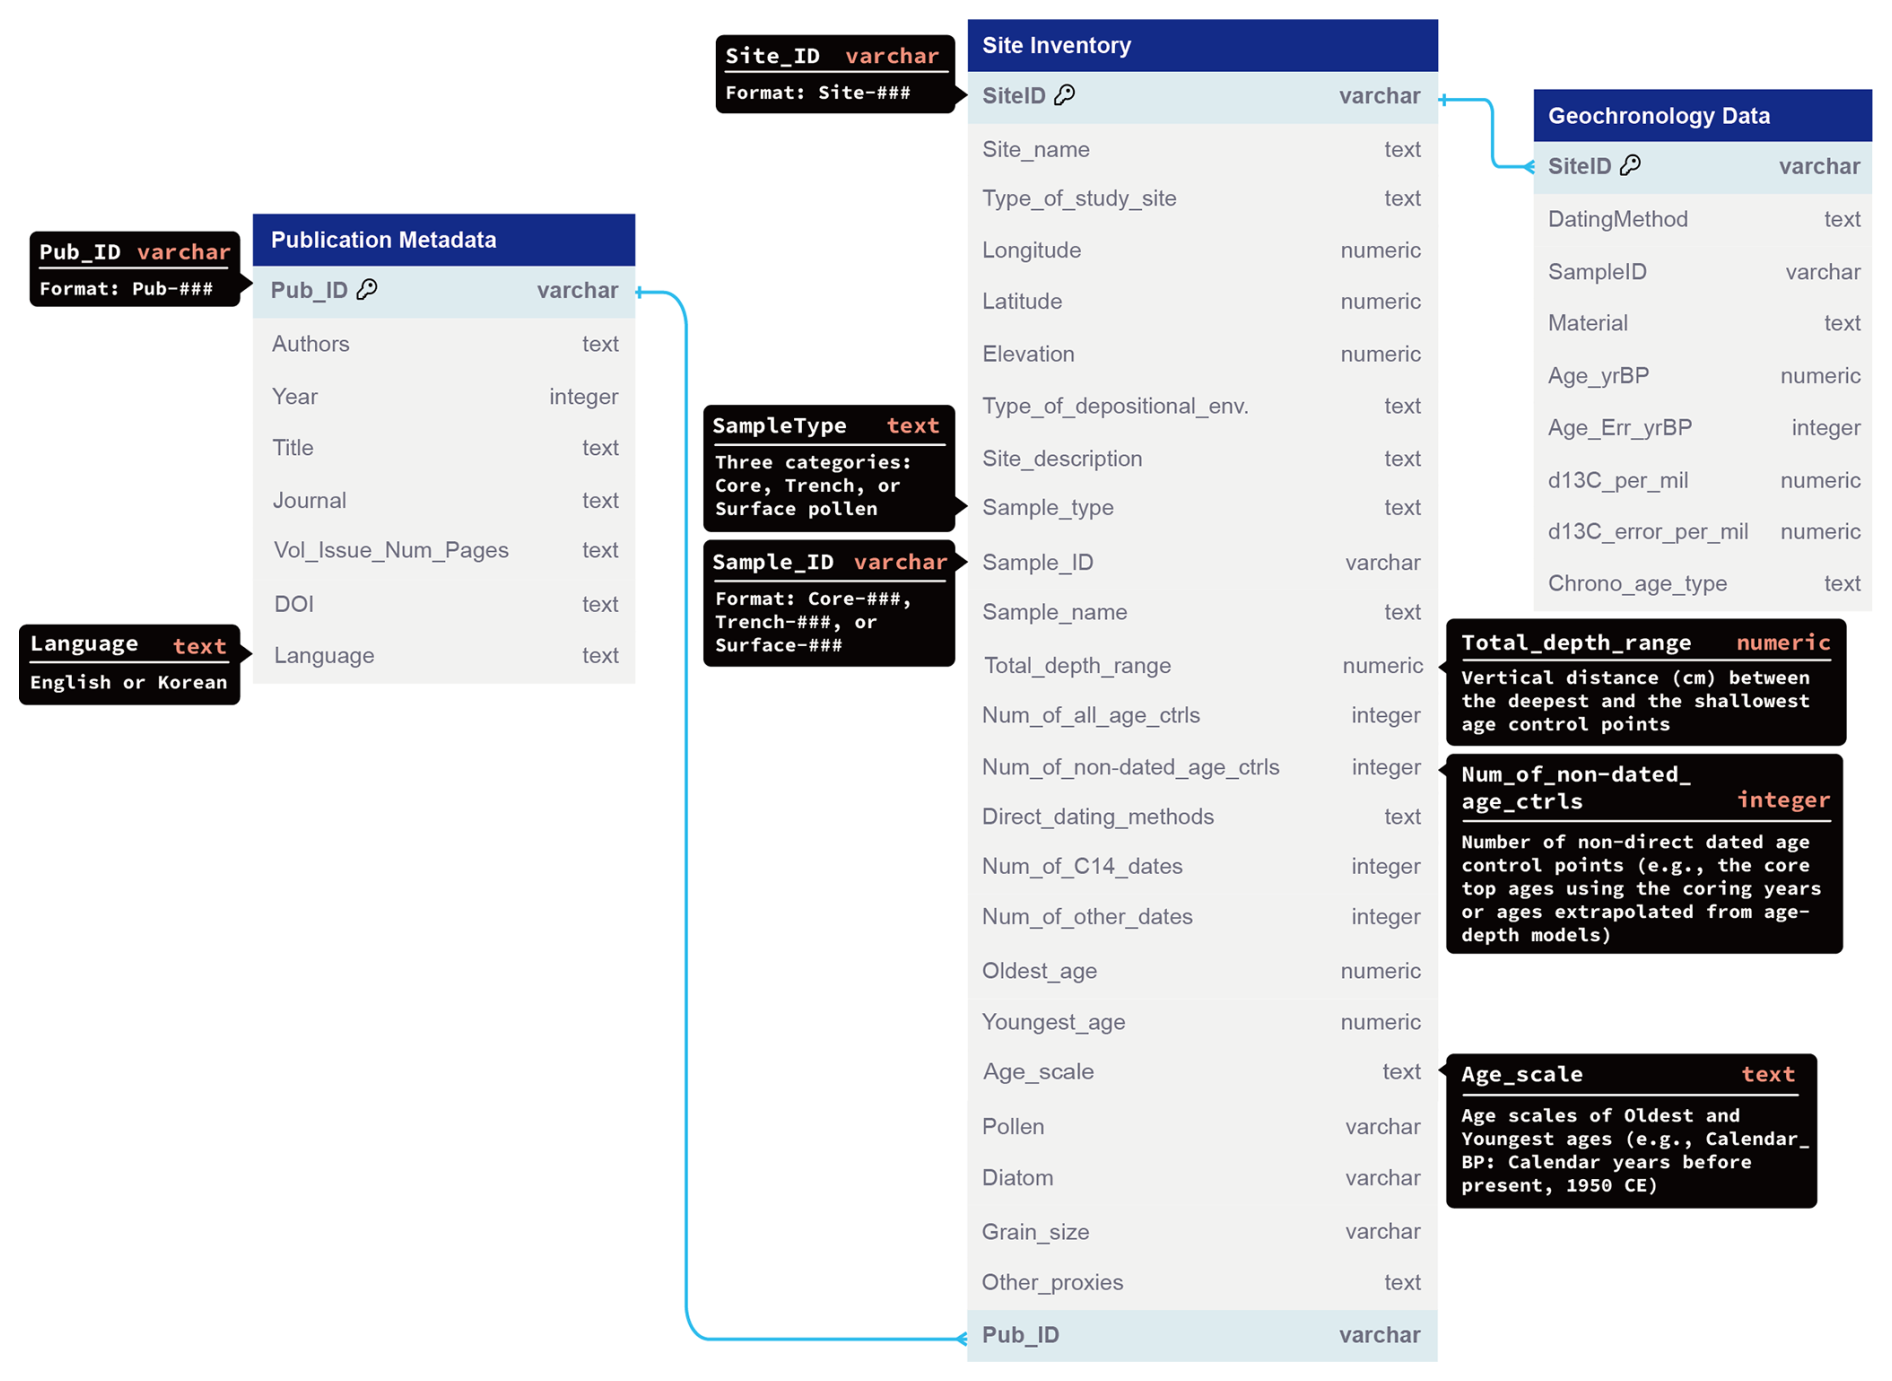
Figure 2Entity–relationship diagram (ERD) illustrating the three datasets built in this study. This ERD was created using dbdiagram.io. Data types, following standard conventions of SQL (Standard Query Language), include varchar (variable-length character strings), text (long-form text), numeric (decimal values), and integer (whole number). Table 1 provides details of data fields.
Table 1Description of data types in the Site Inventory dataset.
3.1 Dataset I: Publication Metadata
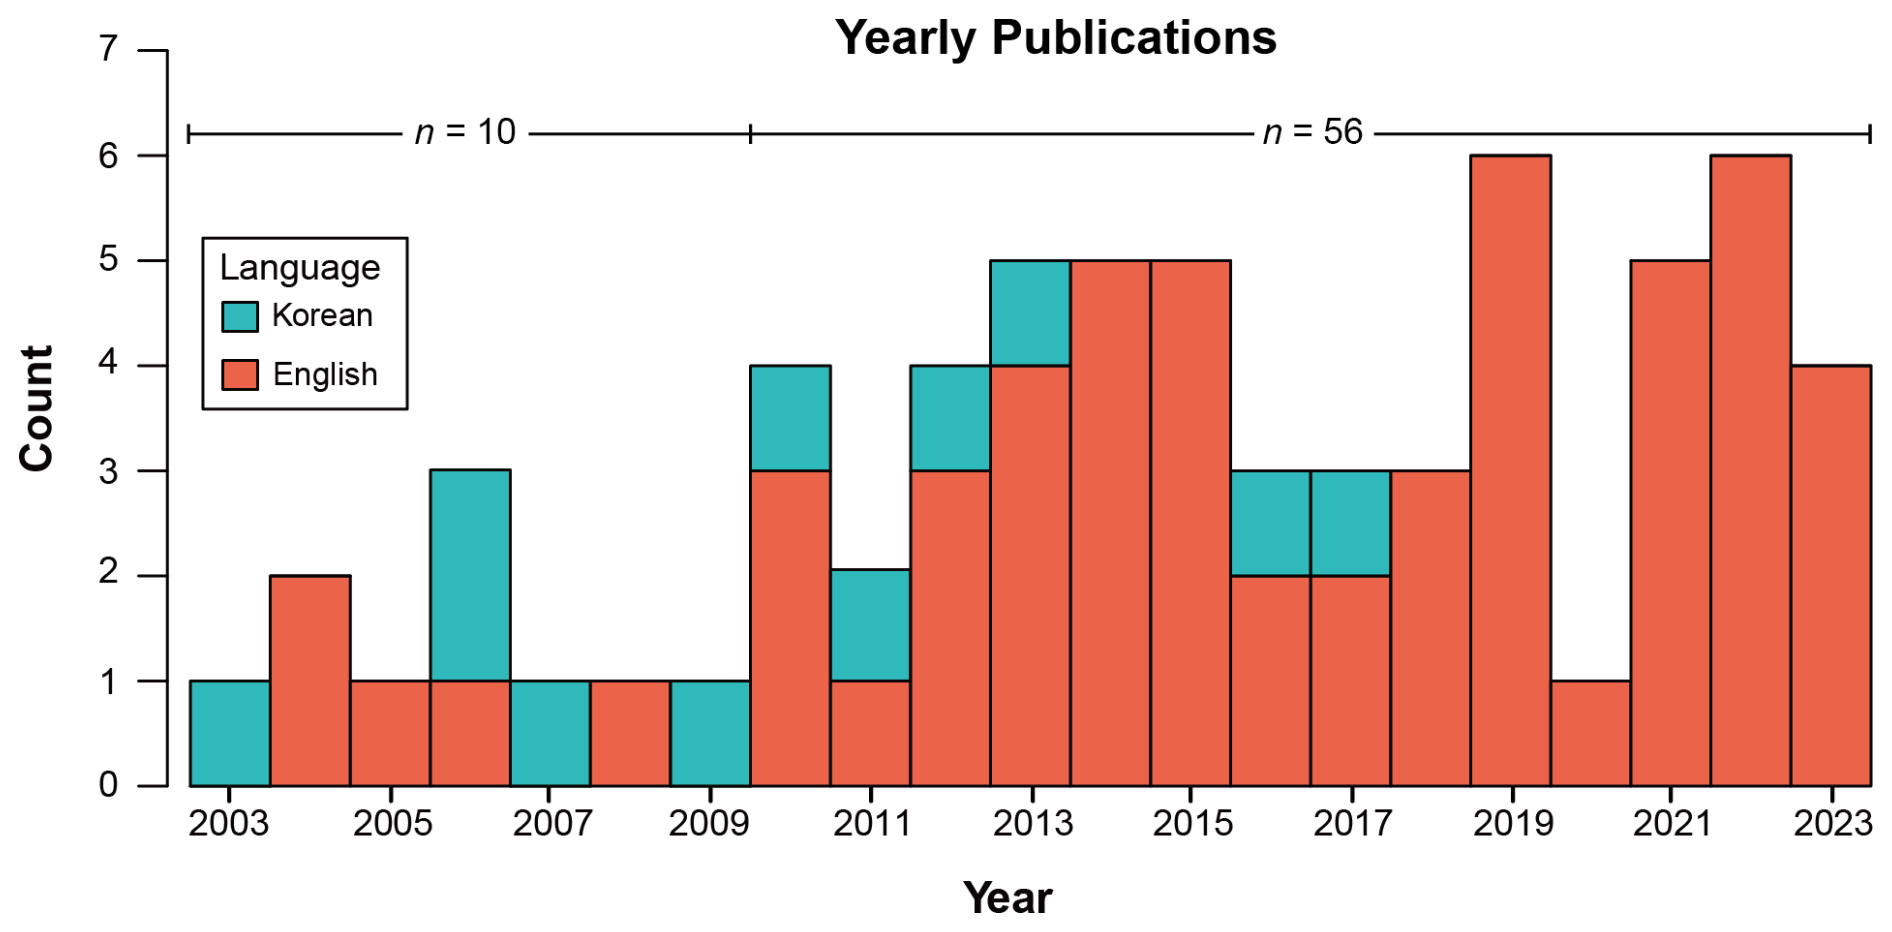
The Publication Metadata dataset contains information about the authors, publication year, title, and journal, as well as numbers of volume, issue, and pages, along with the DOI and language (either English or Korean). The annual number of papers has increased rapidly since 2010, driven by the growing number of English-written papers published in international journals (Fig. 3).
3.2 Dataset II: Site Inventory
This section outlines the data processing procedures for the Site Inventory dataset, with relevant details also summarized in the Supplement.
3.2.1 Type of study site
The Site Inventory dataset comprises 328 sites that consist of 72 paleo-sites with sedimentary records and 256 surface sites with surface pollen samples (Fig. 4). The paleo-sites were derived from 64 publications that presented paleorecords reconstructed from sediment sequences to investigate the temporal sequence of the targeted proxy and past ecosystem elements (e.g., fossil pollen and past vegetation–climate interactions). The surface sites were presented in two articles that investigated modern surface samples that provide spatial information on the modern ecosystems, serving as the basis for the space-for-time substitution method (e.g., surface pollen and modern vegetation–climate associations) (Chevalier et al., 2020).
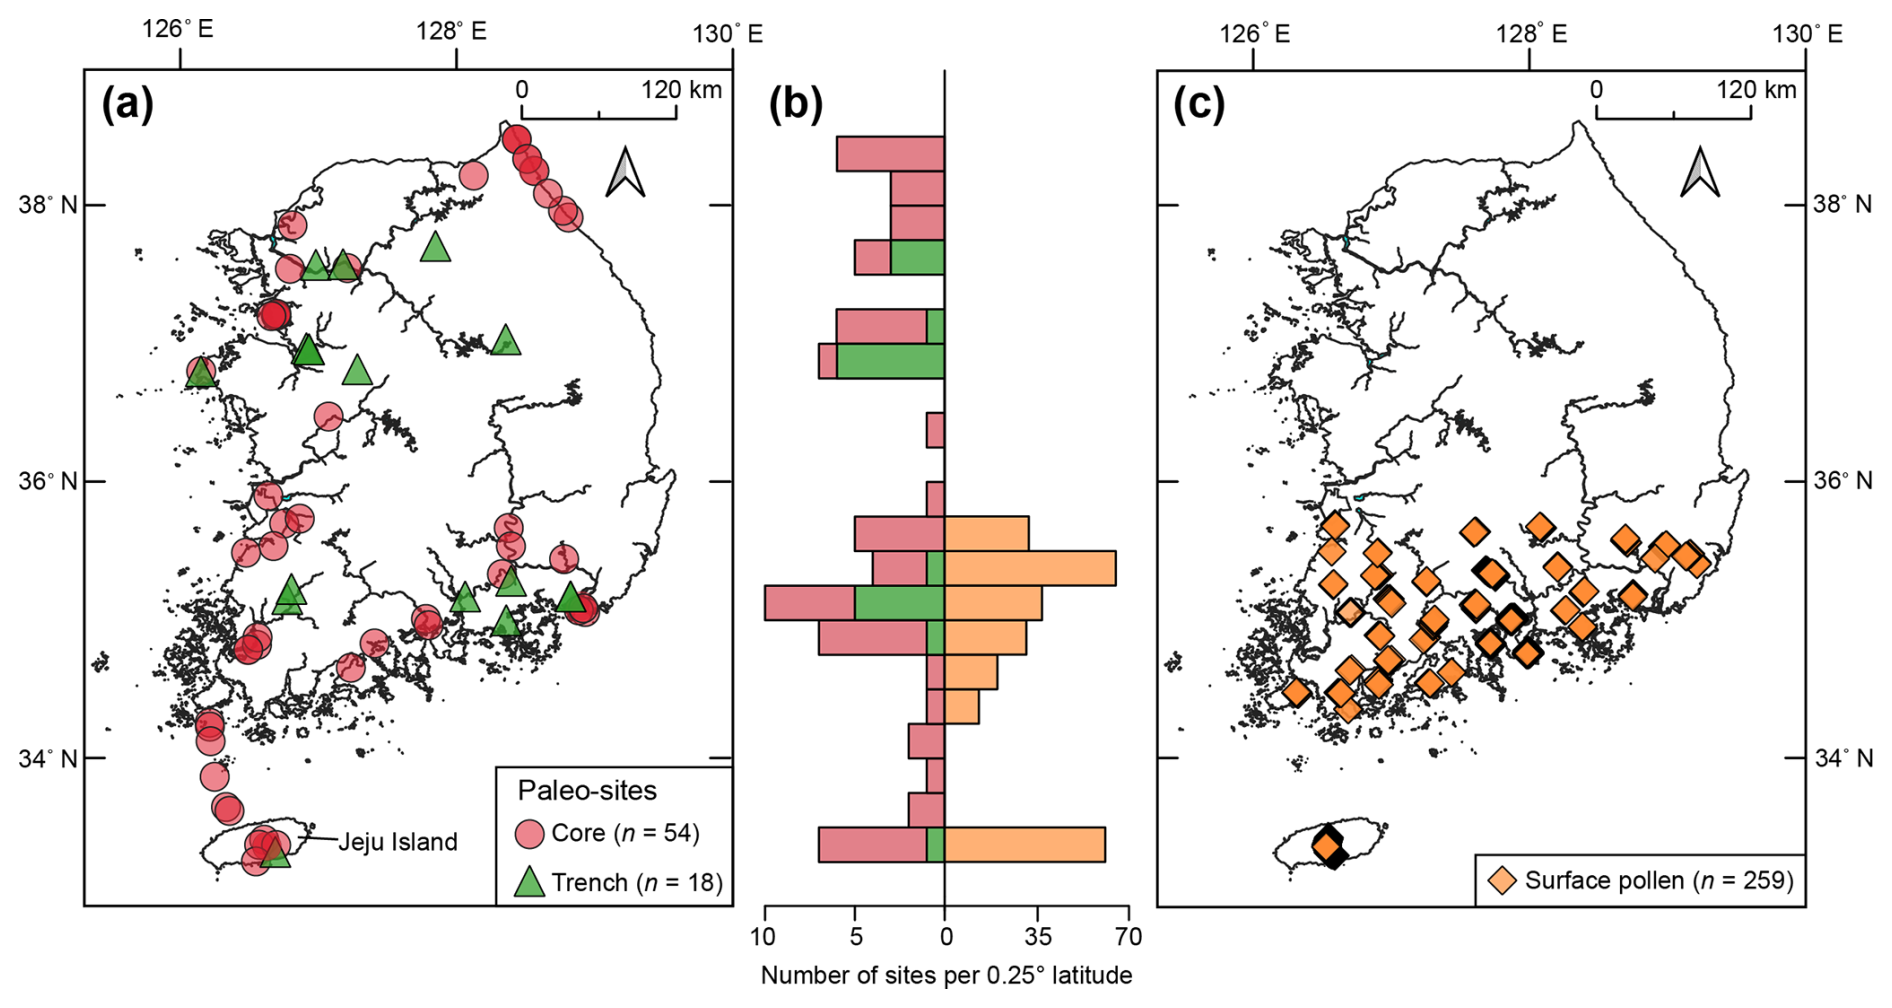
Figure 4Geographic distributions of sites. (a) Paleo-sites. (b) Surface pollen sites. Site markers may appear overlapped in areas with high site density. Elevational distributions of the sites are shown in Fig. 6.
3.2.2 Geospatial coverage
Each site is georeferenced using geographic coordinates and elevation. We used coordinates and elevations reported in the papers when available. If not, we estimated these data using site maps from the articles, cross-referencing with Google Earth. Site locations were recorded in decimal degrees (to four-digit precision) with elevations in meters above mean sea level (unit: m).
The distribution of paleo-sites and surface sites shows no significant variation in longitude but distinct patterns in elevation (Fig. 5) and latitude (Fig. 6). In the geographic extent (33.2508 to 38.4808° N, 126.1486 to 128.9719° E) of paleo-sites, their elevations (range: −156 to 1305 m; median: 5 m) are consistent with the tendency of depositional environments for stratigraphic sediments typically found at low elevations (Fig. 5a), although their latitudinal distribution exhibits broad coverage across South Korea except for the central eastern region (Fig. 6a). In contrast, the surface pollen sites (33.2916 to 35.6913° N, 126.3090 to 129.2132° E) span a wider range of elevation (range: 95 to 1867 m; median: 605 m) compared to the paleo-sites (Fig. 5b) but are concentrated in the southern regions (Fig. 6b). These surface pollen sites were primarily contributed by two pioneering studies: Park and Park (2015), who investigated 39 elevational transects along mountain slopes on Jeju Island to reflect temperature gradients, and Lee et al. (2022), who studied 37 transects in the southern part of the Korean Peninsula for modern pollen–climate references (Fig. 6b). It is interesting to note the high elevations of Jeju's volcanic-cone wetland sites (Fig. 7), which locally shift the statistical distribution of the island paleo-sites (range: 51 to 1305 m; median: 692 m)
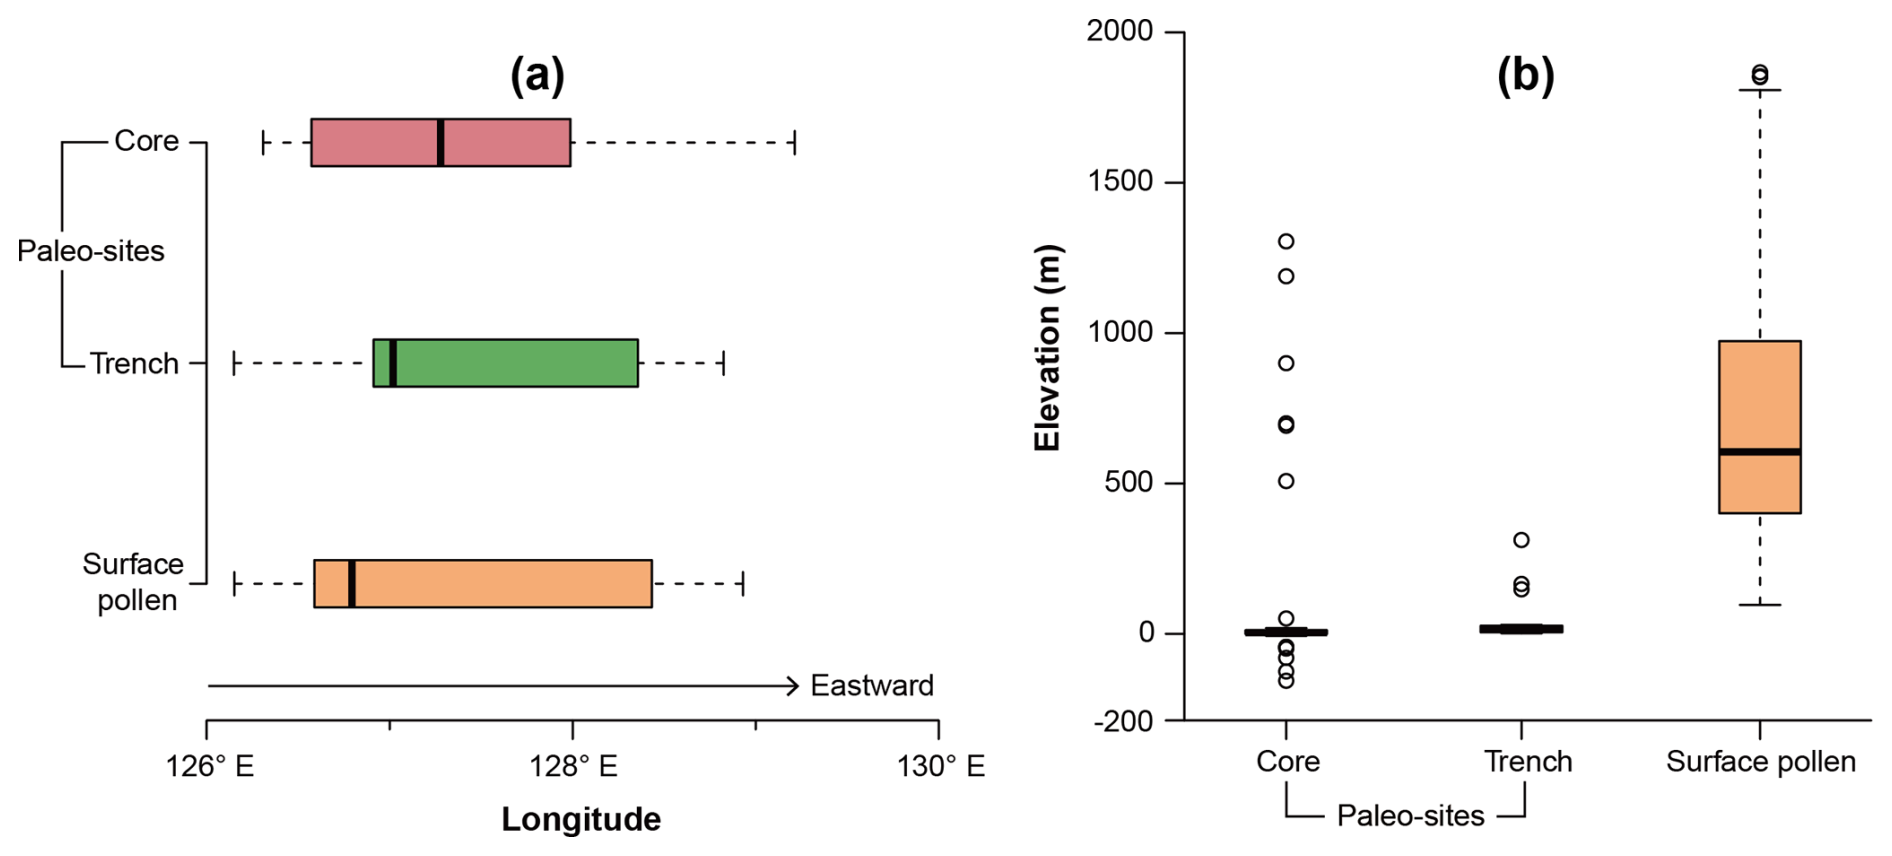
Figure 5Box plots of site locations and elevations. (a) Longitudinal distribution of sites. (b) Elevational distribution of sites.
3.2.3 Sample type
Three sample types (surface pollen, core, and trench) for the Site Inventory dataset represent the study approaches commonly used in South Korean Quaternary paleo-reconstruction research (Kim et al., 2024). Surface pollen samples were systematically targeted and obtained from the soil surface on mountain slopes on Jeju Island and the southern region of the mainland (Lee et al., 2022; Park and Park, 2015). For sediment samples, either coring or trenching was employed to obtain the sediments for various proxy analyses, preserving the original stratigraphy of the layered, aged sediments. Coring generally involves inserting empty tubes into sediments to extract vertically long and continuous sediments embedded in the tubes. Trenching involves collecting subsamples directly from stratigraphic sequences of exposed outcrops. Since trenching was unsuitable for submerged sites, coring was used more frequently at paleo-sites than trenching (Fig. 4).
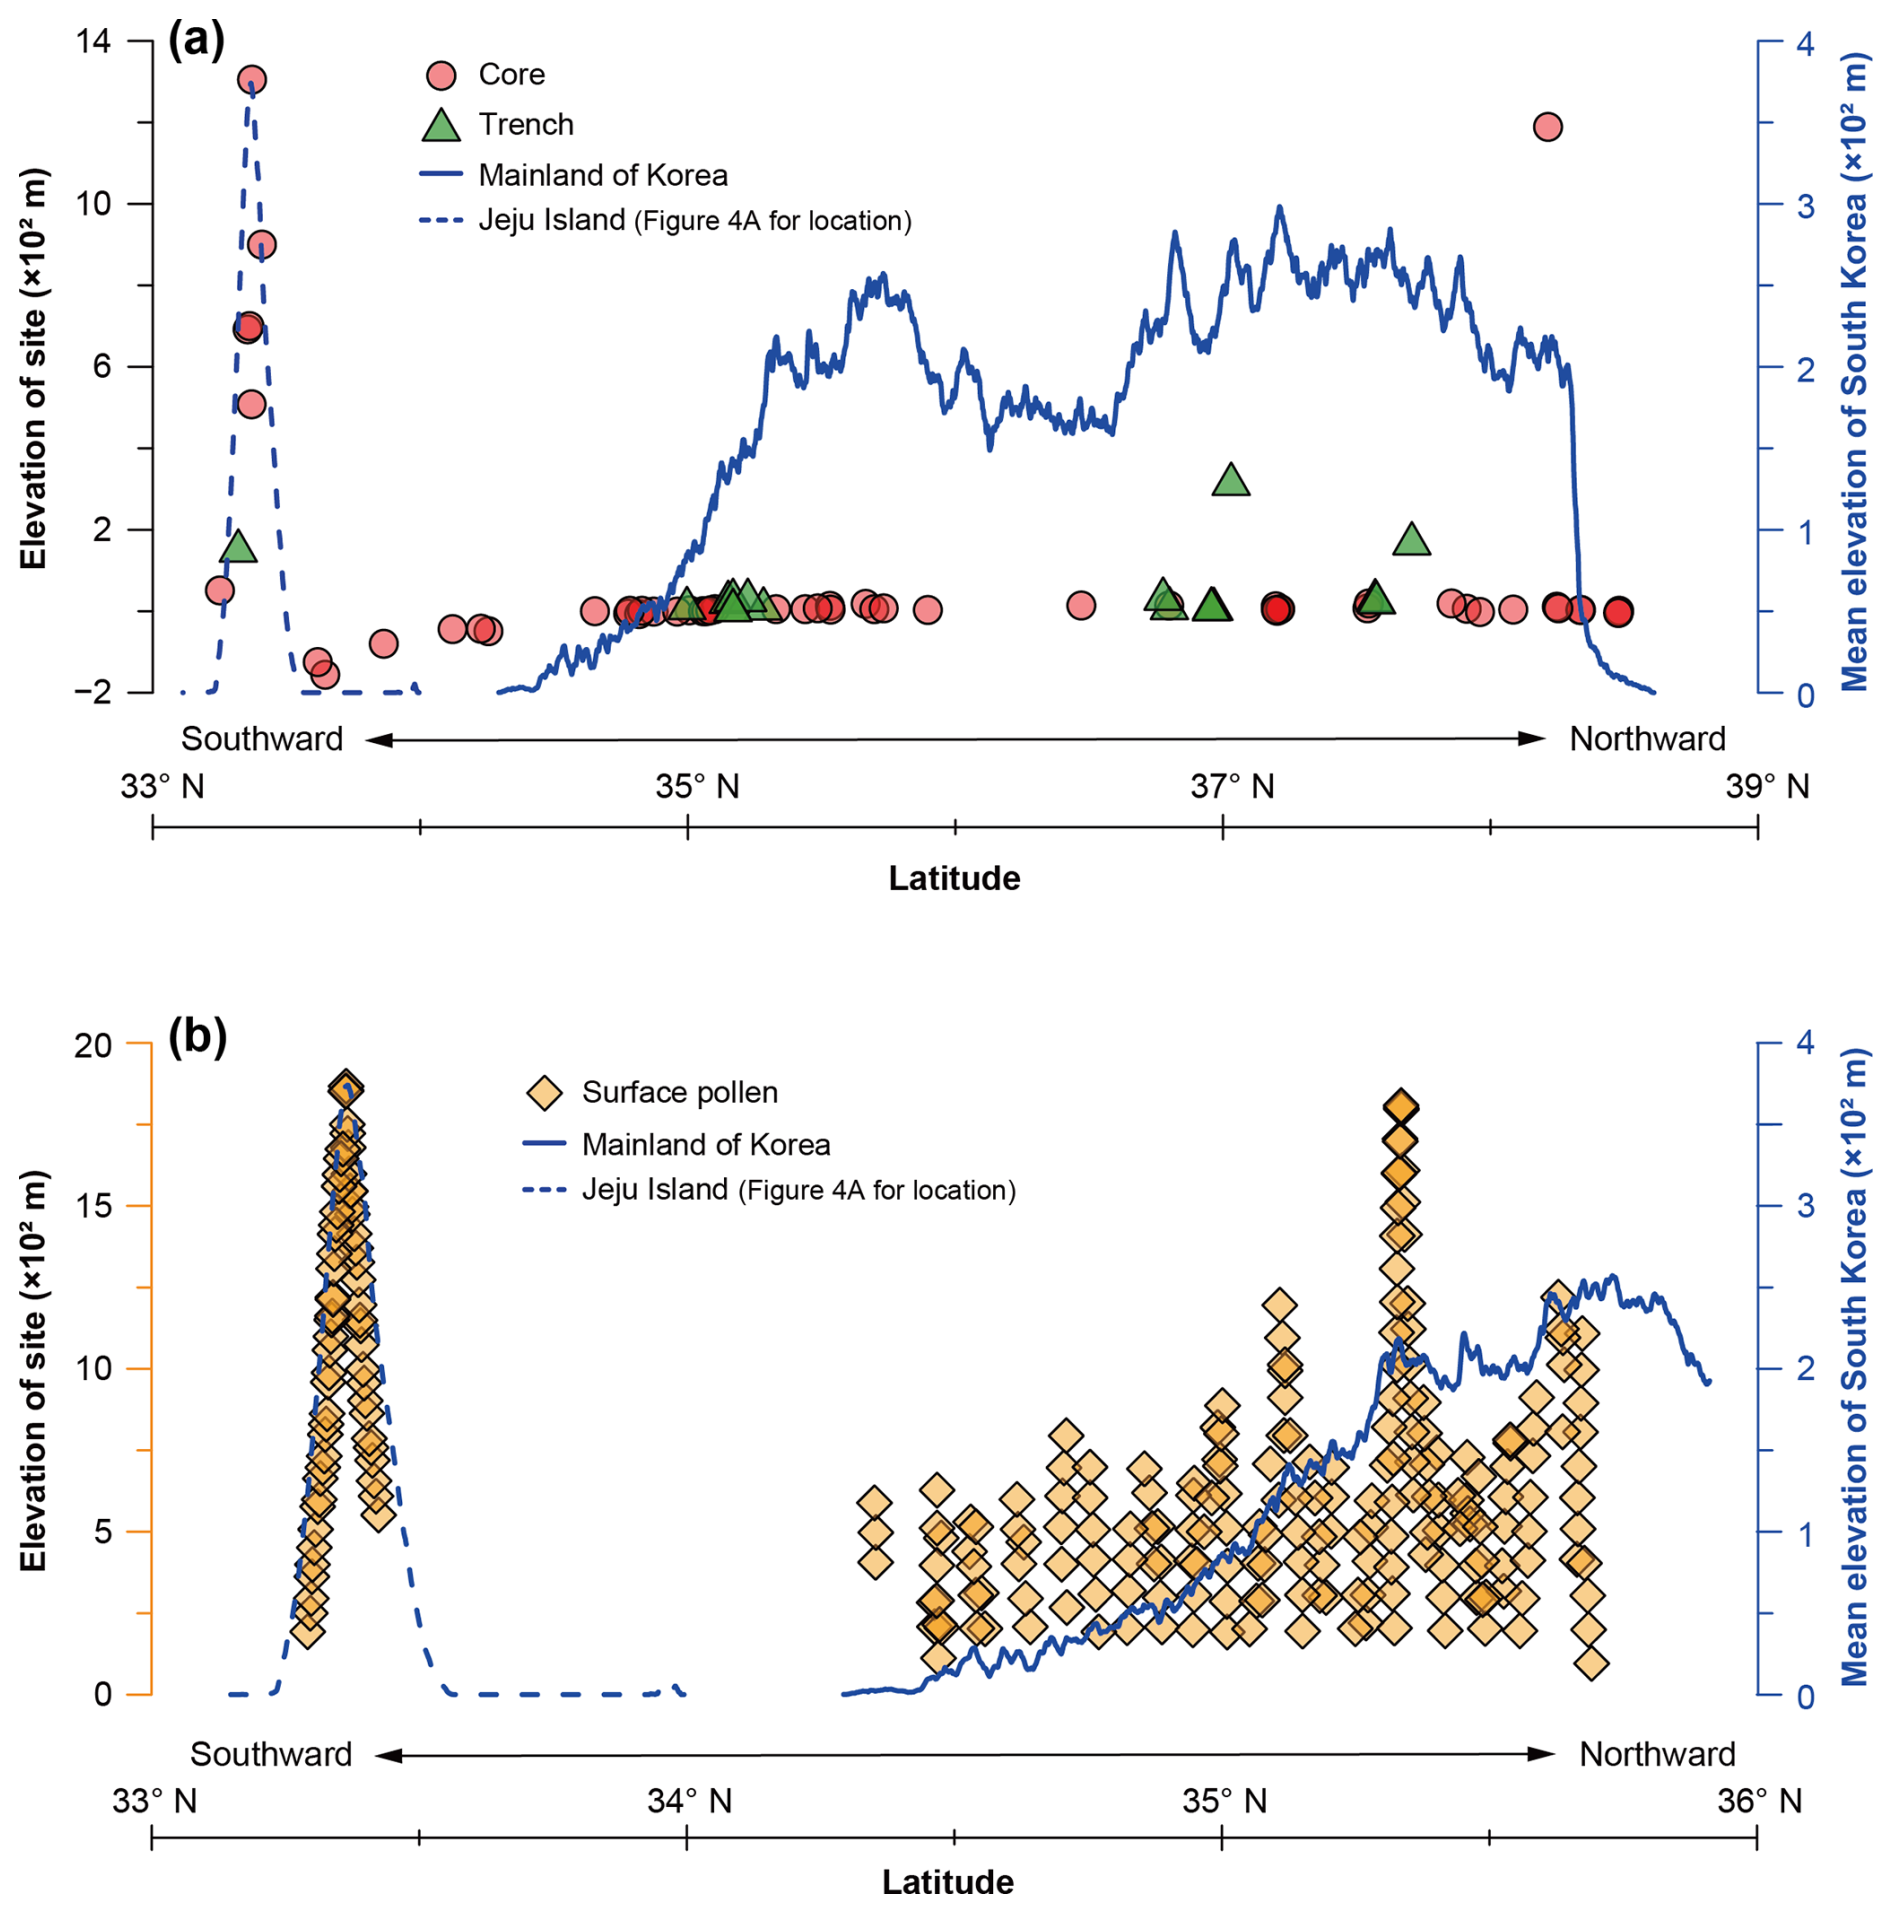
Figure 6Elevational distribution of sites. (a) Paleo-sites. (b) Surface pollen sites. These plots have different latitudinal ranges (a: 33 to 39° N, b: 33 to 36° N). The blue lines display mean elevations along a latitudinal gradient, with averaged elevations across all longitudes within the mainland (solid line) and Jeju Island (dashed line). The elevation lines are drawn using Shuttle Radar Topography Mission (SRTM) digital elevation model (DEM) data (void-filled, 3 arcsec for global coverage) (NASA JPL, 2013), downloaded via the EarthExplorer (https://earthexplorer.usgs.gov/, last access: 28 August 2025). The location of Jeju Island is shown in Fig. 4a.
3.2.4 Depositional setting
The depositional environments of paleo-sites are categorized into six groups: open coastal zone, estuary, lagoon, river, volcanic cone, and other (Table 2). The open coastal zone encompasses a set of environments dominantly influenced by oceanic depositional processes, such as beaches, nearshore areas, and continental shelves. Estuary and lagoon are classified separately based on energy conditions within the transitional zone between terrestrial and oceanic sedimentation, with estuary characterized by high-energy conditions and lagoon by low-energy conditions. The river category includes depositional environments such as floodplains, backswamps, and other fluvial settings associated with rivers and streams. The volcanic cone category refers to wetland systems such as lakes, bogs, or swamps in the craters of cinder cones scattered across Jeju Island, the largest island of South Korea, located to the south of the mainland. The “other” category comprises sites with depositional settings that do not fit within the other five groups, and because surface pollen samples were all from the montane soil surface, they were also classified under the “other” category. The paleo-sites can be broadly categorized into two groups, coastal and terrestrial sites. The coastal sites (n=41), including open coastal zone, estuary, and lagoon, outnumber non-coastal sites (n=31). River is a more commonly sampled site type than the other non-coastal categories – volcanic cone and other (Fig. 7b).
Table 2Number of sites (total n=72 with multi-proxy n=57 and mono-proxy n=15) for paleo-records by type of sample, depositional environment, and proxy.
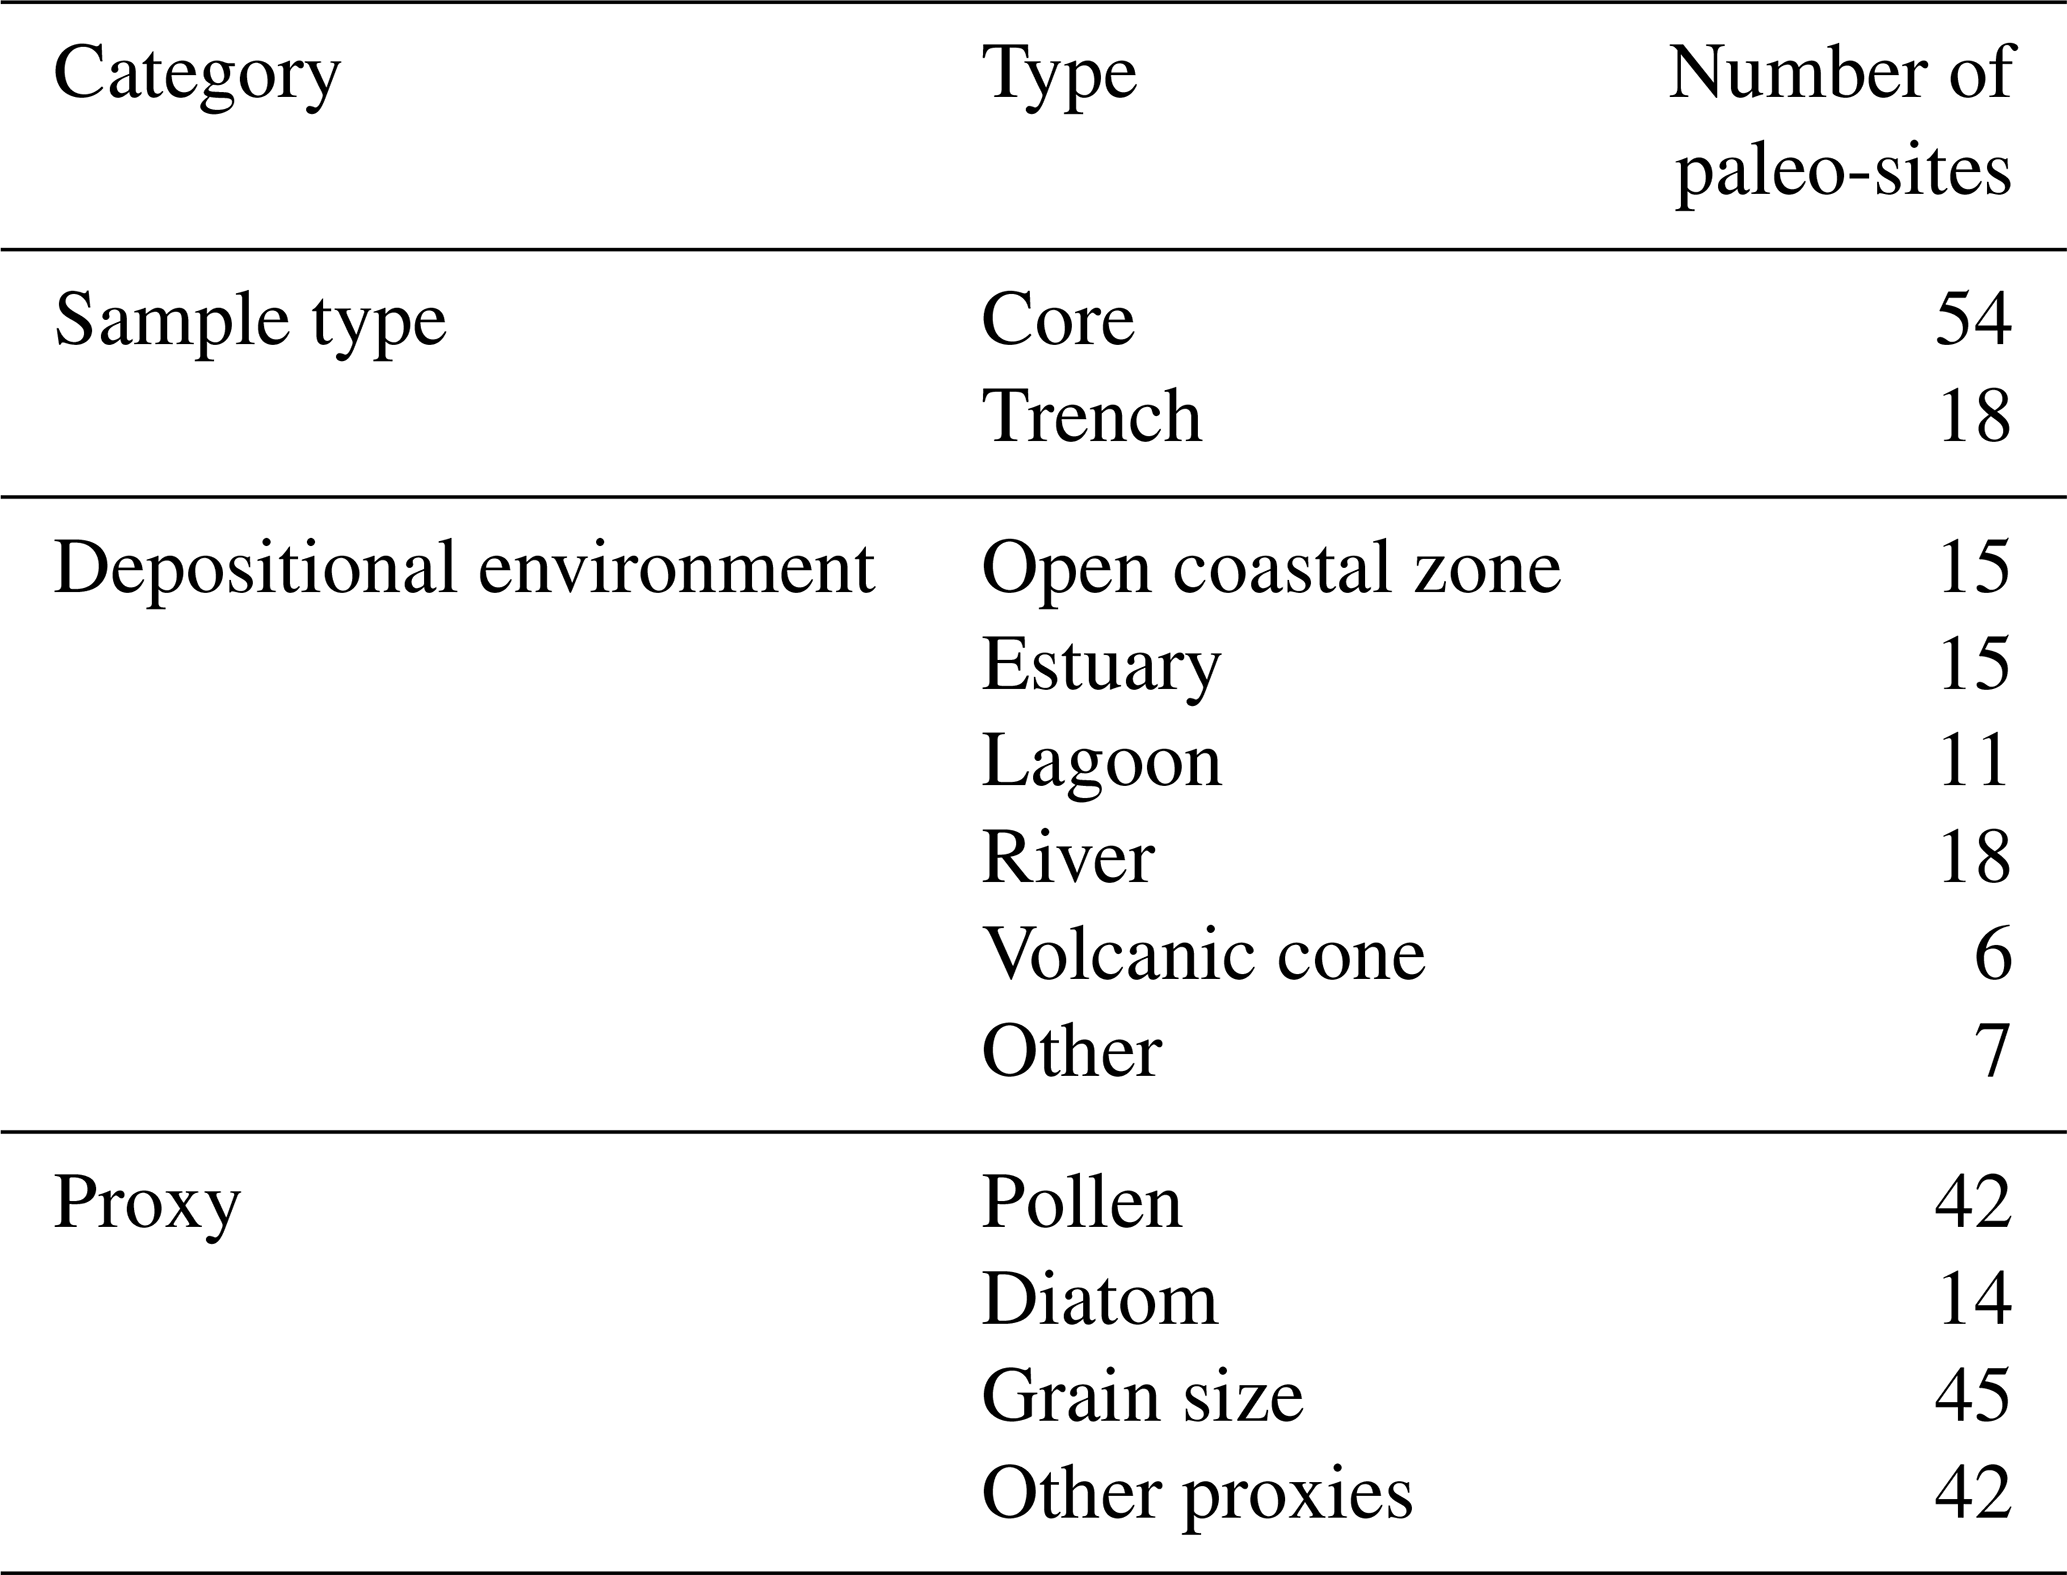
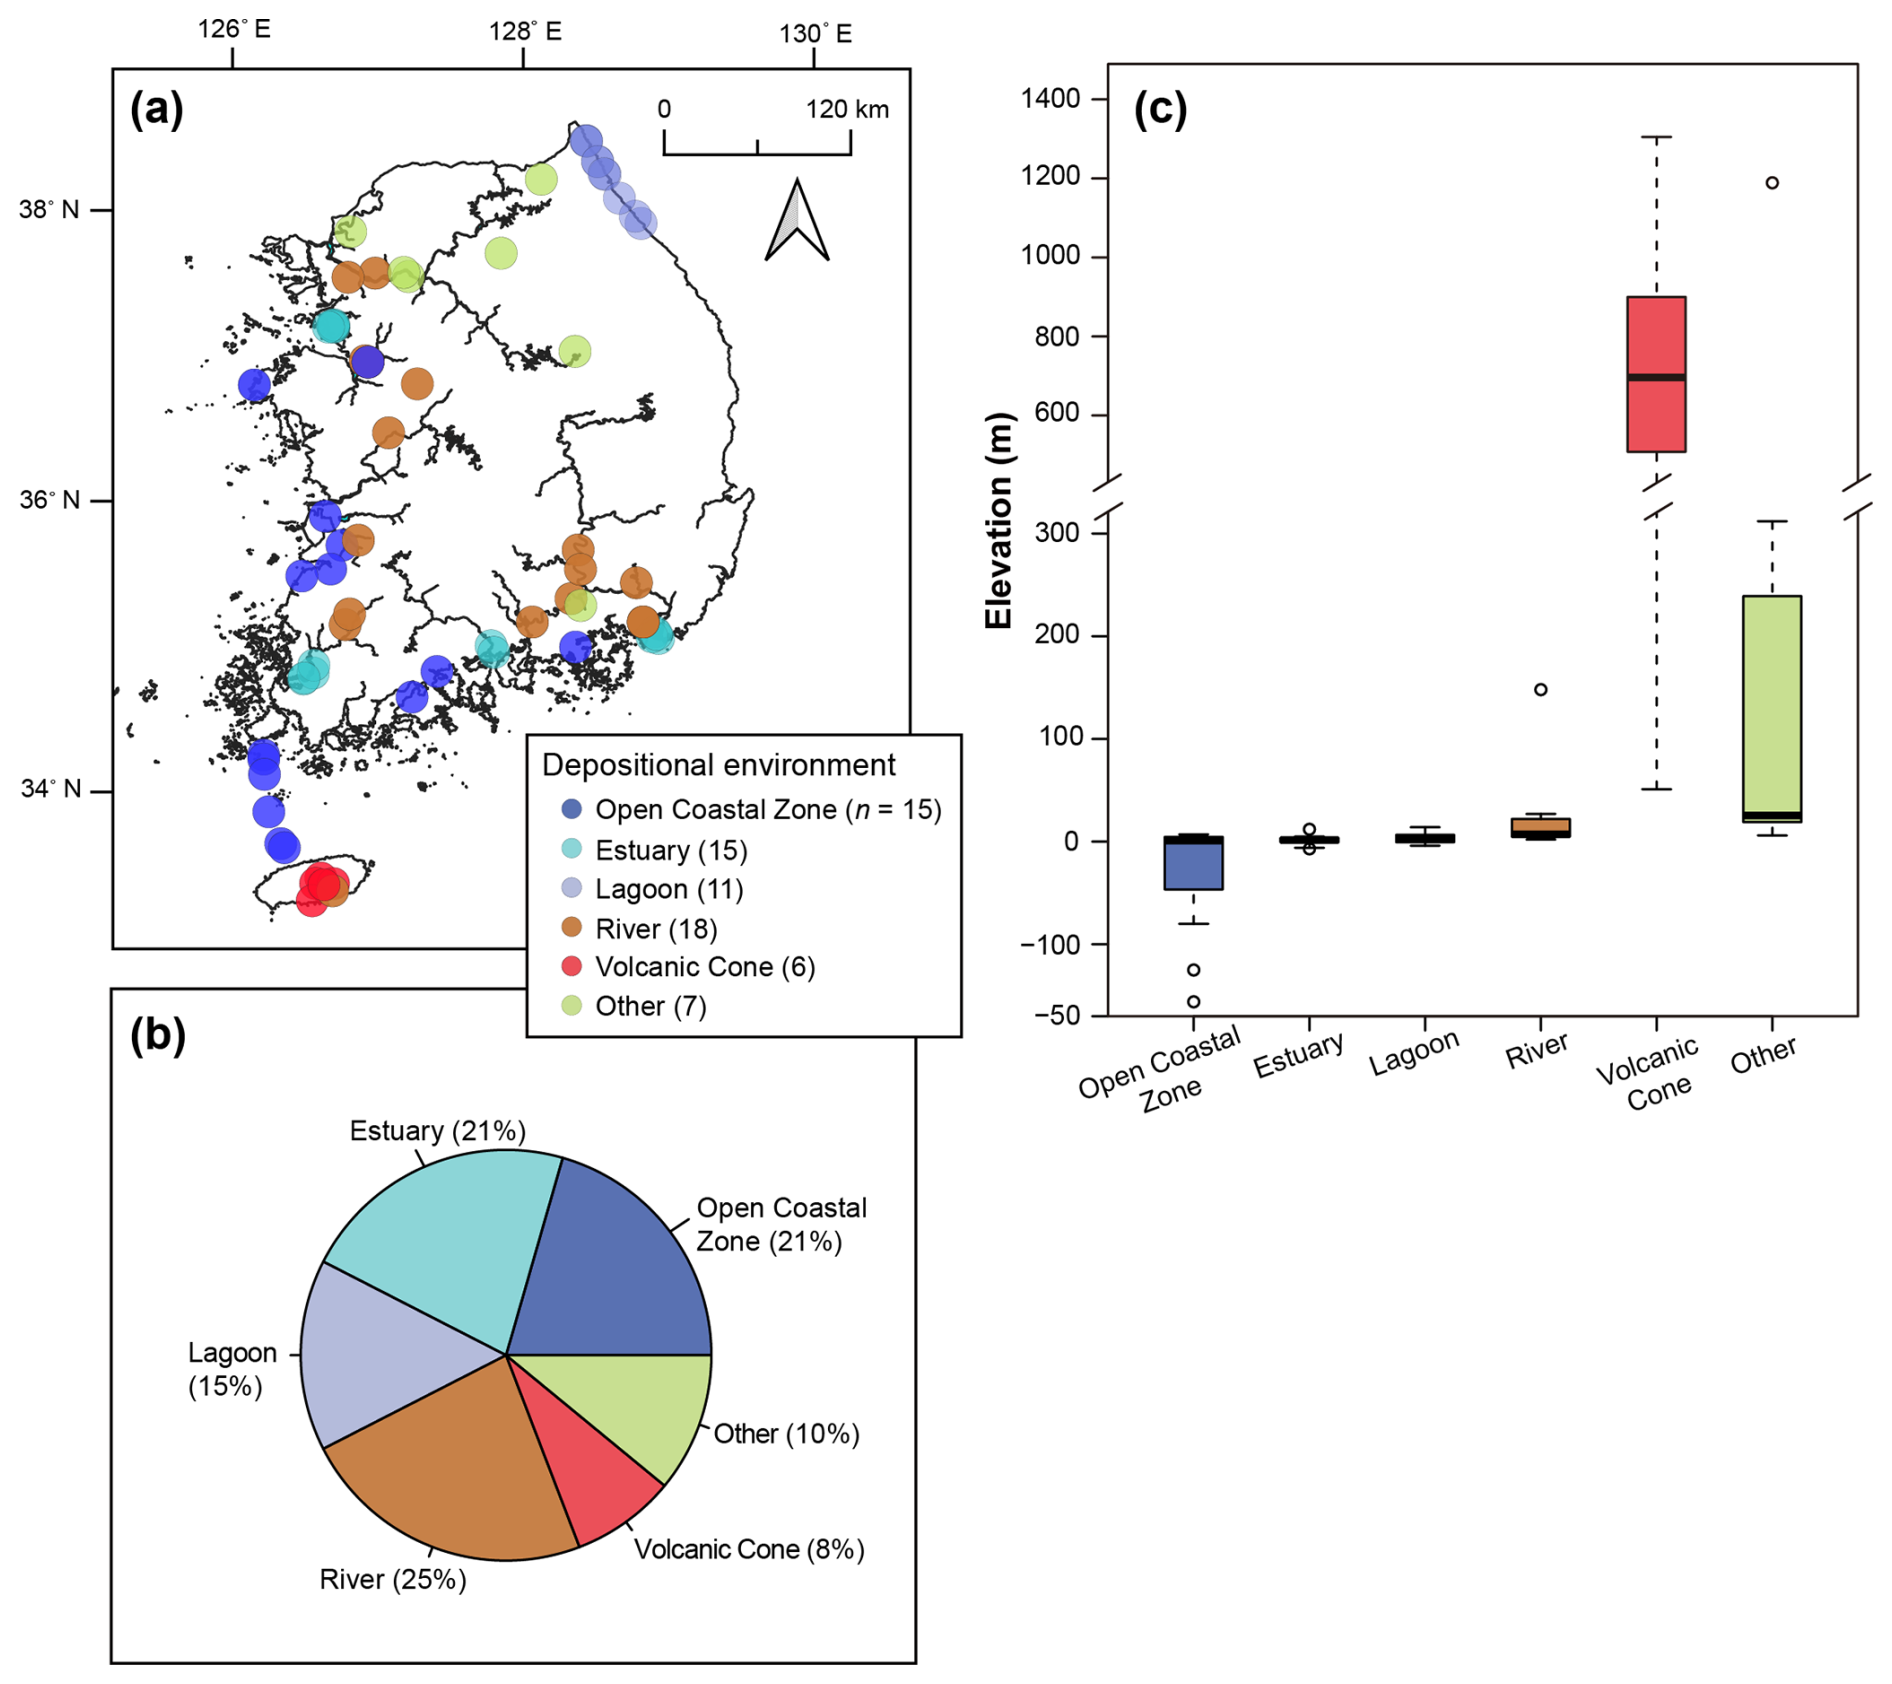
Figure 7Paleo-sites (n=72) categorized by six types of depositional environments. (a) Geographic locations of sites. (b) Proportion of sites by depositional environment. (c) Box plots of elevations. The median elevations for each environmental type are as follows: open coastal zone (1 m), estuary (1.5 m), lagoon (3 m), river (10 m), volcanic cone (696 m), and other (21 m).
3.2.5 Geochronology
The chronological data are organized into eight data fields: number of all age controls, number of non-absolute age controls, absolute dating methods, number of C-14 dates, number of other absolute dates, oldest age, youngest age, age scale, and total depth range (Table 1).
A total of 812 age control points compiled from 72 paleo-sites are classified into non-absolute and absolute types (Fig. 8a). The non-absolute age controls (n=28) consist of core top (n=22) and estimated ages (n=6). Core top ages are assigned to the sediment surface as reference ages corresponding to the year of sampling. Estimated ages are extrapolated from age–depth models. The absolute age controls (n=784) are obtained by three dating methods: radiocarbon (14C dates; n=623), optically stimulated luminescence (OSL dates, n=157), and uranium–thorium (U–Th dates; n=4) dating. Among these absolute age controls, 14C dating has been exclusively used to construct the geochronology of sediments at 55 out of 72 paleo-sites (Fig. 8b).
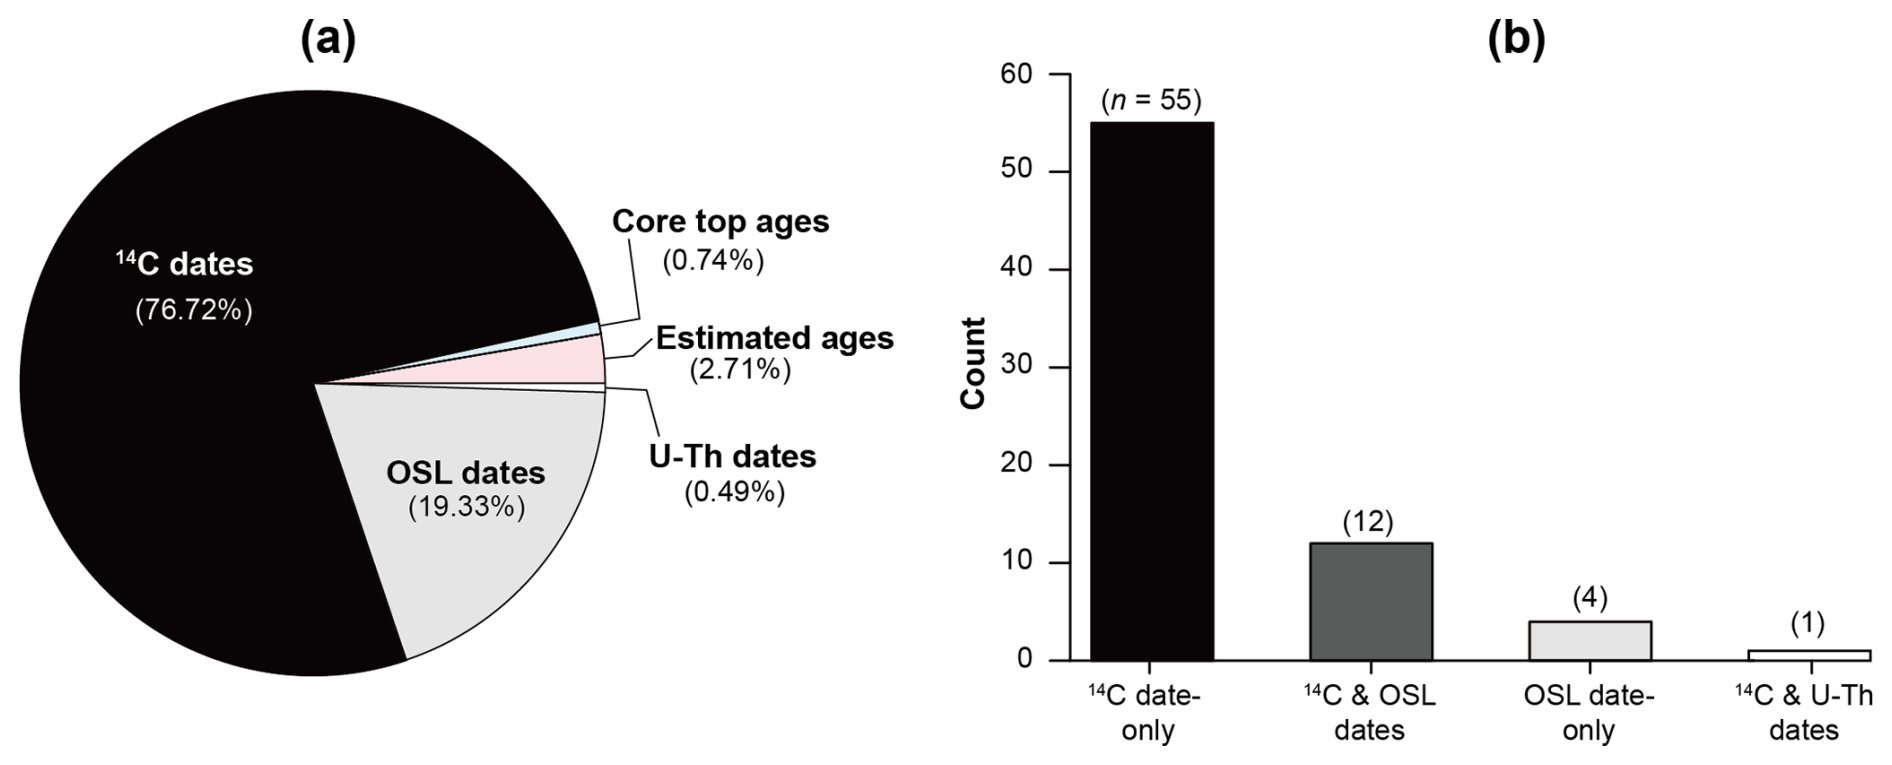
Figure 8(a) Pie chart showing the proportional distribution of age control types, including three direct dating methods, 14C, OSL, and U–Th, and two indirect controls, core top ages and estimated ages derived from age–depth modeling. Percentages may not total 100 % due to rounding. (b) Bar plot showing the number of paleo-sites grouped by direct dating methods: sites dated only by 14C, by both 14C and OSL, by OSL only, and by 14C and U–Th.
Oldest and youngest ages are reported in calendar years before present (BP) using 1950 CE as the reference point for “present”. For paleo-sites, these two endpoints correspond to ages of the youngest and oldest age control points used in age–depth models in the original studies. This age selection is made not based on depth, as age reversals frequently occur within sediment sequences, obscuring reliable geochronological boundaries of paleorecords. If either age is based on a radiocarbon date, the lower (oldest) or upper (youngest) bound of the 95 % calibrated range is documented using the IntCal20 or Marine20 calibration curves through the IntCal R package (Blaauw, 2022; Heaton et al., 2020; Reimer et al., 2020). When the core top age reflects the youngest age, it is calculated by subtracting the year of coring or trenching from 1950 CE. If the collection year is unspecified, a value of 0 is assigned for the youngest, following the same approach used for post-bomb 14C dates. For surface samples, the oldest and youngest ages are derived by subtracting the sampling year from 1950 CE. The publication year is used as the sampling year when it is unavailable in the original article. For OSL and U–Th dates, the lower (oldest) and upper (youngest) bounds of the 1σ error ranges are also selected. Neither OSL nor U–Th ages were calibrated. The U–Th ages were not normalized, as their reference year is defined as 1950 CE (Dutton et al., 2017). OSL age limits, initially expressed as calendar years before the measurement year, are converted to calendar years before present by assigning the measurement year as the sampling year or the earliest publication year if unavailable. The calibration methods, normalization approaches, and dating sources for oldest and youngest ages are provided in the age scale field.
The difference between the oldest and youngest ages represents the temporal extent of each site. ∼ 67 % of paleo-sites (n=48) record only the Holocene, ∼ 32 % span from Pleistocene to the Holocene (n=23), and ∼ 1 % contain records exclusively from the Pleistocene (n=1) (Fig. 9a and b). The Holocene-only and the Pleistocene–Holocene sites are broadly distributed across five types of depositional settings, although the lagoon category contains no Pleistocene record (Fig. 9c).
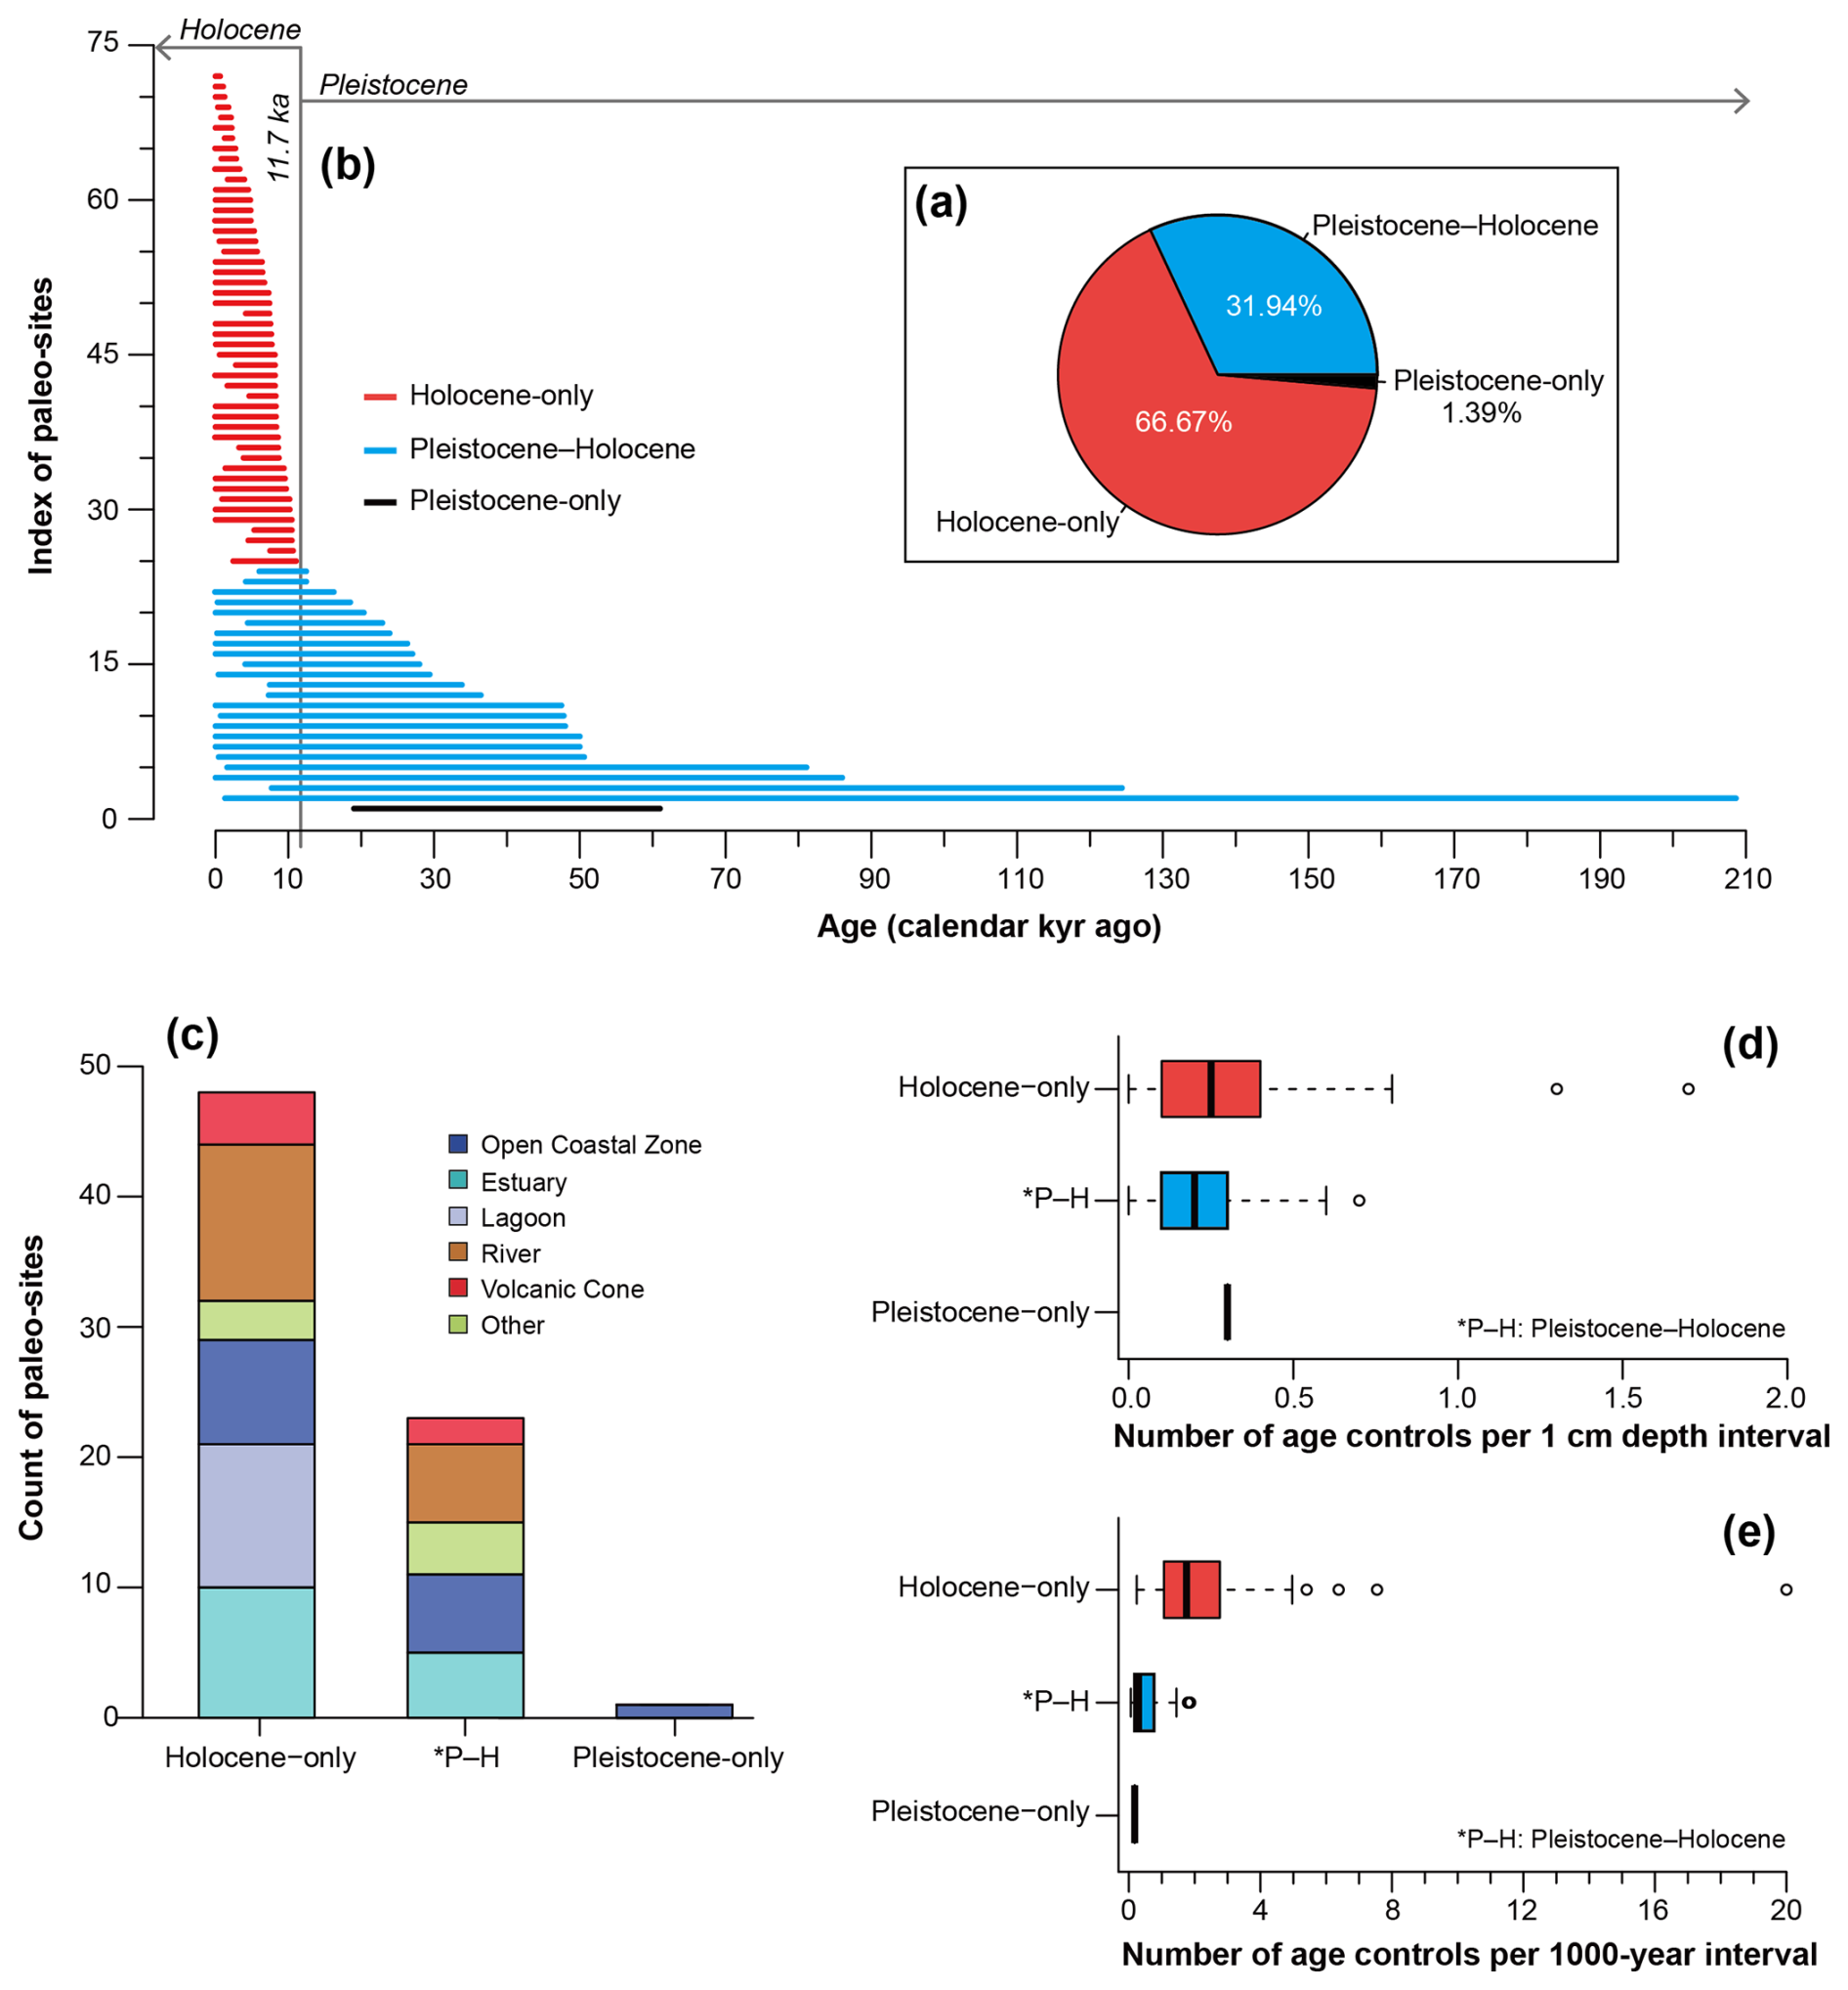
Figure 9(a) Distribution of paleo-sites by three groups of age coverage (kyr = 1000 years): Holocene-only (n=48), Pleistocene–Holocene (23), and Pleistocene-only (1). (b) Chronological extent of records from paleo-sites, ordered by descending oldest ages within each age coverage group. (c) Counts of depositional environments by age coverage group. (d) Box plot of the number of age controls per 1 cm depth interval. Medians of age control density per 1 cm depth are 0.025 for Holocene-only, 0.020 for Pleistocene–Holocene, and 0.030 fir Pleistocene-only. (e) Box plot of the number of age controls per 1000-year interval. Medians of age control density per millennium are 1.752 for Holocene-only, 0.292 for Pleistocene–Holocene, and 0.167 for Pleistocene-only.
In addition, the chronological data are used to calculate two types of dating density: the number of age controls per time interval (Flantua et al., 2015; Lacourse and Gajewski, 2020) and per depth interval. The temporal dating density is defined as the total number of age controls divided by the time span between the oldest and youngest ages, and the spatial dating density is the total number divided by the total depth range. These metrics help assess the temporal and depth–spatial resolutions of age–depth models (Lacourse and Gajewski, 2020). Both types of dating density are higher in Holocene-only sites compared to the other two sites covering the Pleistocene (Fig. 9d and e).
3.2.6 Proxy
Information about proxies available at each site is organized in four data fields: pollen, diatom, grain size, and other proxies. The first three fields indicate whether each site contains a proxy related to pollen and diatom assemblages and grain size distribution parameters (e.g., mean, median, or sorting and relative proportions of sand, silt, or clay), marking the presence of each proxy as “yes” and its absence as “NA”. These three types of proxies are documented because they are the most frequently investigated proxies, with some sites showing mono-proxy reconstructions that rely on only one of them (Fig. 10b).
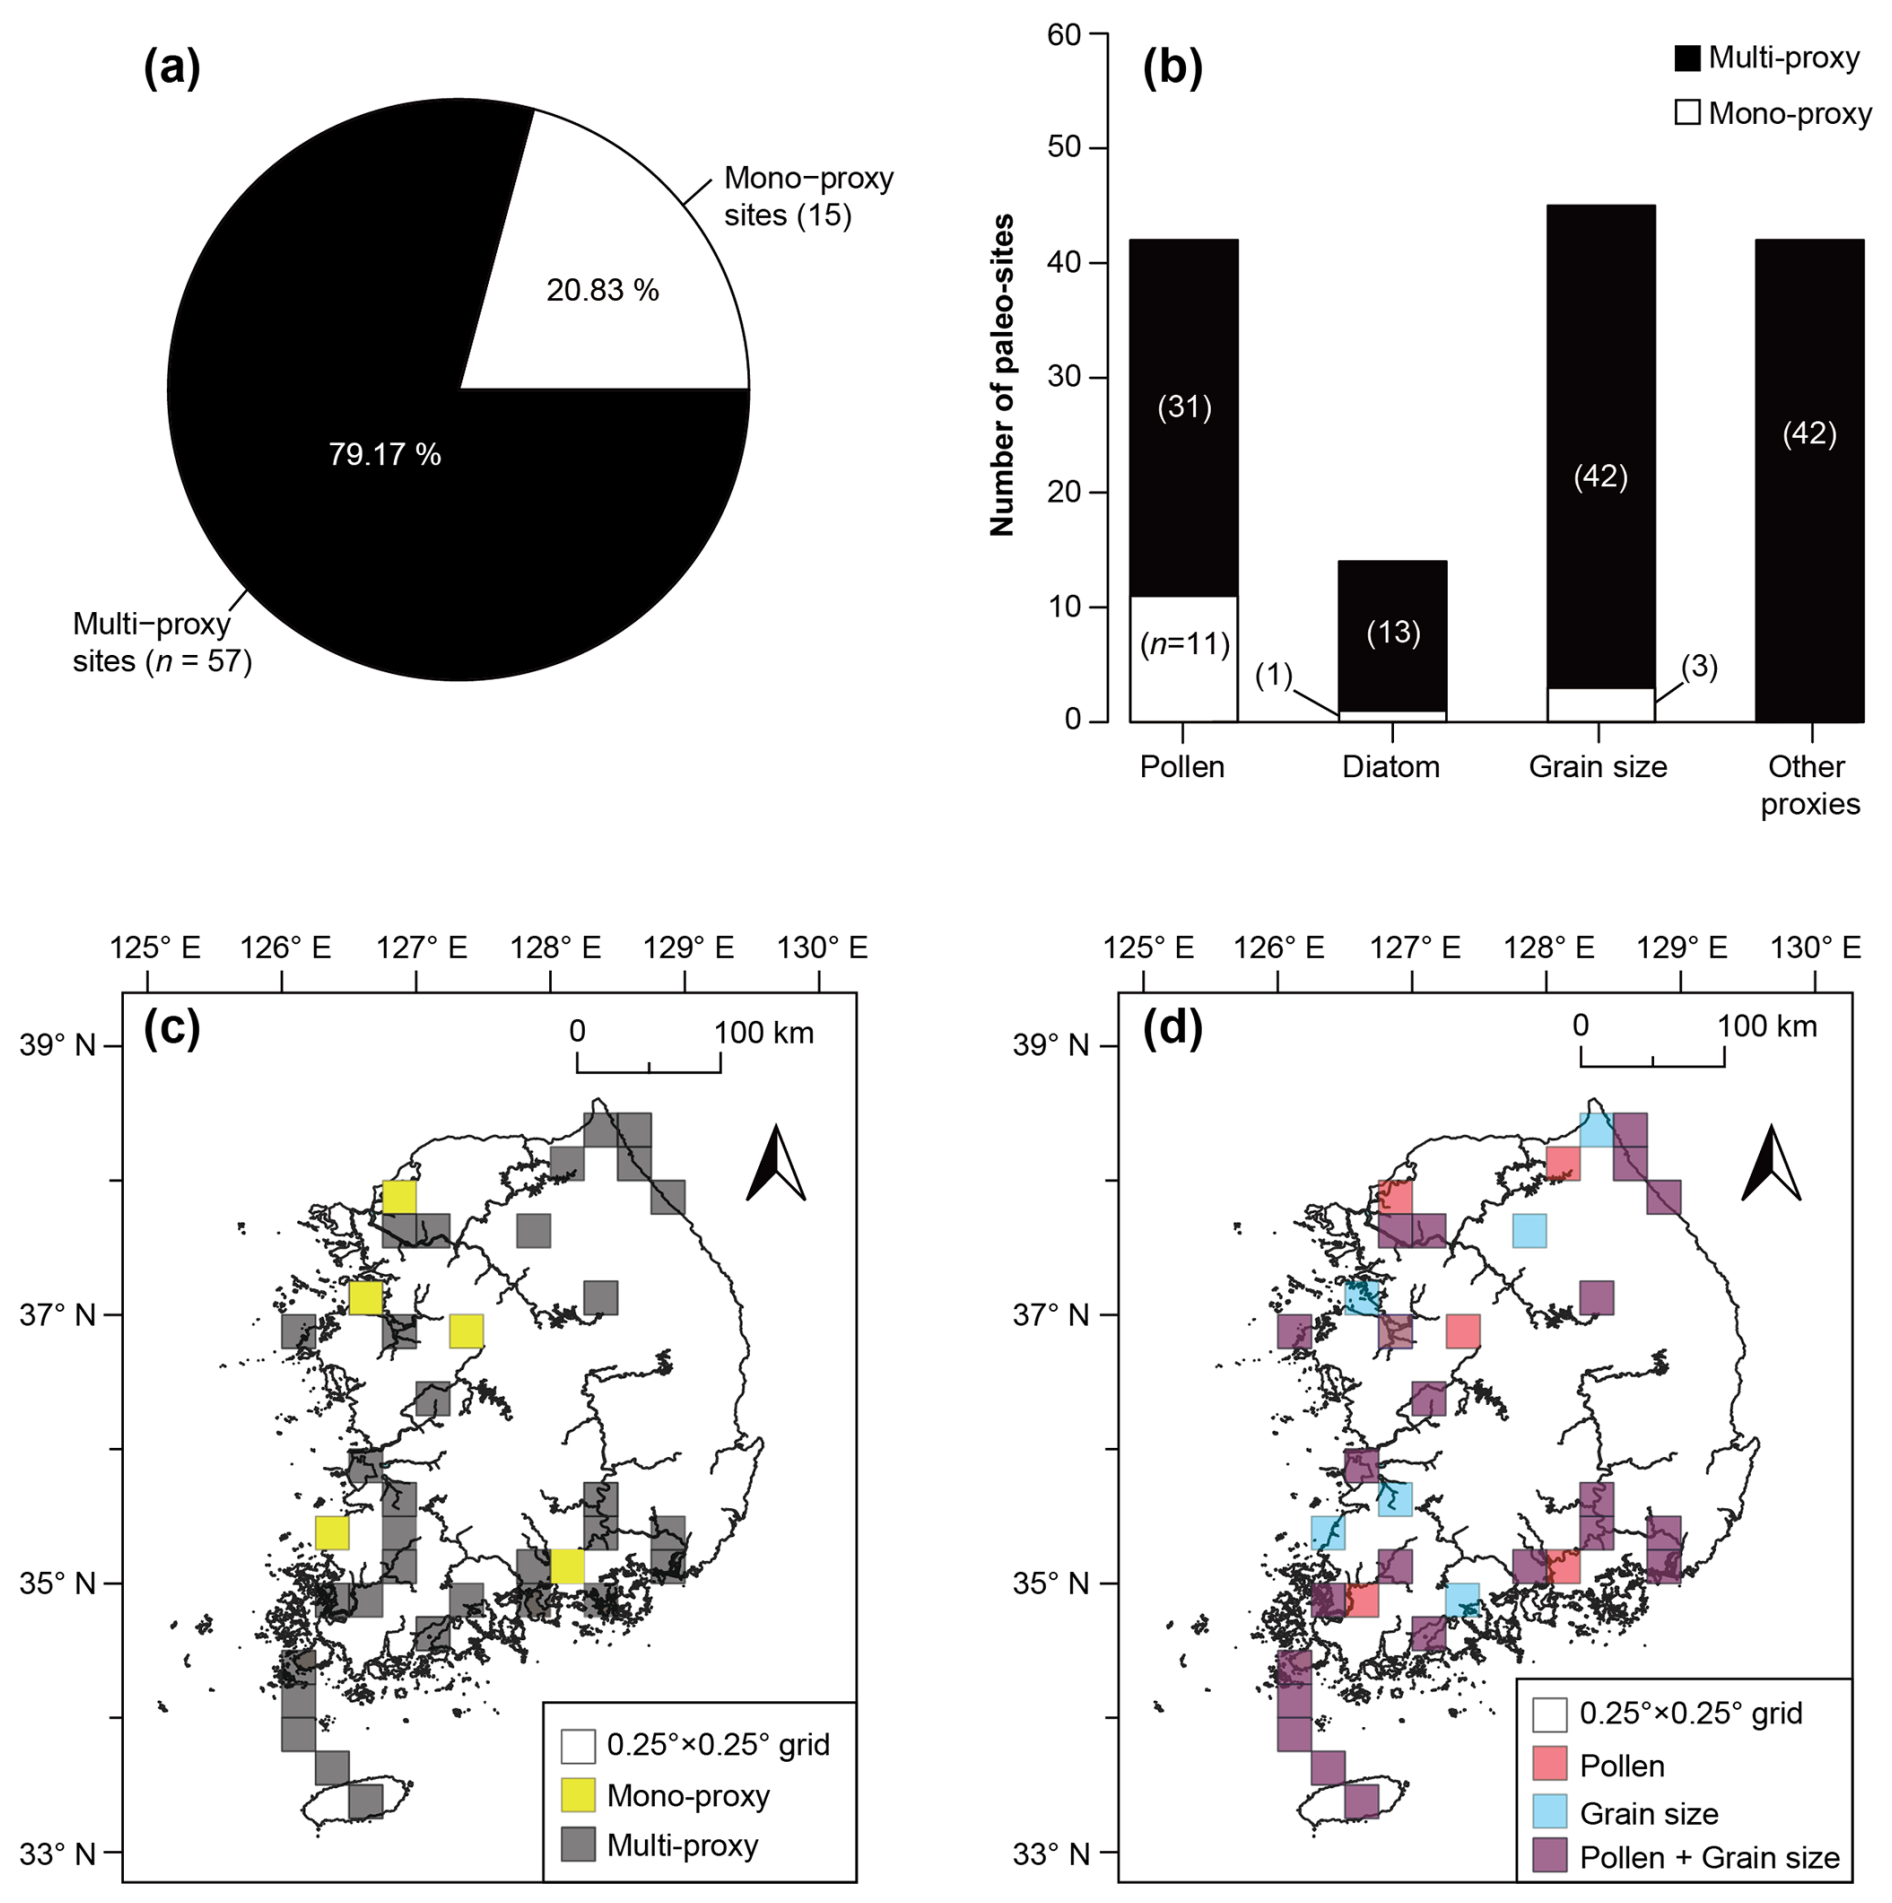
Figure 10(a) Proportion of mono-proxy and multi-proxy sites. (b) Number of paleo-sites by four proxy types. (c, d) Geospatial distribution of proxy-based records for a 0.25° × 0.25° grid. These maps display grids containing proxy-based records from paleo-sites in South Korea. In (c), grids are classified as either mono-proxy or multi-proxy. Panel (d) shows grids containing records of pollen and grain size, the most widely used proxies in South Korea.
In the field of “other” proxies, a total of 79 proxy types are listed, with abbreviations when necessary. The explanation of each abbreviation is documented in a Supplement worksheet (see Sect. 4). In the list of the other proxies, organic geochemical indicators (e.g., ratios and δ13C) are more commonly available than inorganic proxies such as mineralogical compositions, trace element content, and magnetic susceptibility.
Overall, for surface samples, our dataset includes only pollen, which is widely used to construct taxon-based transfer functions for paleotemperature estimates (Lee et al., 2022; Park and Park, 2015). While non-palynological organisms, such as ostracods from brine and freshwater swamps and subterranean caves, have been studied in South Korea (McKenzie, 1972; Smith et al., 2015) (Fig. 1), they were not included in our datasets because those studies focused on taxonomical descriptions rather than quantitative reconstructions of past environments such as those produced by the modern analog techniques. For paleo-sites, approximately 79 % sites have multi-proxy records (Fig. 10a) and these sites are more widely distributed than mono-proxy records. (Fig. 10c). Grain size and pollen proxies are more frequently used than other proxies, with pollen being the most utilized in mono-proxy sites (Fig. 10b). The extensive spatial coverage suggests that multi-proxy approaches have become standard practice in Quaternary paleoenvironmental research in South Korea (Fig. 10d).
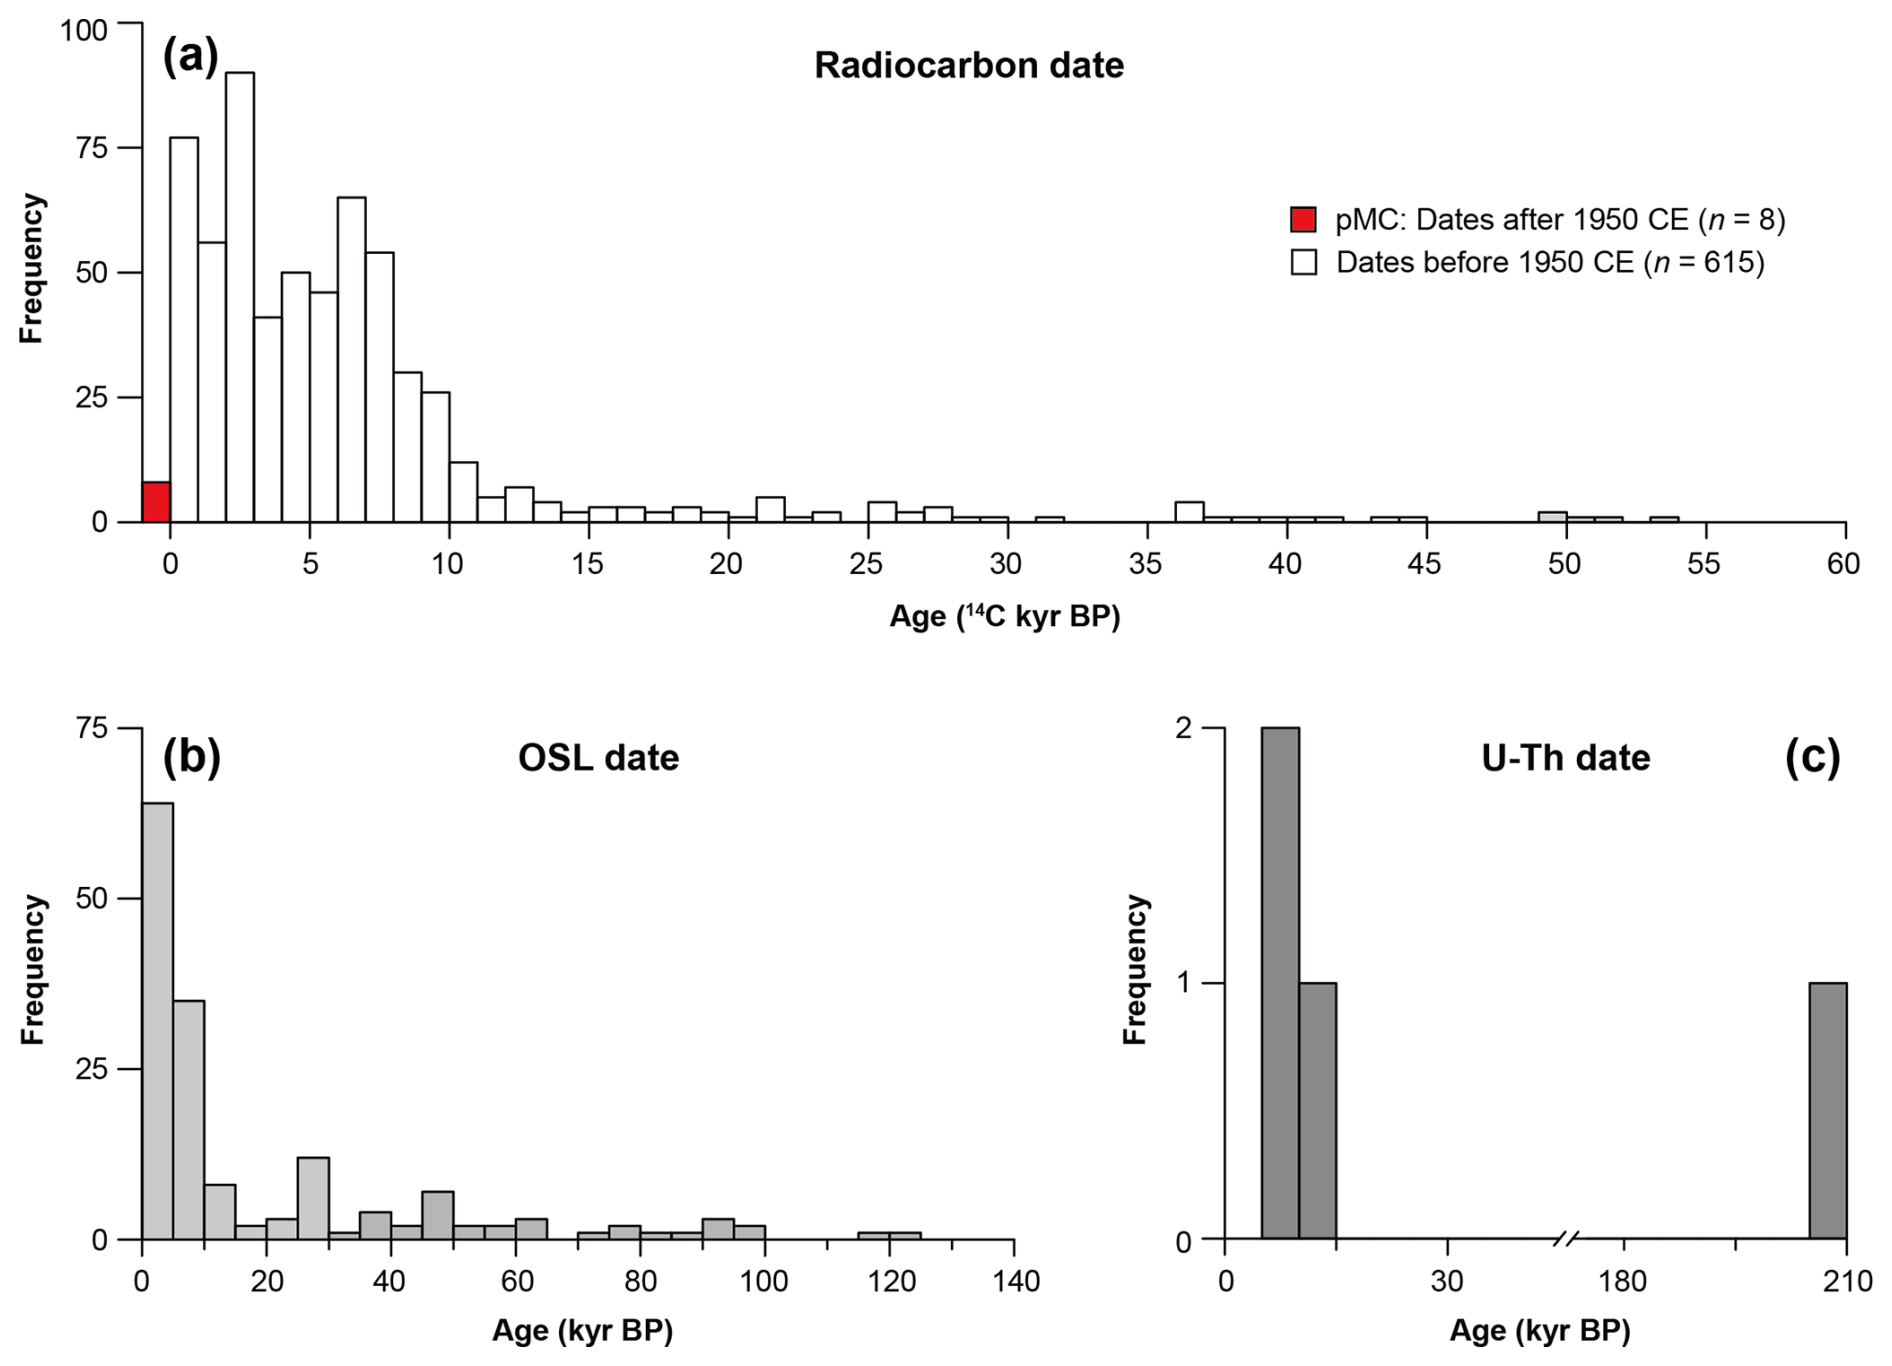
Figure 11Histograms of dates over ages (unit: kyr BP, which means 1000 years before present). (a) Radiocarbon dates (range of pre-1950 dates: > 53 671 to 27 14C years BP; median: 4790 14C years BP). (b) OSL dates (range: 124 400 to 140 years BP; median: 7114 years BP). (c) U–Th dates (range: 208 000 to 6900 years BP; median: 10 000 years BP). * Note: the reference year for “present” is 1950 CE for radiocarbon and U–Th dates and the measurement year for OSL dates.
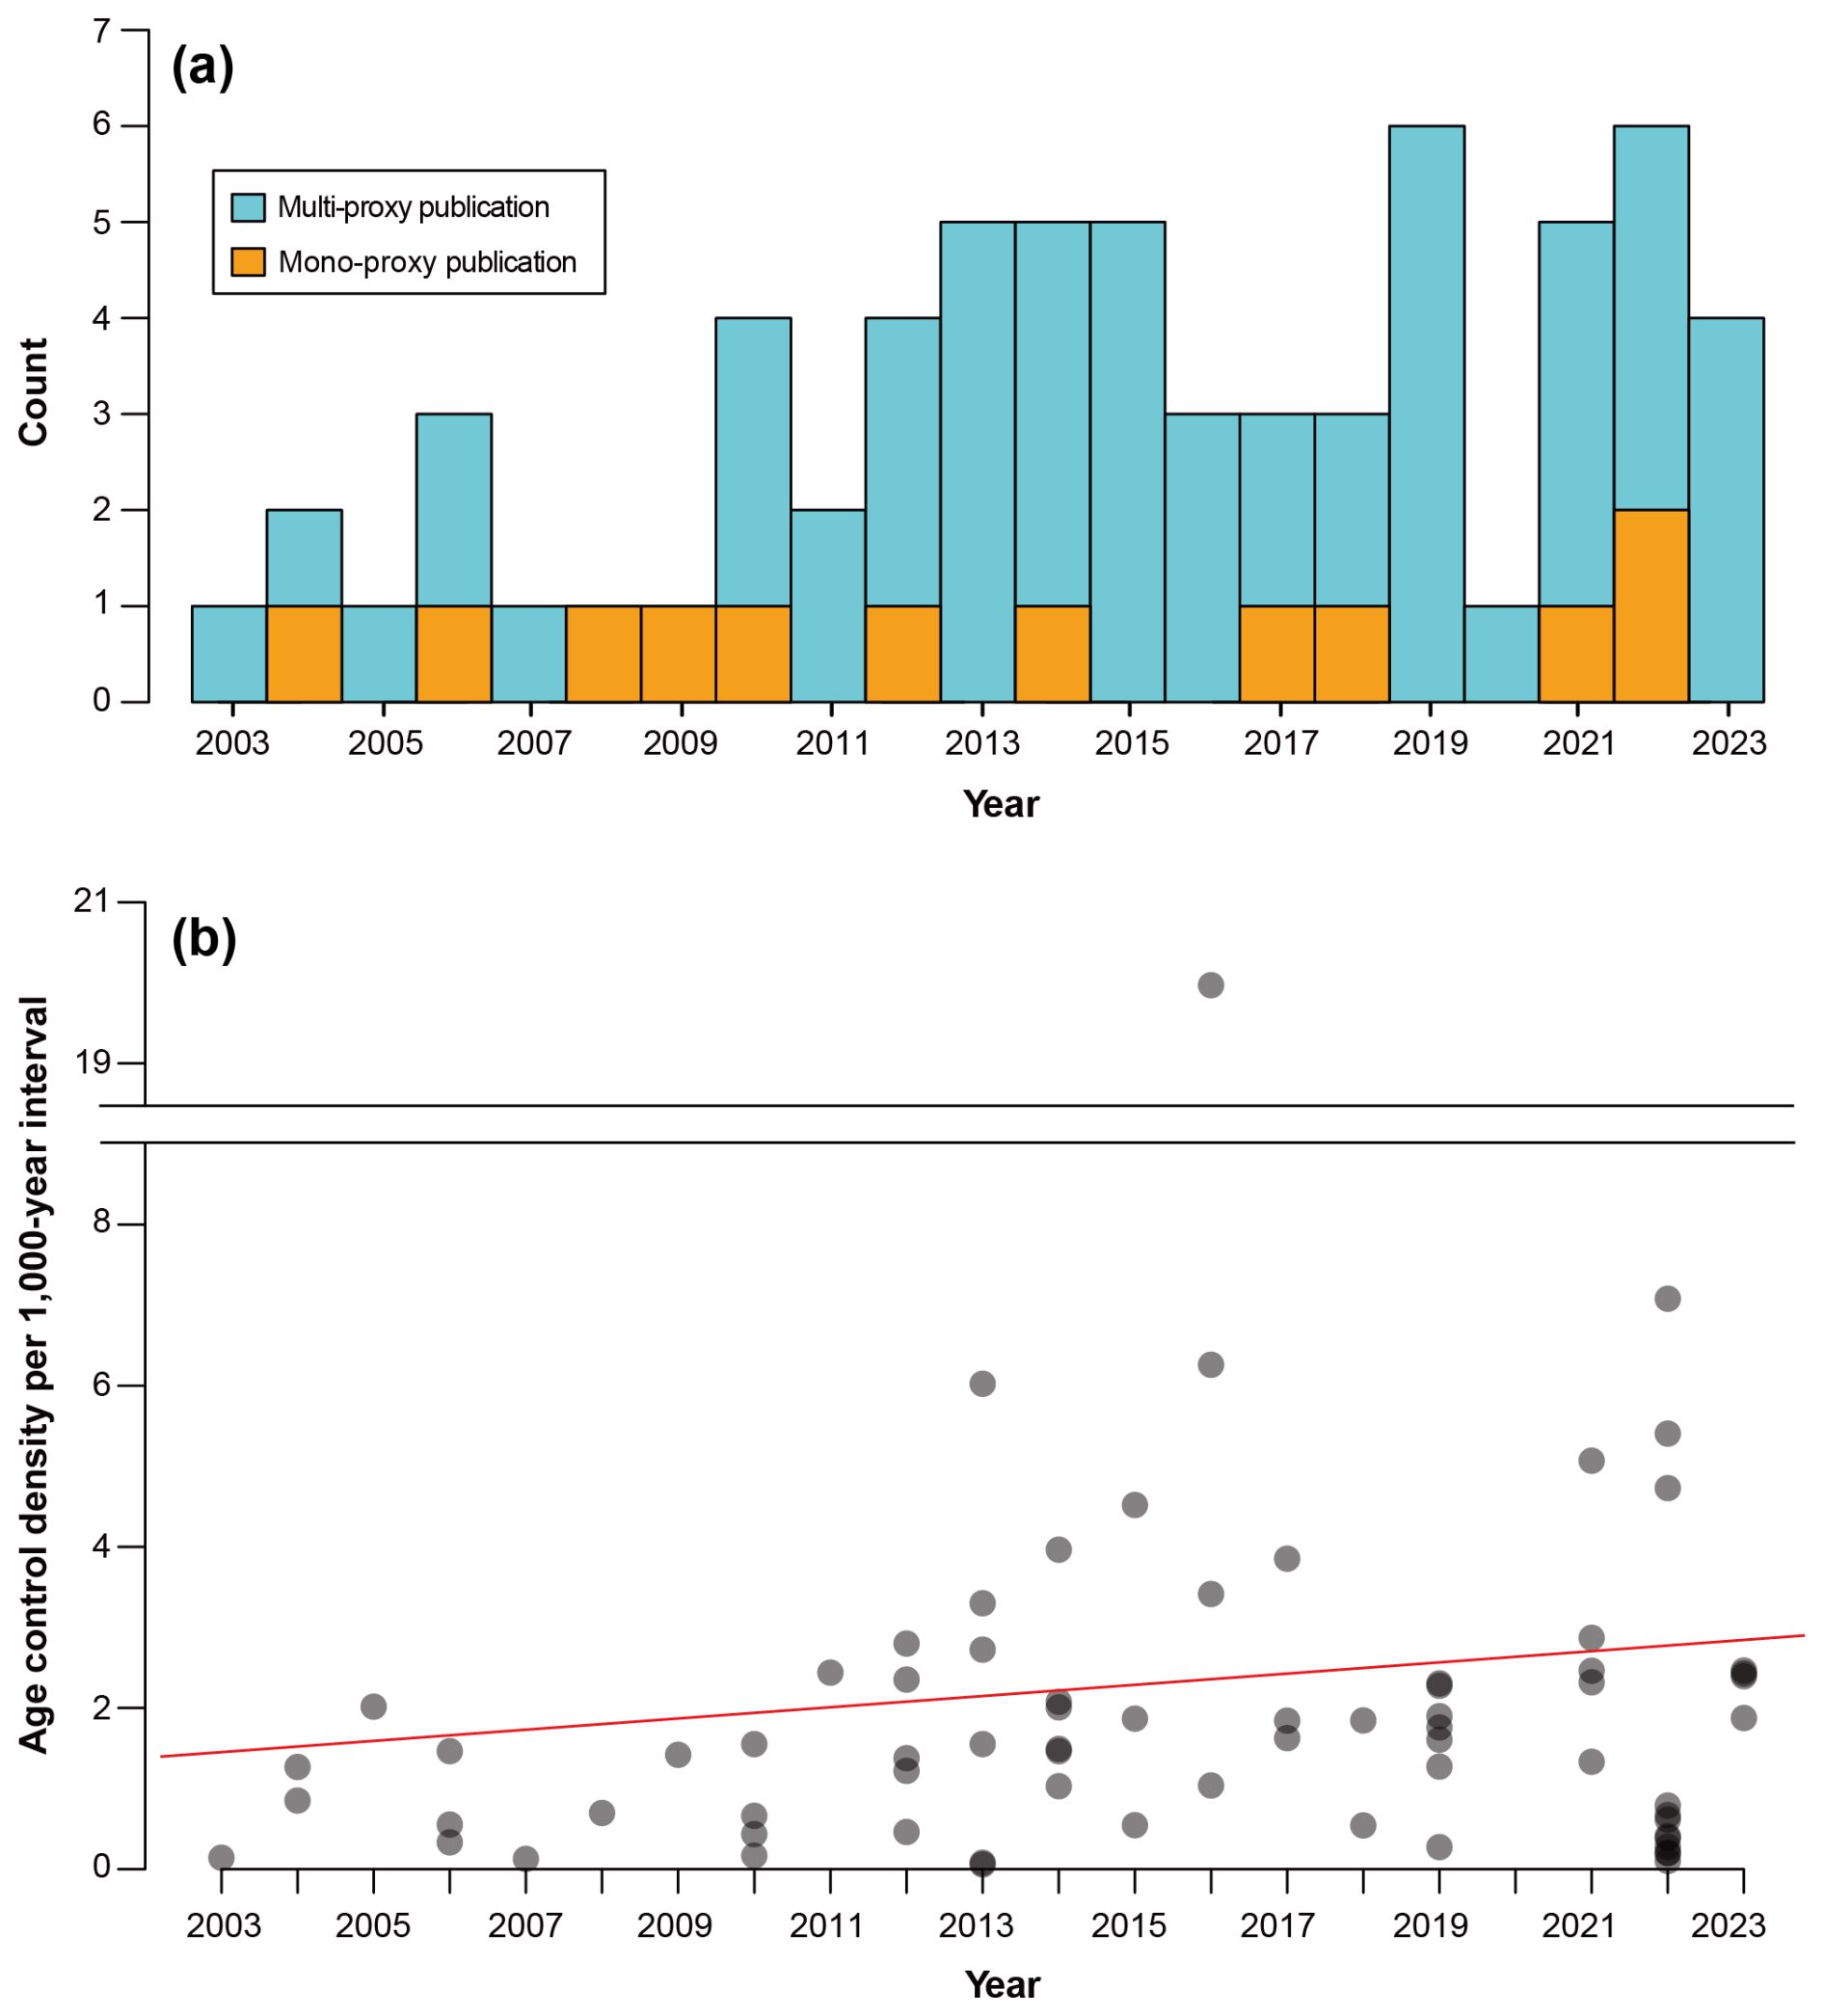
Figure 12Temporal trends in (a) the number of multi-proxy and mono-proxy publications and (b) age control density per 1000-year interval. In (a), 64 publications are shown because two articles studying surface pollen samples are excluded. In (b), the age control density, defined as the total number of age controls by the difference between the oldest and youngest ages (unit: 1000 years), is calculated for sediments from 72 paleo-sites. The year corresponds to when each record from a paleo-site was published. When more than two publications reported data from the same site, the earlier one was selected. The red line represents a linear regression (; R2 = 0.02; p value = 0.30).
3.3 Dataset III: Geochronology Data
The chronological dataset corresponding to 72 paleo-sites is documented separately. This dataset consists of nine categories: site ID, dating method (non-absolute dating: core top or estimated; absolute dating: C-14 AMS, OSL, or U–Th dating), sample ID, dating material, mean and 1σ error of age (years before present), depth (cm), mean and 1σ error of δ13C (‰), and chronological age type. In these fields, most chronological data from the original publications are documented without calibration, except in two standardized cases: core top ages are converted from AD to calendar years BP using 1950 CE as the reference point, and post-bomb radiocarbon dates are expressed with “pMC.” The field of chronological age type indicates the timescale in which the date is reported, including uncalibrated 14C years before present (1950 CE). Further details on other data fields are provided in the Supplement as well as the column description worksheet within the dataset file (see Sect. 4).
Most absolute dates fall within the Holocene (Fig. 11). OSL dates often constrain the ages of sediment sequences older than ∼ 55 000 years BP, the upper limit of 14C dating (Fig. 11b). Although U–Th dating has been applied to sediments exceeding the maximum range of OSL ages, its usage for terrestrial sediments in South Korea remains limited (Fig. 11c).
Our three datasets are accessible on two platforms: Figshare and the GeoEcoKorea website. Figshare hosts tabular datasets in Excel file (.xlsx) format at https://doi.org/10.6084/m9.figshare.28236596.v2 (Kim and Byun, 2025) (contact email: geoecokorea@gmail.com). The first dataset file, Publication Metadata.xlsx, is composed of two worksheets: (a) publication dataset and (b) column description. The second file, Site Inventory.xlsx contains three worksheets: (a) inventory dataset, (b) column description (identical to Table 1), and (c) OtherProxy_Abbreviation. The third file, Geochronology Data.xlsx has two worksheets, (a) geochronological data and (b) column description
Concurrently, the GeoEcoKorea web page (https://geoecokorea.org/, GEK, 2025) presents site locations on an interactive map at https://geoecokorea.org/research/2025_Site_Inventory (GeoEcoKorea, 2025). The bibliographic and Site Inventory datasets are integrated, converted to GeoJSON format, and visualized on OpenStreetMap-based interactive maps customized with the “Leaflet” JavaScript library. Each site is represented by an interactive marker that opens a pop-up window displaying site-specific metadata, along with direct links to the corresponding bibliographic information and downloadable Geochronology Data (three worksheets: Readme, geochronological data, and column description) in .xlsx format.
Our datasets provide a comprehensive overview of South Korean Quaternary paleoecological data published in peer-reviewed journals from 2003 to 2023. The datasets highlight the high spatial density of paleorecords available from various depositional environments, including wetlands, coastal deposits, lagoons, estuaries, rivers, and volcanic crater wetlands on Jeju Island. While ∼ 67 % of records cover only the Holocene, the remaining 33 % extend into the Pleistocene. The quality of these records has improved over the past decades, particularly with the increasing dominance of multi-proxy approaches and improved chronological constraints (Fig. 12), suggesting continued progress in the future.
Our Site Inventory offers a practical reference for future site selection. Korea's compact geography and clearly differentiated depositional settings (Fig. 7a) allow for temporal variability of sediment accumulation rates – defined as “deposition time” in similar studies (e.g., Crann et al., 2015; Goring et al., 2012) – across the settings without the profound effects of large-scale continental gradients. In addition, when the Korean paleorecords in the inventory are integrated, they can provide foundational datasets for testing new hypotheses regarding the drivers of local ecosystem turnover in northeastern Asia. The records span both human-cultivated lowlands and relatively undisturbed upland settings (Fig. 6a), enabling comparisons that help separate climate- from human-induced impacts on past landscape changes during the Holocene. The interpretability of past vegetation dynamics is enhanced by extensive surface pollen samples collected across elevation gradients, which serve as modern analogs of climate–vegetation relationships (Fig. 6b). These features can contribute to understanding regional-scale ecosystem dynamics in response to climate and anthropogenic forcings.
Although the site-specific findings can be explored through the main text of related publications in international peer-reviewed journals, the “interoperability” and “reusability” of original data (and thus citation of the paper) have been relatively rare in international collaborative research. A recent global pollen data compilation study for the Northern Hemisphere, for example, included only a single dataset from Korea (Herzschuh et al., 2023). Our dataset framework can serve not only to characterize the inventory of paleo-studies in South Korea, but also as a template for organizing similar inventories in other underrepresented regions.
Moving forward, our database (GEK, GeoEcoKorea), integrated with the open-access web platform, aims to enhance the “findability” and “accessibility” of Korean paleoecological data, contributing to FAIR data sharing and the advance of this research field both regionally and globally. GEK currently curates two categories of datasets: those published from Korean-language publications and those from international publications. Korean-language datasets are curated for their values in site revisits, regional syntheses, and legacy preservation. As a part of our strategy for global integration, internationally published datasets from nine Korean paleo-sites have been submitted to and are now stored in the Neotoma Paleoecology Database (as of June 2025). Furthermore, GEK plans to become a Neotoma constituent database (e.g., The Indo-Pacific Pollen Database) (Herbert et al., 2024). Affiliation with Neotoma will be critical for increasing the availability of Korean paleoecological data and fostering trust among both international and Korean researchers (Thomer et al., 2025; Yoon, 2017). These trust-building efforts will help our regional initiatives to encourage and support Korean Quaternary researchers to contribute their data, thereby fostering a more collaborative and inclusive data-sharing culture.
The supplement related to this article is available online at https://doi.org/10.5194/essd-17-4479-2025-supplement.
SHK: conceptualization, data curation, formal analysis, investigation, resources, software, visualization, writing (original draft; review and editing). EB: conceptualization, supervision, project administration, funding acquisition, investigation, validation, resources, writing (original draft; review and editing).
The contact author has declared that neither of the authors has any competing interests.
Publisher’s note: Copernicus Publications remains neutral with regard to jurisdictional claims made in the text, published maps, institutional affiliations, or any other geographical representation in this paper. While Copernicus Publications makes every effort to include appropriate place names, the final responsibility lies with the authors.
The authors are grateful to Absur Khan Siam, Rifakat Alim Rashkee, and Yerim Han, undergraduate students at the Korea Advanced Institute of Science and Technology, for their assistance in the initial collection and organization of metadata. We also are deeply grateful to our two reviewers, John Williams and Jessica Blois, for their thoughtful, detailed, and constructive feedback, which substantially improved the clarity and quality of the paper and datasets.
This work was supported by Yonsei University (grant number: 2024-22-0529). Additional support was provided by two grants from the National Research Foundation of Korea (NRF): NRF-2018R1A5A7025409, funded by the South Korean Ministry of Science and ICT, and RS-2023-00301702, awarded through the Global Learning and Academic Research Institution for Master's and PhD Students and Postdocs (LAMP) program, funded by the Ministry of Education.
This paper was edited by Attila Demény and reviewed by John Williams and Jessica L. Blois.
Abraham, V., Macek, M., Tkáč, P., Novák, D., Pokorný, P., Kozáková, R., Jamrichová, E., Soukupová, M. G., and Kolář, J.: Pollen anthropogenic indicators revisited using large-scale pollen and archaeological datasets: 12,000 years of human-vegetation interactions in central Europe, Preslia, 95, 385–411, https://doi.org/10.23855/preslia.2023.385, 2023.
Birks, H. H. and Birks, H. J. B.: Multi-proxy studies in palaeolimnology, Veg. Hist. Archaeobot., 15, 235–251, https://doi.org/10.1007/s00334-006-0066-6, 2006.
Bradley, R. S.: Paleoclimatology: Reconstructing Climates of the Quaternary, 3rd Edn., Academic Press, Oxford, ISBN 978-0123869951, 2013.
Blaauw, M.: IntCal: Radiocarbon Calibration Curves, R package version 0.3.1, CRAN [code], https://doi.org/10.32614/CRAN.package.IntCal, 2022.
Center for International Earth Science Information Network – CIESIN – Columbia University: Gridded Population of the World, Version 4 (GPWv4): Land and Water Area, Revision 11, Palisades, NY, NASA Socioeconomic Data and Applications Center (SEDAC) [data set], https://doi.org/10.7927/h4z60m4z, 2018.
Chevalier, M., Davis, B. A. S., Heiri, O., Seppä, H., Chase, B. M., Gajewski, K., Lacourse, T., Telford, R. J., Finsinger, W., Guiot, J., Kühl, N., Maezumi, S. Y., Tipton, J. R., Carter, V. A., Brussel, T., Phelps, L. N., Dawson, A., Zanon, M., Vallé, F., Nolan, C., Mauri, A., de Vernal, A., Izumi, K., Holmström, L., Marsicek, J., Goring, S., Sommer, P. S., Chaput, M., and Kupriyanov, D.: Pollen-based climate reconstruction techniques for late Quaternary studies, Earth-Science Rev., 210, 103384, https://doi.org/10.1016/j.earscirev.2020.103384, 2020.
Crann, C. A., Patterson, R. T., Macumber, A. L., Galloway, J. M., Roe, H. M., Blaauw, M., Swindles, G. T., and Falck, H.: Sediment accumulation rates in subarctic lakes: Insights into age-depth modeling from 22 dated lake records from the Northwest Territories, Canada, Quat. Geochronol., 27, 131–144, https://doi.org/10.1016/j.quageo.2015.02.001, 2015.
Dutton, A., Rubin, K. H., Mclean, N., Bowring, J., Bard, E., Edwards, R. L., Henderson, G. M., Reid, M. R., Richards, D. A., Sims, K. W. W., Walker, J. D., and Yokoyama, Y.: Quaternary Geochronology Data reporting standards for publication of U-series data for geochronology and timescale assessment in the earth sciences, Quat. Geochronol., 39, 142–149, https://doi.org/10.1016/j.quageo.2017.03.001, 2017.
Farley, S. S., Dawson, A., Goring, S. J., and Williams, J. W.: Situating ecology as a big-data science: Current advances, challenges, and solutions, BioScience, 68, 563–576, https://doi.org/10.1093/biosci/biy068, 2018.
Flantua, S. G. A., Mottl, O., Felde, V. A., Bhatta, K. P., Birks, H. H., Grytnes, J. A., Seddon, A. W. R., and Birks, H. J. B.: A guide to the processing and standardization of global palaeoecological data for large-scale syntheses using fossil pollen, Global Ecol. Biogeogr., 32, 1377–1394, https://doi.org/10.1111/geb.13693, 2023.
Flantua, S. G. A., Hooghiemstra, H., Grimm, E. C., Behling, H., Bush, M. B., González-Arango, C., Gosling, W. D., Ledru, M. P., Lozano-García, S., Maldonado, A., Prieto, A. R., Rull, V., and Van Boxel, J. H.: Updated site compilation of the Latin American Pollen Database, Rev. Palaeobot. Palynol., 223, 104–115, https://doi.org/10.1016/j.revpalbo.2015.09.008, 2015.
Gaillard, M.-J., Sugita, S., Mazier, F., Trondman, A.-K., Broström, A., Hickler, T., Kaplan, J. O., Kjellström, E., Kokfelt, U., Kuneš, P., Lemmen, C., Miller, P., Olofsson, J., Poska, A., Rundgren, M., Smith, B., Strandberg, G., Fyfe, R., Nielsen, A. B., Alenius, T., Balakauskas, L., Barnekow, L., Birks, H. J. B., Bjune, A., Björkman, L., Giesecke, T., Hjelle, K., Kalnina, L., Kangur, M., van der Knaap, W. O., Koff, T., Lagerås, P., Latałowa, M., Leydet, M., Lechterbeck, J., Lindbladh, M., Odgaard, B., Peglar, S., Segerström, U., von Stedingk, H., and Seppä, H.: Holocene land-cover reconstructions for studies on land cover-climate feedbacks, Clim. Past, 6, 483–499, https://doi.org/10.5194/cp-6-483-2010, 2010.
GEK: GeoEcoKorea, https://geoecokorea.org/, last access: 28 August 2025.
GeoEcoKorea: 2025 GEK-Site Inventory, https://geoecokorea.org/research/2025_Site_Inventory, last access: 9 September 2025.
Goring, S., Williams, J. W., Blois, J. L., Jackson, S. T., Paciorek, C. J., Booth, R. K., Marlon, J. R., Blaauw, M., and Christen, J. A.: Deposition times in the northeastern United States during the Holocene: Establishing valid priors for Bayesian age models, Quaternary Sci. Rev., 48, 54–60, https://doi.org/10.1016/j.quascirev.2012.05.019, 2012.
Heaton, T. J., Köhler, P., Butzin, M., Bard, E., Reimer, R. W., Austin, W. E. N., Bronk Ramsey, C., Grootes, P. M., Hughen, K. A., Kromer, B., Reimer, P. J., Adkins, J., Burke, A., Cook, M. S., Olsen, J., and Skinner, L. C.: Marine20 – The Marine Radiocarbon Age Calibration Curve (0-55,000 cal BP), Radiocarbon, 62, 779–820, https://doi.org/10.1017/RDC.2020.68, 2020.
Herbert, A. V., Haberle, S. G., Flantua, S. G. A., Mottl, O., Blois, J. L., Williams, J. W., George, A., and Hope, G. S.: The Indo–Pacific Pollen Database – a Neotoma constituent database, Clim. Past, 20, 2473–2485, https://doi.org/10.5194/cp-20-2473-2024, 2024.
Herzschuh, U., Böhmer, T., Li, C., Chevalier, M., Hébert, R., Dallmeyer, A., Cao, X., Bigelow, N. H., Nazarova, L., Novenko, E. Y., Park, J., Peyron, O., Rudaya, N. A., Schlütz, F., Shumilovskikh, L. S., Tarasov, P. E., Wang, Y., Wen, R., Xu, Q., and Zheng, Z.: LegacyClimate 1.0: a dataset of pollen-based climate reconstructions from 2594 Northern Hemisphere sites covering the last 30 kyr and beyond, Earth Syst. Sci. Data, 15, 2235–2258, https://doi.org/10.5194/essd-15-2235-2023, 2023.
Kaufman, D., McKay, N., Routson, C., Erb, M., Davis, B., Heiri, O., Jaccard, S., Tierney, J., Dätwyler, C., Axford, Y., Brussel, T., Cartapanis, O., Chase, B., Dawson, A., de Vernal, A., Engels, S., Jonkers, L., Marsicek, J., Moffa-Sánchez, P., Morrill, C., Orsi, A., Rehfeld, K., Saunders, K., Sommer, P. S., Thomas, E., Tonello, M., Tóth, M., Vachula, R., Andreev, A., Bertrand, S., Biskaborn, B., Bringué, M., Brooks, S., Caniupán, M., Chevalier, M., Cwynar, L., Emile-Geay, J., Fegyveresi, J., Feurdean, A., Finsinger, W., Fortin, M. C., Foster, L., Fox, M., Gajewski, K., Grosjean, M., Hausmann, S., Heinrichs, M., Holmes, N., Ilyashuk, B., Ilyashuk, E., Juggins, S., Khider, D., Koinig, K., Langdon, P., Larocque-Tobler, I., Li, J., Lotter, A., Luoto, T., Mackay, A., Magyari, E., Malevich, S., Mark, B., Massaferro, J., Montade, V., Nazarova, L., Novenko, E., Pařil, P., Pearson, E., Peros, M., Pienitz, R., Płóciennik, M., Porinchu, D., Potito, A., Rees, A., Reinemann, S., Roberts, S., Rolland, N., Salonen, S., Self, A., Seppä, H., Shala, S., St-Jacques, J. M., Stenni, B., Syrykh, L., Tarrats, P., Taylor, K., van den Bos, V., Velle, G., Wahl, E., Walker, I., Wilmshurst, J., Zhang, E., and Zhilich, S.: A global database of Holocene paleotemperature records, Sci. Data, 7, 1–34, https://doi.org/10.1038/s41597-020-0445-3, 2020.
Kim, S. H. and Byun, E.: A geospatial inventory dataset of study sites in a Korean Quaternary paleoecology database, figshare [data set], https://doi.org/10.6084/m9.figshare.28236596.v2, 2025.
Kim, J. C., Han, M., Ahn, H.-S., Yoon, H. H., Lee, J.-Y., Park, S., Cho, A., Kim, J. Y., Nahm, W.-H., Choi, H.-W., Lim, J., Yang, D.-Y., Hong, S.-S., and Yi, S.: Quaternary environmental studies in South Korea, Episodes, 47, 511–535, https://doi.org/10.18814/epiiugs/2024/02403s09, 2024.
Kim, S. H. and Byun, E.: A geospatial inventory dataset of study sites in a Korean Quaternary paleoecology database, figshare [data set], https://doi.org/10.6084/m9.figshare.28236596.v2, 2025.
Kozáková, R., Pokorný, P., Peša, V., Danielisová, A., Čuláková, K., and Svobodová, H. S.: Prehistoric human impact in the mountains of Bohemia. Do pollen and archaeological data support the traditional scenario of a prehistoric “wilderness”?, Rev. Palaeobot. Palynol., 220, 29–43, https://doi.org/10.1016/j.revpalbo.2015.04.008, 2015.
Lacourse, T. and Gajewski, K.: Current practices in building and reporting age-depth models, Quaternary Res., 96, 28–38, https://doi.org/10.1017/qua.2020.47, 2020.
Lee, J., Jun, C.-P., Yi, S., Kim, Y., Lee, E., and Kim, D.: Modern pollen–climate relationships and their application for pollen-based quantitative climate reconstruction of the mid-Holocene on the southern Korean Peninsula, Holocene, 32, 127–136, https://doi.org/10.1177/09596836211060493, 2022.
Mann, M. E.: The Value of Multiple Proxies, Science, 297, 1481–1482, https://doi.org/10.1126/science.1074318, 2002.
McKenzie, K. G.: Results of the speleological survey in South Korea 1966; XXII, Subterranean Ostracoda from South Korea, Bulletin of the National Science Museum, Tokyo, 15, 155–166, 1972.
Mottl, O., Flantua, S. G. A., Bhatta, K. P., Felde, V. A., Giesecke, T., Goring, S., Grimm, E. C., Haberle, S., Hooghiemstra, H., Ivory, S., Kuneš, P., Wolters, S., Seddon, A. W. R., and Williams, J. W.: Global acceleration in rates of vegetation change over the past 18,000 years, Science, 372, 860–864, https://doi.org/10.1126/science.abg1685, 2021.
Nahm, W. H.: Present situation of research of Quaternary terrestrial unconsolidated sediments, in Korea, Journal of the Geological Society of Korea, 54, 107–119, 2018.
NASA JPL: NASA Shuttle Radar Topography Mission Global 3 arc second, NASA Land Processes Distributed Active Archive Center [data set], https://doi.org/10.5067/MEASURES/SRTM/SRTMGL3.003, 2013.
Park, J.: The Applicability of Stable Isotope Analyses on Sediments to Reconstruct Korean Paleoclimate, Journal of the Korean Geographical Society, 43, 477–494, 2008.
Park, J. and Park, J.: Pollen-based temperature reconstructions from Jeju island, South Korea and its implication for coastal climate of East Asia during the late Pleistocene and early Holocene, Palaeogeogr. Palaeoclim., 417, 445–457, https://doi.org/10.1016/j.palaeo.2014.10.005, 2015.
Prentice, C.: Records of Vegetation in Time and Space: the Principles of Pollen Analysis, in: Vegetation History, Handbook of Vegetation Science, vol. 7, edited by: Huntley, B. and Webb, T., Springer Netherlands, Dordrecht, 17–42, https://doi.org/10.1007/978-94-009-3081-0_2, 1988.
Reimer, P. J., Austin, W. E. N., Bard, E., Bayliss, A., Blackwell, P. G., Bronk Ramsey, C., Butzin, M., Cheng, H., Edwards, R. L., Friedrich, M., Grootes, P. M., Guilderson, T. P., Hajdas, I., Heaton, T. J., Hogg, A. G., Hughen, K. A., Kromer, B., Manning, S. W., Muscheler, R., Palmer, J. G., Pearson, C., van der Plicht, J., Reimer, R. W., Richards, D. A., Scott, E. M., Southon, J. R., Turney, C. S. M., Wacker, L., Adolphi, F., Büntgen, U., Capano, M., Fahrni, S. M., Fogtmann-Schulz, A., Friedrich, R., Köhler, P., Kudsk, S., Miyake, F., Olsen, J., Reinig, F., Sakamoto, M., Sookdeo, A., and Talamo, S.: The IntCal20 Northern Hemisphere Radiocarbon Age Calibration Curve (0–55 cal kBP), Radiocarbon, 62, 725–757, https://doi.org/10.1017/RDC.2020.41, 2020.
Smith, R. J., Lee, J., and Chang, C. Y.: Nonmarine Ostracoda (Crustacea) from Jeju Island, South Korea, including descriptions of two new species, J. Nat. Hist., 49, 37–76, https://doi.org/10.1080/00222933.2014.946110, 2015.
Thomer, A., Williams, J., Goring, S., and Blois, J.: The Valuable, Vulnerable, Long Tail of Earth Science Databases, Eos, 106, https://doi.org/10.1029/2025EO250107, 2025.
Vidaña, S. D. and Goring, S. J.: neotoma2: An R package to access data from the Neotoma Paleoecology Database, J. Open Source Softw., 8, 5561, https://doi.org/10.21105/joss.05561, 2023.
Wang, Y., Shipley, B. R., Lauer, D. A., Pineau, R. M., and McGuire, J. L.: Plant biomes demonstrate that landscape resilience today is the lowest it has been since end-Pleistocene megafaunal extinctions, Glob. Chang. Biol., 26, 5914–5927, https://doi.org/10.1111/gcb.15299, 2020.
Wang, Y., Pineda-Munoz, S., and McGuire, J. L.: Plants maintain climate fidelity in the face of dynamic climate change, P. Natl. Acad. Sci. USA, 120, https://doi.org/10.1073/pnas.2201946119, 2023.
Whitlock, C. and Larsen, C.: Charcoal as a Fire Proxy, in: Tracking Environmental Change Using Lake Sediments. Developments in Paleoenvironmental Research, vol. 3, edited by: Smol, J. P., Birks, H. J. B., Last, W. M., Bradley, R. S., and Alverson, K., Springer, Dordrecht, 75–97, https://doi.org/10.1007/0-306-47668-1_5, 2002.
Wilkinson, M. D., Dumontier, M., Aalbersberg, Ij. J., Appleton, G., Axton, M., Baak, A., Blomberg, N., Boiten, J.-W., da Silva Santos, L. B., Bourne, P. E., Bouwman, J., Brookes, A. J., Clark, T., Crosas, M., Dillo, I., Dumon, O., Edmunds, S., Evelo, C. T., Finkers, R., Gonzalez-Beltran, A., Gray, A. J. G., Groth, P., Goble, C., Grethe, J. S., Heringa, J., 't Hoen, P. A. ., Hooft, R., Kuhn, T., Kok, R., Kok, J., Lusher, S. J., Martone, M. E., Mons, A., Packer, A. L., Persson, B., Rocca-Serra, P., Roos, M., van Schaik, R., Sansone, S.-A., Schultes, E., Sengstag, T., Slater, T., Strawn, G., Swertz, M. A., Thompson, M., van der Lei, J., van Mulligen, E., Velterop, J., Waagmeester, A., Wittenburg, P., Wolstencroft, K., Zhao, J., and Mons, B.: The FAIR Guiding Principles for scientific data management and stewardship, Sci. Data, 3, 160018, https://doi.org/10.1038/sdata.2016.18, 2016.
Williams, J. W., Grimm, E. C., Blois, J. L., Charles, D. F., Davis, E. B., Goring, S. J., Graham, R. W., Smith, A. J., Anderson, M., Arroyo-Cabrales, J., Ashworth, A. C., Betancourt, J. L., Bills, B. W., Booth, R. K., Buckland, P. I., Curry, B. B., Giesecke, T., Jackson, S. T., Latorre, C., Nichols, J., Purdum, T., Roth, R. E., Stryker, M., and Takahara, H.: The Neotoma Paleoecology Database, a multiproxy, international, community-curated data resource, Quaternary Res., 89, 156–177, https://doi.org/10.1017/qua.2017.105, 2018.
Yang, Q., Zhou, X., Zhao, C., Gao, Q., Liu, J., Jia, P. W., Jia, X., Xin, Y., Zhao, K., and Li, X.: Human occupation, slash-burning and vegetation response from the final Pleistocene to the middle Holocene, Daling River basin, NE China, Rev. Palaeobot. Palynol., 275, 104158, https://doi.org/10.1016/j.revpalbo.2020.104158, 2020.
Yoon, A.: Data reusers' trust development, J. Assoc. Inf. Sci. Tech., 68, 946–956, https://doi.org/10.1002/asi.23730, 2017.