the Creative Commons Attribution 4.0 License.
the Creative Commons Attribution 4.0 License.
 | 08 Sep 2025
CLIMK–WINDS: a new database of extreme European winter windstorms
Clare M. Flynn
Julia Moemken
Joaquim G. Pinto
Michael K. Schutte
Gabriele Messori
The CLIMK–WINDS (CLimes IMK – WINDstorm) database is a new, publicly available, database of extreme European windstorm footprints for the extended winter season during 1995–2015. In contrast with previously compiled European windstorm databases, it includes storm footprints derived from four different data sets, rather than a single source: the ERA5 reanalysis, the COSMO-REA6 reanalysis for Europe, the COSMO-Climate Limited-area Mode regional climate model driven by ERA5 on the EURO-CORDEX domain and simulation output from the same model but on an enlarged Germany domain with higher horizontal resolution. The database includes the footprints themselves, expressed as the relative daily maximum wind gusts associated with a storm event, the daily maximum wind gusts in absolute magnitude associated with the footprints and a measure of storm severity. We applied a consistent methodology, the storm loss index, across input data sets for identifying storm footprints and assessing their severity. We identified and included the storm footprints associated with the 50 most severe storms, or top 50 storms, within each of the four input data sets. This enables a direct comparison between the footprints derived from the different input data sets, eases future efforts to extend the time record of the database or to include additional input data sets and enables assessment of uncertainty in the footprints. Moreover, since we derived the top 50 storms from each input data set at its native horizontal resolution, the database also allows us to characterise the impact that horizontal resolution can have on footprint identification and severity assessment. We find that the choice of input data set – including the data's horizontal resolution – can have major effects on extreme storm identification and characterisation. Different storms were identified as belonging to the top 50 storms in the different data sets, and storm footprints for common storms displayed substantial variability across the data sets. A comparison of our database with two existing windstorm databases also highlights the important role of the footprint detection methodology. The CLIMK–WINDS database thus supports both the research community and the insurance industry in exploring the data set, methodology and resolution dependence of assessments of extreme storm hazards. The data presented here can be downloaded from https://doi.org/10.5281/zenodo.10594398 (Flynn et al., 2024).
- Article
(10065 KB) - Full-text XML
-
Supplement
(11652 KB) - BibTeX
- EndNote


Winter windstorms constitute the most costly natural hazards for Europe, posing a significant threat to people, infrastructure and the natural environment (Mitchell-Wallace et al., 2017; Priestley et al., 2018; Pinto et al., 2019; Walz and Leckebusch, 2019; Munich Re, 2022; Moemken et al., 2024b). Average annual insured windstorm losses in Europe are of the order of several billion US dollars, with total losses estimated to be well in excess of this. Windstorms also lead to important non-monetary losses, such as casualties (Schwierz et al., 2010; Priestley et al., 2018; Gliksman et al., 2023). Windstorm damage scales non-linearly with storm severity, and single storms of unusual severity can cause losses that exceed the long-term annual average. For example, Windstorm Kyrill, the most severe storm of the 2006/2007 winter season and one of the most severe within the past three decades, struck Europe in January 2007 (Fink et al., 2009; Priestley et al., 2018) and alone caused USD 5.8 billion in insured losses. It further led to 54 fatalities, significant disruptions in transportation and electricity outages, among other impacts (Deutsche Rück, 2008; Munich Re, 2015). Kyrill was also the strongest storm within a series of intense windstorms that struck Europe during the 2006/2007 winter season, which saw an estimated USD 10 billion in cumulative insured losses, as well as high numbers of injuries and deaths (Pinto et al., 2014). Indeed, serial clustering of European winter windstorms, namely, multiple storms following a similar track in quick succession (Dacre and Pinto, 2020), can magnify losses relative to individual storm events. Moreover, more severe storms are more likely to cluster than less severe storms (Pinto et al., 2014; Priestley et al., 2018). Though uncertainties remain in predictions of changes in windstorms with climate change, climate model evidence suggests an increase in both the frequency and strength of storms over northern and central Europe, particularly for more extreme windstorms, with a corresponding increase in storm losses (Pinto et al., 2007; Leckebusch et al., 2007; Schwierz et al., 2010; Pinto et al., 2012; Little et al., 2023; Severino et al., 2024). This occurs in spite of a general decrease in the total number of extratropical cyclones over the region (Ulbrich et al., 2009; Priestley and Catto, 2022). Characterising and understanding extreme European winter windstorm losses is therefore a highly socioeconomically relevant goal.
To address this need, several publicly available and subscription-based storm loss databases have been created and maintained. The publicly available loss databases are often based on a storm severity index that incorporates meteorological indicators and empirical approximations for insured losses. A widely used index is the storm loss model based on Klawa and Ulbrich (2003), in which the predicted windstorm damage is proportional to the cube of the exceedance of the wind speed over a relative threshold value and to the population density (Klawa and Ulbrich, 2003; Pinto et al., 2012; Gliksman et al., 2023; Moemken et al., 2024b). Other approaches are also employed, such as statistical downscaling of wind data (van den Brink, 2019). Insurance and reinsurance companies also simulate storm losses using catastrophe models (Moemken et al., 2024a). However, the loss estimates based on storm severity indices or on catastrophe models require accurate wind speed or wind gust data with high spatial and temporal coverage. Windstorm damage is typically assumed to arise from the strongest wind speeds or gusts during the storm, such that estimates of storm-related losses rely on identifying the locations impacted by a given storm as well as the peak winds as accurately as possible (Klawa and Ulbrich, 2003; Leckebusch et al., 2007; Pinto et al., 2012, 2014; Priestley et al., 2018; Cusack, 2023; Gliksman et al., 2023; Moemken et al., 2024a). The occurrence exceedance probability (OEP) and the annual exceedance probability (AEP), two metrics based on loss estimates that are commonly used in the insurance industry, also rely on accurate wind data. The OEP and AEP represent the maximum loss event during a season and the total losses summed over all events during a season, respectively, and are used to assess return periods of extreme storms and the impact of storm clustering on losses (Priestley et al., 2018). The only loss data that are not sensitive to the quality of the meteorological data are industry reports of recorded insured losses, such as those collected in the PERILS database (http://www.perils.org, last access: 21 April 2025). PERILS is based on data gathered by insurance and reinsurance companies but only provides information on an annual subscription basis and for a subset of European countries (Gliksman et al., 2023; Moemken et al., 2024b).
Wind data of a sufficient quality are therefore crucial for producing reliable, openly accessible and comprehensive storm loss estimates and for the assessment of future risks. This wind information is often provided as a storm footprint, essentially a map of the peak winds, and their magnitudes, encountered during a storm event at locations affected by the storm. These are typically determined through the use of a wind exceedance threshold such as that used in storm severity indices (Klawa and Ulbrich, 2003; Pinto et al., 2012, 2014; Priestley et al., 2018). Two publicly available databases that provide storm footprints and the corresponding storm loss estimates at the time of writing are the eXtreme Wind Storms Catalogue (XWS; Roberts et al., 2014) and the Copernicus Climate Change Service (C3S; C3S Climate Data Store, 2022; van den Brink, 2019) database. These list the most severe European winter windstorms over the past decades and have proven useful in the study of extreme windstorm impacts. Further details on these databases are provided in Sect. 2. However, the XWS and C3S databases are each derived from a single input data set: the ERA-Interim reanalysis (Dee et al., 2011) in the case of XWS and ERA5 (Hersbach et al., 2020) for C3S. While ERA5 is the current state-of-the-art reanalysis data set, there are indications that storm footprints based on ERA5 peak near-surface wind gusts may contain inaccuracies (Cusack, 2023), while ERA-Interim is known to have deficiencies in representing many storms during the later 20th and early 21st centuries (Moemken et al., 2024b). Furthermore, a downscaling approach involving the use of an atmospheric or statistical model was employed to derive the footprints and estimated losses for both databases, requiring intensive computational resources for database extension. Finally, different definitions were used in each database for the spatial extent of the footprint (Roberts et al., 2014; van den Brink, 2019), making the two not comparable, and thus hindering assessment of the uncertainty associated with footprint computation. Thus, while XWS and C3S constitute invaluable tools in the study of extreme windstorms, a need remains for a storm footprint database based on multiple meteorological data sets, which are processed with a standardised methodology.
Having a consistent, reliable and extendable database for historical windstorm risk is a key need for windstorm research (Pinto et al., 2019). In this manuscript, we present the new CLIMK–WINDS (CLimes IMK – WINDstorm) database, which collects the 50 most severe European winter windstorms derived from four different input data sets with four different native horizontal resolutions using a standardised methodology. The meteorological data come from two reanalysis data sets, ERA5 (Hersbach et al., 2020) and COSMO-REA6 (Bollmeyer et al., 2015), and output from two regional climate model simulations, CCLM_ERA5_EUR-11 and CCLM_ERA5_CEU-3, as further described in Sect. 2. This database therefore complements the existing storm databases and expands the footprint data available for use by the scientific community and industry. Its design facilitates an assessment of the impact of different data sources and differing horizontal resolution on the identification of extreme storms and their severity – which we estimate here using an empirical storm loss model based on wind speed data. Equally importantly, it also enables estimation of the uncertainty associated with the footprint itself. CLIMK–WINDS may therefore be used by the scientific community and insurance industry to address the crucial question of how differences in wind gust data affect the characterisation of extreme windstorms and their impacts, supporting an uncertainty-aware analysis of storm damage to mitigate societal impacts.
Throughout the rest of this study, we use the terms “windstorm” and “storm” interchangeably to refer to the extreme storms that affected Europe during the extended winter season.
2.1 Overview of the database
CLIMK–WINDS builds on four different input data sets with different horizontal resolutions (Sect. 2.2). It consists of the windstorm footprints as represented by the relative daily maximum wind gusts during each storm event (unitless), the associated daily maximum wind gusts in absolute units (m s−1), the loss index (LI3D; unitless) integrated over a core Europe region (42° N–60° N, 10° W–15° E) and the unintegrated loss index at each grid point (unitless). These quantities are described in Sect. 2.3. We further provide the name and dates of occurrence of each windstorm, its ordinal rank and its relative rank (also termed the normalised loss, see Sect. 2.4). Because the input data sets are at different native horizontal grid types and resolutions, we maintained the native grid information and created a separate database netCDF file for each input source, rather than merging all the sources into one file.
The database is based on daily wind gust maxima, derived from hourly wind gust data, and covers extended winter seasons (October to March, ONDJFM) from January 1995 to December 2015. This time span was chosen to reflect the period common to both the four input data sets used in CLIMK–WINDS and the two existing databases that we use for comparison and to additionally include the year 2015, during which several storms common to all four input data sets were identified. The 50 most severe storms, or top 50 storms, were identified for each input data set based on the core Europe integrated loss index and included in the database. The individual storms that make up the top 50 storms for each input data set therefore differ, and in some cases the same storm may have somewhat different dates of occurrence across the input data sets.
2.2 Input data sets
Table 1 summarises the input data sets used to create CLIMK–WINDS. These consist of two reanalysis data sets, ERA5 (Hersbach et al., 2020) and COSMO-REA6 (Bollmeyer et al., 2015), and output from two regional climate model simulations on different domains, the CCLM_ERA5_EUR-11 and CCLM_ERA5_CEU-3 simulations, performed with the COSMO model (Rockel et al., 2008). These data sets differ in horizontal resolution, spatial domain size and type of horizontal grid, such as regular latitude–longitude or curvilinear (Fig. 1).
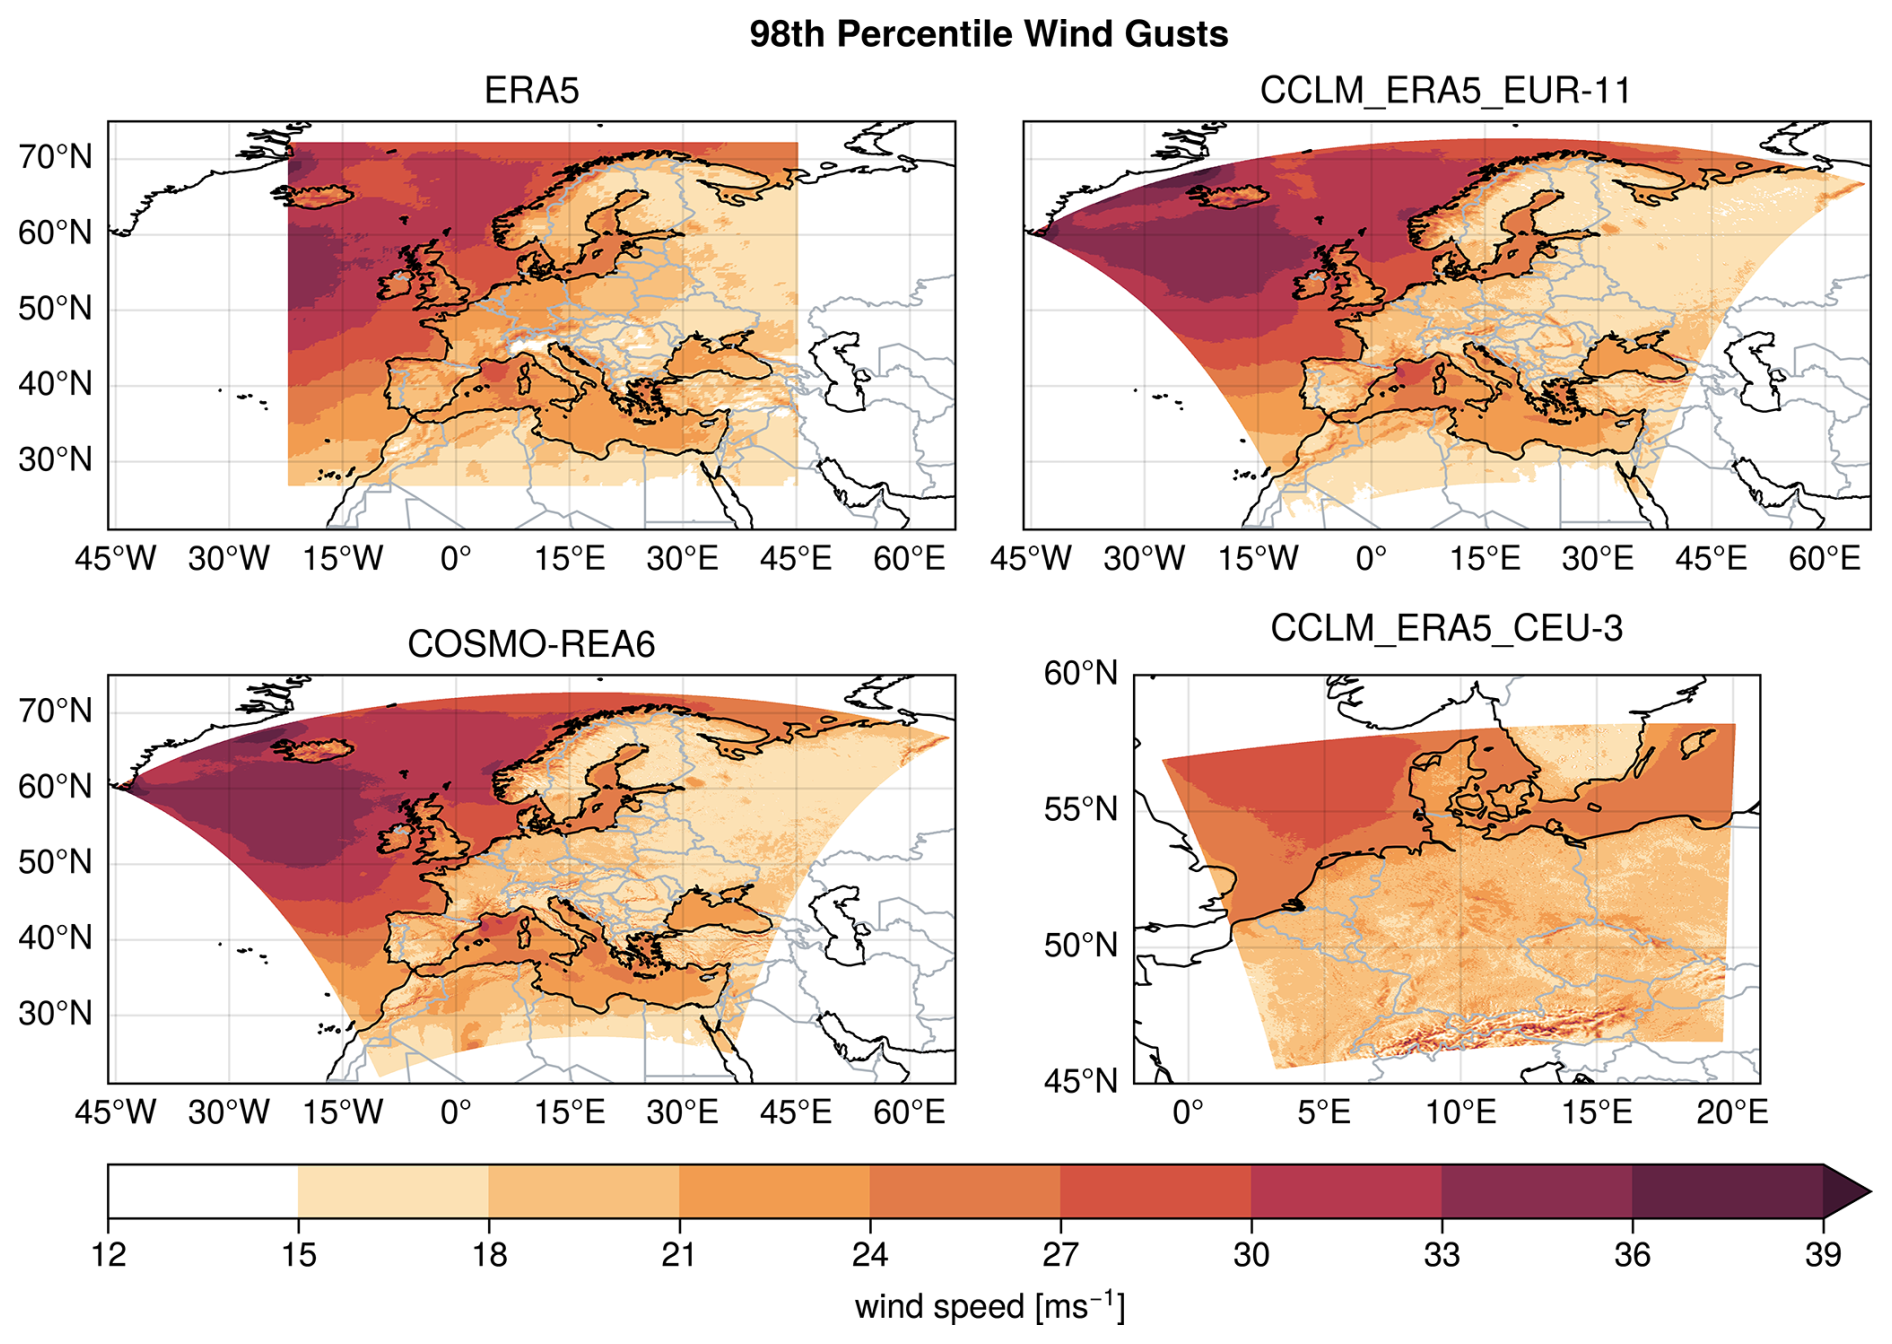
Figure 198th percentile of the daily maximum wind gusts and spatial extent of the input data sets, shown as shaded areas. In clockwise order of the panels: ERA5, CCLM_ERA5_EUR-11, CCLM_ERA5_CEU-3 and COSMO-REA6. Since the CCLM_ERA5_CEU-3 data set spans only an enlarged Germany domain, its map covers a smaller geographical extent than the other three panels. Publisher's remark: please note that the above figure contains disputed territories.
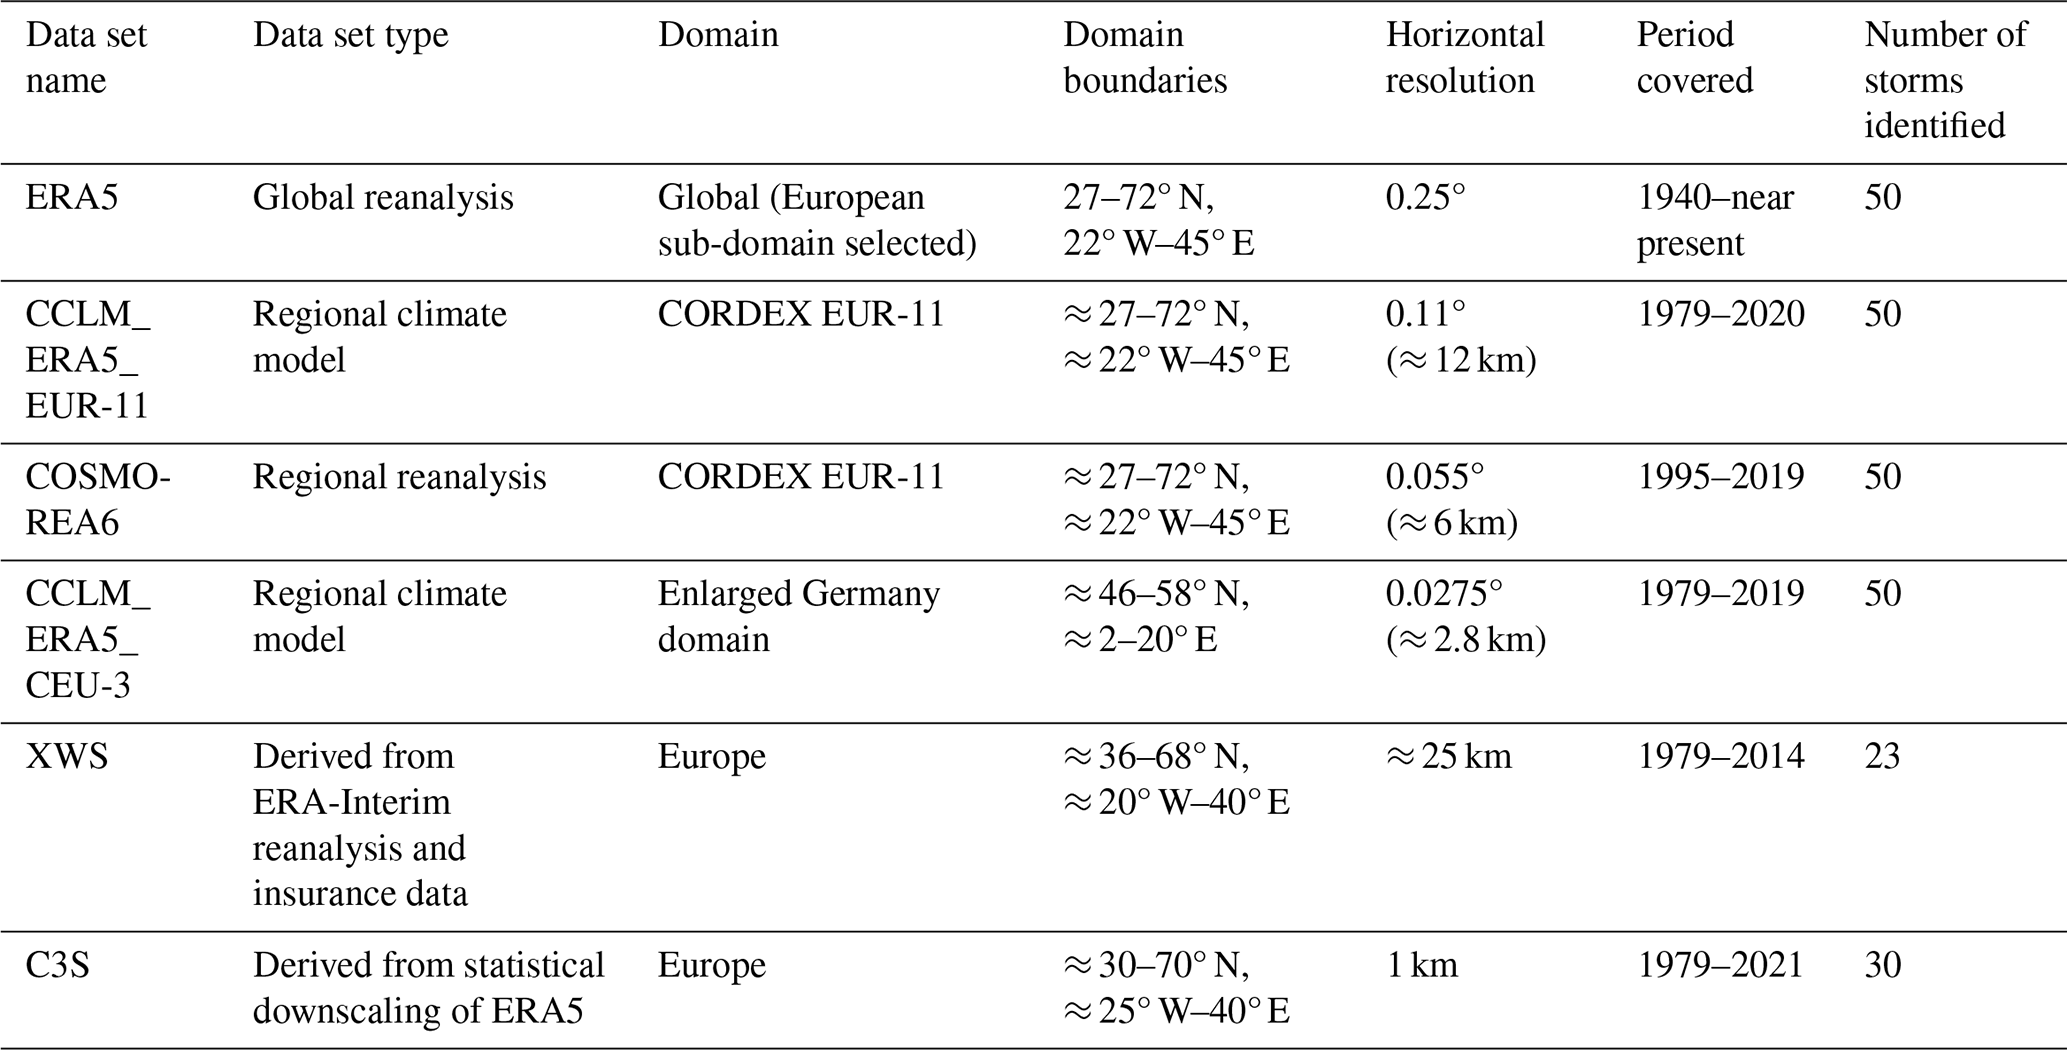
Table 1Summary of input data sets used to create CLIMK–WINDS or used for comparison with the database.
The publicly available ERA5 reanalysis from the European Centre for Medium-Range Weather Forecasts (ECMWF) provides global data with a 0.25° horizontal resolution and with many parameters available at hourly temporal resolution (Hersbach et al., 2020). We analyse ERA5 storm footprints over 27–72° N and 22° W–45° E, to approximately match the CORDEX EUR-11 domain (Jacob et al., 2014, 2020). The reanalysis is based on the Integrated Forecasting System (IFS) Cy41r2 model (Hersbach et al., 2020), which was operational at ECMWF in 2016 (Bonavita et al., 2016). Data span 1940 to the near present. ERA5 is often used for evaluation and bench-marking of other data sets, such as model simulation output, due to its global coverage, high temporal resolution and observationally constrained, physically consistent, atmospheric data.
The Hans Ertel Centre for Weather Research (HErZ) and the Deutscher Wetterdienst (DWD; German Weather Service) developed the COSMO-REA6 (Consortium for Small-Scale Modelling Reanalysis, 6 km) high-resolution regional reanalysis data set for Europe, with a 0.055° (approximately 6 km) horizontal resolution and 15 min or hourly temporal resolutions (Bollmeyer et al., 2015). COSMO-REA6 is available over January 1995–August 2019, since it uses ERA-Interim reanalysis data (Dee et al., 2011) for lateral boundary conditions and the latter are no longer produced. The spatial domain matches that of the CORDEX EUR-11 domain (Jacob et al., 2014, 2020), which covers approximately 27–72° N and 22° W–45° E. Unlike ERA5, COSMO-REA6 is based on the COSMO (Consortium for Small-Scale Modelling) model in numerical weather prediction mode, developed by the DWD (Baldauf et al., 2011). It uses nudging of surface synoptic conditions, aircraft measurements, radiosondes, buoys, ship reports and wind profilers in its data assimilation scheme (Bollmeyer et al., 2015).
The CCLM_ERA5_CEU-3 simulations were run with the non-hydrostatic COSMO model version 5.0 in climate mode (COSMO-Climate Limited-Area Mode, COSMO-CLM) (Rockel et al., 2008). These were performed by the DWD in collaboration with the Climate Limited-area Community (CLM-Community) collaborative network. COSMO-CLM is the climate version of the limited-area numerical weather prediction COSMO model used to produce COSMO-REA6, convection permitting, and driven by ERA5 through direct downscaling. CCLM_ERA5_CEU-3 spans an enlarged Germany or COSMO-DE domain (approximately 45–58° N and 1–20° E) at 0.0275° (approximately 2.8 km) horizontal resolution (Baldauf et al., 2011; Brienen et al., 2022). Output is available for the years 1979–2019 up to hourly resolution (https://esgf.dwd.de/search/esgf-dwd/, last access: 21 April 2025). Output does not extend beyond 2019 as the DWD discontinued use of the COSMO-CLM model. The CCLM_ERA5_CEU-3 simulation output used to create the extreme storms database presented here therefore presents the highest horizontal resolution, but smallest spatial domain, amongst the four input data sets that we used.
Lastly, the CCLM_ERA5_EUR-11 simulations were performed by the Helmholtz-Zentrum Hereon in collaboration with the CLM-Community and EURO-CORDEX. The COSMO-CLM model, in the same configuration as for the CCLM_ERA5_CEU-3 simulations, was used, but on the CORDEX EUR-11 domain at a horizontal resolution of 0.11° (approximately 12 km). The European branch (EURO-CORDEX; Jacob et al., 2014, 2020) of the Coordinated Regional Downscaling Experiment (CORDEX; Giorgi and Gutowski, 2015) is a collaborative initiative that seeks to advance regional climate and Earth system science in Europe. It defined the CORDEX EUR-11 domain in 2013, intended to be used for simulations with a horizontal resolution of 0.11°. Output is available for the years 1979–2020 at up to hourly resolution.
2.3 Windstorm footprint identification
To identify the windstorm footprints within each input data set, and to quantify their severity, we employed the storm loss model known as loss index (LI). This was developed by Pinto et al. (2012) and extended by Karremann et al. (2014) and is in turn based on the storm loss models developed by Klawa and Ulbrich (2003) and Leckebusch et al. (2007). The LI was originally developed based on near-surface daily maximum wind speed (Pinto et al., 2007) but we exchanged this for near-surface daily maximum wind gusts derived from hourly data. This is an unproblematic exchange, as wind speeds are often used as a proxy for wind gusts when gust data are unavailable, and maintains consistency across calculations and comparisons.
The LI is based on the assumption that storm damage occurs only for the highest 2 % of local wind speeds, or wind gusts in our case (Klawa and Ulbrich, 2003; Pinto et al., 2012; Karremann et al., 2014). The footprint of an individual storm is therefore only those locations whose local daily maximum wind gusts on the date of the storm exceed the local 98th percentile of wind gusts. We define this here using the 20-year period common to all data sets used in our analysis (including XWS and C3S, see Sect. 2.5), namely 1995–2014. The 98th percentile of wind gusts for each of the four input data sets is shown in Fig. 1. The storm footprint is expressed in our database in terms of the unitless relative wind gust; the absolute wind gusts associated with the footprint are also provided. The relative wind gust is the ratio of the local daily maximum wind gust that occurred during a given storm to the local 98th percentile; it indicates the magnitude of the exceedance over the 98th percentile and is everywhere greater than 1.0 within the storm footprint (Pinto et al., 2007, 2012).
Individual storms must then be separated from each other in time and their severity assessed. This is accomplished through calculation of the LI itself, which relies on two additional assumptions. First, potential storm losses are assumed to increase with the cube of the maximum wind speed or gust, as this is proportional to wind power. Second, storm losses are linked to the exposure/insured value, which can be approximated by population density (Pinto et al., 2012; Karremann et al., 2014). We used the Gridded Population of the World, version 4 (GPWv4), population density data set for the year 2020, the latest year available, provided by the Center for International Earth Science Information Network (CIESIN) at Columbia University (CIESIN, 2018). These data have a horizontal resolution of 0.04° and were regridded to the resolutions of the four input data sets before use (Fig. S1 in the Supplement). The LI was computed for each day and is defined as
where
and indicates whether or not the daily maximum wind gust at grid point ij falls within the storm footprint; POPij is the population density at grid point ij and vij and are the daily maximum wind gust and the 98th percentile wind gust, respectively, at grid point ij (Pinto et al., 2012; Karremann et al., 2014). Differences in LI among the four data sets arise mostly in densely populated regions, due to the corresponding horizontal resolution of the regridded population density data (Fig. S2). An overlapping 3 d sliding time window is applied to the LI in order to separate individual storms in time and the temporal local maximum of each 3 d window is assumed to be the individual storm event (Karremann et al., 2014):
The LI3D provides the final temporally separated storm footprints for individual storms. It should be noted, however, that if storms occur too closely together in time, such as storms Lothar and Martin in December 1999, it can be very difficult or impossible to separate the storms with LI3D. This seldom happened in the creation of our database but, when it did occur, the storms were typically counted as one “combined” storm in the database. The LI3D can be integrated over any spatial domain of interest; to create our database, we integrated over the core Europe region defined previously, following Pinto et al. (2012). The unintegrated loss index included in the database refers to the summand inside the Σ operator in Eq. (2) that is computed at each grid point before any integration is performed, not to the LI3D. This quantity is thus akin to a pre-LI3D. The unintegrated loss index enables users to compute an integrated loss over a subset region of a given storm's footprint, such as at the country level. This should be regarded as a loss proxy, since the LI3D builds upon an empirical storm loss model.
An example of a storm footprint as represented by the relative wind gusts is shown in Fig. 2 for Storm Kyrill for each of the four input data sets, as Kyrill was identified as the most severe storm in all four. Figure 3 displays the absolute daily maximum wind gusts associated with the footprints for each of the four input sources, as well as for XWS and C3S. Figures 2 and 3 clearly highlight the differences among the footprints for the same storm due to differences in input data sets and, in the case of Fig. 3, storm footprint definition.
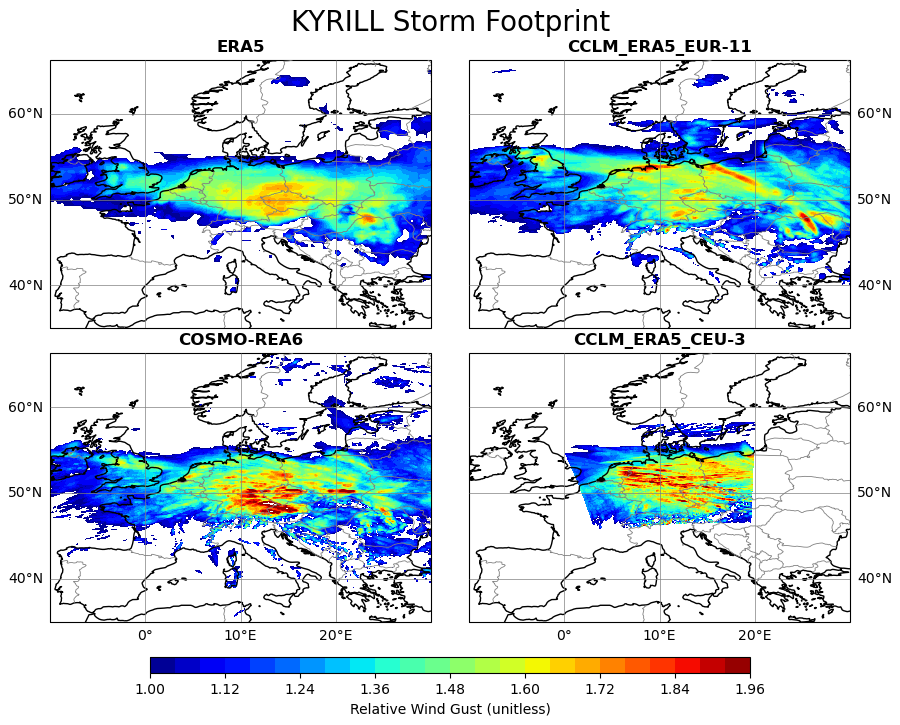
Figure 2Storm footprints, as represented by the locations for which the relative wind gust was greater than 1.0, for Windstorm Kyrill (January 2007) for the four input data sets used here. For XWS and C3S it was not possible to compute or obtain the relative wind gusts. Footprints are all plotted at their native horizontal resolution and for their native domain.
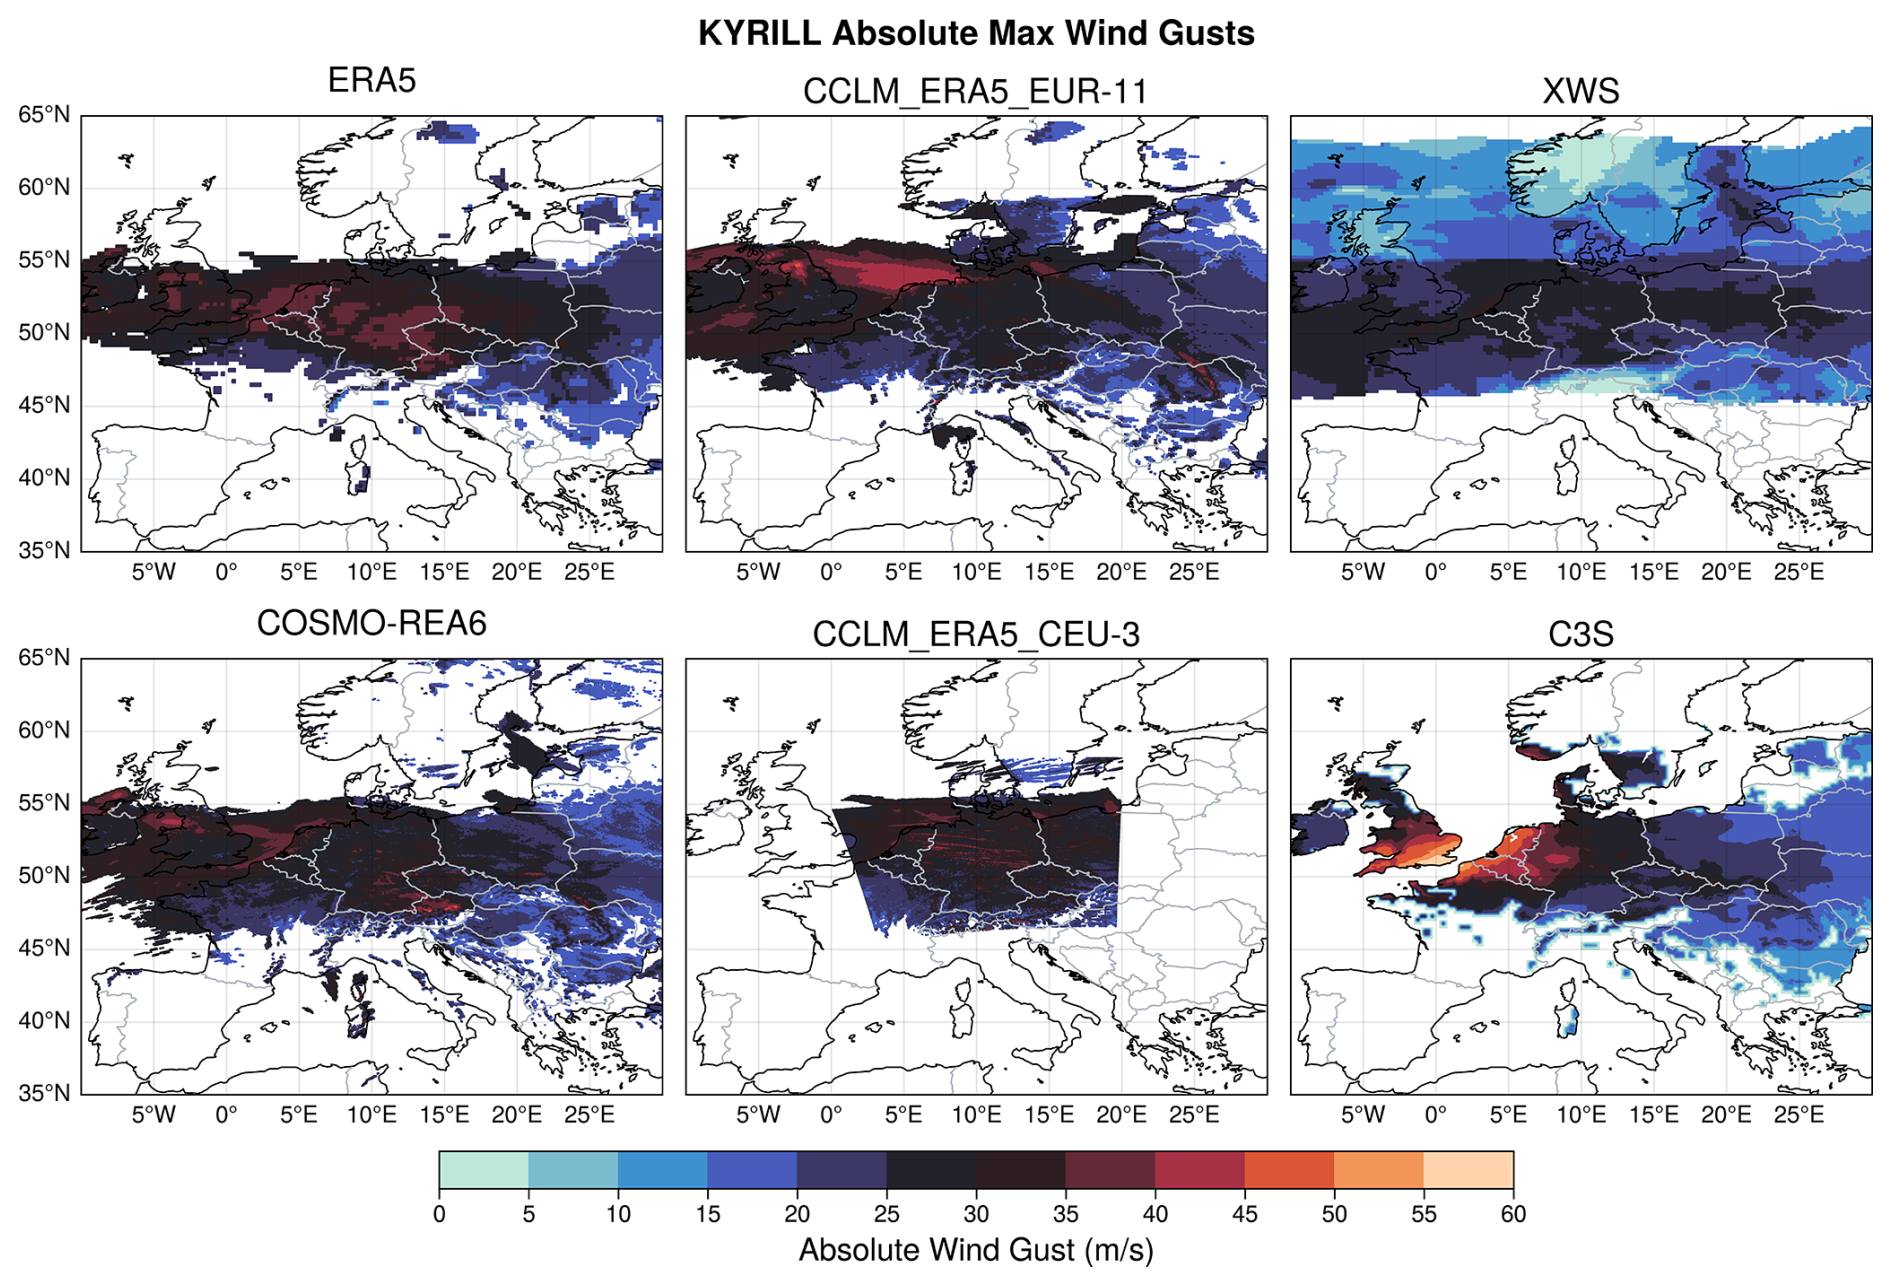
Figure 3The daily maximum wind gusts (m s−1) for Windstorm Kyrill (January 2007) at each location associated with the storm footprints displayed in Fig. 2, or provided by the XWS and C3S databases. C3S wind gusts were plotted after masking had been performed (see text). Absolute wind gusts are all plotted at their native horizontal resolution and for their native domain.
2.4 Selection of extreme windstorms
We selected the 50 most severe (top 50) storms over the period 1995–2015, derived from each input data set based on the 50 largest magnitudes of the LI3D integrated over the core Europe domain. The selected storms were manually checked to ensure that they represented either unique individual storms or, in the case of storms that could not be sufficiently separated, a unique “combined” storm. The dates of the top 50 storm occurrences for each input data set in the database are the mid-points of the 3 d time windows containing the 50 largest LI3D magnitudes.
Based on these dates, storm names were assigned to the individual storm events. Storm names were taken from several sources, including the lists of named storms produced by the DWD and the Freie Universität Berlin for the years 1999–2015 (https://www.wetterpate.de/namenslisten/tiefdruckgebiete/index.html, last access: 21 April 2025; in German), the past European winter windstorm documentation provided by Deutsche Rück for the years 1997–2015 (https://www.deutscherueck.de/downloads, last access: 21 April 2025, in German) and Wikipedia articles about European winter windstorms (primarily English articles). Some storms, chiefly those occurring earlier than 1997, appear to lack names given by a meteorological service or research institution. In these cases, we have taken the storm date of occurrence, preceded by the lower case letter “u”, as the storm name and we have preferred the date as identified from ERA5 for the name, if the storm was identified within ERA5 and at least one other data set. As mentioned previously, some storms could not be sufficiently separated with LI3D in some input data sets and were thus taken as a single “combined” storm; the names of the individual storms that could not be well separated were hyphenated to create the storm name. Some individual storms had two different names given by different entities. These storms retained both names, one “main” name and a “secondary” name given in parentheses (or connected by an underscore rather than parentheses within the database files for ease of coding). Lastly, two different storms were given the same name, Franz, and so we have identified one storm as Franz (11 and 12 January 2007) and the other as Franz-II (12 December 1999); the hyphenated name in this one case does not indicate two storms that could not be well separated.
2.5 Existing windstorm databases for comparison
The XWS (Roberts et al., 2014) and C3S (C3S Climate Data Store, 2022; van den Brink, 2019) storm databases were used as terms of comparison for CLIMK–WINDS. The characteristics of these databases are also summarised in Table 1.
The publicly available XWS database (http://www.europeanwindstorms.org, last access: 21 April 2025) includes 50 of the most severe European storms within the extended winter season for the years 1979–2014, and includes storm footprints and storm severity indices or loss estimates. There are currently no plans to extend this database beyond 2014. The footprints were computed by dynamically downscaling the ERA-Interim reanalysis data set (Dee et al., 2011) to a horizontal resolution of 0.22° (approximately 25 km) with the UK Met Office Unified Model (MetUM; Davies et al., 2005) over a domain including western Europe and the eastern North Atlantic. The footprints are defined as the maximum 3 s wind gusts at each grid point in the downscaled domain over a 72 h period but, rather than taking the maximum gusts over the entire domain, all wind gusts outside of a 1000 km radius centred on the storm track are neglected before taking the maximum. This is done to separate storms that occurred closely together in time from each other. A meteorological severity index Sft (Roberts et al., 2014) was computed for each storm, as
where (Umax)3 is the cube of the storm's maximum near-surface wind speed as an indication of storm intensity and N is the footprint size index, defined as the number of 25 km footprint grid points over European land regions, including Scandinavian for which the maximum wind gust exceeds 25 m s−1. Though differently formulated, the Sft index is based upon the winds associated with a storm, just as the LI and LI3D. Of the 50 storms in the XWS database, 23 storms were included after consultation with the Willis Research Network and based on the extreme values of insured losses. These constitute the “insurance storms”, while the remaining 27 storms were included based on the Sft index. The insurance storms are provided with an insured loss amount in US dollars (indexed to the year 2012), in addition to the Sft index. For comparison with our database, we ranked the 50 XWS storms based on their Sft magnitudes. The XWS data were used directly and required no further processing, as footprints in this database are already restricted to the area affected by each storm.
The publicly available C3S database (C3S Climate Data Store, 2022) was derived from ERA5 and includes significant winter storms from the years 1979–2021 for 21 countries in western, central and northern Europe at a horizontal resolution of 1.0 km; southeastern European countries were not included. Though this database currently extends to 2021, it may be extended further as the ERA5 reanalysis will continue to be updated. Similarly to XWS, the C3S footprint was defined as the maximum 3 s near-surface wind gust over the 72 h period capturing the storm. However, the footprints were computed by statistically rather than dynamically downscaling reanalysis data – which, in the case of C3S, come from ERA5. A multiple linear regression model to derive estimates of the strongest wind gusts during a storm period, following van den Brink (2019), was developed and validated; the ERA5 wind gust data, wind gusts estimated from the wind speed shear between the 10 and 100 m altitude levels (also taken from ERA5) and weather observation station elevation height were used as predictors. This method is valid only for land areas. A total of 148 storm footprints are included in the C3S database. However, the strongest wind gusts associated with a storm were estimated over all land areas within the full C3S domain, covering 35–70° N and 20° W–35° E. Thus, the C3S data do not, a priori, distinguish between those grid points that are and are not impacted by a given storm. No cut-off criterion, such as the 1000 km radius centred on the storm track used in the XWS database, was applied. Though the footprints are often apparent as the areas across Europe with the strongest wind gusts, this leaves ambiguity over precisely where each footprint begins and ends. Because the C3S database is derived from ERA5, we used the footprints we identified from the ERA5 data set in the course of creating CLIMK–WINDS as a spatial mask to “cut out” the C3S wind gusts belonging to a given storm's footprint, after first regridding the ERA5 footprints to the C3S horizontal grid. Following this procedure, we then computed the LI3D for each C3S storm to assess storm severity.
Since the XWS and C3S databases are used as terms of comparison, we selected only those storms from the period 1995–2015 (1995–2014 for XWS) that were also found in at least one of the four input data sets listed previously. This resulted in 23 extreme windstorms for XWS and 30 for C3S. The XWS and C3S databases do not provide relative wind gust data; therefore direct comparisons were only possible between the XWS and C3S databases and CLIMK–WINDS for the absolute wind gusts associated with the footprints.
2.6 Ordinal and relative ranking of windstorms and risk metrics
In order to compare storm severity among the storms identified within our database, the top 50 storms were each assigned an ordinal rank and a relative rank, also called the normalised loss index or simply normalised loss. Ordinal ranking is straightforwardly based on the magnitude of the LI3D, where the storm with the largest LI3D was assigned rank 1 and the storm with the smallest LI3D was assigned rank 50. Ordinal ranks for the same storm identified in two or more input data sets can differ.
The relative rank, which we also refer to in the following sections as relative severity or normalised loss, is based on min–max scaling of the LI3D:
where i refers to the value for an individual storm. The normalised loss ranges from 0.0 for the storm with the smallest impact (the storm with ordinal rank 50) to 1.0 for the storm with the most impact (the storm with ordinal rank 1). The normalised loss thus expresses the severity of each individual storm as relative to the severity of the most severe storm (that with both ordinal and relative rank of 1) and provides an indication of how different the storms are from each other. The normalised losses and the ordinal ranks vary inversely and monotonically with each other. These ordinal and relative ranks are included in the netCDF files that constitute our extreme storms database. The ordinal ranks and normalised losses were also computed for the XWS and C3S storms, though relative to total storm numbers of 23 for XWS and 30 for C3S, rather than 50 (Sect. 2.5). We based the ranks and normalised losses on the Sft index, for XWS, and on the LI3D magnitudes corresponding to the ERA5 footprints used to “cut out” the footprints for C3S.
In addition to ordinal ranks and normalised losses, we compute the OEP and AEP risk metrics, namely the maximum loss event during a season and the total losses summed over all events during a season. Their ratio informs on whether losses during a season were dominated by a single, exceptionally damaging, storm or by several less damaging storms. Here, we compute the OEP and AEP using LI3D, rather than from actual loss data.
3.1 Overview of the identified extreme storms
Our database identified 76 unique storms within the top 50 storms across the four input data sets. Of these storms, 29 storms (approximately 38 % of the unique storms) were identified as top 50 storms within all four input sources, constituting the common storms listed in Table 2. Table 2 also indicates whether these storms are found in the XWS and C3S databases. The file Top50Storms_All_Summary.csv in the Supplement summarises all the top 50 storms identified within each of the input data sets and whether they are found in XWS and C3S, along with their ordinal ranks in each data set.
Table 2Summary of the top 50 extreme windstorms common to all of the four input data sets, with their dates of occurrence and ordinal ranks (rank 1 = most severe storm, rank 50 = least severe storm, of the top 50 storms). A storm name in parentheses indicates that the same storm had two different names, while a hyphenated name indicates that two individual storms could not be effectively separated from each other within the database. For storms lacking given names and thus named after their date of occurrence, the ERA5 date was preferred. An “×” marks storms missing from a data set; “–” indicates storms outside XWS's coverage period. Dates are given as yyyy-mm-dd.
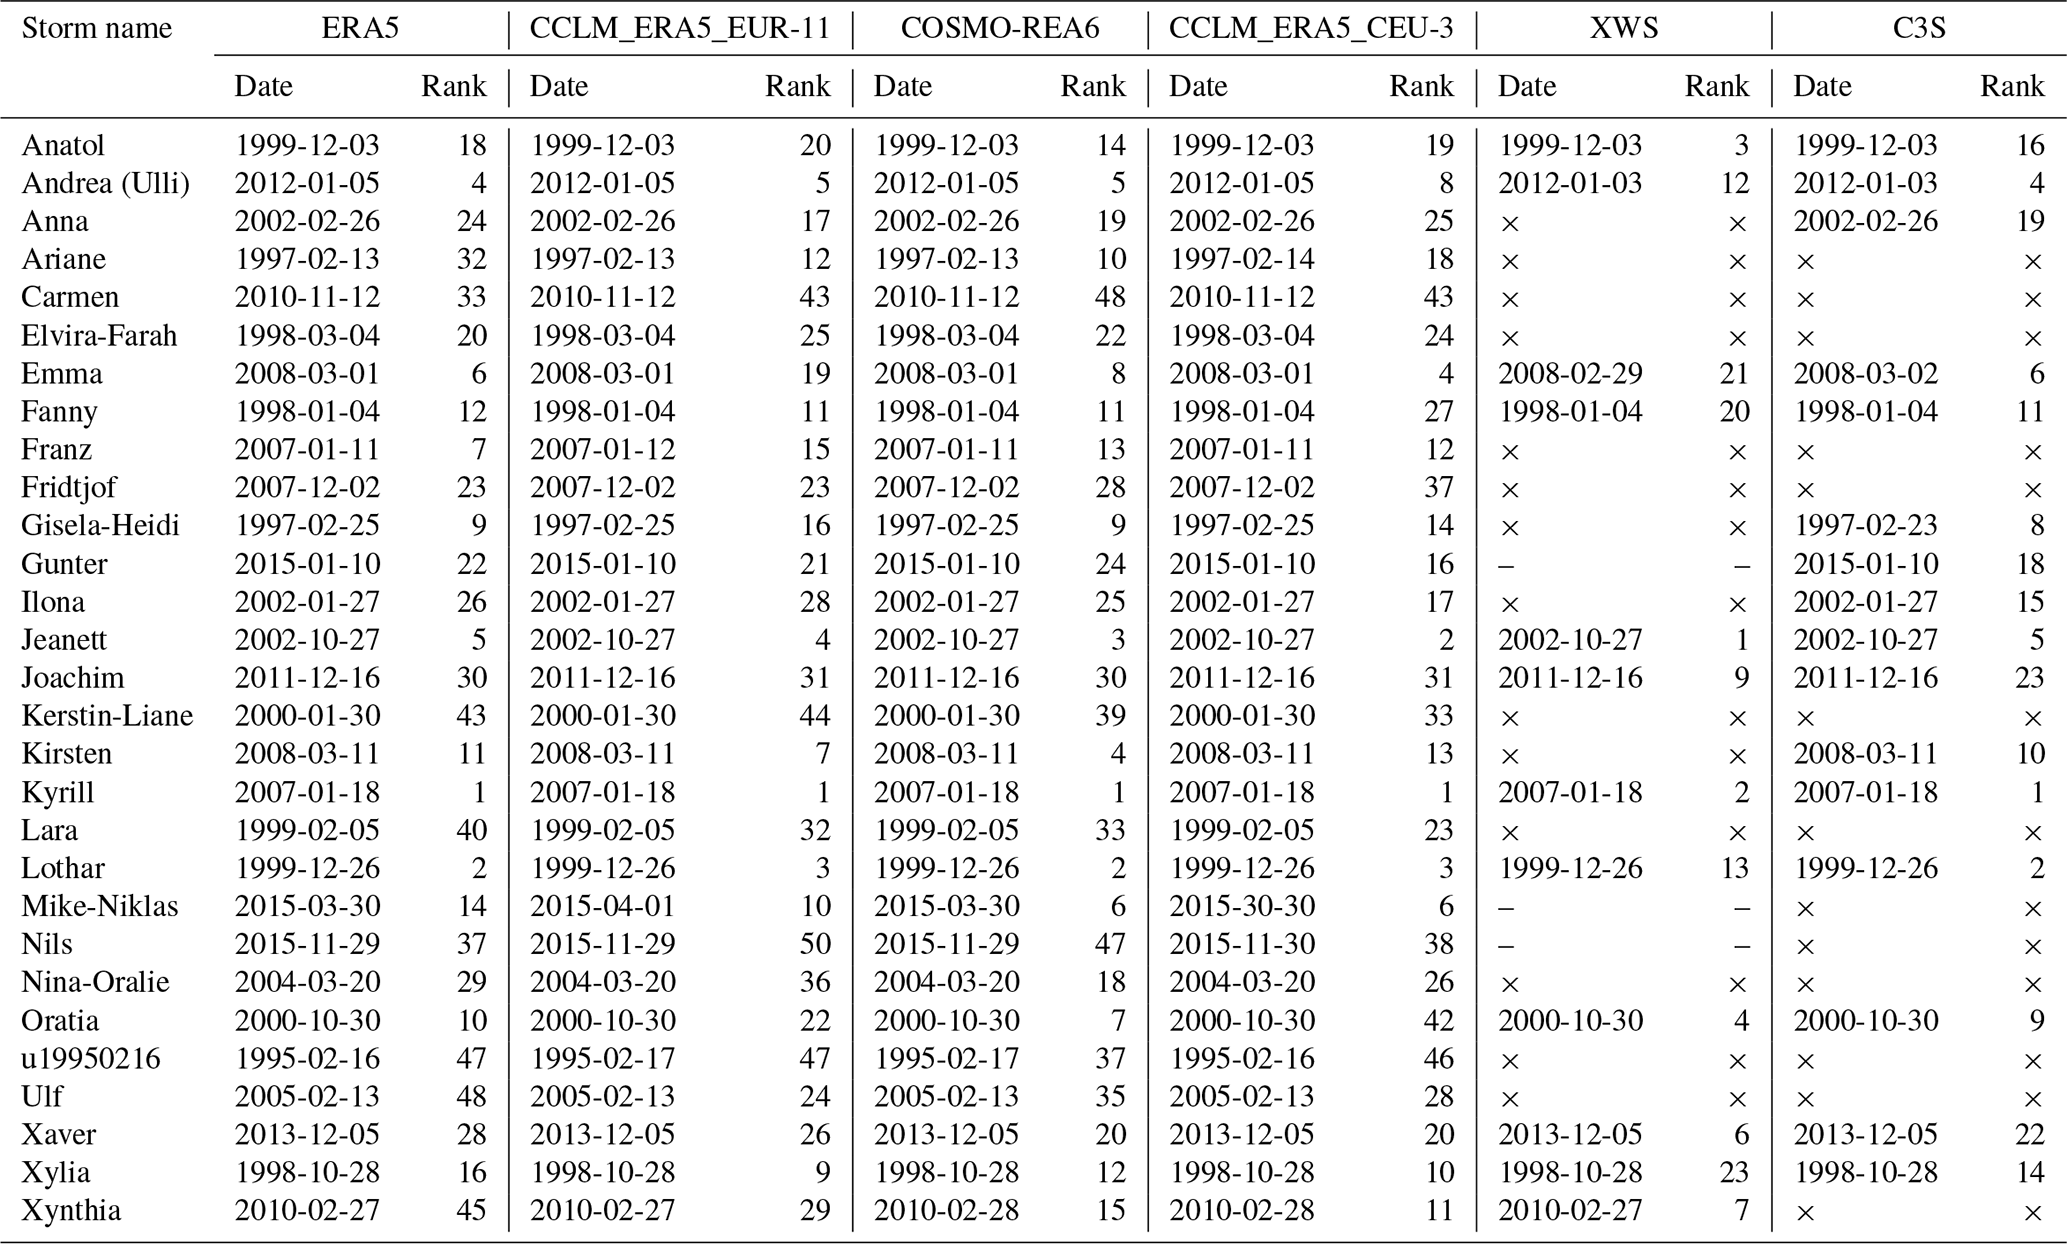
Despite their occurring closely together in time, only Storm Lothar belongs to the common storms while Martin does not, as it was not identified within the COSMO-REA6 and CCLM_ERA5_CEU-3 data sets. This is probably because Martin could not be sufficiently separated from the first-occurring Lothar within the COSMO-REA6 data set, while Martin's more southerly storm track fell mostly outside the domain of CCLM_ERA5_CEU-3. The date of occurrence for Mike-Niklas was identified as 1 April 2015 in CCLM_ERA5_EUR-11. Though technically outside the temporal domain we considered for the database, we decided to keep this storm for this input data set as Mike-Niklas was identified within the remaining input sources as occurring within the extended winter season we defined.
The remaining 47 storms (approximately 62 % of the unique storms) were identified as in the top 50 in at least one of the input data sets but not all four (listed in the file Top50Storms_All_Summary.csv in the Supplement). Of these 47 storms, 18 were identified as being in the top 50 in only one input source. Four storms were identified in ERA5 alone (Becky, the Boxing Day storm, Friedhelm and Jette), six each were identified in CCLM_ERA5_EUR-11 alone (Dagmar, Eberhard, Julia, u19961106, u19961120 and u20000209) and in CCLM_ERA5_CEU-3 alone (Dorian, Elizabeth, ex-hurricane Gonzalo, Gerda-Hann, Ingo and Quinten) and two were identified in COSMO-REA6 alone (Susann and Orkun). It is unexpected that CCLM_ERA5_CEU-3, rather than COSMO-REA6, displayed a similar number of storms identified only in that input data set to ERA5 and CCLM_ERA5_EUR-11, given its much smaller spatial domain. The remaining 29 storms within our database were identified in two or three of the input data sets; no systematic pattern appears to exist in which combinations of input sources are preferred.
All common storms, with the exception of six storms, were identified as occurring on the same date across the four input data sets. Mike-Niklas was recorded 2 d later in CCLM_ERA5_EUR-11 than in all the other data sets. The remaining five common storms displayed a discrepancy in date of occurrence of 1 d (Table 2). When considering all top 50 storms identified in at least two input data sets, approximately 74 % of storms displayed no discrepancy in the date of occurrence and approximately 26 % of storms displayed a discrepancy of 1 d. One of the reasons for these discrepancies is the smaller spatial domain of CCLM_ERA5_CEU-3, compared with the others.
Only 12 of the common storms were also found in the suite of XWS storms examined here (approximately 52 % of all the XWS storms used here), while 16 of the common storms were found in C3S (or approximately 53 % of all the C3S storms used here). When a common storm was also found within both the XWS and C3S databases, the dates of occurrence between CLIMK–WINDS, XWS and C3S agreed with each other for all storms, except for Andrea (Ulli), Emma, Gisela-Heidi and Xynthia. In the case of Emma, XWS and C3S also disagreed with each other. These discrepancies were of 1 or 2 d (Table 2). Relative to our database, XWS and C3S thus most often displayed no discrepancy in the date of occurrence for the common storms. The same holds for the other top 50 storms.
The four input data sets in our database thus demonstrate some disagreement on which storms are identified as belonging to the top 50, and a generally strong (albeit not perfect) agreement on the dates of the storms for those occurring in two or more data sets. These discrepancies exist despite the use of a consistent methodology. This points to the important differences resulting from the use of different input data sets when defining storm footprints and storm severity, while comparisons with XWS and C3S further highlight potential impacts resulting from differences in storm footprint identification methodology.
3.2 Storms per extended winter season
The distribution of storms per extended winter season over all top 50 storms identified from each of the four input data sets, XWS and C3S is displayed in Fig. 4.
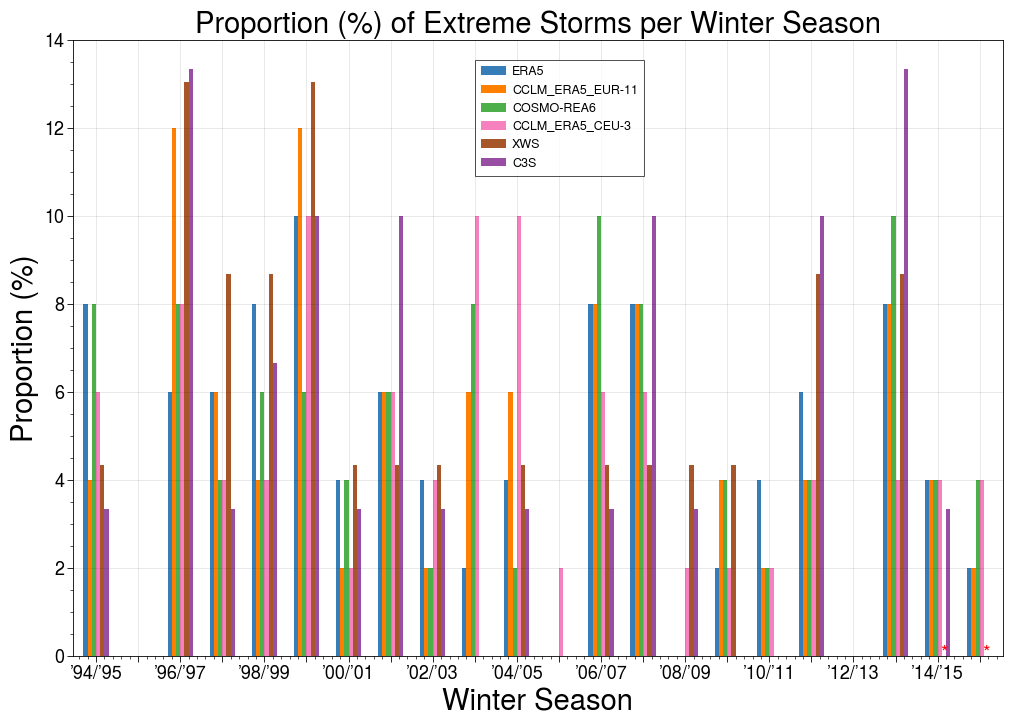
Figure 4Percentage of extreme storms (y axis) that occurred during each extended winter season (ONDJFM; x axis) for each input data set, XWS and C3S. The end-cap extended winter seasons 1994/1995 and 2015/2016 exclude storms that occurred in the years 1994 and 2016. Percentages are computed relative to the total number of extreme storms for each data set: 50 storms for ERA5, CCLM_ERA5_EUR-11, COSMO-REA6 and CCLM_ERA5_CEU-3; 23 for XWS; and 30 for C3S. No bars indicate that no extreme storms were identified in a given year and data set. Asterisks mark winters not covered by XWS.
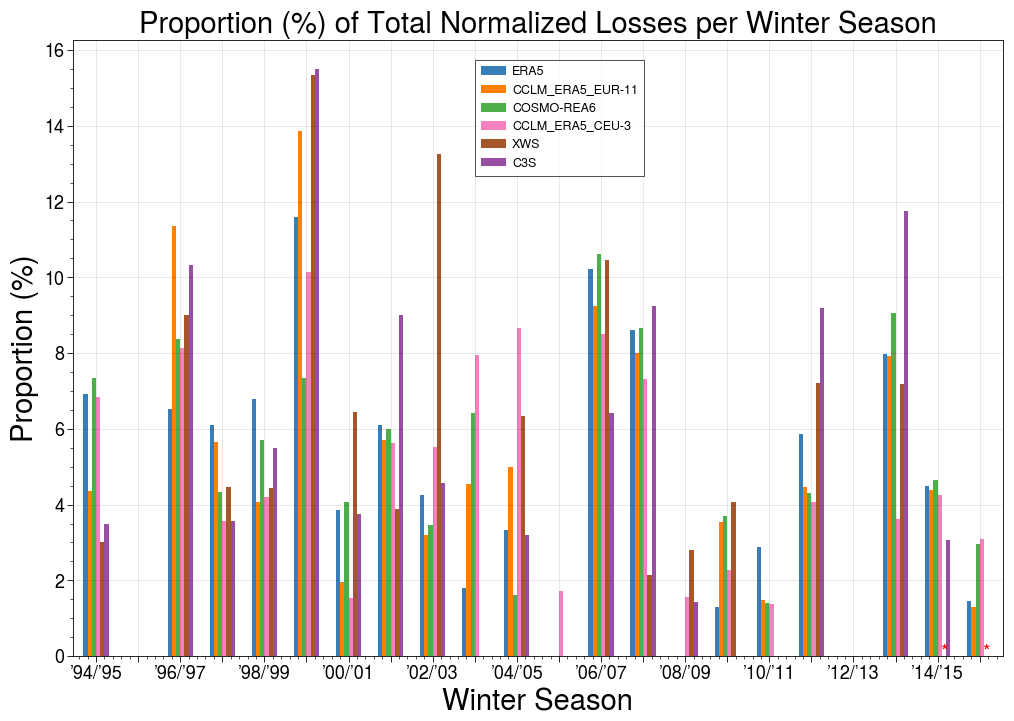
Figure 5Percentage of total normalised loss (y axis) that was incurred per extended winter season (ONDJFM; x axis) for each input data set, XWS and C3S. The end-cap extended winter seasons 1994/1995 and 2015/2016 exclude storms that occurred in the years 1994 and 2016. Asterisks mark winters not covered by XWS.
There is a large interannual variability, but no data set shows any significant trend in extreme storm occurrence over time. Further, the input data sets demonstrate disagreement on the periods of low and high storm activity (Table 3). The input sources agree best on the winters with no extreme storm activity: no storms were identified for the 1995/1996 and 2012/2013 extended winter seasons from any of the four inputs, while one storm was identified within CCLM_ERA5_CEU-3 for the 2005/2006 (Dorian) and 2008/2009 (Quinten) winters but not within the remaining three inputs. This level of agreement cannot be found for other periods of low or high storm activity. There are no additional winters for which all four input sources agree as belonging to periods of low storm activity, high storm activity or very high storm activity, as indicated by winters during which 2 %, 8 % and 10+ % of all storms occurred, respectively (Table 3). While three data sets agree for one winter within each of these periods, the remaining winters show agreement only among two input data sets or are unique to one data set. However, even when different data sets agree on the categorisation of a specific winter, differences in the number of detected storms can exist. For example, the ERA5, CCLM_ERA5_EUR-11 and CCLM_ERA5_CEU-3 data sets agree that the 1999/2000 winter exhibited very high extreme storm activity. However, 10 % of all storms were given as occurring during this winter in ERA5 and CCLM_ERA5_CEU-3, while 12 % of all storms were obtained by CCLM_ERA5_EUR-11 (Fig. 4; Table 3). It is notable that the two winters with very high activity displayed by COSMO-REA6 occur during the second 10 years of our database, whereas the very high activity winters for the remaining three input data sets occur during the first 10 years.
Table 3Summary of the winters within each input data set, XWS and C3S that belong to the periods of no storm activity (0 % of all storms during one winter season), low storm activity (2 % of all storms during one winter season), high storm activity (8 % of all storms during one winter season) and very high storm activity (10+ % of all storms during one winter season). The percentages of normalised storm losses that occurred during each winter for each data set are given in parentheses. Winters are listed in chronological order for each data set and section.
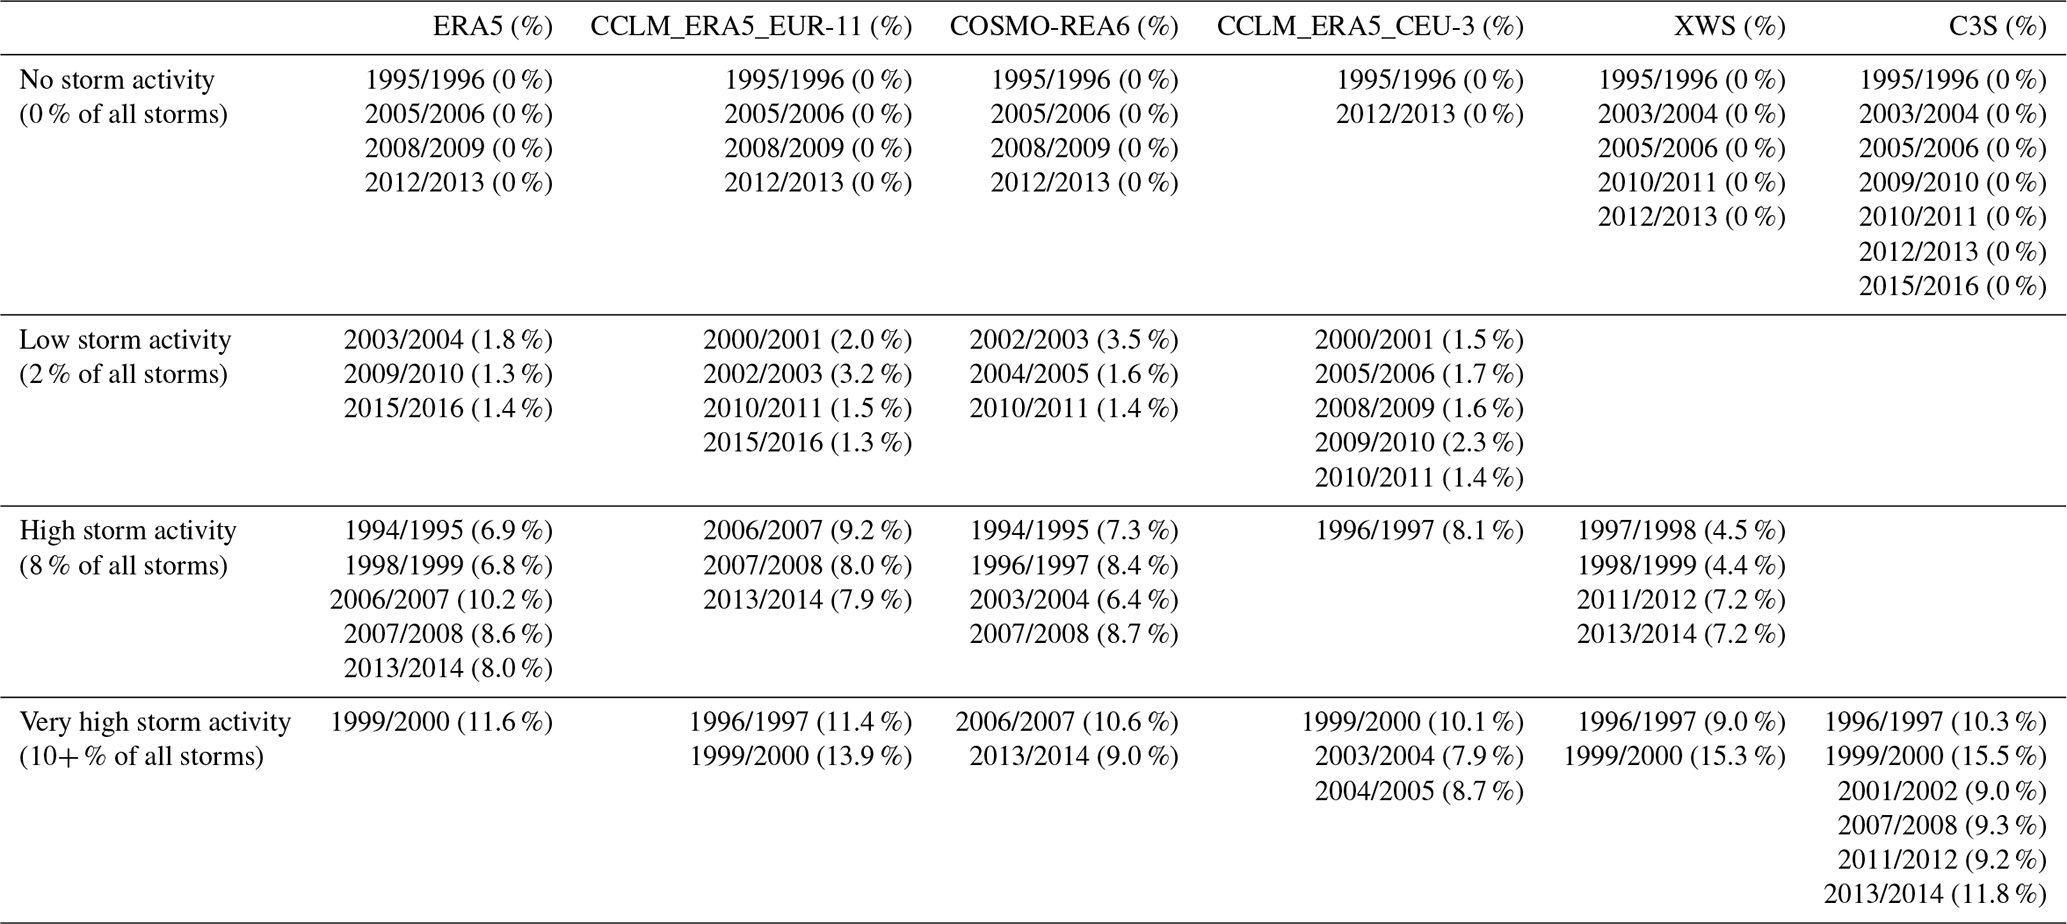
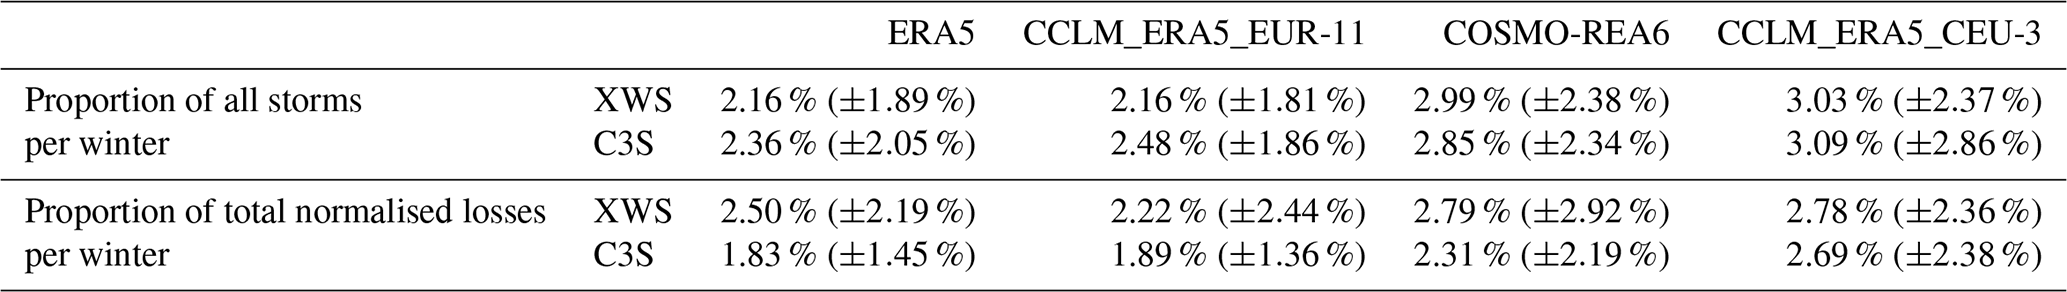
The XWS and C3S databases display quite different distributions of storm frequencies, compared with our database (Fig. 4; Table 3). Though these two databases contained no extreme storms during the 1995/1996 and 2012/2013 winters, in agreement with our database, they also contain additional winters with no extreme storms, which are not identified in any of our four input data sets. They agree on two of these winters: 2003/2004 and 2010/2011 (Table 3). XWS and C3S further display no winters that belong to the low storm activity category, and C3S displays no winters that belong to the high activity category. There is no clear difference in the level of agreement between our database and XWS or C3S, given the similar mean absolute differences in storm percentage per winter and the large standard deviations (Table 4). The differences from our database partially reflect that we neglected storms identified within XWS and C3S that were not identified within our database and that XWS and C3S did not contain all the extreme storms identified within our database (nor all winters within the analysis period, in the case of XWS). The differences in storm frequency distribution and periods of high and low storm activity among our database, XWS and C3S further highlight the influence of horizontal resolution, domain size and methodology on extreme storm identification and characterisation.
Table 4Summary of the mean difference (±1 standard deviation) between XWS or C3S and the input data sets within our database for the proportion of all storms per winter and the proportion of total normalised storm losses per winter. Differences are computed as the absolute value of the difference between XWS or C3S and the CLIMK–WINDS input data sets for each winter and averaged across all winters.
3.3 Relative extreme storm severity
3.3.1 Relative severity within and across winter seasons
The interannual variability in winter severity within each data set is shown in Fig. 5, where the proportion of total losses occurring during each winter is indicated. We again see a large interannual variability, yet no significant trends in the percentage of normalised losses over time in any of the data sets. The proportion of total losses per winter within an input data set generally increases with the proportion of storms per winter, as is also shown in Table 3. All four input data sets display a statistically significant Pearson's correlation coefficient (p<0.001) between 0.95 and 0.98 for the correlation between the percentage of all storms per winter and the percentage of total losses per winter. These statistics imply that, for winters with several extreme storm occurrences, it is uncommon for the bulk of the losses to be caused by a single exceptionally damaging storm. This is further supported by the OEP AEP ratio for each winter season and input data set, displayed in Fig. 6. The OEP AEP ratio indicates the degree to which a single storm event dominated that winter season's aggregated loss (Priestley et al., 2018). A ratio much smaller than 1.0 indicates that multiple storm events contributed to the total seasonal losses, while a large ratio, closer to 1.0, indicates that a single storm contributed most of the losses incurred during that season; a ratio exactly equal to 1.0 is achieved during winters containing only one storm. If we disregard the winters with a single storm, very few winters display a ratio greater than approximately 0.7 for each input source. This indicates that, for most winters that contained more than one extreme storm, the losses comprise large contributions from multiple storms. Single exceptionally severe storms can contribute to a large part of the losses but rarely account for their near totality.
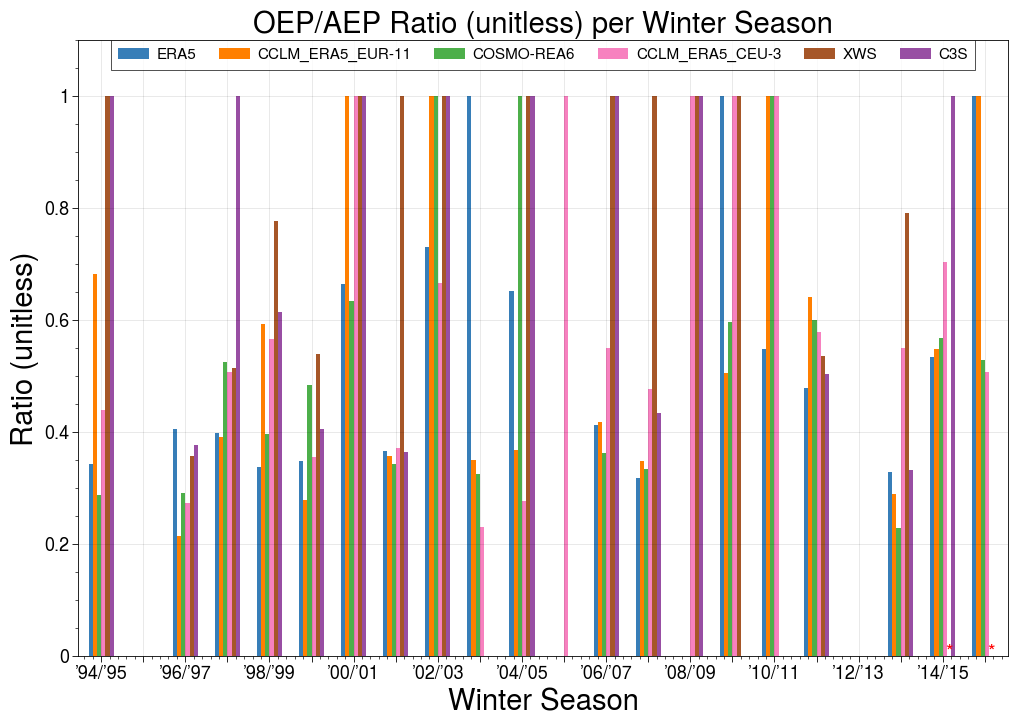
Figure 6OEP AEP ratio (y axis; unitless) per extended winter season (ONDJFM; x axis) for each input data set, XWS and C3S. The ratio varies between undefined (no bar plotted for that data) for winters with no storm activity to a maximum of 1.0 for winters containing only a single storm. The end-cap extended winter seasons 1994/1995 and 2015/2016 exclude storms that occurred in the years 1994 and 2016. Asterisks mark winters not covered by XWS.
We also note some variability in average storm severity, both across different winters within each data set and across data sets during the same winter. For example, during the 2006/2007 season, fewer storms caused a proportion of damages similar to the higher storm activity 1996/1997 and 2004/2005 winters in CCLM_ERA5_CEU-3. Similarly, ERA5 displays twice the number of storms of CCLM_ERA5_EUR-11 in the 2002/2003 winter season, yet the proportions of total losses in the two data sets are similar (cf. Figs. 4 and 5). This highlights both the variability in storm severity across winters for CCLM_ERA5_CEU-3 and how the average storm severity per winter differs between CCLM_ERA5_EUR-11 and ERA5. Thus, disagreements among input data sets for the severity of any given winter are apparent, as is the case for storm frequencies per winter. As the same methodology was employed to compute losses, these differences could be due, at least in part, to differences in horizontal resolution and spatial domain impacting storm identification and severity assessment.
Again, the level of agreement with our database for the proportions of total losses per winter is comparable for XWS and C3S. While C3S shows a generally higher agreement, the improvement over XWS is small compared with the standard deviation of the mean differences (Table 4). The storms within XWS for the 1997/1998 and 1998/1999 winters are probably weaker than the storms within the high activity category winters within our database, given the smaller proportions of total XWS losses (Table 3). However, the loss proportions for the XWS and C3S winters within the very high activity winter category are generally similar to those from our database, as are the remaining two high activity winters within XWS. XWS also exhibits winters of unremarkable storm activity, belonging to neither the high nor very high activity categories, but large damages. These winters thus displayed more severe storms, compared with our database (e.g. 2002/2003). Variations in storm severity between XWS and C3S and relative to our database probably reflect differences in storm identification methodology that impact the storm severity assessments.
3.3.2 Relative common storm severity
We next consider relative storm severity across input data sets for the common storms (Fig. 7), including XWS and C3S when these databases also identified one of the common storms. Storm Xynthia (27 February 2010) illustrates well the discrepancies between input data sets: it is amongst the least severe common storms as derived from ERA5, but is much more severe in all other input data sets, most notably in COSMO-REA6 (Fig. 7b). Storm Kyrill (19 January 2007) is instead an example of relatively good agreement among data sets, as it was the most severe storm in all four data sets input to CLIMK–WINDS, and C3S, in terms of normalised losses (Fig. 7a) and hence also first in ordinal rank (Table 2), and it was the second most severe storm within XWS.
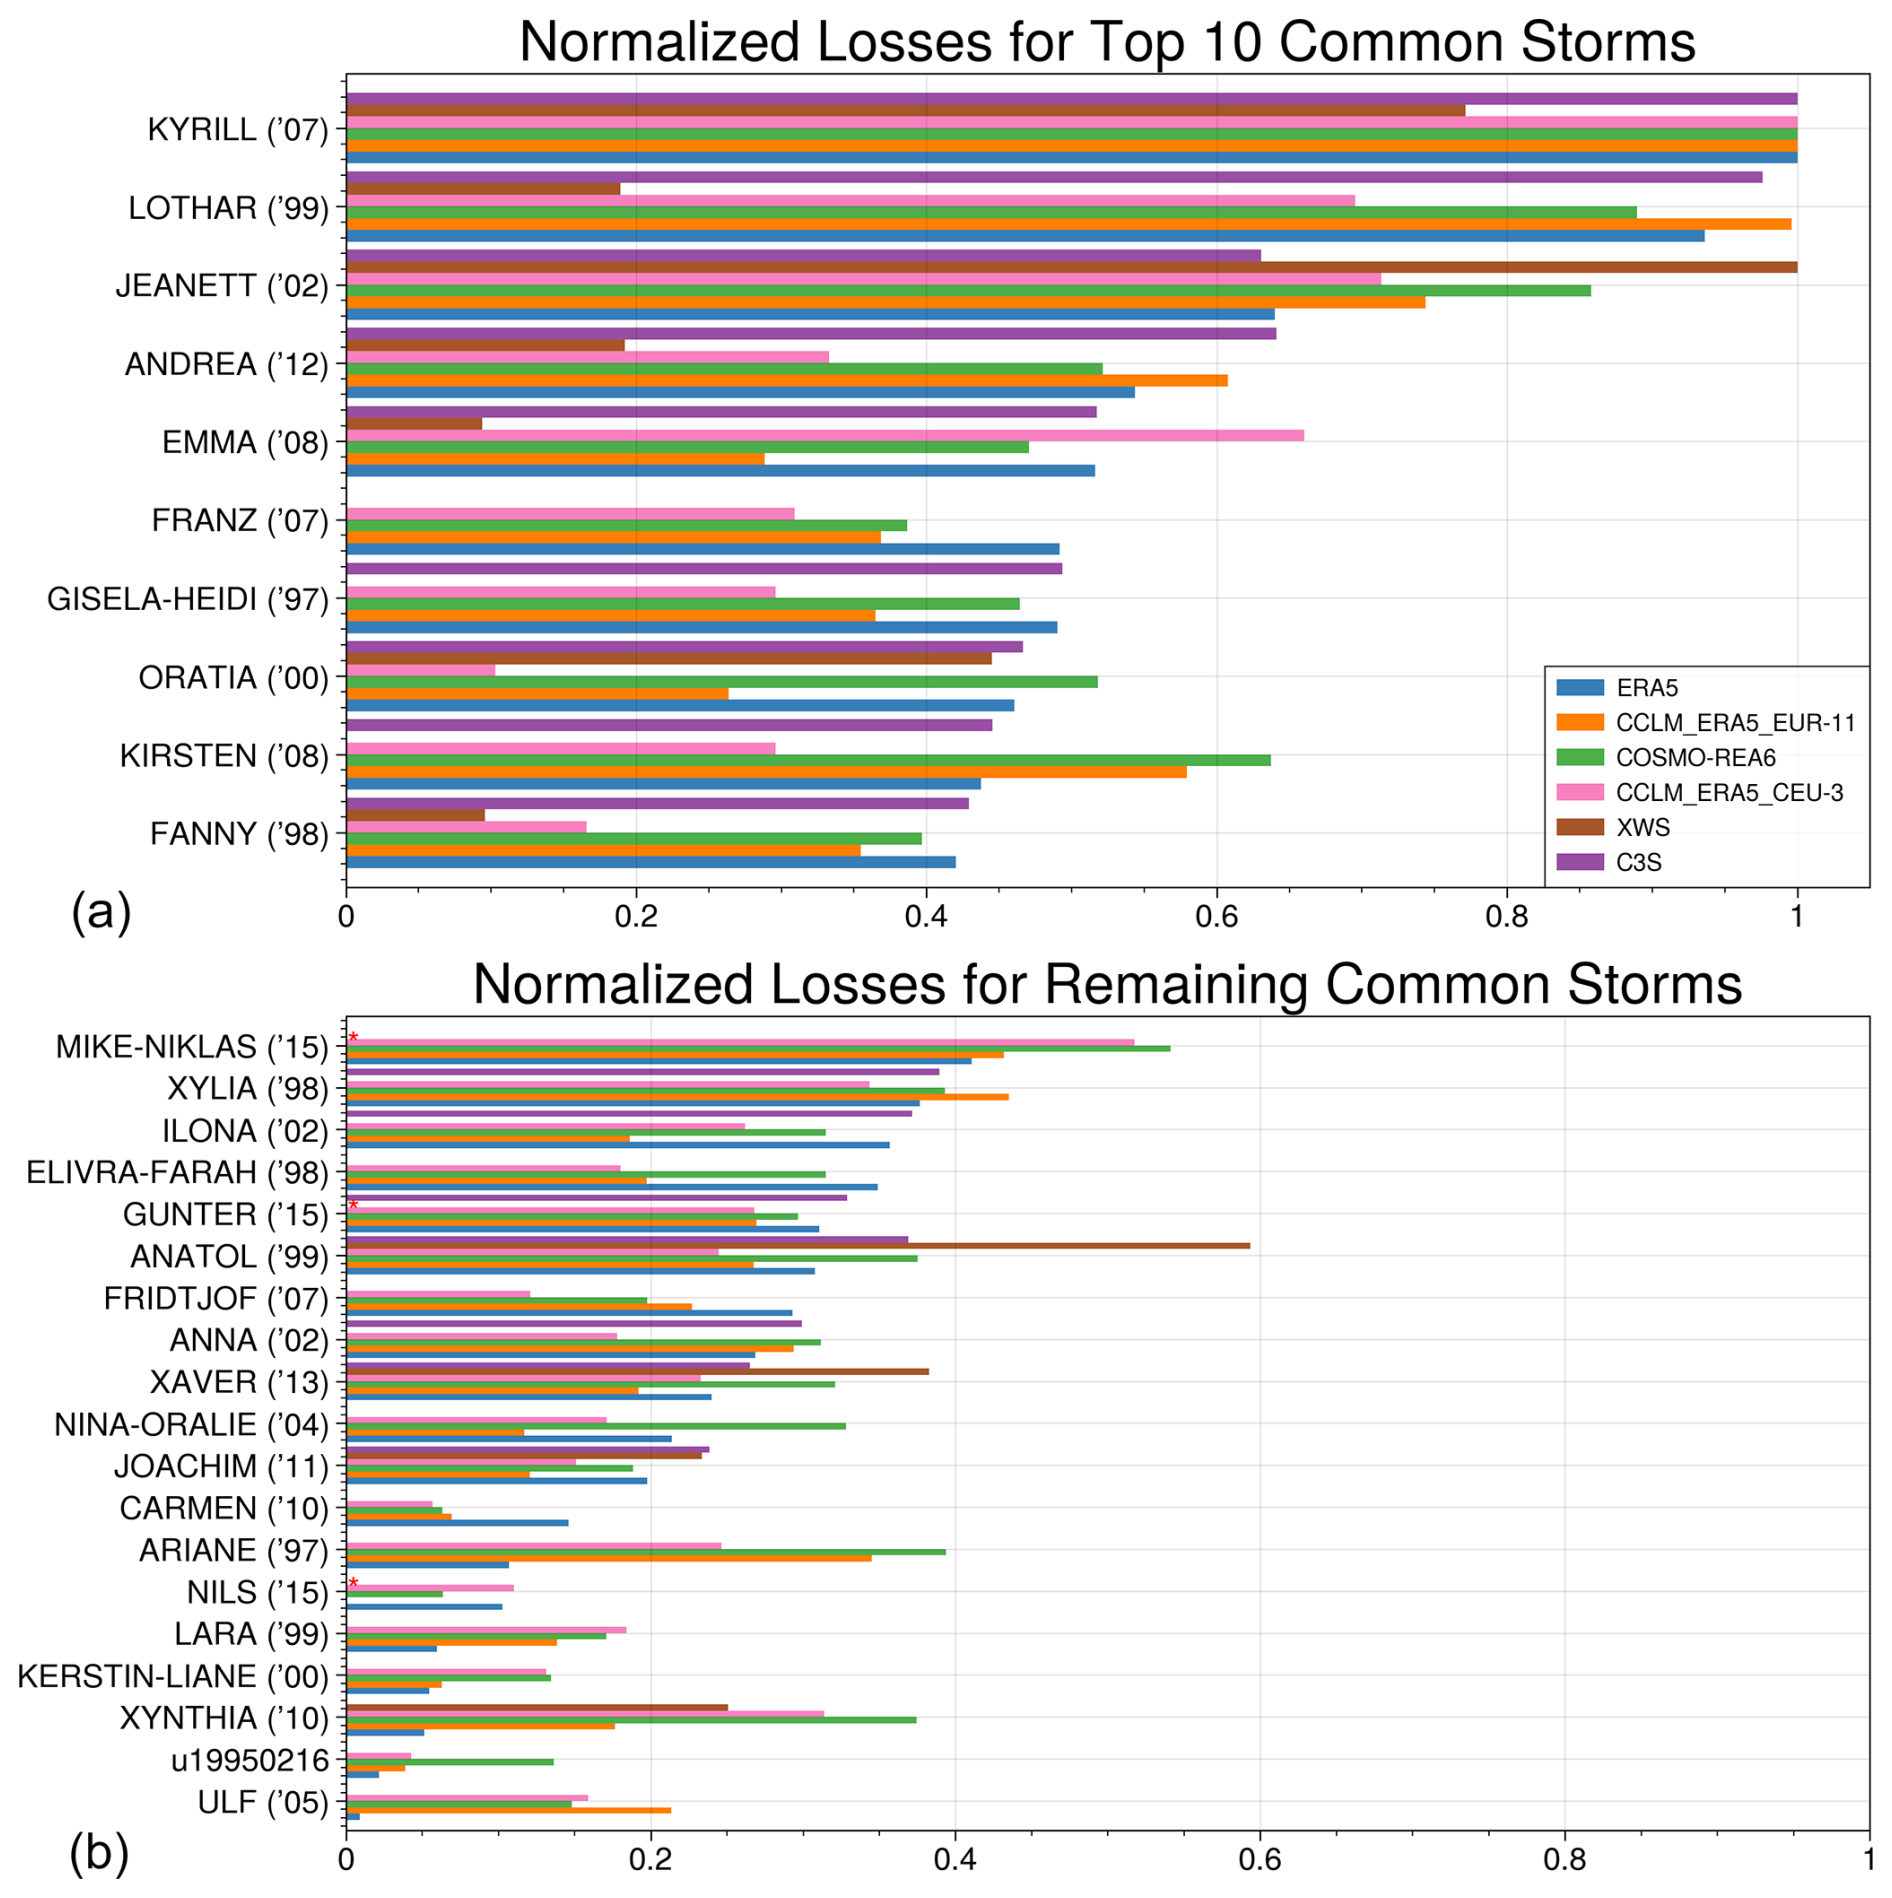
Figure 7Bar plots indicating the normalised loss (x axis; unitless) per common storm (y axis) for each of the input data sets and for XWS and C3S, when available. Storms are sorted into descending order by normalised loss according to the ERA5 data set and separated into (a) the top 10 common storms and (b) the remaining common storms. Asterisks mark storms that fall outside the XWS time period.
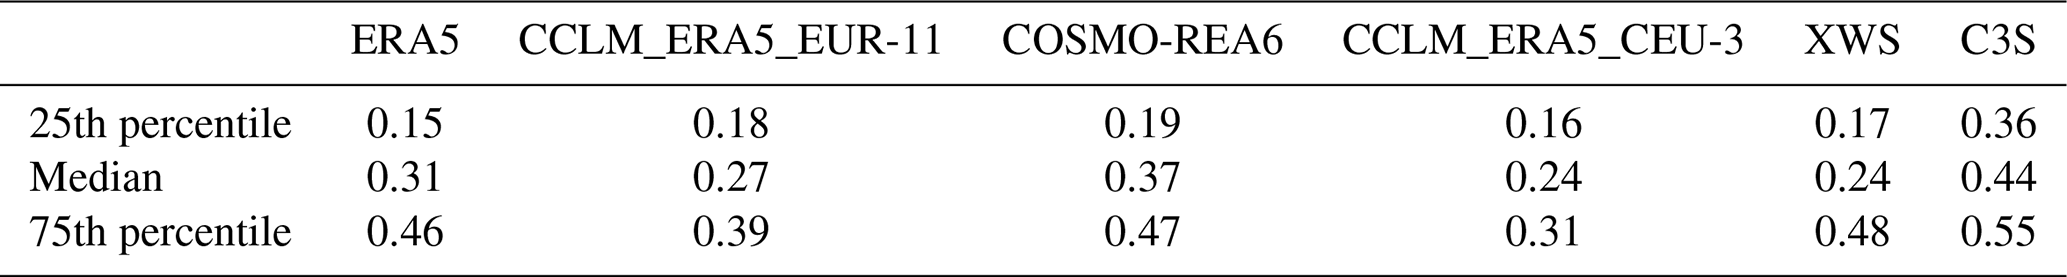
Some differences in storm severity with data set emerge in Fig. 7. Indeed, common storms tend to be stronger, as derived from ERA5 and COSMO-REA6, in comparison with CCLM_ERA5_EUR-11 and CCLM_ERA5_CEU-3, as indicated by the median and 75th percentile values of the common storm normalised losses for each input data set (Table 5). CCLM_ERA5_CEU-3, in turn, tends to exhibit the weakest storms, with smaller median, 25th percentile and 75th percentile values than most of the other three input sources. However, the interquartile ranges for all the input data sets in Table 5 overlap with each other. Table 5 also demonstrates that the median and 25th percentile relative rank values for XWS fall within the ranges exhibited by CLIMK–WINDS, while the 75th percentile is larger than for any of the four input data sets that we use. C3S exhibits the highest values for all percentiles. Its 25th percentile value is larger than all medians in Table 5, with the exception of COSMO-REA6, and is also higher than the 75th percentile of CCLM_ERA5_CEU-3. This points to systematically higher normalised losses, compared with our database and XWS.
Table 5Summary of 25th percentile values, median values and 75th percentile values of the normalised losses (relative ranks) over all the common storms for each input data set and over the common storms available from XWS and C3S. All quantities are unitless.
The substantial variation in storm severity with data set exhibited by the common storms, both within CLIMK–WINDS and when comparing CLIMK–WINDS with XWS and C3S, points to the impact of horizontal resolution and footprint identification methodology on estimated severity. Additional causes, however, are probably also at play, such as the influence of the design of the input data sets themselves on their representations of extreme wind speeds. Because our database includes four different input data sets, this affords a unique perspective to investigate the causes of these variations and their influence on extreme storm characterisation and related empirically derived losses.
3.4 Extreme storm footprints
3.4.1 Spatial variability of extreme storm footprints
We conduct a spatial comparison of the 29 common storm footprints, using CCLM_ERA5_CEU-3 as reference. This is because it is the input data set with the highest native resolution and smallest native domain; CCLM_ERA5_CEU-3 is not assumed to be the most accurate or realistic data set. The ERA5, CCLM_ERA5_EUR-11 and COSMO-REA6 footprints were regridded using bilinear interpolation to the CCLM_ERA5_CEU-3 horizontal resolution and restricted to the enlarged Germany domain. The mean of the footprint differences over all common storms was then taken for each input data set and is presented in Fig. 8. The differences between the CCLM_ERA5_CEU-3 input data set and the other data sets were first computed for each common storm and then averaged within each data set across all common storms. The means presented in Fig. 8 carry the risk of the cancellation of errors, which is particularly important for the interpretation of mean differences of or near zero. We therefore also show the mean absolute error in Fig. S3. This analysis is not intended to evaluate which input source is the most accurate but rather seeks to characterise the main spatial differences in storm footprint arising among the input data sets used in our database.
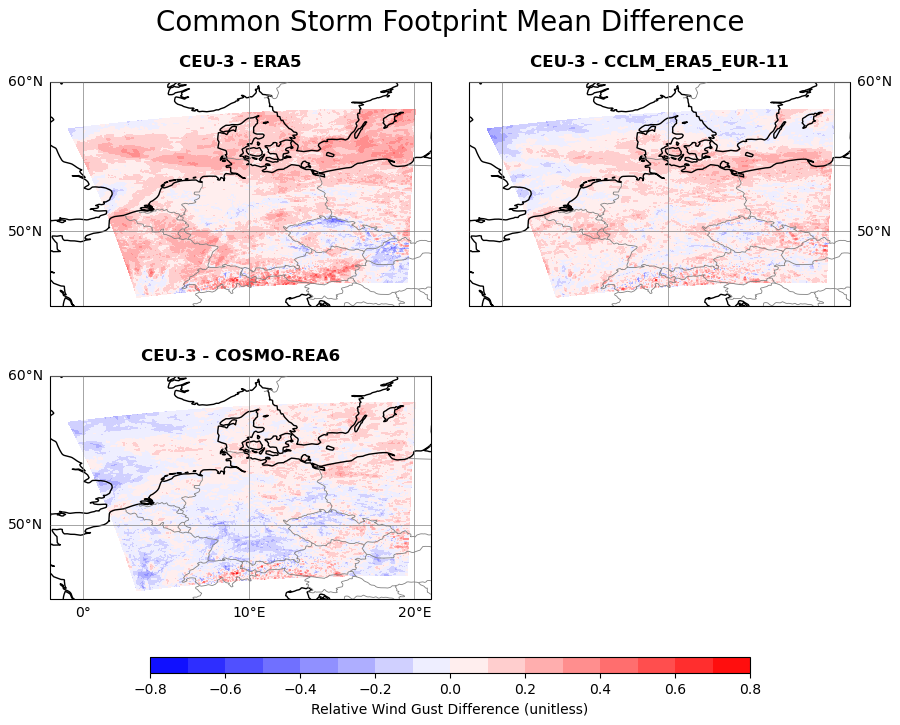
Figure 8Mean storm footprint difference computed over the common storms only, comparing CCLM_ERA5_CEU-3 with the ERA5, CCLM_ERA5_EUR-11 and COSMO-REA6 data sets (shown in clockwise order across the panels). The colours represent the mean difference in the relative wind (unitless). All panels are plotted at the CCLM_ERA5_CEU-3 horizontal resolution and on the enlarged Germany domain.
The footprint comparison between ERA5 and CCLM_ERA5_CEU-3 displays primarily positive mean differences with few exceptions, indicating that, on average, the footprint as derived from CCLM_ERA5_CEU-3 is larger in magnitude than that derived from ERA5 (Fig. 8). The footprint comparisons between CCLM_ERA5_EUR-11 or COSMO-REA6 and CCLM_ERA5_CEU-3 are more variable in terms of positive or negative mean differences across the domain. However, the mean footprint differences between CCLM_ERA5_CEU-3 and COSMO-REA6 tend to exhibit more locations with negative or smaller-magnitude positive differences than do the differences with respect to CCLM_ERA5_EUR-11. The footprint comparison between ERA5 and CCLM_ERA5_CEU-3 also stands out in terms of the larger magnitude of the differences, regardless of sign. Many locations within the domain display a footprint difference magnitude above 0.2, while the locations exhibiting negative differences within Czechia and Slovakia reach magnitudes below −0.2. This may be partially due to ERA5 having the coarsest original native horizontal resolution of our input data sets. In comparison, the differences for CCLM_ERA5_EUR-11 and COSMO-REA6 tend to display magnitudes between −0.2 and 0.2 over most of the enlarged Germany domain. The larger differences between CCLM_ERA5_CEU-3 and ERA5 become less evident when considering mean absolute error (Fig. S3), suggesting that CCLM_ERA5_EUR-11 and COSMO-REA6 may display more cancellation of errors. It is also notable that CCLM_ERA5_CEU-3 and COSMO-REA6, despite being derived from a common numerical model, still show considerable differences in their footprints.
These comparisons thus reveal substantial disagreements among the input data sets in the spatial structures of the common storm footprints, though only the comparison between CCLM_ERA5_CEU-3 and ERA5 presents a domain-scale systematic difference.
3.4.2 Spatial variability of associated absolute wind gusts
We conduct the same comparison performed for the storm footprints for the absolute wind gusts. In this case, we also include XWS and C3S. The mean differences in the absolute wind gusts associated with the common storm footprints also reveal substantial disagreements among the input data sets and between CLIMK–WINDS and XWS and C3S (Fig. 9). The mean absolute wind gust differences relative to CCLM_ERA5_CEU-3 for each input data set generally resemble the footprint differences (e.g. a positive larger-magnitude difference in absolute wind gust in a region exhibiting a positive larger-magnitude difference in the footprint). This is most notable over the northern portion of the domain (North and Baltic Seas, Denmark and southern Sweden). However, locations with differences of opposite sign between the absolute wind gusts and the footprint are also apparent, as are locations where the relative magnitudes of differences differ. For example, the mean footprint differences between CCLM_ERA5_CEU-3 and ERA5 over northwestern Germany and the Netherlands are generally small and positive (between 0.0 and 0.1; Fig. 8), yet the mean absolute wind gust differences are substantially negative over much of the region (approximately −3 m s−1 or more; Fig. 9). In terms of absolute wind gusts, ERA5 no longer stands out as displaying systematically larger-magnitude differences, compared with the other two data sets (see also Fig. S4). The differences identified between all data sets in terms of wind gusts could arise, for example, from different boundary conditions, different wind gust computations or parameterisations, or configuration options unique to a data set. Increasing horizontal resolution can also allow for greater spatial heterogeneity within a data set's wind gust field and thus greater heterogeneity within the threshold exceedances used to compute the footprints. The fact that some of the largest differences are found in the Alpine region also points to a role of spatial resolution, notably for the comparison between CCLM_ERA5_CEU-3 and COSMO-REA6, which issue from a common numerical model.
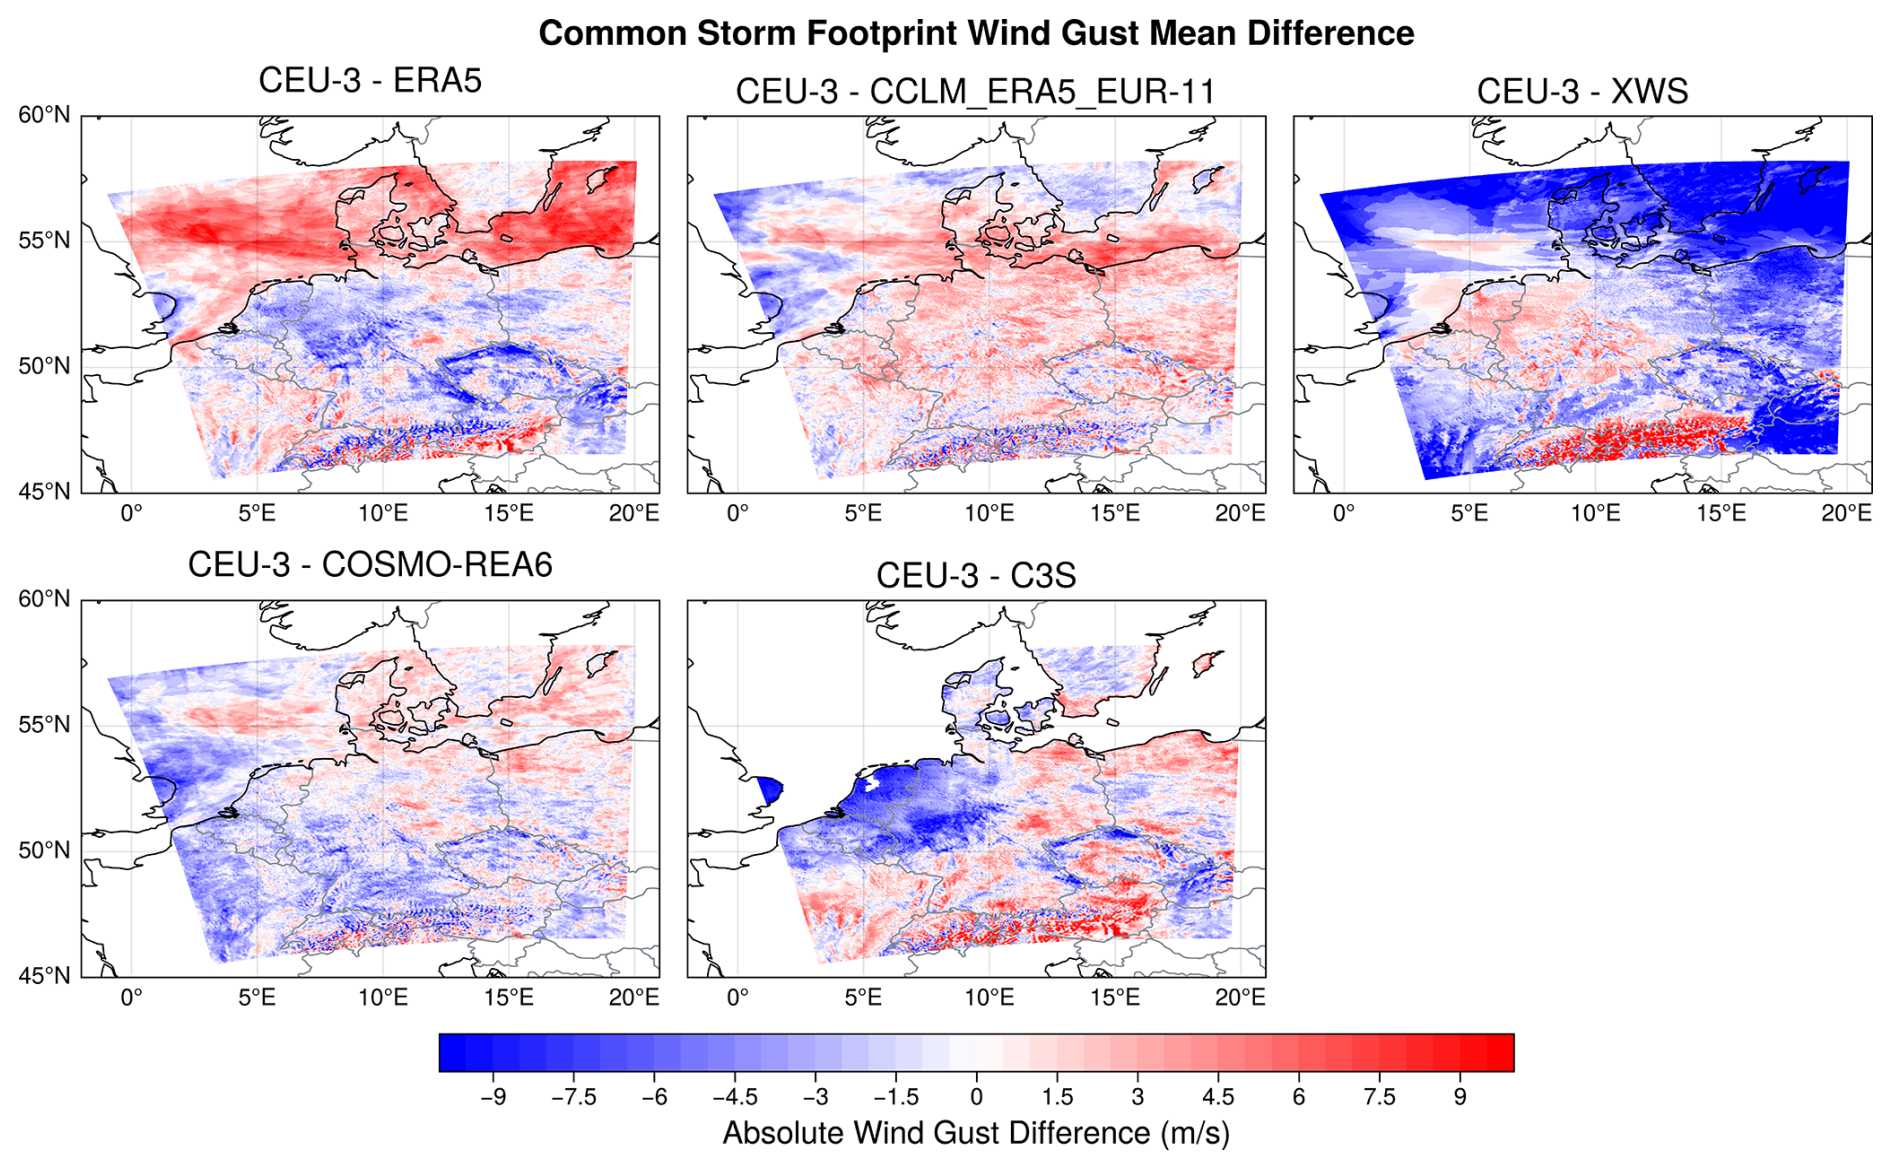
Figure 9Mean difference in daily maximum wind gusts associated with the footprints computed over the common storms only, comparing CCLM_ERA5_CEU-3 with the ERA5, CCLM_ERA5_EUR-11, XWS, C3S and COSMO-REA6 data sets (shown in clockwise order across the panels). The colours represent the mean difference in the absolute wind gusts (m s−1). All panels are plotted at the CCLM_ERA5_CEU-3 horizontal resolution and on the enlarged Germany domain.
Notable differences also emerge in the comparison with XWS and C3S, in this case with the added effect that the latter two databases also present methodological differences from CLIMK–WINDS (Fig. 9). The results are also not fully comparable with the ones discussed previously since not all common storms were captured by XWS and C3S. The differences between CCLM_ERA5_CEU-3 and XWS and C3S do not resemble each other, nor do they resemble the comparisons within our own database. For example, C3S displays primarily positive differences over the eastern and southern parts of the domain and negative differences over the northwestern parts. The latter instead display primarily positive differences for XWS. Similarly, XWS displays substantial negative differences over Denmark, southern Sweden, Poland and the Baltic Sea that are in stark contrast to ERA5 and, to some extent, also to the other data sets. The comparison with XWS indeed exhibits the broadest area of negative difference of any of the data sets, indicating that the absolute wind gusts from XWS tend to be stronger than those from CCLM_ERA5_CEU-3. This major difference also emerges clearly in the mean absolute errors (Fig. S4).
3.4.3 Windstorms Kyrill and Andrea as comparative examples
The previous comparisons provide a mean picture, but individual storm footprints and absolute wind gusts display additional features not apparent in the mean comparisons. We consider storms Kyrill (18 January 2007) and Andrea (5 January 2012) as cases in point. Kyrill is the most severe storm within our database and C3S, and the second most severe within XWS. Andrea also falls within the top 10 most severe storms for all data sets except XWS (Table 2), but its relative storm severity is much more variable than that of Kyrill among input sources (Fig. 7). The footprint and absolute wind gust comparisons for Kyrill (Figs. 10 and 11) and Andrea (Figs. 12 and 13) depart substantially from the mean comparisons.
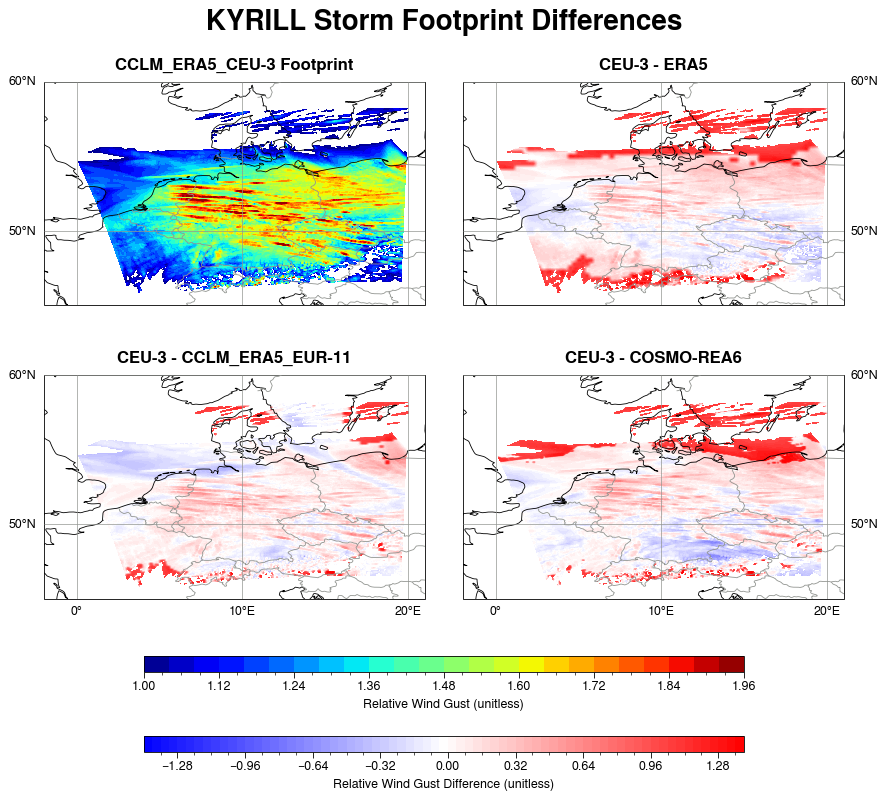
Figure 10Storm footprint for Windstorm Kyrill (January 2007), derived from the CCLM_ERA5_CEU-3 data set and shown in Fig. 2, displayed in the top left panel. The three remaining panels display the difference between the CCLM_ERA5_CEU-3 footprint and the footprints derived from ERA5, COSMO-REA6 and CCLM_ERA5_EUR-11 after regridding to the CCLM_ERA5_CEU-3 resolution, in clockwise order. All panels are plotted at the CCLM_ERA5_CEU-3 horizontal resolution. Kyrill is the strongest storm in our database.
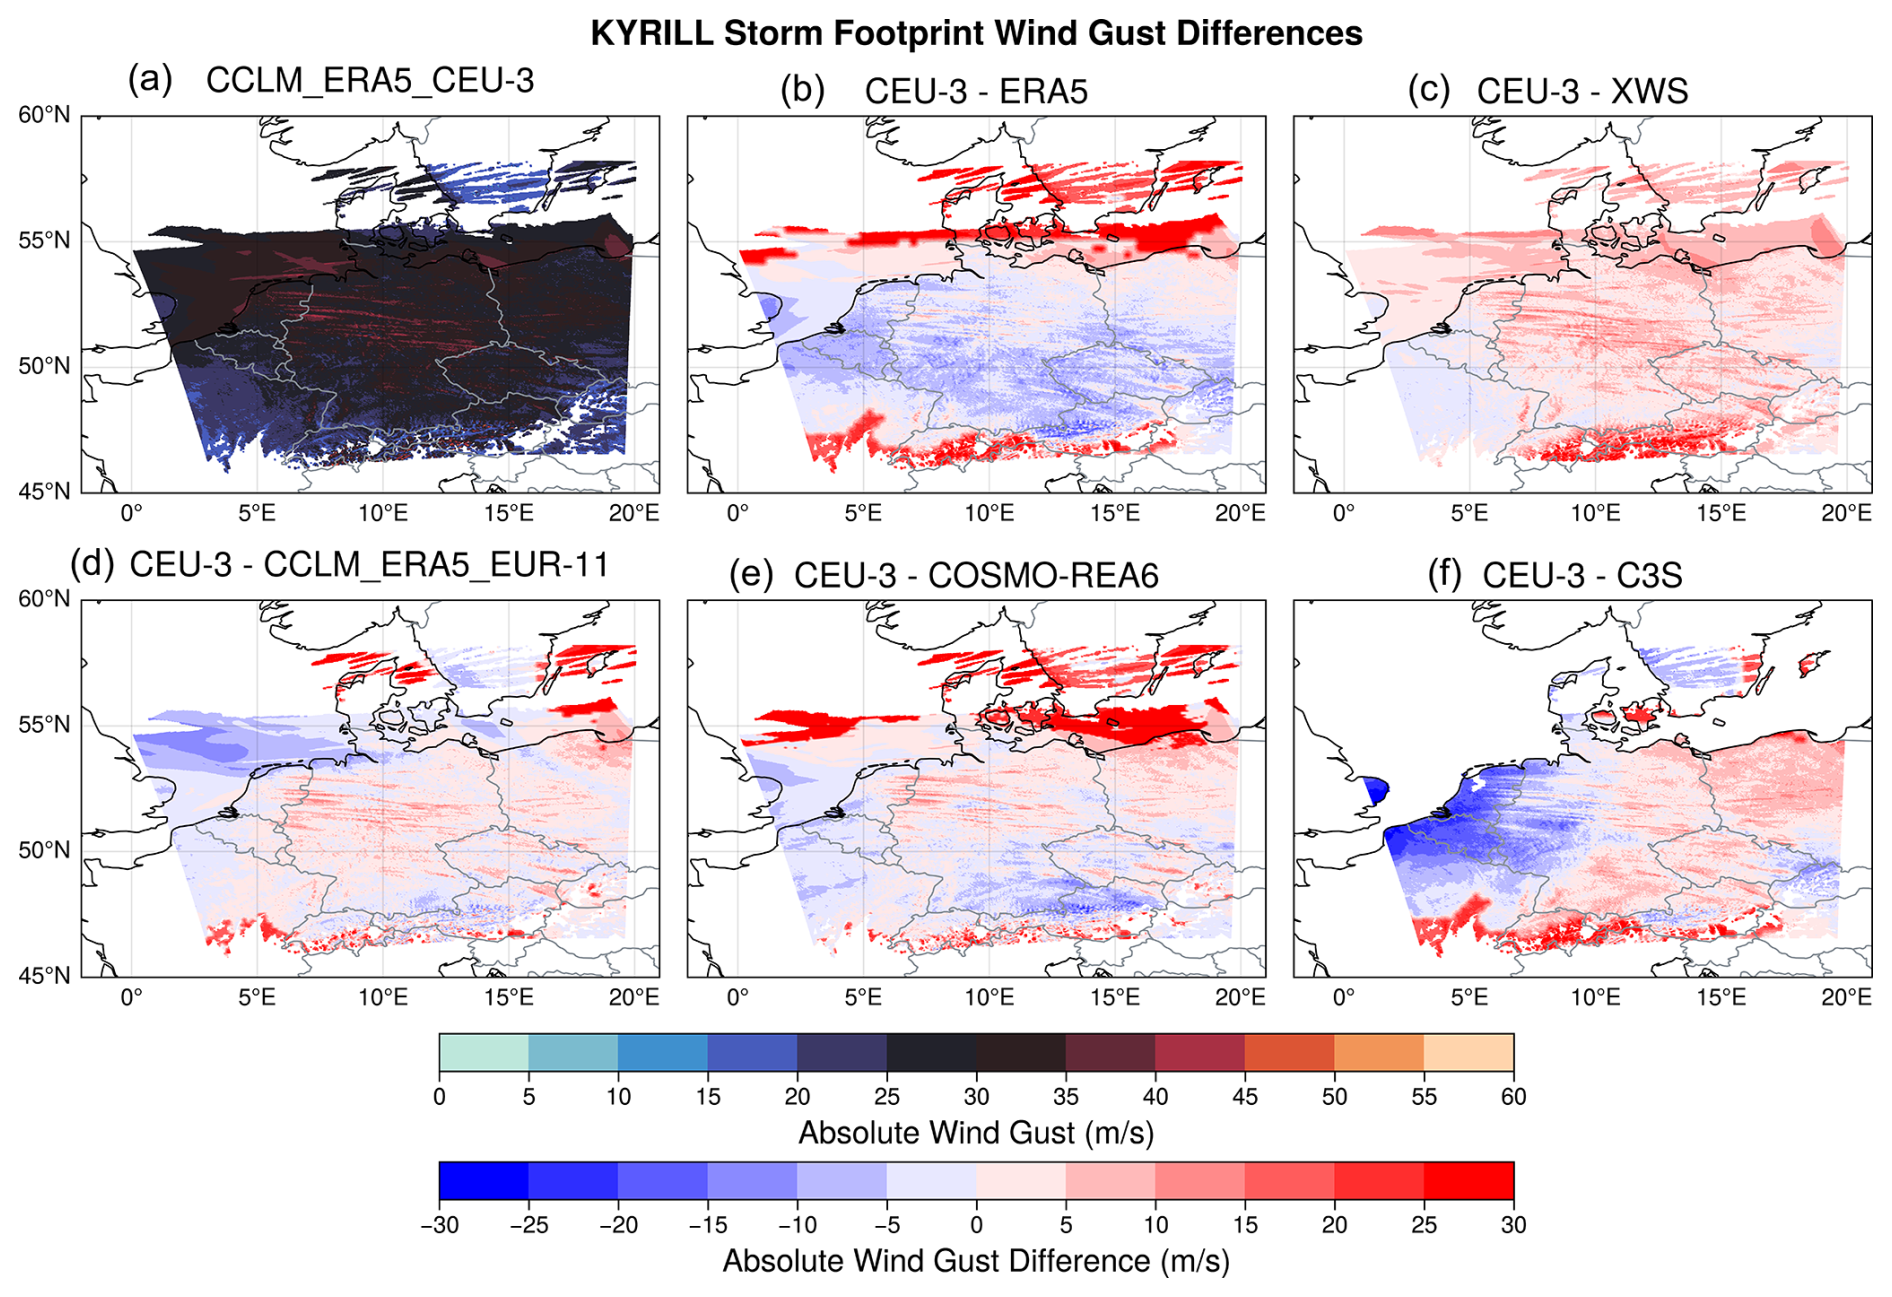
Figure 11Daily maximum wind gusts (m s−1) for Windstorm Kyrill (January 2007) associated with its footprint, as derived from CCLM_ERA5_CEU-3 and shown in Fig. 3, displayed here in the top left panel. The five remaining panels display the difference (in m s−1) between the CCLM_ERA5_CEU-3 absolute wind gusts and the wind gusts derived from ERA5, XWS, C3S, COSMO-REA6 and CCLM_ERA5_EUR-11 after regridding to the CCLM_ERA5_CEU-3 resolution, in clockwise order. All panels are plotted at the CCLM_ERA5_CEU-3 horizontal resolution. Kyrill is the strongest storm in our database.
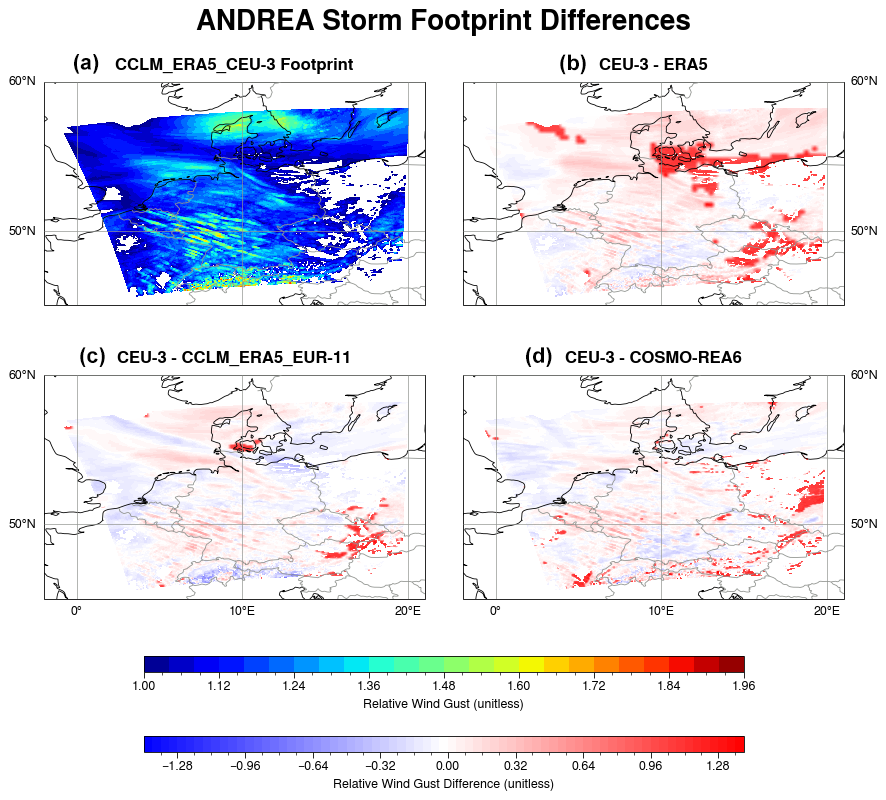
Figure 12Storm footprint for Windstorm Andrea (January 2012), derived from the CCLM_ERA5_CEU-3 data set, displayed in the top left panel. The three remaining panels display the difference between the CCLM_ERA5_CEU-3 footprint and the footprints derived from ERA5, COSMO-REA6 and CCLM_ERA5_EUR-11 after regridding to the CCLM_ERA5_CEU-3 resolution, in clockwise order. All panels are plotted at the CCLM_ERA5_CEU-3 horizontal resolution. Andrea is one of the stronger storms in our database.
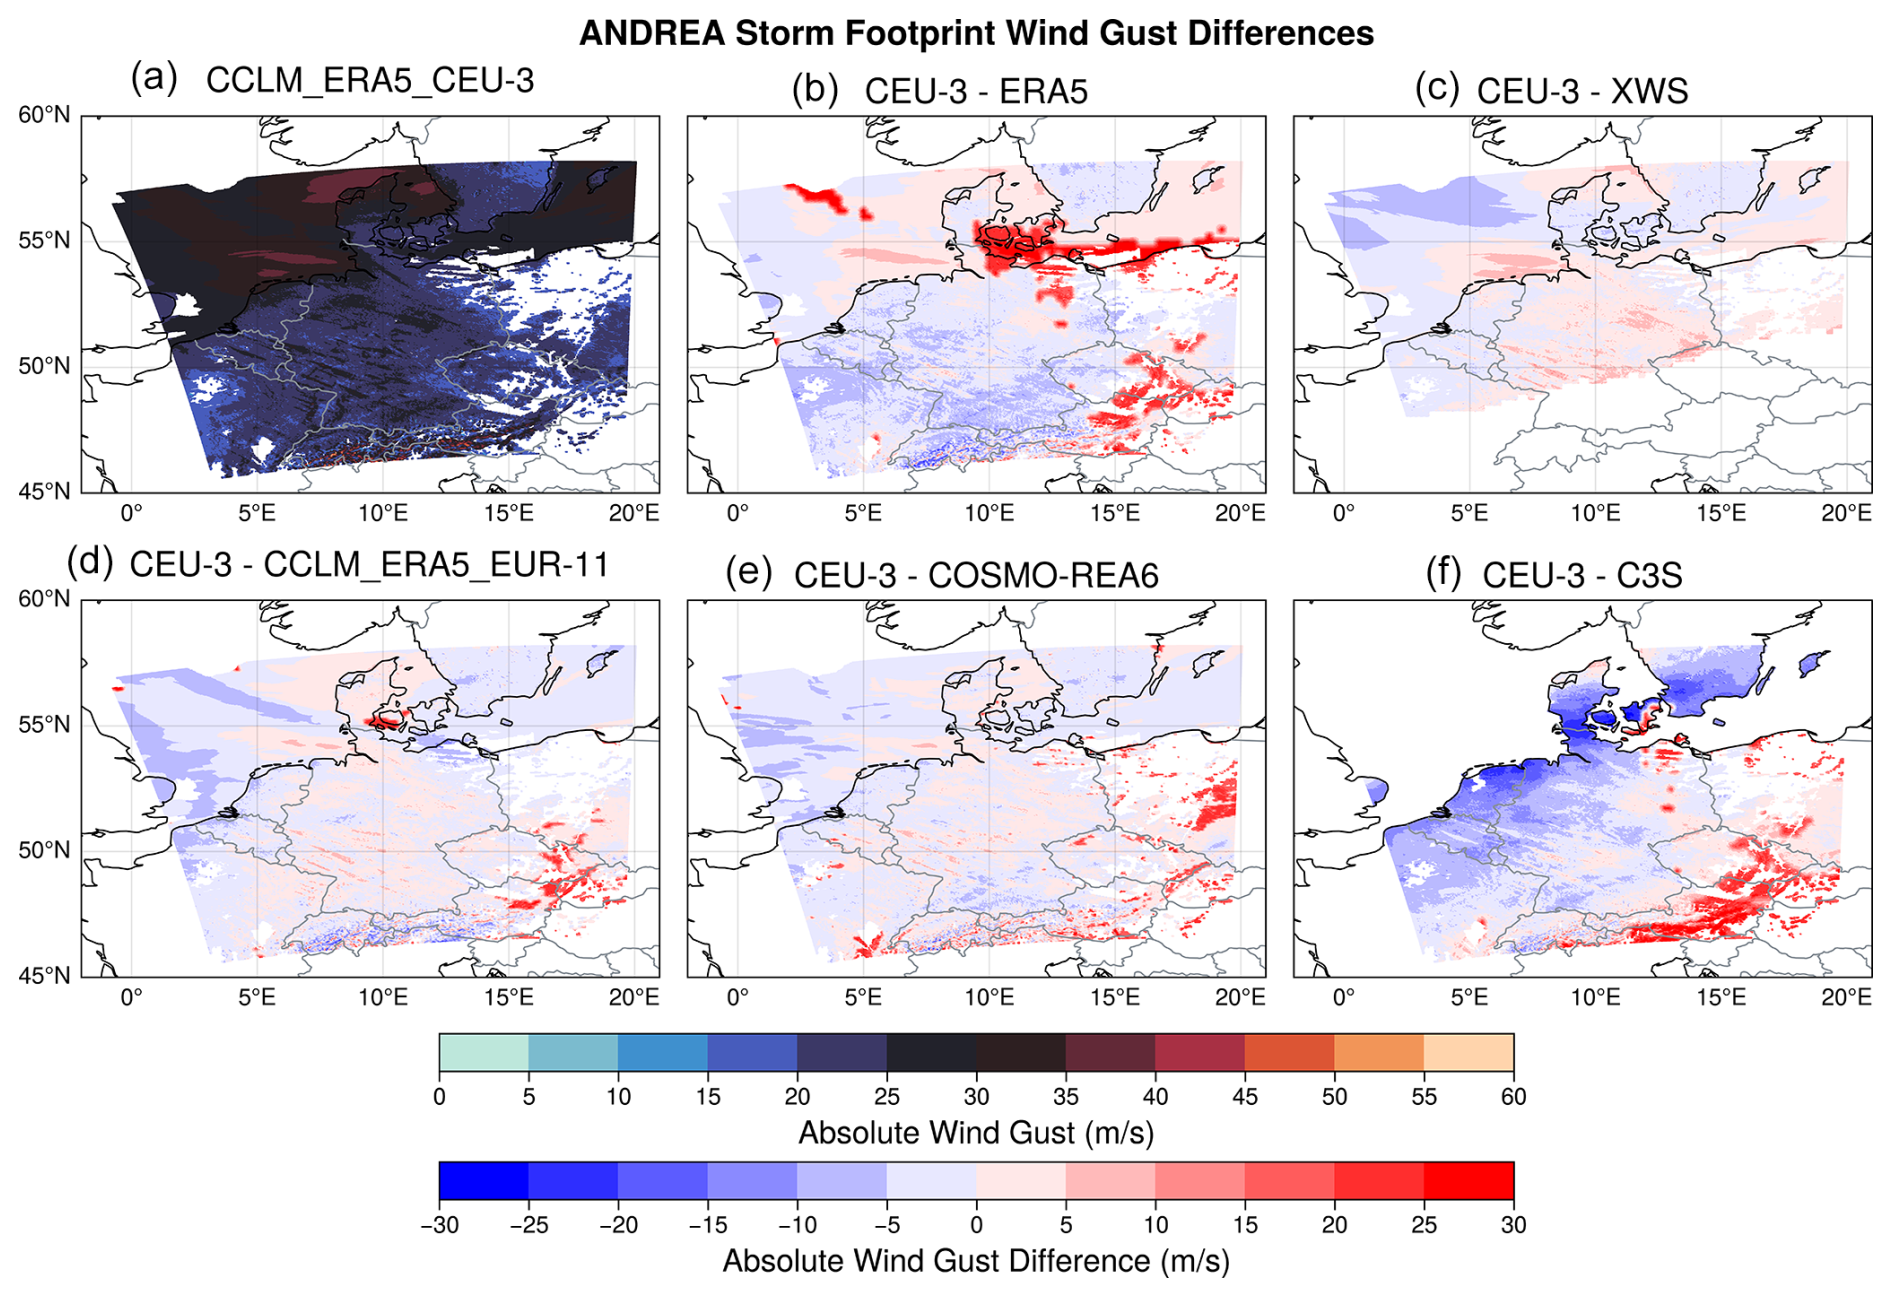
Figure 13Daily maximum wind gusts (m s−1) for Windstorm Andrea (January 2012) associated with its footprint, as derived from CCLM_ERA5_CEU-3, displayed here in the top left panel. The five remaining panels display the difference (in m s−1) between the CCLM_ERA5_CEU-3 absolute wind gusts and the wind gusts derived from ERA5, XWS, C3S, COSMO-REA6 and CCLM_ERA5_EUR-11 after regridding to the CCLM_ERA5_CEU-3 resolution, in clockwise order. All panels are plotted at the CCLM_ERA5_CEU-3 horizontal resolution. Andrea is one of the stronger storms in our database.
The Kyrill and Andrea CCLM_ERA5_CEU-3 footprints display a signature of convective activity over continental Europe, albeit stronger in Kyrill, that is weaker or missing in the other data sets. This appears as the “straight line” maximum relative wind gusts apparent in Figs. 10 and 12. The “straight line” maxima are also visible, although not as clearly, in the CCLM_ERA5_CEU-3 wind gusts (Figs. 11 and 13) The higher resolution and convection-permitting configuration of CCLM_ERA5_CEU-3 probably contribute to a better representation of the downdrafts and wind gusts arising from convective activity associated with winter windstorms (Ludwig et al., 2015). Several storms in our database exhibit this signature in CCLM_ERA5_CEU-3 and occasionally other input data sets. ERA5 typically misses it entirely, with CCLM_ERA5_EUR-11 and COSMO-REA6 performing better, though not as well as CCLM_ERA5_CEU-3. Spatial variability arising from convective activity is entirely missing in the mean footprint comparison.
The mean comparisons also conceal the differences in footprint spatial extent or boundary among data sets for the same storm, as appears in the Kyrill and Andrea comparisons. Disagreements in extent typically occur in the eastern and southern portions of the domain, as highlighted by the bright red regions for Kyrill and Andrea, indicating that CCLM_ERA5_CEU-3 located the footprint there but the other data set did not (Figs. 10, 11, 12 and 13). In addition to footprint boundary disagreements, gaps within footprints containing locations that were not impacted by the surrounding storm exist for some data sets but not others. Such a gap is apparent in the comparison between CCLM_ERA5_CEU-3 and ERA5 for Andrea over the Danish islands, southern Baltic Sea and northeastern Germany (Figs. 12 and 13). The causes for such disagreements are again likely to be related to horizontal resolution and data set configuration differences. Care should thus be taken when choosing footprint sources for local or regional loss estimation.
Individual storms therefore present additional differences in their footprints and wind gusts across data sets that are not visible in a bulk comparison across multiple storms. The ordinal and relative ranks for Kyrill and Andrea serve to highlight that these differences emerge independently of storm severity and of agreement on relative storm severity among input data sets.
CLIMK–WINDS is publicly available online through Zenodo at https://doi.org/10.5281/zenodo.10594398 (Flynn et al., 2024). The ERA5 reanalysis data (Hersbach et al., 2020) and the C3S winter windstorm indicators for Europe (the C3S windstorm database, C3S Climate Data Store, 2022), used as an input source for our database and as a comparison with our database, respectively, are publicly available online through the Copernicus Climate Change Service (https://doi.org/10.24381/cds.adbb2d47, Hersbach et al., 2023, and https://doi.org/10.24381/cds.9b4ea013, C3S Climate Data Store, 2022). The CCLM_ERA5_CEU-3 simulation output (Brienen et al., 2022), used as an input source for our database, is publicly available online from the DWD Earth System Federation Grid nodes (https://doi.org/10.5676/DWD/HOKLISIM_V2022.01). The COSMO-REA6 data set (Bollmeyer et al., 2015), used as an input source for our database, is publicly available from DWD (https://opendata.dwd.de/climate_environment/REA/). The XWS database (Roberts et al., 2014), used as a comparison with our database, is publicly available online (https://www.europeanwindstorms.org/repository/).
We have presented and characterised CLIMK–WINDS, a new database of extreme European winter windstorms over the 1995–2015 extended winter seasons, based on a consistent footprint identification and severity assessment methodology. The latter was based on an empirical storm loss model. We used four different meteorological input data sets, namely, the ERA5 and COSMO-REA6 reanalyses and the CCLM_ERA5_EUR-11 and CCLM_ERA5_CEU-3 regional climate model outputs. We applied the same footprint selection methodology to each input data set at its native horizontal resolution and spatial domain, thereby creating a consistent, systematic, database of the most severe storms identified across diverse input data sets. This allows for a direct comparison of the effects of using different wind gust input data sets on the storm footprints, their severity and their spatial characteristics. Equally importantly, the temporal range of the data sets can be extended when new data become available and it is equally possible for users to include additional input data sets to which they may have access. Our database therefore provides complementary perspectives on extreme storm identification and severity assessment, given the diverse input sources used, and complements existing extreme European winter windstorm databases.
Our results highlight the major effects that horizontal resolution, choice of footprint identification methodology and differing types of input data set can have on extreme storm identification and characterisation. The effect of horizontal resolution is most evident in the comparison of the CCLM_ERA5_CEU-3 and CCLM_ERA5_EUR-11 data, which originate from a common numerical model. The result of different methodological choices emerges from the comparison of the footprints within CLIMK–WINDS with those from the XWS and C3S data. Finally, the data sets that we used to build our database include a global reanalysis, a regional reanalysis and regional climate models, elucidating the effect of differing types of input data set. We found variability across input data sets in all aspects of our database, including which storms were identified as belonging to the top 50 storms and the spatial structure of the footprints of storms identified in more than one input data set. We found similar differences between our database and the XWS and C3S databases.
The CLIMK–WINDS database identified a total of 76 unique storms ranking amongst the top 50 in at least one of our input data sets. There were 29 common storms identified in all four input data sets. The most severe storms, such as Kyrill, Lothar and Jeanett, tended to be identified in all four input data sets, though the common storms also include many comparatively weaker storms. Another 47 storms were identified as extreme storms in at least one of the input sources but not all four. Of these storms, 18 were identified in only one of the four data sets. Unexpectedly, CCLM_ERA5_CEU-3 displayed more such storms than COSMO-REA6, despite its much smaller domain. This may be partly due to its higher resolution, leading it to identify as extreme some storms that do not display particularly strong wind gusts in the other data sets. For both the common storms and the storms identified in only two or three data sets, the severity of a given storm, as denoted by a storm's ordinal rank and normalised loss, often varied across the input data sets. The variation in relative storm severity was substantial across input data sets for many storms. Moreover, the storms identified by C3S tended to be relatively more severe than those identified in the other data sets. The input data sets, XWS and C3S also disagreed on the winters with low and high storm activity and, while a large, statistically significant, positive correlation exists between the proportion of all storms per winter and the proportion of total losses per winter for each input data set, they disagree on how relatively damaging each winter was. Equally importantly, the CLIMK–WINDS footprints and associated absolute wind gusts themselves exhibited substantial variability across input data sets and with XWS and C3S, both in the mean comparisons and for individual storms. Comparisons of the footprint and absolute wind gust spatial variability for individual storms revealed smaller-scale features not present in the mean comparisons, such as the signatures of convective activity. Disagreements are also seen for some storms in the dates of occurrence, although these are typically of 1 d. Moreover, the majority of storms within our database display the same dates of occurrence in all input data sets and in XWS and C3S.
We underscore that our goal in creating the CLIMK–WINDS database was neither to provide a record of accurate and inaccurate footprints nor to assess which input data set or horizontal resolution performed best at identification and characterisation of extreme European winter storms. Rather, we seek to provide a diverse yet consistent record of storm footprints that allows one to understand the uncertainties related to choice of input data set for these storms. A diversity of perspectives has been lacking for footprint data and thus, by considering multiple input data sets processed using a consistent methodology, our database supports uncertainty quantification for a deeper understanding of extreme storms and their impacts. Indeed, uncertainty quantification for footprint data is a little-investigated topic and our database could allow for the assignment of an uncertainty range in the footprints, or the design and assessment of another uncertainty metric that meets the needs of specific end users. This could, in the future, be combined with an analysis of the uncertainties associated with storm loss models (Moemken et al., 2024a), leading to improved models of storm damage and improved understanding of how these may change with a changing climate. Storm footprints derived from multiple data sources at different resolutions could also present an advantage for many areas of research that currently give little weight to historical data uncertainty, such as storm clustering studies (Dacre and Pinto, 2020).
The footprints that are most useful to a particular user of the CLIMK–WINDS database could depend on that user's specific goals. For example, interest in a storm affecting a mountainous region might call for footprints at higher horizontal resolution and neglect of those at coarser resolution. We nonetheless exhort users to consider the storms as identified from two or more input sources within our database. This enables the provision of information on the uncertainties associated with the storms and their impacts. Indeed, our CLIMK–WINDS data set and analysis highlight the value of considering multiple data sources when characterising extreme storms and their impacts.
The supplement related to this article is available online at https://doi.org/10.5194/essd-17-4431-2025-supplement.
GM and JGP conceived the database. CMF conducted the data collection and analysis and wrote the initial paper draft. JM provided guidance to CMF on computing the storm footprints and loss indices and how to rank the storms. MKS and CMF created and revised the figures and tables. GM revised the text. All authors discussed the results and contributed to drafting the manuscript.
The authors declare that they have no conflicts of interest.
Publisher's note: Copernicus Publications remains neutral with regard to jurisdictional claims made in the text, published maps, institutional affiliations, or any other geographical representation in this paper. While Copernicus Publications makes every effort to include appropriate place names, the final responsibility lies with the authors.
Joaquim Ginete Pinto thanks the AXA Research Fund for support. All authors thank the handling editor, Hugo Rakotoarimanga, and the anonymous reviewer for their constructive input on the study.
This research has been supported by the H2020 European Research Council (grant no. 948309), the Horizon Europe European Research Council (grant no. 101112727), the Swedish Research Council Vetenskapsrådet (grant no. 2022-06599), and the Bundesministerium für Bildung und Forschung (grant no. 01LR2002B1).
The publication of this article was funded by the Swedish Research Council, Forte, Formas and Vinnova.
This paper was edited by Graciela Raga and reviewed by Hugo Rakotoarimanga and one anonymous referee.
Baldauf, M., Seifert, A., Förstner, J., Majewski, D., Raschendorfer, M., and Reinhardt, T.: Operational Convective-Scale Numerical Weather Prediction with the COSMO Model: Description and Sensitivities, Mon. Weather Rev., 139, 3887–3905, https://doi.org/10.1175/MWR-D-10-05013.1, 2011. a, b
Bollmeyer, C., Keller, J. D., Ohlwein, C., Wahl, S., Crewell, S., Friederichs, P., Hense, A., Keune, J., Kneifel, S., Pscheidt, I., Redl, S., and Steinke, S.: Towards a high-resolution regional reanalysis for the European CORDEX domain, Q. J. Roy. Meteor. Soc., 141, 1–15, https://doi.org/10.1002/qj.2486, 2015 (data available at: https://opendata.dwd.de/climate_environment/REA/, last access: 21 April 2025). a, b, c, d, e
Bonavita, M., Hólm, E., Isaksen, L., and Fisher, M.: The evolution of the ECMWF hybrid data assimilation system, Q. J. Roy. Meteor. Soc., 142, 287–303, https://doi.org/10.1002/qj.2652, 2016. a
Brienen, S., Haller, M., Brauch, J., and Frueh, B.: HoKliSim-De COSMO-CLM climate model simulation data version V2022.01, DWD-CPS [data set], https://doi.org/10.5676/DWD/HOKLISIM_V2022.01, 2022. a, b
C3S Climate Data Store: Winter windstorm indicators for Europe from 1979 to 2021 derived from reanalysis, Copernicus Climate Change Service (C3S) Climate Data Store (CDS), https://doi.org/10.24381/cds.9b4ea013, 2022. a, b, c, d, e
CIESIN: Gridded Population of the World, Version 4 (GPWv4): Population Density, Revision 11, Palisades, New York, NASA Socioeconomic Data and Applications Center (SEDAC), https://doi.org/10.7927/H49C6VHW, 2018. a
Cusack, S.: A long record of European windstorm losses and its comparison to standard climate indices, Nat. Hazards Earth Syst. Sci., 23, 2841–2856, https://doi.org/10.5194/nhess-23-2841-2023, 2023. a, b
Dacre, H. F. and Pinto, J. G.: Serial clustering of extratropical cyclones: A review of where, when and why it occurs, NPJ Climate and Atmospheric Science, 3, 2397–3722, https://doi.org/10.1038/s41612-020-00152-9, 2020. a, b
Davies, T., Cullen, M. J. P., Malcolm, A. J., Mawson, M. H., Staniforth, A., White, A. A., and Wood, N.: A new dynamical core for the Met Office's global and regional modelling of the atmosphere, Q. J. Roy. Meteor. Soc., 131, 1759–1782, 2005. a
Dee, D. P., Uppala, S. M., Simmons, A. J., Berrisford, P., Poli, P., Kobayashi, S., Andrae, U., Balmaseda, M. A., Balsamo, G., Bauer, P., Bechtold, P., Beljaars, A. C. M., van de Berg, L., Bidlot, J., Bormann, N., Delsol, C., Dragani, R., Fuentes, M., Geer, A. J., Haimberger, L., Healy, S. B., Hersbach, H., Hólm, E. V., Isaksen, L., Kållberg, P., Köhler, M., Matricardi, M., McNally, A. P., Monge-Sanz, B. M., Morcrette, J.-J., Park, B.-K., Peubey, C., de Rosnay, P., Tavolato, C., Thépaut, J.-N., and Vitart, F.: The ERA-Interim reanalysis: configuration and performance of the data assimilation system, Q. J. Roy. Meteor. Soc., 137, 553–597, https://doi.org/10.1002/qj.828, 2011. a, b, c
Deutsche Rück: Sturmdokumentation 2007, Publication of the Deutsche Rück Reinsurance Company, Duesseldorf, Germany, https://www.deutscherueck.de/fileadmin/Downloads/Sturmdoku_2007_web.pdf (last access: 16 January 2024), 2008 (in German). a
Fink, A. H., Brücher, T., Ermert, V., Krüger, A., and Pinto, J. G.: The European storm Kyrill in January 2007: synoptic evolution, meteorological impacts and some considerations with respect to climate change, Nat. Hazards Earth Syst. Sci., 9, 405–423, https://doi.org/10.5194/nhess-9-405-2009, 2009. a
Flynn, C. M., Moemken, J., Pinto, J. G., Schutte, M. K., and Messori, G.: Storm Database Files for A New Database of Extreme European Winter Windstorms, Zenodo [data set], https://doi.org/10.5281/zenodo.10594398, 2024. a, b
Giorgi, F. and Gutowski, W. J.: Regional Dynamical Downscaling and the CORDEX Initiative, Annu. Rev. Env. Resour., 40, 467–490, https://doi.org/10.1146/annurev-environ-102014-021217, 2015. a
Gliksman, D., Averbeck, P., Becker, N., Gardiner, B., Goldberg, V., Grieger, J., Handorf, D., Haustein, K., Karwat, A., Knutzen, F., Lentink, H. S., Lorenz, R., Niermann, D., Pinto, J. G., Queck, R., Ziemann, A., and Franzke, C. L. E.: Review article: A European perspective on wind and storm damage – from the meteorological background to index-based approaches to assess impacts, Nat. Hazards Earth Syst. Sci., 23, 2171–2201, https://doi.org/10.5194/nhess-23-2171-2023, 2023. a, b, c, d
Hersbach, H., Bell, B., Berrisford, P., Hirahara, S., Horányi, A., Muñoz-Sabater, J., Nicolas, J., Peubey, C., Radu, R., Schepers, D., Simmons, A., Soci, C., Abdalla, S., Abellan, X., Balsamo, G., Bechtold, P., Biavati, G., Bidlot, J., Bonavita, M., De Chiara, G., Dahlgren, P., Dee, D., Diamantakis, M., Dragani, R., Flemming, J., Forbes, R., Fuentes, M., Geer, A., Haimberger, L., Healy, S., Hogan, R. J., Hólm, E., Janisková, M., Keeley, S., Laloyaux, P., Lopez, P., Lupu, C., Radnoti, G., de Rosnay, P., Rozum, I., Vamborg, F., Villaume, S., and Thépaut, J.-N.: The ERA5 global reanalysis, Q. J. Roy. Meteor. Soc., 146, 1999–2049, https://doi.org/10.1002/qj.3803, 2020. a, b, c, d, e, f
Hersbach, H., Bell, B., Berrisford, P., Biavati, G., Horányi, A., Muñoz Sabater, J., Nicolas, J., Peubey, C., Radu, R., Rozum, I., Schepers, D., Simmons, A., Soci, C., Dee, D., and Thépaut, J.-N.: ERA5 hourly data on single levels from 1940 to present, Copernicus Climate Change Service (C3S) Climate Data Store (CDS) [data set], https://doi.org/10.24381/cds.adbb2d47, 2023. a
Jacob, D., Petersen, J., Eggert, B., Alias, A., Christensen, O. B., Bouwer, L. M., Braun, A., Colette, A., Déqué, M., Georgievski, G., Georgopoulou, E., Gobiet, A., Menut, L., Nikulin, G., Haensler, A., Hempelmann, N., Jones, C., Keuler, K., Kovats, S., Kröner, N., Kotlarski, S., Kriegsmann, A., Martin, E., van Meijgaard, E., Moseley, C., Pfeifer, S., Preuschmann, S., Radermacher, C., Radtke, K., Rechid, D., Rounsevell, M., Samuelsson, P., Somot, S., Soussana, J.-F., Teichmann, C., Valentini, R., Vautard, R., Weber, B., and Yiou, P.: EURO-CORDEX: new high-resolution climate change projections for European impact research, Reg. Environ. Change, 14, 563–578, https://doi.org/10.1007/s10113-013-0499-2, 2014. a, b, c
Jacob, D., Teichmann, C., Sobolowski, S., Katragkou, E., Anders, I., Belda, M., Benestad, R., Boberg, F., Buonomo, E., Cardoso, R. M., Casanueva, A., Christensen, O. B., Christensen, J. H., Coppola, E., De Cruz, L., Davin, E. L., Dobler, A., Domínguez, M., Fealy, R., Fernandez, J., Gaertner, M. A., García-Díez, M., Giorgi, F., Gobiet, A., Goergen, K., Gómez-Navarro, J. J., Alemán, J. J. G., Gutiérrez, C., Gutiérrez, J., Güttler, I., Haensler, A., Halenka, T., Jerez, S., Jiménez-Guerrero, P., Jones, R. G., Keuler, K., Kjellström, E., Knist, S., Kotlarski, S., Maraun, D., van Meijgaard, E., Mercogliano, P., Montávez, J. P., Navarra, A., Nikulin, G., de Noblet-Ducoudré, N., Panitz, H.-J., Pfeifer, S., Piazza, M., Pichelli, E., Pietikäinen, J.-P., Prein, A. F., Preuschmann, S., Rechid, D., Rockel, B., Romera, R., Sánchez, E., Sieck, K., Soares, P. M. M., Somot, S., Srnec, L., Sørland, S. L., Termonia, P., Truhetz, H., Vautard, R., Warrach-Sagi, K., and Wulfmeyer, V.: Regional climate downscaling over Europe: perspectives from the EURO-CORDEX community, Reg. Environ. Change, 20, 51, https://doi.org/10.1007/s10113-020-01606-9, 2020. a, b, c
Karremann, M. K., Pinto, J. G., von Bomhard, P. J., and Klawa, M.: On the clustering of winter storm loss events over Germany, Nat. Hazards Earth Syst. Sci., 14, 2041–2052, https://doi.org/10.5194/nhess-14-2041-2014, 2014. a, b, c, d, e
Klawa, M. and Ulbrich, U.: A model for the estimation of storm losses and the identification of severe winter storms in Germany, Nat. Hazards Earth Syst. Sci., 3, 725–732, https://doi.org/10.5194/nhess-3-725-2003, 2003. a, b, c, d, e, f
Leckebusch, G. C., Ulbrich, U., Fröhlich, L., and Pinto, J. G.: Property loss potentials for European midlatitude storms in a changing climate, Geophys. Res. Lett., 34, L05703, https://doi.org/10.1029/2006GL027663, 2007. a, b, c
Little, A. S., Priestley, M. D. K., and Catto, J. L.: Future increased risk from extratropical windstorms in northern Europe, Nat. Commun., 14, 4434, https://doi.org/10.1038/s41467-023-40102-6, 2023. a
Ludwig, P., Pinto, J. G., Hoepp, S. A., Fink, A. H., and Gray, S. L.: Secondary Cyclogenesis along an Occluded Front Leading to Damaging Wind Gusts: Windstorm Kyrill, January 2007, Mon. Weather Rev., 143, 1417–1437, https://doi.org/10.1175/MWR-D-14-00304.1, 2015. a
Mitchell-Wallace, K., Jones, M., Hillier, J., and Foote, M.: Natural Catastrophe Risk Management and Modelling: A Practitioner's Guide, Wiley-Blackwell, https://doi.org/10.1002/9781118906057, 2017. a
Moemken, J., Alifdini, I., Ramos, A. M., Georgiadis, A., Brocklehurst, A., Braun, L., and Pinto, J. G.: Insurance loss model vs. meteorological loss index – how comparable are their loss estimates for European windstorms?, Nat. Hazards Earth Syst. Sci., 24, 3445–3460, https://doi.org/10.5194/nhess-24-3445-2024, 2024a. a, b, c
Moemken, J., Messori, G., and Pinto, J. G.: Windstorm losses in Europe – What to gain from damage datasets, Weather and Climate Extremes, 44, 100661, https://doi.org/10.1016/j.wace.2024.100661, 2024b. a, b, c, d
Munich Re: Geo Risks Research: Loss events in Europe 1980–2014: 10 costliest winter storms ordered by insured losses, Tech. rep., https://www.preventionweb.net/files/44281_19802014paketworldusde4zu3.pdf (last access: 16 January 2024), 2015. a
Munich Re: Risks posed by natural disasters: Losses are trending upwards, https://www.munichre.com/en/risks/natural-disasters-losses-are-trending-upwards.html (last access: 16 January 2024), 2022. a
Pinto, J. G., Fröhlich, E. L., Leckebusch, G. C., and Ulbrich, U.: Changing European storm loss potentials under modified climate conditions according to ensemble simulations of the ECHAM5/MPI-OM1 GCM, Nat. Hazards Earth Syst. Sci., 7, 165–175, https://doi.org/10.5194/nhess-7-165-2007, 2007. a, b, c
Pinto, J. G., Karremann, M. K., Born, K., Della-Marta, P. M., and Klawa, M.: Loss potentials associated with European windstorms under future climate conditions, Clim. Res., 54, 1–20, 2012. a, b, c, d, e, f, g, h, i, j
Pinto, J. G., Gómara, I., Masato, G., Dacre, H. F., Woollings, T., and Caballero, R.: Large-scale dynamics associated with clustering of extratropical cyclones affecting Western Europe, J. Geophys. Res.-Atmos., 119, 13704–13719, https://doi.org/10.1002/2014JD022305, 2014. a, b, c, d
Pinto, J. G., Pantillon, F., Ludwig, P., Déroche, M.-S., Leoncini, G., Raible, C. C., Shaffrey, L. C., and Stephenson, D. B.: From Atmospheric Dynamics to Insurance Losses: An Interdisciplinary Workshop on European Storms, B. Am. Meteorol. Soc., 100, ES175–ES178, https://doi.org/10.1175/BAMS-D-19-0026.1, 2019. a, b
Priestley, M. D. K. and Catto, J. L.: Future changes in the extratropical storm tracks and cyclone intensity, wind speed, and structure, Weather Clim. Dynam., 3, 337–360, https://doi.org/10.5194/wcd-3-337-2022, 2022. a
Priestley, M. D. K., Dacre, H. F., Shaffrey, L. C., Hodges, K. I., and Pinto, J. G.: The role of serial European windstorm clustering for extreme seasonal losses as determined from multi-centennial simulations of high-resolution global climate model data, Nat. Hazards Earth Syst. Sci., 18, 2991–3006, https://doi.org/10.5194/nhess-18-2991-2018, 2018. a, b, c, d, e, f, g, h
Roberts, J. F., Champion, A. J., Dawkins, L. C., Hodges, K. I., Shaffrey, L. C., Stephenson, D. B., Stringer, M. A., Thornton, H. E., and Youngman, B. D.: The XWS open access catalogue of extreme European windstorms from 1979 to 2012, Nat. Hazards Earth Syst. Sci., 14, 2487–2501, https://doi.org/10.5194/nhess-14-2487-2014, 2014 (data available at: https://www.europeanwindstorms.org/repository/, last access: 21 April 2025). a, b, c, d, e
Rockel, B., Will, A., and Hense, A.: The Regional Climate Model COSMO-CLM (CCLM), Meteorol. Z., 17, 347–348, https://doi.org/10.1127/0941-2948/2008/0309, 2008. a, b
Schwierz, C., Köllner-Heck, P., Zenklusen Mutter, E., Bresch, D. N., Vidale, P.-L., Wild, M., and Schär, C.: Modelling European winter wind storm losses in current and future climate, Climatic Change, 101, 485–514, https://doi.org/10.1007/s10584-009-9712-1, 2010. a, b
Severino, L. G., Kropf, C. M., Afargan-Gerstman, H., Fairless, C., de Vries, A. J., Domeisen, D. I. V., and Bresch, D. N.: Projections and uncertainties of winter windstorm damage in Europe in a changing climate, Nat. Hazards Earth Syst. Sci., 24, 1555–1578, https://doi.org/10.5194/nhess-24-1555-2024, 2024. a
Ulbrich, U., Leckebusch, G., and Pinto, J.: Extra-tropical cyclones in the present and future climate: a review, Theor. Appl. Climatol., 96, 117–131, https://doi.org/10.1007/s00704-008-0083-8, 2009. a
van den Brink, H. W.: An effective parametrization of gust profiles during severe wind conditions, Environmental Research Communications, 2, 011001, https://doi.org/10.1088/2515-7620/ab5777, 2019. a, b, c, d, e
Walz, M. A. and Leckebusch, G. C.: Loss potentials based on an ensemble forecast: How likely are winter windstorm losses similar to 1990?, Atmos. Sci. Lett., 20, e891, https://doi.org/10.1002/asl.891, 2019. a