the Creative Commons Attribution 4.0 License.
the Creative Commons Attribution 4.0 License.
 | 04 Sep 2025
What is climate change doing in the Himalaya? Thirty years of the Pyramid Meteorological Network (Nepal)
Franco Salerno
Nicolas Guyennon
Nicola Colombo
Maria Teresa Melis
Francesco Gabriele Dessì
Gianpietro Verza
Kaji Bista
Ahmad Sheharyar
Gianni Tartari
Climate change is deeply impacting mountain areas around the globe, especially in the Himalaya. However, the lack of long-term meteorological observations at high elevations poses significant challenges to understanding and predicting impacts at various scales. This also represents a serious limit for model-based projections of future behavior of crucial elements of the mountain cryosphere such as glaciers. Here, we present the Pyramid Meteorological Network, located in the Himalaya (Nepal) on the southern slopes of Mt. Everest. The network is composed of seven meteorological stations located between 2660 and 7986 , which have collected continuous climatic data during 30 recent years (1994–2023). In this paper, we provide details regarding instrument types and characteristics as well as data quality control and assessment. The obtained data series are available on a newly created geoportal. We leverage these unique records to present new knowledge on the Himalayan climate, also benefiting from the highest observational climatic series in the world (Pyramid station, located above 5000 , close to the Khumbu Glacier). These data will provide fundamental knowledge on climate dynamics in the Himalaya that will inform research at high elevations in the coming years. The dataset is freely accessible from https://geoportal.mountaingenius.org/portal/ (last access: 1 September 2025) (https://doi.org/10.5281/zenodo.15211352; Salerno et al., 2024).
- Article
(6728 KB) - Full-text XML
-
Supplement
(658 KB) - BibTeX
- EndNote


Global temperature has been increasing at unprecedented rates during recent decades, impacting both natural and human systems. Alpine biomes, among the natural ecosystems most sensitive to climate warming, have shown rapid shifts in species distribution ranges and modulations of species interactions (e.g., Sigdel et al., 2021). Furthermore, Himalayan glaciers have been losing mass in recent decades (Biemans et al., 2019; The GlaMBIE Team, 2025). The current uncertainties concerning the glacial shrinkage in the Himalaya are mainly attributed to the lack of measurements of climatic forcings (e.g., Bhattacharya et al., 2021). Indeed, recent research has underlined the need for fine-scale investigations, especially at high elevations, to better model the glaciohydrological dynamics (Yao et al., 2022). In addition, according to Yang et al. (2018), reliable meteorological data at glacial elevations are essential for (1) placing the observed glacial changes in the context of current climatic change, (2) understanding hydrometeorological relationships in cryospheric environments, and (3) calibrating dynamically and statistically downscaled climate fields. However, there are only a few high-elevation weather stations where the glaciers are located, especially in the Himalaya. This can be attributed to the remote locations of the glaciers and the rugged terrain, which make physical access difficult (e.g., Salerno et al., 2015; Lin et al., 2021; Wagnon et al., 2021; Matthews et al., 2022).
As a consequence of the remoteness and difficulty in accessing several high-elevation sites combined with the complications of operating automated weather stations (AWSs) in remote areas, long-term measurements are challenging (Yang et al., 2018). For instance, in the Himalaya, meteorological stations at high elevations are extremely scarce (Pepin et al., 2015; Salerno et al., 2015; Matthews et al., 2022). Therefore, in several studies, climatic data at high elevations had to be estimated using low-elevation data (Salerno et al., 2015), which are more common. This is the case of the central Himalaya, where the Department of Hydrology and Meteorology of Nepal (http://www.dhm.gov.np/, last access: 1 September 2025) maintains more than 300 long-term rain stations, although they are mainly located below 3000
In this context, in the early 1990s, the Pyramid Meteorological Network was created by the Italian Ev-K2-CNR Committee (http://www.evk2cnr.org, last access: 1 September 2025). This network is composed of seven automatic weather stations located on the southern side of Mt. Everest (along the Khumbu Valley) in the central Himalaya (Sagarmatha National Park – SNP; Amatya et al., 2010; Salerno et al., 2010), ranging from 2660 to 7986 . For each station, the following variables are collected on an hourly basis: air temperature, total precipitation, relative humidity, atmospheric pressure, and wind speed and direction.
Here, we present the overall dataset of the Pyramid Meteorological Network and the database in which all meteorological data are stored, which are freely accessible at https://geoportal.mountaingenius.org/portal/ (last access: 1 September 2025), (https://doi.org/10.5281/zenodo.15211352, Salerno et al., 2024). Furthermore, we explore the small-scale climate variability of the longest time series of the network, the Pyramid station (5035 ), located close to the Khumbu Glacier.
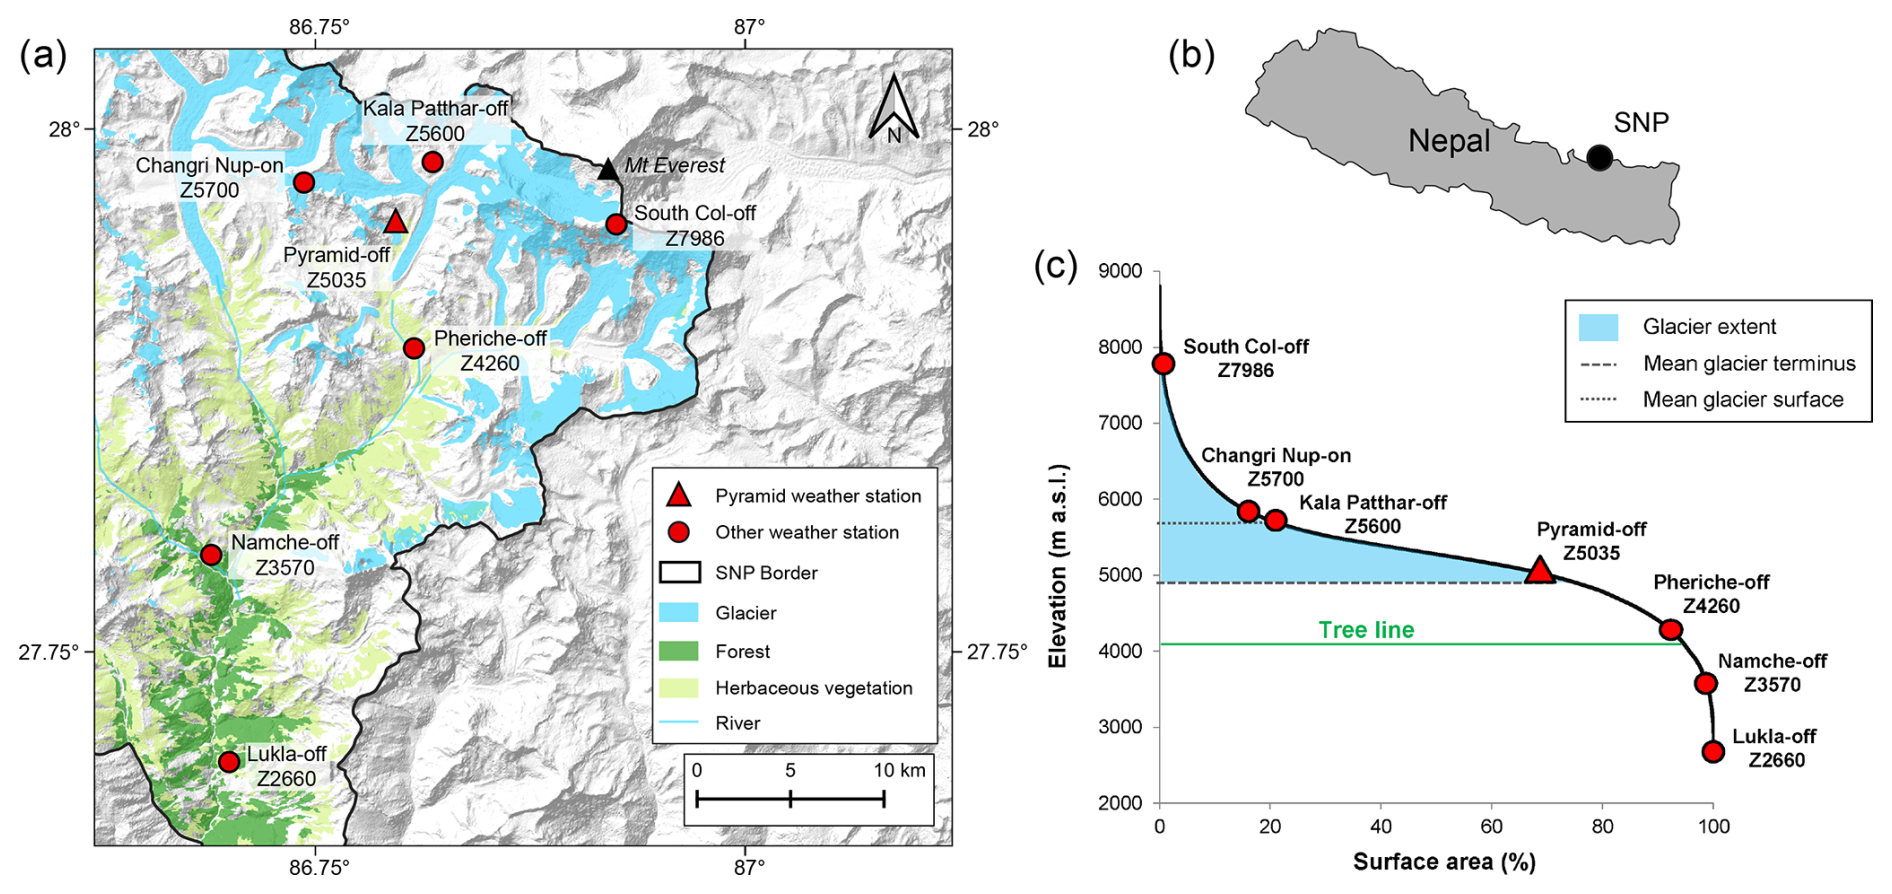
Figure 1(a, b) Locations of the meteorological monitoring network in the Sagarmatha National Park (SNP), Nepal. (c) Hypsometric curve of the SNP and the altitudinal glacier distribution. Along this curve, the locations of meteorological stations belonging to the Pyramid Observatory Laboratory are presented.
Salerno et al. (2015) described the ground network of AWSs belonging to the Pyramid Meteorological Network, which is located on the southern side of Mt. Everest (along the Khumbu Valley) in the central Himalaya (SNP; Amatya et al., 2010; Salerno et al., 2010) (Fig. 1). The land cover classification shows that almost one-third of the territory is characterized by glaciers and ice cover, while less than 10 % of the park area is forested (Abies spectabilis and Betula utilis) (Magnani et al., 2018; Pandey et al., 2020). The treeline is located at approximately 4050 , while the landscape is dominated by alpine tundra and lichen above this elevation (Bhuju et al., 2010; Sigdel et al., 2021). Glacial surfaces are distributed from 4300 to above 8000 Around 75 % of the glacier surfaces are located between 5000 and 6500 (Thakuri et al., 2014, 2016), and approximately 25 % of the glacierized area is debris-covered (Shea et al., 2015; Salerno et al., 2017). Glaciers in this area are classified as the summer accumulation type and are fed mainly by summer monsoon precipitation (Tartari et al., 2008; Ueno et al., 2008).
The climate in the South Asian and Himalayan region has a strong annual cycle, with the South Asian monsoon that is a phase of this annual cycle. During the pre-monsoon season (March–April–May), the westerlies prevail over this region and are deflected when crossing the Himalayan mountains. During the monsoon season (June–July–August–September), the westerlies move northward, while southwesterly flows dominate the upper level of the atmosphere and southeasterly flows from the Bay of Bengal dominate the lower level (Ichiyanagi et al., 2007). After the offset of the monsoon, the southwesterly and southeasterly flows are replaced by the westerlies. The warm area moves to the south, and both air temperature and humidity decrease considerably. Cooling and drying are further enhanced towards the winter (Yang et al., 2018).
Regarding the precipitation, the measurements at the Pyramid station (5035 – Z5035) show that 90 % is concentrated from June to September, while the probability of snowfall during these months is very low (4 %). The annual cumulative precipitation at this elevation is 446 mm, with a mean annual temperature of −2.5 °C (Salerno et al., 2015). Precipitation increases linearly to an elevation of 2500 and decreases exponentially at higher elevations (Salerno et al., 2015). Finally, the wind regime of the area is characterized by up-valley winds during the day throughout the year, while weak up-valley winds occur at night during the monsoon season, with some evidence of down-valley winds occurring at night in the winter (Potter et al., 2018, and references therein). Strong diurnal katabatic winds also occur at higher elevations (above approximately 4500 ) due to enhanced glacier melting under warm atmospheric conditions (Salerno et al., 2023).
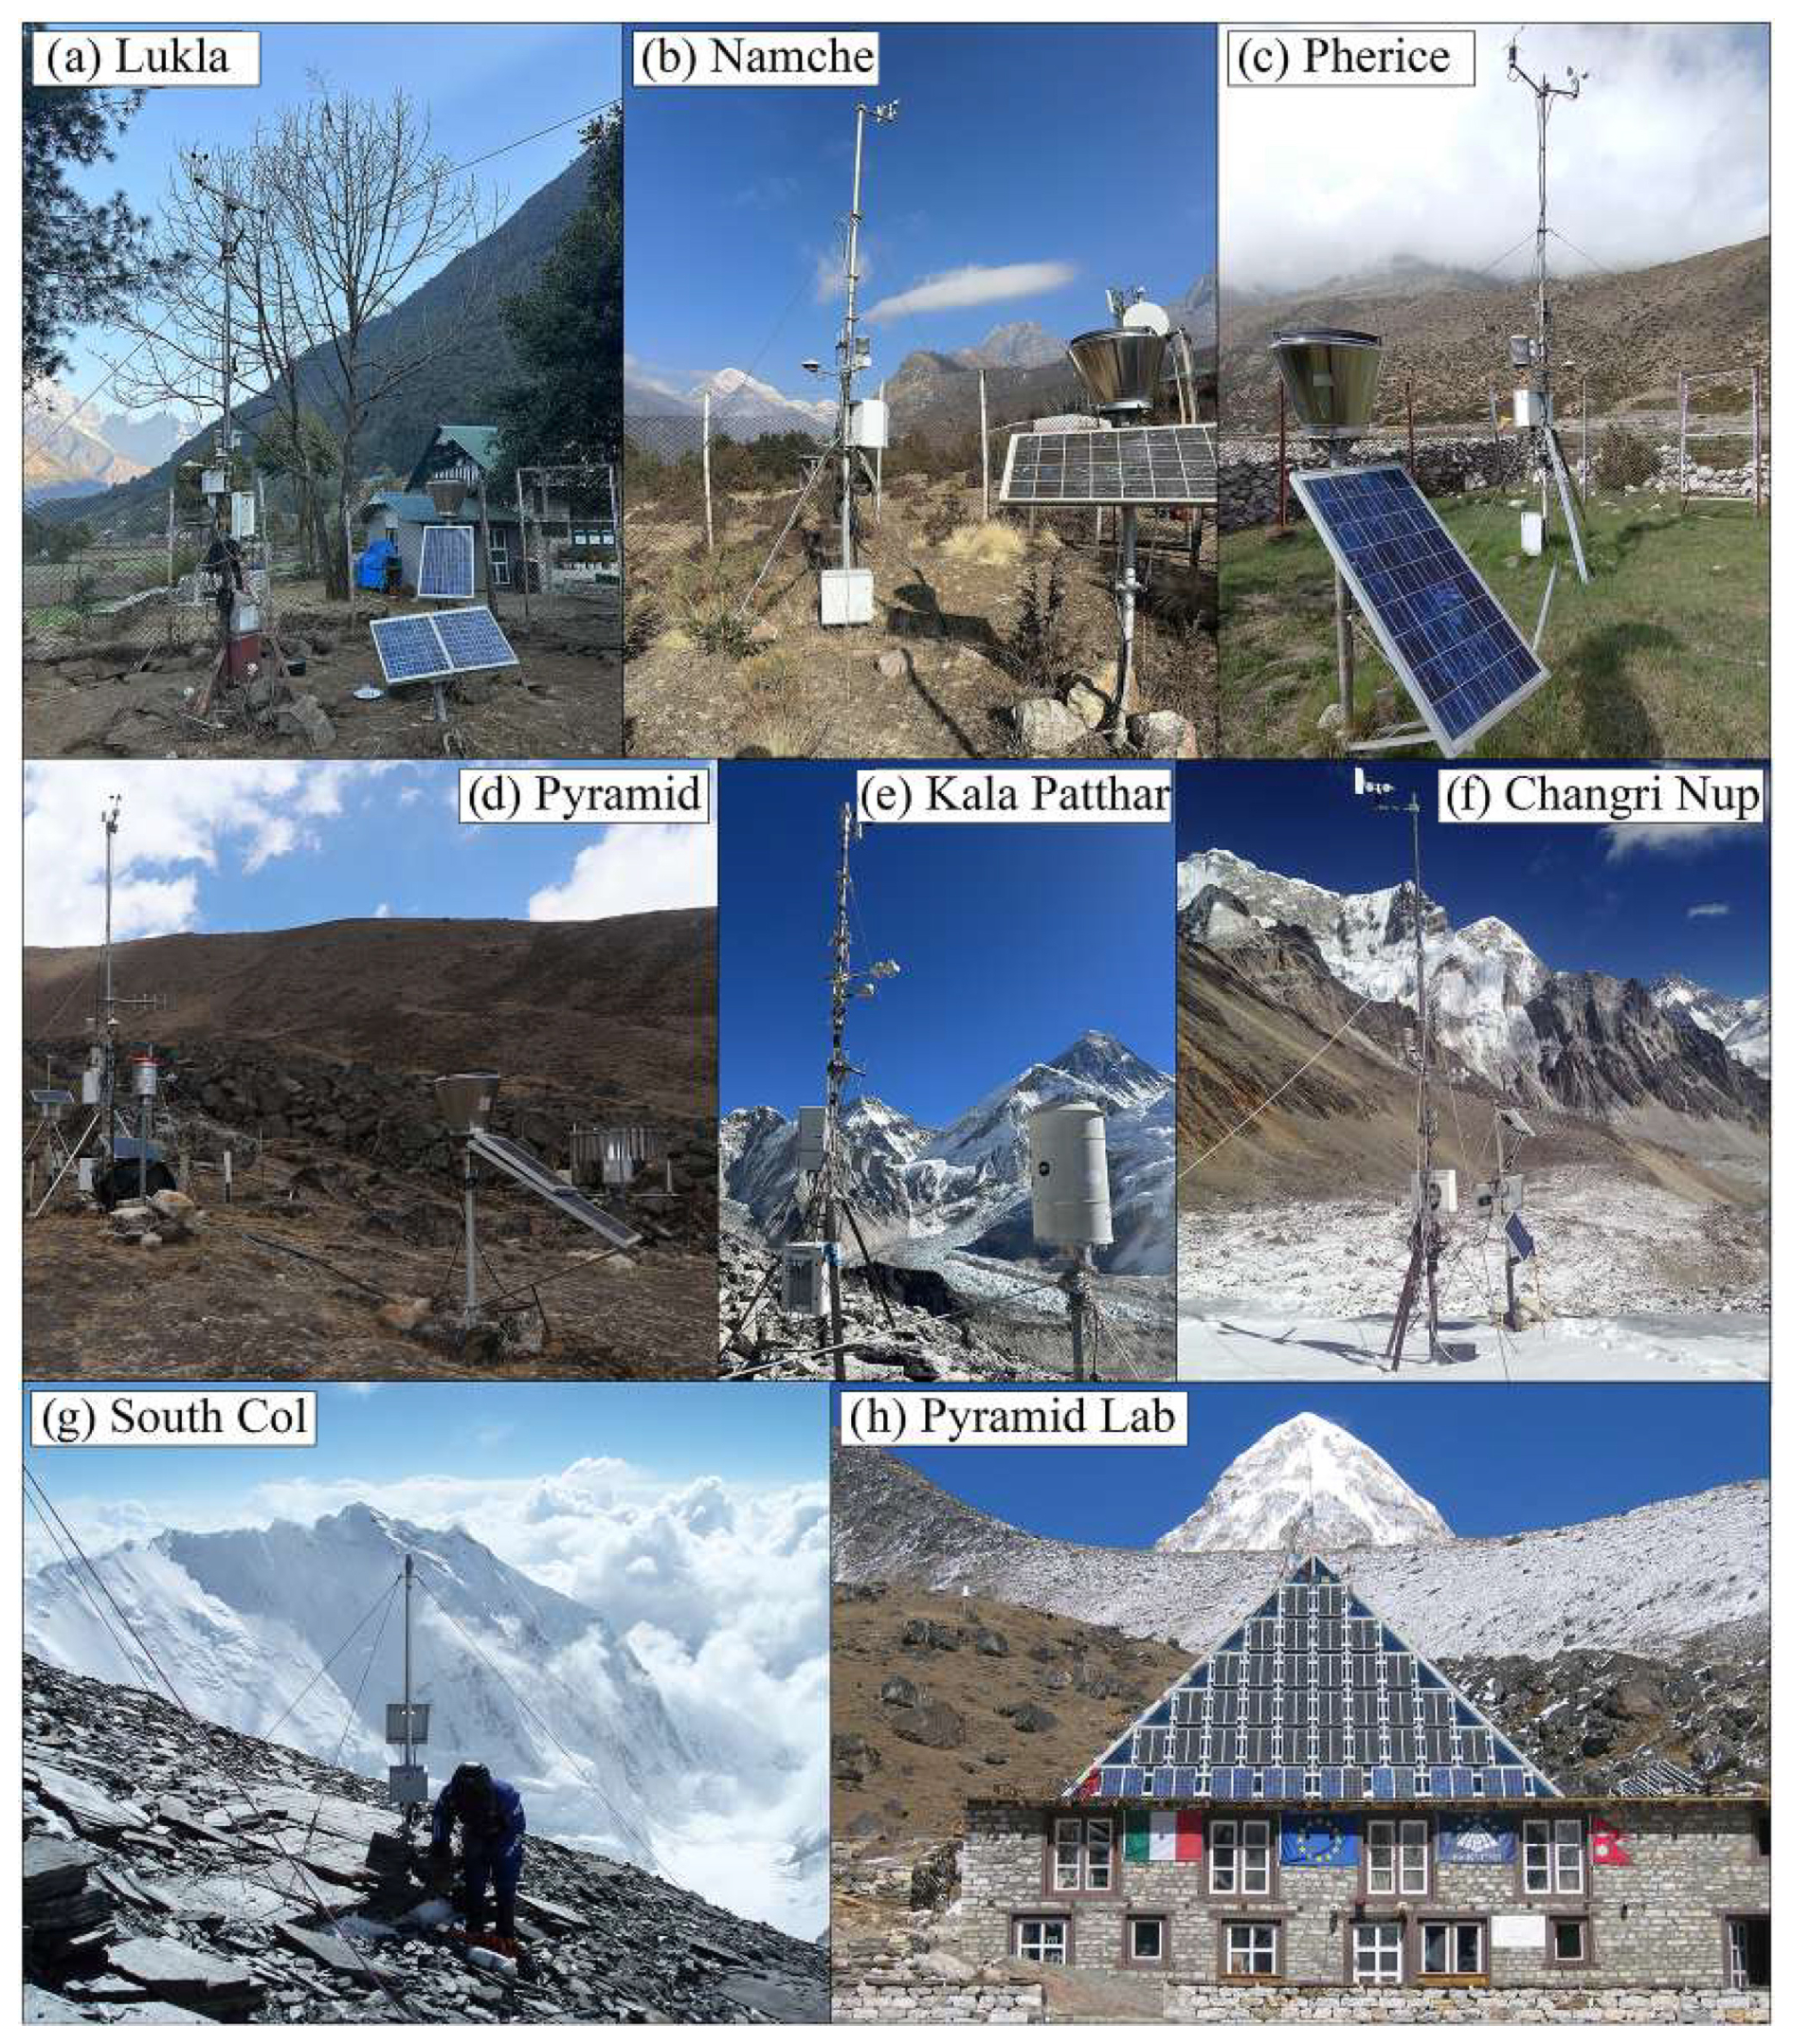
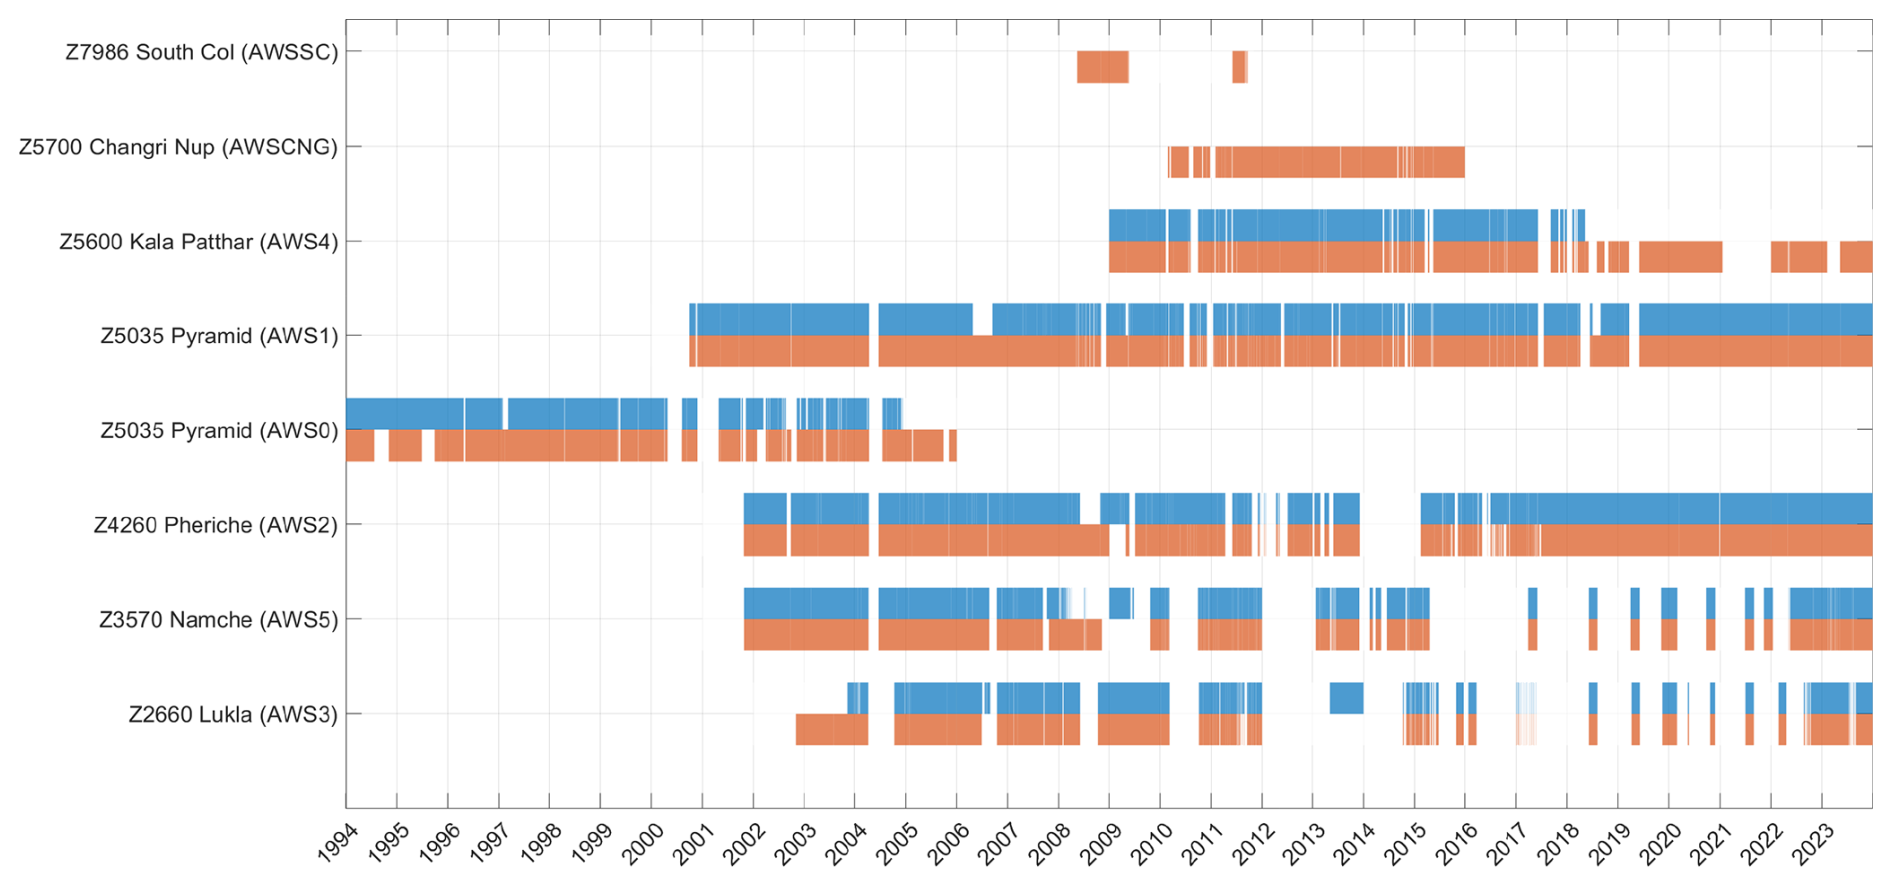
Figure 3Available data time series (precipitation: blue; temperature: orange) for the Pyramid Meteorological Network since 1994.
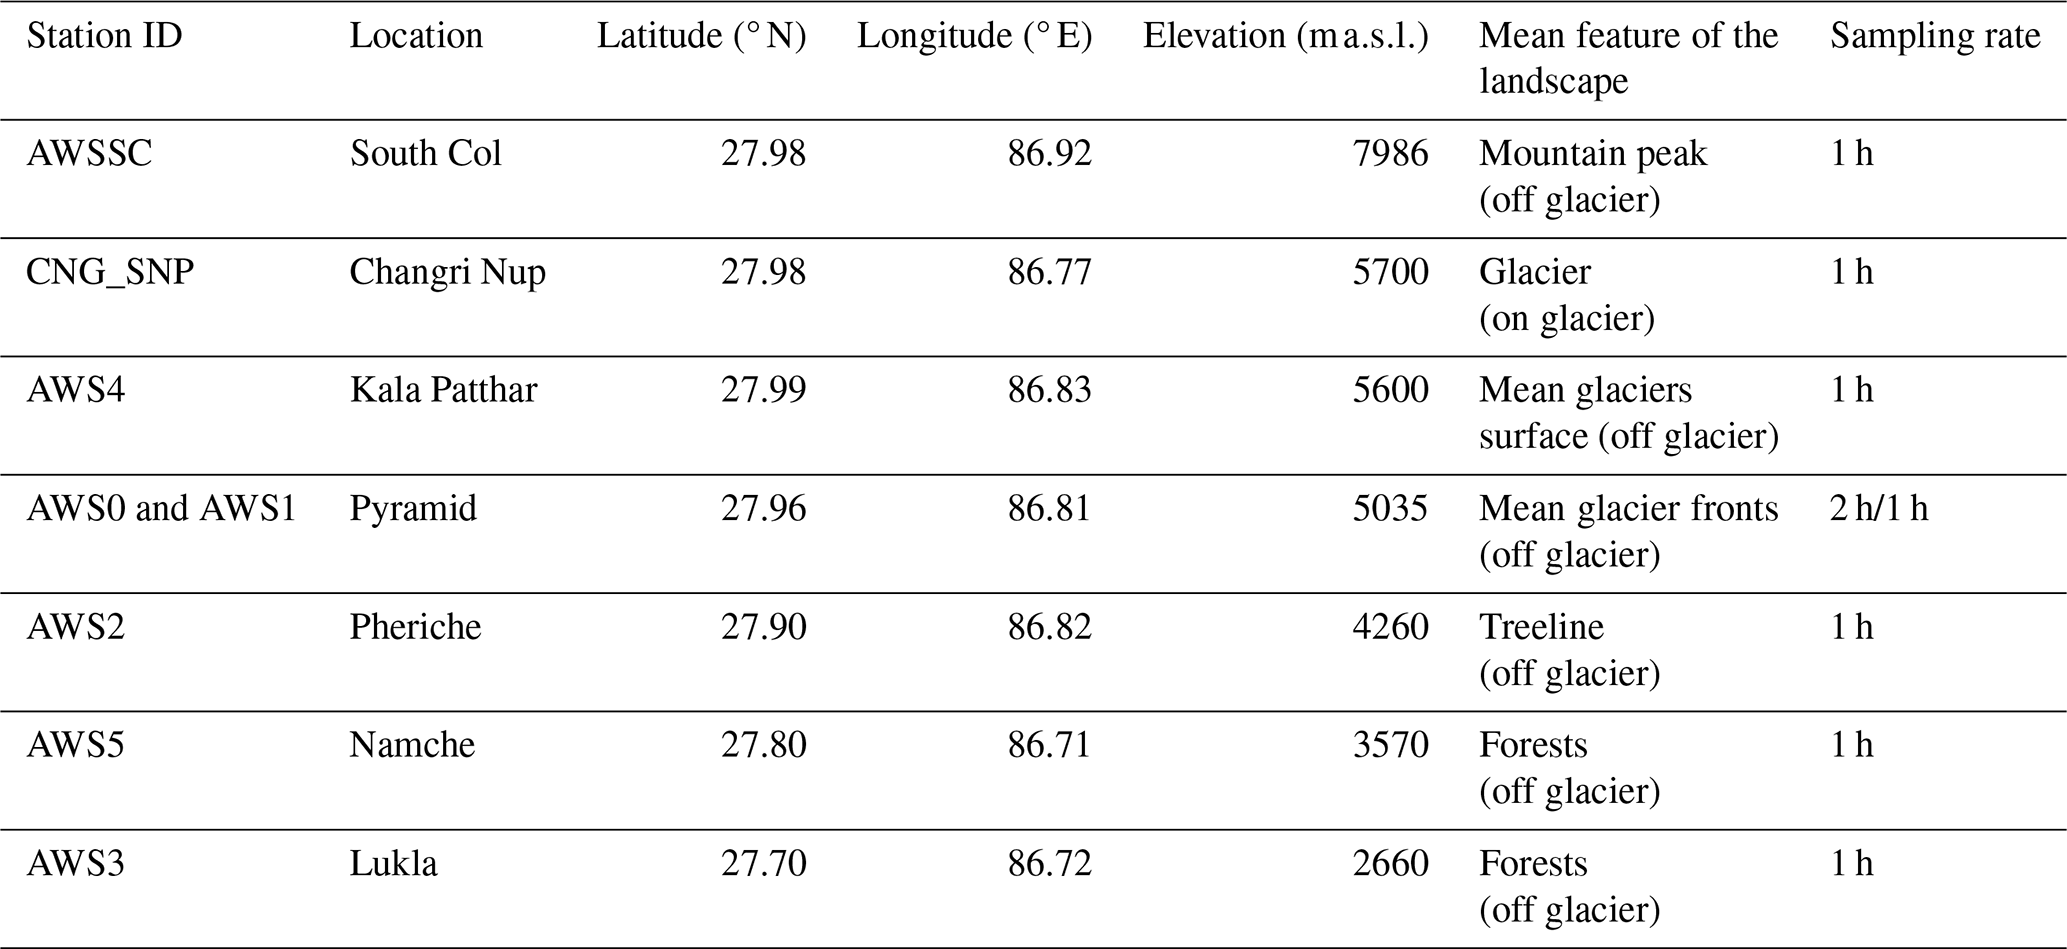
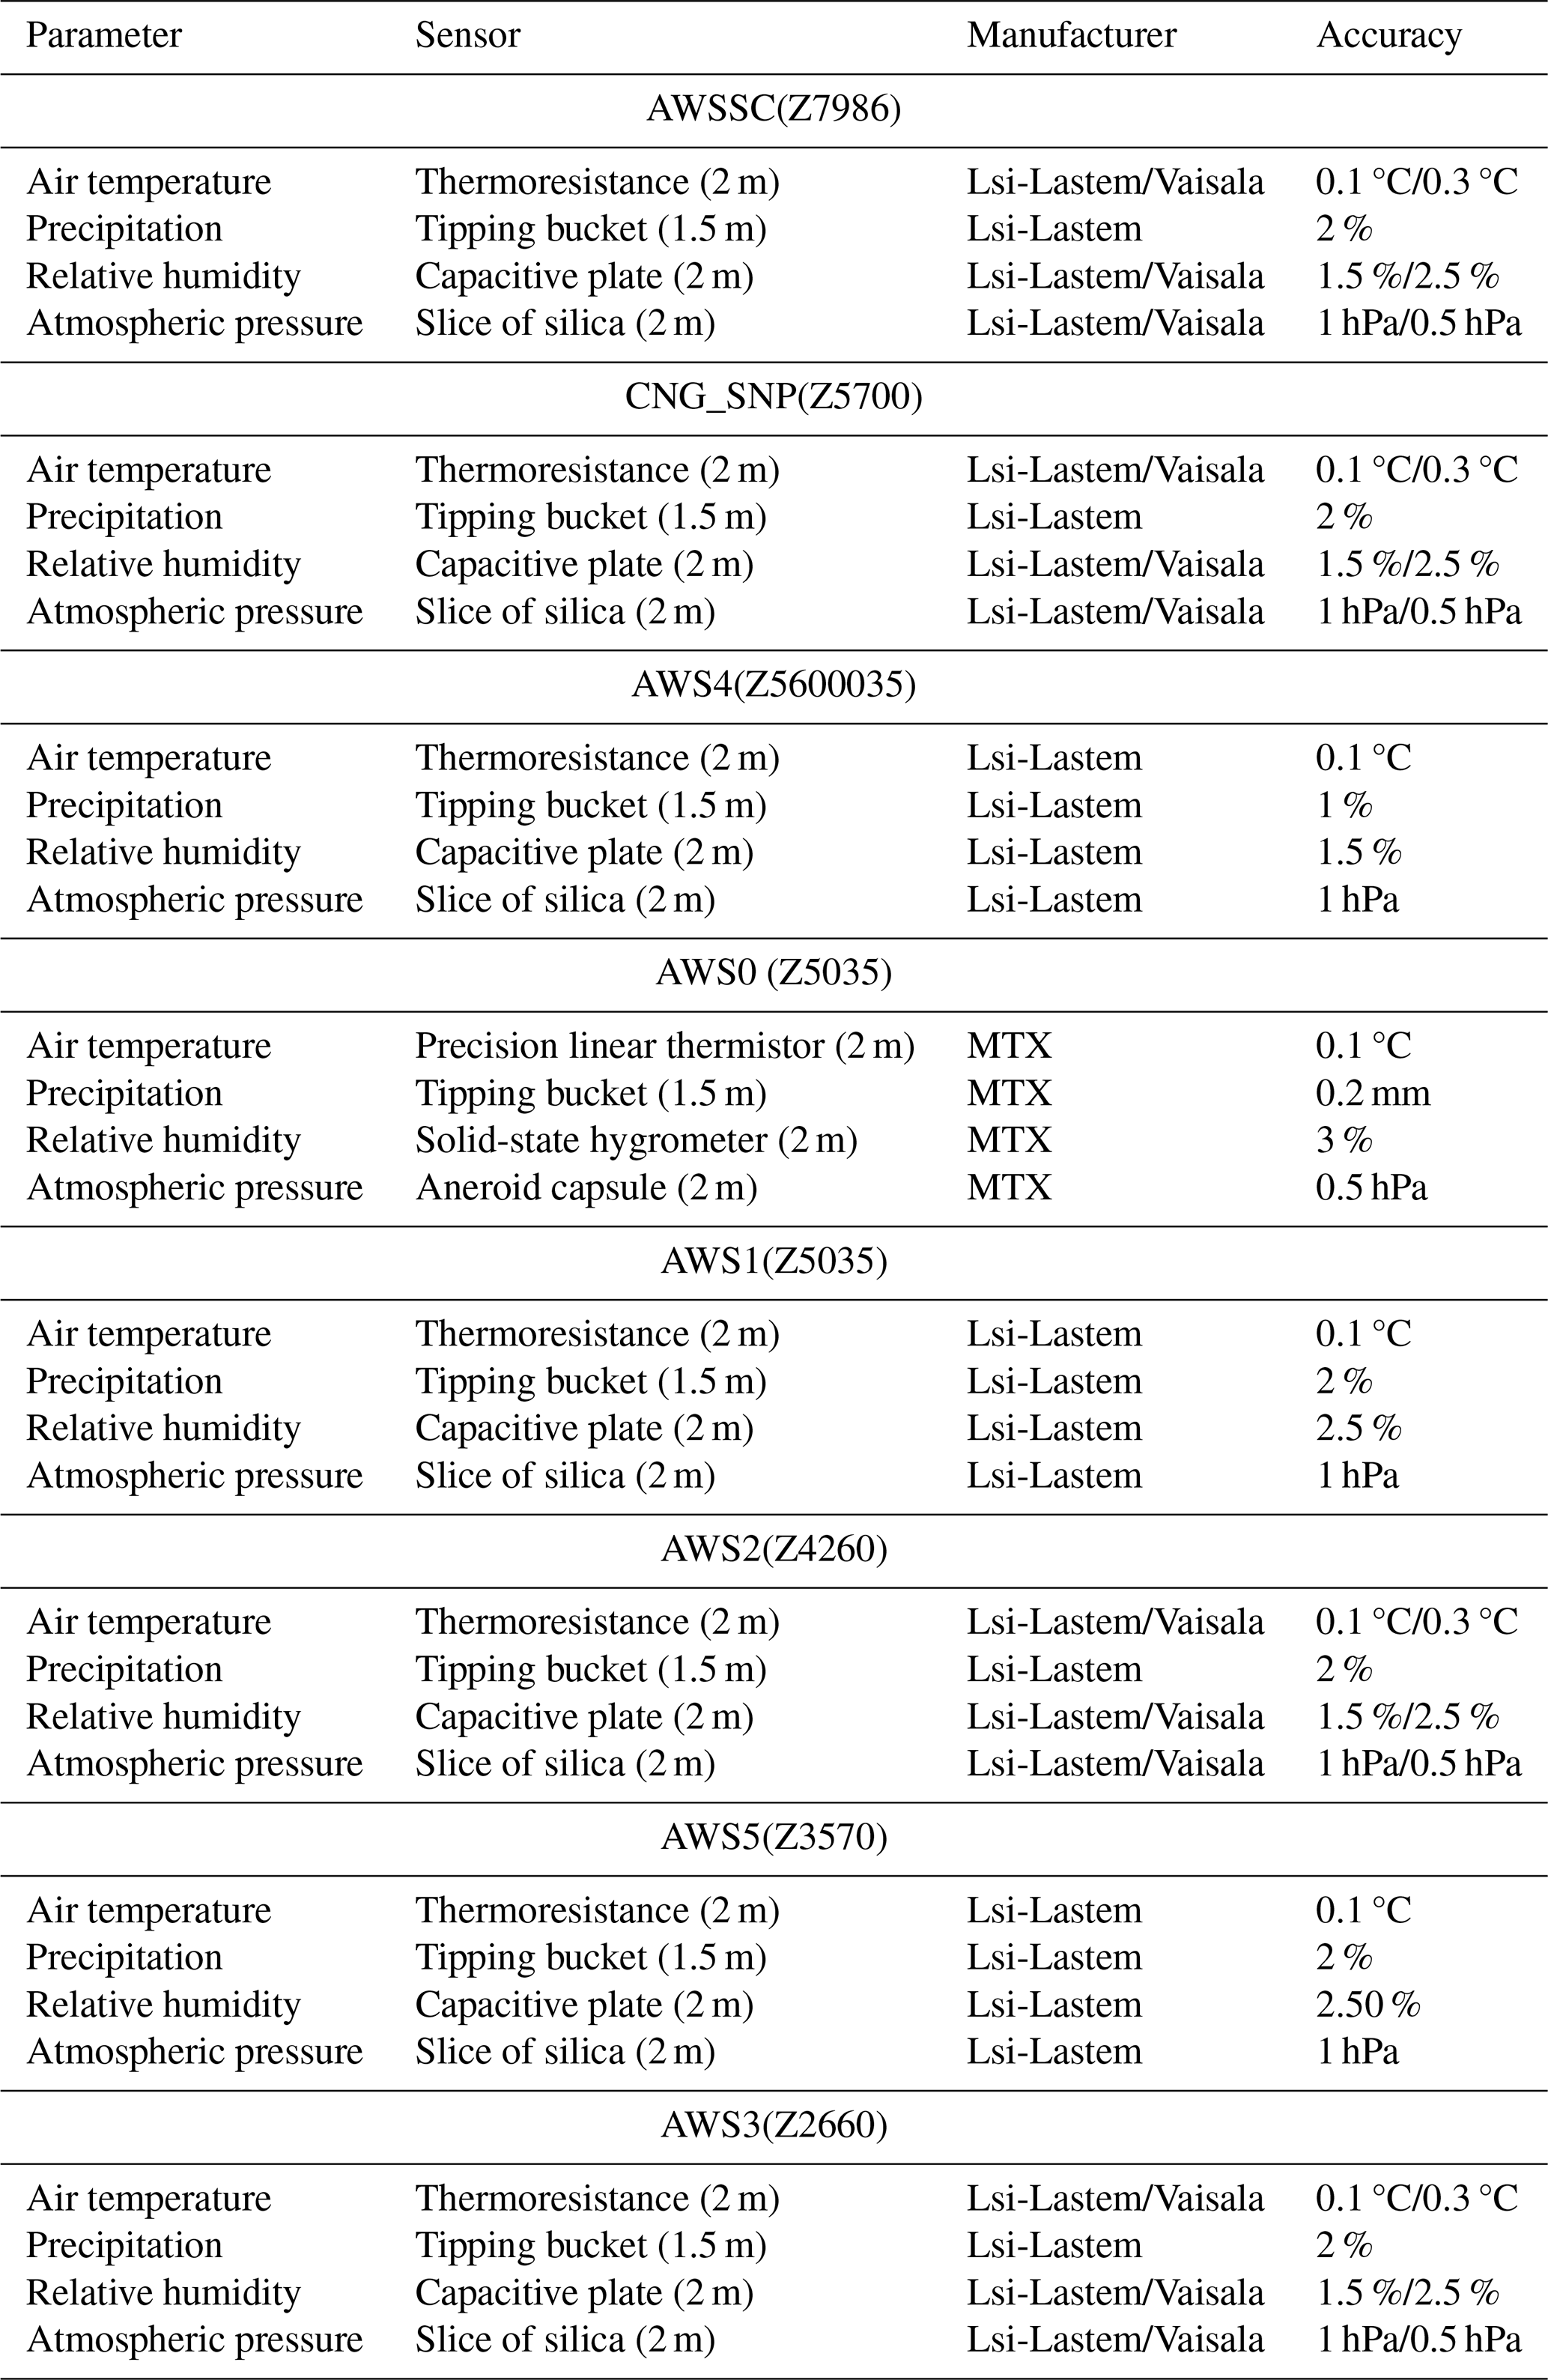
Table 1List of stations belonging to the Pyramid Meteorological Network.
3.1 Weather stations
The first automatic weather station (AWS0) was installed in October 1993 near the Pyramid Laboratory at 5035 (Figs. 1 and 2; Bertolani et al., 2000). AWS0 recorded temperature data until December 2005. A new station (AWS1) was installed just a few tens of meters away from AWS0, and it has been operating since October 2000. The comparison between the two stations during the overlapping period is detailed in Figs. S1 and S2 in the Supplement. The hourly temperature data show a high level of agreement, with R2 = 0.93 and a small mean bias of −0.073 °C. Similarly, we compared daily precipitation measurements. The two stations show a negligible bias of −0.53 mm, though the data exhibit greater scatter (R2 = 0.64), which is mostly observed outside the monsoon period.
The other stations were installed in the following years in the Khumbu Valley (Fig. 1 and Table 1). In 2008, the network included seven monitoring sites, including the highest weather station of the world located at South Col on Mt. Everest (7986 ). The locations of all of the stations are presented in Fig. 1, while Fig. 3 shows the temporal availability of the meteorological data. AWS3 (2660 – Z2660) and AWS5 (5370 – Z3570) are located below the treeline, while AWS2 (Z4260) is located close to the upper limit of the vegetation. At higher elevations, AWS0 and AWS1 (Z5035) are close to the glacier front elevation, AWS4 (Z5600) is situated at the mean elevation of the glaciers, and, finally, AWSCC (Z7986) characterizes the highest peaks.
Recently, a new meteorological network was established in the Khumbu Valley by the 2019 National Geographic and Rolex Everest Expedition (https://datadash.appstate.edu/high-altitude-climate/#download, last access: 1 September 2025), with five stations ranging from 3810 to 8810 (Matthews et al., 2022). On average, this network is located at an elevation higher than that of the Pyramid Meteorological Network, mainly representing the accumulation zone of the glaciers in the region. Moreover, the GLACIOCLIM group manages some stations on Changri Nup and Mera Glacier (e.g., Wagnon et al., 2021).
Table 2List of sensors with measurement height, manufacturer, and accuracy. The Z naming convention relates to the elevation of each station.
3.2 Data description
The list of the measured variables, the sensor types, and the accuracies for each station is presented in Table 2. The dataset contains AT (2 m atmospheric temperature, °C), RR (rainfall rate, mm), RH (relative humidity, %), AP (atmospheric pressure, hPa), WS (wind speed, m s−1), and WD (wind direction, °). All times are given in the local time (Nepal Standard Time (NPT), UTC+5:45). All data are published on an hourly basis. These hourly data are published without any gap-filling procedure: when the data are missing, the field is empty.
The existence of a permanent laboratory at 5035 (the Pyramid Laboratory) has allowed constant maintenance for over 3 decades thanks to the presence of a technician all year round, which has resulted in all of the stations being currently fully operational. In addition, starting from 2024, all of the stations have been transmitting data, which will further limit the issue of missing data in the future. However, the main weakness of this data network is the lack of heated rain gauges, although precipitation is concentrated in summer, when minimum temperatures are above +0 °C. According to Salerno et al. (2015), the underestimation of precipitation falling as snow during the remaining months should not be over 20 %.
Here we also report the reconstructed monthly Pyramid time series (1994–2023 period) for Tmin (minimum air temperature), Tmax (maximum air temperature), Tmean (mean air temperature), and Prec (precipitation) after the gap-filling procedure reported in Sect. 3.4. These time series are presented and discussed in Sects. 4 and 5.
3.3 Geoportal structure
Since the early 1990s, when the Pyramid Meteorological Network was created, the Ev-K2-CNR Committee has promoted the sharing of data collected from high-elevation AWSs. In 2014, the first data-sharing system was born, and it was called the SHARE (Station at High Altitude for Research on the Environment) geonetwork. The system collected data from 15 stations spread across four countries (Nepal, Pakistan, Italy, and Uganda). The system was designed for open data management, in line with international directives and standards for free access to environmental data. Furthermore, based on a customization of the geonetwork software system, a hierarchical database of the individual stations and sensors was created (Melis et al., 2013; Locci et al., 2014).
In the last 10 years, this web platform has been improved according to new digital standards and software releases. Furthermore, the publication of the station data was accompanied by a new webGIS platform to provide three services: (1) a structured metadata and data archive, (2) a simplified interface to provide access to AWS data, and (3) a dedicated webGIS platform for georeferenced data. The new geoportal is accessible at https://geoportal.mountaingenius.org/portal/ (last access: 1 September 2025).
An exclusive function provided by the geoportal is direct access to datasets and databases through a dedicated search data tab in the portal's main menu. Datasets acquired by the projects are stored in a PostgreSQL database management system (DBMS): registered geoportal users can query the data using the search data command, and on the results page it is possible to proceed to directly downloading the dataset in .csv format or directly consulting it in the form of tables and charts. All information provided by the portal is supplied with its corresponding metadata. The metadata database is the core of the system: only through metadata is it possible to search for and retrieve resources. The main search window allows us to search for any string occurrence in the metadata database: through the results page, it is possible to access the metadata sheet directly using a description of the resource. Here it is possible to retrieve the direct connection with datasets, with the possibility of a direct download of the supplied dataset according to the file format. Metadata and datasets are strictly related via a two-way connection.
3.4 Data gap-filling for temperature and precipitation time series
The Pyramid station has data gaps corresponding to approximately 10 % and 15 % for temperature and precipitation, respectively (Table 3). In this study, we applied the same gap-filling method (quantile mapping) used for missing data in Salerno et al. (2015) but extended the time series to 2023. All of the stations belonging to the network were tested and used to fill the gaps according to a priority criterion based on the degree of correlation among the data. AWS1 was chosen as the reference station given the length of the time series and the fact that it is currently still operating. The selected filling method is a simple regression analysis based on quantile mapping (e.g., Déqué, 2007; Themeßl et al., 2012). This regression method has been preferred to more complex techniques, such as the fuzzy-rule-based approach (Abebe et al., 2000) or artificial neural networks (Coulibaly and Evora, 2007; Abudu et al., 2010), considering the peculiarity of this case study where all stations are located in the same valley (Khumbu Valley). This aspect confines the variance among the stations to the elevational gradient of the considered variable, which can easily be reproduced by the stochastic link created by the quantile mapping method. In case all stations registered a simultaneous gap, we applied a multiple imputation technique (Schneider, 2001) that uses other proxy variables to fill in the remaining missing data. The uncertainty introduced by the filling process on Sen's slope (SS) was estimated through a Monte Carlo uncertainty analysis. Details of the reconstruction procedure and the computation of the associated uncertainty are provided in Salerno et al. (2015).
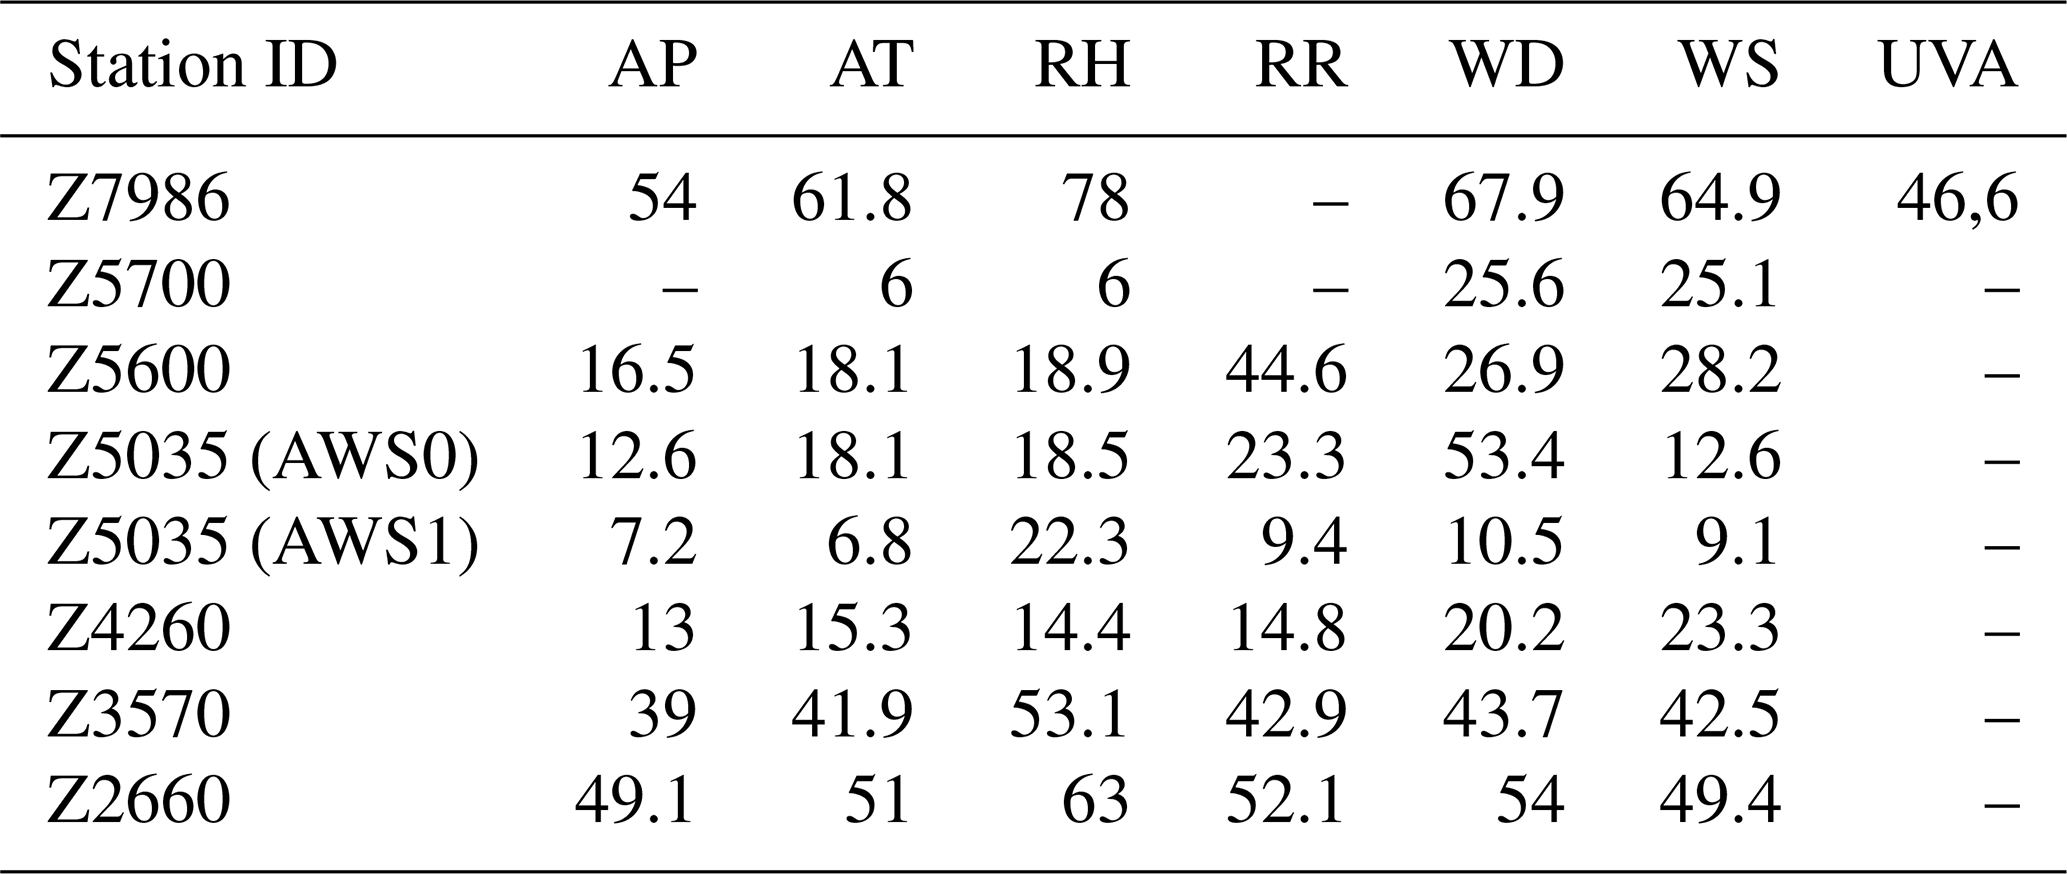
Table 3Percentage of daily missing data for each variable: AT (°C), RR (mm), RH (%), AP (hPa), WS (m s−1), and WD (°). The Z naming convention relates to the elevation of each station.
3.5 Statistical analyses
In this study, we applied the Mann–Kendall test (MK, Kendall, 1990) at the monthly scale (after daily data aggregation) to analyze the nonstationarity of the meteorological data. This test is widely adopted to assess significant trends in hydrometeorological time series (Guyennon et al., 2013). The MK test is nonparametric and thus less sensitive to extreme sample values, and it is independent of the hypothesis of the nature of the trend (linear or not). The MK test verifies the assumption of the stationarity of the investigated series by ensuring that the associated normalized Kendall tau-b coefficient, μ(τ), is included within the confidence interval for a given significance level (for α = 5 %, μ(τ) is below −1.96 and above 1.96). We used the SS proposed by Sen (1968) as a robust linear regression allowing the quantification of the potential trends revealed by the MK test. The significance level is established for p < 0.05. We defined a slight significance for p < 0.10. The uncertainty associated with the SS (1994–2013) is estimated through a Monte Carlo uncertainty analysis (James and Oldenburg, 1997). In the sequential form (seqMK) of μ(τ), the test is applied forward starting from the oldest values (progressive trend) and backward starting from the most recent values (retrograde trend). The crossing period allows us to identify the approximate starting point of the trend. In this study, we applied seqMK to monthly vectors. To monitor the seasonal nonstationarity, we reported the monthly progressive μ(τ) using a pseudo color code, where warm colors represent positive slopes and cold colors negative ones.
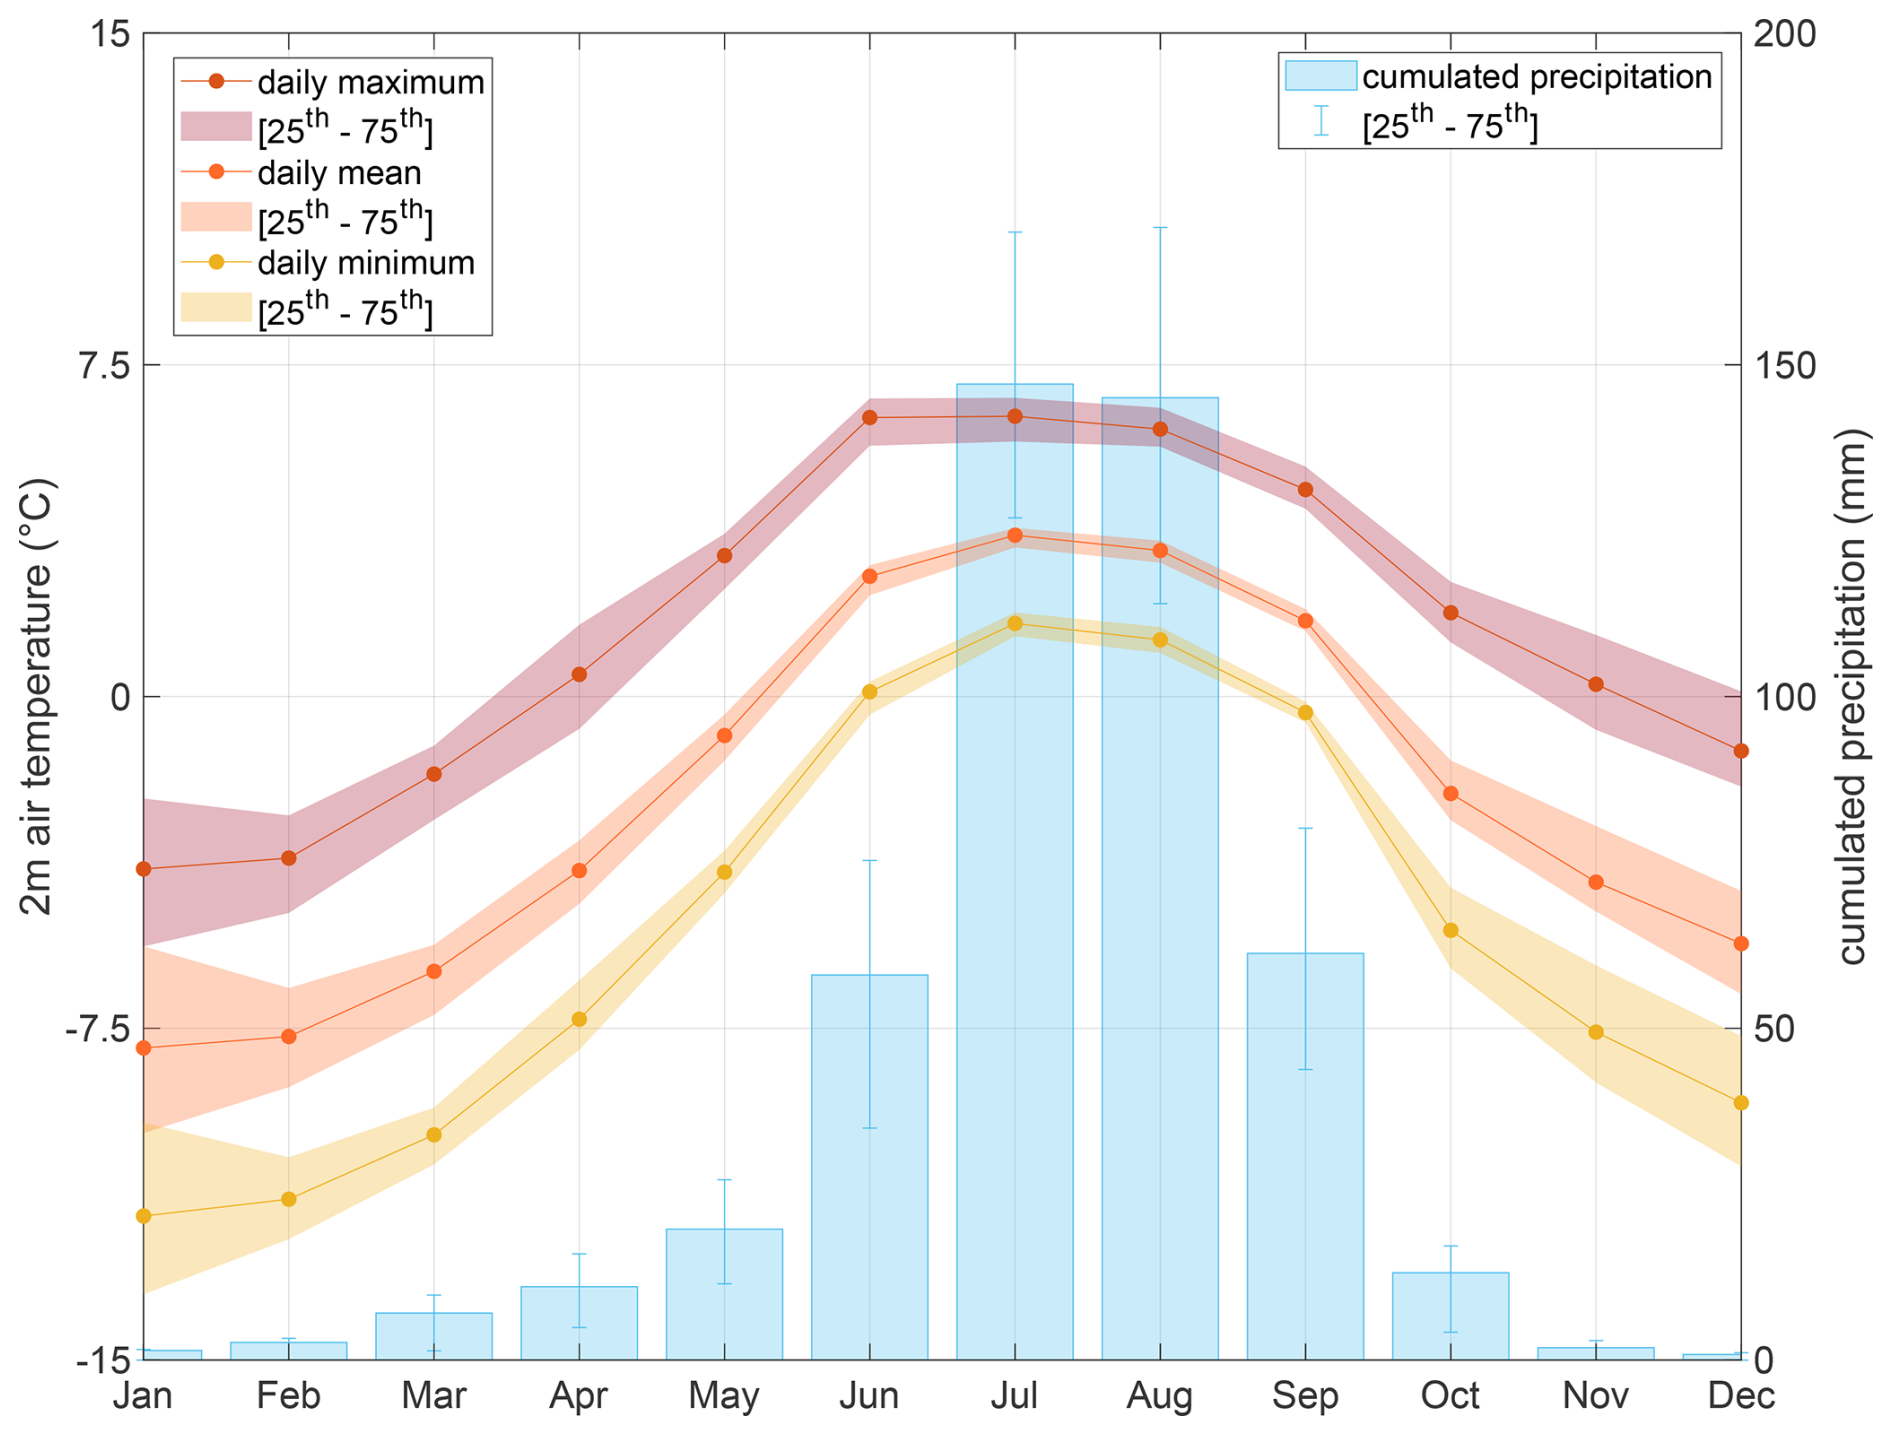
Figure 4Mean monthly cumulative precipitation and minimum, maximum, and mean temperatures at the Pyramid station (5035 ; reference period 1994–2023).
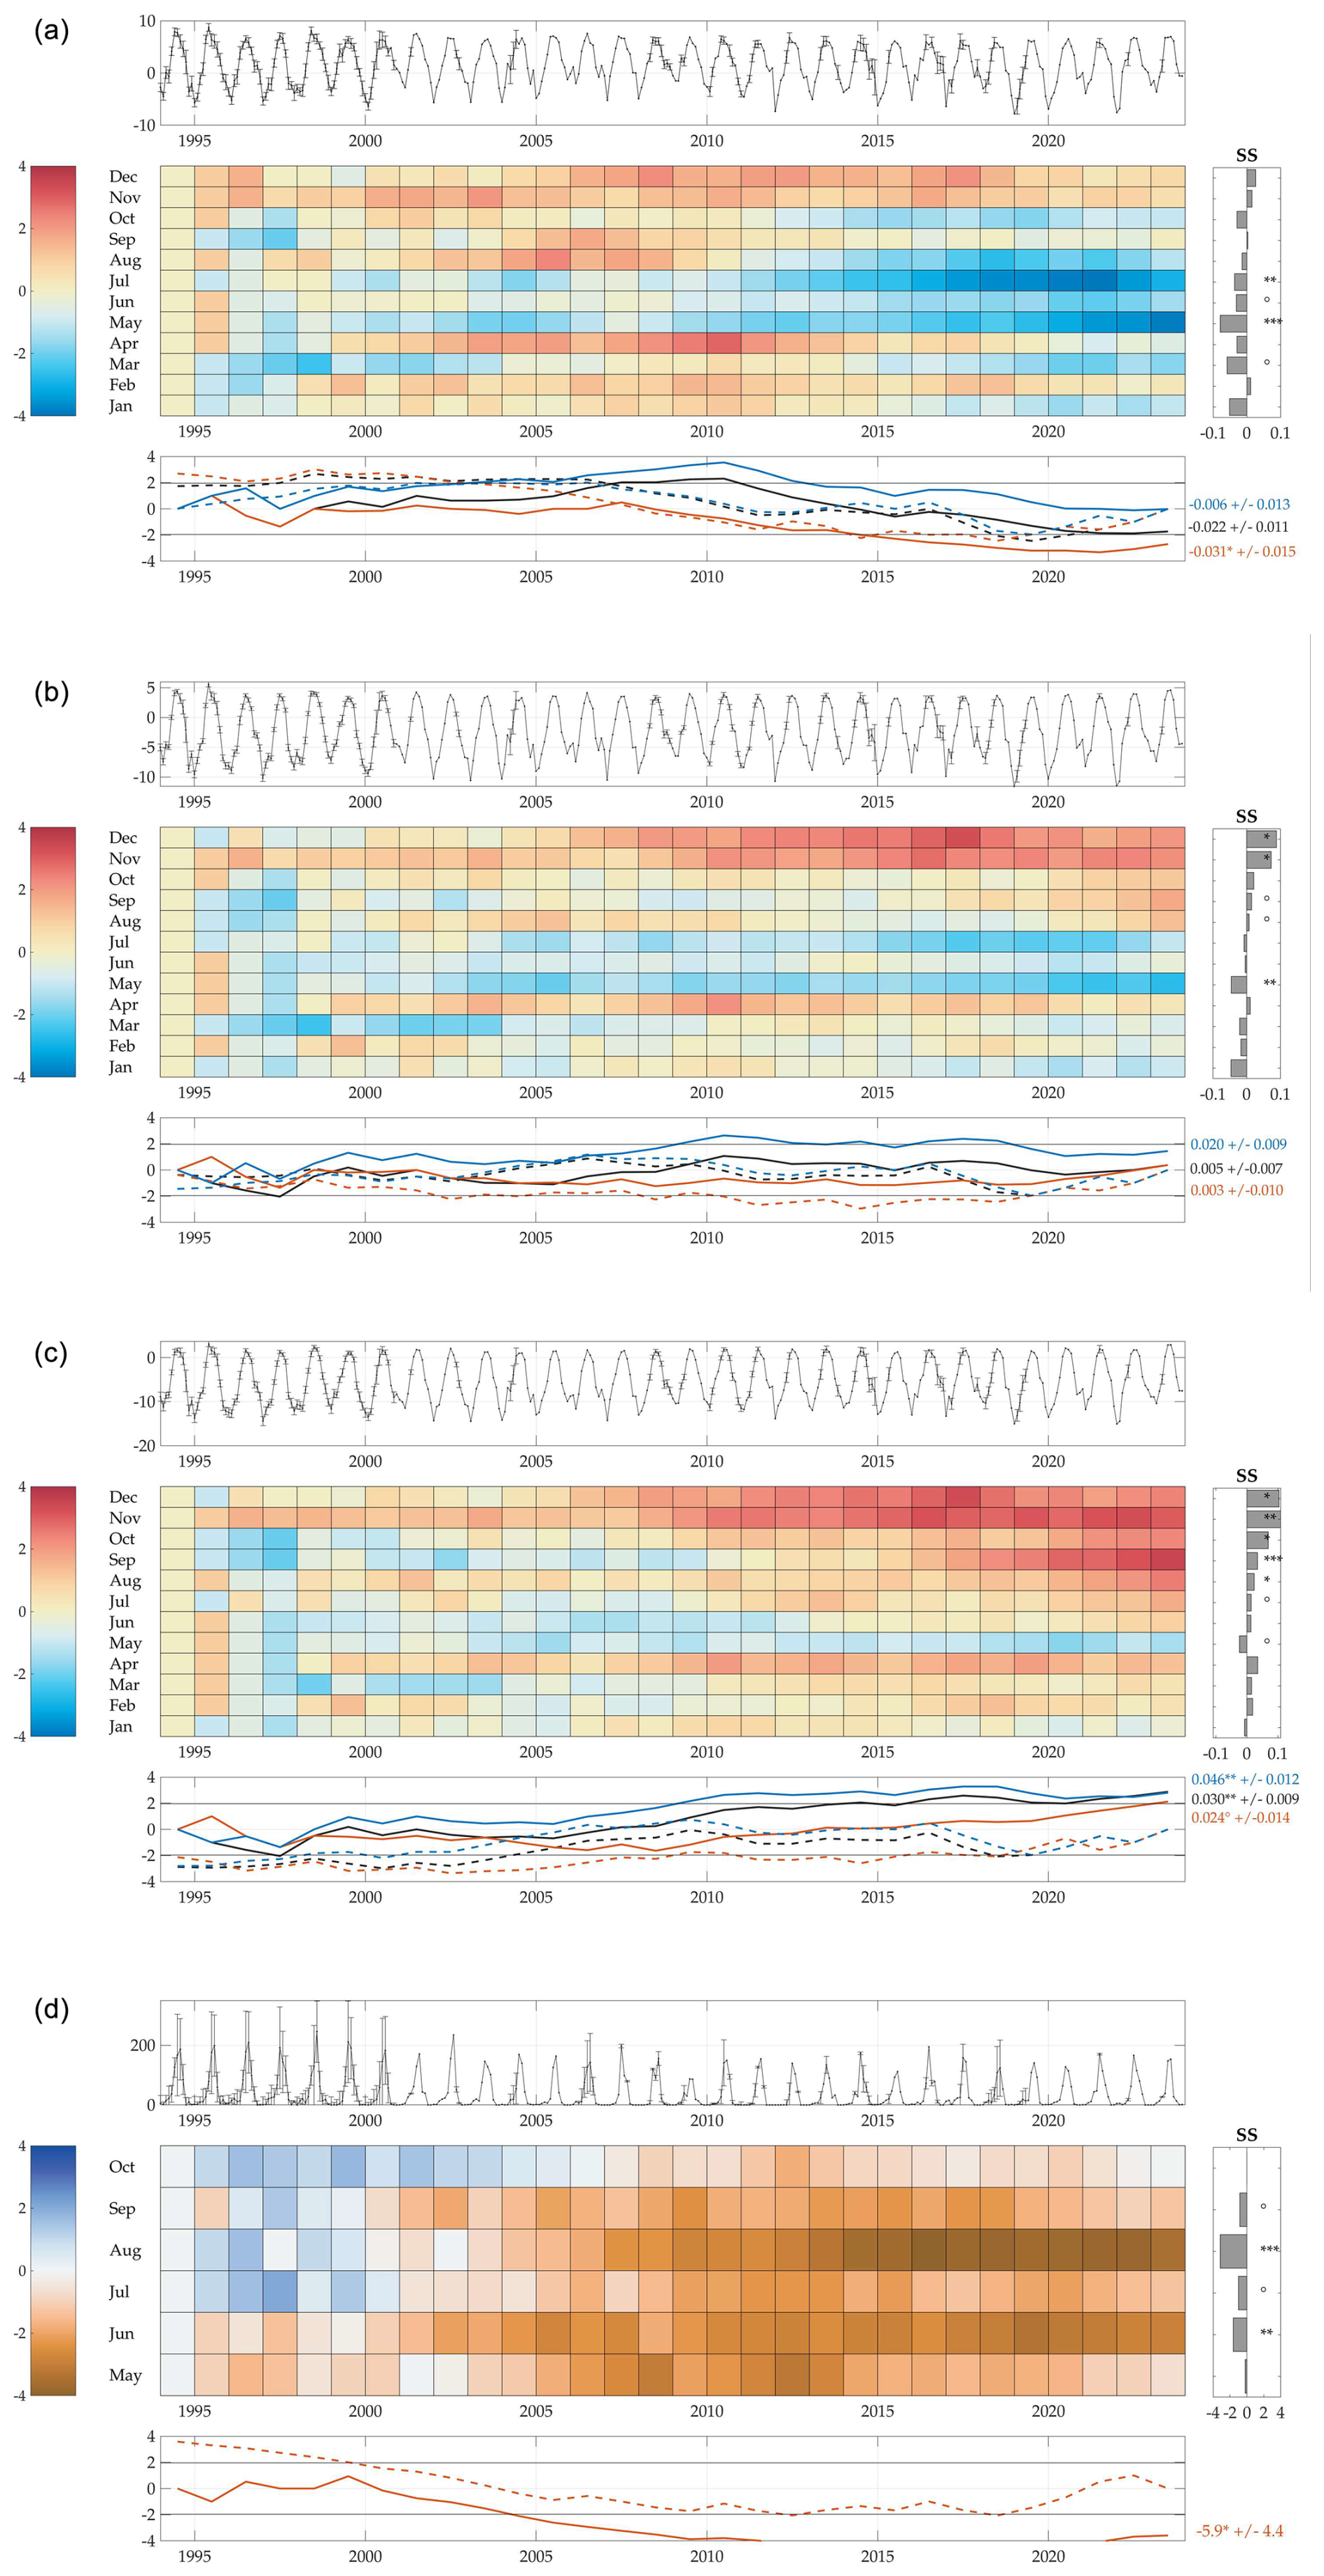
Figure 5Air temperature and precipitation trend analysis at the Pyramid station (5035 ): (a) maximum temperature, (b) mean temperature, (c) minimum temperature, and (d) total precipitation. The top graph of each meteorological variable (from panel a to panel d) shows the monthly time series. The grids display the results of the MK test applied at the monthly scale and calculated from the beginning of the series to the given year. The color bar represents the normalized Kendall tau coefficient μ (τ). The color tones below −1.96 and above 1.96 are significant (α = 5 %). On the right are the monthly Sen slope (SS) and the significance levels for 1994–2023 (° p < 0.1, ∗ p < 0.05, p < 0.01, and p < 0.001). The bottom graph plots show the progressive μ (τ) (solid lines) and retrograde (dotted line) of the seqMK test (calculated from the beginning or end, respectively, of the series to the given year) for the cold season (November–April) (blue), the warm season (May–October) (orange), and the entire year (black). For each year, below-zero lines indicate negative trends (calculated from 1994).
At 5035 , the precipitation is concentrated in the period June–September (87.7 %, Fig. 4), and, considering that the minimum daily temperature during these months is above +0 °C, the probability of snowfall is very low. According to Salerno et al. (2015), the underestimation of precipitation falling as snow during the remaining months is likely below 20 %. Sustained by these analysis results, we performed the precipitation trend analysis, focusing on the warmest months (Fig. 5d).
4.1 Trend analysis at high elevation
Figure 5 shows the reconstructed Pyramid time series for Tmin, Tmax, Tmean, and Prec after the gap-filling procedure. These monthly time series for the 1994–2023 period are available at https://geoportal.mountaingenius.org/portal/ (last access: 1 September 2025). These data, until 2020, were presented in Salerno et al. (2023). In this paper, the last 3 years have been added to the time series, and here we present the results of 30 recent years (1994–2023).
4.1.1 Maximum air temperature (Tmax)
During the warm season (from May to October), Tmax shows a significant negative trend (−0.031 ± 0.015 °C yr−1, p < 0.05) as highlighted by the progressive μ(τ) trend reported in Fig. 5a (full line in orange). Increases (although not significant) are observed in November and December; generally, the cold season (from November to April) shows no trend (−0.006 ± 0.013 °C yr−1, p > 0.1) (full line in blue, Fig. 5a). On the annual scale, the trend is negative but not significant (−0.022 ± 0.011 °C yr−1, p > 0.1). The decreasing trend seems to have started in 2007 for the warm season, while in the previous years the negative trend was restricted to May–June–July only, whereas the cold months show trends starting to become less and less positive from 2011 (Fig. 5a).
4.1.2 Minimum air temperature (Tmin)
November (+0.06 °C yr−1, p < 0.05) and December (+0.08 °C yr−1, p < 0.01) present the highest increasing trend; i.e., both months experienced approximately +2.1 °C over 30 years (Fig. 5c). The cold season experienced a positive trend (0.046 ± 0.012 °C yr−1, p < 0.01) mainly concentrated in the post-monsoon period. As highlighted by the progressive μ(τ) trend in Fig. 5c (full line in blue), this trend started increasing in 2005. In the warm season, the trend is much lower (+0.024 ± 0.014 °C yr−1, p < 0.1), and it is negative in May. On the annual scale, the trend is positive (+0.030 ± 0.009 °C yr−1, p < 0.01).
4.1.3 Mean air temperature (Tmean)
Figure 5b presents intermediate conditions for Tmean. The cold season shows increasing trends, although these are not significant (0.020 ± 0.009 °C yr−1, p > 0.1), and only November and December rise significantly. In the warm season, there is no trend (0.003 ± 0.010 °C yr−1, p > 0.1), while the temperature in May decreases. Also considering the annual scale, there is no trend in the 30 recent years (0.005 ± 0.007 °C yr−1, p > 0.1).
4.1.4 Total precipitation (Prec)
In recent years, for all months of the warm season, an overall and strongly significant decreasing trend of Prec has occurred (Fig. 5d). Considering all of the periods, a continuous decreasing trend has occurred since 2000, which became significant at the beginning of 2005. The decreasing Prec trend is highest in August. During the warm season, the reduction in precipitation has been 5.9 ± 4.4 mm yr−1 (i.e., −41 %) (1994–2023).
Our measurements reveal a local diurnal cooling mainly occurring during the warm season (from May to October), which is in stark contrast to the postulated temperature increases. An interpretation of this phenomenon was provided recently by Salerno et al. (2023). Thus, through the use of this unique dataset and the consistent acquisition of measurements in such a logistically complex area, we managed to provide new insights into the climate dynamics at the highest Himalayan elevations, which would not have been possible by relying solely on climatic data from lower elevations.
All datasets described and presented in this paper can be accessed freely at https://geoportal.mountaingenius.org/portal/ (last access: 1 September 2025). Moreover, the dataset can be downloaded from https://doi.org/10.5281/zenodo.15211352 (Salerno et al., 2024) and distributed under the CC BY 4.0 license.
Glaciers in the Himalaya are a major focus of international research because of their relevance for water and people, their role in climate–land feedbacks, and their iconic (and not entirely understood) patterns of changes. One of the major drawbacks of Himalayan research into the cryosphere is that there are almost no long-term climate measurements at high elevations, where the glaciers are located. Here, we presented meteoclimatic data acquired by seven meteorological stations belonging to the Pyramid Meteorological Network managed by EV-K2-CNR. In this framework, we presented precipitation and temperature time series based on a 3-decade effort to ensure continuous monitoring of the high-elevation climate in the Himalaya.
We are convinced that making these data available will open new perspectives on climate change and its effects in the Himalaya that will guide research at high elevations in the coming decades.
The supplement related to this article is available online at https://doi.org/10.5194/essd-17-4293-2025-supplement.
FS, NG, and NC drafted the article. GT contributed to improving the manuscript. MTM and FD built the Geonetwork platform. NG conducted the data quality assessment. GV and KB were responsible for the management of the weather stations.
The contact author has declared that none of the authors has any competing interests.
Publisher's note: Copernicus Publications remains neutral with regard to jurisdictional claims made in the text, published maps, institutional affiliations, or any other geographical representation in this paper. While Copernicus Publications makes every effort to include appropriate place names, the final responsibility lies with the authors.
This article is part of the special issue “Hydrometeorological data from mountain and alpine research catchments”. It is not associated with a conference.
We are grateful to the editor and the three reviewers, who provided valuable feedback and input during the discussion of this paper.
The Pyramid Meteorological Network was supported by the MIUR (Ministero dell'Istruzione e del Merito) through Ev-K2-CNR/SHARE and the CNR-DTA/NEXTDATA project within the framework of Ev-K2-CNR and the Nepal Academy of Science and Technology (NAST). Nicola Colombo was supported by the NODES project, which received funding from MUR–M4C2 1.5 of PNRR funded by the European Union – NextGeneration EU (grant no. ECS00000036).
This paper was edited by Tobias Gerken and reviewed by Emily Potter, Signe Hillerup Larsen, and one anonymous referee.
Abebe, A., Solomatine, D., and Venneker, R.: Application of adaptive fuzzy rule based models for reconstruction of missing precipitation events, Hydrolog. Sci. J., 45, 425–436, https://doi.org/10.1080/02626660009492339, 2000.
Abudu, S., Bawazir, A. S., and King, J. P.: Infilling missing daily evapotranspiration data using neural networks, J. Irrig. Drain. E-ASCE, 136, 317–325, https://doi.org/10.1061/(ASCE)IR.1943-4774.0000197, 2010.
Amatya, L. K., Cuccillato, E., Haack, B., Shadie, P., Sattar, N., Bajracharya, B., Shrestha, B. Caroli, P., Panzeri, D., Basani, M., Schommer, B., Flury, B. Salerno, F., and Manfredi, E. C.: Improving communication for management of social-ecological systems in high mountain areas: Development of methodologies and tools – The HKKH Partnership Project, Mt. Res. Dev., 30, 69–79, https://doi.org/10.1659/MRD-JOURNAL-D-09-00084.1, 2010.
Bertolani L., Bollasina, M., and Tartari, G.: Recent biannual variability of meteorological features in the Eastern Highland Himalayas, Geophys. Res. Lett., 27, 2185–2188, https://doi.org/10.1029/1999GL011198, 2000.
Bhattacharya, A., Bolch, T., Mukherjee, K., King, O., Menounos, B., Kapitsa, V., Neckel, N., Yang, W., and Yao, T.: High Mountain Asian glacier response to climate revealed by multi-temporal satellite observations since the 1960s, Nat. Commun., 12, 4133., https://doi.org/10.1038/s41467-021-24180-y, 2021.
Bhuju, D. R., Carrer, M., Gaire, N. P., Soraruf, L., Riondato, R., Salerno, F., and Maharjan, S. R.: Dendroecological study of high altitude forest at Sagarmatha National Park, Nepal. Contemporary research in Sagarmatha (Mt. Everest) region, Nepal, Nepal Academy of Science and Technology, edited by: Jha, P. K., and Khanal, I. P., Khumaltar, Latipur, 119–130, 2010.
Biemans, H., Siderius, C., Lutz, A. F., Nepal, S., Ahmad, B., Hassan, T., von Bloh, W., Wijngaard, R. R., Wester, P., Shrestha, A. B., and Immerzeel, W. W.: Importance of snow and glacier meltwater for agriculture on the Indo-Gangetic Plain, Nat. Sustain., 2, 594–601, https://doi.org/10.1038/s41893-019-0305-3, 2019.
Coulibaly, P. and Evora, N.: Comparison of neural network methods for infilling missing daily weather records, J. Hydrol., 341, 27–41, https://doi.org/10.1016/j.jhydrol.2007.04.020, 2007.
Déqué, M.: Frequency of precipitation and temperature extremes over France in an anthropogenic scenario: model results and statistical correction according to observed values, Global Planet. Change, 57, 16–26, https://doi.org/10.1016/j.gloplacha.2006.11.030, 2007.
Guyennon, N., Romano, E., Portoghese, I., Salerno, F., Calmanti, S., Petrangeli, A. B., Tartari, G., and Copetti, D.: Benefits from using combined dynamical-statistical downscaling approaches – lessons from a case study in the Mediterranean region, Hydrol. Earth Syst. Sci., 17, 705–720, https://doi.org/10.5194/hess-17-705-2013, 2013.
Ichiyanagi, K., Yamanaka, M. D., Muraji, Y., and Vaidya, B. K.: Precipitation in Nepal between 1987 and 1996, Int. J. Climatol., 27, 1753–1762, https://doi.org/10.1002/joc.1492, 2007.
James, A. L. and Oldenburg, C. M.: Linear and Monte Carlo uncertainty analysis for subsurface contaminant transport simulation, Water Resour. Res., 33, 2495–2508, https://doi.org/10.1029/97WR01925, 1997.
Kendall, M. G.: Rank Correlation Methods, Oxford University Press, New York, ISBN 0195208374, 1990.
Lin, C., Yang, K., Chen, D., Guyennon, N., Balestrini, R., Yang, X., Acharya, S., Ou, T., Yao, T., Tartari, G., and Salerno, F.: Summer afternoon precipitation associated with wind convergence near the Himalayan glacier fronts, Atmos. Res., 259, 105658, https://doi.org/10.1016/j.atmosres.2021.105658, 2021.
Locci, F., Melis, M. T., Dessì, F., Stocchi, P., Akinde, M. O., Bønes, V., Bonasoni, P., and Vuillermoz, E.: Implementation of a webGIS service platform for high mountain climate research: the SHARE GeoNetwork project, Geosci. Data J., 1, 140–157, https://doi.org/10.1002/gdj3.14, 2014.
Magnani, A., Ajmone-Marsan, F., D'Amico, M., Balestrini, R., Viviano, G., Salerno, F., and Freppaz, M.: Soil properties and trace elements distribution along an altitudinal gradient on the southern slope of Mt. Everest, Nepal, Catena, 162, 61–71, https://doi.org/10.1016/j.catena.2017.11.015, 2018.
Matthews, T., Perry, B., Khadka, A., Sherpa, T. G., Shrestha, D., Aryal, D., and Alexiev, N.: Weather observations reach the summit of Mount Everest, B. Am. Meteorol. Soc., 103, E2827–E2835, 2022.
Melis, M. T., Dessì, F., Locci, F., Bonasoni, P., and Vuillermoz, E.: Share Geonetwork: a web-service platform for environmental data sharing, Proc. SPIE 8795, First International Conference on Remote Sensing and Geoinformation of the Environment (RSCy2013), 87951V, Paphos, Cyprus, 5 August 2013, https://doi.org/10.1117/12.2027602, 2013.
Pandey, J., Sigdel, S. R., Lu, X., Salerno, F., Dawadi, B., Liang, E., and Camarero, J. J.: Early growing-season precipitation drives radial growth of alpine juniper shrubs in the central Himalayas, Geogr. Ann. A, 102, 317–330, https://doi.org/10.1080/04353676.2020.1761097, 2020.
Pepin, N., Bradley, R. S., Diaz, H. F., Baraer, M., Caceres, E. B., Forsythe, N., Fowler, H., Greenwood, G., Hashmi, M. Z., Liu, X. D., Miller, J. R., Ning, L., Ohmura, A., Palazzi, E., Rangwala, I., Schöner, W., Severskiy, I., Shahgedanova, M., Wang, M. B., Williamson, S. N. and Yang, D. Q.: Elevation-dependent warming in mountain regions of the world, Nat. Clim. Change, 5, 424–430, https://doi.org/10.1038/nclimate2563, 2015.
Potter, E. R., Orr, A., Willis, I. C., Bannister, D., and Salerno, F.: Dynamical drivers of the local wind regime in a Himalayan valley, J. Geophys. Res.-Atmos., 123, 13186–13202, https://doi.org/10.1029/2018JD029427, 2018.
Salerno, F., Cuccillato, E., Caroli, P., Bajracharya, B., Manfredi, E. C., Viviano, G., Thakuri, S., Flury, B., Basani, M., Giannino, F., and Panzeri, D.: Experience with a hard and soft participatory modeling framework for social ecological system management in Mount Everest (Nepal) and K2 (Pakistan) protected areas, Mt. Res. Dev., 30, 80–93, https://doi.org/10.1659/MRD-JOURNAL-D-10-00014.1, 2010.
Salerno, F., Guyennon, N., Thakuri, S., Viviano, G., Romano, E., Vuillermoz, E., Cristofanelli, P., Stocchi, P., Agrillo, G., Ma, Y., and Tartari, G.: Weak precipitation, warm winters and springs impact glaciers of south slopes of Mt. Everest (central Himalaya) in the last 2 decades (1994–2013), The Cryosphere, 9, 1229–1247, https://doi.org/10.5194/tc-9-1229-2015, 2015.
Salerno, F., Thakuri, S., Tartari, G., Nuimura, T., Sunako, S., Sakai, A., and Fujita, K.: Debris-covered glacier anomaly? Morphological factors controlling changes in the mass balance, surface area, terminus position, and snow line altitude of Himalayan glaciers, Earth Planet. Sc. Lett., 471, 19–31, https://doi.org/10.1016/j.epsl.2017.04.039, 2017.
Salerno, F., Guyennon, N., Yang, K., Shaw, T. E., Lin, C., Colombo, N., Romano, E., Gruber, S., Bolch, T., Alessandri, A., Cristofanelli, P., Putero, D., Diolaiuti, G., Tartari, G., Verza, G., Thakuri, S., Balsamo, G., Miles, E. S. and Pellicciotti, F.: Local cooling and drying induced by Himalayan glaciers under global warming, Nat. Geosci., 16, 1120–1127, https://doi.org/10.1038/s41561-023-01331-y, 2023.
Salerno, F., Guyennon, N., Colombo, N., Melis, M. T., Dessì, F. G., Verza, G., Bista, K., Sheharyar, A., and Tartari, G.: Pyramid Meteorological Network – EVK2CNR (Version 1), Zenodo [data set], https://doi.org/10.5281/zenodo.15211352, 2024.
Schneider, T.: Analysis of incomplete climate data: Estimation of mean values and covariance matrices and imputation of missing values, J. Climate, 14, 853–871, https://doi.org/10.1175/1520-0442(2001)014<0853:AOICDE>2.0.CO;2, 2001.
Sen, P. K.: Estimates of the regression coefficient based on Kendall's Tau, J. Am. Stat. Assoc., 63, 1379–1389, https://doi.org/10.1080/01621459.1968.10480934, 1968.
Shea, J. M., Immerzeel, W. W., Wagnon, P., Vincent, C., and Bajracharya, S.: Modelling glacier change in the Everest region, Nepal Himalaya, The Cryosphere, 9, 1105–1128, https://doi.org/10.5194/tc-9-1105-2015, 2015.
Sigdel, S. R., Pandey, J., Liang, E., Muhammad, S., Babst, F., Leavitt, S. W., Shen, M., Zhu, H., Salerno, F., Piao, S., Camarero, J. J., and Peñuelas, J.: No benefits from warming even for subnival vegetation in the central Himalayas, Sci. Bull., 66, 1825–1829, 2021.
Tartari, G., Salerno, F., Buraschi, E., Bruccoleri, G., and Smiraglia, C.: Lake surface area variations in the North-Eastern sector of Sagarmatha National Park (Nepal) at the end of the 20th Century by comparison of historical maps, J. Limnol., 67, 139–154, https://doi.org/10.4081/jlimnol.2008.139, 2008.
Thakuri, S., Salerno, F., Smiraglia, C., Bolch, T., D'Agata, C., Viviano, G., and Tartari, G.: Tracing glacier changes since the 1960s on the south slope of Mt. Everest (central Southern Himalaya) using optical satellite imagery, The Cryosphere, 8, 1297–1315, https://doi.org/10.5194/tc-8-1297-2014, 2014.
Thakuri, S., Salerno, F., Bolch, T., Guyennon, N., and Tartari, G.: Factors controlling the accelerated expansion of Imja Lake, Mount Everest region, Nepal, Ann. Glaciol., 57, 245–257., 2016.
Themeßl, M. J., Gobiet, A., and Heinrich, G.: Empirical-statistical downscaling and error correction of regional climate models and its impact on the climate change signal, Climatic Change, 112, 449–468, https://doi.org/10.1007/s10584-011-0224-4, 2012.
The GlaMBIE Team: Community estimate of global glacier mass changes from 2000 to 2023, Nature, 639, 382–388, https://doi.org/10.1038/s41586-024-08545-z, 2025.
Ueno, K., Toyotsu, K., Bertolani, L., and Tartari, G.: Stepwise onset of monsoon weather observed in the Nepal Himalaya, Mon. Weather Rev., 136, 2507–2522, https://doi.org/10.1175/2007MWR2298.1, 2008.
Yang, K., Guyennon, N., Ouyang, L., Tian, L., Tartari, G., and Salerno, F.: Impact of summer monsoon on the elevation-dependence of meteorological variables in the south of central Himalaya, Int. J. Climatol., 38, 1748–1759, https://doi.org/10.1002/joc.5293, 2018.
Yao, T., Bolch, T., Chen, D., Gao, J., Immerzeel, W., Piao, S., Su, F., Thompson, L., Wada, Y., Wang, L., Wang, T., Wu, G., Xu, B., Yang, W., Zhang, G., and Zhao, P.: The imbalance of the Asian water tower, Nat. Rev. Earth Environ., 3, 618–632, https://doi.org/10.1038/s43017-022-00299-4, 2022.
Wagnon, P., Brun, F., Khadka, A., Berthier, E., Shrestha, D., Vincent, C., Arnaud, Y., Six, D., Dehecq, A., Ménégoz, M., and Jomelli, V.: Reanalysing the 2007–19 glaciological mass-balance series of Mera Glacier, Nepal, Central Himalaya, using geodetic mass balance, J. Glaciol., 67, 117–125, https://doi.org/10.1017/jog.2020.88, 2021.
- Abstract
- Introduction
- Region of investigation
- Data and methods
- Results of the reconstructed time series
- Discussion of the reconstructed time series
- Data availability
- Conclusion
- Author contributions
- Competing interests
- Disclaimer
- Special issue statement
- Acknowledgements
- Financial support
- Review statement
- References
- Supplement