the Creative Commons Attribution 4.0 License.
the Creative Commons Attribution 4.0 License.
 | 03 Sep 2025
Soil hydraulic and hydrological data from seven field sites in the Thames catchment, UK, 2021
John Robotham
Emily Trill
Ponnambalam Rameshwaran
Peter Scarlett
Gareth Old
Joanna Clark
Observational data on soil physical and hydraulic properties are important for improving our understanding of hydrological processes. This is particularly relevant given current interest in the potential of land-based “natural flood management” measures (and related concepts: “nature-based solutions” and “working with natural processes”) to reduce flood risk. Therefore, a detailed survey of seven field sites under different land uses and management practices in the Thames catchment, UK, was undertaken as part of the LANDWISE project. Measurements (n = 1300) included soil surface infiltration rate, saturated hydraulic conductivity, bulk density, estimated porosity, soil moisture, and soil moisture retention. Field sites comprised three arable fields on shallow soils over limestone, two arable fields on free-draining loamy soils over chalk, and permanent grassland and broadleaf woodland on slowly permeable soil over mudstone. Soil sampling points covered infield areas, trafficked areas (e.g. tramlines), and untrafficked margins. Samples were generally taken at five depths ranging from the soil surface to 100 cm below ground level. Soil saturated hydraulic conductivity measurements were made at 25 and 45 cm depths. Soil samples and measurements were taken between April and October 2021, with repeats taken pre- and post-harvest (arable sites). These data provide valuable insight into the hydrological behaviour of soils under contrasting management, including both conventional and innovative agricultural practices (e.g. herbal leys, mob grazing, and controlled traffic). Dataset applications include improving the performance of hydrological and land surface models and validation of remotely sensed soil observations. The dataset is publicly available at https://doi.org/10.5285/a32f775b-34dd-4f31-aafa-f88450eb7a90 (Trill et al., 2022).
- Article
(4895 KB) - Full-text XML
-
Supplement
(298 KB) - BibTeX
- EndNote


The physical and hydraulic properties of soil play crucial roles in controlling the extent to which soils are able to absorb, store, and transmit water (Cleophas et al., 2022; Vogelmann et al., 2013; Nimmo, 2005). Such properties include soil texture, porosity, pore size distribution and connectivity, soil moisture retention, and hydraulic conductivity. These properties, together with antecedent soil moisture conditions, exert a critical control on the partitioning of rainfall into infiltration and runoff, with implications for flood risk. They are also important in determining the fate of pollutants and the accessibility of water for plants and crops, thus affecting a range of ecosystem services and biogeochemical processes (Indoria et al., 2020; Fu et al., 2021). Previous studies have shown how soil hydraulic properties can exhibit high spatial variability at regional, catchment, and even field scales (Usowicz and Lipiec, 2021; Peck et al., 1977). This makes observational data on such properties valuable for improving our understanding of hydrological processes and also for being able to accurately represent these processes within models. Soil hydraulic properties have been widely used in pedotransfer functions which relate these properties to more easily determined properties such as soil texture (Lilly, 2000; Cooper et al., 2021; Schaap et al., 2001; Wösten et al., 1999; Hollis et al., 2015). This has helped to overcome some of the issues surrounding the scarcity of data on soil hydraulic properties and by doing so provide better model predictions of processes such as water flow and solute transport at larger scales (Vereecken et al., 2010). However, this does not negate the need for new observational data, particularly with respect to the influence of land use and management on soils and their hydrological functioning.
Over the past decades, growing concern over the need for sustainable agriculture and delivery of ecosystem services has led to greater interest in the effect of innovative land management on soil properties (Mihelič et al., 2020; Blanco-Canqui and Ruis, 2018; Haruna et al., 2018; Martínez-Mena et al., 2020; Terefe et al., 2020; Hartmann and Six, 2022; Page et al., 2020; Soane et al., 2012; Antille et al., 2019; Strudley et al., 2008). Land use and land management have been shown to influence belowground water storage and movement (Niu et al., 2015), as well as surface runoff generation processes (Germer et al., 2010). In terms of agriculture, the choice of cropping system (e.g. mixed cropping) has been shown to influence soil properties such as porosity (Haynes and Francis, 1990). There is evidence to suggest that modifying tillage practices can improve the soil hydro-physical properties (e.g. bulk density and hydraulic conductivity) of arable fields. For example, Singh et al. (2022) found that zero tillage showed the best potential to effectively reduce runoff generation when compared with conventional tillage and minimum tillage. Another area of concern for maintaining healthy soil on agricultural land is compaction and its impact on soil structure, particularly as a result of traffic from heavy machinery such as tractors (Wang et al., 2022). Innovative approaches such as controlled traffic farming aim to minimise potential soil compaction by confining it to specific areas and thereby reducing the overall area of a field subjected to farm traffic (Shaheb et al., 2021). There is evidence to suggest that applying such practices can help to restore soil structure, increase water-holding capacity and macropore density, and reduce bulk density (McHugh et al., 2009).
The LANDWISE (LAND management in loWland catchments for Integrated flood riSk rEduction) project aimed to evaluate the effectiveness of realistic and scalable land-based natural flood management (NFM) measures to reduce the risk from surface water, river, and groundwater flooding in lowland catchments. This research focussed on NFM solutions related to how land and soil are managed (e.g. crop choice and tillage practices) in order to fill gaps in the current knowledge surrounding their effect on soil hydrology and potential effectiveness for flood mitigation at different scales (Dadson et al., 2017). Measurements were made across different land uses, land management practices, and soil types within the Thames catchment, UK, to investigate infiltration and belowground water storage.
An initial LANDWISE broad-scale field survey measured a large sample (n=1836) of near-surface physical and hydrological soil properties across 164 fields/land parcels in the Thames catchment which represented four broad land use and management classes: arable with and without grass in the crop rotation, permanent grassland, and broadleaf woodland. These field locations also covered five generalised soil/geology classes and covered a range of conventional and innovative agricultural practices. Data and the details for the broad-scale survey are available separately from this paper; see Blake et al. (2022). Following on from the broad-scale campaign, a LANDWISE detailed field survey was undertaken to better understand the variability of soil properties with depth and over time. This paper describes the data collected during this detailed survey, which focussed on a subset of seven fields from the broad-scale study (Fig. 1). Key variables within the dataset include soil surface infiltration rate (n=117), saturated hydraulic conductivity (n=65), dry bulk density (n=543), estimated porosity (n=543), soil moisture (n=537), and soil moisture retention (n=38).
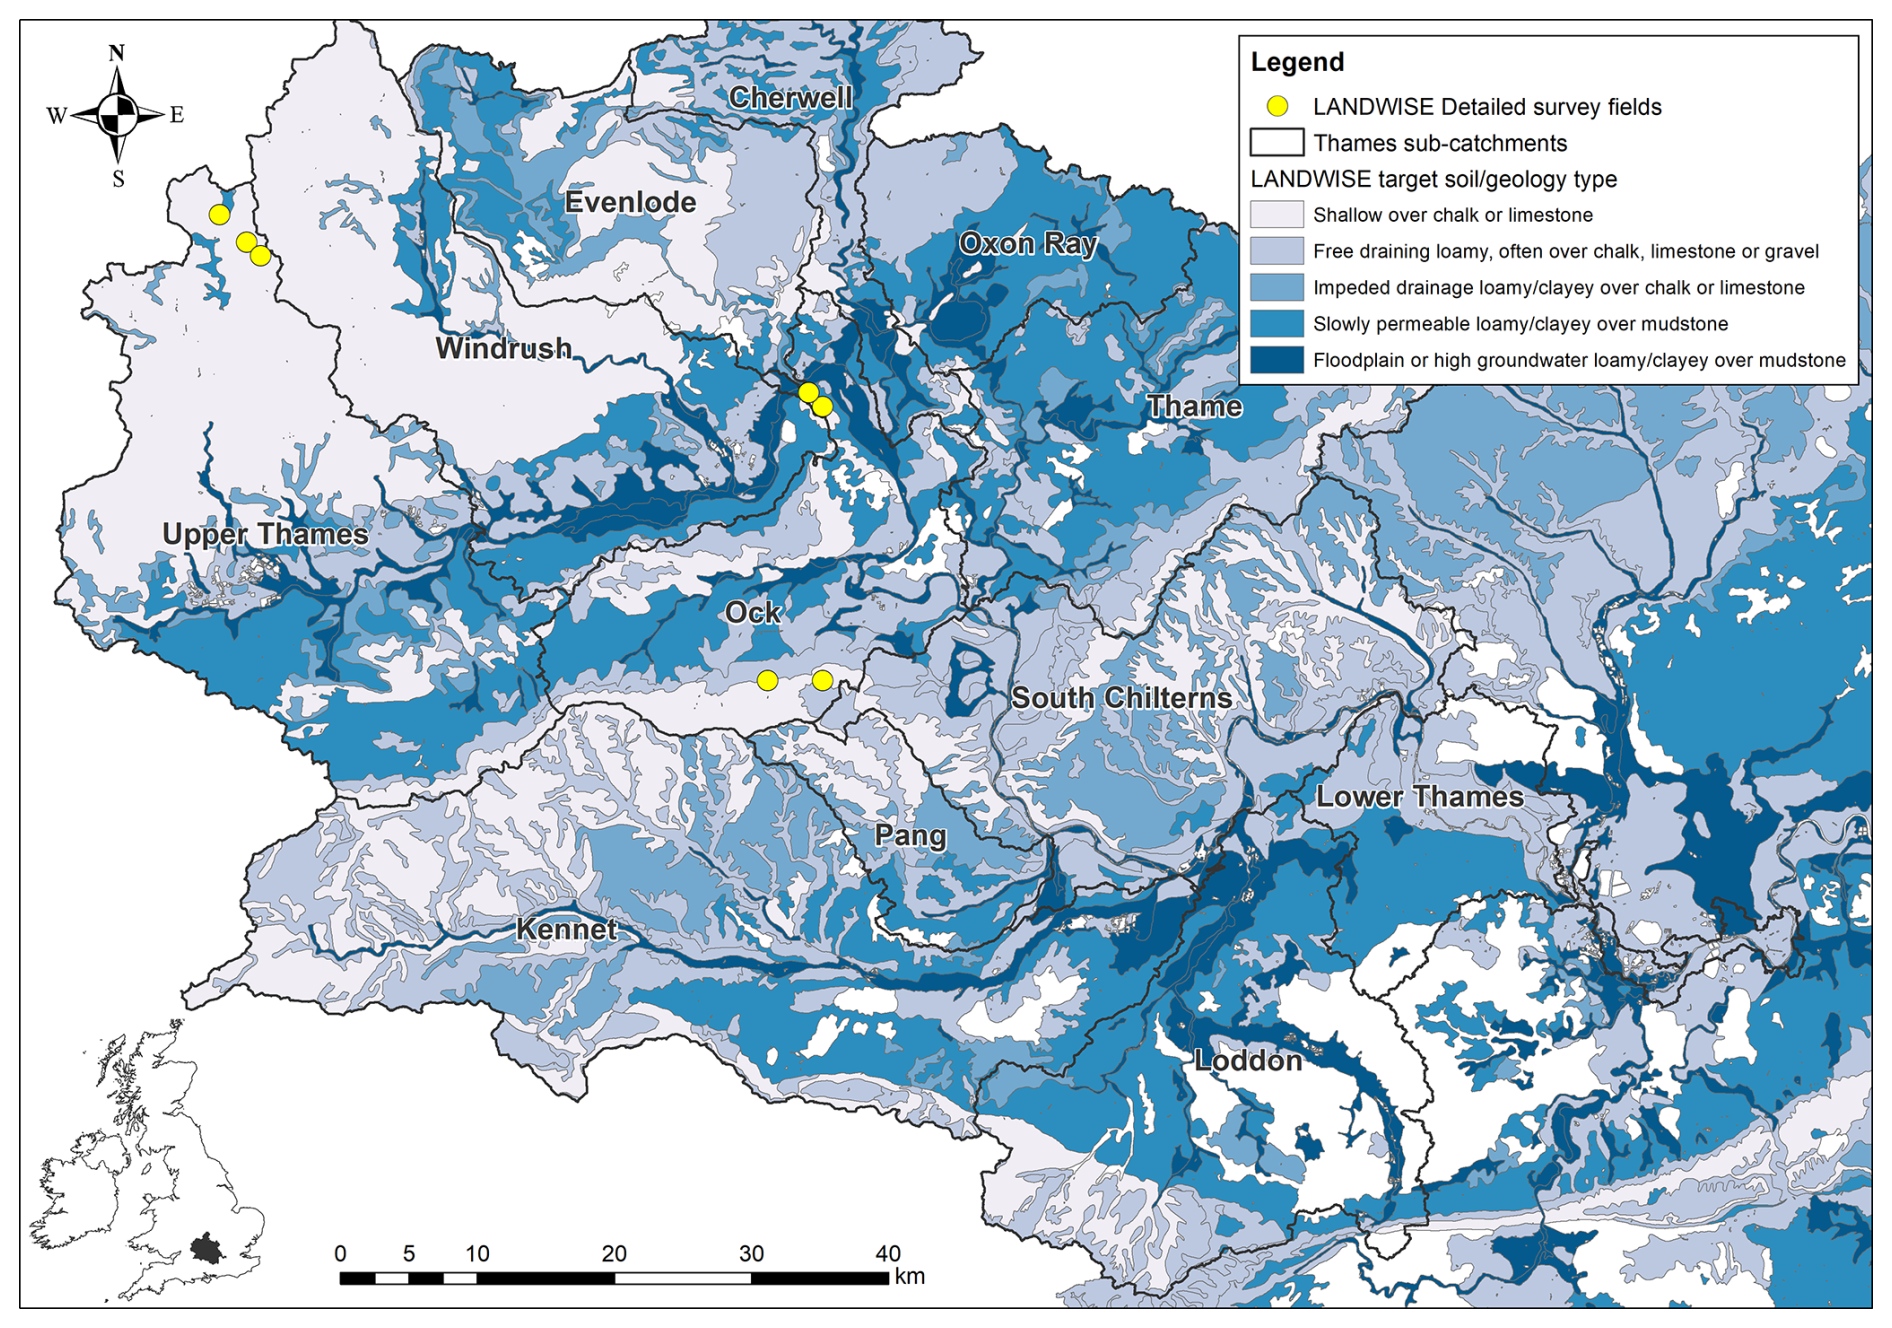
Figure 1Locations and soil/geology types of the LANDWISE detailed survey field sites within the Thames catchment, UK. Field locations are displayed to the nearest 1 km for participant anonymity purposes. See Table 1 for further details. Soil data © Cranfield University (NSRI) and for the controller of HMSO 2023. Map colours based on ColourBrewer: Color Advice for Maps (2023) by Cynthia A. Brewer, Geography, Pennsylvania State University.
2.1 Field sites
The seven LANDWISE detailed survey field sites were selected based on their soil type and underlying geology, land use, and management (as detailed in Table 1). Two field sites were located (on similar soil types, based on data from Blake et al., 2022) over mudstone, two over chalk, and three over limestone. Each of these site groupings allows for comparisons between land uses or types of management. The mudstone sites compare grazed permanent grassland and mature broadleaf woodland. The chalk sites compare arable rotations with and without controlled machinery traffic. The limestone sites compare conventional ploughed arable farming to no-till arable farming with grass or herbal leys in the rotation. For ease of reference herein, each survey site has been given a brief site/field name based on the underlying geology type, e.g. “Chalk 1”.
Table 1LANDWISE detailed survey field sites, showing location, land use, management, soil, and geology.
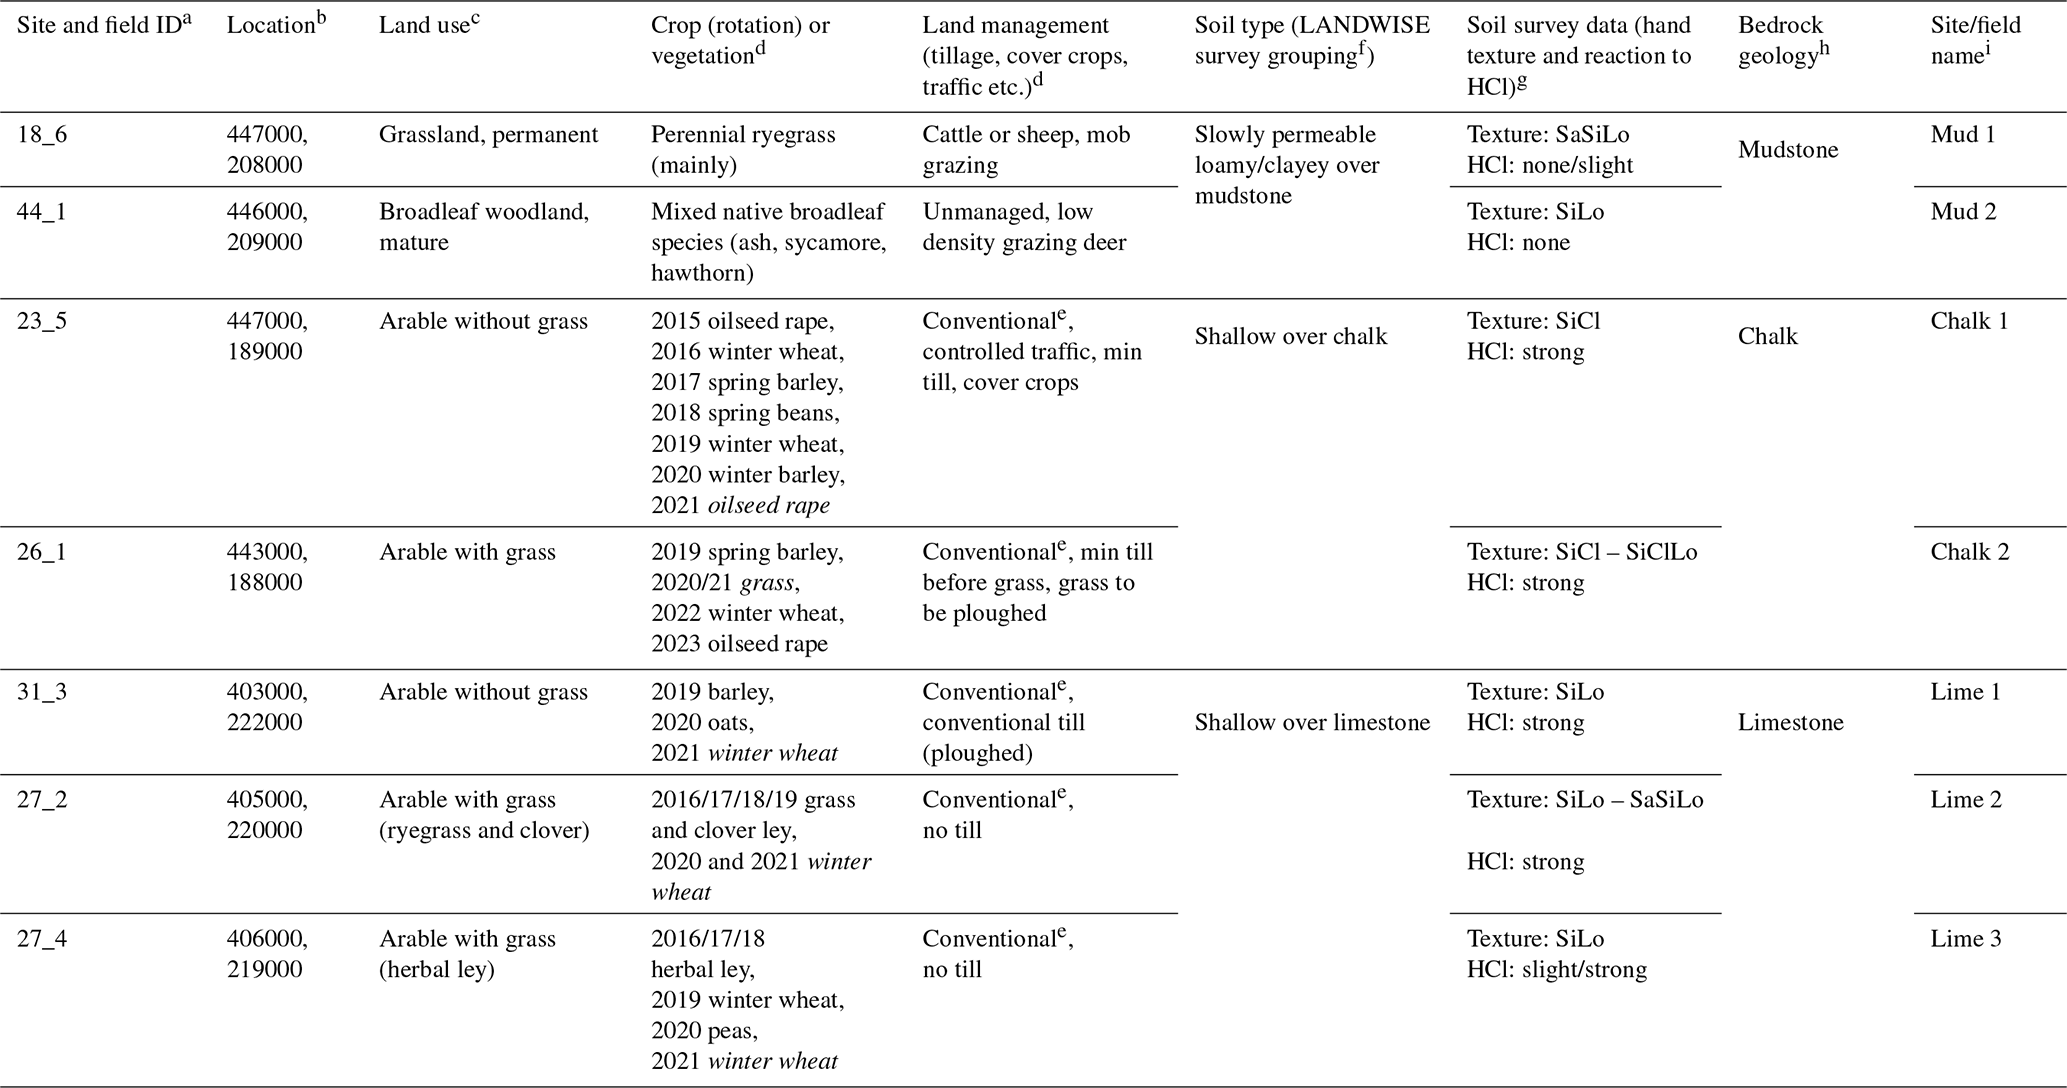
a ID code corresponding to “ID_SiteNo_FieldNo” in the dataset. b British National Grid Reference (easting, northing). Due to participant anonymity requirements, locations are given to the nearest 1 km. c LANDWISE target land use. d Data from land owner/manager survey and/or field observations. The crop during the period of sampling is italicised. e “Conventional” indicates non-organic farming. f LANDWISE survey soil types derived from Cranfield “Soilscapes” classes: soil data © Cranfield University (NSRI) and for the controller of HMSO 2023. g Additional soil data are dominant values from the LANDWISE broad-scale field survey (Blake et al., 2022). Soil texture class abbreviations: Sa(nd), Si(lt), Lo(am), Cl(ay). Reaction of soil to HCl (hydrochloric acid) was used to test for calcareous soil. Please see Blake et al. (2022) for further details of the methodology. h Indicative bedrock geology from DiGMapGB data at 1:625 000 scale: reproduced with the permission of the British Geological Survey © NERC. All rights reserved. i Brief site/field name for use in this paper.
2.2 Sampling strategy
The sampling strategy of the LANDWISE detailed survey was designed so that fields were sampled across multiple periods over an annual cycle. Table 2 lists the measurements made and the techniques used, along with the number of samples taken and when they were taken in the farming calendar.
Soil properties were measured along transects within fields at different location types that were categorised into TR (trafficked areas e.g. tramlines), IN (general infield areas), and UN (untrafficked field margins). Each of the three location types was sampled five times within each field, giving a total of 15 locations per field (see Fig. 2 for details). The UN sample transect was necessarily located along the field margin, with the two other transects offset into the field with 30 m spacing from both each other and from the UN transect. Transect locations and spacing were selected to avoid potentially excessively compacted soil in the vicinity of field gateways and to avoid sampling within 30 m of the field margins to avoid any current or historic turning headlands. Within-field transects were located approximately perpendicular to any tramlines. Sampling locations were spaced approximately evenly along each transect, although due to practical constraints not all soil measurements were made at each of these locations (see Table 3). Once in the general vicinity of the sampling location, field surveyor discretion was used to ensure that a representative sampling location was selected. The five IN locations were chosen to represent general infield conditions typical of the majority of the field area. The five TR locations were targeted to the trafficked parts of the field, typically tramlines in arable fields and animal/livestock tracks in grassland/woodland. The five UN locations were chosen on field margins that were uncultivated and untrafficked, avoiding any margin trafficking associated with hedge cutting or other activities and also avoiding sampling within 1 m of tree/hedge stems and animal burrows. In the woodland, sampling locations were positioned along two transects at least 1 m away from the base of any trees.
Table 2Summary of soil measurements, techniques used for sampling, and timing of sampling for the LANDWISE detailed survey. Note that “na” represents not applicable.
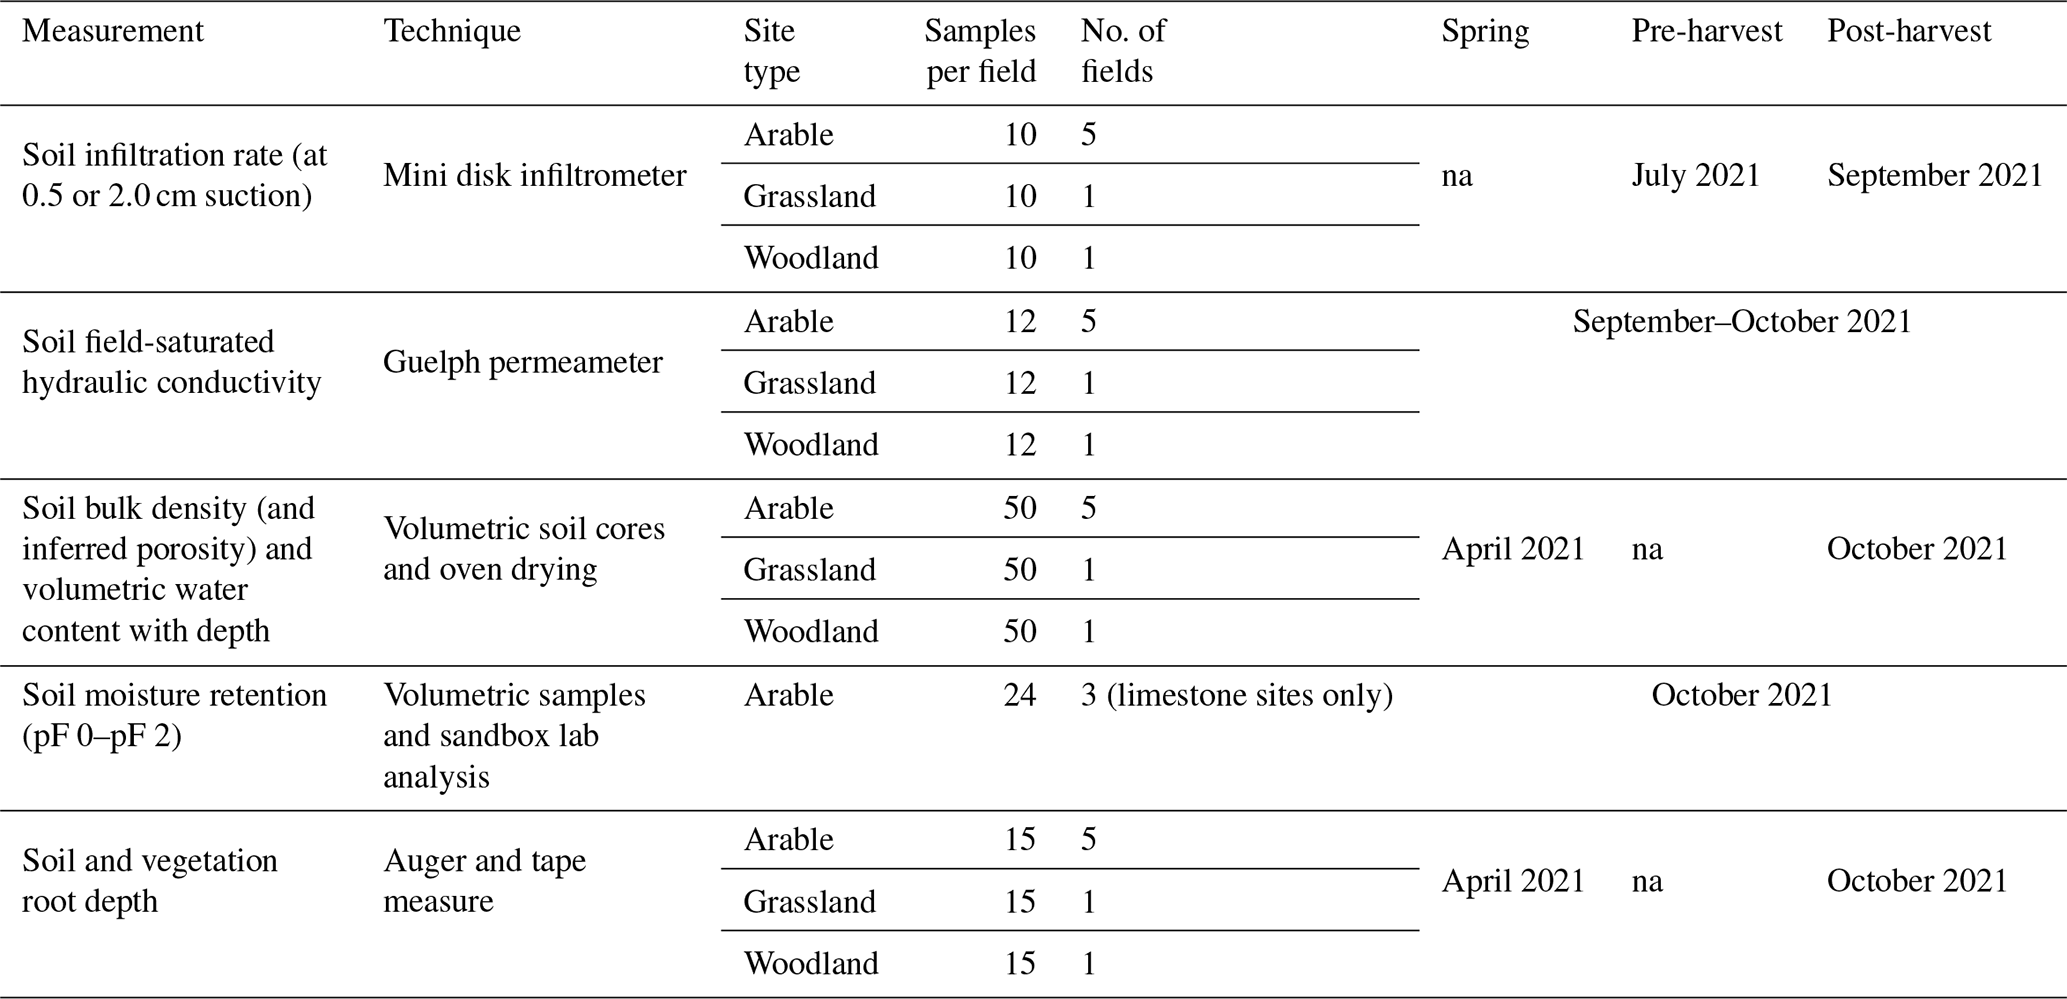
Table 3Sampling locations used for LANDWISE detailed survey soil property measurements.
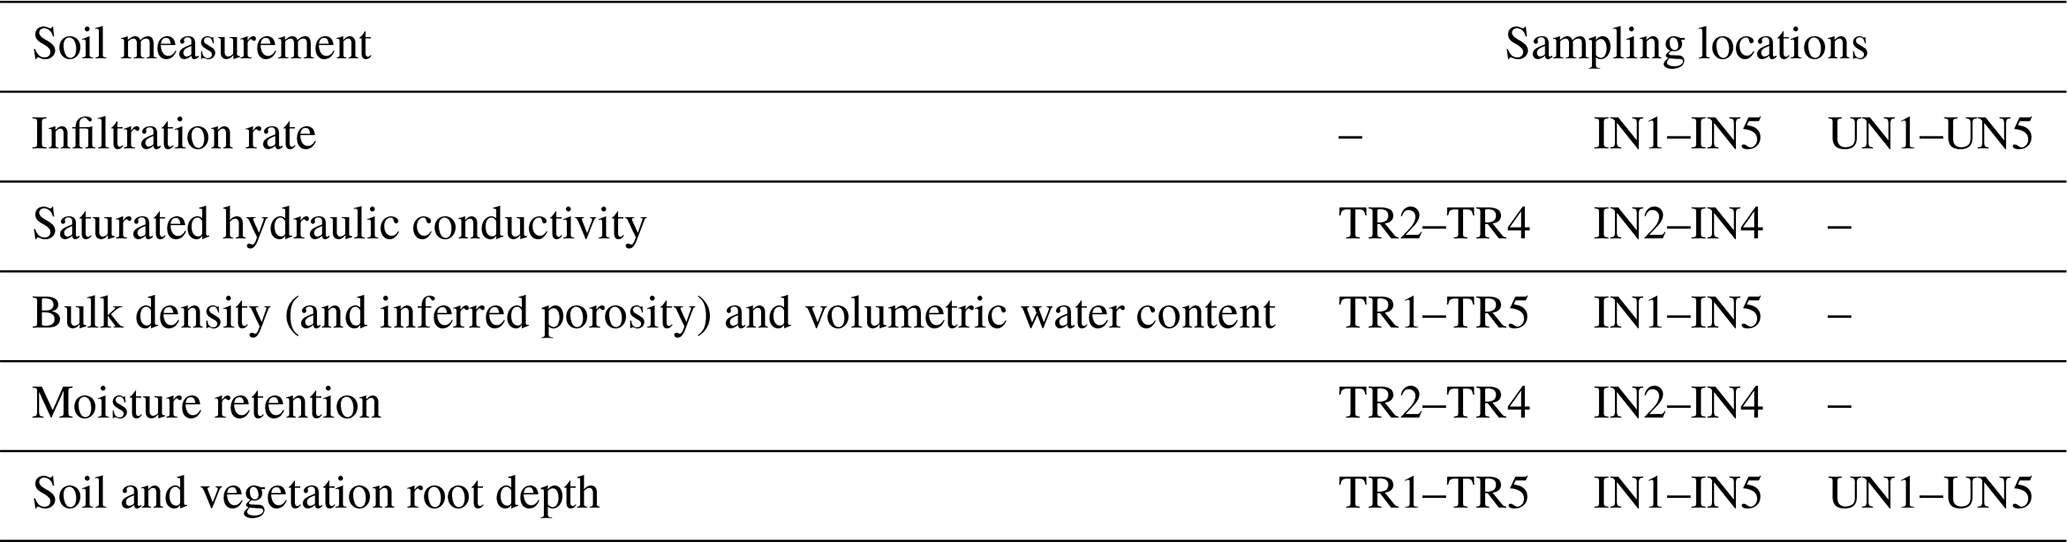
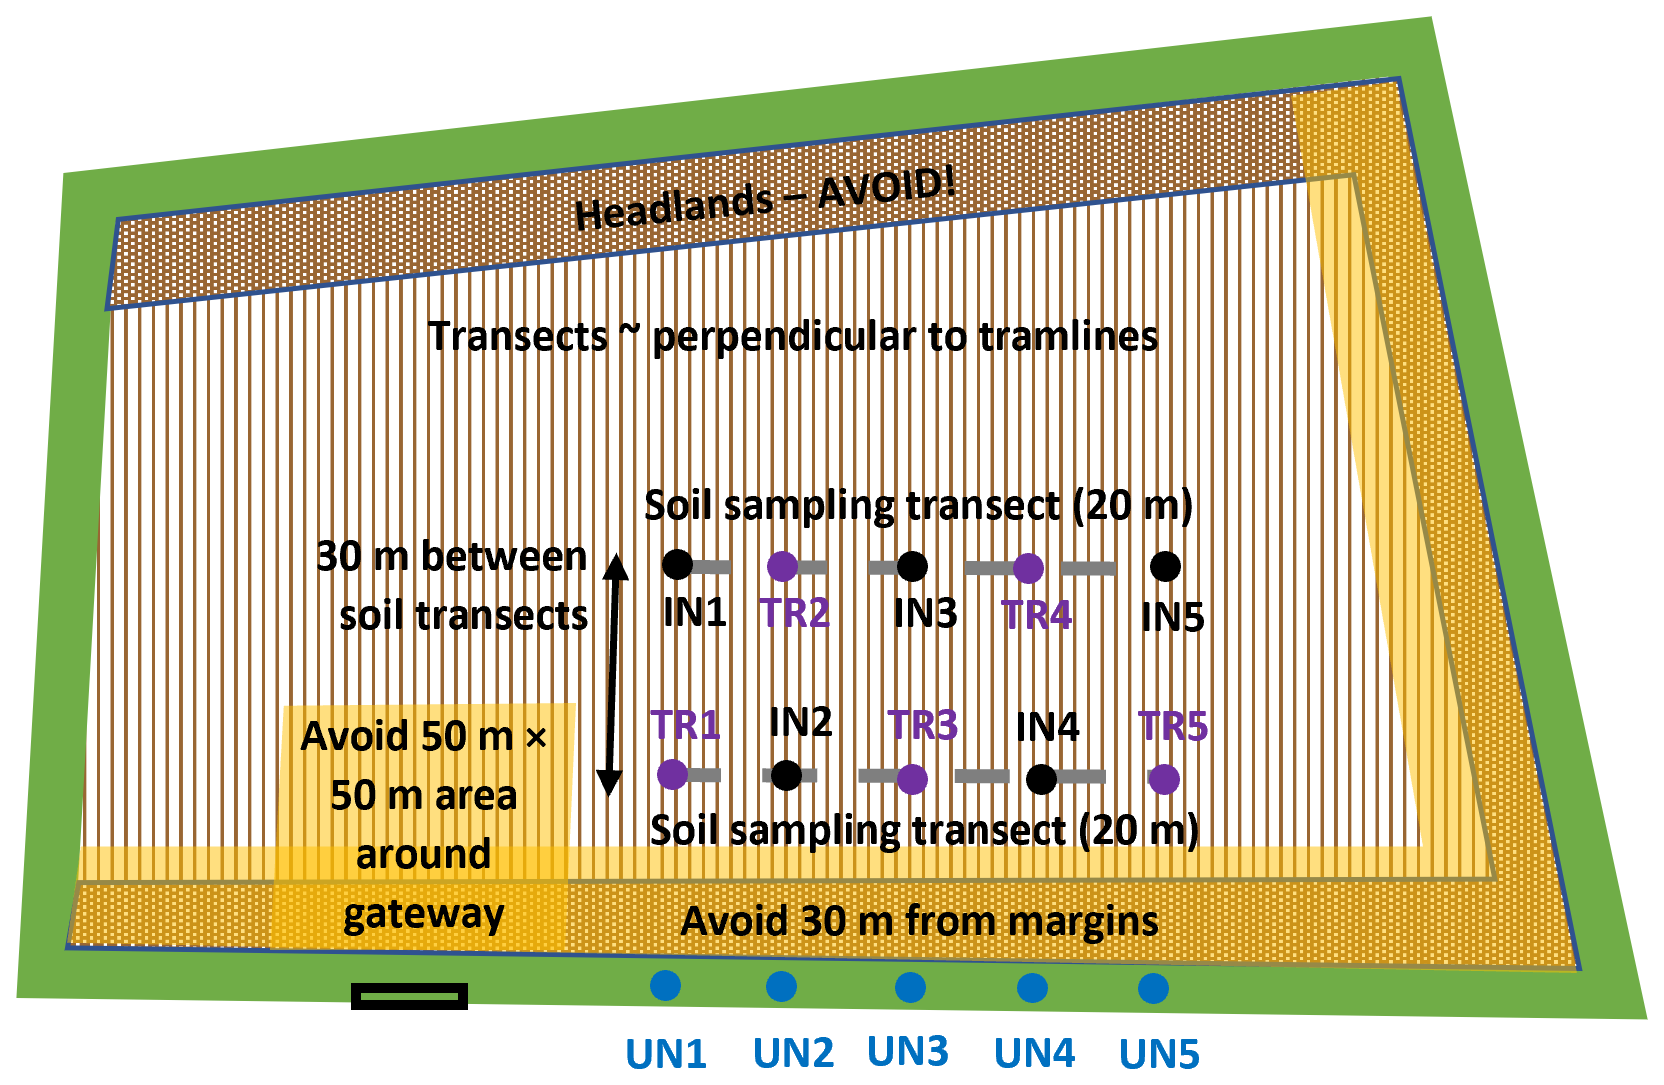
Figure 2Schematic of the LANDWISE detailed survey transects and sampling locations within a typical field. IN = infield; TR = trafficked; UN = untrafficked margin.
2.3 Infiltration rate
Soil surface infiltration measurements were taken using mini disk infiltrometers (Decagon Devices, Inc.; Pullman, Washington, USA). The infiltrometers are made up of an upper and lower chamber (both of which are filled with water during measurements). The upper chamber controls the suction, and the lower chamber contains a volume of water that infiltrates into the soil at a rate determined by the suction. The bottom of the infiltrometer contains a porous sintered stainless-steel disk that does not allow water to leak in open air, so it only allows water out when placed on a relatively level soil surface. Once the infiltrometer is placed onto the soil surface for a measurement, water leaves the lower chamber and infiltrates into the soil (the rate of which is determined by the soil properties). As the water level in the lower chamber drops over time, the rate of infiltration can be calculated by recording the water volume at regular intervals (e.g. 30 s for a typical silt loam).
Where the soil surface was vegetated, the soil surface first had to be exposed at the sampling locations. Vegetation was carefully cleared using a hand trowel to ensure the soil remained relatively undisturbed. Reliable measurements required the soil surface to be as level as possible, so locations were chosen with this in mind. Where it was not possible to get a naturally level surface, the soil was gently brushed (avoiding any soil smearing) to create a flat surface for the infiltrometer to rest on and ensure a good contact with the porous disk.
At each site, the suction rate of the infiltrometer was selected based on prior knowledge of the soil type (Table 1) following guidance in the mini disk infiltrometer manual (Decagon, 2022). At most sites the recommended suction rate of 2 cm was used; however, on the two mudstone sites a suction rate of 0.5 cm was used due to the lower infiltration rates anticipated there. The measurement interval was also chosen based on the soil type at each site and adjusted accordingly to suit the observed rate of infiltration.
The infiltrometer was kept upright and stable during the measurement using a retort stand and clamp. Following the recommendation in the infiltrometer manual, the chambers were filled using tap water rather than distilled water to avoid potential changes to the ionic balance of soil water and its effects on soil properties. Before taking a measurement, the initial water volume of the lower chamber was recorded and then the infiltrometer was placed onto the soil surface whilst a timer was started. Measurements were then taken at the selected time interval. The method aimed to infiltrate at least 15 mL of water for a robust measurement; however, given fieldwork time constraints this was not always practical where infiltration rates were notably slow. These measurements were still used in the dataset but were flagged during the data quality control process (see Sect. 3.1).
The recorded field data were entered into a Microsoft Excel spreadsheet (available at https://library.metergroup.com/Sales and Support/METER Environment/New-Minidisk-Infiltrometer-Macro.xlsx, last access: 11 August 2025) (METER Environment, 2025), which was used to calculate the unsaturated hydraulic conductivity (Kunsat) at the specified suction (infiltration rate). The calculations used within the spreadsheet follow the method proposed by (Zhang, 1997), which measures cumulative infiltration over time and fits the results using a curve function. The soil van Genuchten parameters (for different soil texture classes) required by the function were obtained from Carsel and Parrish (1988).
2.4 Saturated hydraulic conductivity
Soil field-saturated hydraulic conductivity (Kfs) was measured at two depths (25 and 45 cm b.g.l.) using model 2800 Guelph permeameters (Soilmoisture Equipment Corp.; Goleta, California, USA). The Guelph permeameter operates using the Mariotte principle and measures the steady-state rate of water recharge into unsaturated soil from a well hole, in which a constant head of water is maintained.
Measurements of Kfs were taken nearby but offset from locations on field transects (Fig. 2) to avoid errors due to soil disturbance from previous measurements and sampling. Well holes for the 25 and 45 cm depth measurements were made approximately 1 m apart to avoid interference from soil moisture saturation “bulbs” created during measurements. An Edelman soil auger was initially used to excavate a well to depths of 10 and 30 cm b.g.l. for the 25 and 45 cm measurements, respectively. To remove the remaining depth of soil from the well, a sizing auger attachment was then used to ensure a well hole of uniform geometry (6 cm in diameter with a flat bottom). Where large stones were encountered during the augering process, new well holes were dug to avoid excessively increasing the volume of the well by removing stones from the walls of the well hole. Once the well hole was of suitable depth and geometry, a well prep brush attachment was used to lightly roughen the walls of the well hole and to remove any soil smearing that may have occurred during the augering process.
The Guelph permeameter was assembled, the reservoir was filled with deionised water, and the device was placed on a tripod above the well hole following the operating instructions (Soilmoisture Equipment Corp., 2012). For the measurements, the “two-head” method was chosen due to its higher accuracy compared to the “single-head” method. The two-head method involved repeating measurements at two well head heights. At most field sites, measurements were carried out using well head heights of 5 and 10 cm above the base of the well. However, at the two sites with more slowly permeable soils, increased heights of either 10 and 15 cm or 15 and 20 cm were used for some measurements to ensure the measurement duration remained practical given time constraints. Similarly, where measurements were anticipated to be slow, the inner reservoir of the permeameter (containing a smaller volume of water) was used instead of the larger combined reservoir which was used for most measurements.
To take measurements with the permeameter, the steady-state rate of fall (R) was determined by recording the reservoir water volume at regular time intervals. The rate of fall in the volume was calculated for each time interval and the measurement was only finished when there was no significant change for three consecutive time intervals.
A Microsoft Excel spreadsheet (available at https://soilmoisture.com/wp-content/uploads/2024/07/Guelph-Permeameter-Ksat-Calculator-2023M07D27.xls, last access: 11 August 2025) was used to calculate Kfs (SoilMoisture Equipment Corp, 2023). The calculation takes into account the observed R value from a measurement, the cross-sectional area of the reservoir used, the well head height, and the well hole radius.
2.5 Soil and vegetation root depth
Soil depth profiles and the root depths of vegetation were examined at each sampling location. First, an Eijkelkamp gouge auger was used to sample the top 50 cm of soil (where possible, depending on the soil type and geology). A tape measure was then used to measure the depths of distinct soil horizon boundaries (e.g. at the bottom of the plough layer) and the maximum rooting depth where this was shallower than 50 cm. The gouge auger was then re-inserted to sample the next 50 cm of soil and measure any soil horizon boundaries and the rooting depth. Where the soil depth extended beyond 1 m, this augering and measuring process was continued until no longer possible.
2.6 Volumetric water content, bulk density, and porosity
Soil samples were collected using an Eijkelkamp 07.53.SC sample ring kit with closed ring holder (50 mm diameter rings; 100 cm3 volume) combined with an Edelman auger or Stony auger as required (Royal Eijkelkamp; Giesbeek, the Netherlands). Following careful removal of any loose surface vegetation, soil samples were taken at depths of 0–5, 10–15, 25–30, 45–50, and 95–100 cm below ground level (b.g.l.). Due to limited soil depths, some of the deeper samples were not always possible. Upon extraction, samples were carefully trimmed using a soil spatula to ensure volume control, placed in a polythene bag, and sealed. Samples were returned to the laboratory on the day of collection and kept refrigerated at 4 °C prior to analysis.
Volumetric water content (VWC) was obtained by oven-drying the volumetric soil samples. Whilst samples were still in their bags, any particularly large soil aggregates were manually broken up to aid drying. Samples were emptied into pre-weighed aluminium foil trays and then weighed to the nearest 0.1 g. The sample trays were then placed into a drying oven at 105 °C for approximately 36 h (up to a maximum of 60 h). Upon completion of drying, samples were removed from the oven in small batches and immediately weighed (to the nearest 0.1 g) to ensure they did not regain any moisture from the atmosphere. VWC (cm3 cm−3) was then calculated using Eqs. (1)–(2):
where vw is the volume of water (cm3), and v is the sample volume (cm3; equal to 100.1 cm3).
where vw is the volume of water (cm3), mwet is the wet soil mass (g), mdry is the dry soil mass (g), and ρw is the density of water (g cm−3; equal to 1 g cm−3).
Dry bulk density (BD) was then calculated using Eq. (3):
where ρbulk_dry is soil BD (g cm−3), mdry is the dry soil mass (g), and v is the sample volume (cm3).
Soil porosity was estimated using Eq. (4):
where φest is the estimated soil porosity (cm3 cm−3), ρbulk_dry is the soil dry bulk density (g cm−3), and ρmineral is the particle density of mineral soil (g cm−3), which was assumed to be 2.65 g cm−3, as commonly used in soil science, e.g. Blake (2008).
2.7 Soil moisture retention
Soil samples for soil moisture retention analysis were collected following a procedure similar to that given in Sect. 2.4, except that the collected samples were retained in their soil sampling ring and capped prior to analysis. These samples were taken from 0–5, 25–30, and 45–50 cm b.g.l., where the soil profile allowed. Care was taken to ensure that the sample soil surfaces were not smeared by the sample trimming process. The laboratory analysis was carried out using an Eijkelkamp Sandbox 08.01 (Royal Eijkelkamp; Giesbeek, the Netherlands) that applied a range of suction values (pF 0 to pF 2; from saturation to 100 cm suction) to soil samples.
Small pieces of thin permeable nylon cloth were attached to the base of the soil samples (still contained within metal sample rings) using rubber rings in order to retain the soil samples as they were placed on and removed from the sandbox surface whilst being weighed during the analysis process. Each cloth and rubber ring were weighed together before use and the sample was then reweighed once the cloth and ring were attached.
The samples were then spaced out evenly on the sandbox surface, ensuring a gap of several centimetres between them. Deionised water was used to supply water to the sandbox during the saturation process (with the water level raised slowly to avoid air entrapment). The water supply contained a small addition of copper sulfate to help prevent algal growth within the sandbox and its tubing. Samples were left to saturate in the sandbox until they reached a constant mass. Saturation was assumed to have been reached when sample mass (measured using a 0.1 g precision balance) remained the same for 2 consecutive days. Evaporation from the sandbox was minimised by placing a tight lid over the sandbox when the samples were not being weighed.
Once all samples reached saturation, the suction regulator was changed to apply a suction of 2.5 cm head for the first pF (0.4). Samples were weighed on a daily basis until they reached equilibrium (consistent mass over 2 consecutive days). This process was then repeated at each of the following pF values: 1, 1.5, 1.7, 1.8, and 2 (equivalent to 100 cm suction). Due to practical constraints soil moisture retention beyond pF 2.0 was not measured.
3.1 Data quality control
Data underwent a quality control (QC) process to flag any data entry errors or potentially spurious or unusual measurements. Hard-copy measurements made in the field and lab were entered into Excel spreadsheets by the person who recorded them. To avoid data entry errors, the transcribed data were then checked by another individual and corrected where necessary. Data calculations and derived measurement values were quality-controlled following guidance in the instrument manuals (Decagon, 2022; Soilmoisture Equipment Corp., 2012).
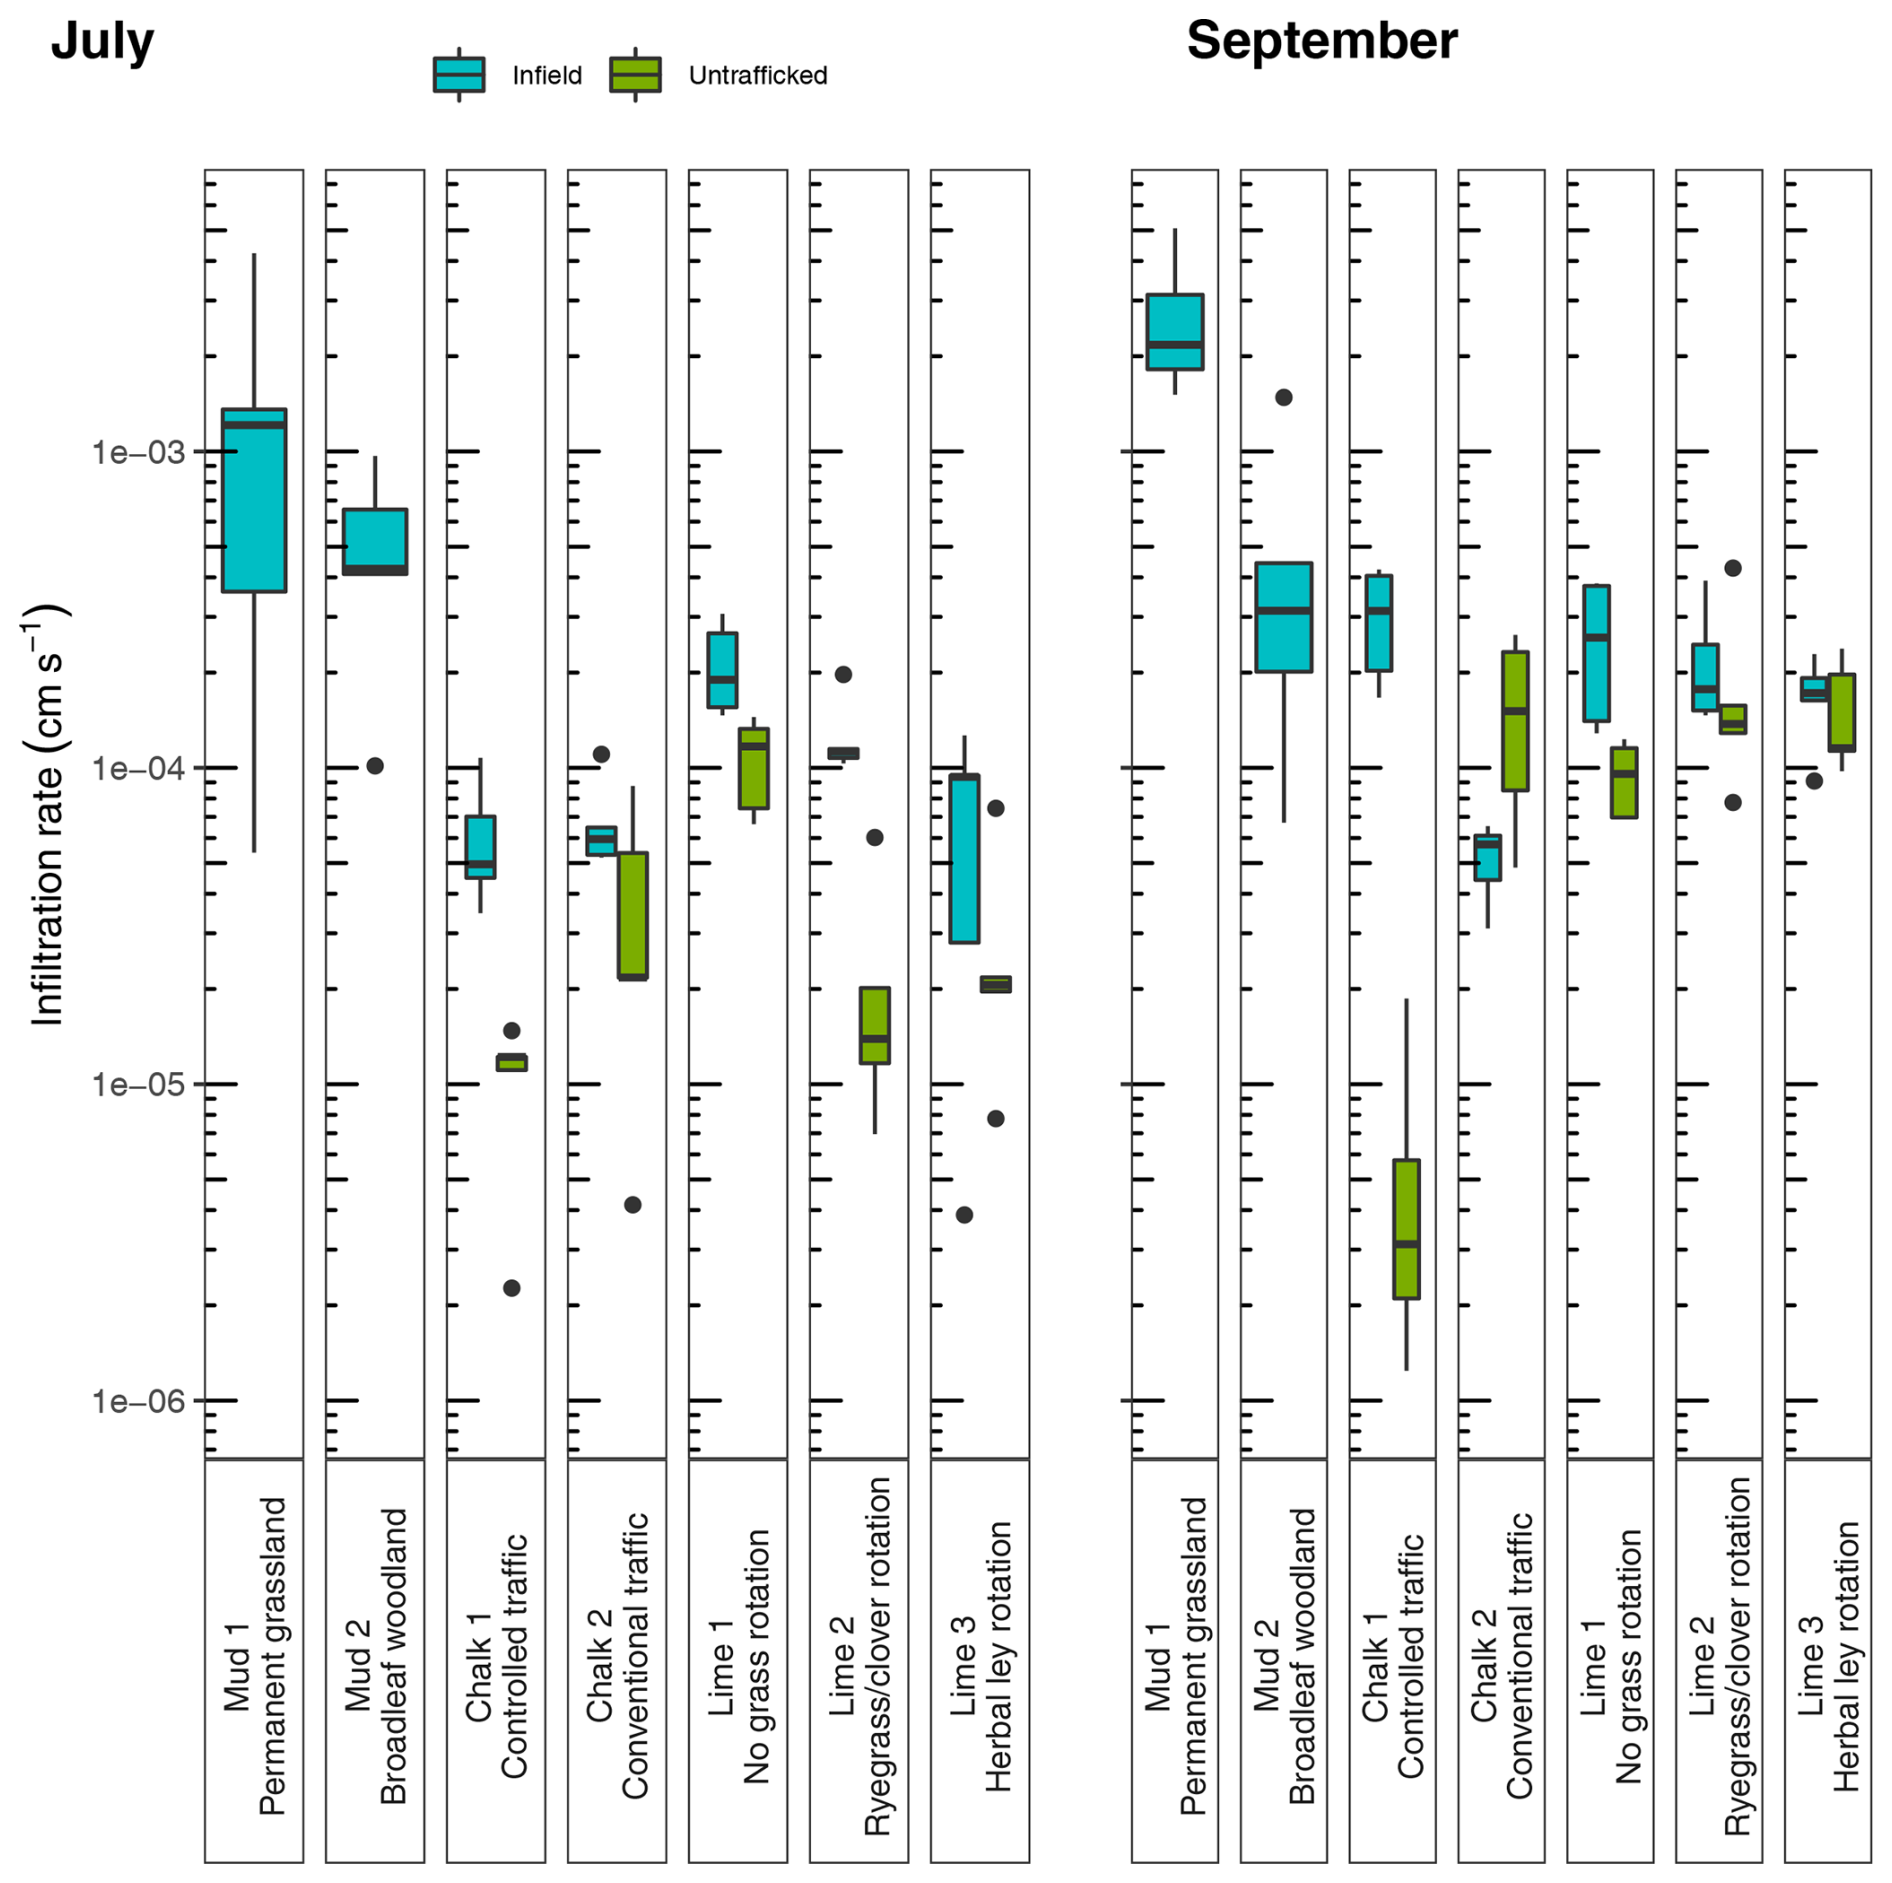
Figure 3Box plots of infiltration rate (cm s−1) measurements taken at infield and untrafficked margin locations in July and September (pre- and post-harvest, respectively, for the arable sites). Bold lines indicate median values. Note the log scale.
Infiltration measurements underwent QC to categorise each measurement using the following data flags, which are stored as “Infiltration_1_ QC_Flag” and “Infiltration_2_QC_Flag” in the dataset:
-
“Good” = no apparent issues with the measurement were identified.
-
“Invalid” = the measurement gave values that were not physically plausible (negative infiltration rate). These values have been removed from the dataset (affecting 3 of 120 records).
-
“A” = the change in infiltration rate over time was observed to be notably unsteady (e.g. where plots of cumulative infiltration over time showed sudden/rapid changes).
-
“B” = <15 ml water infiltrated during the measurement (the mini disk infiltrometer manual states that accurate calculation requires at least 15 ml of water to be infiltrated during each measurement).
-
“C” = calculated Kunsat values were unusually high. This was determined by comparing the measured value against typical values + 3 SD (i.e. the 99.7 % upper bound of the distribution) from Carsel and Parrish (1988). It is important to note that data points with this QC flag may in fact be correct and potentially reflect the spatial heterogeneity of the soil pore system or the novel soil state/structure/management at the time of measurement.
Infiltration measurements with QC flag A, B, or C are retained in the dataset given the possibility that they may be representative of actual soil conditions and phenomena. For example, interactions between soil chemistry and the ionic strength of the infiltrating water or breakdown of water repellency might have caused infiltration rates to be unsteady. Additionally, soil macroporosity or biopores created by earthworms might have resulted in some extreme values. Data users should take these factors into account when making decisions on the inclusion or exclusion of individual measurements for further use of the dataset.
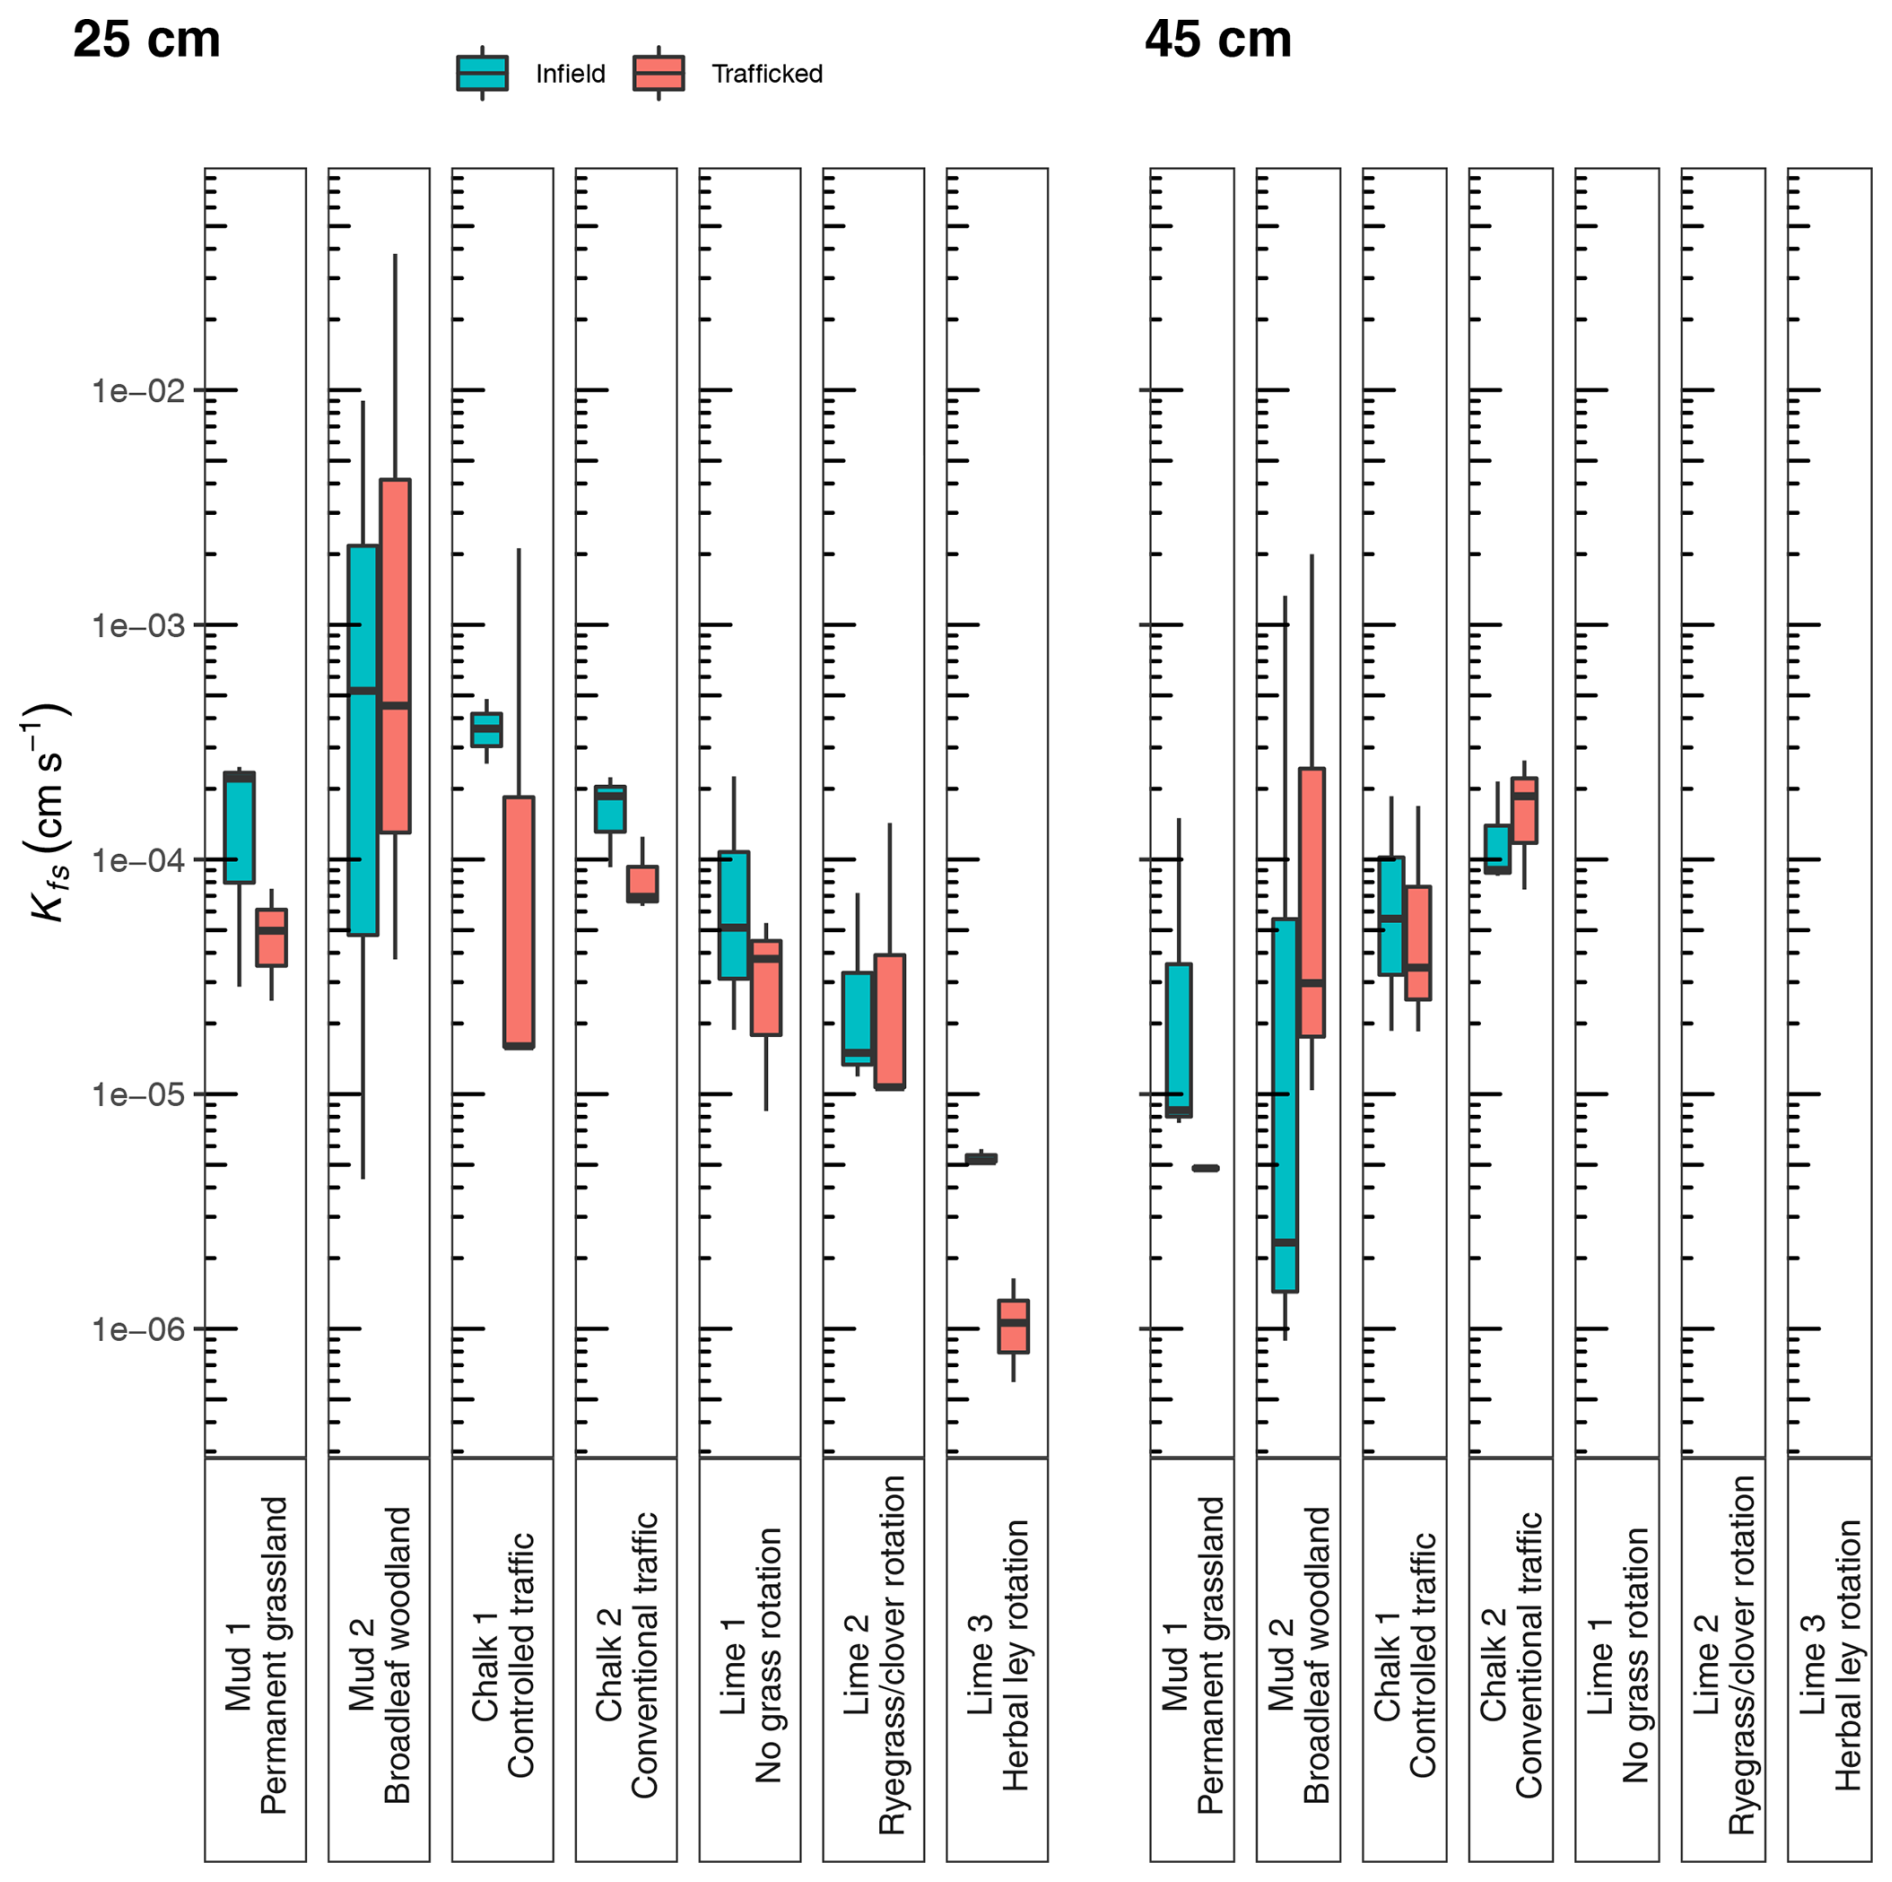
Figure 4Box plots of saturated hydraulic conductivity (Kfs) (cm s−1) measurements taken at infield and trafficked locations at 25 cm depth and also 45 cm depth where possible. Bold lines indicate median values. Note the log scale.
Saturated hydraulic conductivity measurements underwent QC to categorise each measurement using the following flags, which are stored in the “Guelph_Permeameter_QC_Flag” column of the dataset:
-
“Good” = no apparent issues with the measurement were identified.
-
“Invalid” = it was not possible to make a valid measurement in the field – no value was recorded in the dataset (affecting 1 of 64 records – in this case as there was no measurable reduction in the Guelph permeameter reservoir water level after 1 h, with four repeat attempts made).
In addition, the “Guelph_Permeameter_notes” column indicates whether the double-head method or the mean of two single-head measurements was used for deriving Kfs for each measurement. The double-head method is more accurate and is therefore provided in preference. However, sometimes the data generated physically inadmissible values when using the double-head method. Following Soilmoisture Equipment Corp. (2012), when using the double-head method this includes the following: (i) if the steady-state rate of water level change for the first (smaller well head) measurement is equal to or larger than the rate for the second (larger well head) measurement, (ii) if negative values of the “alpha” parameter are calculated, or (iii) if “alpha” values are calculated which lie outside the “realistic” range of 0.01–0.5 cm−1. In such cases the data were instead used in two separate single-head measurement calculations. The results of the two single-head measurements were then averaged. Further details are given in the Guelph permeameter operating instructions (Soilmoisture Equipment Corp., 2012).
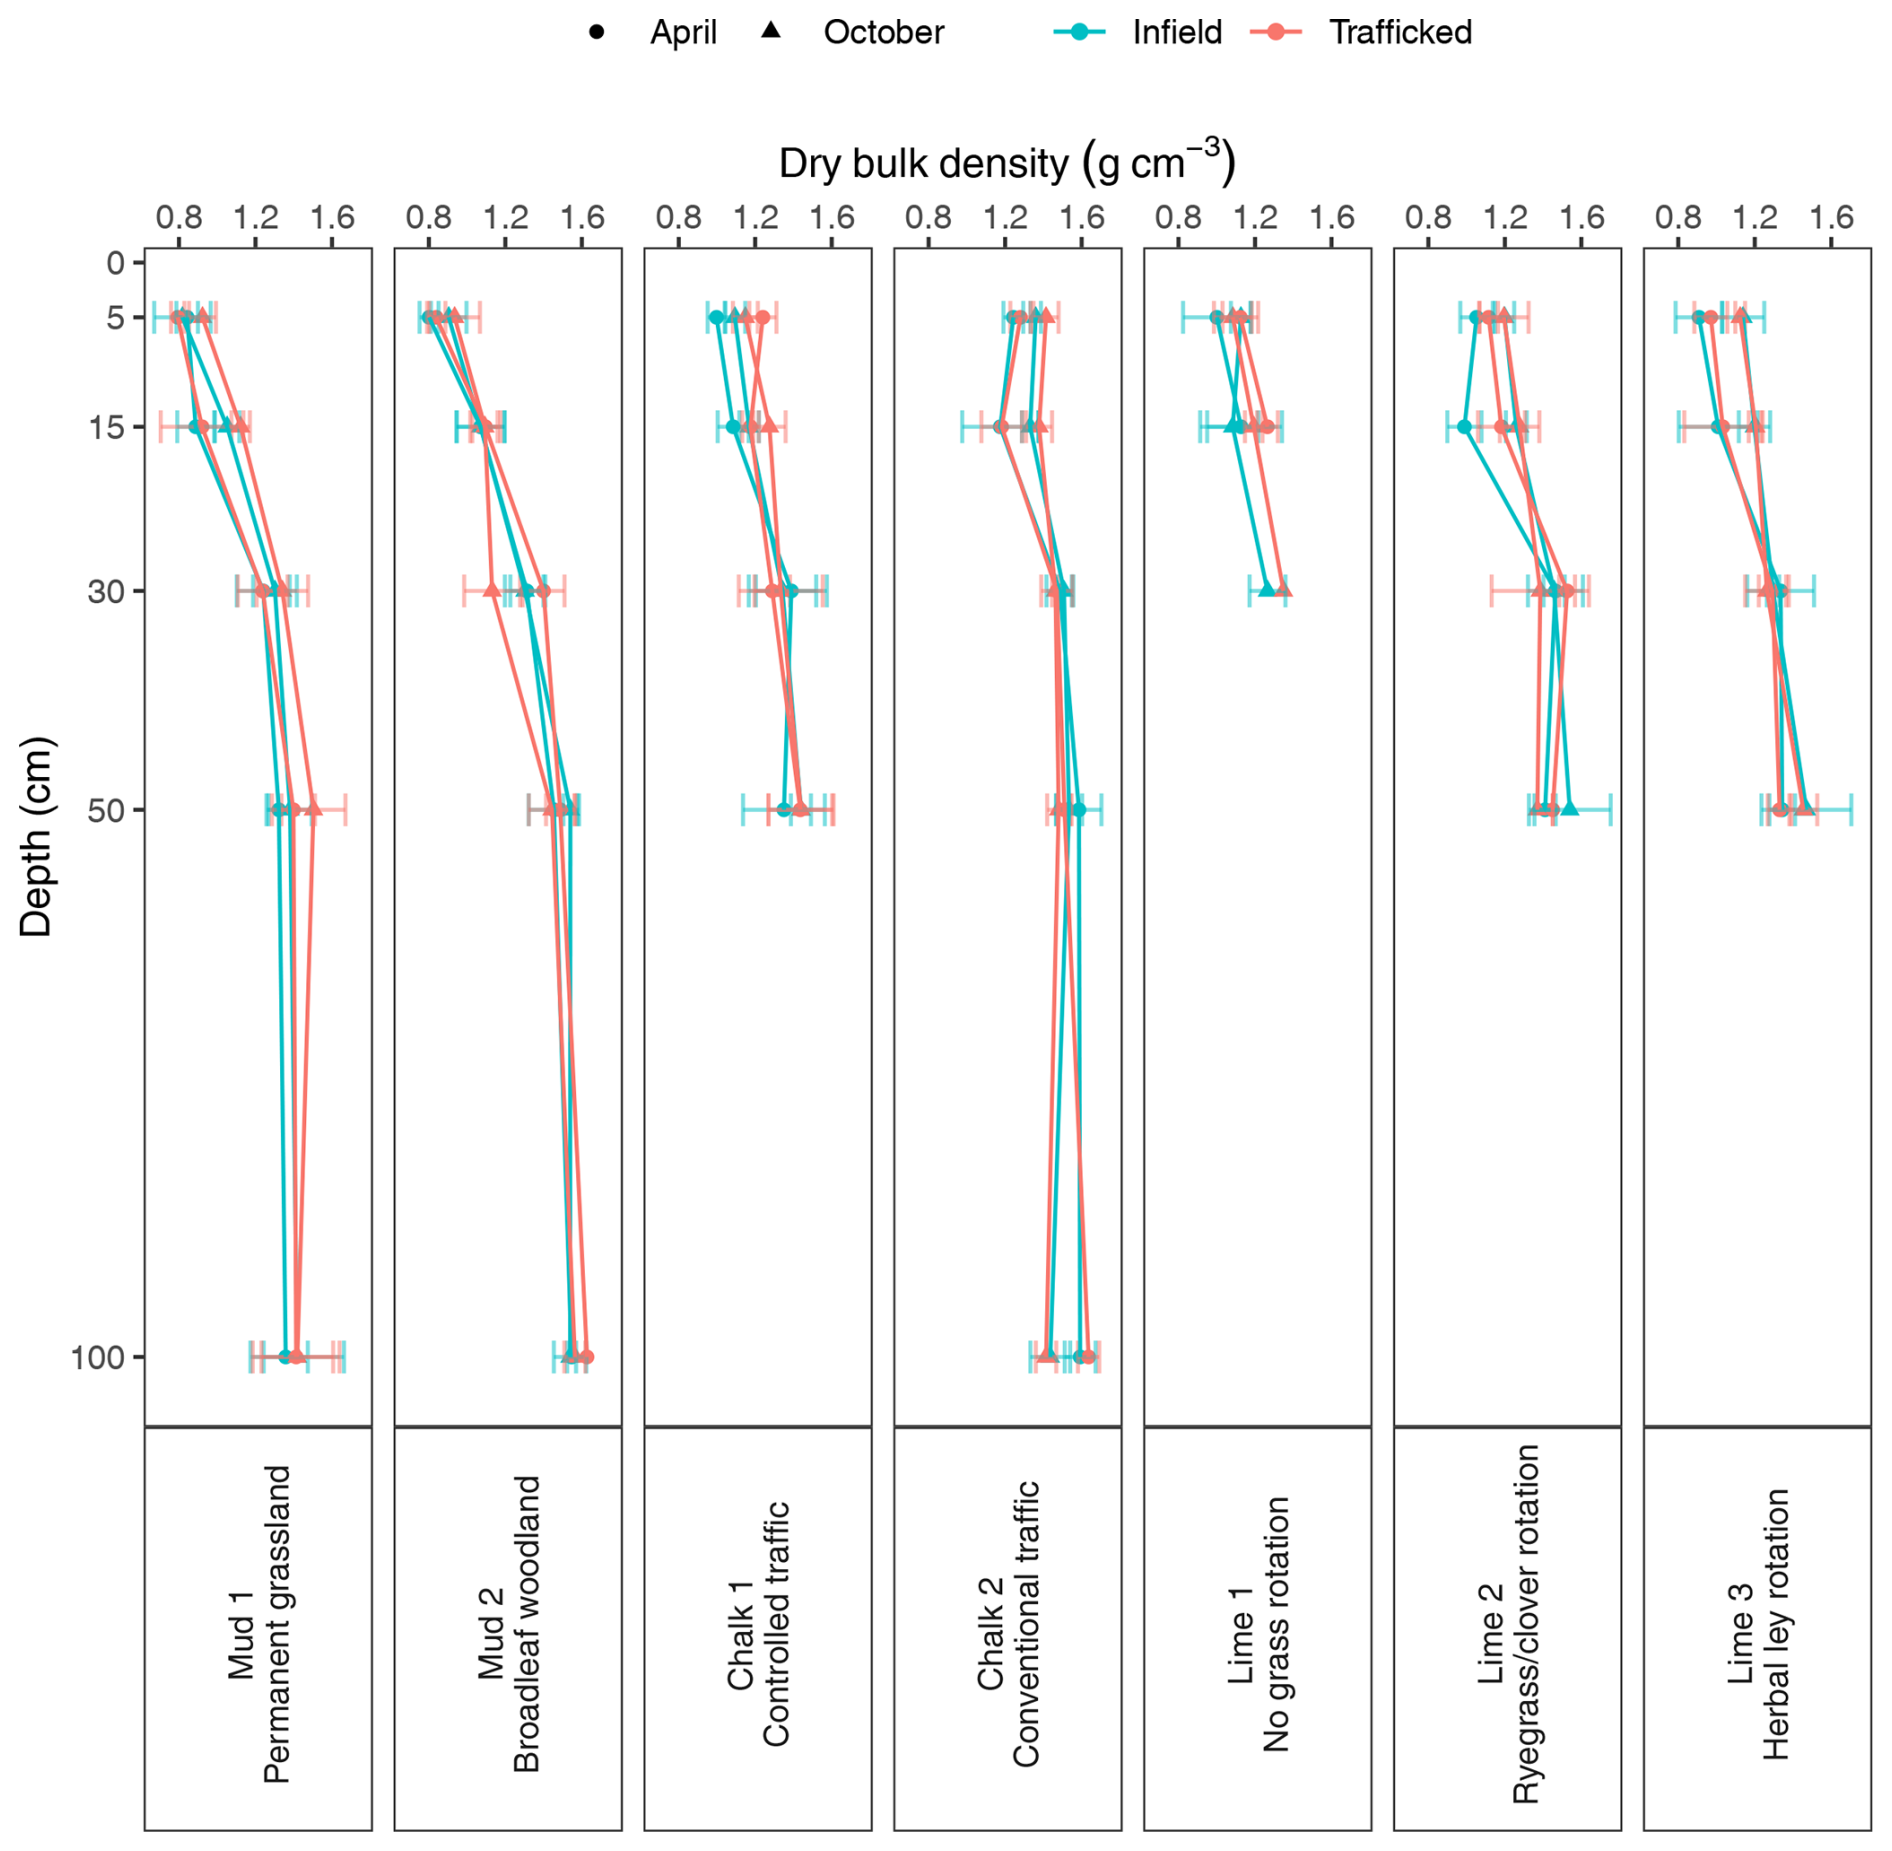
Figure 5Changes in mean soil dry bulk density (g cm−3) with depth (cm) at infield and trafficked locations sampled in April and October. Error bars represent standard deviations. Plotting on the “Depth” axis is at the lower limit of the sampled depth; e.g. 45–50 cm samples are plotted at 50 cm.
3.2 Infiltration rate
Infiltration rate measurements are summarised in Fig. 3 as box plots for each field, grouped according to when the measurements took place and also by the location type (infield or untrafficked margins). At the non-arable sites (Mud 1 and 2), infiltration measurements were only taken infield due to the absence of untrafficked margins. The infiltration rate varied by several orders of magnitude, ranging from ∼ 1 × 10⁻⁶ to 5 × 10⁻³ cm s−1. The permanent grassland soil over mudstone was found to have the highest median infiltration rate in both July and September. However, it should be noted that infiltration rate at the mudstone sites cannot be directly compared to other sites due to the different suction values used for the measurements. Infiltration rates at the mudstone sites are likely to be higher due to the lower suction allowing larger pore sizes to be activated for infiltration. For the arable soils, infiltration was on average faster in September with the exception of the untrafficked margin at site Chalk 1, which exhibited notably low rates in comparison to the other sites. Some of the more extreme values may be due to the influence of soil macropore organisation. For example, the presence of channels and fissures can lead to significant increases in intrinsic permeability, thereby increasing the soil infiltration rate (Blackwell et al., 1990).
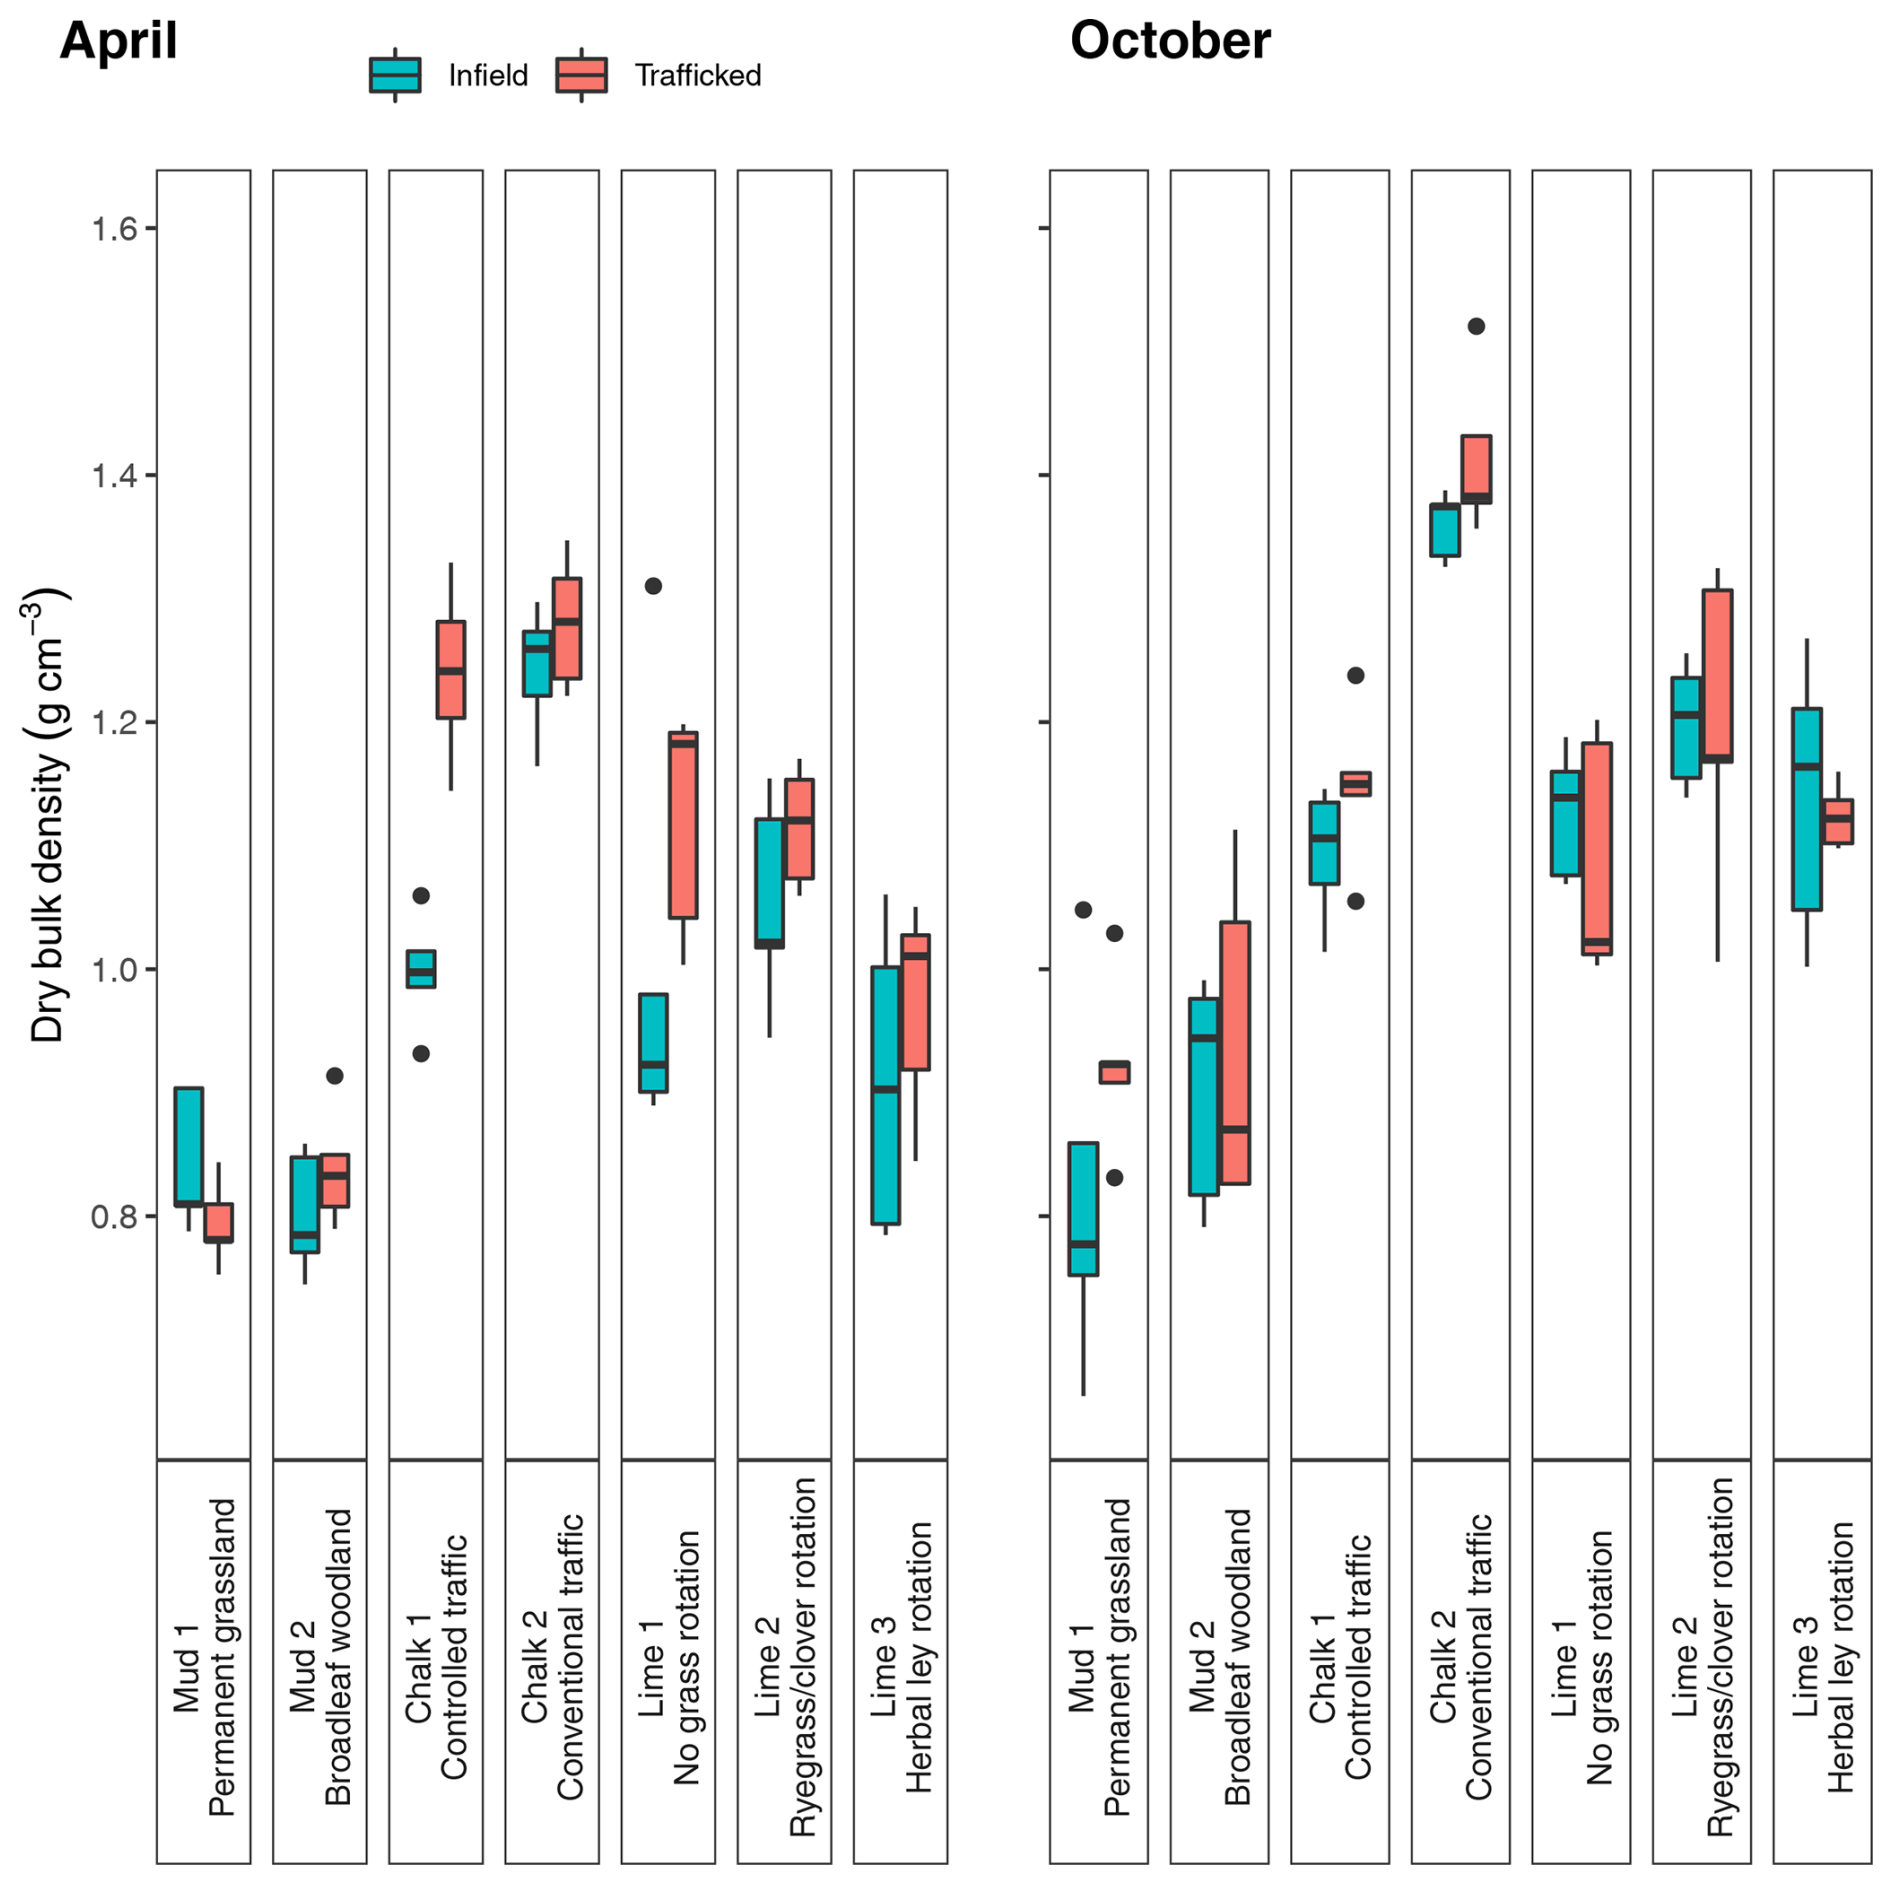
Figure 6Box plots of soil surface (0–5 cm depth) dry bulk density (g cm−3) sampled at infield and trafficked locations in April and October (pre- and post-harvest, respectively, for the arable sites).
3.3 Saturated hydraulic conductivity
Figure 4 summarises the soil saturated hydraulic conductivity data grouped by the location type and measurement depth. Kfs varied by several orders of magnitude, with measurements across all field sites, location types, and depths ranging from < 1 × 10⁻⁶ to > 0.03 cm s−1. Irrespective of location type and depth, the greatest variability in soil Kfs was observed in the broadleaf woodland site (Mud 2). This variability reflects the heterogenous complexity of woodland soils in terms of both space and depth. For example, soil water movement can be heavily influenced at a local scale by features such as decayed root channels. Notably high Kfs at 25 cm depth is likely to be due to efficient transit of water through channels and fissures, which allow rapid drainage in clay soils (Blackwell et al., 1990). Furthermore, the woodland site was underlain by mudstone, with the soil texture becoming increasingly clayey with depth and therefore likely to be a cause of the low Kfs at 45 cm depth. However, the trend of decreasing Kfs with depth was not consistent across all field sites, as shown by the two arable fields with free-draining loamy soils underlain by chalk. The field with controlled traffic exhibited a decrease in average Kfs with depth for infield sampling locations, but for trafficked locations average Kfs was higher at 45 cm depth compared to 25 cm depth, presumably due to surface ground pressure exerted by vehicle wheeling. This pattern was also observed in the field that was managed conventionally (without controlled traffic) but to a smaller extent, as both depths had relatively similar ranges of Kfs (median of ∼ 1 × 10⁻⁴ cm s−1).
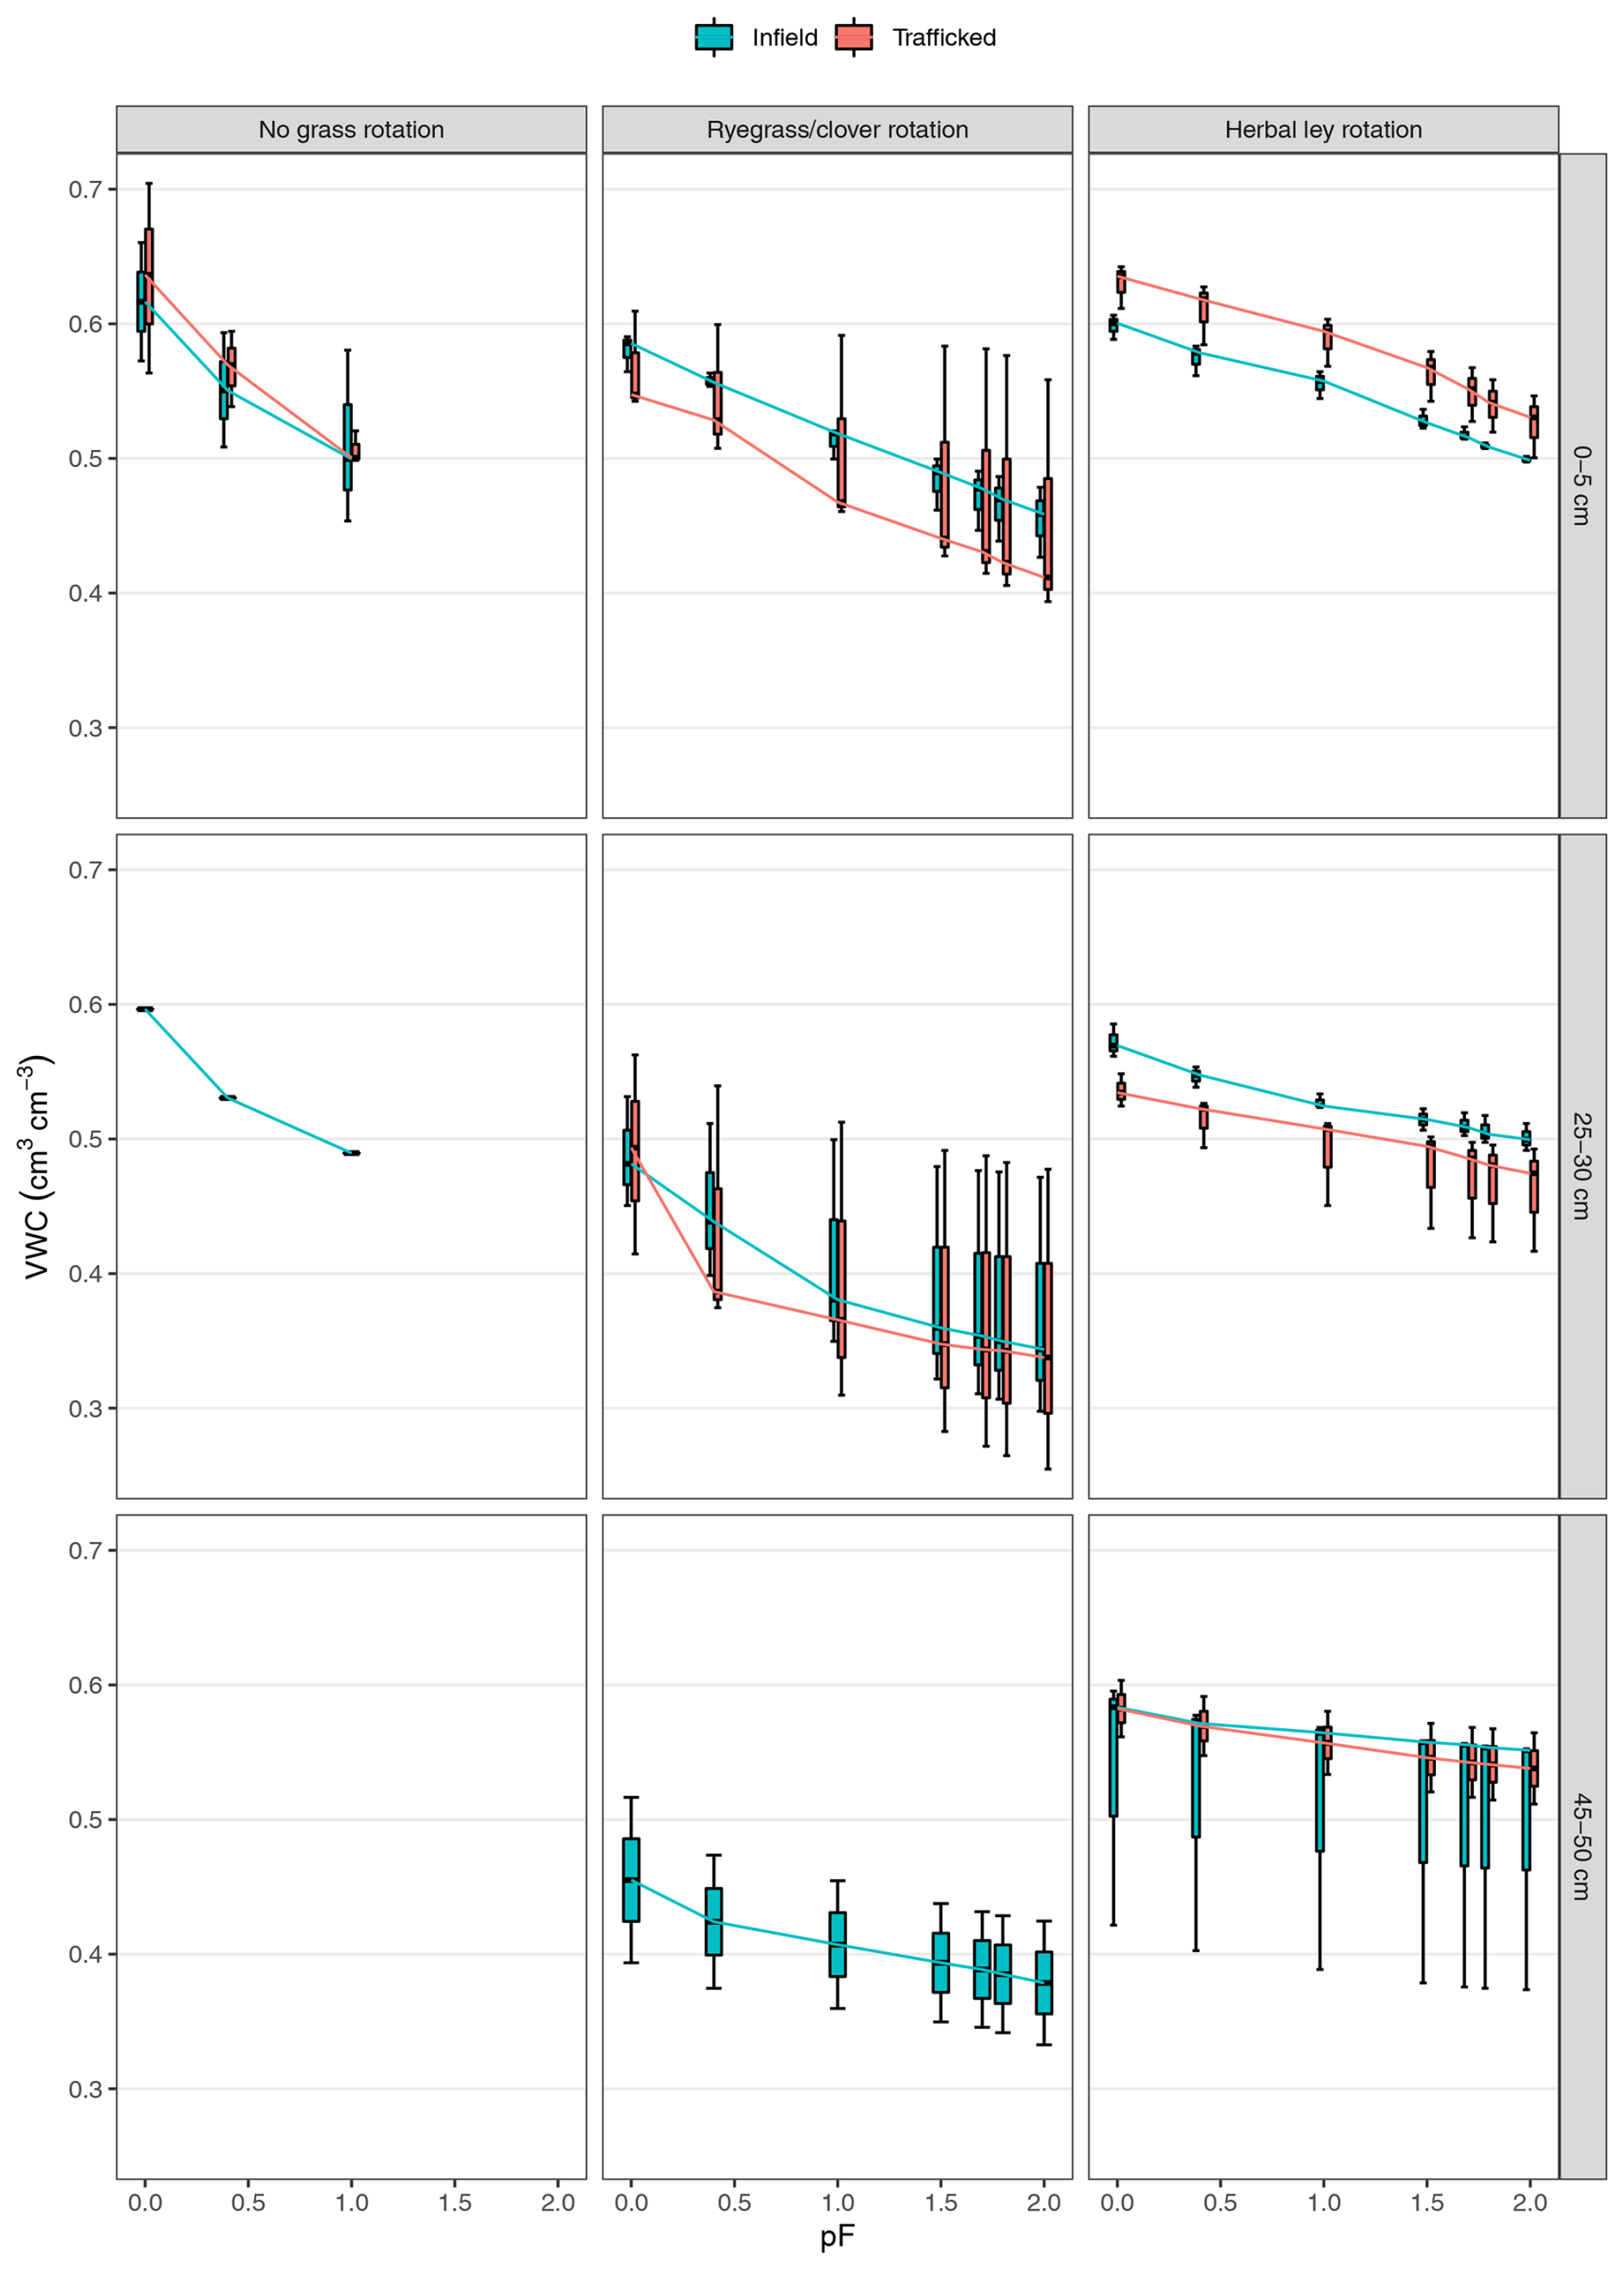
Figure 7Soil moisture retention curves showing changes in volumetric water content (VWC; cm3 cm−3) with increasing suction (pF) at infield and trafficked sampling points and different depths across different agricultural management practices. Lines joining box plots represent median values with the exception of the single soil sample for “no grass rotation” at 25–30 cm, for which no summary statistics could be calculated.
3.4 Volumetric water content, bulk density, and porosity
VWC, BD, and estimated porosity were determined from soil sampling at five different depths from the surface down to 100 cm where possible. Example BD data, showing variation with depth, are illustrated in Fig. 5. All depths were sampled at Mud 1 and 2 and Chalk 2, whereas samples could only be obtained from a maximum depth of 45–50 cm at Chalk 1 and Lime 2 and 3 as well as at 25–30 cm at Lime 1 (due to the shallow soil profiles at these sites). Overall, BD showed an increasing trend with depth but showed signs of reaching a maximum value between around 45–50 and 95–100 cm b.g.l.
Soil sampling occurred in April and October from both infield and trafficked locations at each field. For the arable sites, the October samples were taken post-harvest and generally pre-cultivation (if applicable). Comparing the sites over time shows that BD of the soil surface (0–5 cm) was typically higher in October than in April (Fig. 6). The highest soil surface BD values were observed at the two arable sites on loamy soil underlain by chalk, whereas the lowest occurred on the grassland and woodland sites with more clayey soils underlain by mudstone. In terms of the sampling location types, the differences between infield and trafficked soil BD at the surface were more notable in April, with higher median BD at the arable sites. In April, the infield areas of the Chalk 1 controlled traffic site have a substantially lower bulk density compared to the trafficked areas or indeed both area types at the nearby Chalk 2 conventional traffic site.
It is important to note that the estimated porosity data are derived purely based on the assumed density of the soil mineral particles, without accounting for the proportion or density of any soil organic matter present. Therefore, estimated porosities for the soil surface samples are likely to be less accurate than the samples at greater depth due to the greater influence of organic matter in the topsoil. Derived porosities for the broadleaf woodland site (Mud 2) are likely to be overestimated as a result of higher organic matter content relative to the agricultural land uses. However, the LANDWISE broad-scale dataset provides adjusted estimates of soil surface porosities which also take organic matter content into account (Blake et al., 2022). Previous measurements found that soil particle density can vary between 2.42 and 3.1 g cm−3 (Aki and Antigha, 2015). Taking this variation into account, there is potential for the derived porosity in the dataset to be underestimated by up to 28 % and overestimated by up to 19 % (Table S1 in the Supplement). For typical (mean) soil bulk density values in the dataset, the uncertainty in derived porosity is estimated to be around ±10 %.
3.5 Soil moisture retention
Soil moisture retention data describe the relationships between soil suction and VWC for each sampling location type and depth (Fig. 7). The three fields where soil moisture retention data are available are all on shallow soils over limestone, thereby allowing comparisons to be made between the different agricultural management practices and their potential influence on soil hydraulic properties. Soil moisture retention data show that the steepest decreases in VWC with increasing soil suction occurred in the field with no grass in rotation (n = 7), whereas the fields with ryegrass and clover in rotation (n = 14) and the herbal ley rotation (n = 17) had comparably more gentle decreases in VWC with increasing soil suction. Considerable variation was observed in moisture retention curves between both soil depths and location types for the herbal ley field, with VWC at saturation (pF 0) ranging from 0.52 to 0.64 cm3 cm−3. A higher degree of uncertainty was observed for some agricultural management practice and depth combinations (e.g. ryegrass/clover rotation at 25–30 cm), making comparisons between infield and trafficked areas of fields more challenging. Higher certainty in observations at 0–5 and 25–30 cm depths in the herbal ley rotation field indicated that soil water retention was greater in trafficked areas at the surface; however, infield areas had greater water retention at 25–30 cm depth. Given the importance of soil water retention to rainfall–runoff partitioning and drainage, such differences could be incorporated into overland flow models to more accurately represent within-field variability.
The data described within this paper are available via the UK Natural Environment Research Council (NERC) Environmental Information Data Centre (EIDC) at the following DOI: https://doi.org/10.5285/a32f775b-34dd-4f31-aafa-f88450eb7a90 (Trill et al., 2022). To aid use of the .csv format dataset in Microsoft Excel, it is recommended that the row containing column headings and the first column are frozen.
The soil hydraulic and hydrological dataset described herein provides a valuable snapshot of soil properties on different typical geologies in the Thames catchment, UK, under different land uses and land management practices. This dataset captures spatial–temporal variations over a typical growing season, including samples replicated over space and at different soil depths. Notwithstanding the original survey aim to provide information on the impacts of land-based “natural flood management” (NFM) measures on soil properties, these valuable spatial–temporal observations could also be used to help improve process representation and parameterisation in hydrological and land surface models. Measurements of infiltration rate and saturated hydraulic conductivity demonstrate the highly heterogeneous nature of these properties and the role of macropore organisation in soil hydrology. The dataset highlights how trafficked arable field areas such as tramlines, in comparison to general infield areas, can have a higher bulk density (and lower estimated porosity) near the soil surface and lower saturated hydraulic conductivity (both attributable to compaction). These trafficked areas, although forming a small proportion of the field area, could therefore have a disproportionate impact on the potential generation of surface runoff in response to storm events and likely provide rapid overland flow routes connecting runoff to the local watercourse network. Further research is needed to test these ideas and also address the challenge of how to represent such processes in hydrological models, particularly given the apparent disparity of scales. Trafficked areas such as tramlines can also act as significant sources of soil erosion (Saggau et al., 2023). Whilst the controlled traffic field in the dataset was on flat terrain and not vulnerable to soil erosion, tramlines are likely to present a significant issue for more steeply sloping sites. In addition to the soil physical properties, the dataset also contains information on soil moisture variation with depth at the sampled points in time, which may assist in the validation of remotely sensed soil moisture products. Finally, although this was a snapshot survey over 2021, the impact of NFM measures on soil properties is only likely to fully emerge over a longer timescale and this therefore provides a valuable baseline reference against which future changes may be compared.
The supplement related to this article is available online at https://doi.org/10.5194/essd-17-4277-2025-supplement.
JC, JB, and GO formulated the research concept and secured the research funding. JC and JB, supported by ET, designed the research methodology. ET, JR, and PS collected the field survey data. JR and ET undertook the laboratory sample analysis. ET and JR determined secondary derived data. JB quality-controlled the field and laboratory data. ET and JR compiled and curated the final dataset. This element of the LANDWISE project was led and managed by JB, ET, and PR, supported by JC and GO. JR prepared the initial paper draft, with contributions from ET and JB. JB, JR, ET, and PR reviewed, edited, and contributed to subsequent paper revisions.
The contact author has declared that none of the authors has any competing interests.
Publisher’s note: Copernicus Publications remains neutral with regard to jurisdictional claims made in the text, published maps, institutional affiliations, or any other geographical representation in this paper. While Copernicus Publications makes every effort to include appropriate place names, the final responsibility lies with the authors.
This LANDWISE research was supported by the UK Natural Environment Research Council (grant ref. NE/R004668/1) under its Natural Flood Management Research Programme. Additional support was kindly provided by the Natural Environment Research Council, UK Centre for Ecology & Hydrology, and University of Reading to mitigate the impacts of the Covid-19 pandemic on this research. The participation and assistance of the land owners and managers are also gratefully acknowledged, particularly their sharing of local knowledge and insights about soils and hydrology at individual survey sites. The authors also thank Paul Blackwell and an anonymous reviewer for their constructive comments and suggestions which greatly improved the final paper.
This research has been supported by the Natural Environment Research Council (grant no. NE/R004668/1).
This paper was edited by Christof Lorenz and reviewed by Paul Blackwell and one anonymous referee.
Aki, E. E. and Antigha, N. R. B.: Some physical properties of soils overlying limestone parent material in South Eastern Nigeria, Nig. J. Soil Sci., 25, 1–7, 2015.
Antille, D. L., Peets, S., Galambošová, J., Botta, G. F., Rataj, V., Macak, M., Tullberg, J. N., Chamen, W. C. T., White, D. R., Misiewicz, P. A., Hargreaves, P. R., Bienvenido, J. F., and Godwin, R. J.: Review: Soil compaction and controlled traffic farming in arable and grass cropping systems, Agron. Res., 17, 653–682, https://doi.org/10.15159/AR.19.133, 2019.
Blackwell, P. S., Ringrose-Voase, A. J., Jayawardane, N. S., Olsson, K. A., McKenzie, D. C. and Mason, W. K.: The use of air-filled porosity and intrinsic permeability to air to characterize structure of macropore space and saturated hydraulic conductivity of clay soils, J. Soil Sci., 41, 215–228, https://doi.org/10.1111/j.1365-2389.1990.tb00058.x, 1990.
Blake, G. R.: Particle density, edited by: Chesworth, W., Springer Netherlands, Dordrecht, 504–505, https://doi.org/10.1007/978-1-4020-3995-9_406, 2008.
Blake, J., Trill, E., O'Brien, A., Clark, J., Hares, A., Ingham, A., Whitwam, B., Sherlock, E., Clarke, T., Theobald, H., Robotham, J., Verhoef, A., Hammond, J., White, K., Macdonald, D., Short, C., Nisbet, T., Frost, R., Gantlett, R., Gold, J., Willson, B., Old, G., Love, A., and McGeehin, P.: Soil near-surface properties, vegetation observations, land use and land management information for 1800 locations across the Thames catchment, UK, 2018–2021, Environmental Information Data Centre (EIDC), https://doi.org/10.5285/9ab5285f-e9c4-4588-ba21-476e79e87668, 2022.
Blanco-Canqui, H. and Ruis, S. J.: No-tillage and soil physical environment, Geoderma, 326, 164–200, https://doi.org/10.1016/j.geoderma.2018.03.011, 2018.
Carsel, R. F. and Parrish, R. S.: Developing Joint Probability Distributions of Soil Water Retention Characteristics, Water Resour. Res., 24, 755–769, 1988.
Cleophas, F., Isidore, F., Musta, B., Mohd Ali, B. N., Mahali, M., Zahari, N. Z., and Bidin, K.: Effect of soil physical properties on soil infiltration rates, J. Phys. Conf. Ser., 2314, 012020, https://doi.org/10.1088/1742-6596/2314/1/012020, 2022.
ColourBrewer: Color Advice for Maps, https://colorbrewer2.org/, last access: 12 January 2023.
Cooper, E., Blyth, E., Cooper, H., Ellis, R., Pinnington, E., and Dadson, S. J.: Using data assimilation to optimize pedotransfer functions using field-scale in situ soil moisture observations, Hydrol. Earth Syst. Sci., 25, 2445-2458, https://doi.org/10.5194/hess-25-2445-2021, 2021.
Dadson, S. J., Hall, J. W., Murgatroyd, A., Acreman, M., Bates, P., Beven, K., Heathwaite, L., Holden, J., Holman, I. P., Lane, S. N., O'Connell, E., Penning-Roswell, E., Reynard, N., Sear, D., Thorne, C., and Wilby, R.: A restatement of the natural science evidence concerning catchment-based “natural” flood management in the UK, Proc. R. Soc. A-Math., 473, 20160706, https://doi.org/10.1098/rspa.2016.0706, 2017.
Decagon: Mini Disk Infiltrometer, https://publications.metergroup.com/Manuals/20421_Mini_Disk_Manual_Web.pdf, last access: 19 October 2022.
Fu, Z., Hu, W., Beare, M., Thomas, S., Carrick, S., Dando, J., Langer, S., Müller, K., Baird, D., and Lilburne, L.: Land use effects on soil hydraulic properties and the contribution of soil organic carbon, J. Hydrol., 602, 126741, https://doi.org/10.1016/j.jhydrol.2021.126741, 2021.
Germer, S., Neill, C., Krusche, A. V., and Elsenbeer, H.: Influence of land-use change on near-surface hydrological processes: Undisturbed forest to pasture, J. Hydrol., 380, 473–480, https://doi.org/10.1016/j.jhydrol.2009.11.022, 2010.
Hartmann, M. and Six, J.: Soil structure and microbiome functions in agroecosystems, Nat. Rev. Earth Environ., 4, 4–18, https://doi.org/10.1038/s43017-022-00366-w, 2022.
Haruna, S. I., Aanderson, S. H., Nkongolo, N. V., and Zaibon, S.: Soil Hydraulic Properties: Influence of Tillage and Cover Crops, Pedosphere, 28, 430–442, https://doi.org/10.1016/S1002-0160(17)60387-4, 2018.
Haynes, R. J. and Francis, G. S.: Effects of mixed cropping farming systems on changes in soil properties on the Canterbury Plains, N. Z. J. Ecol., 14, 73–82, 1990.
Hollis, J. M., Lilly, A., Higgins, A., Jones, R. J. A., Keay, C. A., and Bellamy, P.: Predicting the water retention characteristics of UK mineral soils, Eur. J. Soil Sci., 66, 239–252, https://doi.org/10.1111/ejss.12186, 2015.
Indoria, A. K., Sharma, K. L., and Reddy, K. S.: Hydraulic properties of soil under warming climate, in: Climate Change and Soil Interactions, Elsevier, 473–508, https://doi.org/10.1016/B978-0-12-818032-7.00018-7, 2020.
Lilly, A.: The relationship between field-saturated hydraulic conductivity and soil structure: Development of class pedotransfer functions, Soil Use Manag., 16, 56–60, https://doi.org/10.1111/j.1475-2743.2000.tb00174.x, 2000.
Martínez-Mena, M., Carrillo-López, E., Boix-Fayos, C., Almagro, M., García Franco, N., Díaz-Pereira, E., Montoya, I., and de Vente, J.: Long-term effectiveness of sustainable land management practices to control runoff, soil erosion, and nutrient loss and the role of rainfall intensity in Mediterranean rainfed agroecosystems, CATENA, 187, 104352, https://doi.org/10.1016/j.catena.2019.104352, 2020.
McHugh, A. D., Tullberg, J. N., and Freebairn, D. M.: Controlled traffic farming restores soil structure, Soil Tillage Res., 104, 164–172, https://doi.org/10.1016/j.still.2008.10.010, 2009.
METER Environment: Mini Disk Infiltrometer Macro., https://library.metergroup.com/Sales and Support/METER Environment/New-Minidisk-Infiltrometer-Macro.xlsx, last access: 11 August 2025.
Mihelič, R., Pečnik, J., Glavan, M., and Pintar, M.: Impact of Sustainable Land Management Practices on Soil Properties: Example of Organic and Integrated Agricultural Management, Land, 10, 8, https://doi.org/10.3390/land10010008, 2020.
Nimmo, J. R.: Porosity and pore-size distribution, in: Encyclopedia of Soils in the Environment, Elsevier, 295–303, https://doi.org/10.1016/B0-12-348530-4/00404-5, 2005.
Niu, C. Y., Musa, A., and Liu, Y.: Analysis of soil moisture condition under different land uses in the arid region of Horqin sandy land, northern China, Solid Earth, 6, 1157–1167, https://doi.org/10.5194/se-6-1157-2015, 2015.
Page, K. L., Dang, Y. P., and Dalal, R. C.: The Ability of Conservation Agriculture to Conserve Soil Organic Carbon and the Subsequent Impact on Soil Physical, Chemical, and Biological Properties and Yield, Front. Sustain. Food Syst., 4, 1–17, https://doi.org/10.3389/fsufs.2020.00031, 2020.
Peck, A. J., Luxmoore, R. J., and Stolzy, J. L.: Effects of spatial variability of soil hydraulic properties in water budget modeling, Water Resour. Res., 13, 348–354, https://doi.org/10.1029/WR013i002p00348, 1977.
Saggau, P., Kuhwald, M., and Duttmann, R.: Effects of contour farming and tillage practices on soil erosion processes in a hummocky watershed. A model-based case study highlighting the role of tramline tracks, Catena, 228, 107126, https://doi.org/10.1016/j.catena.2023.107126, 2023.
Schaap, M. G., Leij, F. J., and van Genuchten, M. T.: rosetta: a computer program for estimating soil hydraulic parameters with hierarchical pedotransfer functions, J. Hydrol., 251, 163–176, https://doi.org/10.1016/S0022-1694(01)00466-8, 2001.
Shaheb, M. R., Venkatesh, R., and Shearer, S. A.: A Review on the Effect of Soil Compaction and its Management for Sustainable Crop Production, J. Biosyst. Eng., 46, 417–439, https://doi.org/10.1007/s42853-021-00117-7, 2021.
Singh, D., Mishra, A. K., Patra, S., Mariappan, S., Singh, N., and Kar, S. K.: Spatial variability of soil hydraulic and physical properties in erosive sloping agricultural fields, Water Sci. Eng., 16, 1–10, https://doi.org/10.1016/j.wse.2022.10.001, 2022.
Soane, B. D., Ball, B. C., Arvidsson, J., Basch, G., Moreno, F., and Roger-Estrade, J.: No-till in northern, western and south-western Europe: A review of problems and opportunities for crop production and the environment, Soil Tillage Res., 118, 66–87, https://doi.org/10.1016/j.still.2011.10.015, 2012.
Soilmoisture Equipment Corp.: Guelph Permeameter – Operating Instructions, http://www.soilmoisture.com (last access: 11 August 2025), 2012.
SoilMoisture Equipment Corp.: Guelph Permeameter K-sat Calculator, https://www.soilmoisture.com/resources/Software-Downloads/ (last access: 11 August 2025) 2023.
Strudley, M., Green, T., and Ascoughii, J.: Tillage effects on soil hydraulic properties in space and time: State of the science, Soil Till. Res., 99, 4–48, https://doi.org/10.1016/j.still.2008.01.007, 2008.
Terefe, H., Argaw, M., Tamene, L., Mekonnen, K., Recha, J., and Solomon, D.: Effects of sustainable land management interventions on selected soil properties in Geda watershed, central highlands of Ethiopia, Ecol. Process., 9, 14, https://doi.org/10.1186/s13717-020-0216-2, 2020.
Trill, E., Blake, J., Robotham, J., Scarlett, P., Rameshwaran, P., Old, G., and Clark, J.: Hydraulic and hydrological data from surface and subsurface soils across the Thames catchment, UK, 2021, Environmental Information Data Centre (EIDC), https://doi.org/10.5285/a32f775b-34dd-4f31-aafa-f88450eb7a90, 2022.
Usowicz, B. and Lipiec, J.: Spatial variability of saturated hydraulic conductivity and its links with other soil properties at the regional scale, Sci. Rep., 11, 1–12, https://doi.org/10.1038/s41598-021-86862-3, 2021.
Vereecken, H., Weynants, M., Javaux, M., Pachepsky, Y., Schaap, M. G., and van Genuchten, M. T.: Using Pedotransfer Functions to Estimate the van Genuchten-Mualem Soil Hydraulic Properties: A Review, Vadose Zone J., 9, 795–820, https://doi.org/10.2136/vzj2010.0045, 2010.
Vogelmann, E. S., Reichert, J. M., Prevedello, J., Consensa, C. O. B., Oliveira, A. É., Awe, G. O., and Mataix-Solera, J.: Threshold water content beyond which hydrophobic soils become hydrophilic: The role of soil texture and organic matter content, Geoderma, 209–210, 177–187, https://doi.org/10.1016/j.geoderma.2013.06.019, 2013.
Wang, X., He, J., Bai, M., Liu, L., Gao, S., Chen, K., and Zhuang, H.: The Impact of Traffic-Induced Compaction on Soil Bulk Density, Soil Stress Distribution and Key Growth Indicators of Maize in North China Plain, Agriculture, 12, 1220, https://doi.org/10.3390/agriculture12081220, 2022.
Wösten, J. H., Lilly, A., Nemes, A., and Le Bas, C.: Development and use of a database of hydraulic properties of European soils, Geoderma, 90, 169–185, https://doi.org/10.1016/S0016-7061(98)00132-3, 1999.
Zhang, R.: Determination of Soil Sorptivity and Hydraulic Conductivity from the Disk Infiltrometer, Soil Sci. Soc. Am. J., 61, 1024–1030, https://doi.org/10.2136/sssaj1997.03615995006100040005x, 1997.