the Creative Commons Attribution 4.0 License.
the Creative Commons Attribution 4.0 License.
 | 19 Aug 2025
Fluorescent aerosol particles in the Finnish sub-Arctic during the Pallas Cloud Experiment 2022 campaign
Jürgen Gratzl
David Brus
Konstantinos Doulgeris
Alexander Böhmländer
Ottmar Möhler
Hinrich Grothe
Fluorescent aerosol particles (FAPs), as a fraction of total aerosol particles (TAPs), were measured online with a Wideband Integrated Bioaerosol Sensor 5/NEO (WIBS, Droplet Measurement Technologies) from mid-September to mid-December during the Pallas Cloud Experiment 2022 (PaCE22) at the station of Sammaltunturi, located in the sub-Arctic region of Finnish Lapland. The WIBS measures particle size distributions from 0.5 to 30 µm and fluorescence in three channels of single aerosol particles, as well as particle concentrations. Since biological aerosol particles can exhibit intrinsic fluorescence, FAP concentration can be used as a proxy for primary biological aerosol particles (PBAPs) like bacteria, fungal spores and pollen. The concentrations and size distributions of different fluorescent particles, together with meteorological data and air mass trajectories, allow valuable insights into the emission of PBAPs from northern boreal forests and their dynamic in the atmosphere. We found a clear seasonal trend for most FAP types and a strong, sudden decrease in concentration after the surrounding ground is covered in snow. Caution should be taken in interpreting the data as interference may be introduced by non-biological fluorescent particles like secondary organic aerosols or soot, as well as biological secondary organic aerosols. The data are available from the open data repository Zenodo under the following DOI: https://doi.org/10.5281/zenodo.13885888 (Gratzl and Grothe, 2024).
- Article
(3012 KB) - Full-text XML
- BibTeX
- EndNote


The atmosphere is a dynamic reservoir of diverse aerosol particles, influenced by both anthropogenic and biological sources. Aerosol particles play a vital role in the radiative balance of Earth's atmosphere by scattering and absorbing sunlight, either directly or by changing cloud albedo and cloud lifetime (Lohmann and Feichter, 2005). A special subset of aerosols are the primary biological aerosol particles (PBAPs) which include but are not limited to airborne viruses, bacteria, fungal spores, pollen grains and plant debris (Després et al., 2012). Due to the interaction of PBAPs with human, animal and plant health (e.g., disease transmission, allergic reactions, crop diseases), fungal spores and pollen grains have been monitored for decades by aerobiologists using traditional methods like the Hirst trap, first introduced in 1952 (Hirst, 1952). This method relies on the capture of PBAPs on a slowly moving sticky microscope slide and subsequent analysis of pollen grains and fungal spores under an optical microscope. Other commonly used techniques involve examining PBAP concentrations with fluorescence microscopes after DNA staining of PBAPs on filters or by incubation on Agar plates (Després et al., 2012). However, these methods have a limited time resolution and require trained personnel, as well as a high expenditure of time to identify PBAPs.
Only in recent years have PBAPs gained more attention from atmospheric scientists, partly because a new technology became commercially available in the late 1990s, i.e., laser or light-induced fluorescence (LiF) of single aerosol particles. The first commercially available instrument was the UV-APS from TSI, first described by Hairston et al. (1997) and Brosseau et al. (2000). Another commonly used instrument is the Wideband Integrating Bioaerosol Sensor (WIBS) from Droplet Measurement Technologies (DMT), which is used in this study. These instruments detect the intrinsic fluorescence of single aerosol particles, enabling the measurement of fluorescent aerosol particles with a high time resolution and in near-real time. Particles of biological origin often contain bio-fluorophores like tryptophan, nicotinamide adenine dinucleotides (NAD(P)H) and riboflavin (Pöhlker et al., 2013), which can be detected using suitable excitation and emission wavelengths. Therefore, fluorescent aerosol particles (FAPs) can be interpreted as a proxy for PBAPs (Artaxo et al., 2022). For example, several field studies showed a good correlation between LiF-instrument-obtained particle concentrations and fungal spores or fungal spore tracers in the field (e.g., Healy et al., 2014; Fernández-Rodríguez et al., 2018; Gosselin et al., 2016; Yue et al., 2019; 2022; Markey et al., 2022).
Beyond an aerobiology and immunology perspective, bioaerosols are also studied in the context of cloud formation. Several laboratory and field studies (for an overview, see Duan et al., 2023; Kanji et al., 2017; Fröhlich-Nowoisky et al., 2016; Després et al., 2012; Hoose and Möhler, 2012; Möhler et al., 2007) showed that biological particles are effective known ice-nucleating particles (INPs), triggering the glaciation of water droplets at very high sub-zero temperatures: for example, the bacteria Pseudomonas syringe was proven to nucleate ice at −2 °C (Maki et al., 1974), making it the most effective known ice nucleator. Besides bacteria, several atmospherically relevant fungal spores (Morris et al., 2013; Haga et al., 2013, 2014; Fröhlich-Nowoisky et al., 2015) and pollen grains (Pummer et al., 2012; Diehl et al., 2001), as well as their associated nanometer-sized macromolecules (Pummer et al., 2012, 2015; Augustin et al., 2013; Wieland et al., 2025), can nucleate ice at high or moderate sub-zero temperatures. Other potentially atmospherically relevant bioparticles like plant debris (Puxbaum and Tenze-Kunit, 2003) or subpollen particles/pollen fragments (Taylor et al., 2004) can also be ice active (Schnell and Vali, 1976; Seifried et al., 2023; Burkart et al., 2021; Matthews et al., 2023). Thus, the traditional methods of aerobiologists might not be suitable for ice nucleation research as they only detect intact and big fungal spores and pollen grains with a low time resolution. Therefore, these methods potentially overlook important contributors to biological INPs, especially in the size range below about 2 µm in diameter (Fernández-Rodríguez et al., 2018). To better understand biological atmospheric ice nucleation, LiF instruments are increasingly being used in field studies addressing the question of if and how biological particles actually play an important role in cloud glaciation and, therefore, precipitation (Fennelly et al., 2018). For instance, a strong link between biological particles measured with LiF instruments and warm INPs has been found in a boreal forest in southern Finland (Schneider et al., 2021) and in the High Arctic (Pereira Freitas et al., 2023).
However, certain non-biological aerosols show fluorescence as well and can therefore bias the measurement: Savage et al. (2017) characterized several biological and non-biological particles in the laboratory and showed that, for instance, PAHs (polyaromatic hydrocarbons) and certain types of soot and brown carbon introduce false positives. In field studies, a correlation between eBC (equivalent black carbon) mass concentrations and certain fluorescent particle types measured with the WIBS (see Table 1) was observed (Gao et al., 2024; Beck et al., 2024; Yue et al., 2022). In Table 1, possible contributors of biological and non-biological aerosol particles that have been identified in both laboratory experiments and field studies are listed.
Table 1WIBS particle classification using all possible combinations of the three channels. Biological and non-biological particles that have been attributed to different channels in laboratory or field studies are listed.
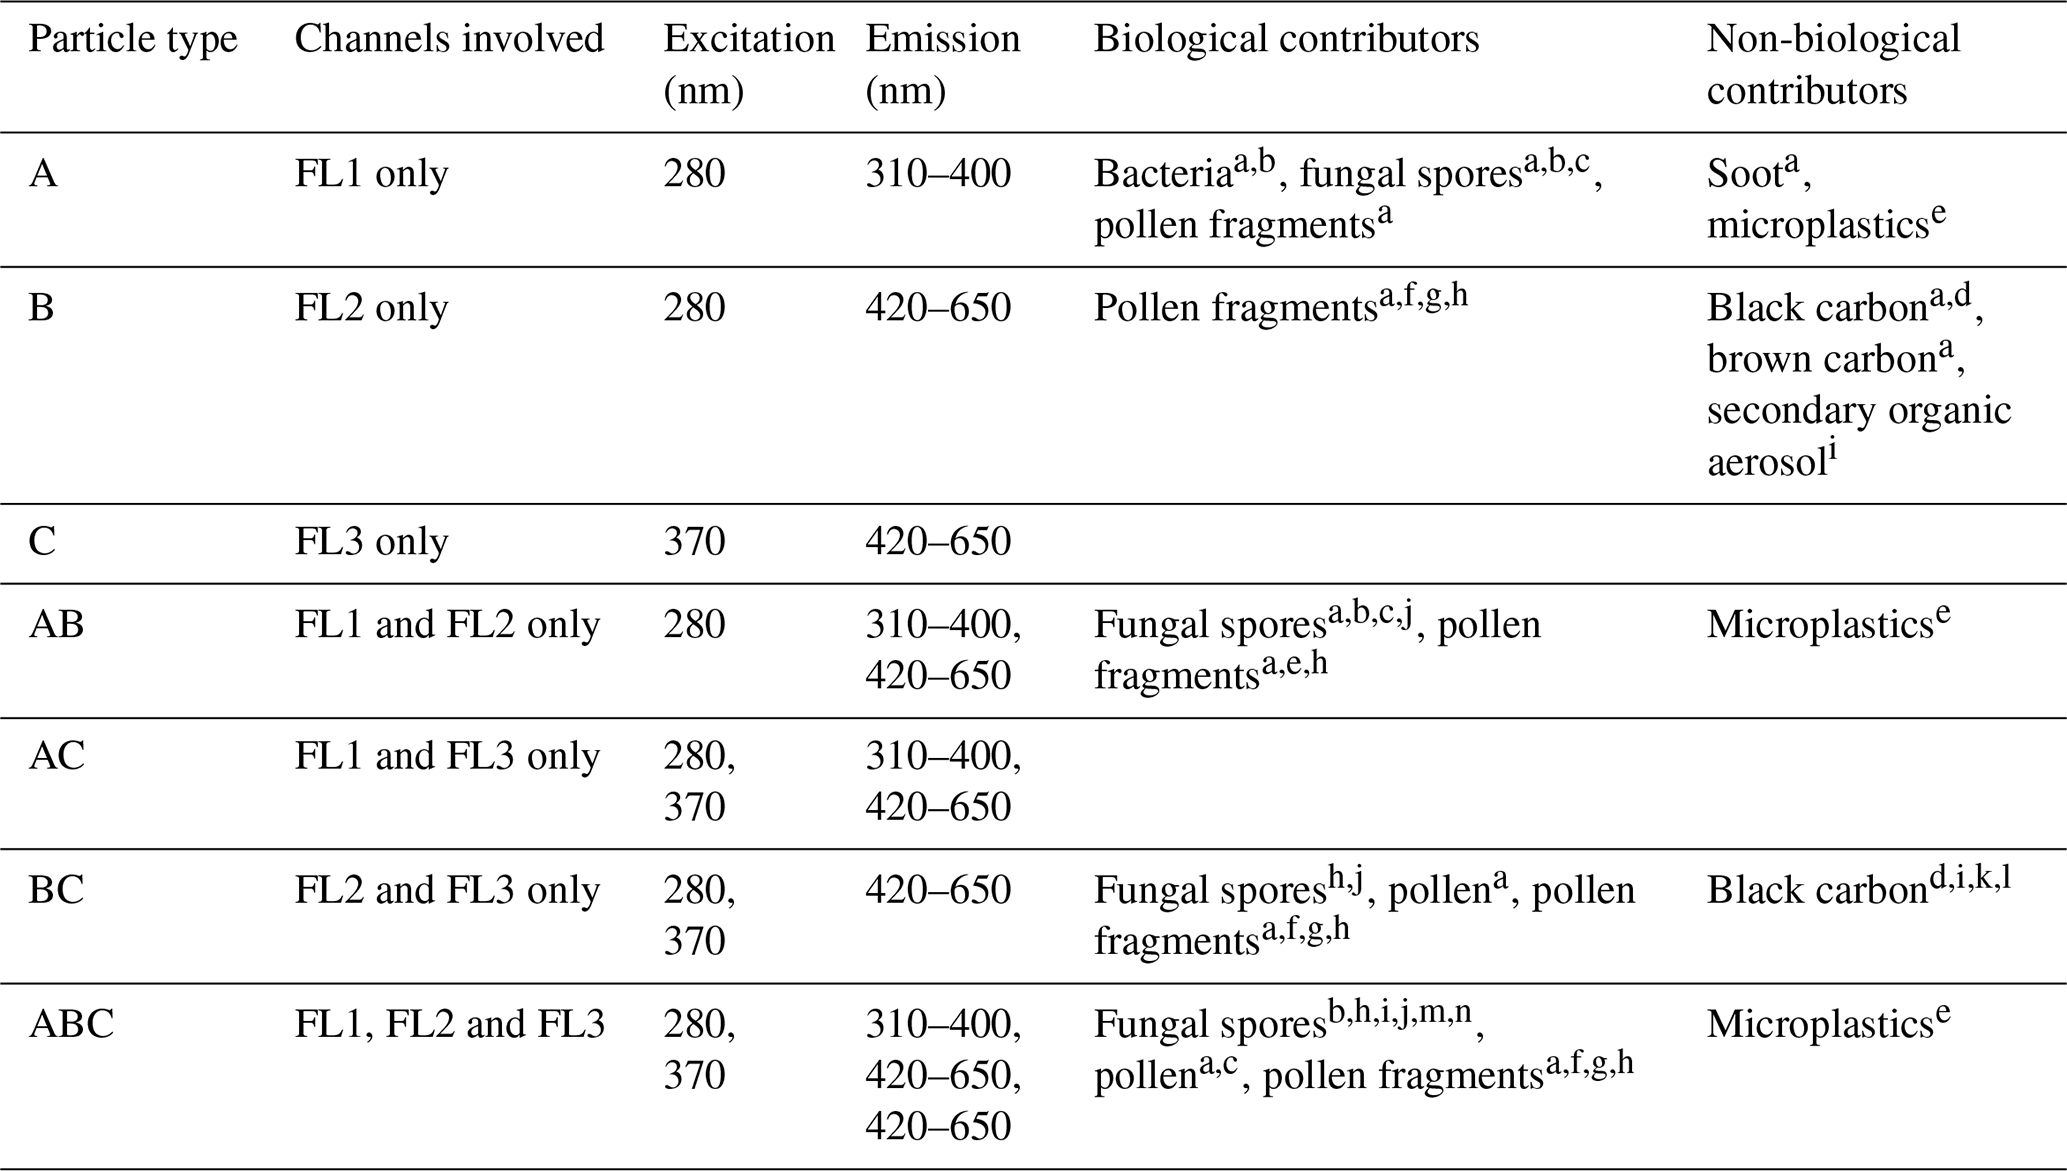
References: a Savage et al. (2017) (laboratory), b Hernandez et al. (2016) (laboratory), c Markey et al. (2022), d Beck et al. (2024), e Gratzl et al. (2024) (laboratory), f Stone et al. (2021) (laboratory), g Hughes et al. (2020), h Mampage et al. (2022), i Yue et al. (2022), j Yue et al. (2019), k Markey et al. (2024), l Gao et al. (2024), m Sarangi et al. (2022), n Fernandez-Rodriguez et al. (2018).
Pallas, as a clean continental background station with minimal anthropogenic influence, is an ideal site to study ambient fluorescent aerosol particles (Doulgeris et al., 2022). By choosing an appropriate fluorescent-background threshold (Savage et al., 2017), only minor non-biological interferences are expected. An introduction to and overview of the Pallas Cloud Experiment 2022 (PaCE 2022) campaign is given in Brus et al. (2025).
The instrument was installed at the station of Sammaltunturi, part of the Pallas Atmosphere-Ecosystem Supersite in Finnish Lapland, hosted by the Finnish Meteorological Institute. The station is located at 67.9733° N and 24.1157° E and is approximately 170 km above the Arctic Circle. According to the Köppen climate classification (Köppen, 1931), the location is on the northern edge of the sub-Arctic climate zones (Beck et al., 2018). It is built at an altitude of 565 m above sea level, at the summit of Sammaltunturi Hill. The tree line is approximately 100 m below the station. Above the tree line, the vegetation is dominated by low vascular plants, lichen and moss (Hatakka et al., 2003). The boreal forest around the station consists of pine, spruce and birch (Komppula et al., 2005). The station is located within the Pallas-Yllästunturi National Park. Local or regional sources of air pollution are scarce. Therefore, Sammaltunturi is an important station to measure background air in northern Europe (Lohila et al., 2015) and is an ideal place to observe biological aerosol particles using single-particle fluorescence measurements as the surrounding boreal forest is an important source of PBAPs (Schumacher et al., 2013) and because false positives (non-biological fluorescent particles) are minimized due to the clean air conditions.
Near-real-time measurements of fluorescent and total aerosol particles were conducted with the Wideband Integrated Bioaerosol Sensor WIBS 5/NEO (DMT), referred to hereafter as the WIBS. The WIBS operated with an inlet flow of 0.3 Lmin−1 and an internally produced sheath flow of 2.1 Lmin−1. A 635 nm laser is used to measure the size of single particles via Mie-scattering-induced intensity reduction, as well as a trigger signal for two xenon lamps firing at 280 and 370 nm, used as a fluorescence excitation source. The emitted fluorescence is collected with two detectors in the wavelength ranges of 310–400 and 410–650 nm. Therefore, a fluorescence signal can be detected in three channels: FL1 (excitation at 280 nm and emission at 310–400 nm), FL2 (excitation at 280 nm and emission at 410–650 nm) and FL3 (excitation at 380 nm and emission at 410–650 nm). The fourth option (excitation at 380 nm and emission at 310–400 nm) is omitted due to elastic scattering. A particle is considered to be fluorescent if it exceeds the fluorescence threshold in any channel. The threshold TH is obtained by the equation
using the forced-trigger mode of the WIBS during which the xenon lamps are triggered without any particles present. The mean fluorescence value of each channel during the forced-trigger mode plus a certain factor n of the standard deviation σ is calculated for each channel individually and used as the threshold of the channel.
In this data set, a particle is classified as a FAP if it exceeds the threshold calculated with 3σ, whereas it is classified as a highly fluorescent aerosol particle (HFAP) when it exceeds the 9σ threshold. The three channels can be combined using Perring nomenclature (Perring et al., 2015), where every possible combination of the three channels is considered. Thus, seven types of FAPs and HFAPs can be defined, as described in Table 1. The maximum concentration is specified as 466 particles cm−3 for FAP counting (10 % coincidence) and 9500 particles cm−3 for sizing and counting (10 % coincidence). A study on the counting efficiency and size accuracy of the WIBS NEO can be found in Lieberherr et al. (2021). In their study, the specific instrument used seems to reach an upper detection limit for particle diameters larger than 10 µm. However, the authors comment that this might be specific to this exact instrument. Laboratory experiments with pollen and microplastic particles>10 µm with the exact WIBS that is used in this study are not consistent with the findings of Lieberherr and colleagues as pollen particles bigger than 40 µm were detected (Gratzl et al., 2024).
Analysis was conducted with the WIBS toolkit (DMT) implemented in IGOR pro 9. Due to the dead time of the two xenon lamps, a dead time correction for FAPs is integrated into the toolkit. Therefore, the concentration of excited particles (those which get counted and sized and have their fluorescence intensity measured) is not reported here. Due to the generally low aerosol concentrations at the site, the ratio of excited particles to total particles is high, with a median value of 98.76 % (mean: 97.68 %) for the whole campaign.
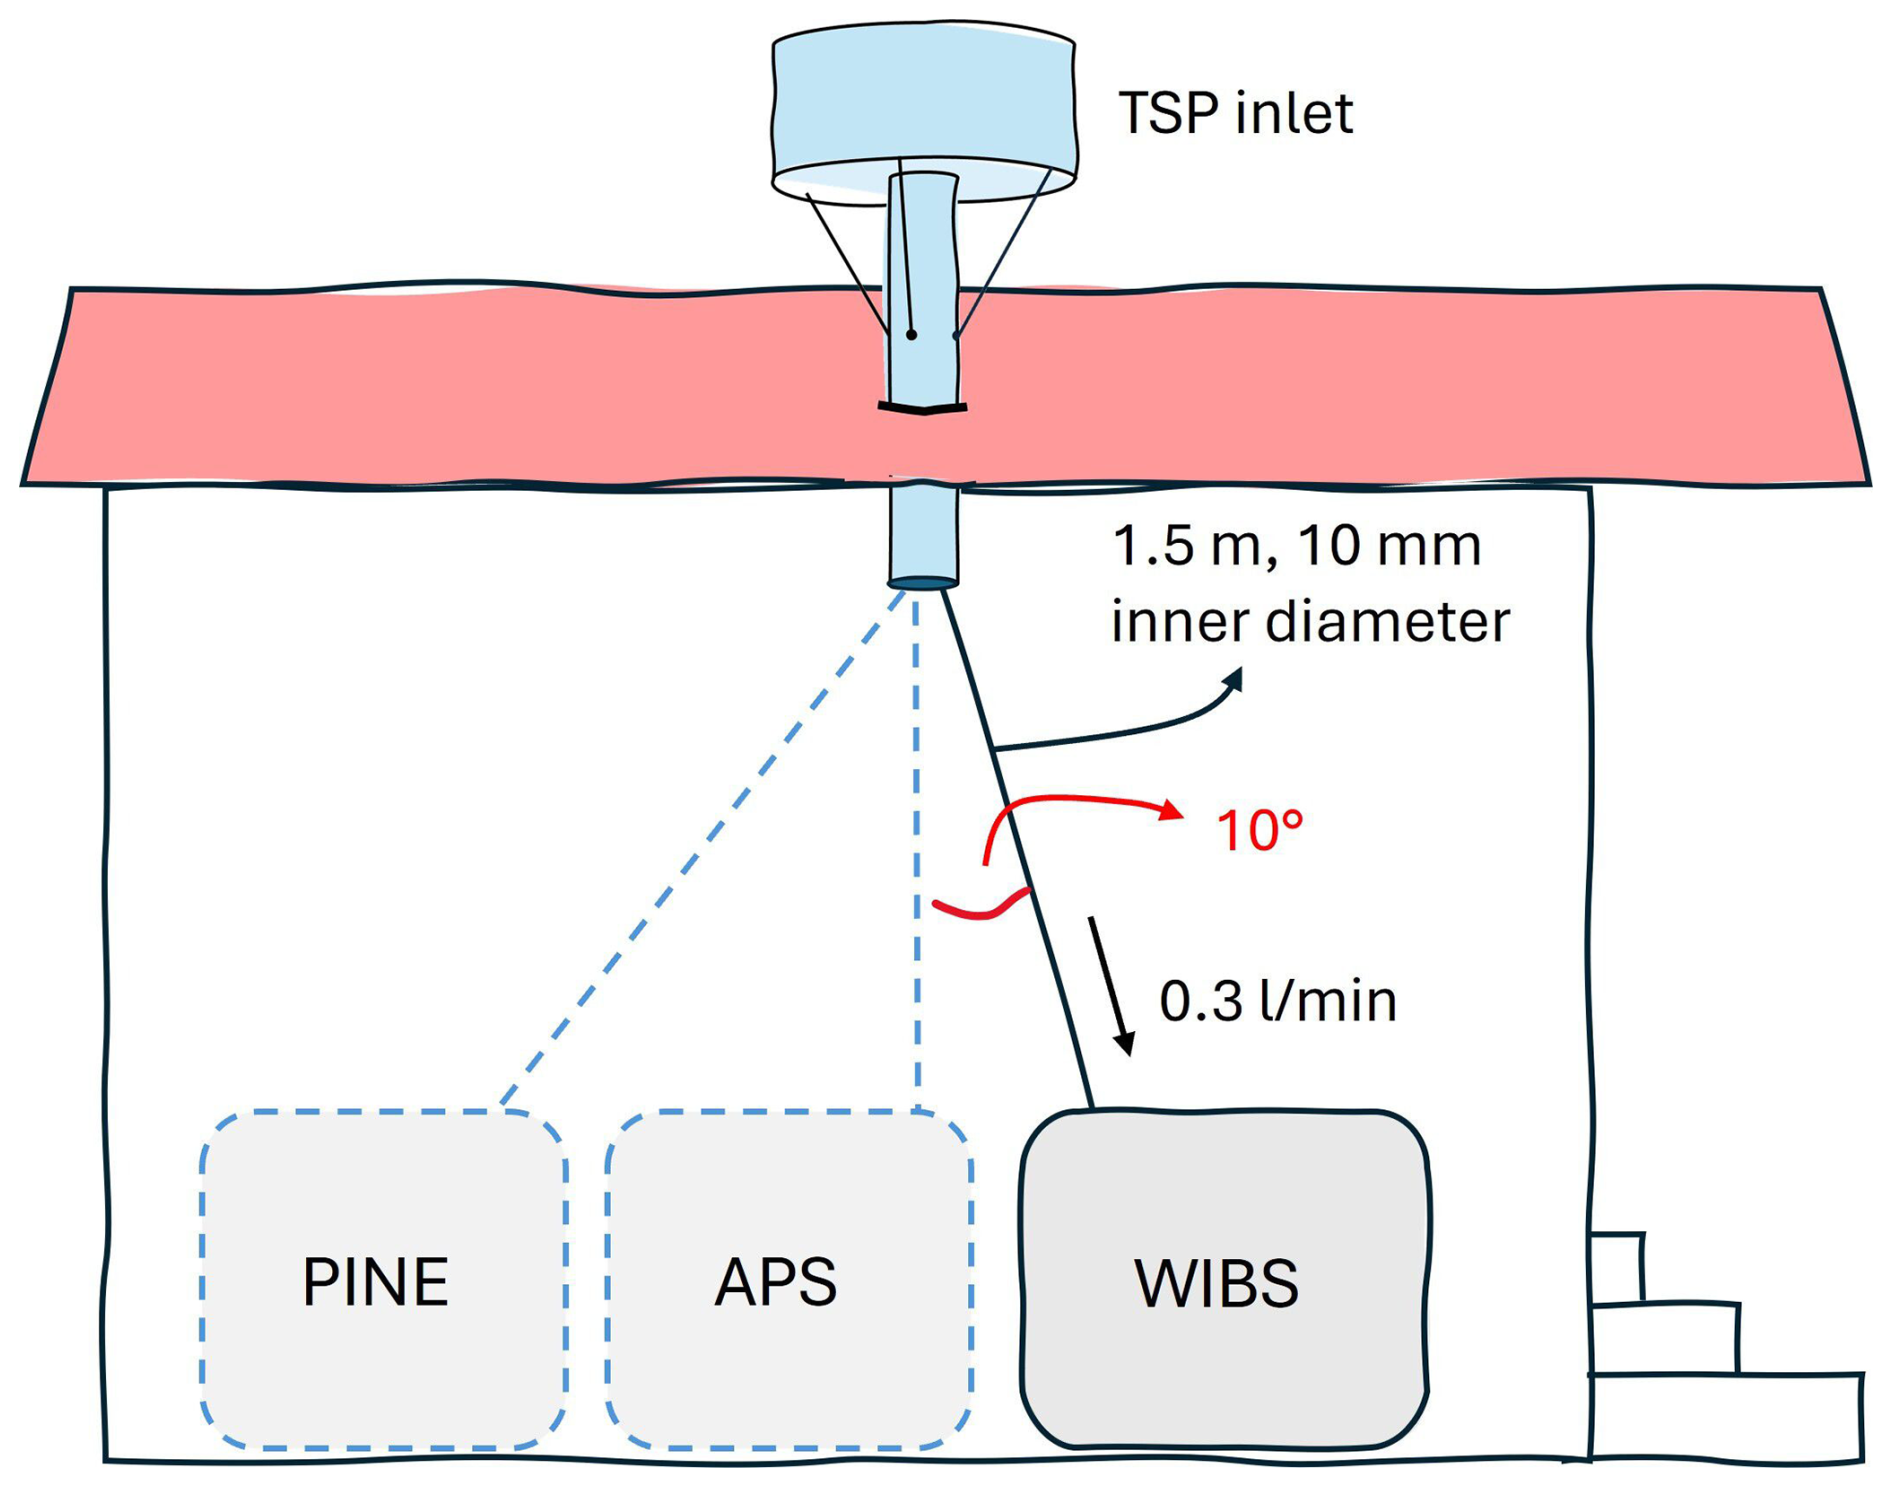
The instrument was attached to an ACTRIS (Aerosol, Clouds and Trace Gases Research Infrastructure)-approved, heated total air inlet. Cloud droplets (and crystals) enter the system but evaporate on their way to the instruments. The inlet was connected to the instrument with conductive tubing (i.d.=10 mm and L∼1.5 m). Although the tubing to the WIBS was kept as vertical as possible, a slight angle of approximately 10° could not be avoided. Consequently, at a low flow rate of 0.3 L min−1, we expect great losses for super-coarse (>10 µm) particles due to sedimentation. Theoretical calculations with the Particle Loss Calculator (Weiden et al., 2009) from the Max Planck Institute for Chemistry show particle losses of 7 % at 3 µm and 26 % at 6 µm for only the 1.5 m tubing from the end of the TSP inlet to the instrument assuming a particle density of 1 g cm−3 and a shape factor of 1. For the low flow rate of 0.3 L min−1, no values for particles bigger than 6 µm are available with the Particle Loss Calculator. Also connected to the TSP inlet, amongst other instruments, were an aerodynamic particle sizer (APS, TSI model 3321) and the Portable Ice Nucleation Experiment (PINE, Bilfinger SE, Möhler et al., 2021). The setup is shown in Fig. 1.
The instrument was operated in forced-trigger mode every 6 h for 1 min. The mean values of the forced-trigger intensities (and standard deviations) from the four measurements each day (or less, if not all four were measured) were used to calculate the threshold every 24 h. Over the whole campaign, the threshold calculated from the forced-trigger intensity was relatively constant. A time series of the daily 3σ threshold intensities is depicted in Fig. 2. The standard deviation of the 3σ threshold mean was highest for the FL1 channel, with a relative deviation of ±2.8 % from the mean value. The highest deviation of a single, 1 d mean value was ±9.4 %. The standard deviations for FL2 and FL3 were ±1.5 % and ±2.3 %, respectively.
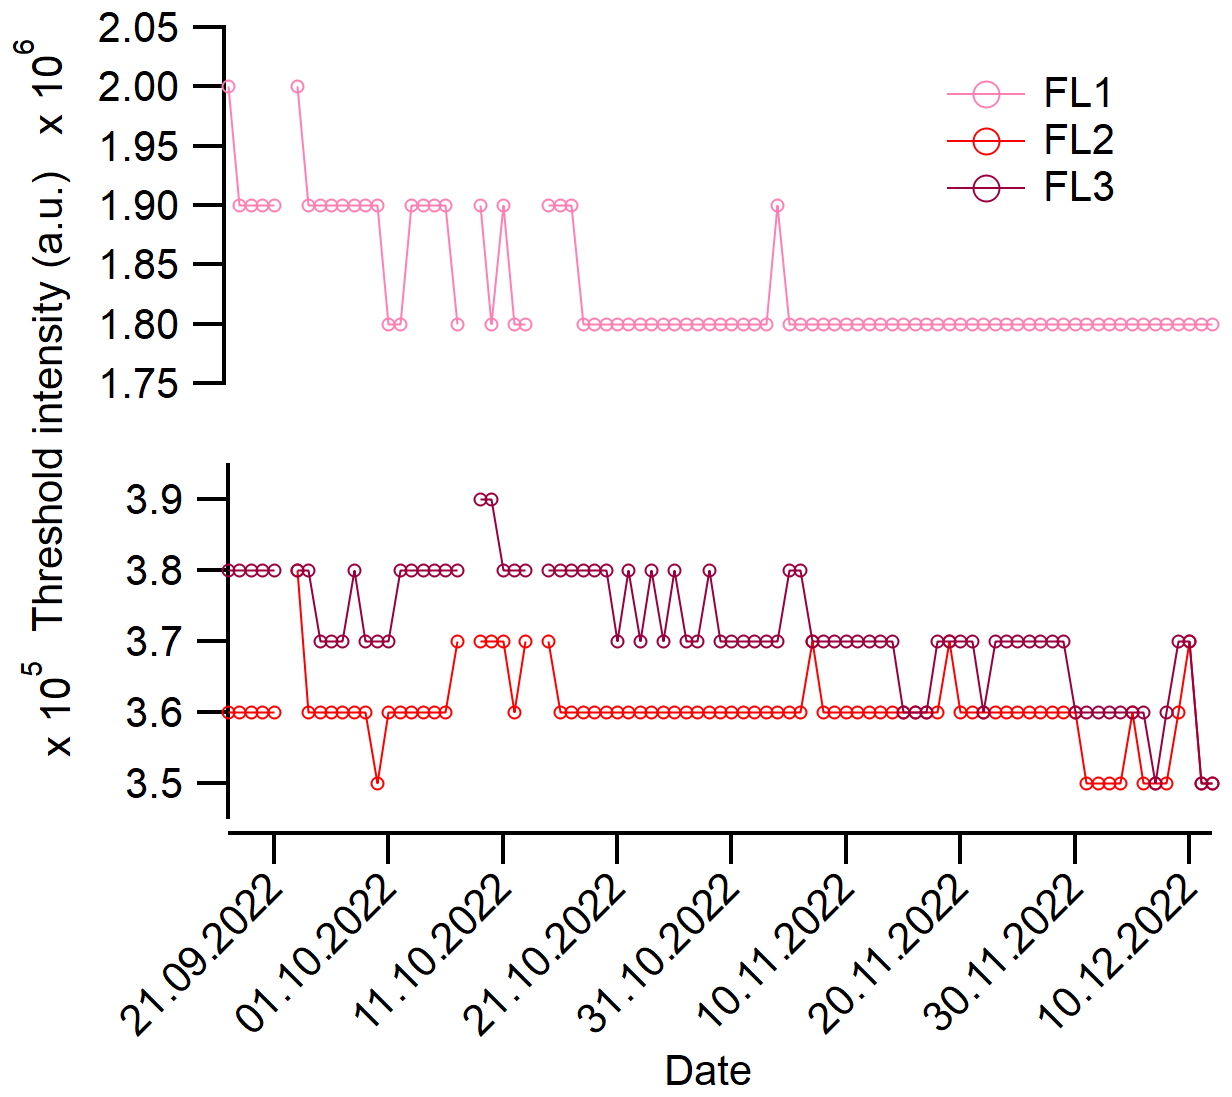
Figure 2Temporal evolution of the 3σ threshold intensities for the three channels. A particle was considered to be fluorescent if its intensity in any channel was higher than the threshold intensity.
This data set contains one file per day, with the naming convention TUW-WIBS_N.b1.yyyymmdd.hhmm.csv, where the date and time indicate the date of the measurement and the time of the first data point, respectively. The data set is accessible under the DOI https://doi.org/10.5281/zenodo.13885888 (Gratzl and Grothe, 2024) from the Zenodo Open Science data archive (http://zenodo.org, last access: 18 November 2024). The files include the number concentrations of total aerosol particles (TAPs), FAPs and HFAPs and the subtypes of the latter two, with diameters of 0.50–30 µm (optical-equivalent diameter), as well as the number size distributions of TAPs, FAPs and HFAPs and the subtypes of the latter two, with diameters of 0.50–30.42 µm (optical-equivalent diameter) in 15 logarithmically equidistant size channels: 0.50–0.66, 0.66–0.86, 0.86–1.14, 1.14–1.50, 1.50–1.97, 1.97–2.59, 2.59–3.40, 3.40–4.47, 4.47–5.88, 5.88–7.73, 7.73–10.17, 10.17–13.37, 13.37–17.59, 19.59–23.13 and 23.13–30.42 µm. The concentrations and size distributions are reported in cm−3. In Table 2, a description of each variable can be found.
Table 2Description of variables in the data set. Variables 2–47 are reported in cm−3. Each size distribution variable (variables 25–47) consists of 15 values per time interval for the 15 size channels and is reported as . The size channels are indicated as “(lower limit_upper limit)” in µm in the data set.
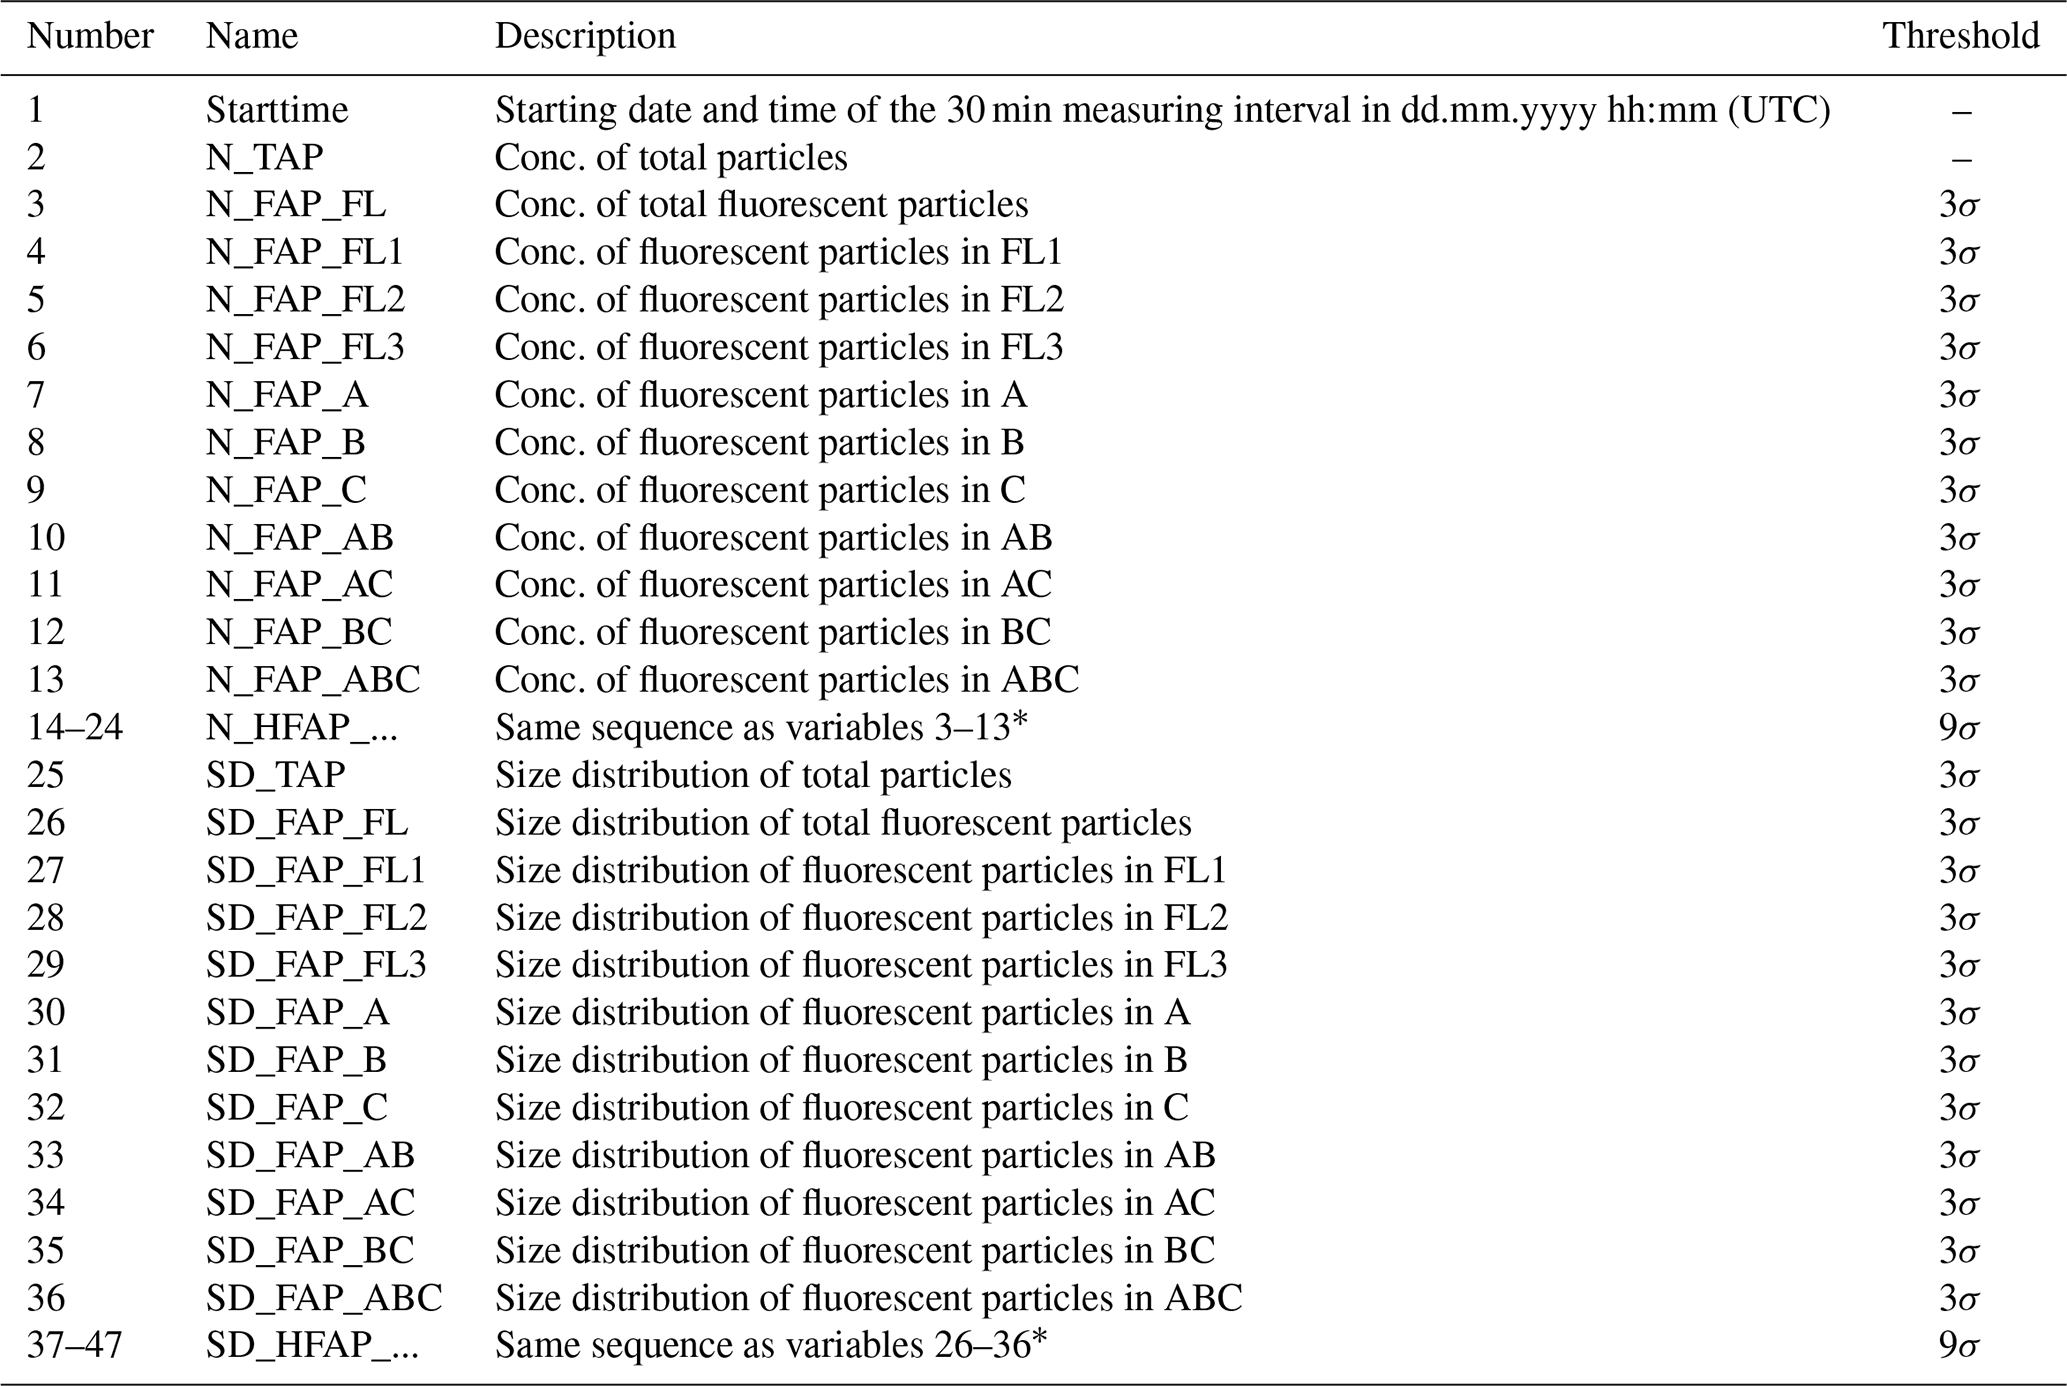
∗ HFAP refers to particles exceeding the 9σ threshold.
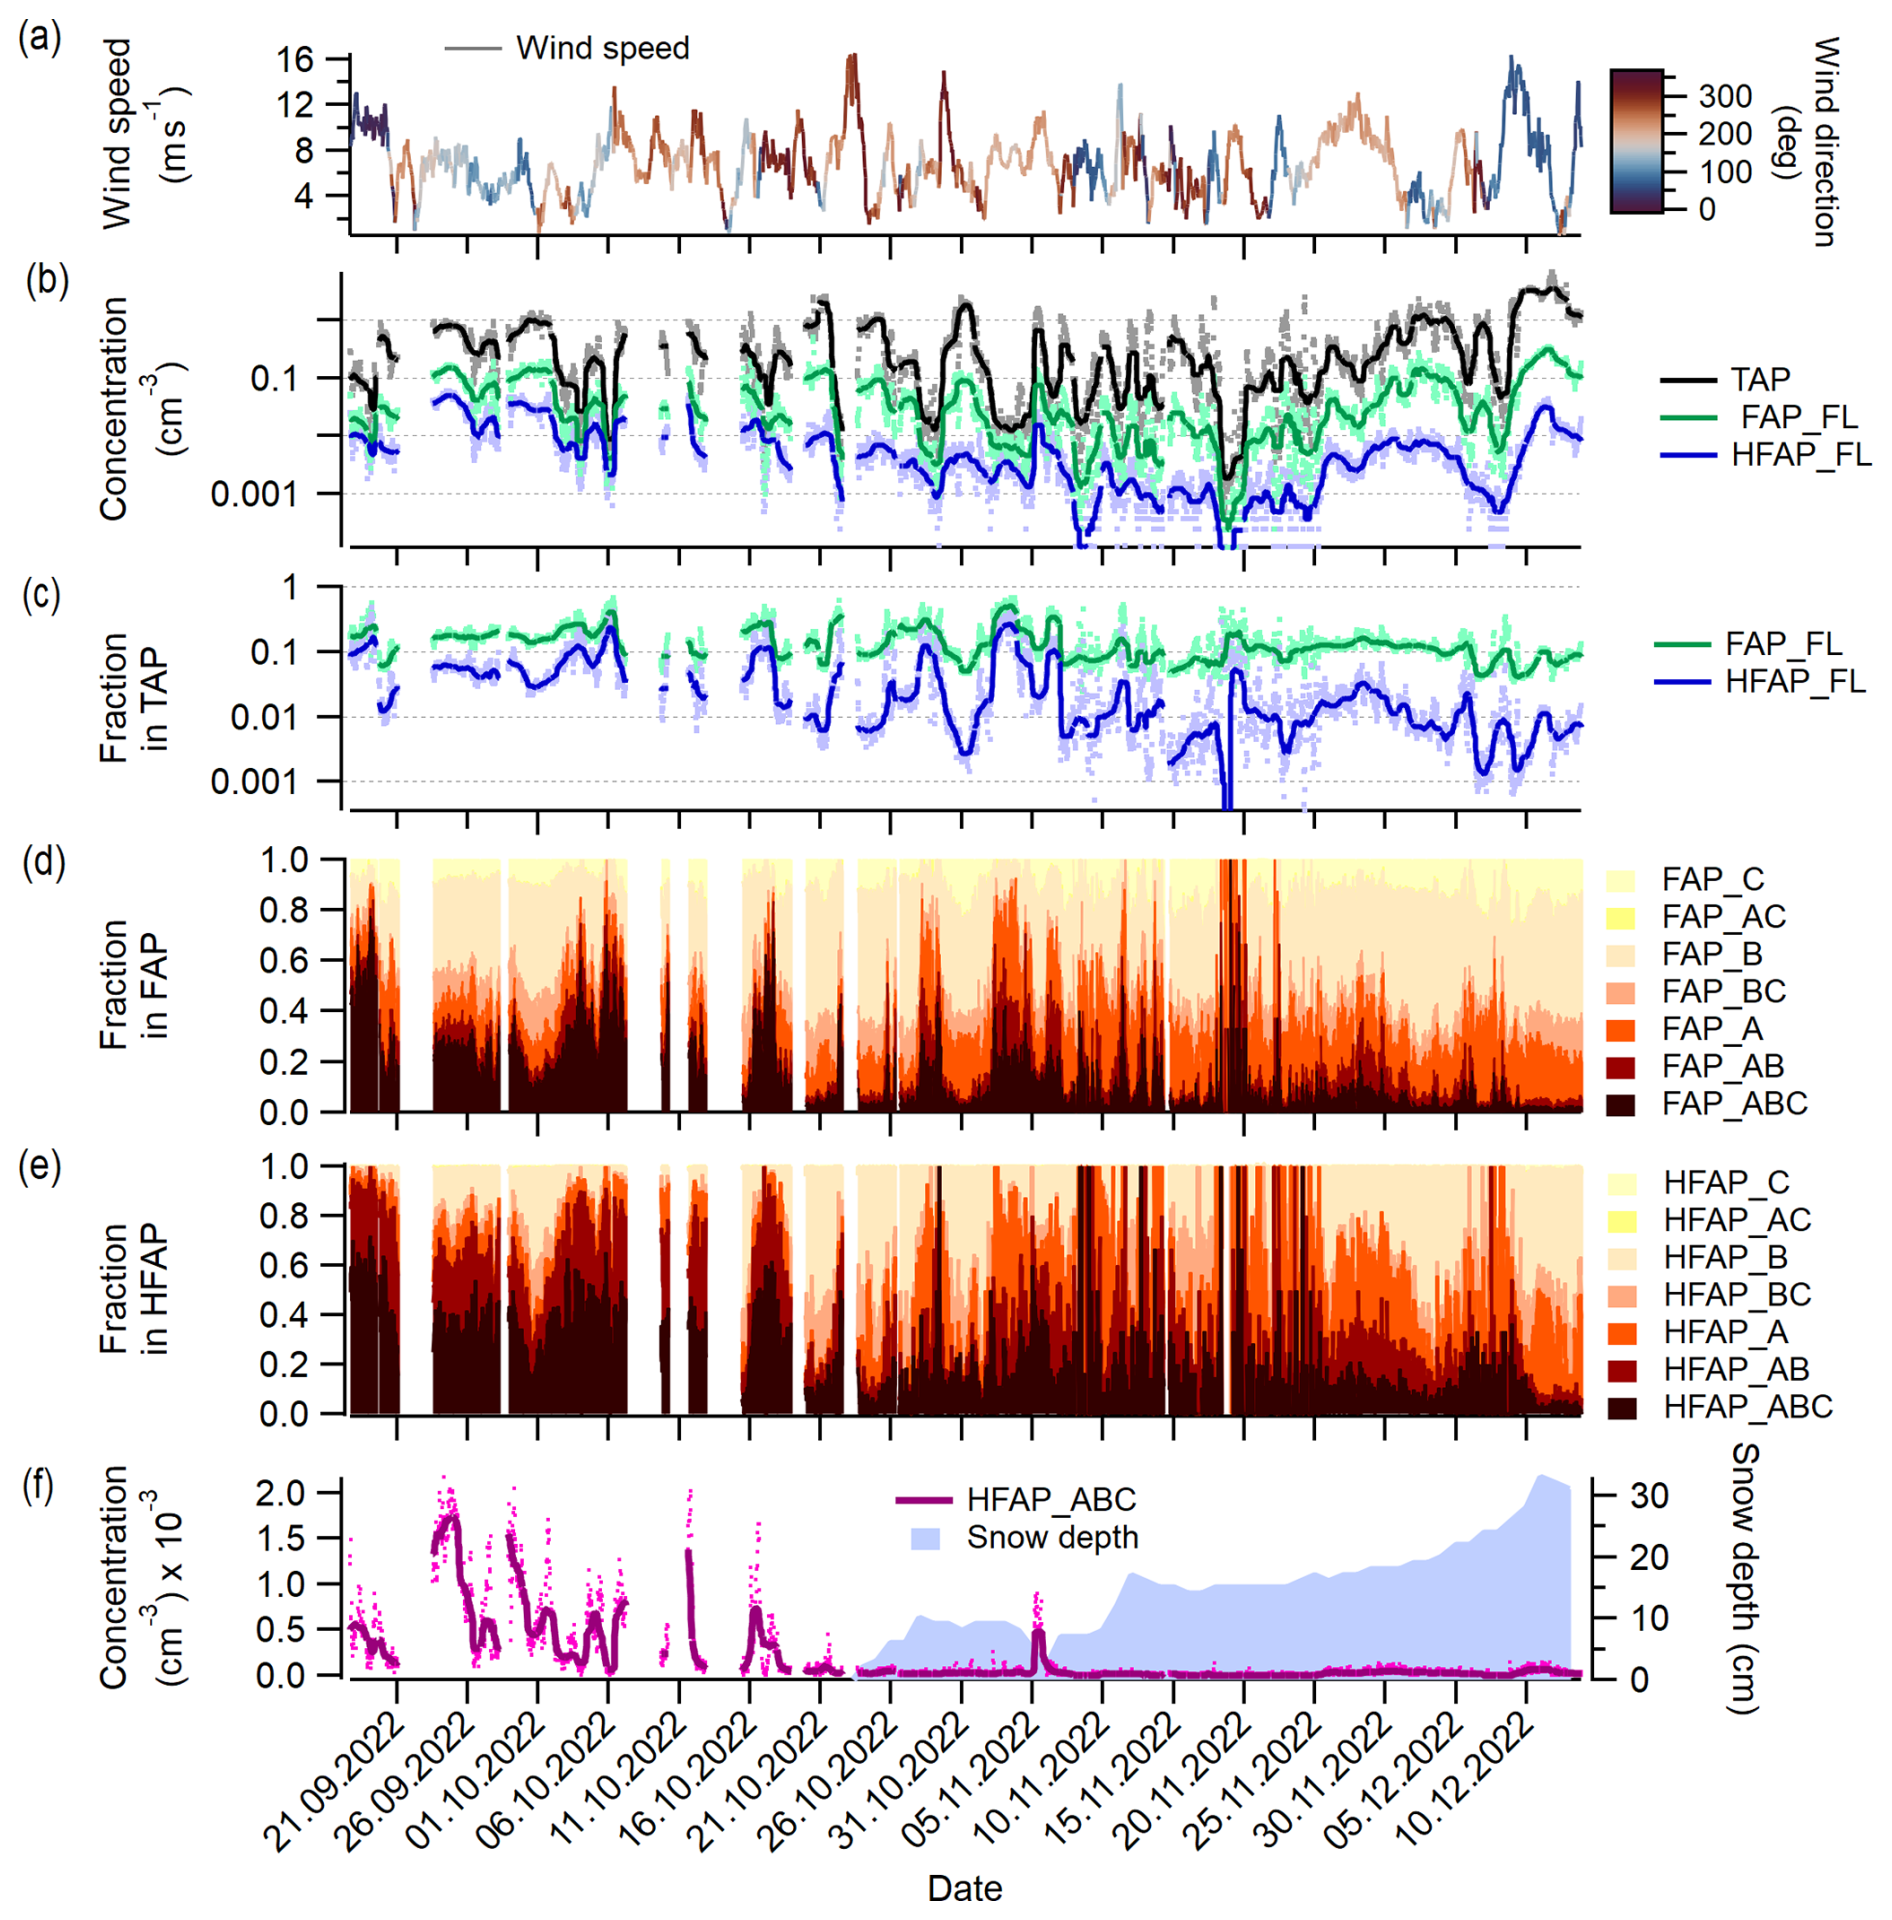
Figure 3Overview of concentrations and fractions of TAPs, FAPs and HFAPs and meteorological variables. (a) Wind speed and wind direction; (b) TAP, FAP and HFAP concentrations; (c) FAP and HFAP fractions in TAP. Markers in (b, c) represent data with the temporal resolution of the data set, while lines represent 24 h running medians. (d) Stacked fractions of all FAP types, (e) stacked fractions of HFAP types, and (f) concentration of HFAP_ABC and snow depth.
All data were carefully monitored and quality controlled. Missing or outlier data points were set to −9999.9. The values of the first data point of every day were deleted and set to −9999.9 since the data analysis software WIBS toolkit gave too low concentrations or values of zero due to the program code. On certain days, the first time stamp of the next day (the deleted one) was also recorded as the last time stamp of the previous day and gave good values. In these cases, these values are used rather than deleting the data from this time stamp. The instrument experienced several breaks throughout the campaign due to software failure. For approximately 2 h after restart, the size distributions of certain fluorescence channels were shifted to smaller sizes, with the maximum always being in the lowest size channel. This effect was seen consistently after every break. Therefore, data from the first 3 h after a restart were omitted. Although the total concentrations did not seem to be affected, number concentration values were also set to −9999.9 for these periods. Single data points for which the concentration of fluorescent particles was 3 times higher than the mean value of the three previous and three subsequent data points were examined in detail to rule out artificial spikes. For some data points, the higher concentration compared to the neighboring ones originated from a single increase of more than a factor of 100 and lasting less than 2 s in detected particles, which also showed higher fluorescence intensities. This clearly points to an unphysical event. These data points were interpreted as artifacts, and the values were set to −9999.9. The origin of these artifacts is not clear.
A size calibration was carried out to test the instruments' ability for accurate particle sizing before and after the campaign. Before the campaign, polystyrene latex spheres (PSLs) with a physical diameter of 1 µm were atomized and recorded by the instrument, which detected the peak of the size distribution within 4 % of the physical diameter at 1.04 µm. After the campaign, PSLs of 0.8, 1 and 2 µm were measured. The instrument response was within 10 % of the physical diameter for the 2 µm PSL at 1.8 µm and below 3 % for the remaining sizes (0.995 µm for the 1 µm PSL and 0.78 µm for the 0.8 µm PSL).
Figure 3 provides an overview of concentrations of TAPs and (H)FAPs; fractions of (H)FAPs; and wind speed, wind direction and snow depth over the whole measurement period. Figure 3a shows wind speed and wind direction data measured at the station of Sammaltunturi. Figure 3b displays the TAP, FAP_FL and HFAP_FL concentrations. Both FAP_FL and HFAP_FL concentrations decrease over time by up to 2 orders of magnitude, while TAP concentrations exhibit no clear seasonal trend. The fraction of HFAP_FL in TAPs decreases much more substantially over time than the fraction of FAP_FL (Fig. 3c). Figure 3d and e show the stacked fractions of FAP types within FAP_FL and of HFAP types within HFAP_FL, respectively, revealing changes in the contribution of different particle types. The contribution of AB and ABC particles is much higher at the beginning of the campaign for both cases. ABC (and AB for HFAPs) dominate (H)FAPs until the middle of October, after which A and B particles become the dominant contributors for the remainder of the campaign.
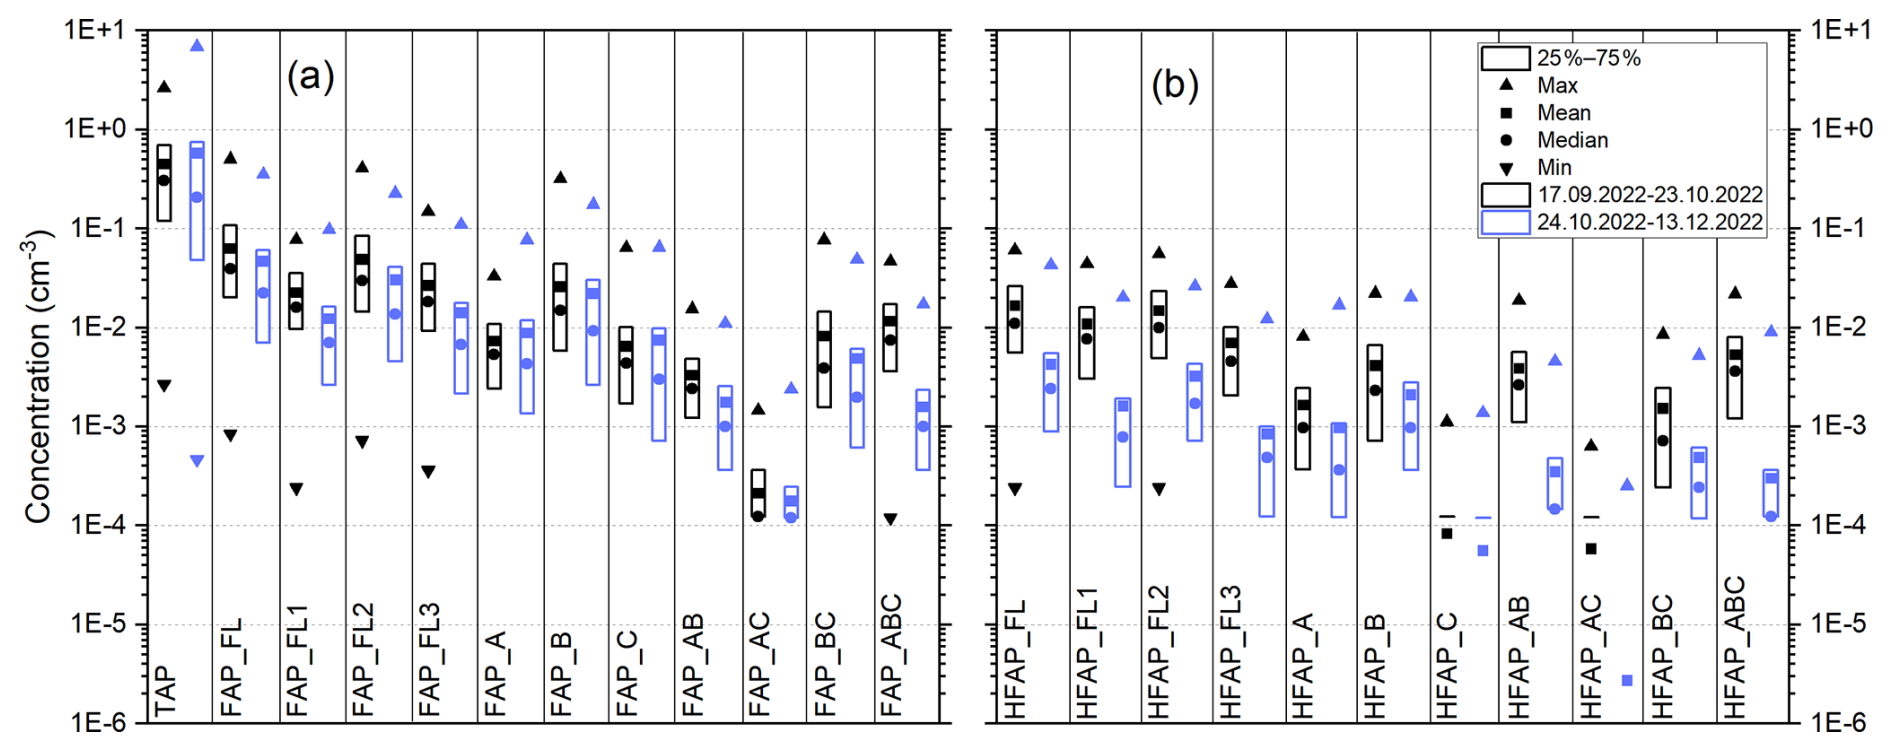
Figure 4Boxplots of concentrations of (a) TAPs and all subtypes of FAPs and (b) all subtypes of HFAPs. In black: concentration from 17 September to 23 October 2022 (snow-free period of the campaign). In blue: concentrations from 24 October to 13 December 2022 (snow-covered period). The horizontal bar in (b) for HFAP_C and HFAP_AC is the 25th percentile.
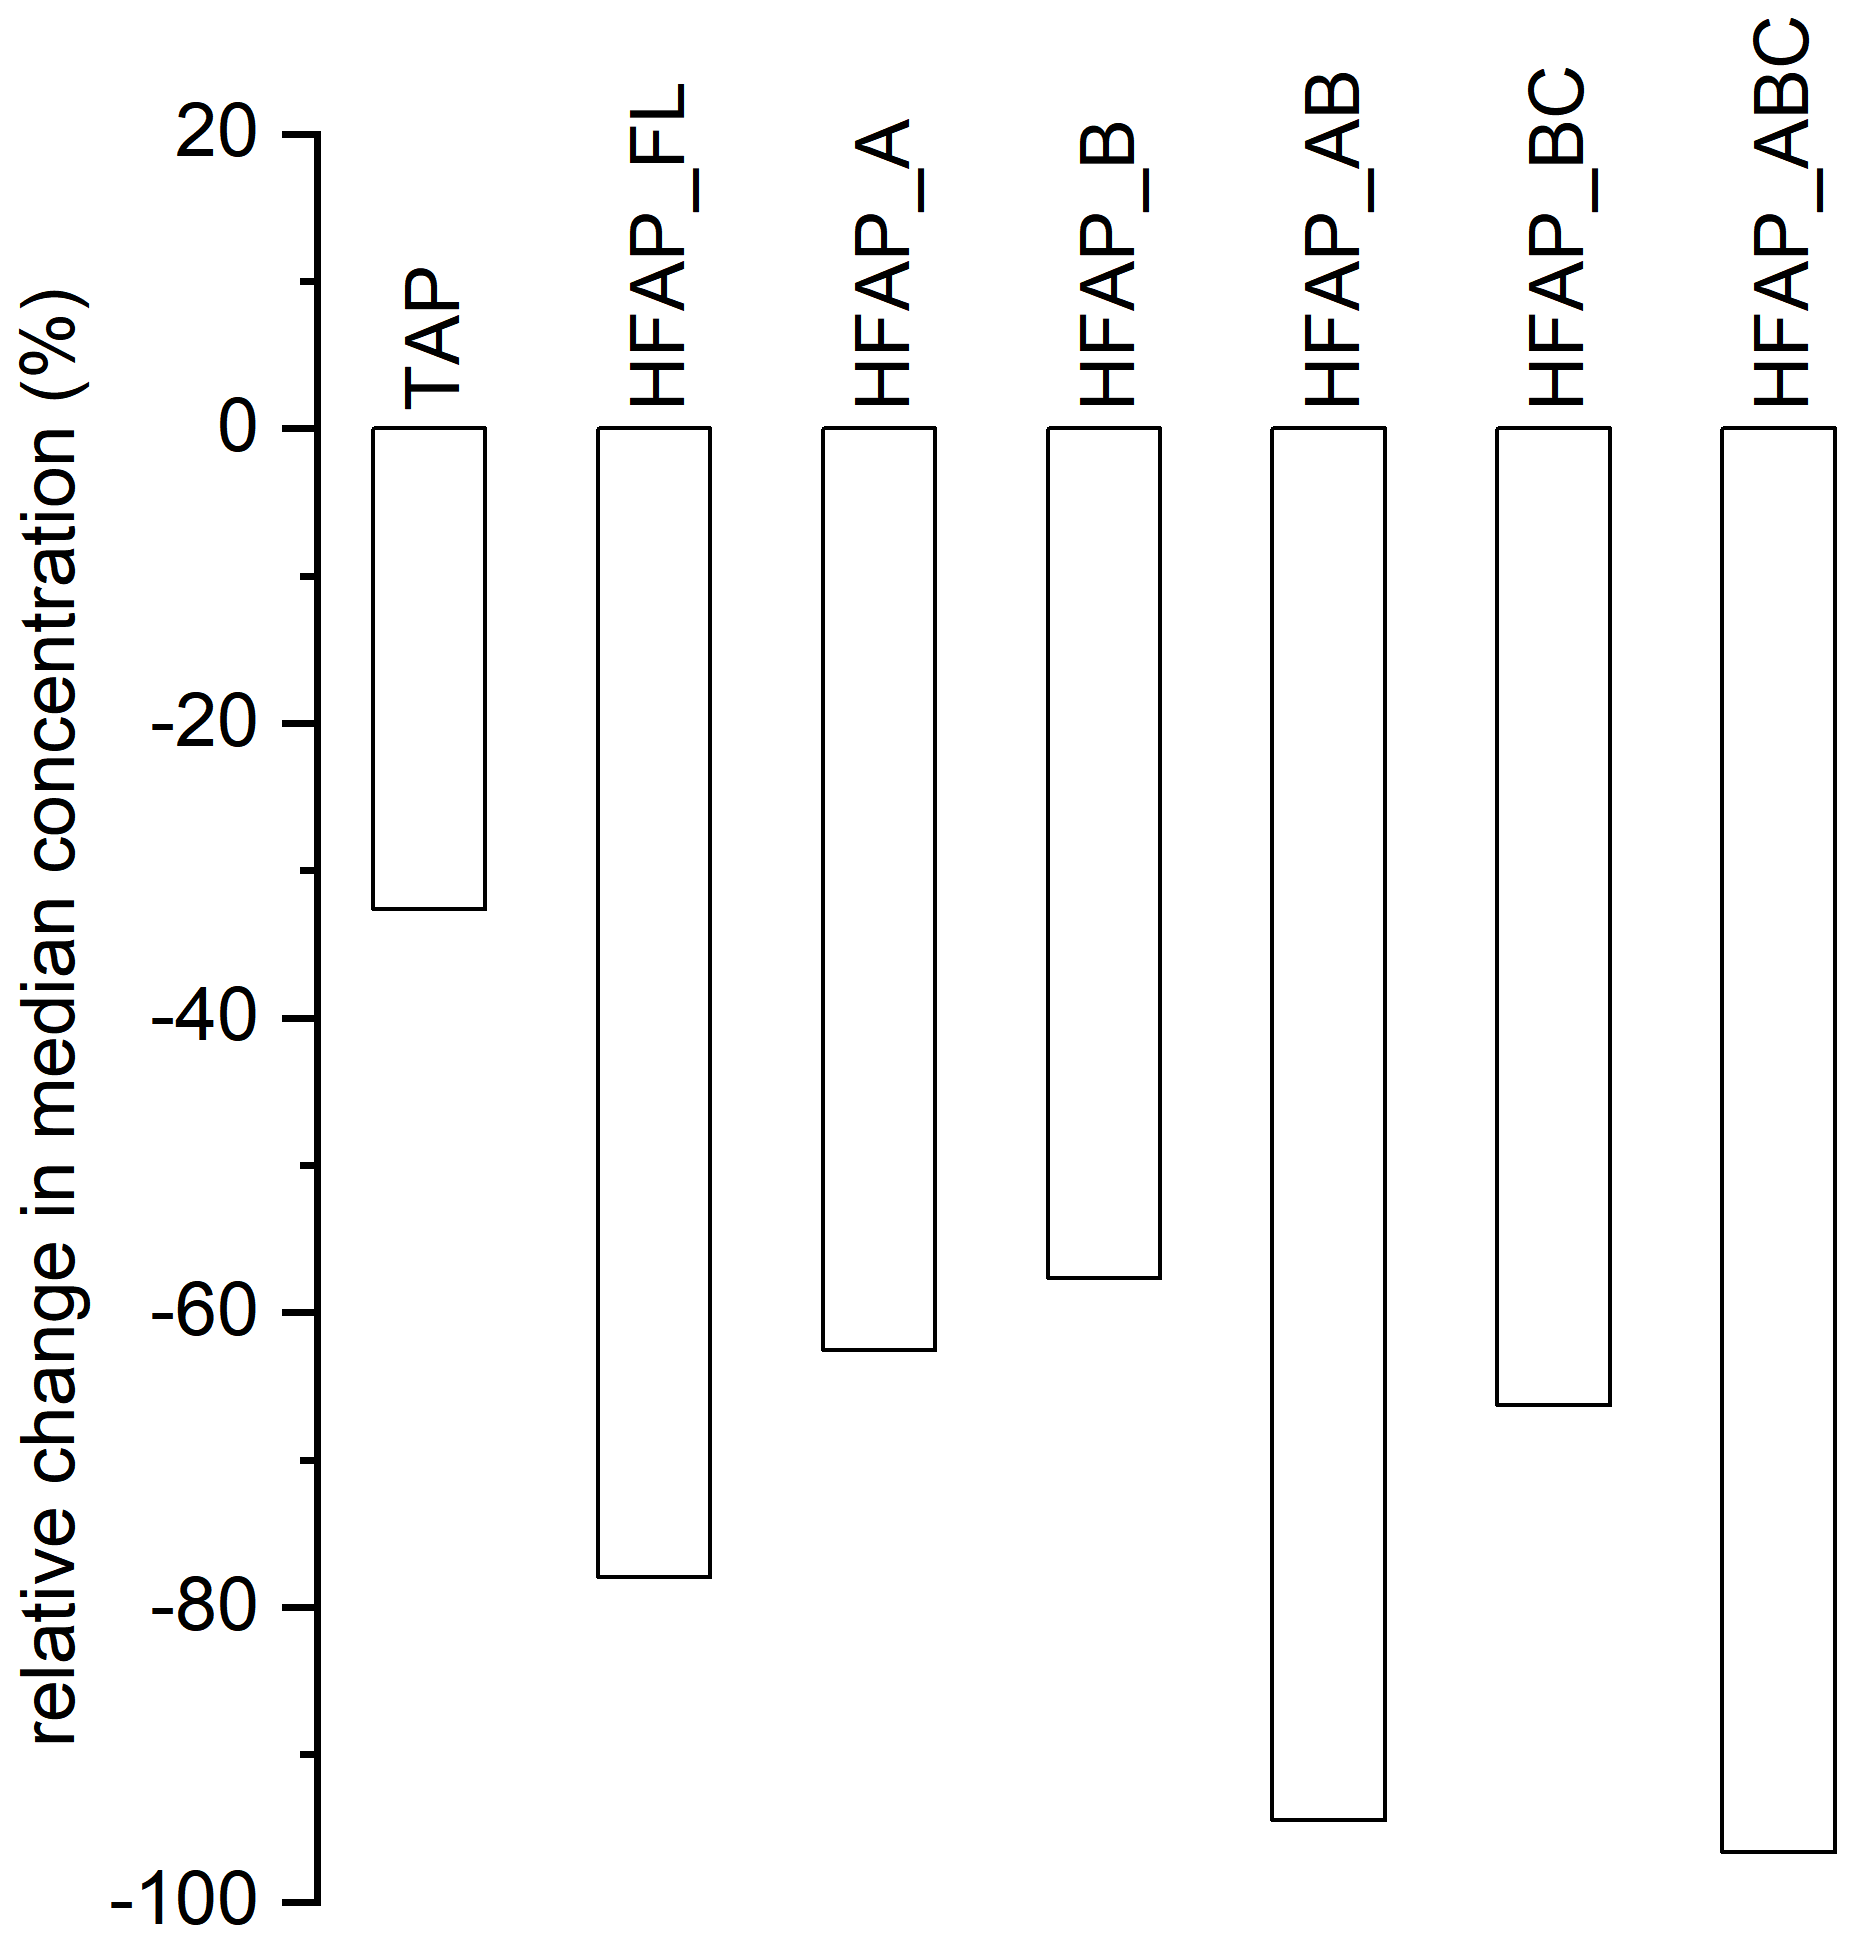
Figure 5Relative change in median concentrations from the snow-free period to the snow-covered period of the campaign for TAP, HFAP_FL and the subtypes of HFAP, except for HFAP_C and HFAP_AC, the medians of which are zero. Mean TAP concentrations decrease by 33 %, while the other particle types decrease more strongly. HFAP_AB and HFAP_ABC decrease most strongly at −94 % and −97 %, respectively.
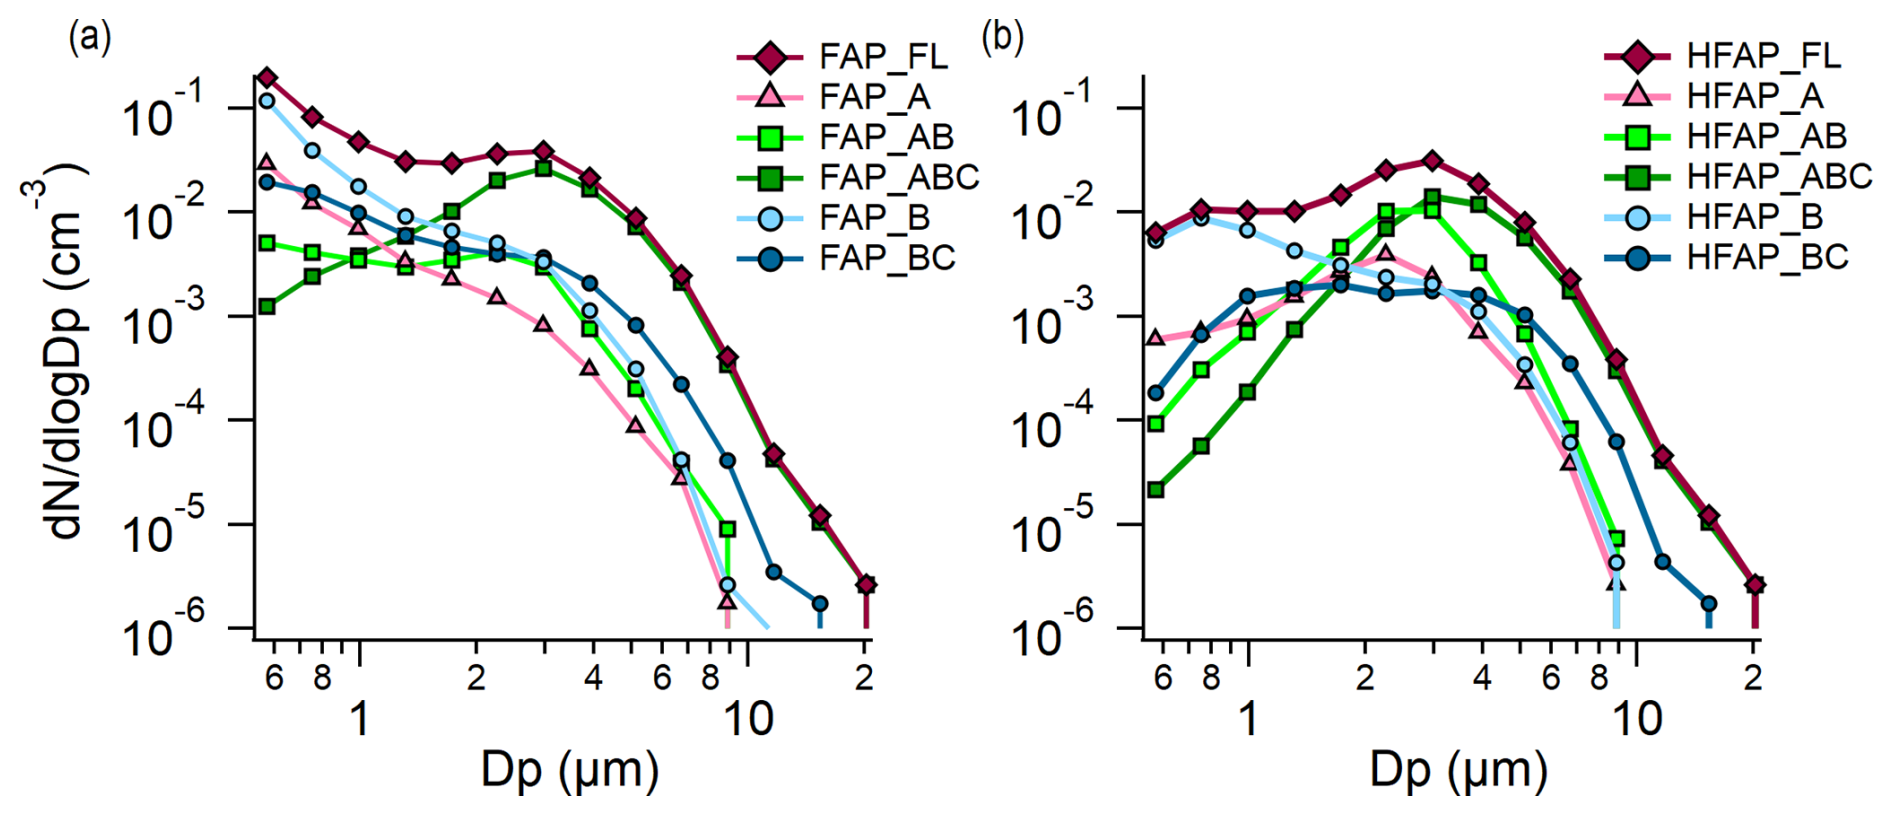
Figure 6Mean size distributions for the snow-free period of (a) FAP_FL and some FAP types and (b) HFAP_FL and some HFAP types.
From 24 October 2022, the surrounding ground was covered in snow. Snow depth was measured at the research station of Kenttärova located at 67.987° N and 24.243° E at 347 m above sea level inside a spruce forest approximately 5.5 km east of the station of Sammaltunturi. In Fig. 3f, the concentration of HFAP_ABC is plotted alongside snow depth. The data indicate that snow cover has a strong influence on (H)FAP concentrations, particularly for the ABC and AB types: once the ground is snow-covered, the concentration of HFAP_ABC decreases rapidly and remains low, with the exception of a brief increase coinciding with a short melting period.
Figure 4 shows boxplots of the concentrations of TAPs, FAPs and HFAPs during the snow-free period (9 September–23 October 2022) and the snow-covered period (24 October–13 December 2022). Permanent snow cover leads to a pronounced decrease in the concentrations of FAPs (Fig. 4a) and, especially, HFAPs (Fig. 4b). In Fig. 5, the relative change in median concentrations from the snow-free period to the snow-covered period is plotted for TAP, HFAP_FL and most HFAP subtypes. While the median concentration for TAP is 33 % lower during the snow-covered time compared to during the snow-free period (the mean concentration increases; see Fig. 3a), the reduction is much more pronounced for the highly fluorescent particle types: HFAP_AB and HFAP_ABC both show reductions exceeding 94 %. The influence of other meteorological variables on HFAP concentrations is discussed in Gratzl et al. (2025), which includes evaluations based on this data set.
Figure 6 presents the mean size distributions () of FAP_FL, HFAP_FL and selected types from the snow-free period. For FAPs (Fig. 6a), the maximum of the distribution occurs in the smallest size channel (0.50–0.66 µm) for all types except FAP_AB and FAP_ABC. The higher fluorescence threshold applied to HFAPs results in the exclusion of most fluorescent particles<1 µm (Fig. 6b). Among the small particles that do exceed this higher fluorescence threshold, the majority are classified as B particles. A comparison of the size distributions of FAPs and HFAPs indicates that the higher concentrations of FAPs relative to that of HFAPs can be attributed to the greater proportion of smaller fluorescent particles present in the FAP population.
Data sets are archived under the DOI https://doi.org/10.5281/zenodo.13885888 (Gratzl and Grothe, 2024) on the Zenodo Open Science data archive (http://zenodo.org, last access: 18 November 2024), where a dedicated community for the Pallas Cloud Experiment (PaCE2022) has been established (https://zenodo.org/communities/pace2022/, last access: 18 November 2024). This community houses the data files along with additional metadata on the data sets from the Pallas Cloud Experiment 2022 campaign.
Wind speed, wind direction and snow depth data are archived at the DOI https://doi.org/10.48436/mgs41-7pc98 (Finnish Meteorological Institute and Gratzl, 2025) in the open data repository TU Wien Research Data.
The PaCE2022 campaign was conducted from September to December 2022 in Pallas in the Finnish sub-Arctic. This paper provides an overview of the data on the concentrations and size distributions of TAPs, FAPs and HFAPs during this campaign, collected at the station of Sammaltunturi at 565 m above sea level. The station was located inside clouds for about 50 % of the measurement period. In Sect. 2, we briefly describe the research site and the vegetation surrounding the location of the WIBS measurements. In Sect. 3, a short overview of the instrument is provided. The measured variables and the quality control of the data were explained in Sect. 4.
These are the first such measurements of fluorescent aerosols at the Sammaltunturi research station. They provide valuable insights into the seasonal dynamics of fluorescent and biological particles and into how snow cover influences their emission. FAPs and HFAP concentrations can be used as a proxy for PBAPs. The size distributions of the different particle types as studied with a WIBS instrument, together with the literature that characterized PBAPs in the laboratory or in field, could help in identifying different types of PBAPs such as bacteria and fungal spores. Together with meteorological data and air mass backward trajectories, the driving forces of the emission of PBAPs from the northern boreal forest can be examined. Caution should be exercised in interpreting particles as pollen grains as they are usually larger than 10 µm. This is a size range that is not well covered in this data set due to inlet losses. Comparison with other aerosol data – for instance, data on black carbon (see Backman et al., 2025) – could give valuable information on interfering particles which are detected as fluorescent but that do not necessarily originate from the biosphere. For example, B and BC particle concentrations have been shown to correlate with black-carbon concentrations in previous field studies (Gratzl et al., 2025; Beck et al., 2024; Gao et al., 2024; Markey et al., 2024; Yue et al., 2022) and account for approximately 50 % of both FAPs and HFAPs in this data set. For further analysis, it is also recommended to categorize the local emissions or potential far-range contributions to FAPs and HFAPs (Gratzl et at., 2025). As PBAPs might play a crucial role in cloud glaciation processes, this data set might also be valuable when compared to INP concentrations, measured with PINE (Böhmländer et al., 2025).
JG performed the measurements with help from all of the authors. JG did the data analysis and wrote the paper. All of the authors contributed to the discussion of the data set and reviewed and edited the paper. DB and KD prepared and organized the PACE 2022 campaign. HG and OM funded the journey. HG purchased the WIBS as part of his appointment.
The contact author has declared that none of the authors has any competing interests.
Publisher's note: Copernicus Publications remains neutral with regard to jurisdictional claims made in the text, published maps, institutional affiliations, or any other geographical representation in this paper. While Copernicus Publications makes every effort to include appropriate place names, the final responsibility lies with the authors.
This article is part of the special issue “Data generated during the Pallas Cloud Experiment 2022 campaign”. It is not associated with a conference.
The authors would like to thank the team from the stations of Metsähallitus and Sammaltunturi for their help with the logistics and for watching over our instrumentation during the PaCE 2022 campaign.
This research has been supported by the Österreichische Forschungsförderungsgesellschaft (grant no. 888109).
This paper was edited by Gholamhossein Bagheri and reviewed by two anonymous referees.
Artaxo, P., Hansson, H.-C., Andreae, M. O., Bäck, J., Alves, E. G., Barbosa, H. M. J., Bender, F., Bourtsoukidis, E., Carbone, S., Chi, J., Decesari, S., Després, V. R., Ditas, F., Ezhova, E., Fuzzi, S., Hasselquist, N. J., Heintzenberg, J., Holanda, B. A., Guenther, A., Hakola, H., Heikkinen, L., Kerminen, V.-M., Kontkanen, J., Krejci, R., Kulmala, M., Lavric, J. V., de Leeuw, G., Lehtipalo, K., Machado, L. A. T., McFiggans, G., Franco, M. A. M., Meller, B. B., Morais, F. G., Mohr, C., Morgan, W., Nilsson, M. B., Peichl, M., Petäjä, T., Praß, M., Pöhlker, C., Pöhlker, M. L., Pöschl, U., Von Randow, C., Riipinen, I., Rinne, J., Rizzo, L. V., Rosenfeld, D., Silva Dias, M. A. F., Sogacheva, L., Stier, P., Swietlicki, E., Sörgel, M., Tunved, P., Virkkula, A., Wang, J., Weber, B., Yáñez-Serrano, A. M., Zieger, P., Mikhailov, E., Smith, J. N., and Kesselmeier, J.: Tropical and Boreal Forest – Atmosphere Interactions: A Review, Tellus B, 24–163, https://doi.org/10.16993/tellusb.34, 2022.
Augustin, S., Wex, H., Niedermeier, D., Pummer, B., Grothe, H., Hartmann, S., Tomsche, L., Clauss, T., Voigtländer, J., Ignatius, K., and Stratmann, F.: Immersion freezing of birch pollen washing water, Atmos. Chem. Phys., 13, 10989–11003, https://doi.org/10.5194/acp-13-10989-2013, 2013.
Backman, J., Luoma, K., Servomaa, H., Vakkari, V., and Brus, D.: In-situ aerosol measurements at the Arctic Sammaltunturi measurement station during the Pallas Cloud Experiment 2022, Earth Syst. Sci. Data Discuss. [preprint], https://doi.org/10.5194/essd-2025-284, in review, 2025.
Beck, H. E., Zimmermann, N. E., McVicar, T. R., Vergopolan, N., Berg, A., and Wood, E. F.: Present and future Köppen–Geiger climate classification maps at 1 km resolution, Scientific Data, 5, 180214, https://doi.org/10.1038/sdata.2018.214, 2018.
Beck, I., Moallemi, A., Heutte, B., Pernov, J. B., Bergner, N., Rolo, M., Quéléver, L. L. J., Laurila, T., Boyer, M., Jokinen, T., Angot, H., Hoppe, C. J. M., Müller, O., Creamean, J., Frey, M. M., Freitas, G., Zinke, J., Salter, M., Zieger, P., Mirrielees, J. A., Kempf, H. E., Ault, A. P., Pratt, K. A., Gysel-Beer, M., Henning, S., Tatzelt, C., and Schmale, J.: Characteristics and sources of fluorescent aerosols in the central Arctic Ocean, Elementa: Science of the Anthropocene, 12, 00 125, https://doi.org/10.1525/elementa.2023.00125, 2024.
Böhmländer, A., Lacher, L., Fösig, R., Büttner, N., Nadolny, J., Brus, D., Doulgeris, K.-M., and Möhler, O.: Measurement of the ice-nucleating particle concentration with the Portable Ice Nucleation Experiment during the Pallas Cloud Experiment 2022, Earth Syst. Sci. Data Discuss. [preprint], https://doi.org/10.5194/essd-2025-89, in review, 2025.
Brosseau, L. M., Vesley, D., Rice, N., Goodell, K., Nellis, M., and Hairston, P.: Differences in Detected Fluorescence Among Several Bacterial Species Measured with a Direct-Reading Particle Sizer and Fluorescence Detector, Aerosol Sci. Tech., 32, 545–558, https://doi.org/10.1080/027868200303461, 2000.
Brus, D., Doulgeris, K., Bagheri, G., Bodenschatz, E., Chávez-Medina, V., Pohorsky, R., Schmale, J., Lonardi, M., Favre, L., Böhmländer, A., Möhler, O., Lacher, L., Girdwood, J., Gratzl, J., Grothe, H., Kaikkonen, V., O'Connor, E., Le, V., Backman, J., Luoma, K., Servomaa, H., and Asmi, E.: Data generated during the Pallas Cloud Experiment 2022 campaign: an introduction and overview, Earth Syst. Sci. Data, in preparation, 2025.
Burkart, J., Gratzl, J., Seifried, T. M., Bieber, P., and Grothe, H.: Isolation of subpollen particles (SPPs) of birch: SPPs are potential carriers of ice nucleating macromolecules, Biogeosciences, 18, 5751–5765, https://doi.org/10.5194/bg-18-5751-2021, 2021.
Després, V. R., Huffman, J. A., Burrows, S. M., Hoose, C., Safatov, A. S., Buryak, G., Fröhlich-Nowoisky, J., Elbert, W., Andreae, M. O., Pöschl, U., and Jaenicke, R.: Primary biological aerosol particles in the atmosphere: a review, Tellus B, 64, 15598, https://doi.org/10.3402/tellusb.v64i0.15598, 2012.
Diehl, K., Quick, C., Matthias-Maser, S., Mitra, S., and Jaenicke, R.: The ice nucleating ability of pollen: Part I: Laboratory studies in deposition and condensation freezing modes, Atmos. Res., 58, 75–87, https://doi.org/10.1016/S0169-8095(01)00091-6, 2001.
Doulgeris, K. M., Lihavainen, H., Hyvärinen, A.-P., Kerminen, V.-M., and Brus, D.: An extensive data set for in situ microphysical characterization of low-level clouds in a Finnish sub-Arctic site, Earth Syst. Sci. Data, 14, 637–649, https://doi.org/10.5194/essd-14-637-2022, 2022.
Duan, P., Hu, W., Wu, Z., Bi, K., Zhu, J., and Fu, P.: Ice nucleation activity of airborne pollen: A short review of results from laboratory experiments, Atmos. Res., 285, 106659, https://doi.org/10.1016/j.atmosres.2023.106659, 2023.
Fennelly, M. J., Sewell, G., Prentice, M. B., O'Connor, D. J., and Sodeau, J. R.: Review: The Use of Real-Time Fluorescence Instrumentation to Monitor Ambient Primary Biological Aerosol Particles (PBAP), Atmosphere, 9, 1, https://doi.org/10.3390/atmos9010001, 2018.
Fernández-Rodríguez, S., Tormo-Molina, R., Lemonis, N., Clot, B., O'Connor, D., and Sodeau, J. R.: Comparison of fungal spores concentrations measured with wideband integrated bioaerosol sensor and Hirst methodology, Atmos. Environ., 175, 1–14, https://doi.org/10.1016/j.atmosenv.2017.11.038, 2018.
Finnish Meteorological Institute and Gratzl, J.: Auxiliary data for “Fluorescent aerosol particles in the Finnish sub-Arctic during the Pallas Cloud Experiment 2022 campaign”, TU Wien [data set], https://doi.org/10.48436/mgs41-7pc98, 2025.
Fröhlich-Nowoisky, J., Hill, T. C. J., Pummer, B. G., Yordanova, P., Franc, G. D., and Pöschl, U.: Ice nucleation activity in the widespread soil fungus Mortierella alpina, Biogeosciences, 12, 1057–1071, https://doi.org/10.5194/bg-12-1057-2015, 2015.
Fröhlich-Nowoisky, J., Kampf, C. J., Weber, B., Huffman, J. A., Pöhlker, C., Andreae, M. O., Lang-Yona, N., Burrows, S. M., Gunthe, S. S., Elbert, W., Su, H., Hoor, P., Thines, E., Hoffmann, T., Després, V. R., and Pöschl, U.: Bioaerosols in the Earth system: Climate, health, and ecosystem interactions, Atmos. Res., 182, 346–376, https://doi.org/10.1016/j.atmosres.2016.07.018, 2016.
Gao, K., Vogel, F., Foskinis, R., Vratolis, S., Gini, M. I., Granakis, K., Billault-Roux, A.-C., Georgakaki, P., Zografou, O., Fetfatzis, P., Berne, A., Papayannis, A., Eleftheridadis, K., Möhler, O., and Nenes, A.: Biological and dust aerosols as sources of ice-nucleating particles in the eastern Mediterranean: source apportionment, atmospheric processing and parameterization, Atmos. Chem. Phys., 24, 9939–9974, https://doi.org/10.5194/acp-24-9939-2024, 2024.
Gosselin, M. I., Rathnayake, C. M., Crawford, I., Pöhlker, C., Fröhlich-Nowoisky, J., Schmer, B., Després, V. R., Engling, G., Gallagher, M., Stone, E., Pöschl, U., and Huffman, J. A.: Fluorescent bioaerosol particle, molecular tracer, and fungal spore concentrations during dry and rainy periods in a semi-arid forest, Atmos. Chem. Phys., 16, 15165–15184, https://doi.org/10.5194/acp-16-15165-2016, 2016.
Gratzl, J. and Grothe, H.: Data of Fluorescent Aerosol Particles during the Pallas Cloud Experiment 2022, Zenodo [data set], https://doi.org/10.5281/zenodo.13885888, 2024.
Gratzl, J., Seifried, T. M., Stolzenburg, D., and Grothe, H.: A fluorescence approach for an online measurement technique of atmospheric microplastics, Environmental Science: Atmosphere, 4, 601–610, https://doi.org/10.1039/D4EA00010B, 2024.
Gratzl, J., Böhmländer, A., Pätsi, S., Pogner, C.-E., Gorfer, M., Brus, D., Doulgeris, K. M., Wieland, F., Asmi, E., Saarto, A., Möhler, O., Stolzenburg, D., and Grothe, H.: Locally emitted fungal spores serve as high temperature ice nucleating particles in the European sub-Arctic, EGUsphere [preprint], https://doi.org/10.5194/egusphere-2025-1599, 2025.
Haga, D. I., Iannone, R., Wheeler, M. J., Mason, R., Polishchuk, E. A., Fetch Jr., T., van der Kamp, B. J., McKendry, I. G., and Bertram, A. K.: Ice nucleation properties of rust and bunt fungal spores and their transport to high altitudes, where they can cause heterogeneous freezing, J. Geophys. Res.-Atmos., 118, 7260–7272, https://doi.org/10.1002/jgrd.50556, 2013.
Haga, D. I., Burrows, S. M., Iannone, R., Wheeler, M. J., Mason, R. H., Chen, J., Polishchuk, E. A., Pöschl, U., and Bertram, A. K.: Ice nucleation by fungal spores from the classes Agaricomycetes, Ustilaginomycetes, and Eurotiomycetes, and the effect on the atmospheric transport of these spores, Atmos. Chem. Phys., 14, 8611–8630, https://doi.org/10.5194/acp-14-8611-2014, 2014.
Hairston, P. P., Ho, J., and Quant, F. R.: Design of an instrument for real-time detection of bioaerosols using simultaneous measurement of particle aerodynamic size and intrinsic fluorescence, J. Aerosol Sci., 28, 471–482, https://doi.org/10.1016/S0021-8502(96)00448-X, 1997.
Hatakka, J., Aalto, T., Aaltonen, V., Aurela, M., Hakola, H., Komppula, M., Laurila, T., Lihavainen, H., Paatero, J., Salminen, K., and Viisanen, Y.: Overview of the atmospheric research activities and results at Pallas GAW station, Boreal Environ. Res., 8, 365–383, 2003.
Healy, D. A., Huffman, J. A., O'Connor, D. J., Pöhlker, C., Pöschl, U., and Sodeau, J. R.: Ambient measurements of biological aerosol particles near Killarney, Ireland: a comparison between real-time fluorescence and microscopy techniques, Atmos. Chem. Phys., 14, 8055–8069, https://doi.org/10.5194/acp-14-8055-2014, 2014.
Hernandez, M., Perring, A. E., McCabe, K., Kok, G., Granger, G., and Baumgardner, D.: Chamber catalogues of optical and fluorescent signatures distinguish bioaerosol classes, Atmos. Meas. Tech., 9, 3283–3292, https://doi.org/10.5194/amt-9-3283-2016, 2016.
Hirst, J. M.: An automatic volumetric spore trap, Ann. Appl. Biol., 39, 257–265, https://doi.org/10.1111/j.1744-7348.1952.tb00904.x, 1952.
Hoose, C. and Möhler, O.: Heterogeneous ice nucleation on atmospheric aerosols: a review of results from laboratory experiments, Atmos. Chem. Phys., 12, 9817–9854, https://doi.org/10.5194/acp-12-9817-2012, 2012.
Hughes, D. D., Mampage, C. B., Jones, L. M., Liu, Z., and Stone, E. A.: Characterization of atmospheric pollen fragments during springtime thunderstorms, Environ. Sci. Tech. Let., 7, 409–414, 2020.
Kanji, Z. A., Ladino, L. A., Wex, H., Boose, Y., Burkert-Kohn, M., Cziczo, D. J., and Krämer, M.: Overview of Ice Nucleating Particles, Meteor. Mon., 58, 1.1–1.33, https://doi.org/10.1175/AMSMONOGRAPHS-D-16-0006.1, 2017.
Komppula, M., Lihavainen, H., Kerminen, V.-M., Kulmala, M., and Viisanen, Y.: Measurements of cloud droplet activation of aerosol particles at a clean subarctic background site, J. Geophys. Res.-Atmos., 110, D06204, https://doi.org/10.1029/2004JD005200, 2005.
Köppen, W. P.: Grundriss der Klimakunde, 2nd edn., Walter de Gruyter, ISBN 9783111283043, 1931.
Lieberherr, G., Auderset, K., Calpini, B., Clot, B., Crouzy, B., Gysel-Beer, M., Konzelmann, T., Manzano, J., Mihajlovic, A., Moallemi, A., O'Connor, D., Sikoparija, B., Sauvageat, E., Tummon, F., and Vasilatou, K.: Assessment of real-time bioaerosol particle counters using reference chamber experiments, Atmos. Meas. Tech., 14, 7693–7706, https://doi.org/10.5194/amt-14-7693-2021, 2021.
Lohila, A., Penttilä, T., Jortikka, S., Aalto, T., Anttila, P., Asmi, E., Aurela, M., Hatakka, J., Hellén, H., Henttonen, H., Hänninen, P., Kilkki, J., Kyllönen, K., Laurila, T., Lepistö, A., Lihavainen, H., Makkonen, U., Paatero, J., Rask, M., and Viisanen, Y.: Preface to the special issue on integrated research of atmosphere, ecosystems and environment at Pallas, Boreal Environ. Res., 20, 431–454, 2015.
Lohmann, U. and Feichter, J.: Global indirect aerosol effects: a review, Atmos. Chem. Phys., 5, 715–737, https://doi.org/10.5194/acp-5-715-2005, 2005.
Maki, L., Galyan, E., Chang-Chien, M., and Caldwell, D.: Ice nucleation induced by pseudomonas syringae, Appl. Microbiol., 28, 456—459, https://doi.org/10.1128/am.28.3.456-459.1974, 1974.
Mampage, C. B. A., Hughes, D. D., Jones, L. M., Metwali, N., Thorne, P. S., and Stone, E. A.: Characterization of sub-pollen particles in size-resolved atmospheric aerosol using chemical tracers, Atmos. Environ., 15, 100177, https://doi.org/10.1016/j.aeaoa.2022.100177, 2022.
Markey, E., Hourihane Clancy, J., Martínez-Bracero, M., Neeson, F., Sarda-Estève, R., Baisnée, D., McGillicuddy, E. J., Sewell, G., and O'Connor, D. J.: A Modified Spectroscopic Approach for the Real-Time Detection of Pollen and Fungal Spores at a Semi-Urban Site Using the WIBS-4+, Part I, Sensors, 22, 8747, https://doi.org/10.3390/s22228747, 2022.
Markey, E., Hourihane Clancy, J., Martínez-Bracero, M., Sarda-Estève, R., Baisnée, D., McGillicuddy, E. J., Sewell, G., Skjøth, C. A., and O'Connor, D. J.: Spectroscopic detection of bioaerosols with the wibs-4+: Anthropogenic and meteorological impacts, Sci. Total Environ., 943, 173649, https://doi.org/10.1016/j.scitotenv.2024.173649, 2024.
Matthews, B. H., Alsante, A. N., and Brooks, S. D.: Pollen Emissions of Subpollen Particles and Ice Nucleating Particles, ACS Earth and Space Chemistry, 7, 1207–1218, https://doi.org/10.1021/acsearthspacechem.3c00014, 2023.
Möhler, O., DeMott, P. J., Vali, G., and Levin, Z.: Microbiology and atmospheric processes: the role of biological particles in cloud physics, Biogeosciences, 4, 1059–1071, https://doi.org/10.5194/bg-4-1059-2007, 2007.
Möhler, O., Adams, M., Lacher, L., Vogel, F., Nadolny, J., Ullrich, R., Boffo, C., Pfeuffer, T., Hobl, A., Weiß, M., Vepuri, H. S. K., Hiranuma, N., and Murray, B. J.: The Portable Ice Nucleation Experiment (PINE): a new online instrument for laboratory studies and automated long-term field observations of ice-nucleating particles, Atmos. Meas. Tech., 14, 1143–1166, https://doi.org/10.5194/amt-14-1143-2021, 2021.
Morris, C. E., Sands, D. C., Glaux, C., Samsatly, J., Asaad, S., Moukahel, A. R., Gonçalves, F. L. T., and Bigg, E. K.: Urediospores of rust fungi are ice nucleation active at and harbor ice nucleation active bacteria, Atmos. Chem. Phys., 13, 4223–4233, https://doi.org/10.5194/acp-13-4223-2013, 2013.
Pereira Freitas, G., Adachi, K., Conen, F., Heslin-Rees, D., Krejci, R., Tobo, Y., Yttri, K. E., and Zieger, P.: Regionally sourced bioaerosols drive high-temperature ice nucleating particles in the Arctic, Nat. Commun., 14, 5997, https://doi.org/10.1038/s41467-023-41696-7, 2023.
Perring, A. E., Schwarz, J. P., Baumgardner, D., Hernandez, M. T., Spracklen, D. V., Heald, C. L., Gao, R. S., Kok, G., McMeeking, G. R., McQuaid, J. B., and Fahey, D. W.: Airborne observations of regional variation in fluorescent aerosol across the United States, J. Geophys. Res.-Atmos., 120, 1153–1170, https://doi.org/10.1002/2014JD022495, 2015.
Pöhlker, C., Huffman, J. A., Förster, J.-D., and Pöschl, U.: Autofluorescence of atmospheric bioaerosols: spectral fingerprints and taxonomic trends of pollen, Atmos. Meas. Tech., 6, 3369–3392, https://doi.org/10.5194/amt-6-3369-2013, 2013.
Pummer, B. G., Bauer, H., Bernardi, J., Bleicher, S., and Grothe, H.: Suspendable macromolecules are responsible for ice nucleation activity of birch and conifer pollen, Atmos. Chem. Phys., 12, 2541–2550, https://doi.org/10.5194/acp-12-2541-2012, 2012.
Pummer, B. G., Budke, C., Augustin-Bauditz, S., Niedermeier, D., Felgitsch, L., Kampf, C. J., Huber, R. G., Liedl, K. R., Loerting, T., Moschen, T., Schauperl, M., Tollinger, M., Morris, C. E., Wex, H., Grothe, H., Pöschl, U., Koop, T., and Fröhlich-Nowoisky, J.: Ice nucleation by water-soluble macromolecules, Atmos. Chem. Phys., 15, 4077–4091, https://doi.org/10.5194/acp-15-4077-2015, 2015.
Puxbaum, H. and Tenze-Kunit, M.: Size distribution and seasonal variation of atmospheric cellulose, Atmos. Environ., 37, 3693– 3699, https://doi.org/10.1016/S1352-2310(03)00451-5, 2003.
Sarangi, B., Baumgardner, D., Bolaños-Rosero, B., and Mayol-Bracero, O. L.: Measurement report: An exploratory study of fluorescence and cloud condensation nuclei activity of urban aerosols in San Juan, Puerto Rico, Atmos. Chem. Phys., 22, 9647–9661, https://doi.org/10.5194/acp-22-9647-2022, 2022.
Savage, N. J., Krentz, C. E., Könemann, T., Han, T. T., Mainelis, G., Pöhlker, C., and Huffman, J. A.: Systematic characterization and fluorescence threshold strategies for the wideband integrated bioaerosol sensor (WIBS) using size-resolved biological and interfering particles, Atmos. Meas. Tech., 10, 4279–4302, https://doi.org/10.5194/amt-10-4279-2017, 2017.
Schneider, J., Höhler, K., Heikkilä, P., Keskinen, J., Bertozzi, B., Bogert, P., Schorr, T., Umo, N. S., Vogel, F., Brasseur, Z., Wu, Y., Hakala, S., Duplissy, J., Moisseev, D., Kulmala, M., Adams, M. P., Murray, B. J., Korhonen, K., Hao, L., Thomson, E. S., Castarède, D., Leisner, T., Petäjä, T., and Möhler, O.: The seasonal cycle of ice-nucleating particles linked to the abundance of biogenic aerosol in boreal forests, Atmos. Chem. Phys., 21, 3899–3918, https://doi.org/10.5194/acp-21-3899-2021, 2021.
Schnell, R. C. and Vali, G.: Biogenic Ice Nuclei: Part I. Terrestrial and Marine Sources, J. Atmos. Sci., 33, 1554–1564, https://doi.org/10.1175/1520-0469(1976)033<1554:BINPIT>2.0.CO;2, 1976.
Schumacher, C. J., Pöhlker, C., Aalto, P., Hiltunen, V., Petäjä, T., Kulmala, M., Pöschl, U., and Huffman, J. A.: Seasonal cycles of fluorescent biological aerosol particles in boreal and semi-arid forests of Finland and Colorado, Atmos. Chem. Phys., 13, 11987–12001, https://doi.org/10.5194/acp-13-11987-2013, 2013.
Seifried, T. M., Reyzek, F., Bieber, P., and Grothe, H.: Scots Pines (Pinus sylvestris) as Sources of Biological Ice-Nucleating Macromolecules (INMs), Atmosphere, 14, 266, https://doi.org/10.3390/atmos14020266, 2023.
Stone, E. A., Mampage, C. B., Hughes, D. D., and Jones, L. M.: Airborne sub-pollen particles from rupturing giant ragweed pollen, Aerobiologia, 37, 625–632, https://doi.org/10.1007/s10453-021-09702-x, 2021.
Taylor, P. E., Flagan, R. C., Miguel, A. G., Valenta, R., and Glovsky, M. M.: Birch pollen rupture and the release of aerosols of respirable allergens, Clin. Exp. Allergy, 34, 1591–1596, https://doi.org/10.1111/j.1365-2222.2004.02078.x, 2004.
von der Weiden, S.-L., Drewnick, F., and Borrmann, S.: Particle Loss Calculator – a new software tool for the assessment of the performance of aerosol inlet systems, Atmos. Meas. Tech., 2, 479–494, https://doi.org/10.5194/amt-2-479-2009, 2009.
Wieland, F., Bothen, N., Schwidetzky, R., Seifried, T. M., Bieber, P., Pöschl, U., Meister, K., Bonn, M., Fröhlich-Nowoisky, J., and Grothe, H.: Aggregation of ice-nucleating macromolecules from Betula pendula pollen determines ice nucleation efficiency, Biogeosciences, 22, 103–115, https://doi.org/10.5194/bg-22-103-2025, 2025.
Yue, S., Ren, L., Song, T., Li, L., Xie, Q., Li, W., Kang, M., Zhao, W., Wei, L., Ren, H., Sun, Y., Wang, Z., Ellam, R. M., Liu, C.-Q., Kawamura, K., and Fu, P.: Abundance and Diurnal Trends of Fluorescent Bioaerosols in the Troposphere over Mt. Tai, China, in Spring, J. Geophys. Res.-Atmos., 124, 4158–4173, https://doi.org/10.1029/2018JD029486, 2019.
Yue, S., Li, L., Xu, W., Zhao, J., Ren, H., Ji, D., Li, P., Zhang, Q., Wei, L., Xie, Q., Pan, X., Wang, Z., Sun, Y., and Fu, P.: Biological and Nonbiological Sources of Fluorescent Aerosol Particles in the Urban Atmosphere, Environ. Sci. Technol., 56, 7588–7597, https://doi.org/10.1021/acs.est.1c07966, 2022.