the Creative Commons Attribution 4.0 License.
the Creative Commons Attribution 4.0 License.
 | 30 Jul 2025
Exploring the CO2 fugacity along the east coast of South America aboard the schooner Tara
Jacqueline Boutin
Gilles Reverdin
Christopher Hunt
Thomas Linkowski
Alison Chase
Nils Haentjens
Pedro C. Junger
Stéphane Pesant
Douglas Vandemark
The air–sea CO2 flux in the coastal ocean is a critical component of the global carbon budget, yet it remains poorly understood due to limited data, the many sources and sinks of carbon, and their complex interactions. In August–November 2021, the Tara schooner collected over 14 000 km of CO2 fugacity (fCO2) measurements along the coast of South America, including in the Amazon River–ocean continuum (https://doi.org/10.5281/zenodo.13790064, Olivier et al., 2024a). The Amazon River and its oceanic plume exhibit complex interactions under the combined influence of many processes such as tides and bathymetry. Observations revealed a wide range of fCO2 values, from up to 3000 µatm in the river to a minimum of 42 µatm downstream of the plume, where values were notably lower than atmospheric levels. South of the estuary, the fCO2 of the North Brazil Current waters (0–9° S) exceeds 400 µatm, while along the Brazil Current (10–30° S), fCO2 is around 400 µatm and decreases with temperature and distance from the Equator. Due to its high variability in the coastal environment, in the dataset salinity emerged as the primary driver of fCO2 variability across this dynamic region. Despite strong variability, comparison with discrete samples of other carbonate parameters showed a mean difference of 2 µatm, within the range of uncertainties of the chemical formulas used for comparison. This dataset provides critical insights into the under-sampled region of the Brazilian coast, improving our understanding of coastal fCO2 dynamics and their role in the global carbon budget.
- Article
(3688 KB) - Full-text XML
- BibTeX
- EndNote


The global ocean is a sink that absorbs 26 % of the anthropogenic carbon dioxide (CO2) emitted into the atmosphere by the burning of fossil fuels and land use change (Friedlingstein et al., 2025). While the ocean participates in mitigating the effects of climate change by storing both heat and CO2, it is also subject to profound changes such as ocean warming and acidification. Coastal and marginal oceans play a pivotal role in the global carbon cycle by connecting terrestrial, oceanic, and atmospheric carbon reservoirs. The air–sea CO2 flux varies spatially over the world's oceans, and some of the strongest gradients are found in the coastal regions (Landschützer et al., 2020). These regions present much higher temporal and spatial variability compared to the open ocean (Borges, 2005; Cai et al., 2006; Laruelle et al., 2014; Roobaert et al., 2019). Recent studies estimate that the uptake of CO2 per unit area is even greater over continental shelf seas than over the open ocean due to the contribution of the arctic shelves and the impact of rivers (Chen et al., 2013; Laruelle et al., 2014; Roobaert et al., 2019). Despite the fact that coastal waters play a major role in the livelihood of humans and are strongly affected by human activities, our understanding of these waters is strongly limited by the low number of observations (Bauer et al., 2013).
While the coastal and marginal seas of the middle and northern latitudes are sinks of CO2 with regards to the atmosphere, the tropical coastal oceans act as sources (Cai et al., 2006; Laruelle et al., 2014; Takahashi et al., 2002). There are several reasons for this, including the reduced solubility of CO2 at high temperatures and the upwelling of deep waters rich in dissolved inorganic carbon (DIC) in the equatorial upwelling and along the coast (Andrié et al., 1986; Takahashi et al., 2002). This has also been observed in regional studies, and one region presenting a strong and heterogeneous signal is the western tropical Atlantic coastal ocean (Lefèvre et al., 2017, 2010; Olivier et al., 2022; Padin et al., 2010).
One example is the Amazon River–ocean continuum (AROC). It represents one of the greatest environmental gradients on the interface between land and ocean in the world (e.g., Araujo et al., 2017). The Amazon River system discharge is unique in the global ocean. It contributes as much fresh water as the next seven largest rivers combined, accounting for 20 % of the global riverine freshwater input to the ocean (Dai and Trenberth, 2002). The resulting Amazon River plume (ARP) spreads across up to 1.3×10⁶ km2 of the tropical Atlantic Ocean and creates a significant CO2 sink relative to the atmosphere, primarily driven by strong biological drawdown (Cooley et al., 2007; Körtzinger, 2003; Subramaniam et al., 2008) combined with low salinities (Ibánhez et al., 2016; Lefévre et al., 2010). Opposing this, the Amazon River releases almost as much CO2 into the atmosphere annually as the rainforest absorbs (Richey et al., 2002; Sawakuchi et al., 2017). The main source of CO2 in the river comes from the breakdown of young organic carbon from the land by microbes (Mayorga et al., 2005; Ward et al., 2013, 2015). The lower Amazon River (from Óbidos to the river mouth) releases an amount of CO2 slightly higher (0.02 Pg C yr−1, Sawakuchi et al., 2017) than the uptake by the ARP in the Atlantic Ocean (0.014 Pg C yr−1, Körtzinger, 2003). Sawakuchi et al. (2017) demonstrated the importance of quantifying CO2 fluxes in the lower Amazon by adding the Óbidos–Macapá section to the Amazon River budget. On the other hand, oceanographic studies, carried out in particular during the ANACONDAS (in 2011, 2012 and 2013, Mu et al., 2021) and Camadas Finas III (October 2012, Araujo et al., 2017) campaigns, focused on the ARP development, maximum extension, and early decay, have shown the extent of CO2 undersaturation in the ARP. However, the estuary, which is the link between these two systems, is little known, if at all (Sawakuchi et al., 2017; Ward et al., 2017). Valerio et al. (2018) collected discrete samples for CO2 partial pressure all the way to the river mouth in April 2017 but do not address the Amazon River CO2 flux budget. Chen et al. (2013) studied the CO2 in the world's coastal seas by evaluating the air–sea exchanges of CO2 in 165 estuaries, but no data were available in the Amazon estuary, despite being arguably one with the strongest impact. Since then, Araujo et al. (2017) collected discrete DIC and total alkalinity (TA) samples at the mouth of the Pará–Tocantins River system, near the town of Belém.
The Brazilian continental shelf hosts diverse CO2 flux dynamics influenced by regional oceanographic and biogeochemical processes (Kerr et al., 2016). The ARP plays a key role in air–sea CO2 exchange, with strong seasonal variability driven by river discharge, biological productivity, and salinity gradients (e.g., Lefévre et al., 2010; Mu et al., 2021; Olivier et al., 2024b). In the North Brazil Current (NBC) region, upwelling and mesoscale eddies contribute to CO2 flux variability, modulating carbon exchange between the ocean and atmosphere (e.g., Monteiro et al., 2022; Olivier et al., 2022). Further south, the Vitória–Trindade seamount chain interacts with regional currents (Napolitano et al., 2021), influencing nutrient transport and biological activity that can affect CO2 fluxes. The Lagoa dos Patos and Guanabara Bay are important estuarine systems where terrestrial carbon inputs, tidal mixing, and anthropogenic influences create spatially and temporally variable CO2 flux patterns (Cotovicz et al., 2015). Along the broader Brazilian continental shelf, complex interactions between ocean circulation, biological productivity, and local conditions shape regional carbon dynamics, making in situ observations critical for understanding these fluxes.
While data gaps in the open ocean have begun to narrow, partly due to advancements such as the Argo biogeochemical float program, it is not the case for biogeochemical measurement on the shelves and continental margins. Continuous surface fugacity of CO2 (fCO2) measurements carried out on ships remain the most accurate way to assess CO2 fluxes and are still too sparse (Friedlingstein et al., 2025). A notable trend in recent years is the global decline in ship-based CO2 observations being added to the Surface Ocean CO2 Atlas (SOCAT) database (Bakker et al., 2016), particularly since 2017 (Friedlingstein et al., 2025), mainly due to reduced funding (Dong et al., 2024). Despite recent contributions documented in publicly available open-access data, the Brazilian continental margins remain notably under-sampled, with an acute lack of data during specific seasons, such as from August to November (Fig. 1c). Recently, sailboats have provided interesting opportunities to measure CO2 in conditions different from traditional research vessels, as highlighted by the contribution of data from racing sailboats (Landschützer et al., 2023).
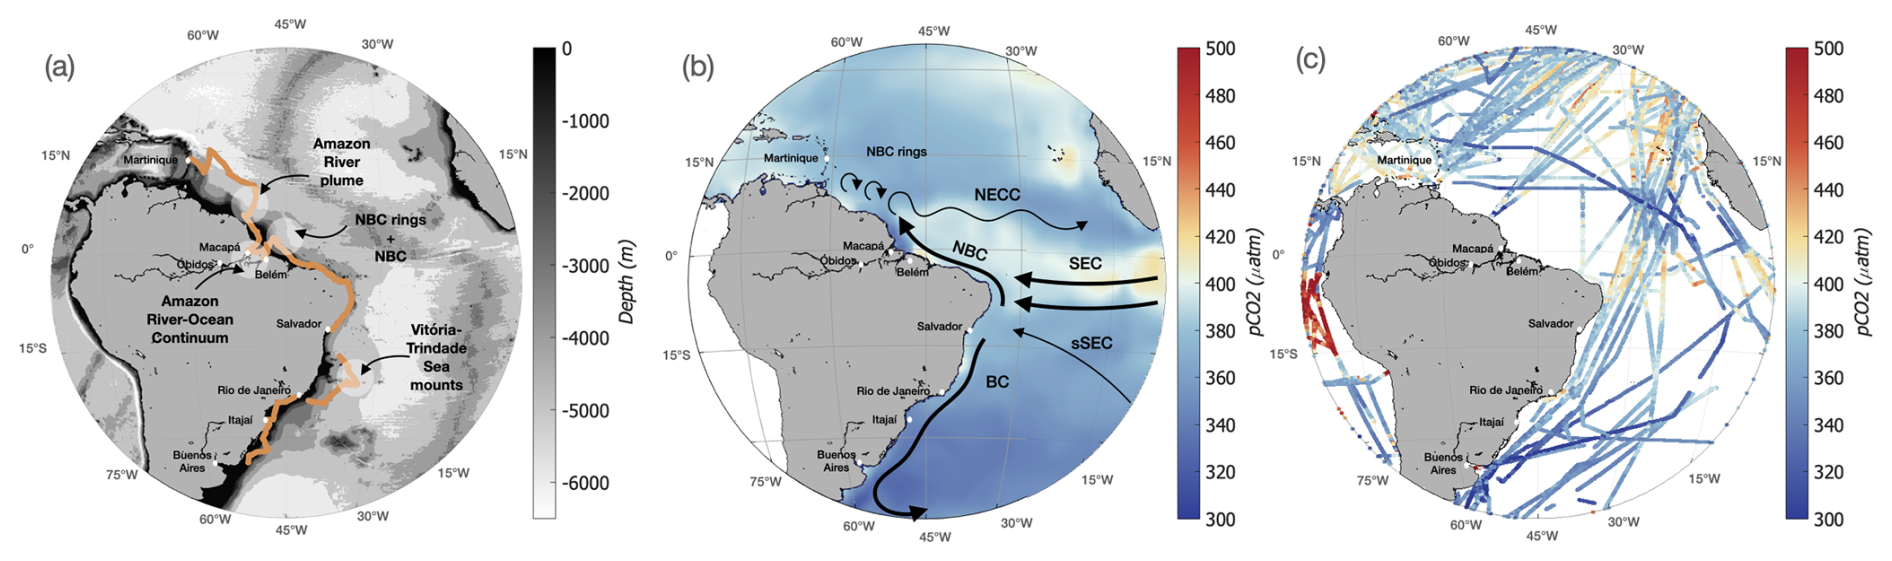
Figure 1(a) Bathymetry of the Atlantic Ocean (ETOPO2v2) and journey of the schooner Tara (orange line). (b) 1998–2015 September climatology of the partial pressure of CO2 (pCO2, Landschützer et al., 2020); the black arrows represent some of the main surface geostrophic currents in boreal fall. (c) pCO2 along the boat trajectories in August–September–October (SOCAT, data from 1957 to 2022). NBC: North Brazil Current, NECC: North Equatorial Counter Current, SEC: South Equatorial Current, sSEC: southern branch of the SEC, BC: Brazil Current.
Here, we present a new fCO2 dataset, acquired on the research schooner Tara. This is the first time that a sailboat has been equipped with an fCO2 equilibrator system, which is more accurate than the membrane system used on racing yachts but larger and more maintenance-intensive. One of the special features of the missions aboard Tara is the combination of physical, biogeochemical, and biological oceanography to provide comprehensive knowledge of the ocean (Bork et al., 2015; Pesant et al., 2015). Tara missions have a unique design: they are continuous for a multiyear duration, with scientists and sailors taking turns on board. This novel dataset presents 14 000 km of fCO2 measurements over 98 d between August and the end of November 2021, primarily along the South American coast, marking the first repeated sampling of the AROC. The cruise took place in a period of decreasing river outflow, following one of the largest Amazon flood events on record. Freshwater transport was strongly directed toward the Caribbean, with comparatively less Amazon-derived fresh water reaching the NECC and central Atlantic (Olivier et al., 2024b). It also includes measurements in the ARP and in different areas off Brazil: in the North Brazil Current (NBC), the Brazil Current, the Guanabara Bay (Rio de Janeiro), the Vitória–Trindade seamounts, and the shelves of southern Brazil, filling some of the gaps in the current data.
The primary objective of this study is to present the fCO2 dataset acquired by Tara and shed light on some of the lesser studied areas of the Amazon River estuary and plume. Section 2 provides a detailed description of the fCO2 measurement system, the challenges encountered during its installation on the schooner, the solutions implemented, and the validation of the dataset. Section 3 illustrates the dataset, first encompassing the whole transect and then focusing on the case study of the river–ocean continuum. Section 4 discusses possible uses of the data and the performance of the system.
2.1 Mission Microbiomes AtlantECO
For 2 years, the schooner Tara sailed 70 000 km across the South Atlantic Ocean to study the ocean microbiome and its interactions with climate and pollution. The 36 m long schooner is equipped with numerous scientific equipment operated by a team of four to six scientists and six sailors consistently on board. During the first part of the Mission Microbiomes AtlantECO, the schooner sampled the entire east coast of South America, from August to the end of November 2021 (Fig. 1a). The dataset presented in this study focuses on the underway data collected during legs 5, 6, 7, 8, and 9 of the Mission Microbiomes (Table 1). The dataset covers 14 000 km and stops on 25 November, as the authorization to sample in the exclusive economic zone of Uruguay was not obtained. Attempts were subsequently made to restart the system during leg 11, but these were aborted, as the conditions of the standard gas cylinders did not allow the same accuracy to be achieved.
Table 1Port to port description of SV Tara's journey, including latitude ranges to indicate spatial coverage.
2.2 Underway fCO2 system
An equilibrator-based system from the university of New Hampshire (Vandemark et al., 2011) was installed on Tara in July 2021. It continuously monitored the near-surface ocean fCO2 (Fig. 2). Currently, an equilibrator-based fCO2 system is the most reliable and accurate instrument to measure the in situ fCO2 in seawater. It is able to capture the fine-scale variability of oceanic fCO2 by responding quickly to fCO2 changes in seawater. The exchange time for the water in the equilibrator is between 30 and 45 s, depending on flow rate (Pierrot et al., 2009). Unlike a traditional research vessel (RV), space and time for maintenance are limited on board the schooner. The continuous water line is used by nine instruments, stored under the floor in the fore hold, and in a small laboratory of 2.5 m2. The installation of the CO2 system required some compromises, chosen with the help of the sailors and engineers on board, to fit the schooner constraints and to limit the loss in measurement accuracy (originally less than 2 µatm). We will detail the modifications in the setup of the fCO2 system and then discuss the accuracy of the data obtained, before illustrating the large variability of the sampled area.
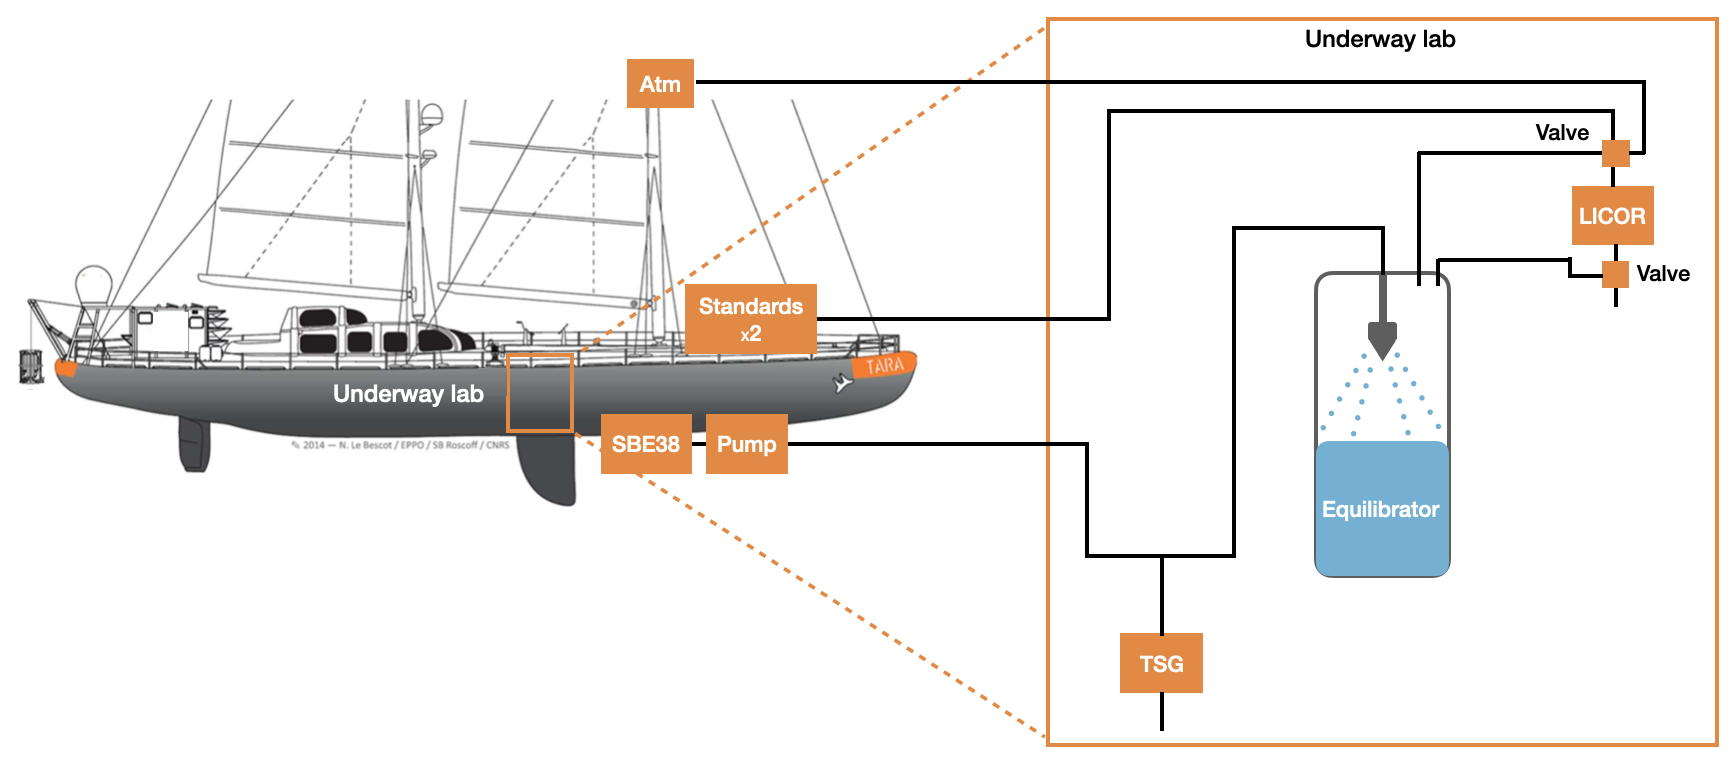
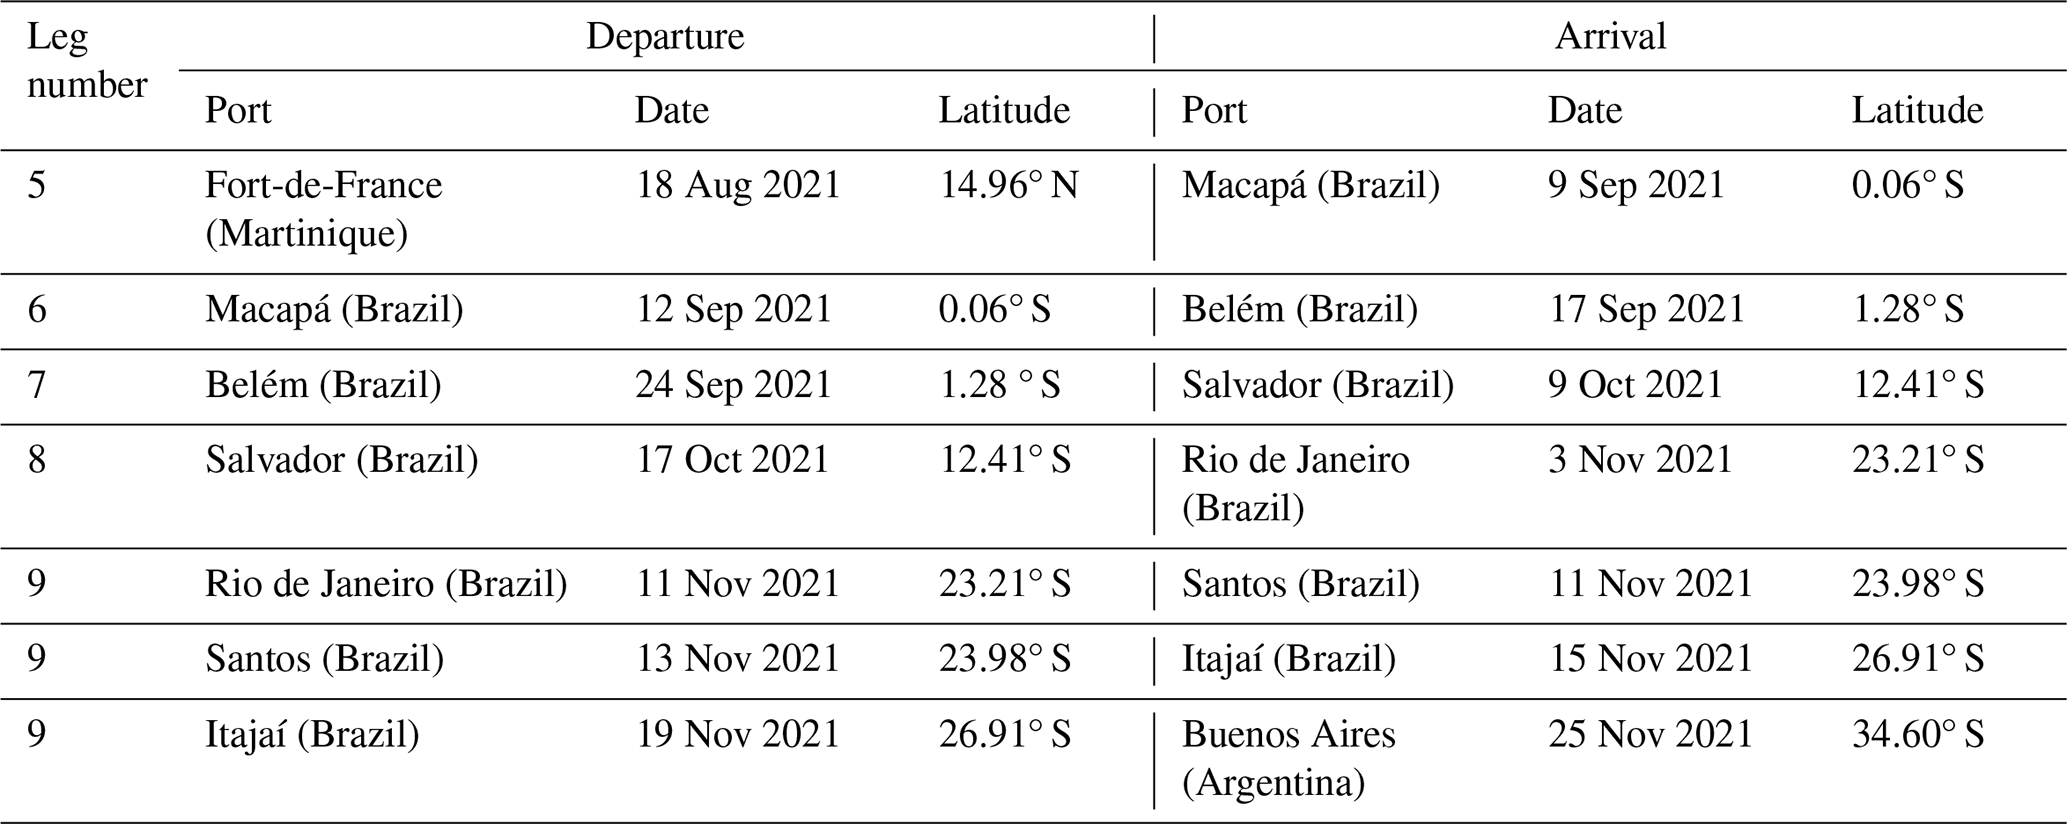
Figure 2Schematic of the underway laboratory and fCO2 system on board the schooner Tara, adapted from Pesant et al. (2015).
Seawater enters through the hull at less than 1.5 m depth where a Sea-Bird Electronics (SBE) 38 temperature sensor is located for an accurate measurement of sea surface temperature (SST). It then enters a debubbler to remove most of the bubbles that can be caused by such shallow water intake, especially in rough seas, and goes through a large-particle filter. The seawater circuit is then split into two to feed the many underway instruments. One branch first flows through a thermosalinograph (TSG, SBE 45) to measure temperature and salinity (temperature accuracy of ±0.002 °C, conductivity accuracy of ±0.0003 S m−1). The other branch first flows into the equilibrator of the fCO2 system after less than 5 m of tubing at a rate of 2–6 L min−1. We make the hypothesis that at this high flow rate and short path, the temperature is similar in the equilibrator and in the TSG, as both instruments are first in their respective water circuit and at a similar distance from the split. We suspect that this choice introduces less uncertainty than directly using SST (action recommended for missing equilibrator temperature data, Pierrot et al., 2009), although we do not have the data to fully validate this hypothesis. Fortunately, the sailboat is small compared to an open-ocean RV, so the pipe length from the hull to the underway instruments is considerably smaller, and the temperature difference between the hull sensor (SBE38) and the TSG is small (always below 0.1 °C, averaging 0.07 °C, Fig. 2).
The fCO2 system uses a shower spray air–sea equilibrator of 2.5 L as described by Dickson (2007) and used by Vandemark et al. (2011). Water is sprayed or trickled inside a chamber, creating a large surface area for rapid equilibration with the headspace air. A closed loop of air flows through the equilibrator where the air–water exchanges happen; the equilibrated air is drawn at 100 mL min−1 through tubing containing a Nafion selectively permeable membrane with a counter-flowing stream of dry nitrogen to remove water vapor from the sample gas stream. It is then sent to a non-dispersive infrared CO2 analyzer, a LI-COR LI-840A. It detects the molar fraction of CO2 (xCO2) in dry air by infrared detection, from which fCO2 is computed following Henry's law (detailed in the annex of Pierrot et al., 2009). Ideally, the computation requires the pressure inside the equilibrator. The equilibrator was not equipped with a pressure sensor but was designed to be at atmospheric pressure. Atmospheric pressure was measured by a Vaisala Barometer PTB100 with an accuracy of ±0.3 hPa at 20 °C at the rear of the ship. A temperature correction to the seawater fCO2 data is applied based on the difference between the temperature sensor in the hull and the TSG.
Through a system of electro-valves, four circuits are operated, one for the atmospheric air, one for each of the two reference gases, and one for the air equilibrated with seawater. The atmospheric air intake is located on the first cross-tree of the schooner front mast (∼ 10 m). The two 20 L reference gas tanks of 0 and 502.3 ppm are stored on the front deck. These values were chosen because they effectively bracket the range of oceanic fCO2 values in this highly variable environment, encompassing most of the observed data except in the river. As a result, fCO2 values above 500 µatm are more uncertain and should be interpreted with caution. The number of different calibration gases was reduced from four (on a traditional RV) to two (as done on racing sailboats, Landschützer et al., 2023). The reduced use of standards results from complications replacing the gas cylinders abroad (especially during the covid period), as well as storing them on board. It is recommended to measure a complete set of standards every 3 h. During the first week, to test the system, a complete set of standards and atmospheric cycle was measured for 15 min every hour. As the system behaved well and the drift of the LI-COR was acceptable (less than 0.4 ppm over 6 h), the measurement of standards was changed to every 6 h (on 31 August), then to every 12 h (on 2 September) to save the reference gases. Although not ideal, this is still more frequent than the once-a-day rate on the racing sailboats (Landschützer et al., 2023).
It is quite challenging to install such a system on a schooner, but it also presents numerous advantages, one of the most important being the shallow depth of the seawater intake. Tara's seawater intake is located below the hull, at 1.5 m depth. This is shallower than on many research vessels (5 m depth on average) and better represents the actual air–sea exchanges, especially in stratified regions (Ho and Schanze, 2020). The system also has the advantage of being able to work in a turbid environment. The equilibrator was cleaned at each stopover and each time the ship exited a major river (so seven times in total) to avoid the buildup of mud, and the system therefore recorded data during the whole time spent in the Amazon River.
2.3 Using atmospheric CO2 to validate the span value
It is customary to measure in the laboratory the value of each nonzero standard after the cruise as its value can differ from the value reported by the supplier. Unfortunately, this was not possible because after this long cruise (and some gas leakage in rough seas) the tank was empty. The value requested for the nonzero standard was 500 ppm, with a reported 507.9 ppm value by the supplier (Airgas), with an uncertainty of 2 %. The value measured in the laboratory before the cruise was 530 ppm. However, we found that choosing this value of 530 ppm results in unrealistically high atmospheric (close to 440 ppm) and oceanic (>450 ppm) xCO2 measurements (blue in Fig. 3). Furthermore, it is outside of the uncertainty range reported by the manufacturer.
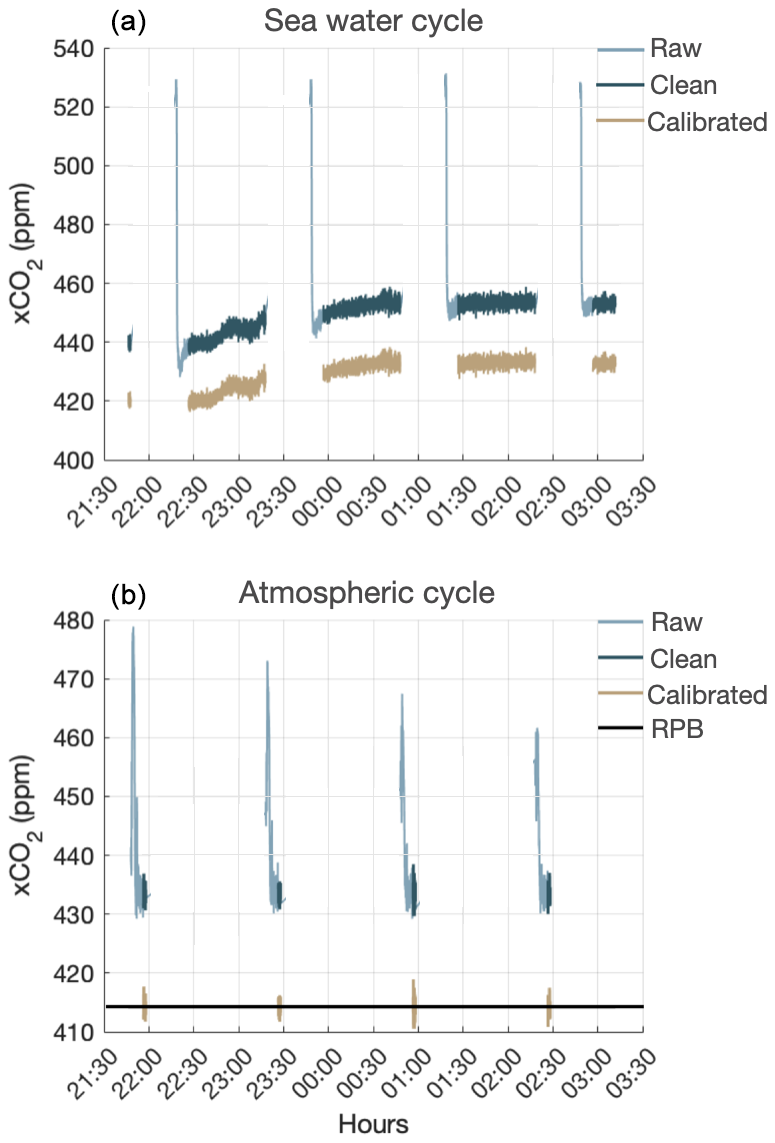
Figure 3Time series of Tara xCO2 extracted near Barbados (night of 18–19 August 2021) for the seawater cycle (a) and atmospheric cycle (b). The raw data are shown in light blue, the data cleaned for valve change pollution in dark blue, and the clean and calibrated data in light brown. For the atmospheric cycle, the value measured at Ragged Point, Barbados (RPB), on 15 August 2021 (414.15 ppm) is shown in black.
To address this calibration issue, we take advantage of the atmospheric xCO2 measured on board. A few days after departure, during the night from 18 to 19 August 2021, Tara sailed in close proximity to the island of Barbados, where recurrent accurate measurements of atmospheric xCO2 are taken at Ragged Point, Barbados (RPB). The xCO2 measured by Tara calibrated using the value of 530 ppm for the span was very stable over 4 h at 437.09 ppm. The atmospheric xCO2 measured at RPB on 15 August 2021 (closest to Tara's passage) was 414.245 ppm. In order for the Tara xCO2 data near Barbados to match the ones at RPB, the span value should be 502.3 ppm, which is within the uncertainty range provided by Airgas. This span value was then used to calibrate the entire dataset (light brown in Fig. 3). This approach assumes that the atmospheric CO2 near Barbados is representative of the value on Tara. During the time Tara was near the island, winds were moderate and blowing from the sea (not shown), so the atmospheric xCO2 at RPB is not expected to vary much from day to day (∼ 0.5 ppm). In the worst case, an error of 1 ppm in the calibration value would lead to a ±0.84 ppm averaged difference over the dataset. Tara crossed highly variable regions during its voyage, supporting our confidence that the uncertainty in the dataset associated with this span value has a limited influence on the overall results but should nevertheless be take into account when analyzing the dataset.
2.4 Validation of the dataset
Samples of TA and DIC were taken at each station. Out of a total of 78 samples, 17 are from the surface (Metzl et al., 2024). Samples were drawn from the rosette into 0.5 L borosilicate glass bottles, ensuring minimal air contamination, and immediately poisoned with 400 µL of mercuric chloride (HgCl2) to prevent biological alteration. TA was measured using open-cell titration with a hydrochloric acid titrant, while DIC was analyzed using acidification followed by CO2 extraction and detection via infrared or coulometric methods. Quality control was ensured through calibration with certified reference materials to maintain an accuracy of ±4 µmol kg−1 (Metzl et al., 2024). Their salinity ranges on a salinity scale from 0 inside the Amazon River to 37.3 in the North Brazil Current. The fCO2 is computed from the near-surface ocean DIC and TA using the CO2SYS v3.1 software (Sharp et al., 2020) to compare with the continuous fCO2 measurements (Fig. 4). The dissociation constants were taken from Mehrbach et al. (1973) refitted by Dickson and Millero (1987) and nutrients were neglected. The dissociation constants used are the same as those in Lefèvre et al. (2010) to ensure consistency for comparison in Sect. 4. However, we also tested several other sets of constants for additional analysis, detailed below. It is worth noting that DIC and TA are not the most accurate pair to determine the fCO2, and it can lead to a probable error of 5.7 µatm (Millero, 1995).
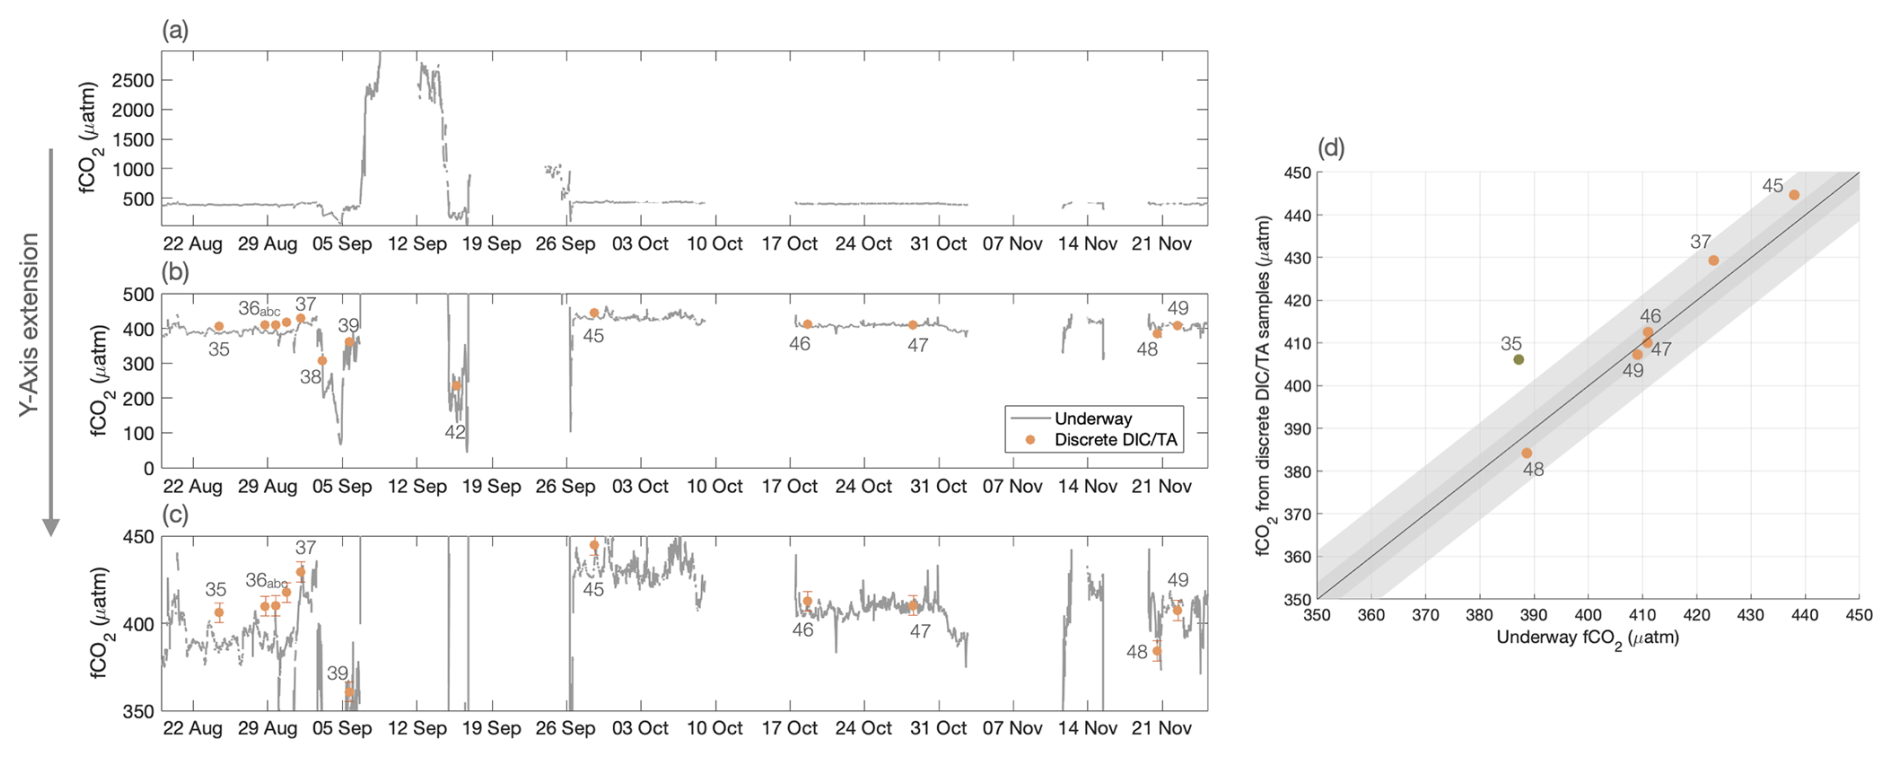
Figure 4Time series of the surface fCO2 from 18 August to 25 November 2021 for the full range of values (a), for only oceanic values and (b), for values between 350 and 450 µatm (c). The dots indicate the fCO2 inferred from the DIC/TA water samples for stations 35 to 49, with error bars of 5.7 µatm to represent the uncertainty of the chemical formulas. Scatter plot of the underway fCO2 and the fCO2 inferred from the DIC/TA samples for fCO2 values ranging between 350 and 450 µatm. The green dot indicates a salinity difference between the CTD sensor and the sample from bottle of more than 0.5. The fCO2 system was measuring the standards and not seawater for stations 36abc and 39, so these stations are not represented in (d).
Considering the compromise on accuracy that had to be made to be able to sample on the schooner, the continuous fCO2 compares well to the one computed from the samples, especially after 26 September. Before that, the DIC/TA samples from the rosette during conductivity–temperature– depth (CTD) casts were often taken in the presence of salinity stratification near the surface in the ARP. The depth actually sampled for these samples is likely to be a bit deeper (by a couple of meters) than the depth of the in-line TSG (sampling depth at 1.5 m), which could explain why the fCO2 measured underway is lower than the one inferred from DIC/TA in the ARP. For station 35, the difference in salinity of 0.9 between the salinity sample from the Niskin bottle and the CTD sensor is an indication of the high temporal and spatial variability of the area. Over the whole time series no constant bias is identified, and the mean difference after 26 September is 2.02 µatm (standard deviation of the difference (SDdiff) = 7.4 µatm) and drops to 0.97 µatm (SDdiff = 0.5 µatm) after 10 October. These results vary but remain of the same order of magnitude when changing the dissociation constants. Using constants from Lueker et al. (2000) leads to similar results (mean difference of 1.2 µatm); the largest differences are obtained using the constants from Waters et al. (2014) that are designed for a large salinity range (0–50). It improves the comparison for low salinities (before 26 September) but gives slightly larger differences for high salinities (mean difference after 26 September of 0.5 and 3.4 µatm after 10 October). Overall, the mean difference remains around 2 µatm, providing a reasonable estimate of the dataset's uncertainty. In the river, where fCO2 values fall outside the range of the standard gas used and no discrete samples are available for direct comparison, the uncertainty is likely higher. However, the values obtained align with expected ranges for this part of the river based on discrete samples collected in April 2017 by Valerio et al. (2018), despite differences in season and year.
As no simultaneous dataset can be used to cross-quality-check the data, the agreement tendency between fCO2 estimated from six samples and the continuous fCO2 measurements is important and is used here to validate the data. However, the number of samples – particularly in the open ocean – is very limited relative to the distance covered, which limits the statistical robustness of the validation of both the dataset and more importantly of the calibration approach. Users should therefore interpret the data, especially in coastal and river-influenced regions, with appropriate caution.
2.5 Reported data
Following the recommendations of Pierrot et al. (2009) and of SOCAT, the dataset provides for each location and time step the following measured data: molar fraction of CO2 in the equilibrator (xCO2eq), sea surface salinity (SSS), temperatures (SST and Teq), pressure (Patm), and the calculated variables (pCO2sw, fCO2sw) averaged over 1 min. The atmospheric fCO2 is not included as the atmospheric xCO2 was used as a standard and for validation of the dataset. The dataset will be submitted to the 2025 SOCAT version, with probably a flag C, as only one nonzero reference gas is used to calibrate the measured xCO2. In the meantime, the data are available in the following public repository: https://doi.org/10.5281/zenodo.13790064 (Olivier et al., 2024a). In the dataset, ancillary data are added (wind speed at 10 m, bottom depth from ETOPO2v2) to achieve a more detailed interpretation of the data. The wind speed was measured by a Gill anemometer at the top of the mast (27 m) and then adjusted to 10 m using a logarithmic relationship (Tennekes, 1973) and can be used for the calculation of the CO2 flux. This dataset addresses the overall lack of data identified by SOCAT by covering diverse environmental gradients with a high-resolution sampling. The use of the schooner highlights the potential of nontraditional platforms for collecting high-quality data in challenging environments, complementing traditional research vessels.
3.1 From the Caribbean to Uruguay
After leaving the island of Martinique on 18 August 2021, Tara sampled the northwestern tropical Atlantic. Surface waters exhibited strong spatial variability, with temperatures and salinities changing from 27.5 to 30.5 °C and from 31.5 to 35.5. It induced a variability of the surface fCO2 that ranged from 370 to 420 µatm (Figs. 5 and 6).
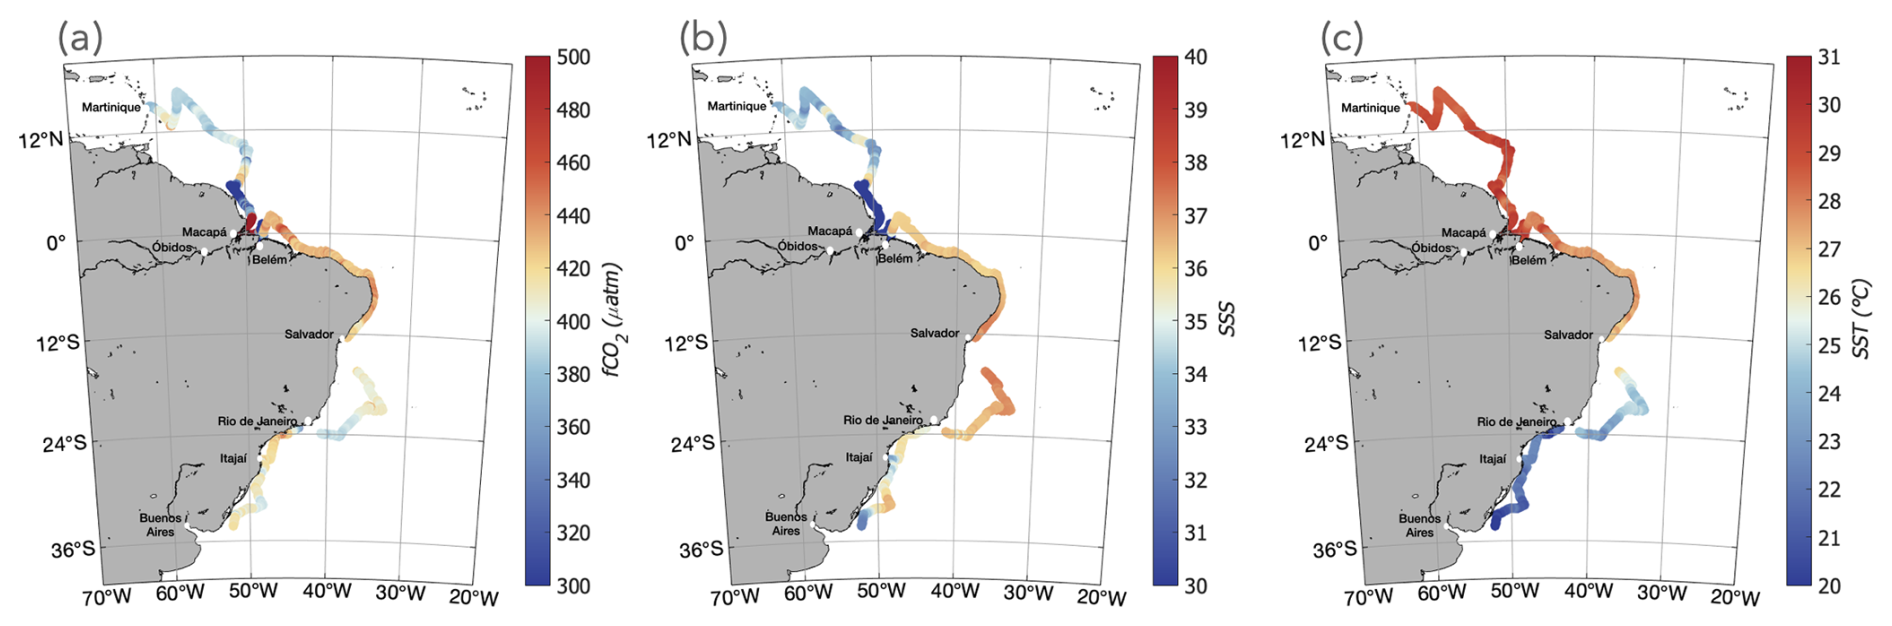
Figure 5Along-track (a) CO2 fugacity (complete range of values shown in Fig. 4), (b) sea surface salinity, and (c) sea surface temperature.
The schooner then crossed the salty (36) water of the NBC retroflection, before sampling the river plume that had been recently transported from the Amazon estuary. Around this period of time, the ARP was located almost entirely on the shelf as salinities lower than 30 were observed at depths shallower than 100 m (Fig. 6). The ARP water is drastically different from the one of the NBC retroflection, and the two water masses are separated by strong horizontal fronts. On 3 September 2021 Tara crossed a front of 14.2 in salinity between 00:30 and 05:00 UTC (UTC used throughout). This first strong front was followed by several others: on 4 September between 00:00 and 20:00 (loss of 14 salinity units), between 4 September at 20:00 and 5 September at 09:00 (increase of 17 salinity units), and finally on 6 September between 10:00 and 23:00 the salinity dropped from 24.2 to 0 as the schooner reached the Amazon River. These sharp salinity fronts are associated with variations of temperature (variability of 2–3 °C) and mainly fCO2. In the ARP, the fCO2 variations follow the ones in salinity. The fCO2 of the ARP is extremely low, as for a salinity of 11 on 4 September an fCO2 of 65 µatm is observed (Fig. 6). The salinity and fCO2 increase on 5 September is associated with a decrease in SST, which could suggest an event of vertical mixing or local upwelling. This event generated fCO2 fluctuations, and then as the schooner approaches the river and the salinity decreases, the conditions switch from marine to riverine and fCO2 rapidly increases. In the Amazon River, fCO2 is very high, reaching 3000 µatm in Macapá.
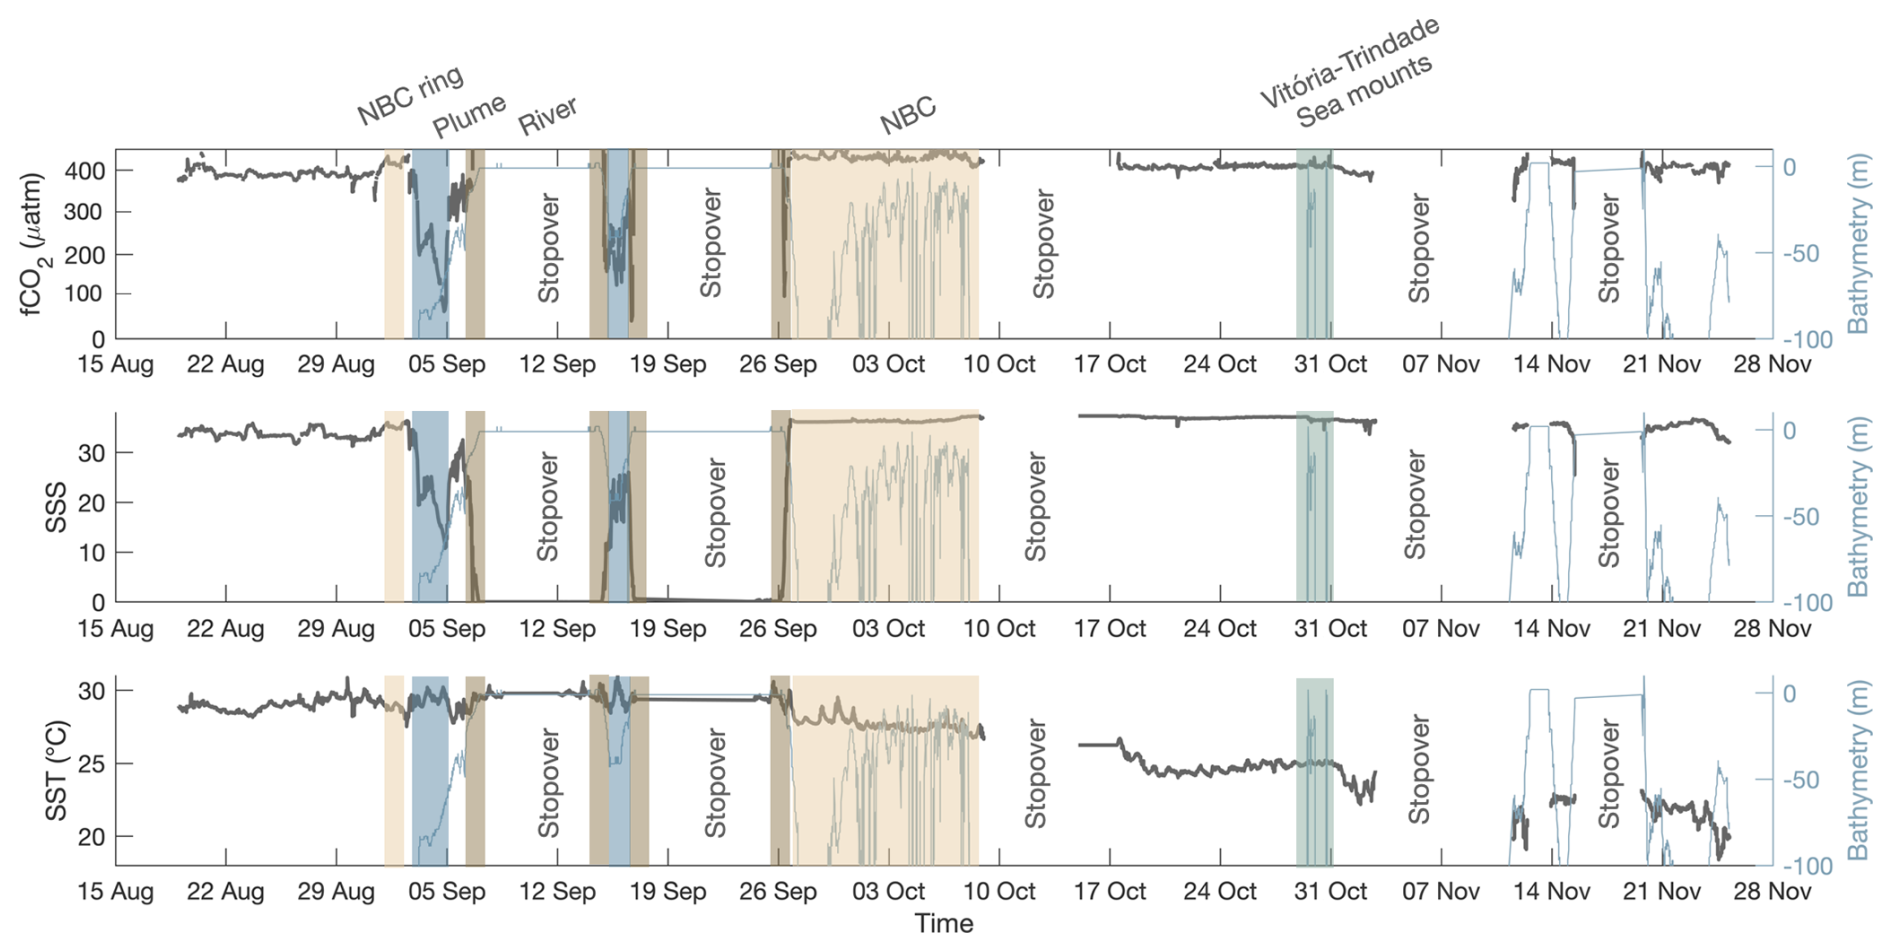
Figure 6Time series of fCO2, sea surface salinity, and sea surface temperature. The light blue line in each panel represents the along-track ETOPO2v2 bathymetry. The shaded patches show areas of interest identified in Fig. 1. NBC: North Brazil Current.
On 12 September, the schooner left the Amazon River and sampled the Amazon and Pará River plume before entering the Pará River to join Belém. The lowest fCO2 of the time series was observed in the Amazon/Pará River plume, with an fCO2 of 42.8 µatm offshore of the Pará River. After the stopover in Belém, the ship sampled the waters of the NBC. The temperature decreased and showed a variability on the order of 1 °C. The NBC waters stand out by their high salinity (around 37) and high fCO2 (∼ 420 µatm) and strongly contrast with the river plume waters. From 9 to 18 October the ship stopped in Salvador and then sailed to Rio de Janeiro, with a particular focus on the Vitória–Trindade seamounts, a biodiversity hotspot (Pinheiro et al., 2015) amidst the South Atlantic Subtropical Gyre, one of the most oligotrophic zones of the global ocean (Morel et al., 2010). The temperature was colder (24 °C after Salvador compared to 26–27 °C before), and its variability is closely associated with the one of fCO2 (the decrease in temperature is associated with a decrease in fCO2 close to the rate of 4.23 % °C−1 given by Takahashi et al., 1993). This indicates a switch from an fCO2 variability dominated by salinity and primary production to an fCO2 variability dominated by a temperature solubility effect. Around the Vitória–Trindade seamounts (28 October to 1 November) we observe a strong variability of surface salinity and CO2, correlated with the shallower bathymetry, which could be driven by upwelling turbulent mixing (Mashayek et al., 2024; Napolitano et al., 2021).
The ship called in Rio de Janeiro from 2 to 11 November and then sailed to Itajaí with a call in Santos. This part of the journey is very coastal, with bottom depth almost always above 100 m. It shows strong fCO2 variability, with low values associated with the lower salinities (34.8) close to Santos. After 19 November, the temperature decreased as the ship sailed southward, reaching a minimum of 18.4 °C, associated with a small drop in fCO2. Salinity also decreased to 31 as bottom depths got shallower than 50 m, possibly an early signal from the Rio de la Plata plume and/or a signal from the Lagoa dos Patos.
3.2 The Amazon River–ocean continuum
The largest variations of fCO2 are observed in the AROC. The strongest gradient, reaching 3000 µatm, is observed at the transition between the marine and riverine waters. The signature of the ARP in itself is important, with a variation of fCO2 of up to 340 µatm (Fig. 6). The minimum observed fCO2 in the Amazon River plume is 65 µatm (4.5° N, 50.77° W), whereas outside of the plume, in the NBC, the fCO2 is around 420 µatm. Then, on the Amazon shelf, fCO2 progressively got stronger as Tara went southward towards the Amazon estuary, with the change in regime intensifying around the 30 m bathymetry line, when the ARP switches from a sink to a very strong source (fCO2 > 2000 µatm, Fig. 7). The AROC was sampled twice, and so was the Pará River–ocean continuum (Figs. 6, 7).
For the four crossings of the river–ocean continuum (two in the Amazon River, two in the Pará River), different fCO2–SSS relationships (Fig. 8) and different relationships to bathymetry (Fig. 9) are observed. From the NBC to the core of the ARP (6 to 4° N, in dark blue in Fig. 8a, b), the fCO2 and SSS measurements follow the relationship reported in Lefèvre et al. well (2010, then NL). However, when salinity and fCO2 increase locally from 4 to 2° N (light blue and brown in Fig. 8), they move away from the NL linear relationship. This is even more pronounced closer to the Amazon River, where the salinity decreases (from 25 to 0) and bottom depth is shallower than 20 m (Fig. 9). After a slow decrease for salinity ranging from 25 to 12, fCO2 sharply increases in a nonlinear fashion as the bathymetry gets shallower than 20 m (salinity ranging from 12 to 5). For depth shallower than 10 m and salinities below 5, the fCO2 is already greater than 1000 µatm and shows the largest variability (on the order of 500 µatm) before the ship enters the pure riverine waters (0 salinity, depth of ∼ 2 m, Figs. 8b, 9b).
The schooner leaves the Amazon River through a different branch than on entry (Fig. 8a). The decrease in fCO2 from 1000 to 300 µatm is more linear with respect to salinity, and the source–sink transition occurs at a lower salinity than on entry (3 instead of 12, Fig. 8c). The points in the 5 to 25 salinity range show great variability, and only those with the lowest fCO2 and salinities between 15 and 20 follow the NL relationship. The variation of salinity with bathymetry is not the same as on the way in, where the salinity stays lower than 15 for depths between 20 and 40 m.
The variation of fCO2 along the way in the Pará River is also different from the way out, but with less variability than for the Amazon River (Fig. 8d). The sink–source transition occurs at salinities of 2.7 and 3.7, respectively, and for very shallow depth (<5 m, Fig. 9a). The minimum fCO2 reached before the Pará River is 42.7 µatm for a salinity of 5, whereas on the way out it is 101.6 µatm for a salinity of 7. This is likely due to the Pará River plume being advected northwestward along the shelf and mixing with the ARP on its northern side. On the southern side, it mixes with the carbon-rich waters of the NBC.
The transition from a source to a sink thus presents large variability. It does not happen at a consistent salinity or bottom depth, highlighting the role of other parameters driving the fCO2 variability in the region.
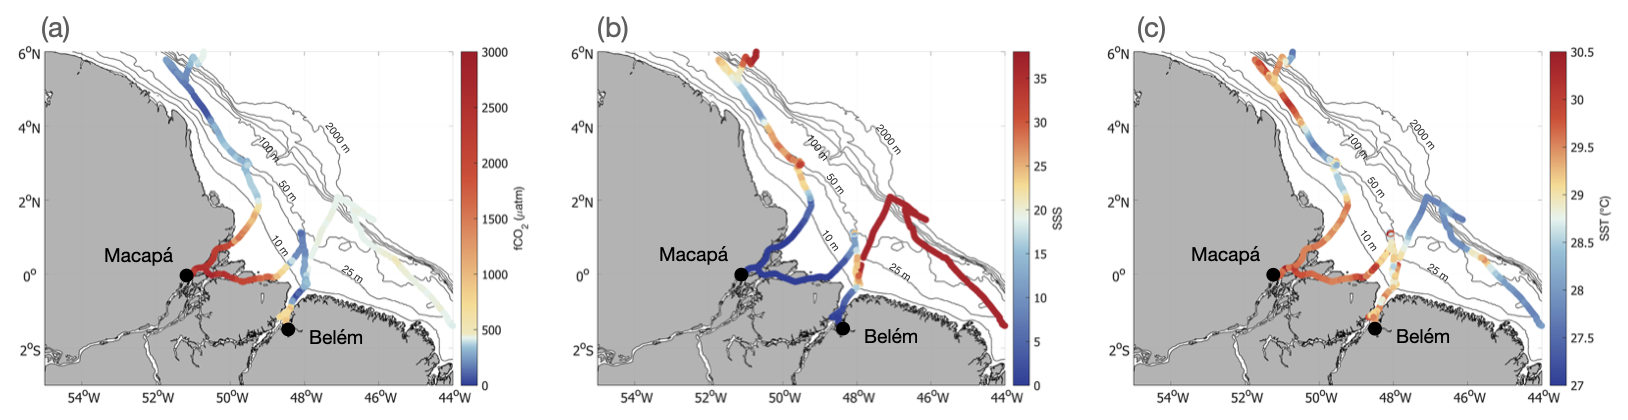
Figure 7Along-track fCO2 (a), sea surface salinity (b), and sea surface temperature (c) in the Amazon region. Bathymetry contours are represented in black from 10 to 2000 m.
4.1 Main drivers of fCO2 variability
4.1.1 Salinity
In the equatorial band (15° N–15° S) of the western Atlantic, the fCO2 variability in the data follows the strong surface salinity variability well (Fig. 6). There are two reasons for that. First, in this region, the surface temperature is very warm (SST > 27 °C), with relatively low variability (the SD of the SST in the dataset is 0.8 °C). The solubility effect associated with an increase in temperature of 0.8 °C would be an increase in the fCO2 by 13.6 µatm (Takahashi et al. 1993, 4.23 % °C−1). While this is non-negligible, it is small compared to the observed SD of 109 µatm observed in the Tara dataset between 15° N and 15° S (excluding waters with SSS ≦ 1).
Second, the Amazon River flows into the tropical Atlantic and forms huge salinity gradients (SD of the SSS in the Tara dataset between 15° N and 15° S is 7.5 for SSS > 1). These gradients indicate the river's influence on the open ocean and thus also the changes in biogeochemical properties. At first order, the gradient in salinity is indicative that the gradient in alkalinity and DIC (linked to biological activity) is associated with the river plume and therefore fCO2. This explains the robustness of empirical linear relationships between salinity and fCO2 in the ARP, such as the one of Lefèvre et al. (2010), presented in Sect. 3.2.
4.1.2 Temperature
South of 15° S, the situation is different, with larger temperature changes. As the schooner sails poleward, the temperature decreases with no more influence of the Amazon River system. At first order, the fCO2 variations follow the one expected from the solubility effect. The SST decreases 8 °C, and the change in fCO2, with a maximum of 442.8 µatm and a minimum of 309.2 µatm is coherent with a drop of 8 °C in temperature (expected drop in fCO2 of 136 µatm following a 4.23 % °C−1 effect; Takahashi et al., 1993).
Nevertheless, while the large-scale variability of the fCO2 reflects the latitudinal temperature gradient (Landschützer et al., 2013), at smaller scales the variability of salinity is also important and different water masses are sampled. Notably, south of Rio de Janeiro, the schooner sailed on the shelf, with a bathymetry often shallower than 100 m (Abril et al., 2022). Other river discharges reach the South Atlantic, such as the one of the Rio de la Plata (Marta-Almeida et al., 2021). These waters spread on the shelf and generate variability in salinity, suspended sediments, and biological activity (Marta-Almeida et al., 2021; Piola et al., 2005).
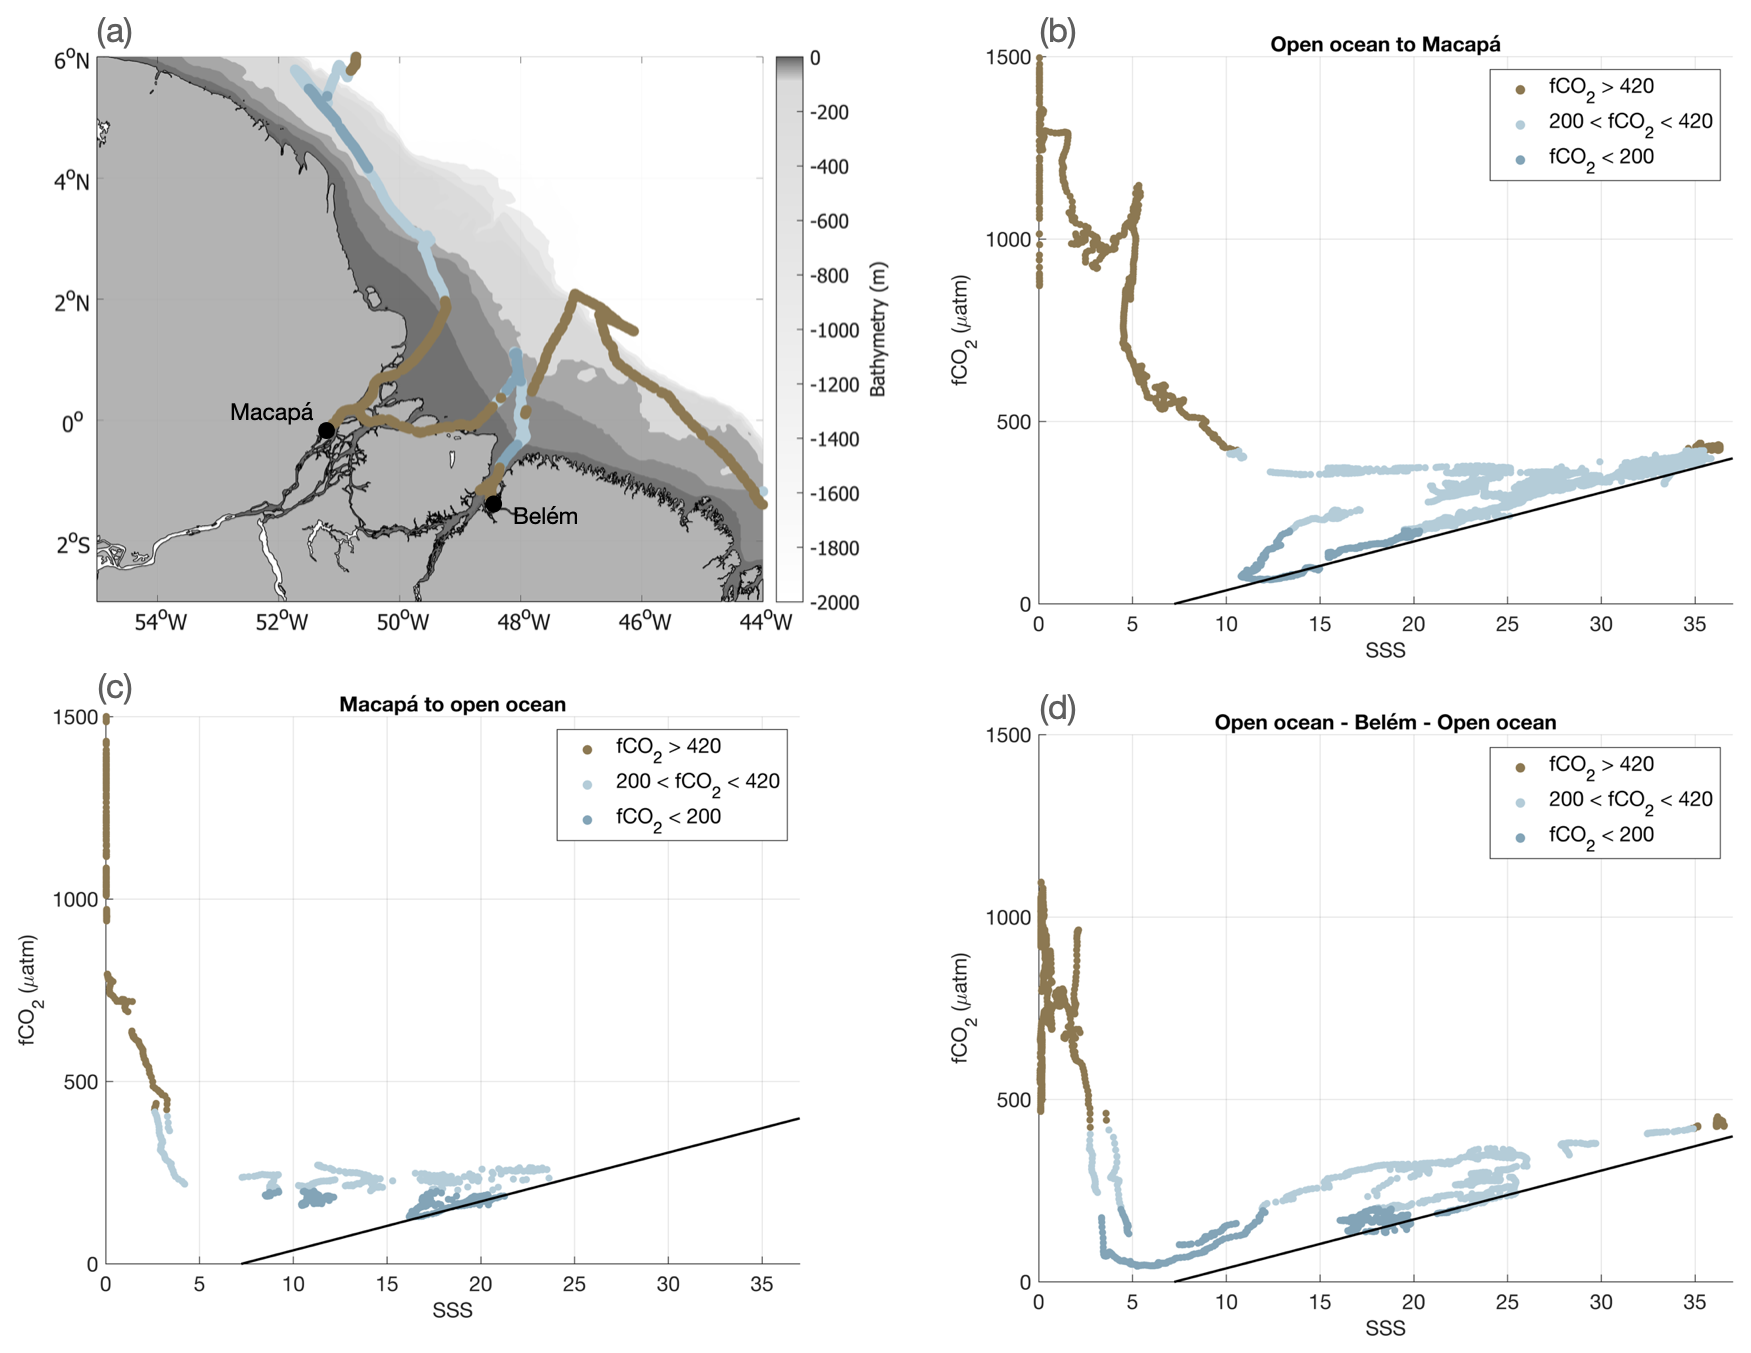
Figure 8(a) Map of the Amazon region, with bathymetry contours. Each region is defined in Fig. 9. The track is colored based on the fCO2 values to highlight three regimes: fCO2 > = 420 µatm (brown), 200 µatm < fCO2 < 420 µatm (light blue), and fCO2 < = 200 µatm (dark blue). fCO2–SSS diagram for the entrance in the Amazon River (b), the exit of the Amazon River (c), and the sampling of the Pará River (d). The black line in (b), (c), and (d) is the fCO2–SSS relationship from Lefèvre et al. (2010).
4.2 The sink–source transition in the river–ocean continuum
The multiple crossings of the river–ocean continuum show a great fCO2 variability in the Amazon River/Pará River estuaries and resulting plumes on the Amazon shelf. As a continuous feature, this environment can extend over 500 km along-shelf and 200 km across-shelf (Curtin and Legeckis, 1986). Within this region, the transports of fresh water, sediment, nutrients, and biomass are determined by energetic processes occurring on semidiurnal, several-day, several-week, and seasonal timescales (Curtin, 1986; Geyer et al., 1991).
In the regions close to the river estuary, the fCO2 changes are no longer primarily associated with the changes in salinity. As salinity decreases, the switch from a decreasing fCO2 (representative of the plume) to increasing fCO2 (representative of the river) does not happen at the same salinity for each crossing. Moreover, the linear relationship between salinity and fCO2 does not hold close to the river. It is thus likely that the salinity gradient no longer mirrors the gradient in DIC or in TA. The strong sediment load of the Amazon River prevents light penetration in the water column and the development of photosynthetic organisms (DeMaster et al., 1986; Gagne-Maynard et al., 2017). The source-to-sink transition is mainly driven by the switch from a respiration-dominated system to a photosynthetic one (Gagne-Maynard et al., 2017; Mu et al., 2021). Several factors impact the suspension of sediments in the water column and the development of phytoplankton, such as the bathymetry, winds, intensity of the outflow (that can be influenced by large-scale climatic modes), and tides (Gomes et al., 2021). Indeed, tides and tidal currents are one of the dominant factors of the variability of the Amazon estuary, with tidal currents ranging from 0.5 to 2.0 m s−1 (Geyer et al., 1991; Ruault et al., 2020).
The relationship between suspended sediments and bathymetry allowed the identification of four zones of interactions by Curtin and Legeckis (1986). They match the fCO2 measurements well. For the Amazon River, the zone of highest suspended sediment concentration (SSC) is located between the isobaths 4 and 11 m, matching the strong increase in the fCO2 observed for the two crossings of the AROC. The zone of lowest SSC found by Curtin and Legeckis (1986) and DeMaster et al. (1986) is between the isobaths 10 and 20 m, which is also the region where we observe the transition from a source to a sink of CO2. For the Pará River, this region extends directly to the mouth for depth shallower than 5 m. It also matches the observations and the differences between the two rivers. Indeed, while for the Amazon River, the transition from a sink to a source happens between 10 and 20 m depth, it happens at much shallower depths for the Pará River (below 10 m). Their “river zone” for depth below 5 m indeed corresponds to a salinity of 0. Nevertheless, we observe important variability of fCO2 even if the salinity does not change anymore. This region was not investigated by studies that were focused further offshore of the mouth. For the region, the bathymetry used here is not adapted anymore, and a specific Amazon estuary bathymetry should be used for further studies (such as Fassoni-Andrade et al., 2021). Therefore, combining the fCO2 dataset and the numerous optical measurements also conducted underway on board the Tara Mission Microbiomes could lead to a better understanding of the AROC system. Moreover, linking this continuous dataset to the discrete imaging and genetic samples from Mission Microbiomes stations, conducted in the different zones of the system, will also shed light on the biological communities responsible for the strong CO2 source or sink observed.
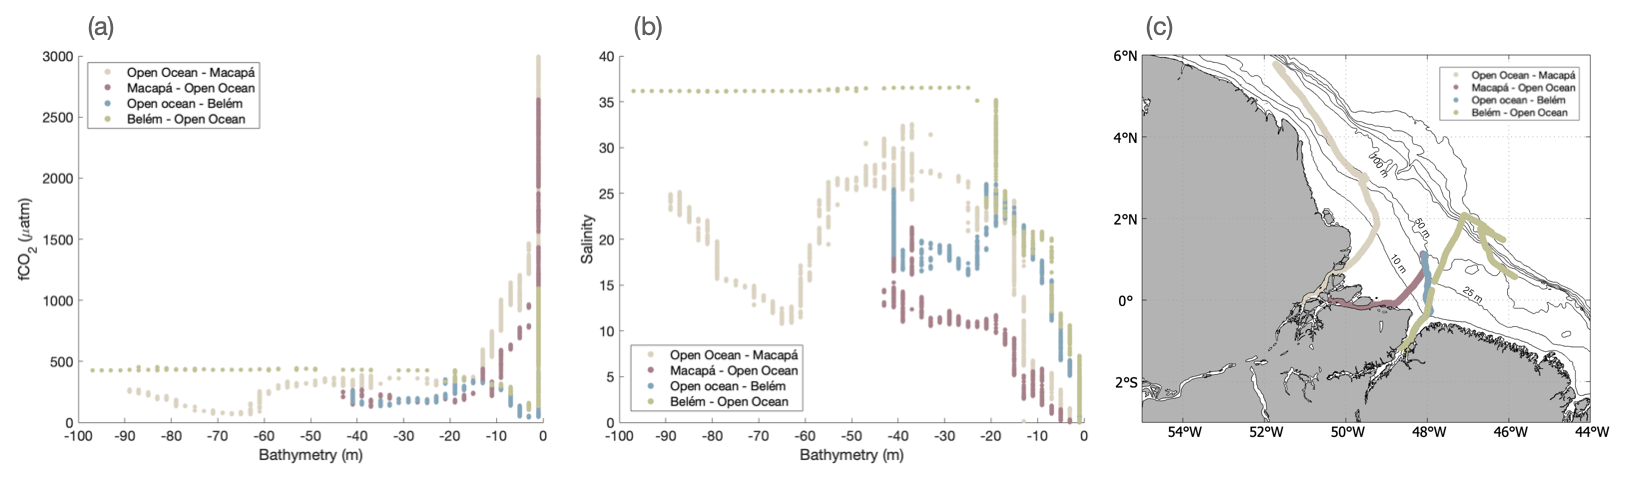
Figure 9(a) fCO2 bathymetry and (b) SSS bathymetry of the different river–ocean continuum crossings for depths shallower than 95 m. The bathymetry is ETOPO2v2 colocalized along the ship track.
4.3 Limitations of the dataset
On board Tara, there is rarely a trained scientist to take care of an equilibrator fCO2 system. The system therefore has to run almost autonomously and is monitored from land when someone trained is not on board. Limited space meant that only two standards were used, and they were stored outside on the foredeck. The deck is subject to spray, waves, and wave-related impacts. This increases the strain on the system and the possibility of failure, particularly during bad weather. The fCO2 system operations were finally terminated due to several leakages that happened during the strong sea state encountered in the Southern Ocean. For this mission, Tara sampled mainly coastal environments, where CO2 is highly variable and little known. There are very few previously acquired data in the region that can be used for comparison. And even where there are other data, the variability in the coastal ocean is such that they might not be comparable. Some surface samples of DIC and TA were collected by scientists on board, which were essential to validate the fCO2 measured. The mean difference of 2 µatm and SDdiff of 7.4 µatm (going down to 0.5 µatm in the less variable environment) gives an estimate of the uncertainty that supports the validity of the dataset. It is nevertheless necessary to note that the relationship to compute fCO2 from DIC and TA also has an uncertainty of 5.4 µatm, and it would be more accurate to cross-compare with fCO2 measurements conducted in the same region at the same time as recommended by SOCAT. This shows the limitation of autonomous fCO2 systems that cannot be checked regularly, especially the ones on small boats that are more fragile due to the rougher conditions than on a large research or container ship.
The dataset is available in the public repository at https://doi.org/10.5281/zenodo.13790064 (Olivier et al., 2024a). It is also submitted to the SOCAT version 2025.
For the first time, a schooner equipped with an fCO2 equilibrator system measured fCO2 along the eastern coasts of South America. This high-temporal-resolution dataset includes fCO2 measurements every minute over 14 000 km of sailing. From the Caribbean to Argentina, this dataset of 65 000 measurements spanning over almost 4 months (from August to the end of November 2021, for a total of 45 d and 8 h of valid fCO2 data) shows large fCO2 variability. In particular, it sampled the Amazon River plume, the Amazon and Pará River estuaries, the North Brazil Current, the Brazil Current, the Vitória–Trindade seamounts (local hotspot of biodiversity), and the shelves of southern Brazil.
In August–September 2021, the Amazon–Pará plume is highly undersaturated with CO2, in line with the many regional studies on the Amazon River plume (Ibánhez et al., 2015; Körtzinger, 2003; Lefévre et al., 2010; Mu et al., 2021). This dataset provides data closer to the river than in some of these earlier studies, sampling the core of the plume. Further from the mouth, fCO2 reaches extreme low values, between 40 and 60 µatm, which had never been observed before. It was possible to measure such low values because for the first time a ship equipped with an fCO2 system sampled the river–ocean continuum and pumped water at a very shallow depth. When salinity continues to drop (S<8), a sink–source transition occurs, and fCO2 rises rapidly. The influence of the river becomes dominant, and fCO2 reaches 3000 µatm in the river. The river–ocean continuum was crossed four times and each time showed different properties. This system is highly dynamic and needs to be studied further to infer the role of the Amazon system in the global carbon budget.
Equipping a sailboat with an fCO2 equilibrator system is a challenge, but one that has been met by the schooner Tara. The dataset is very valuable for global and regional studies, providing data in the data-poor region of the coastal regions of the South Atlantic Ocean. It is particularly helpful for fCO2 mapping products, which assimilate all data collected to produce global monthly and climatological fCO2 maps from neural network reconstruction (Chau et al., 2024; Denvil-Sommer et al., 2019; Landschützer et al., 2016, 2020; Laruelle et al., 2017). It is also useful for process studies, such as the river–ocean continuum (Sawakuchi et al., 2017), offshore ARP (Olivier et al., 2024b) and the coastal currents of the South American coast. The difficulty in validating the dataset shows just how little is known about coastal regions and how dynamic they are. The limited number of observations could be due to the complicated access to some of these regions (distance from major port), limited funding, and the difficulty of obtaining sampling permits. Collecting more fCO2 data in under-sampled regions, such as the Southern Hemisphere oceans, the Southern Ocean, coastal regions, and estuaries, is very important to improve our knowledge of the global carbon cycle (Roobaert et al., 2019).
LO, JB, and GR conceptualized the project. LO, TL, NH, and AC collected the data, and LO and CH curated the data. CH and DV designed and provided the instrument to collect the dataset. SP managed and coordinated the project on land and on board for the mission. LO prepared the paper with contributions from all co-authors.
The contact author has declared that none of the authors has any competing interests.
This output reflects only the authors' view and the European Union cannot be held responsible for any use that may be made of the information contained herein.
Publisher's note: Copernicus Publications remains neutral with regard to jurisdictional claims made in the text, published maps, institutional affiliations, or any other geographical representation in this paper. While Copernicus Publications makes every effort to include appropriate place names, the final responsibility lies with the authors.
We wish to thank the Tara Ocean Foundation, the SV Tara crew, and all those who participated in the Mission Microbiomes AtlantECO and continue adopt its data sharing and publication best practices (https://zenodo.org/communities/mission-microbiomes-atlanteco/, last access: 30 April 2025). In particular, we would like to thank chief engineer Léo Boulon for all his help with the installation of the system as well as Martin Hertau, Nicolas Bin, and Samuel Audrain for the maintenance. Clémentine Moulin and Aliénor Bourdais are thanked for the help with the logistics, the shipping, and the coordination. We warmly thank SNAPOCO2 and Jonathan Fin for the accurate analysis of the DIC/TA samples. We are grateful for the commitment of the following institutions for their financial and scientific support that made Mission Microbiomes AtlantECO possible: Stazione Zoologica Anton Dohrn, European Bioinformatics Institute (EMBL-EBI), Centre national de la recherche scientifique (CNRS), Centre National de Séquençage (CNS, Genoscope), agnès b., BIC, Capgemini Engineering, Fondation Groupe EDF, Compagnie Nationale du Rhône, L'Oréal, Biotherm, Région Bretagne, Lorient Agglomération, Billerudkorsnas, Havas Paris, Fondation Rothschild, Office Français de la Biodiversité, AmerisourceBergen, Philgood Foundation, UNESCO-IOC, and Etienne Bourgois.
This publication has received funding from the European Union's Horizon 2020 research and innovation program under grant agreement no. 862923 (project AtlantECO). This work was supported by the Initiative and Networking Fund of the Helmholtz Association (grant number: VH-NG-19-33). Pedro C. Junger was supported by Fundação de Amparo à Pesquisa do Estado de São Paulo (FAPESP; PhD grant no. 2017/26786-1) and by FAI/UFSCar (ProEx no. 3213/2020-83) through the European Union – H2020 project AtlantECO (award no. 862923).
The article processing charges for this open-access publication were covered by the Alfred-Wegener-Institut Helmholtz-Zentrum für Polar- und Meeresforschung.
This paper was edited by Anton Velo and reviewed by Marcos Fontela and one anonymous referee.
Abril, G., Cotovicz Jr., L. C., Nepomuceno, A., Erbas, T., Costa, S., Ramos, V., Moser, G., Fernandes, A., Negri, E., Knoppers, B. A., Brandini, N., Machado, W., Bernardes, M., and Vantrepotte, V.: Spreading Eutrophication and Changing CO2 Fluxes in the Tropical Coastal Ocean: A Few Lessons from Rio De Janeiro, Arq. Ciênc. Mar., 55, 461–476, https://doi.org/10.32360/acmar.v55iEspecial.78518, 2022.
Andrié, C., Oudot, C., Genthon, C., and Merlivat, L.: CO2 fluxes in the tropical Atlantic during FOCAL cruises, J. Geophys. Res.-Oceans, 91, 11741–11755, https://doi.org/10.1029/JC091iC10p11741, 1986.
Araujo, M., Noriega, C., Hounsou-gbo, G. A., Veleda, D., Araujo, J., Bruto, L., Feitosa, F., Flores-Montes, M., Lefèvre, N., Melo, P., Otsuka, A., Travassos, K., Schwamborn, R., and Neumann-Leitão, S.: A Synoptic Assessment of the Amazon River-Ocean Continuum during Boreal Autumn: From Physics to Plankton Communities and Carbon Flux, Front. Microbiol., 8, 1358, https://doi.org/10.3389/fmicb.2017.01358, 2017.
Bakker, D. C. E., Pfeil, B., Landa, C. S., Metzl, N., O'Brien, K. M., Olsen, A., Smith, K., Cosca, C., Harasawa, S., Jones, S. D., Nakaoka, S., Nojiri, Y., Schuster, U., Steinhoff, T., Sweeney, C., Takahashi, T., Tilbrook, B., Wada, C., Wanninkhof, R., Alin, S. R., Balestrini, C. F., Barbero, L., Bates, N. R., Bianchi, A. A., Bonou, F., Boutin, J., Bozec, Y., Burger, E. F., Cai, W.-J., Castle, R. D., Chen, L., Chierici, M., Currie, K., Evans, W., Featherstone, C., Feely, R. A., Fransson, A., Goyet, C., Greenwood, N., Gregor, L., Hankin, S., Hardman-Mountford, N. J., Harlay, J., Hauck, J., Hoppema, M., Humphreys, M. P., Hunt, C. W., Huss, B., Ibánhez, J. S. P., Johannessen, T., Keeling, R., Kitidis, V., Körtzinger, A., Kozyr, A., Krasakopoulou, E., Kuwata, A., Landschützer, P., Lauvset, S. K., Lefèvre, N., Lo Monaco, C., Manke, A., Mathis, J. T., Merlivat, L., Millero, F. J., Monteiro, P. M. S., Munro, D. R., Murata, A., Newberger, T., Omar, A. M., Ono, T., Paterson, K., Pearce, D., Pierrot, D., Robbins, L. L., Saito, S., Salisbury, J., Schlitzer, R., Schneider, B., Schweitzer, R., Sieger, R., Skjelvan, I., Sullivan, K. F., Sutherland, S. C., Sutton, A. J., Tadokoro, K., Telszewski, M., Tuma, M., van Heuven, S. M. A. C., Vandemark, D., Ward, B., Watson, A. J., and Xu, S.: A multi-decade record of high-quality fCO2 data in version 3 of the Surface Ocean CO2 Atlas (SOCAT), Earth Syst. Sci. Data, 8, 383–413, https://doi.org/10.5194/essd-8-383-2016, 2016.
Bauer, J. E., Cai, W.-J., Raymond, P. A., Bianchi, T. S., Hopkinson, C. S., and Regnier, P. A. G.: The changing carbon cycle of the coastal ocean, Nature, 504, 61–70, https://doi.org/10.1038/nature12857, 2013.
Borges, A. V.: Do we have enough pieces of the jigsaw to integrate CO2 fluxes in the coastal ocean?, Estuaries, 28, 3–27, https://doi.org/10.1007/BF02732750, 2005.
Bork, P., Bowler, C., de Vargas, C., Gorsky, G., Karsenti, E., and Wincker, P.: Tara Oceans studies plankton at planetary scale, Science, 348, 873–873, https://doi.org/10.1126/science.aac5605, 2015.
Cai, W.-J., Dai, M., and Wang, Y.: Air-sea exchange of carbon dioxide in ocean margins: A province-based synthesis, Geophys. Res. Lett., 33, L12603, https://doi.org/10.1029/2006GL026219, 2006.
Chau, T.-T.-T., Gehlen, M., Metzl, N., and Chevallier, F.: CMEMS-LSCE: a global, 0.25°, monthly reconstruction of the surface ocean carbonate system, Earth Syst. Sci. Data, 16, 121–160, https://doi.org/10.5194/essd-16-121-2024, 2024.
Chen, C.-T. A., Huang, T.-H., Chen, Y.-C., Bai, Y., He, X., and Kang, Y.: Air–sea exchanges of CO2 in the world's coastal seas, Biogeosciences, 10, 6509–6544, https://doi.org/10.5194/bg-10-6509-2013, 2013.
Cooley, S. R., Coles, V. J., Subramaniam, A., and Yager, P. L.: Seasonal variations in the Amazon plume-related atmospheric carbon sink: SEASONALITY OF CO2 IN AMAZON PLUME, Glob. Biogeochem. Cy., 21, GB3014, https://doi.org/10.1029/2006GB002831, 2007.
Cotovicz Jr., L. C., Knoppers, B. A., Brandini, N., Costa Santos, S. J., and Abril, G.: A strong CO2 sink enhanced by eutrophication in a tropical coastal embayment (Guanabara Bay, Rio de Janeiro, Brazil), Biogeosciences, 12, 6125–6146, https://doi.org/10.5194/bg-12-6125-2015, 2015.
Curtin, T. B.: Physical observations in the plume region of the Amazon River during peak discharge – II. Water masses, Cont. Shelf Res., 6, 53–71, https://doi.org/10.1016/0278-4343(86)90053-1, 1986.
Curtin, T. B. and Legeckis, R. V.: Physical observations in the plume region of the Amazon River during peak discharge – I. Surface variability, Cont. Shelf Res., 6, 31–51, https://doi.org/10.1016/0278-4343(86)90052-X, 1986.
Dai, A. and Trenberth, K. E.: Estimates of Freshwater Discharge from Continents: Latitudinal and Seasonal Variations, J. Hydrometeorol., 3, 660–687, https://doi.org/10.1175/1525-7541(2002)003<0660:EOFDFC>2.0.CO;2, 2002.
DeMaster, D. J., Kuehl, S. A., and Nittrouer, C. A.: Effects of suspended sediments on geochemical processes near the mouth of the Amazon River: examination of biological silica uptake and the fate of particle-reactive elements, Cont. Shelf Res., 6, 107–125, https://doi.org/10.1016/0278-4343(86)90056-7, 1986.
Denvil-Sommer, A., Gehlen, M., Vrac, M., and Mejia, C.: LSCE-FFNN-v1: a two-step neural network model for the reconstruction of surface ocean pCO2 over the global ocean, Geosci. Model Dev., 12, 2091–2105, https://doi.org/10.5194/gmd-12-2091-2019, 2019.
Dickson, A. G.: Guide to best practices for ocean CO2 measurements, PICES Spec. Publ., North Pacific Marine Science Organization, 191, 2007.
Dickson, A. G. and Millero, F. J.: A comparison of the equilibrium constants for the dissociation of carbonic acid in seawater media, Deep-Sea Res. Pt. A, 34, 1733–1743, https://doi.org/10.1016/0198-0149(87)90021-5, 1987.
Dong, Y., Bakker, D. C. E., and Landschützer, P.: Accuracy of Ocean CO2 Uptake Estimates at a Risk by a Reduction in the Data Collection, Geophys. Res. Lett., 51, e2024GL108502, https://doi.org/10.1029/2024GL108502, 2024.
Fassoni-Andrade, A. C., Durand, F., Moreira, D., Azevedo, A., dos Santos, V. F., Funi, C., and Laraque, A.: Comprehensive bathymetry and intertidal topography of the Amazon estuary, Earth Syst. Sci. Data, 13, 2275–2291, https://doi.org/10.5194/essd-13-2275-2021, 2021.
Friedlingstein, P., O'Sullivan, M., Jones, M. W., Andrew, R. M., Hauck, J., Landschützer, P., Le Quéré, C., Li, H., Luijkx, I. T., Olsen, A., Peters, G. P., Peters, W., Pongratz, J., Schwingshackl, C., Sitch, S., Canadell, J. G., Ciais, P., Jackson, R. B., Alin, S. R., Arneth, A., Arora, V., Bates, N. R., Becker, M., Bellouin, N., Berghoff, C. F., Bittig, H. C., Bopp, L., Cadule, P., Campbell, K., Chamberlain, M. A., Chandra, N., Chevallier, F., Chini, L. P., Colligan, T., Decayeux, J., Djeutchouang, L. M., Dou, X., Duran Rojas, C., Enyo, K., Evans, W., Fay, A. R., Feely, R. A., Ford, D. J., Foster, A., Gasser, T., Gehlen, M., Gkritzalis, T., Grassi, G., Gregor, L., Gruber, N., Gürses, Ö., Harris, I., Hefner, M., Heinke, J., Hurtt, G. C., Iida, Y., Ilyina, T., Jacobson, A. R., Jain, A. K., Jarníková, T., Jersild, A., Jiang, F., Jin, Z., Kato, E., Keeling, R. F., Klein Goldewijk, K., Knauer, J., Korsbakken, J. I., Lan, X., Lauvset, S. K., Lefèvre, N., Liu, Z., Liu, J., Ma, L., Maksyutov, S., Marland, G., Mayot, N., McGuire, P. C., Metzl, N., Monacci, N. M., Morgan, E. J., Nakaoka, S.-I., Neill, C., Niwa, Y., Nützel, T., Olivier, L., Ono, T., Palmer, P. I., Pierrot, D., Qin, Z., Resplandy, L., Roobaert, A., Rosan, T. M., Rödenbeck, C., Schwinger, J., Smallman, T. L., Smith, S. M., Sospedra-Alfonso, R., Steinhoff, T., Sun, Q., Sutton, A. J., Séférian, R., Takao, S., Tatebe, H., Tian, H., Tilbrook, B., Torres, O., Tourigny, E., Tsujino, H., Tubiello, F., van der Werf, G., Wanninkhof, R., Wang, X., Yang, D., Yang, X., Yu, Z., Yuan, W., Yue, X., Zaehle, S., Zeng, N., and Zeng, J.: Global Carbon Budget 2024, Earth Syst. Sci. Data, 17, 965–1039, https://doi.org/10.5194/essd-17-965-2025, 2025.
Gagne-Maynard, W. C., Ward, N. D., Keil, R. G., Sawakuchi, H. O., Da Cunha, A. C., Neu, V., Brito, D. C., Da Silva Less, D. F., Diniz, J. E. M., De Matos Valerio, A., Kampel, M., Krusche, A. V., and Richey, J. E.: Evaluation of Primary Production in the Lower Amazon River Based on a Dissolved Oxygen Stable Isotopic Mass Balance, Front. Mar. Sci., 4, 26, https://doi.org/10.3389/fmars.2017.00026, 2017.
Geyer, W. R., Beardsley, R. C., Candela, J., Castro, B. M., Legeckis, R. V., Lentz, S. J., Limeburner, R., Miranda, L. B., and Trowbridge, J. H.: The physical oceanography of the Amazon outflow, Oceanography, 4, 8–14, 1991.
Gomes, V. J. C., Asp, N. E., Siegle, E., Gomes, J. D., Silva, A. M. M., Ogston, A. S., and Nittrouer, C. A.: Suspended-Sediment Distribution Patterns in Tide-Dominated Estuaries on the Eastern Amazon Coast: Geomorphic Controls of Turbidity-Maxima Formation, Water, 13, 1568, https://doi.org/10.3390/w13111568, 2021.
Ho, D. T. and Schanze, J. J.: Precipitation-induced reduction in surface ocean pCO2: Observations from the eastern tropical Pacific Ocean, Geophys. Res. Lett., 47, e2020GL088252, https://doi.org/10.1029/2020GL088252, 2020.
Ibánhez, J. S. P., Diverrès, D., Araujo, M., and Lefèvre, N.: Seasonal and interannual variability of sea-air CO2 fluxes in the tropical Atlantic affected by the Amazon River plume, Glob. Biogeochem. Cy., 29, 1640–1655, https://doi.org/10.1002/2015GB005110, 2015.
Ibánhez, J. S. P., Araujo, M., and Lefèvre, N.: The overlooked tropical oceanic CO2 sink, Geophys. Res. Lett., 43, 3804–3812, https://doi.org/10.1002/2016GL068020, 2016.
Kerr, R., da Cunha, L. C., Kikuchi, R. K. P., Horta, P. A., Ito, R. G., Müller, M. N., Orselli, I. B. M., Lencina-Avila, J. M., de Orte, M. R., Sordo, L., Pinheiro, B. R., Bonou, F. K., Schubert, N., Bergstrom, E., and Copertino, M. S.: The Western South Atlantic Ocean in a High-CO2 World: Current Measurement Capabilities and Perspectives, Environ. Manage., 57, 740–752, https://doi.org/10.1007/s00267-015-0630-x, 2016.
Körtzinger, A.: A significant CO2 sink in the tropical Atlantic Ocean associated with the Amazon River plume, Geophys. Res. Lett., 30, 2287, https://doi.org/10.1029/2003GL018841, 2003.
Landschützer, P., Gruber, N., Bakker, D. C. E., Schuster, U., Nakaoka, S., Payne, M. R., Sasse, T. P., and Zeng, J.: A neural network-based estimate of the seasonal to inter-annual variability of the Atlantic Ocean carbon sink, Biogeosciences, 10, 7793–7815, https://doi.org/10.5194/bg-10-7793-2013, 2013.
Landschützer, P., Gruber, N., and Bakker, D. C. E.: Decadal variations and trends of the global ocean carbon sink, Glob. Biogeochem. Cy., 30, 1396–1417, https://doi.org/10.1002/2015GB005359, 2016.
Landschützer, P., Laruelle, G. G., Roobaert, A., and Regnier, P.: A uniform pCO2 climatology combining open and coastal oceans, Earth Syst. Sci. Data, 12, 2537–2553, https://doi.org/10.5194/essd-12-2537-2020, 2020.
Landschützer, P., Tanhua, T., Behncke, J., and Keppler, L.: Sailing through the southern seas of air–sea CO2 flux uncertainty, Philos. T. R. Soc., 381, 20220064, https://doi.org/10.1098/rsta.2022.0064, 2023.
Laruelle, G. G., Lauerwald, R., Pfeil, B., and Regnier, P.: Regionalized global budget of the CO2 exchange at the air-water interface in continental shelf seas, Glob. Biogeochem. Cy., 28, 1199–1214, https://doi.org/10.1002/2014GB004832, 2014.
Laruelle, G. G., Landschützer, P., Gruber, N., Tison, J.-L., Delille, B., and Regnier, P.: Global high-resolution monthly pCO2 climatology for the coastal ocean derived from neural network interpolation, Biogeosciences, 14, 4545–4561, https://doi.org/10.5194/bg-14-4545-2017, 2017.
Lefévre, N., Diverrés, D., and Gallois, F.: Origin of CO2 undersaturation in the western tropical Atlantic, Tellus B, 62, 595–607, https://doi.org/10.1111/j.1600-0889.2010.00475.x, 2010.
Lefèvre, N., Flores Montes, M., Gaspar, F. L., Rocha, C., Jiang, S., De Araújo, M. C., and Ibánhez, J. S. P.: Net Heterotrophy in the Amazon Continental Shelf Changes Rapidly to a Sink of CO2 in the Outer Amazon Plume, Front. Mar. Sci., 4, 278, https://doi.org/10.3389/fmars.2017.00278, 2017.
Lueker, T. J., Dickson, A. G., and Keeling, C. D.: Ocean pCO2 calculated from dissolved inorganic carbon, alkalinity, and equations for K1 and K2: validation based on laboratory measurements of CO2 in gas and seawater at equilibrium, Mar. Chem., 70, 105–119, https://doi.org/10.1016/S0304-4203(00)00022-0, 2000.
Marta-Almeida, M., Dalbosco, A., Franco, D., and Ruiz-Villarreal, M.: Dynamics of river plumes in the South Brazilian Bight and South Brazil, Ocean Dynam., 71, 59–80, https://doi.org/10.1007/s10236-020-01397-x, 2021.
Mashayek, A., Gula, J., Baker, L. E., Naveira Garabato, A. C., Cimoli, L., Riley, J. J., and de Lavergne, C.: On the role of seamounts in upwelling deep-ocean waters through turbulent mixing, P. Natl. Acad. Sci., 121, e2322163121, https://doi.org/10.1073/pnas.2322163121, 2024.
Mayorga, E., Aufdenkampe, A. K., Masiello, C. A., Krusche, A. V., Hedges, J. I., Quay, P. D., Richey, J. E., and Brown, T. A.: Young organic matter as a source of carbon dioxide outgassing from Amazonian rivers, Nature, 436, 538–541, 2005.
Mehrbach, C., Culberson, C. H., Hawley, J. E., and Pytkowicx, R. M.: Measurement of the Apparent Dissociation Constants of Carbonic Acid in Seawater at Atmospheric Pressure1, Limnol. Oceanogr., 18, 897–907, https://doi.org/10.4319/lo.1973.18.6.0897, 1973.
Metzl, N., Fin, J., Lo Monaco, C., Mignon, C., Alliouane, S., Antoine, D., Bourdin, G., Boutin, J., Bozec, Y., Conan, P., Coppola, L., Diaz, F., Douville, E., Durrieu de Madron, X., Gattuso, J.-P., Gazeau, F., Golbol, M., Lansard, B., Lefèvre, D., Lefèvre, N., Lombard, F., Louanchi, F., Merlivat, L., Olivier, L., Petrenko, A., Petton, S., Pujo-Pay, M., Rabouille, C., Reverdin, G., Ridame, C., Tribollet, A., Vellucci, V., Wagener, T., and Wimart-Rousseau, C.: A synthesis of ocean total alkalinity and dissolved inorganic carbon measurements from 1993 to 2022: the SNAPO-CO2-v1 dataset, Earth Syst. Sci. Data, 16, 89–120, https://doi.org/10.5194/essd-16-89-2024, 2024.
Millero, F. J.: Thermodynamics of the carbon dioxide system in the oceans, Geochim. Cosmochim. Ac., 59, 661–677, https://doi.org/10.1016/0016-7037(94)00354-O, 1995.
Monteiro, T., Batista, M., Henley, S., Machado, E. da C., Araujo, M., and Kerr, R.: Contrasting Sea-Air CO2 Exchanges in the Western Tropical Atlantic Ocean, Global Biogeochem. Cy., 36, e2022GB007385, https://doi.org/10.1029/2022GB007385, 2022.
Morel, A., Claustre, H., and Gentili, B.: The most oligotrophic subtropical zones of the global ocean: similarities and differences in terms of chlorophyll and yellow substance, Biogeosciences, 7, 3139–3151, https://doi.org/10.5194/bg-7-3139-2010, 2010.
Mu, L., Gomes, H. do R., Burns, S. M., Goes, J. I., Coles, V. J., Rezende, C. E., Thompson, F. L., Moura, R. L., Page, B., and Yager, P. L.: Temporal Variability of Air-Sea CO2 flux in the Western Tropical North Atlantic Influenced by the Amazon River Plume, Global Biogeochem. Cy., 35, e2020GB006798, https://doi.org/10.1029/2020GB006798, 2021.
Napolitano, D. C., da Silveira, I. C. A., Tandon, A., and Calil, P. H. R.: Submesoscale Phenomena Due to the Brazil Current Crossing of the Vitória-Trindade Ridge, J. Geophys. Res.-Oceans, 126, e2020JC016731, https://doi.org/10.1029/2020JC016731, 2021.
Olivier, L., Boutin, J., Reverdin, G., Lefèvre, N., Landschützer, P., Speich, S., Karstensen, J., Labaste, M., Noisel, C., Ritschel, M., Steinhoff, T., and Wanninkhof, R.: Wintertime process study of the North Brazil Current rings reveals the region as a larger sink for CO2 than expected, Biogeosciences, 19, 2969–2988, https://doi.org/10.5194/bg-19-2969-2022, 2022.
Olivier, L., Reverdin, G., Boutin, J., Hunt, C., Linkowski, T., Chase, A. P., Haentjens, N., Junger, P. C., Pesant, S., and Vandemark, D.: CO2 fugacity aboard the schooner Tara during Mission Microbiomes AtlantECO, Zenodo [data set], https://doi.org/10.5281/zenodo.13790064, 2024a.
Olivier, L., Reverdin, G., Boutin, J., Laxenaire, R., Iudicone, D., Pesant, S., Calil, P. H. R., Horstmann, J., Couet, D., Erta, J. M., Huber, P., Sarmento, H., Freire, A., Koch-Larrouy, A., Vergely, J.-L., Rousselot, P., and Speich, S.: Late summer northwestward Amazon plume pathway under the action of the North Brazil Current rings, Remote Sens. Environ., 307, 114165, https://doi.org/10.1016/j.rse.2024.114165, 2024b.
Padin, X. A., Vázquez-Rodríguez, M., Castaño, M., Velo, A., Alonso-Pérez, F., Gago, J., Gilcoto, M., Álvarez, M., Pardo, P. C., de la Paz, M., Ríos, A. F., and Pérez, F. F.: Air-Sea CO2 fluxes in the Atlantic as measured during boreal spring and autumn, Biogeosciences, 7, 1587–1606, https://doi.org/10.5194/bg-7-1587-2010, 2010.
Pesant, S., Not, F., Picheral, M., Kandels-Lewis, S., Le Bescot, N., Gorsky, G., Iudicone, D., Karsenti, E., Speich, S., Troublé, R., Dimier, C., and Searson, S.: Open science resources for the discovery and analysis of Tara Oceans data, Sci. Data, 2, 150023, https://doi.org/10.1038/sdata.2015.23, 2015.
Pierrot, D., Neill, C., Sullivan, K., Castle, R., Wanninkhof, R., Lüger, H., Johannessen, T., Olsen, A., Feely, R. A., and Cosca, C. E.: Recommendations for autonomous underway pCO2 measuring systems and data-reduction routines, Deep-Sea Res. Pt. II, 56, 512–522, https://doi.org/10.1016/j.dsr2.2008.12.005, 2009.
Pinheiro, H. T., Mazzei, E., Moura, R. L., Amado-Filho, G. M., Carvalho-Filho, A., Braga, A. C., Costa, P. A. S., Ferreira, B. P., Ferreira, C. E. L., Floeter, S. R., Francini-Filho, R. B., Gasparini, J. L., Macieira, R. M., Martins, A. S., Olavo, G., Pimentel, C. R., Rocha, L. A., Sazima, I., Simon, T., Teixeira, J. B., Xavier, L. B., and Joyeux, J.-C.: Fish Biodiversity of the Vitória-Trindade Seamount Chain, Southwestern Atlantic: An Updated Database, PLOS ONE, 10, e0118180, https://doi.org/10.1371/journal.pone.0118180, 2015.
Piola, A. R., Matano, R. P., Palma, E. D., Möller Jr., O. O., and Campos, E. J.: The influence of the Plata River discharge on the western South Atlantic shelf, Geophys. Res. Lett., 32, L01603, https://doi.org/10.1029/2004GL021638, 2005.
Richey, J. E., Melack, J. M., Aufdenkampe, A. K., Ballester, V. M., and Hess, L. L.: Outgassing from Amazonian rivers and wetlands as a large tropical source of atmospheric CO2, Nature, 416, 617–620, https://doi.org/10.1038/416617a, 2002.
Roobaert, A., Laruelle, G. G., Landschützer, P., Gruber, N., Chou, L., and Regnier, P.: The Spatiotemporal Dynamics of the Sources and Sinks of CO2 in the Global Coastal Ocean, Global Biogeochem. Cy., 33, 1693–1714, https://doi.org/10.1029/2019GB006239, 2019.
Ruault, V., Jouanno, J., Durand, F., Chanut, J., and Benshila, R.: Role of the Tide on the Structure of the Amazon Plume: A Numerical Modeling Approach, J. Geophys. Res.-Oceans, 125, e2019JC015495, https://doi.org/10.1029/2019JC015495, 2020.
Sawakuchi, H. O., Neu, V., Ward, N. D., Barros, M. de L. C., Valerio, A. M., Gagne-Maynard, W., Cunha, A. C., Less, D. F. S., Diniz, J. E. M., Brito, D. C., Krusche, A. V., and Richey, J. E.: Carbon Dioxide Emissions along the Lower Amazon River, Front. Mar. Sci., 4, 76, https://doi.org/10.3389/fmars.2017.00076, 2017.
Sharp, J. D., Pierrot, D., Humphreys, M. P., Epitalon, J.-M., Orr, J. C., Lewis, E. R., and Wallace, D. W. R.: CO2SYSv3 for MATLAB, , https://doi.org/10.5281/zenodo.4023039, 2020.
Subramaniam, A., Yager, P. L., Carpenter, E. J., Mahaffey, C., Björkman, K., Cooley, S., Kustka, A. B., Montoya, J. P., Sañudo-Wilhelmy, S. A., Shipe, R., and Capone, D. G.: Amazon River enhances diazotrophy and carbon sequestration in the tropical North Atlantic Ocean, P. Natl. Acad. Sci., 105, 10460–10465, https://doi.org/10.1073/pnas.0710279105, 2008.
Takahashi, T., Olafsson, J., Goddard, J. G., Chipman, D. W., and Sutherland, S. C.: Seasonal variation of CO2 and nutrients in the high-latitude surface oceans: A comparative study, Global Biogeochem. Cy., 7, 843–878, https://doi.org/10.1029/93GB02263, 1993.
Takahashi, T., Sutherland, S. C., Sweeney, C., Poisson, A., Metzl, N., Tilbrook, B., Bates, N., Wanninkhof, R., Feely, R. A., Sabine, C., Olafsson, J., and Nojiri, Y.: Global sea–air CO2 flux based on climatological surface ocean pCO2, and seasonal biological and temperature effects, Deep-Sea Res. Pt. II, 49, 1601–1622, https://doi.org/10.1016/S0967-0645(02)00003-6, 2002.
Tennekes, H.: The Logarithmic Wind Profile, J. Atmos. Sci., 30, 234–238, https://doi.org/10.1175/1520-0469(1973)030<0234:TLWP>2.0.CO;2, 1973.
Valerio, A. de M., Kampel, M., Vantrepotte, V., Ward, N. D., Sawakuchi, H. O., Less, D. F. D. S., Neu, V., Cunha, A., and Richey, J.: Using CDOM optical properties for estimating DOC concentrations and pCO2 in the Lower Amazon River, Opt. Express, 26, A657–A677, https://doi.org/10.1364/OE.26.00A657, 2018.
Vandemark, D., Salisbury, J. E., Hunt, C. W., Shellito, S. M., Irish, J. D., McGillis, W. R., Sabine, C. L., and Maenner, S. M.: Temporal and spatial dynamics of CO2 air-sea flux in the Gulf of Maine, J. Geophys. Res.-Oceans, 116, C01012, https://doi.org/10.1029/2010JC006408, 2011.
Ward, N. D., Keil, R. G., Medeiros, P. M., Brito, D. C., Cunha, A. C., Dittmar, T., Yager, P. L., Krusche, A. V., and Richey, J. E.: Degradation of terrestrially derived macromolecules in the Amazon River, Nat. Geosci., 6, 530–533, 2013.
Ward, N. D., Krusche, A. V., Sawakuchi, H. O., Brito, D. C., Cunha, A. C., Moura, J. M. S., da Silva, R., Yager, P. L., Keil, R. G., and Richey, J. E.: The compositional evolution of dissolved and particulate organic matter along the lower Amazon River – Óbidos to the ocean, Mar. Chem., 177, 244–256, 2015.
Ward, N. D., Bianchi, T. S., Medeiros, P. M., Seidel, M., Richey, J. E., Keil, R. G., and Sawakuchi, H. O.: Where Carbon Goes When Water Flows: Carbon Cycling across the Aquatic Continuum, Front. Mar. Sci., 4, 7, https://doi.org/10.3389/fmars.2017.00007, 2017.
Waters, J., Millero, F. J., and Woosley, R. J.: Corrigendum to “The free proton concentration scale for seawater pH”, [MARCHE: 149 (2013) 8–22], Mar. Chem., 165, 66–67, https://doi.org/10.1016/j.marchem.2014.07.004, 2014.