the Creative Commons Attribution 4.0 License.
the Creative Commons Attribution 4.0 License.
 | 27 Jun 2025
An updated reconstruction of Antarctic near-surface air temperatures at monthly intervals since 1958
Sheng-Hung Wang
Alexandra Ensign
An updated near-surface temperature reconstruction for the Antarctic continent is presented for 1958–2022 (65 years) as monthly anomalies relative to 1981–2010 (RECON; Bromwich and Wang, 2024, https://doi.org/10.48567/efwt-jw56). It is based on monthly mean 2 m temperatures at 15 fixed stations that are spatially extrapolated to the entire continent using weights derived from the European Centre for Medium-Range Weather Forecasts Reanalysis v5 (ERA5) and has a grid spacing of 60 km. Infilling of the fixed station records is performed where necessary to yield complete time series for 1958–2022. Variability and trends are tested at independent stations that have much shorter periods of record. RECON is designed for Antarctic climate variability and change applications for large spatial scales and extended timescales.
- Article
(2594 KB) - Full-text XML
- BibTeX
- EndNote


Near-surface air temperature is a fundamental variable for describing and understanding the climate. For those regions of Earth that are remote and sparsely populated, establishing their temperature history from direct observations can be a major challenge. For Antarctica, a substantial network of permanent research stations was established in conjunction with the International Geophysical Year (IGY) of 1957–1958 (e.g., Jones et al., 2019), although there are isolated sites in the Antarctic Peninsula region that predate the IGY. One of these is Orcadas Base, which has the longest continuous temperature record south of 60° S and which was founded in 1903. As a result, derivation of the continental temperature regime from meteorological observations should start from the IGY. One complication is that the temperature records were collected for a variety of applications, most often for weather forecasting purposes, and the quality is not always suitable for detecting small climate changes. So, care is needed when applying these data to derive Antarctica's air temperature history (e.g., Lazzara et al., 2012).
Previous reconstructions of Antarctic temperatures were performed in the context of coarse-resolution global analyses such as GIS-Temp (Lenssen et al., 2024), HadCRUT5 (Morice et al., 2021), NOAA GlobalTemp (Yin et al., 2024), and Berkeley Earth (Rohde and Hausfather, 2020). All available observations were utilized, and results were extrapolated to data-sparse regions, typically using kriging-type analysis. Error estimates were provided. In contrast, this Antarctica-focused temperature reconstruction employs vetted observations from 15 fixed stations along with a kriging extrapolation to fill data-void regions. Independent observations are used to establish the reliability of this (much) higher-resolution reconstruction.
The paper is organized as follows: Sect. 2 summarizes the temperature observations applied and the spatial extrapolation approach. This is followed by performance testing of the resulting temperature reconstruction against independent observations that extend for at least 10 years and that are selected to sample the range of Antarctic environments. Section 4 presents an example application of the reconstruction. Sections 5 and 6, respectively, present the data availability and a discussion.
One key consideration for reconstructing the continental temperature from station observations is the spatial extrapolation from these point observations to the entire continent. For this task, we depend on global reanalyses that reconstruct the weather and climate across all of Earth from a wide variety of meteorologically related observations. For Antarctica and the Southern Ocean, such reanalyses have much lower quality prior to 1979, when there was very limited satellite coverage over the data-sparse Southern Ocean (e.g., Bromwich et al., 2024). So, our use of global reanalyses for spatial temperature extrapolation is restricted to after 1979, and even then spurious features such as artificial trends can be present. We employ temperature anomalies that the reanalyses tend to capture skillfully and that typically have a large spatial footprint, especially for the interior of Antarctica (e.g., Zhu et al., 2021, Fig. 3; King et al., 2003). It is assumed that the spatial relationships for the temperature anomalies established by the European Centre for Medium-Range Weather Forecasts Reanalysis v5 (ERA5) apply to the entire observational record.
Nicolas and Bromwich (2014) reconstructed the air temperature over Antarctica from monthly temperature observations at 15 fixed stations across Antarctica on a 60 km polar stereographic projection. These data were spatially extrapolated to the entire continent based on the statistical linkages between the stations and all grid points covering Antarctica from the Climate Forecast System Reanalysis (CFSR) for the 31-year period 1979–2009. The reconstruction closely matched the station observations, was not impacted by anomalous temperature trends in the reanalysis, and was verified against independent temperature observations. It spanned 1958–2012 at monthly intervals. We present a new version of this dataset in this paper.
To revise and update the Nicolas and Bromwich (2014) analysis, Belgrano Station is employed instead of Halley Station. This is done because the frequent relocation of the Halley observation site on the floating Brunt Ice Shelf led to artifacts in the temperature time series, resulting in weak cooling for 1957–2019, whereas weak warming likely occurred (King et al., 2021). The other 14 stations used by Nicolas and Bromwich (2014) are applied here. Figure 1 shows these sites, along with Halley, which is replaced by Belgrano. ERA5 (Hersbach et al., 2020) is employed to provide the spatial weights that extrapolate the station observations. ERA5 is a more modern and higher-resolution global reanalysis than CFSR and has fewer issues with anomalous temperature trends (Gossart et al., 2019), although it has a warm bias of several degrees during winter in the Antarctic interior. Testing for the 1958–2012 period using the 15 stations employed by Nicolas and Bromwich (2014) demonstrated that CFSR- and ERA5-based spatial extrapolation produced very similar results (not shown). Further, Nicolas and Bromwich (2014) and Screen and Simmonds (2012) found that spatial extrapolation to the entire continent from long-term station observations was relatively insensitive to the reanalysis used for near-surface air temperatures and free-atmosphere temperatures, respectively.
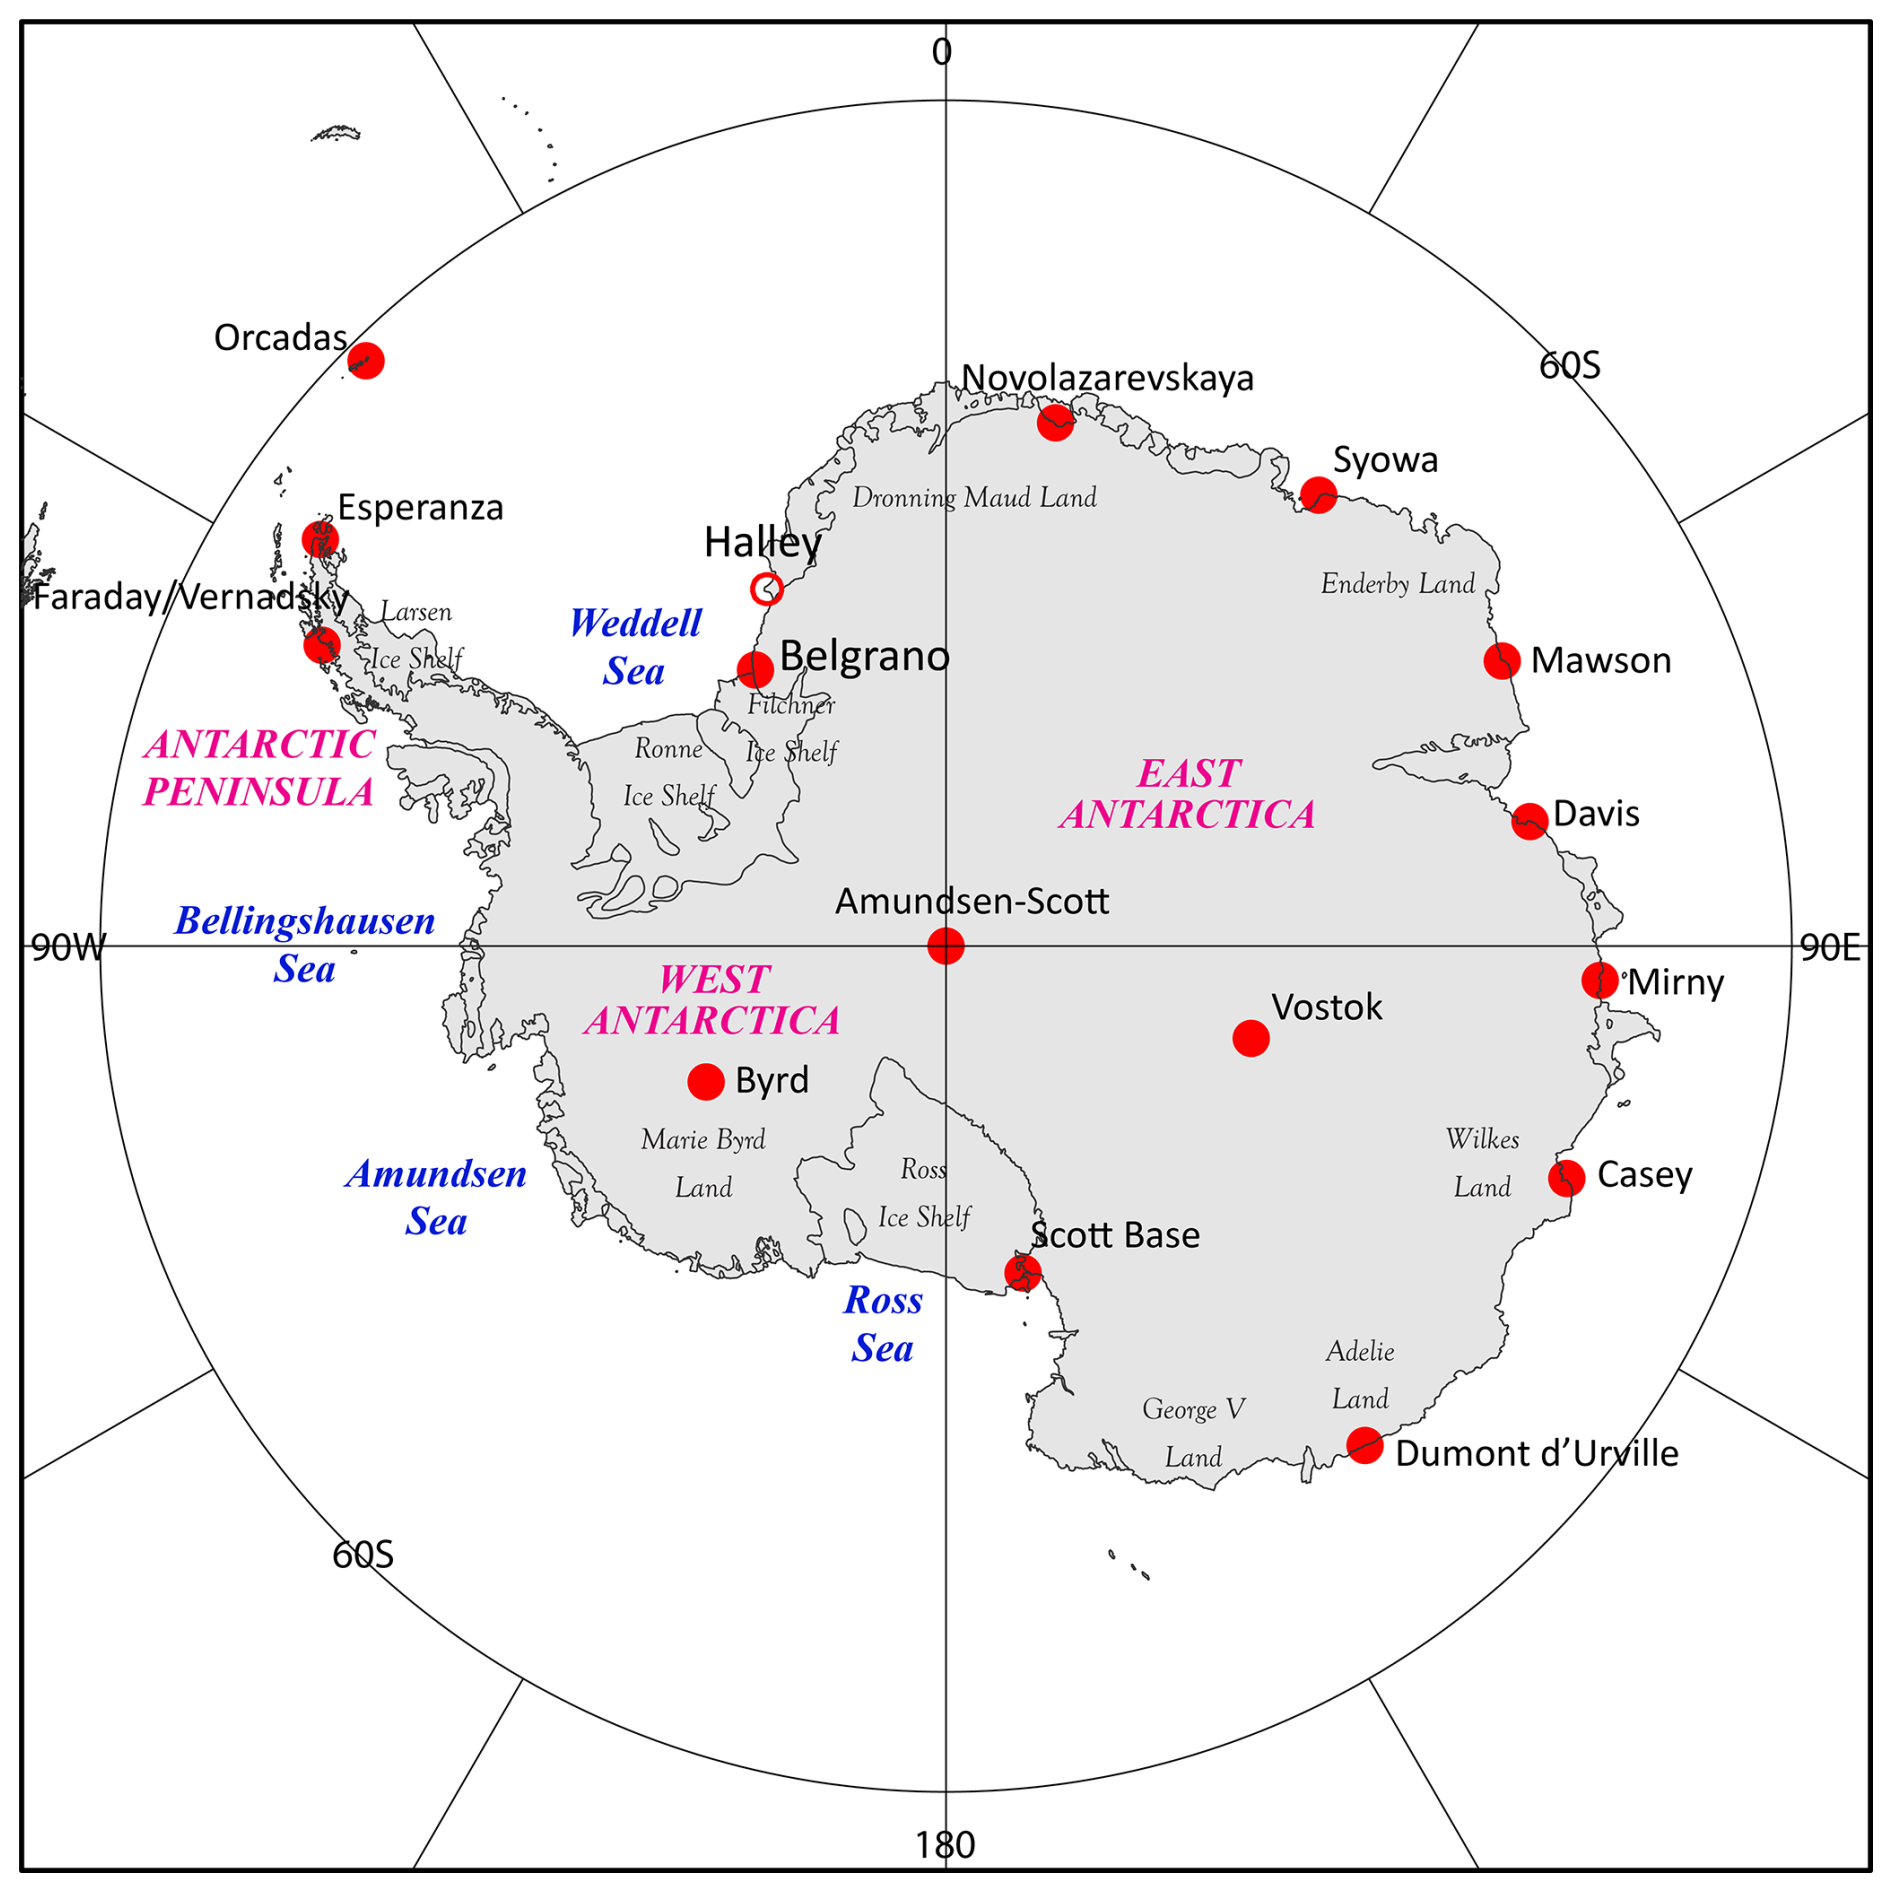
Figure 1Antarctic stations (red filled dots) used to reconstruct the near-surface air temperature over Antarctica at monthly intervals from 1958 to 2022. Halley Station (red circle), which is replaced by Belgrano, is also shown.
Monthly average 2 m temperatures from the 14 stations employed by Nicolas and Bromwich (2014) as well as Belgrano (Fig. 1) were updated through 2022. Table 1 gives the sources used for the updates (primarily the READER site as in Turner et al., 2004, but supplemented by several more reliable records), and the steps employed to fill the gaps that were present in the data from READER. The reconstructed Byrd Station record is based on Bromwich et al. (2013, 2014). The Belgrano Station record is another reconstruction that requires detailed discussion. The 1958–1960 values at Belgrano II (actual observations from 1980 to the present) were based on Belgrano I 1958–1960 READER observations estimated for the Belgrano II location by employing Halley Station monthly temperature observations that were available for 1958–1960 as well as when Belgrano II was in operation. For 1961–1979 at Belgrano II, we used estimates produced by the Global Historical Climatology Network – Monthly Mean Temperature Version 4 (Menne et al., 2018), denoted as GHCNm version-4 QFE. Menne et al. (2018, p. 9847) outlined how the estimation procedure “iterates to find a set of neighboring correlated series for each station series requiring estimates (the target) that minimizes the confidence limits for the difference between the target values and estimates of these values derived using neighboring values. The difference between the target and neighbor average is used as an offset in the interpolation to account for climatological differences between the target and neighbors”. For 1980 and later, the Belgrano II record provided by READER has 75 % or more of the 6-hourly observations for each month that we adopt as a sound basis for computing reliable monthly mean temperatures. GHCNm version-4 QFE values are used for four missing data periods in 1980, 1981, 2002, and 2003 at Belgrano II. Other notable aspects from Table 1 are that GCHNm quality-controlled and adjusted values (GHCNm version-4 QCF) are employed to fill short gaps in nine station records from READER. The more uncertain GHCNm QFE (pairwise homogeneity estimations using adjusted quality-controlled adjacent stations) values are used to fill extended periods with no observations for Davis, Syowa, and Vostok stations based on adjacent station observations. All resulting station temperature records were examined for discontinuities, but none were found.
Table 1Data sources employed to fill gaps in the READER datasets to produce RECON. The filled months are indicated by the YYYY(MM) or YYYY(MM–MM) formats.
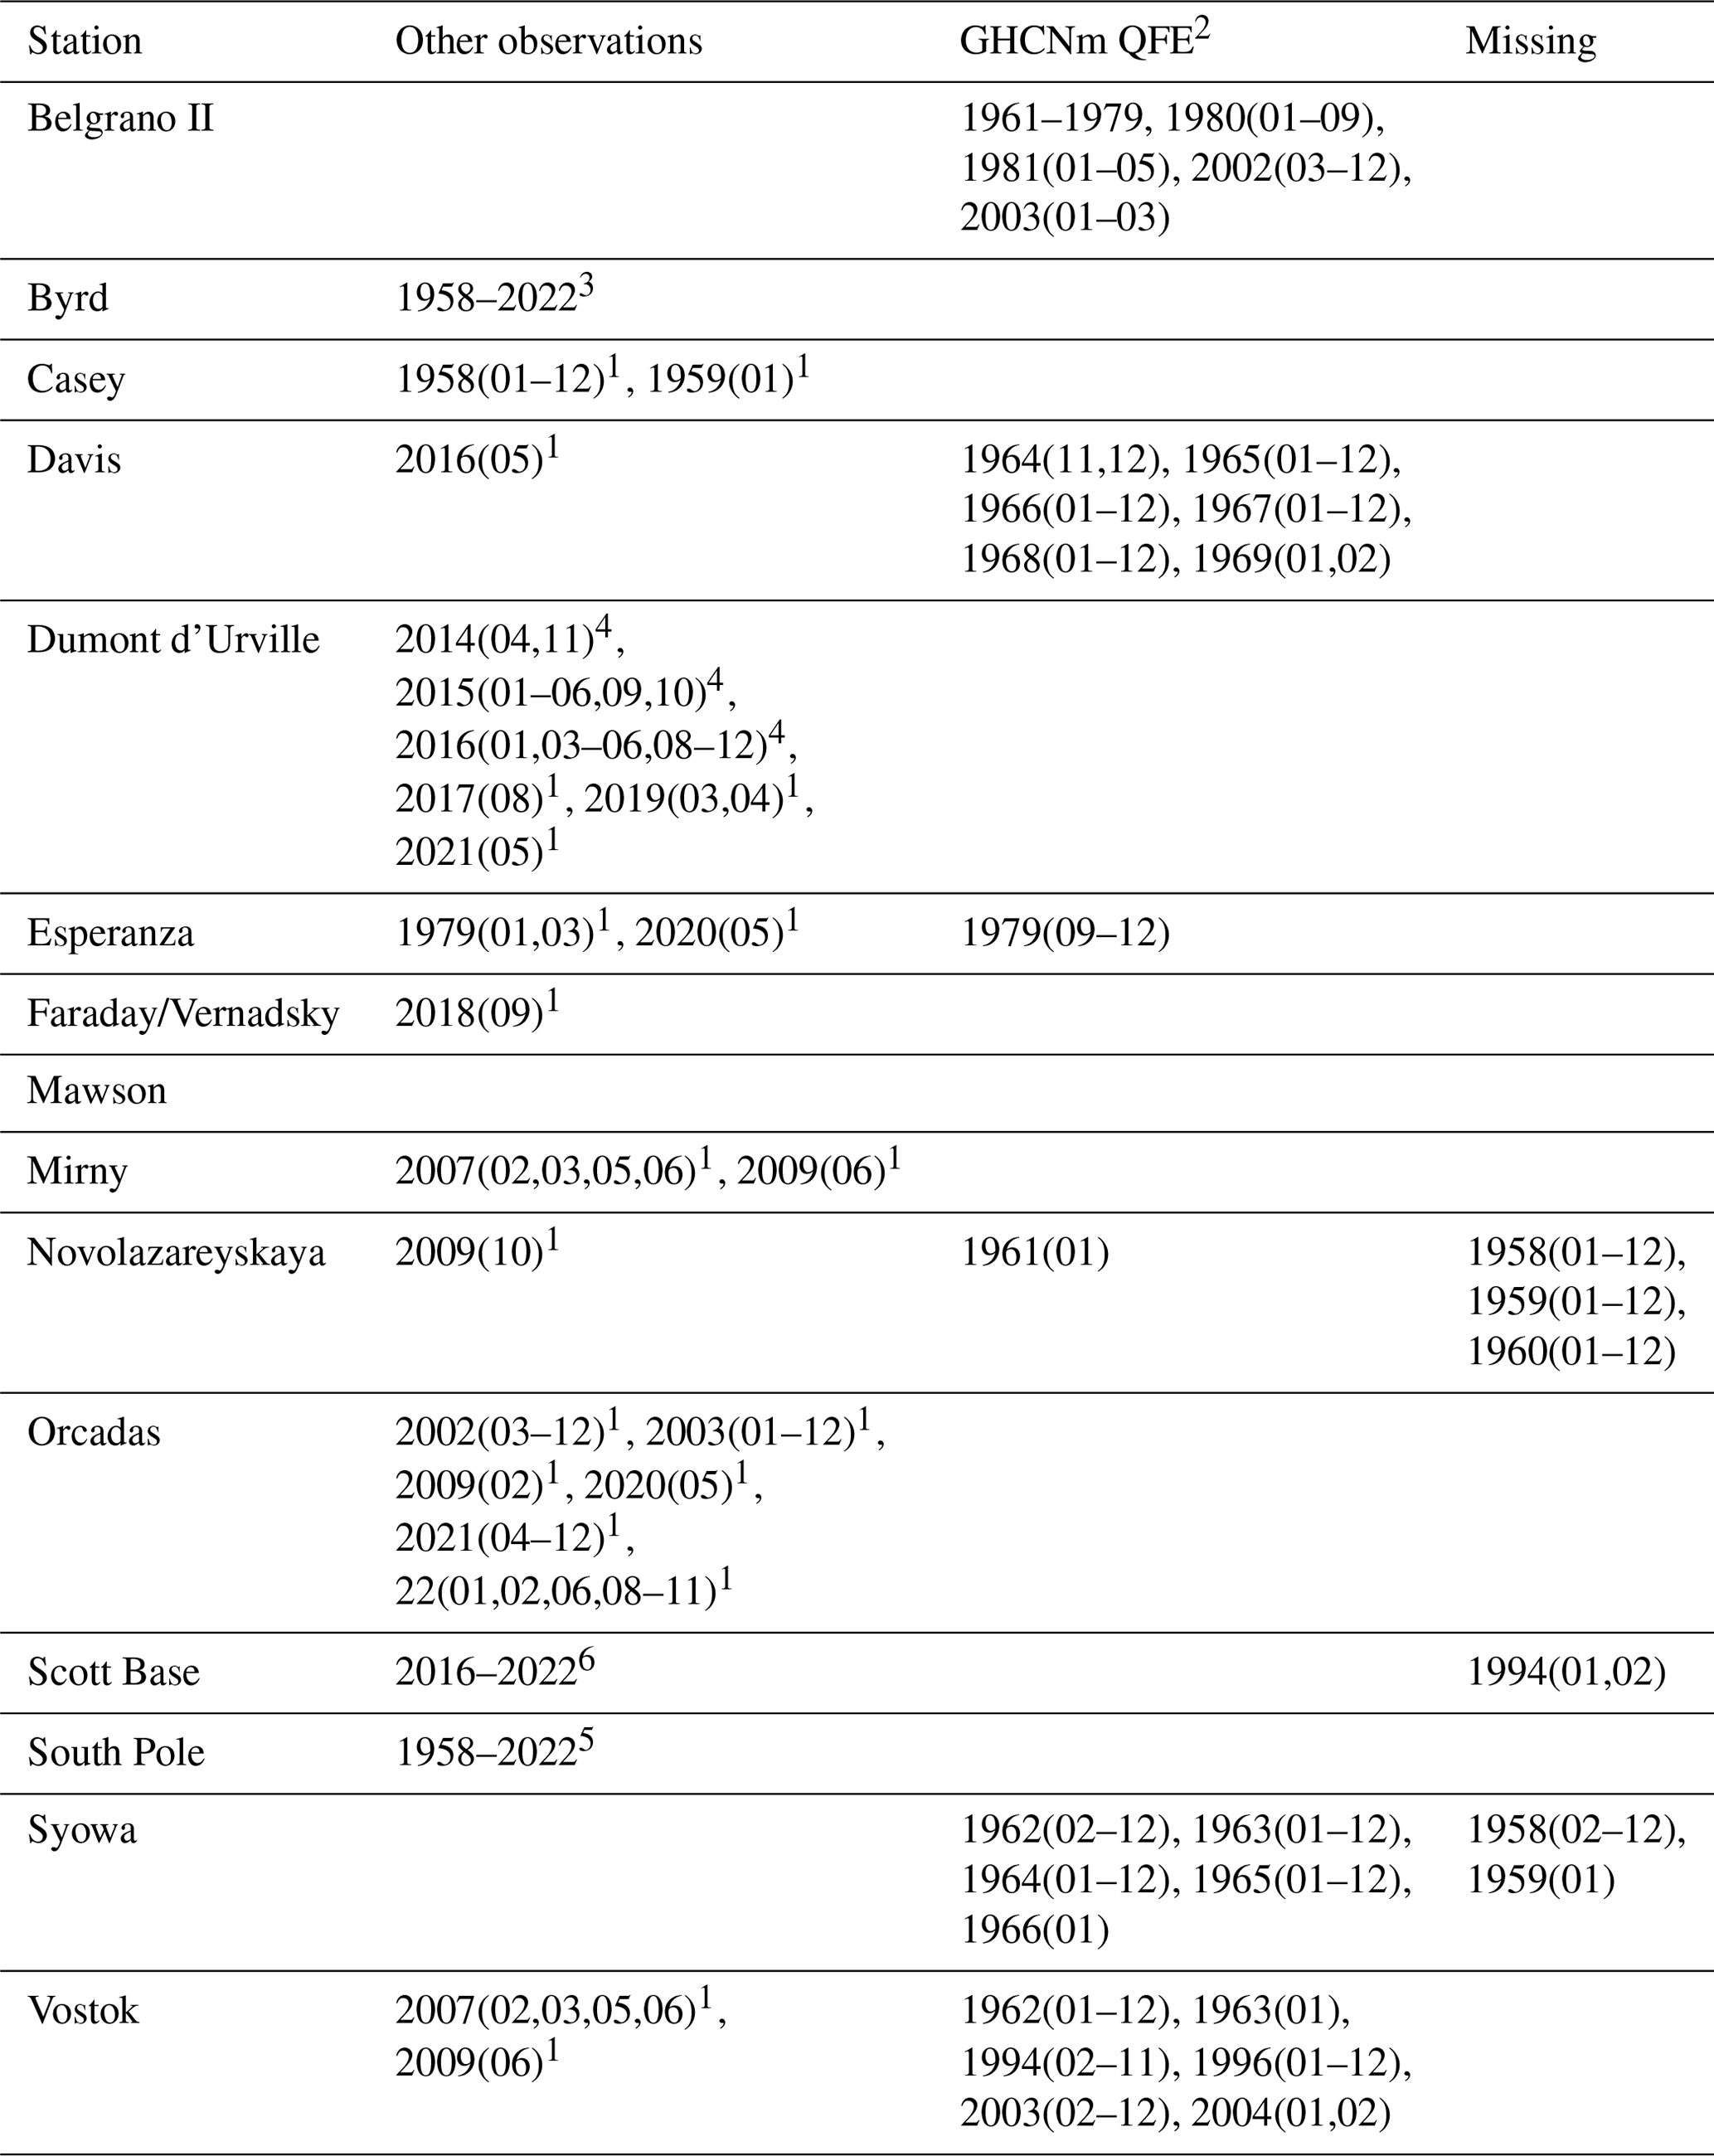
Primary sources: UK BAS and Met READER. Other data sources: 1 GHCNm v4 QCF. 2 GHCNm v4 QFE. 3 OSU Polar Meteorology Group. 4 Meteo France. 5 University of Wisconsin-Madison. 6 National Institute of Water and Atmospheric Research Ltd (NIWA), New Zealand.
The details of the spatial extrapolation method using ordinary kriging are paraphrased from Nicolas and Bromwich (2014). For each month (t), the temperature anomaly estimated at each point of the grid (x) covering continental Antarctica is derived from a linear weighted combination of the anomalies A(i,t) observed at each of the 15 stations (denoted by i), according to the following Eq. (1):
Wi(x) is the weight at point x of the temperature anomaly observed at station i relative to the 1981–2010 mean and is equal to the square of the Pearson correlation coefficient between the ERA5 2 m air temperature anomaly at the station and that at grid point x with respect to the 1981–2010 mean after linearly detrending ERA5. The weights are optimized to minimize the estimation error by accounting for the covariances between the i station records. The station anomalies A(i,t) are divided by their standard deviation (1981–2010) for normalization and to account for the spatial differences in variance. ηi accounts for the positive (+1) or negative (−1) sign of the temperature correlation between the normalized station anomaly A(i,t) and that at location x. The equation yields an estimated normalized temperature anomaly at each grid point (x) that is then multiplied by the ERA5 temperature standard deviation (1981–2010) at that point to yield the estimated temperature anomaly.
ERA5 weights and the updated station records were employed to produce the updated Nicolas and Bromwich (2014) dataset that now spans the 66 years from 1958 to 2022 at monthly intervals: it is called RECON (Bromwich and Wang, 2024) for the remainder of this paper. ERA5 weights were calculated for the 13 available stations in 1958 (Syowa and Novolazarevskaya observations missing), 14 stations for 1959–1960 (Novolazarevskaya observations missing), and all 15 stations for 1961–2022 (see Table 1).
To validate RECON for Antarctica, we first confirm that it fits closely with the observed monthly temperatures at the stations used in the reconstruction, also termed the “anchor stations”. Table 2 demonstrates for these 15 locations (boldfaced font) that the correlation is close to 1 at all of the sites, the bias is minimal, and the root mean square error (RMSE) is small. Thus, RECON reproduces the observations at the anchor sites with high skill.
Table 2Bias, root mean square error (RMSE), Pearson correlation coefficient (r), and fractional observational variance explained by the reconstruction (R2) between the temperature reconstruction dataset and station observations with longer-term records, including 34 independent stations. Monthly anomalies are employed. Boldface indicates stations that are used to develop the temperature reconstruction RECON. Several independent stations have missing data that are longer than 12 months.
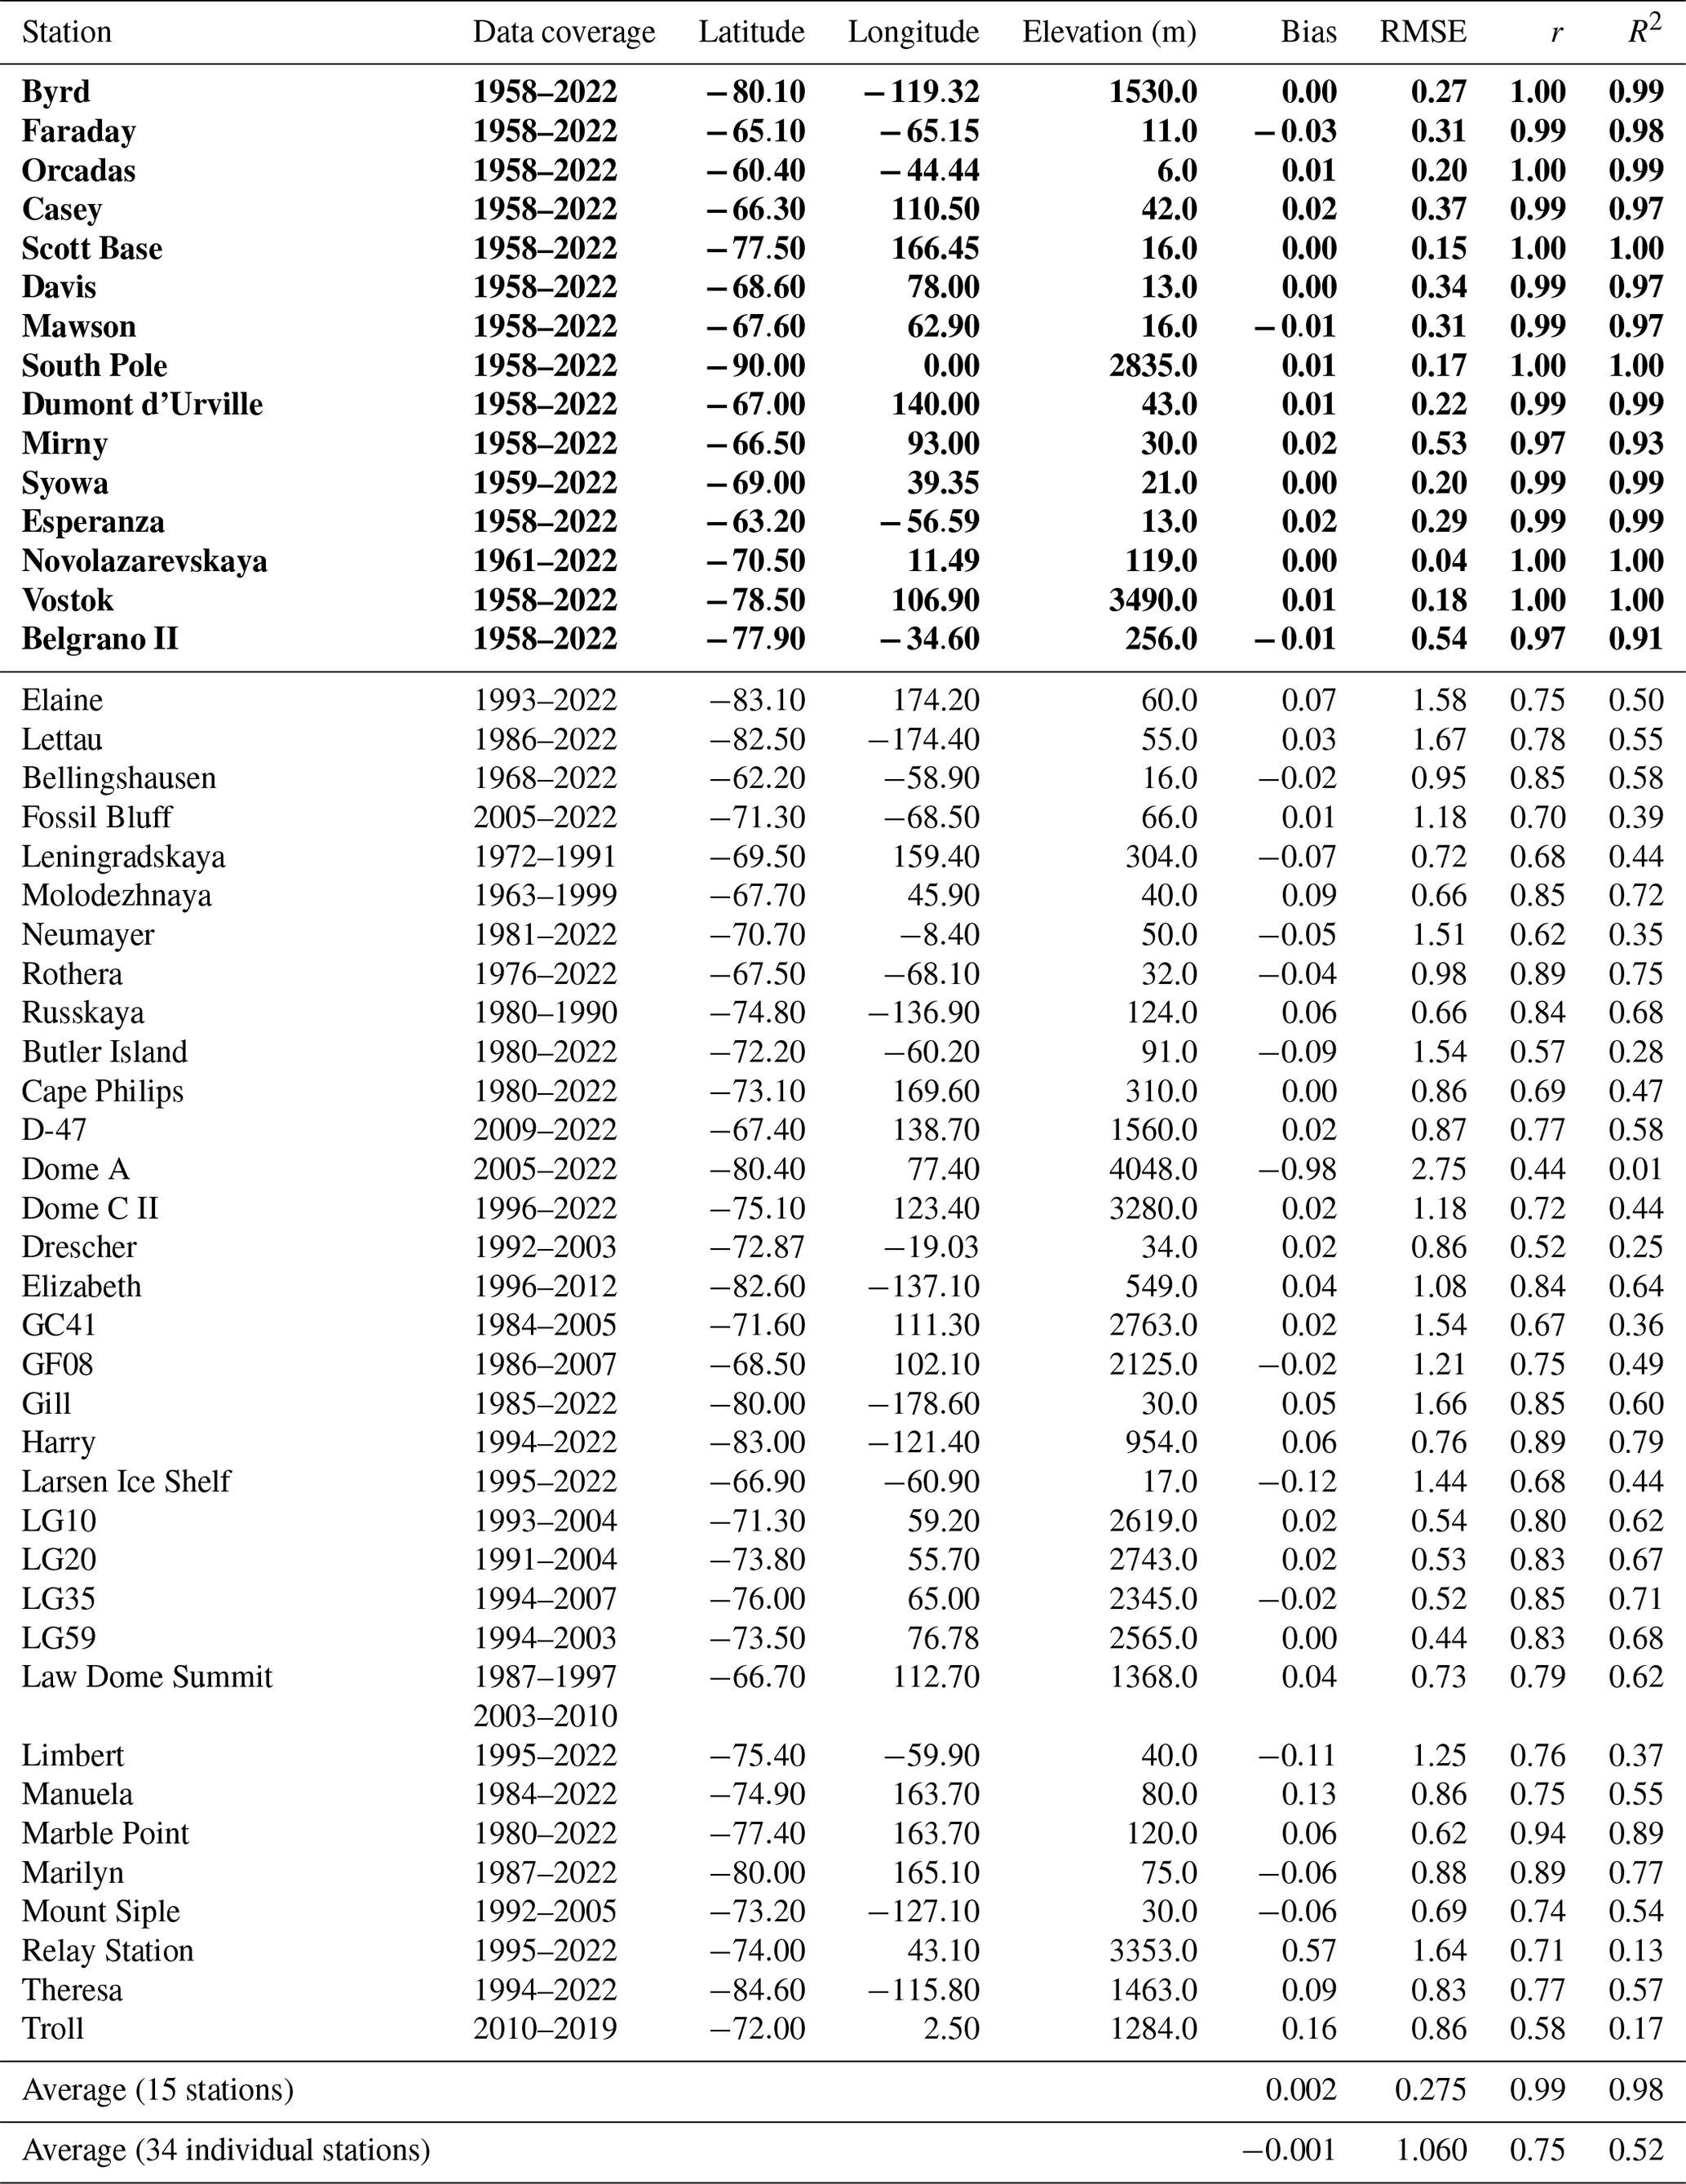
Table 3The 2 m air temperature trend comparison (°C per decade) between the observations, RECON, and ERA5 at stations with records mostly exceeding 35 years. The number of years are in parentheses next to the record duration. The asterisk values are 95 % confidence intervals (CIs) for the average trends. The locations are listed in Table 2.
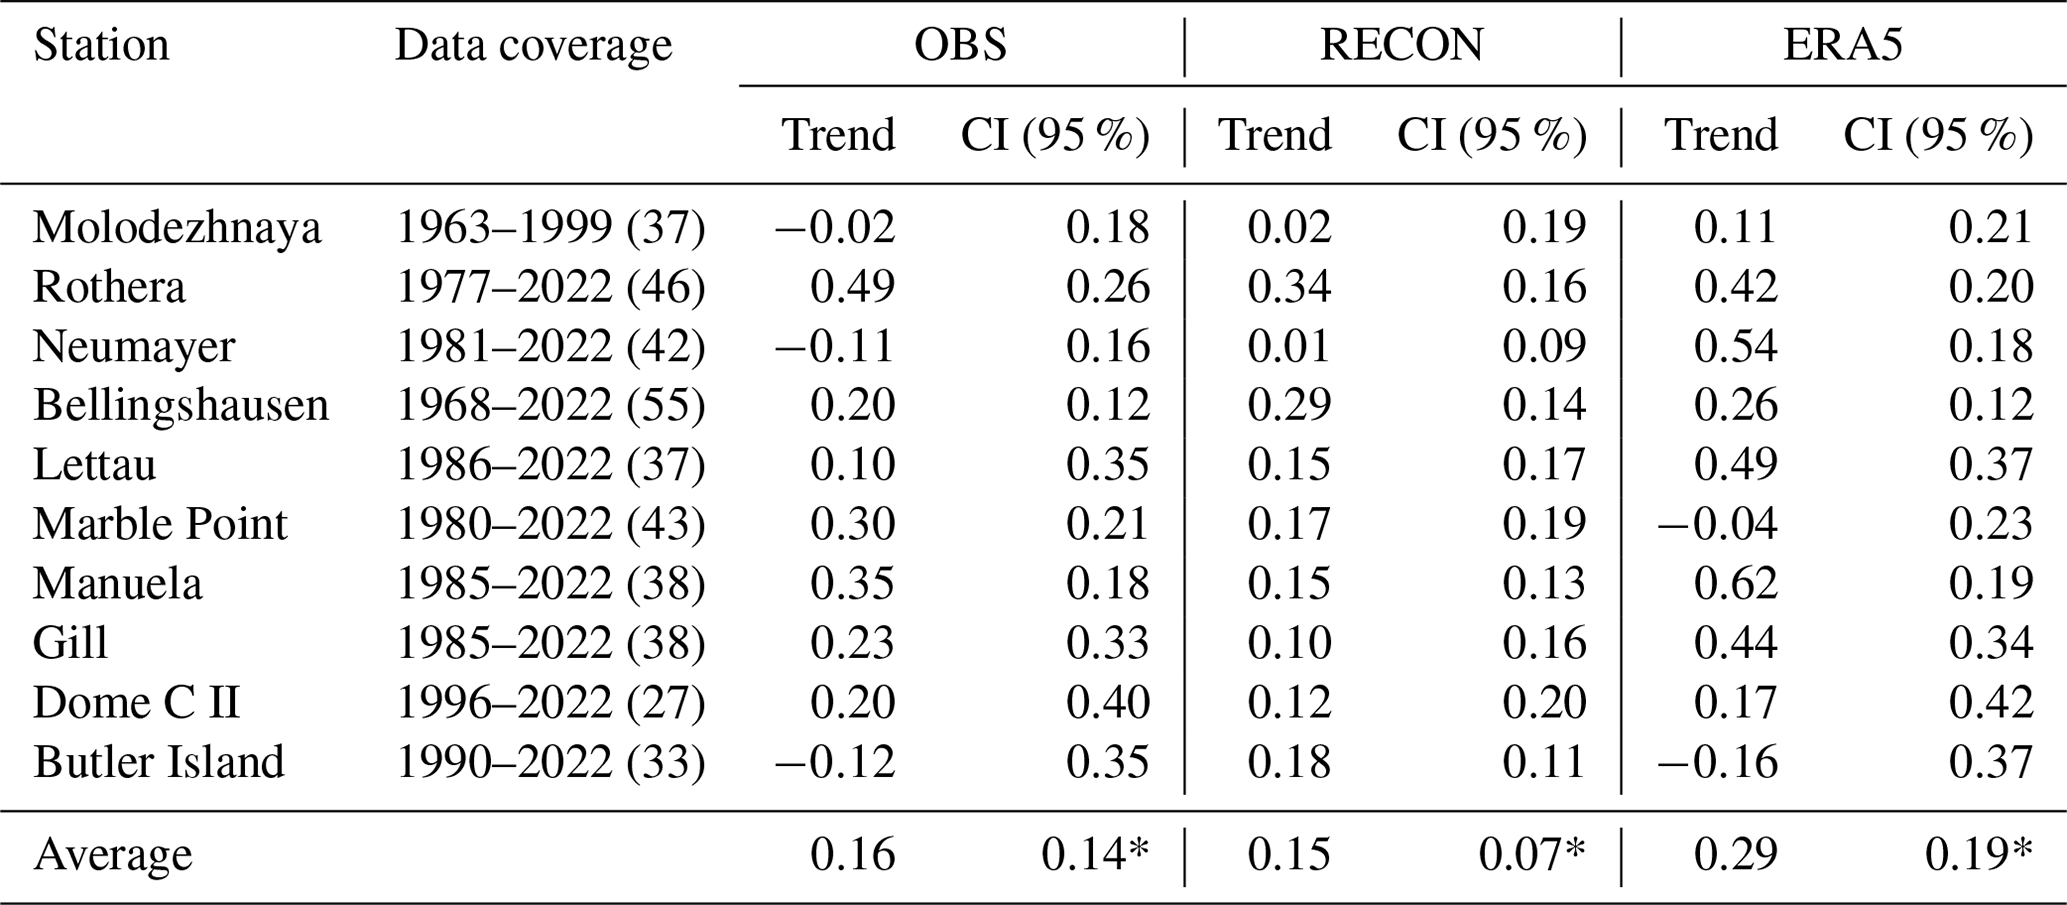
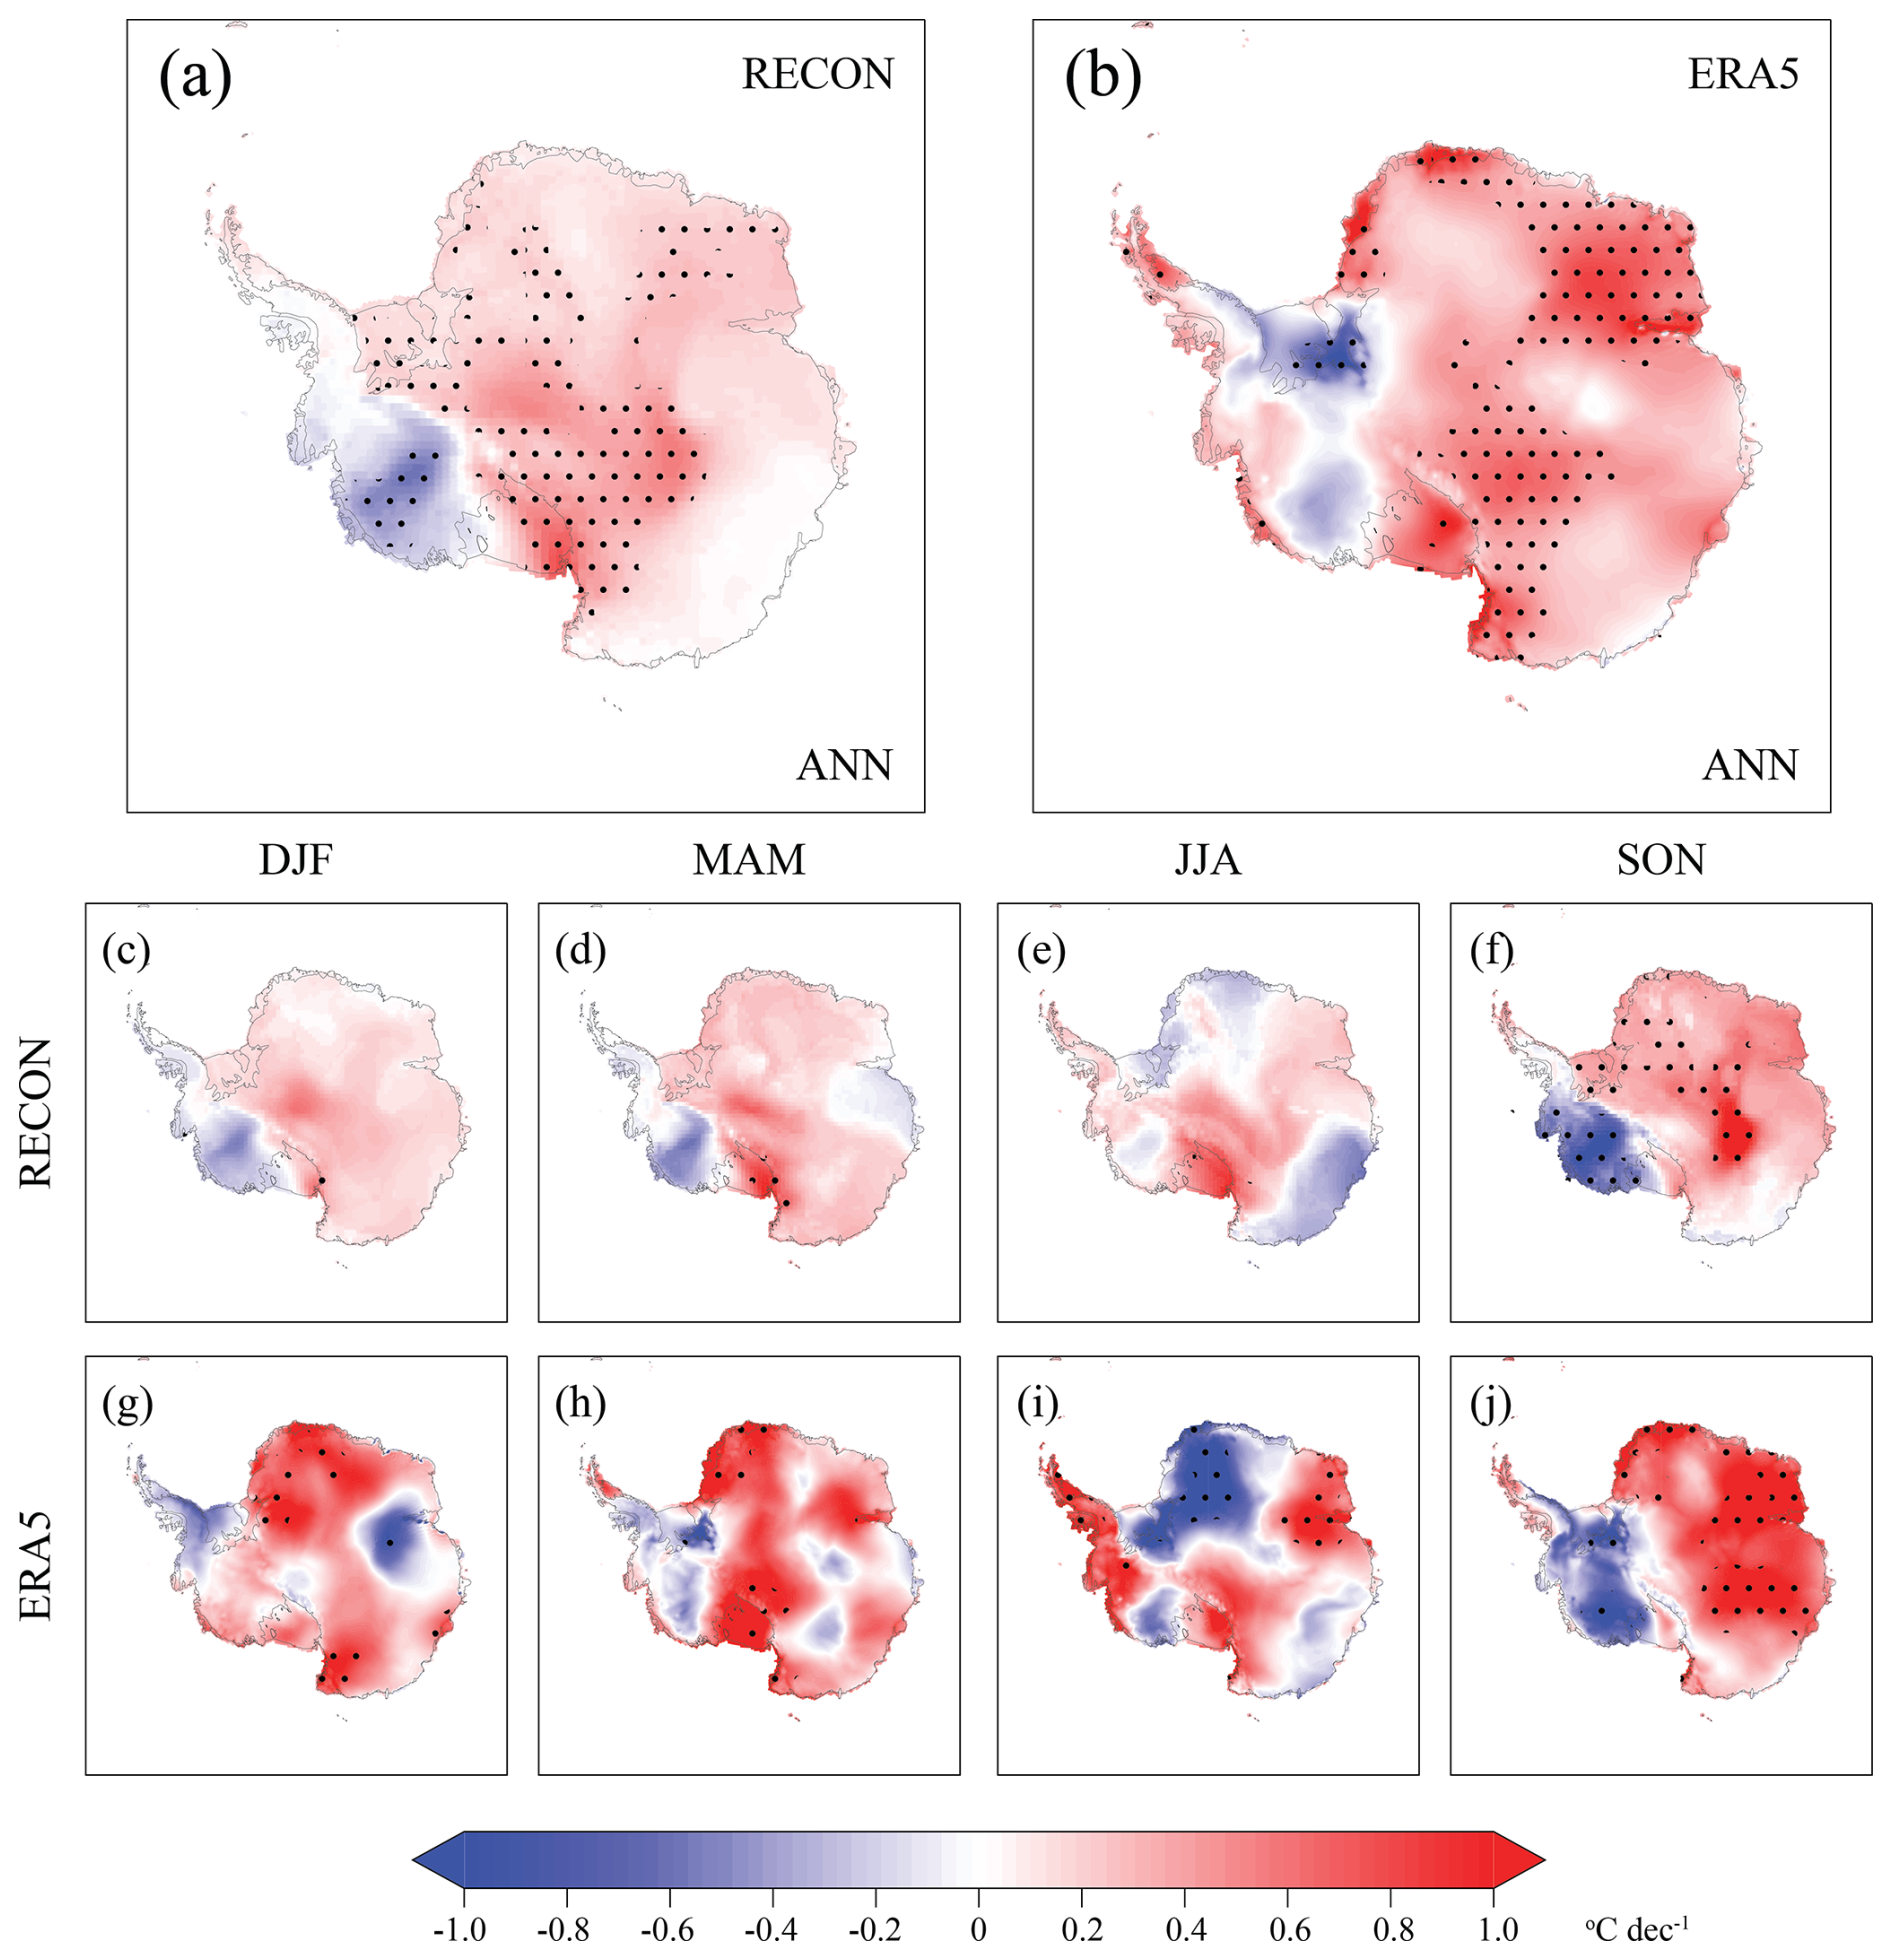
Figure 2Annual linear temperature trends from RECON (a) and ERA5 (b) for 1998–2022. Seasonal results for RECON (c–f) and ERA5 (g–i) are presented below these. The dots indicate the statistical significance of the linear trends at the 0.01 level after considering the lag-1 autocorrelation, following Santer et al. (2000).
Next we compare RECON's monthly values with observed monthly temperatures from the READER site not used in the reconstruction (Table 2, regular font). Almost all of these are from the period after 1979 and are selected so that 10 or more years of continuous observations are available. Stations immediately adjacent to the anchor sites have been excluded, and regions with numerous sites, like Terra Nova Bay, are represented by one site. Spatial coverage of Antarctica was also a consideration: 28 of the 57 stations used by Nicolas and Bromwich (2014) were examined, along with the addition of 6 new stations. Of the 34 independent stations employed here, only 6 are staffed, with the rest being automatic weather stations (AWS). On average, the bias is tiny and the correlation between RECON and the observations is 0.75. Looking at the individual stations, the correlation is 0.7 or larger at 25 of the 34 independent stations, and the absolute bias is much smaller than 1 °C at 32 of the 34 stations. Dome A, the highest point on the East Antarctic Ice Sheet, is a particularly challenging location, where surface winds are controlled by the synoptic-scale circulation and record low air temperatures can occur in winter (Scambos et al., 2018). Overall, the skill statistics for the current reconstruction using independent observations primarily for 1979–2022 are comparable to those given by Nicolas and Bromwich (2014) for their 54 stations for 1979–2012, with a much smaller RMSE but a smaller correlation coefficient.
An additional test of RECON skill at the observation sites is shown in Table 2 by the R2 metric employed by Nicolas and Bromwich (2014) and as defined in their Appendix. This quantity measures the fraction of observational variance explained by RECON, and the entire reconstruction period is considered. Table 2 shows that R2 averages 0.98 for the anchor sites and 0.52 for the independent sites. That is, RECON explains on average 52 % of the observational anomaly variance at the independent sites. Individual problematic sites where R2 is low are Dome A especially, Relay Station, and Troll. The average R2 for independent stations obtained here for 1979–2022 is significantly smaller than that given by Nicolas and Bromwich (2014, Table 3) for 1979–2012, which is perhaps a consequence of the large recent atmospheric variability (e.g., Siegert et al., 2023).
To confirm that RECON reproduces the observed long-term 2 m air temperature trends at independent stations that are not used to generate them, a selection of 10 sites with records mostly exceeding 35 years has been made (Table 3). All are coastal or near-sea-level locations, apart from the interior Dome C II record that spans 27 years. All but three of the locations were founded after 1979. Modest infilling of the AWS monthly data has been done to produce complete time series. The four staffed stations at the top of the table have nearly complete records. Extended periods of comparison are used so that any trends are less likely to be totally swamped by the variability. Table 3 presents the annual temperature trends at the selected stations as well as those from RECON and ERA5. ERA5 is included because it is used next in an example application. It can be seen that RECON captures the trends at all of the selected sites reasonably and on average does better than ERA5, although variability challenges all of the these comparisons. The comparison for Neumayer confirms the erroneous ERA5 warming in that region (Bromwich et al., 2024). We therefore conclude that RECON on average captures long-term temperature trends across Antarctica, implying that RECON is appropriate for large-scale analyses. The large spacing between the anchor stations also indicates that localized features would not be resolved. The spatial averaging of RECON is also consistent with the decreased temporal variability, which leads to an improved focus on temporal trends.
Turner et al. (2016) reported that the Antarctic Peninsula region started to cool in 1998, especially during the austral summer after decades of warming. Tropically forced decadal variability was inferred to be the cause. The warming apparently resumed in the late 2010s (Carrasco et al., 2021). Similarly, the long-term warming over West Antarctica (Bromwich et al., 2013, 2014) was interrupted around the same time (Zhang et al., 2023). Xin et al. (2023) extracted the primary modes of Antarctic temperature change from six reanalyses and 26 observations and noted a marked change in the temperature regime that took place around 2000. Figure 2 presents the annual and seasonal continental temperature trends for 1998–2022 according to RECON and ERA5. The annual depictions are broadly similar, with some notable differences. The northern Antarctic Peninsula is strongly warming in ERA5, while RECON has trends near 0. ERA5 has marked cooling over the Filchner-Ronne Ice Shelf, while RECON finds modest warming, both of which are statistically significant in some regions. As a result of Byrd Station observations and less RECON variability, the annual cooling over West Antarctica is much more marked (and statistically significant) in RECON than in ERA5. ERA5's annual warming in Enderby Land is double that of RECON's, with both being statistically significant. The seasonal trends have a similar pattern, but the ERA5 amplitudes are much larger. To ensure the reliability of these results, seasonal and annual trends at the 15 anchor stations were computed for ERA5, RECON, and the observations (not shown). In general, RECON trends were much closer to the observational ones than those of ERA5, and ERA5 often had significantly larger trends. In addition, ERA5 contains three warming hotspots that continue to 2022 and that are artifacts (Bromwich et al., 2024). The results from Table 3 and the findings outlined in this paragraph indicate that the real world more closely follows the RECON depiction than that provided by ERA5.
The above results indicate that a comprehensive comparison between RECON and ERA5 Antarctic temperature trends is needed. In addition, contrasting RECON trends with those from the global reconstructions by GIS-TEMP, HadCRUT5, NOAA GlobalTemp, and Berkeley Earth would reveal the strengths and weaknesses of each reconstruction. As far as possible, the causes of the differences found by these comparisons should be identified.
The monthly station datasets used in this study are available at the following addresses:
-
UK Met READER data: https://doi.org/10.5285/569d53fb-9b90-47a6-b3ca-26306e696706 (Colwell, 2013) and https://legacy.bas.ac.uk/met/READER/ (last access: 20 June 2025).
-
GHCNm data: https://www.ncei.noaa.gov/data/global-historical-climatology-network-monthly/v4/temperature/ (Menne et al., 2018).
-
Byrd Station: https://polarmet.osu.edu/datasets/Byrd_recon/ (Bromwich et al., 2025)
-
Dumont d'Urville station: The Météo-France data for Dumont d’Urville, data are available on request at https://meteofrance.com/ (last access: 20 June 2025).
-
South Pole station: https://doi.org/10.48567/szgp-6h49 (South Pole Meteorology Office, 2025).
-
Scott Base station: https://cliflo.niwa.co.nz (NIWA, 2025).
The RECON data described in this paper can be accessed:
-
RECON data: https://doi.org/10.48567/efwt-jw56 (Bromwich and Wang, 2024)
Code and software are available:
-
Programs used to create RECON data: https://doi.org/10.5281/zenodo.15707591 (Bromwich and Wang, 2025).
-
Figures were created using the NCAR command language (NCL, 2019) software, https://doi.org/10.5065/D6WD3XH5.
A reconstruction of Antarctic near-surface air temperatures at monthly intervals for 1958–2022 is presented (Bromwich and Wang, 2024). It is an update of an earlier dataset produced by Nicolas and Bromwich (2014) and shows skill in reproducing temperature trends at independent stations. The reconstruction is intended for Antarctic temperature trend analysis of large spaces and long timescales and will be compared with other depictions of the trends in future work. Alternative approaches like statistical downscaling will be needed to produce Antarctic temperature trends from RECON for regions of complex terrain.
Some desirable improvements can be identified. The southeastern Weddell Sea needs a more robust record than that presented here for Belgrano II, which has significant infilling. Perhaps the best solution is to homogenize the presently inhomogeneous Halley temperature record. As shown by King et al. (2021), this will require removal of the impact of the spatial temperature gradients on the Brunt Ice Shelf from the Halley temperature records of various station locations and will take significant effort to achieve. Xin et al. (2023) concluded that summer warming over the interior of Antarctica may be related to radiative effects of stratospheric ozone and thus may be a special environment. Also, Xie et al. (2023) found from ERA5 for 1958–2020 that Antarctic surface warming amplifies with elevation. This result is uncertain because of major artifacts in ERA5, especially prior to 1979 (Bromwich et al., 2024). These two findings suggest that further testing of the RECON trends is desirable for those parts of the East Antarctic Plateau that are far from the South Pole and Vostok stations in order to see whether the issues at Dome A and to a lesser extent Relay Station (Table 2) are localized.
DB designed the project, wrote the manuscript, and oversaw the analysis. SHW produced the RECON data and performed the analysis with important contributions from XZ and AE.
The contact author has declared that none of the authors has any competing interests.
Publisher's note: Copernicus Publications remains neutral with regard to jurisdictional claims made in the text, published maps, institutional affiliations, or any other geographical representation in this paper. While Copernicus Publications makes every effort to include appropriate place names, the final responsibility lies with the authors.
This research has been supported by the National Science Foundation Directorate for Geosciences (grant nos. 2205398, 2229392, and 2331992).
This paper was edited by Marc Daniel Mallet and reviewed by two anonymous referees.
Bromwich, D. H. and Wang, S.-H.: Reconstruction of Antarctic Near-Surface Air Temperatures at Monthly Intervals Since 1958, AMRDC Data Repository [data set], https://doi.org/10.48567/efwt-jw56, 2024.
Bromwich, D. and Wang, S.-H.: Reconstruction of Antarctic Near-Surface Air Temperatures NCL programs, Zenodo [code], https://doi.org/10.5281/zenodo.15707591, 2025.
Bromwich, D. H., Nicolas, J. P., Monaghan, A. J., Lazzara, M. A., Keller, L. M., Weidner, G. A., and Wilson, A. B.: Central West Antarctica among the most rapidly warming regions on Earth, Nat. Geosci., 6, 139–145, https://doi.org/10.1038/ngeo1671, 2013.
Bromwich, D. H., Nicolas, J. P. Monaghan, A. J., Lazzara, M. A., Keller, L. M., Weidner, G. A., and Wilson, A. B.: Corrigendum: Central West Antarctica among the most rapidly warming regions on Earth, Nat. Geosci., 7, 76, https://doi.org/10.1038/ngeo2016, 2014.
Bromwich, D. H., Ensign, A., Wang, S.-H., and Zou, X.: Major artifacts in ERA5 temperature trends over Antarctica prior to and during the modern satellite era, Geophys. Res. Lett., 51, e2024GL111907, https://doi.org/10.1029/2024GL111907, 2024.
Bromwich, D., Wang, S.-H., and Nicolas, J. P.: Reconstructed Byrd temperature record (1957–2022), Polar Meteorology Group [data set], https://polarmet.osu.edu/datasets/Byrd_recon/, last access 20 June 2025.
Carrasco, J. F., Bozkurt, D., and Codero, R. R.: A review of the observed air temperature in the Antarctic Peninsula. Did the warming trend come back after the early 21st hiatus?, Polar Sci., 28, 100653, https://doi.org/10.1016/j.polar.2021.100653, 2021.
Colwell, S.: Surface meteorology at British Antarctic Survey Stations, 1947–2013 (Version “1.0”), Polar Data Centre; British Antarctic Survey, Natural Environment Research Council [data set], https://doi.org/10.5285/569d53fb-9b90-47a6-b3ca-26306e696706, 2013.
Gossart, A., Helsen, S., Lenaerts, J. T. M., Vanden Broucke, S., van Lipzig, N. P. M., and Souverijns, N.: An evaluation of surface climatology in state-of-the-art reanalyses over the Antarctic Ice Sheet, J. Climate, 32, 6899–6915, https://doi.org/10.1175/JCLI-D-19-0030.1, 2019.
Hersbach, H., Bell, B., Berrisford, P., Hirahara, S., Horányi, A., Muñoz-Sabater, J., Nicolas, J., Peubey, C., Radu, R., Schepers, D., Simmons, A., Soci, C., Abdalla, S., Abellan, X., Balsamo, G., Bechtold, P., Biavati, G., Bidlot, J., Bonavita, M., De Chiara, G., Dahlgren, P., Dee, D., Diamantakis, M., Dragani, R., Flemming, J., Forbes, R., Fuentes, M., Geer, A., Haimberger, L., Healy, S., Hogan, R. J., Hólm, E., Janisková, M., Keeley, S., Laloyaux, P., Lopez, P., Lupu, C., Radnoti, G., de Rosnay, P., Rozum, I., Vamborg, F., Villaume, S., and Thépaut, J.-N.: The ERA5 global reanalysis, Q. J. Roy. Meteor. Soc., 146, 1999–2049, https://doi.org/10.1002/qj.3803, 2020.
Jones, M. E., Bromwich, D. H., Nicolas, J. P., Carrasco, J., Plavcová, E., Zou, X., and Wang, S.-H.: Sixty years of widespread warming in the southern mid- and high-latitudes (1957–2016), J. Climate, 32, 6875–6898, https://doi.org/10.1175/JCLI-D-18-0565.1, 2019.
King, J. C., van Lipzig, N. P. M., Connolley, W. M., and Comiso, J. C.: Are temperature variations at Antarctic ice core sites representative of broad-scale climate variations? Seventh Conference on Polar Meteorology and Oceanography and Joint Symposium on High-Latitude Climate Variations, American Meteorological Society, Boston, Massachusetts, https://ams.confex.com/ams/7POLAR/webprogram/Paper61095.html (last access: 23 June 2025), 2003.
King, J. C., Turner, J., Colwell, S., Lu, H., Orr, A., Phillips, T., Hosking, J. S., and Marshall, G. J.: Inhomogeneity of the surface air temperature record from Halley, Antarctica, J. Climate, 34, 4771–4783, https://doi.org/10.1175/JCLI-D-20-0748.1, 2021.
Lazzara, M. A., Keller, L. M., Markle, T., and Gallagher, J.: Fifty-year Amundsen-Scott South Pole station surface climatology, Atmos. Res., 118, 240–259, https://doi.org/10.1016/j.atmosres.2012.06.027, 2012.
Lenssen, N., Schmidt, G. A., Hendrickson, M., Jacobs, P., Menne, M., and Ruedy, R.: A GISTEMPv4 observational uncertainty ensemble, J. Geophys. Res.-Atmos., 129, e2023JD040179, https://doi.org/10.1029/2023JD040179, 2024.
Menne, M. J., Williams, C. N., Gleason, B. E., Rennie, J. J., and Lawrimore, J. H.: The Global Historical Climatology Network Monthly Temperature Dataset, Version 4, J. Climate, 31, 9835–9854, https://doi.org/10.1175/JCLI-D-18-0094.1, 2018 (data available at: https://www.ncei.noaa.gov/data/global-historical-climatology-network-monthly/v4/temperature/, last access: 20 June 2025).
Morice, C. P., Kennedy, J. J., Rayner, N. A., Winn, J. P., Hogan, E., Killick, R. E., Dunn, R. J. H., Osborn, T. J., Jones, P. D., and Simpson, I. R.: An updated assessment of near-surface temperature change from 1850: the HadCRUT5 data set. J. Geophys. Res.-Atmos., 126, e2019JD032361, https://doi.org/10.1029/2019JD032361, 2021.
NCL: NCAR Command Language (Version 6.6.2), UCAR/NCAR/CISL/TDD, Boulder, Colorado [software], https://doi.org/10.5065/D6WD3XH5, 2019.
Nicolas, J. P. and Bromwich, D. H.: New reconstruction of Antarctic near-surface temperatures: Multidecadal trends and reliability of global reanalyses, J. Climate, 27, 8070–8093, https://doi.org/10.1175/JCLI-D-13-00733.1, 2014.
NIWA (National Institute for Water and Atmospheric Research): Scott Base station, NIWA [data set], https://cliflo.niwa.co.nz, last access: 20 June 2025.
Rohde, R. A. and Hausfather, Z.: The Berkeley Earth Land/Ocean Temperature Record, Earth Syst. Sci. Data, 12, 3469–3479, https://doi.org/10.5194/essd-12-3469-2020, 2020.
Santer, B. D., Wigley, T. M. L., Boyle, J. S., Gaffen, D. J., Hnilo, J. J., Nychka, D., Parker, D. E., and Taylor, K. E.: Statistical significance of trends and trend differences in layer-average atmospheric temperature time series, J. Geophys. Res., 105, 7337–7356, https://doi.org/10.1029/1999JD901105, 2000.
Scambos, T. A., Campbell, G. G., Pope, A., Haran, T., Muto, A., Lazzara, M., Reijmer, C. H., and van den Broeke, M. R.: Ultralow surface temperatures in East Antarctica from satellite thermal infrared mapping: The coldest places on Earth, Geophys. Res. Lett., 45, 6124–6133, https://doi.org/10.1029/2018GL078133, 2018.
Screen, J. A. and Simmonds, I.: Half-century air temperature change above Antarctica: Observed trends and spatial reconstructions, J. Geophys. Res., 117, D16108, https://doi.org/10.1029/2012JD017885, 2012.
Siegert, M. J., Bentley, M. J., Atkinson, A., Bracegirdle, T. A., Convey, P., Davies, B., Downie, R., Hogg, A. E., Holmes, C., Hughes, K. A., Meredith, M. P., Ross, N., Rumble, J., and Wilkinson, J.: Antarctic extreme events, Frontiers in Environmental Science, 11, 1229283, https://doi.org/10.3389/fenvs.2023.1229283, 2023.
South Pole Meteorology Office: Amundsen-Scott South Pole Station climatology data, 1957–present (ongoing), AMRDC Data Repository [data set], https://doi.org/10.48567/szgp-6h49, last access: 20 June 2025.
Turner, J., Colwell, S. R., Marshall, G. J., Lachlan-Cope, T. A., Carleton, A. M., Jones, P. D., Lagun, V., Reid, P. A., and Iagovkina, S.: The SCAR READER project: Toward a high-quality database of mean Antarctic meteorological observations, J. Climate, 17, 2890–2898, https://doi.org/10.1175/1520-0442(2004)017<2890:TSRPTA>2.0.CO;2, 2004.
Turner, J., Lu, H., White, I., King, J. C., Phillips, T., Hosking, J. S., Bracegirdle, T. J., Marshall, G. J., Mulvaney, R. and Deb, P.: Absence of 21st century warming on Antarctic Peninsula consistent with natural variability, Nature, 535, 411–415, https://doi.org/10.1038/nature18645, 2016.
Xie, A., Zhu, J. Qin, X. Wang. S. Xu, B., and Wang, Y.: Surface warming from altitudinal and latitudinal amplification over Antarctica since the International Geophysical Year, Sci. Rep.-UK, 13, 9536, https://doi.org/10.1038/s41598-023-35521-w, 2023.
Xin, M., Li, X., Stammerjohn, S. E., Cai, W., Zhu, J., Turner, J., Clem, K. R., Song, C., Wang, W., and Hou, Y.: A broadscale shift in antarctic temperature trends, Clim. Dynam., 61, 4623–4641, https://doi.org/10.1007/s00382-023-06825-4, 2023.
Yin , X.,Huang, B., Menne, M., Vose, R., Zhang, H.-M., Adeyeye, A., Applequist, S., Gleason, K., Liu, C., and Sanchez-Lugo, A.: NOAAGlobalTemp Version 6: An AI-Based Global Surface Temperature Dataset, B. Am. Meteorol. Soc., 105, E2184–E2193, https://doi.org/10.1175/BAMS-D-24-0012.1, 2024.
Zhang, X., Wang, Y., Hou, S., and Heil, P.: Significant West Antarctic cooling in the past two decades driven by tropical Pacific forcing, B. Am. Meteorol. Soc., 104, E1154–E1165, https://doi.org/10.1175/BAMS-D-22-0153.1, 2023.
Zhu., J., Xie, A., Qin, X., Wang, Y., Xu, B., and Wang, Y.: An assessment of ERA5 reanalysis for Antarctic near-surface air temperature, Atmosphere, 12, 217, https://doi.org/10.3390/atmos12020217, 2021.