the Creative Commons Attribution 4.0 License.
the Creative Commons Attribution 4.0 License.
 | 12 Jun 2025
GloUCP: a global 1 km spatially continuous urban canopy parameters for the WRF model
Weilin Liao
Yanman Li
Xiaoping Liu
Yuhao Wang
Yangzi Che
Ledi Shao
Guangzhao Chen
Hua Yuan
Ning Zhang
Fei Chen
The complexities of urban climate and environmental challenges have garnered significant attention in the 21st century. Numerical simulations, offering high-spatiotemporal-resolution meteorological data, are essential tools in meteorological research and atmospheric science. Accurate representation of urban morphology parameters is crucial for enhancing the precision of these simulations in urban areas. Despite the availability of urban canopy parameter (UCP) data for 44 major cities in the United States and 60 in China for the Weather Research and Forecasting (WRF) model, a comprehensive global dataset representing urban morphology remains absent. This study addresses this gap by leveraging existing global three-dimensional vector data of buildings, including footprints and heights, to compile a global 1 km spatially continuous UCP (GloUCP) dataset for the WRF model. Our findings indicate that GloUCP not only surpasses existing datasets in accuracy but also provides superior spatial coverage. In key urban agglomerations such as Beijing–Tianjin–Hebei, the Yangtze River Delta, and the Guangdong–Hong Kong–Macau Greater Bay Area, GloUCP offers detailed and reliable urban morphological information that closely aligns with reference datasets, outperforming other available sources. Similarly, in United States cities like Seattle, San Francisco, and Philadelphia, GloUCP consistently achieves lower RMSE values and higher correlation coefficients, demonstrating its robustness in modeling diverse urban environments. Furthermore, GloUCP's capability to effectively capture the vertical distribution of buildings, particularly in high-rise areas, highlights its utility in urban climate modeling and related applications. As UCPs are pivotal in regulating atmospheric responses to urbanization, the availability of this globally consistent urban description is a crucial prerequisite for advancing model development and informing climate-sensitive urban planning policies. The GloUCP dataset, converted to WRF binary file format, is available for download at https://doi.org/10.6084/m9.figshare.27011491 (Liao et al., 2025).
- Article
(17653 KB) - Full-text XML
-
Supplement
(18924 KB) - BibTeX
- EndNote


Cities play a crucial role in driving climate change, serve as hotspots for climate impacts, and are central to climate solutions (Zhao et al., 2021; Liu et al., 2020). The complexity of urban environments, combined with the limited availability of urban-specific observations, makes it imperative to rely on models to simulate urban processes and their interactions with regional and global climates (Oleson et al., 2011). Therefore, numerical models are indispensable for understanding future urban climate scenarios and for informing policy and planning (Chen et al., 2011).
In recent years, regional climate modeling has increasingly focused on hyper-resolution simulations, which aim to resolve land surface processes at scales of 1 km or finer (Li et al., 2024). This shift towards finer resolutions is driven by the need for more accurate operational forecasts, particularly in urban settings, where microclimate variations and the frequency of extreme events are of significant concern (Deng et al., 2023; Shen et al., 2019). Hyper-resolution modeling not only enhances our ability to predict these urban-specific phenomena but also deepens our understanding of the broader impacts of urbanization on local weather patterns, including temperature, precipitation, and wind dynamics (Li et al., 2021b; Wang and Li, 2019; Liao et al., 2015; He et al., 2019). As they capture the fine-scale variability of urban environments, these models are crucial for developing targeted strategies to mitigate and adapt to climate change at the urban level, ultimately contributing to more resilient and sustainable cities.
The Weather Research and Forecasting (WRF) model is widely used worldwide in the numerical weather prediction and regional climate modeling communities, known for its high precision, innovative schemes, and comprehensive inclusion of various Earth system processes (Chen et al., 2011). Its applications are becoming increasingly widespread in meteorology and related fields, such as weather services, agriculture, forestry, and renewable energy. Studies have shown that coupling the WRF model with an urban canopy model (WRF-UCM) can improve the simulation of near-surface meteorological elements, effectively enhancing the ability to simulate urban climates (Liao et al., 2014; Shen et al., 2019). However, current urban models still exhibit significant deficiencies in the accuracy of basic data descriptions and the completeness of key process representations, leading to certain limitations in their application (Best and Grimmond, 2015).
For the urban morphological data required by UCMs, the common approach is to classify urban surfaces based on reference imagery and assign building morphological parameters (such as building height and building ratio) and building characteristic parameters (such as thermal and radiative properties) through lookup tables. For example, the WRF model classifies urban areas simply into low-density residential areas, high-density residential areas, and industrial/commercial areas (Chen et al., 2011). Similarly, Community Land Model – Urban (CLMU) adopts this method but further refines the classifications by country or region (Jackson et al., 2010; Oleson and Feddema, 2020). Furthermore, Stewart and Oke (2012) introduced the concept of local climate zones (LCZs), which considers three-dimensional building structures and categorizes urban surfaces into 10 types based on factors such as land cover, building structure, materials, and human activities. This method has also been applied to the WRF model (Demuzere et al., 2023), improving simulation performance to some extent. However, the generation of LCZ datasets depends on expert selection and classification of samples, introducing uncertainties due to variations in remote sensing imagery or sample selection.
With the advancement of remote sensing technology and data generation algorithms, urban data are moving towards higher resolution and greater comprehensiveness, enabling the mapping of high-resolution three-dimensional urban morphological structures. Urban surface classification data have evolved from an early 1 km resolution with 3 categories to a 100 m resolution with 10 categories (i.e., LCZ datasets) (Demuzere et al., 2022). In addition to developments in the United States, Europe, and mainland China (Li et al., 2020), global high-resolution datasets have also been established (Li et al., 2022; Esch et al., 2022). To meet the needs of UCMs, detailed three-dimensional urban morphological structure datasets have been preliminarily established for some cities in the United States and China (Ching et al., 2009; He et al., 2019; Li et al., 2021a; Sun et al., 2021). These datasets include building height, building ratio, and frontal area index, providing a good representation of urban three-dimensional morphological structures. The National Urban Database and Access Portal Tool (NUDAPT) provides grid datasets of urban canopy parameters (UCPs) necessary for urban climate modeling systems for 44 city downtown areas in North America (Ching et al., 2009). Additionally, Sun et al. (2021) has shared UCP datasets for 60 cities in China as well. These detailed high-resolution data have begun to be applied in urban simulation studies, showing certain advantages. For example, Miao et al. (2009) applied detailed UCPs in simulations of the Beijing area, while Dai et al. (2019) used similar detailed UCPs in studies of the Pearl River Delta. They both found that this significantly enhancing the model's simulation capability. In addition, other studies have similarly found that the application of high-resolution UCP datasets leads to varying degrees of improvement in simulation results (Deng et al., 2023; Sun et al., 2021; Shen et al., 2019).
Despite this, existing UCP data face challenges in consistency due to differences in data sources and production methods, making it difficult to form a comprehensive set of input parameters for regional or global urban modeling. More importantly, the currently available UCP datasets are limited to only a few cities and have restricted spatial coverage, making them insufficient for large-scale urban climate simulations. Recently, Kamath et al. (2024) released Global Building Heights for Urban Studies (UT-GLOBUS) for city- and street-scale urban simulations. Although UT-GLOBUS covers more than 1200 cities and locales worldwide, UCP data for east Asia remain unavailable due to the lack of building vector data in this area. For study areas without detailed UCP data, urban changes can only be described from a two-dimensional perspective, with three-dimensional morphological parameters often represented by a fixed value, failing to reflect the true impact of urban three-dimensional structures on local climates. In addition, Khanh et al. (2023) developed a global 1 km urban morphological dataset using empirical formulas to estimate UCPs based on gross domestic product (GDP) and population density information. While this dataset performs well in terms of spatial coverage, the accuracy of the estimated parameters has not yet been compared with results derived from actual building data.
The three-dimensional building footprints can provide essential information for calculating fine-scale UCPs. However, obtaining building-scale footprints with global coverage for calculating detailed global UCPs presents a significant challenge currently. Even though global three-dimensional urban height data are becoming more available and their spatial resolution has improved, these high-resolution raster data typically only represent urban heights at a grid scale and do not provide the boundaries and heights of individual buildings, making it difficult to calculate high-resolution UCPs on a global scale. In fact, the OpenStreetMap (OSM) dataset includes vector data for some buildings globally, but coverage is uneven (Herfort et al., 2023). Microsoft offers a global vector dataset, but it lacks building vector data for east Asia and building height data for many regions. However, the latest research has created the first global three-dimensional building footprint dataset (3D-GloBFP) based on publicly available multi-source data (Che et al., 2024). This dataset integrates existing building data to calculate the boundaries and heights of individual buildings globally for 2020. Based on the building vector data, Cheng et al. (2025) developed a global 1 km spatially continuous urban surface property dataset (U-Surf) for the UCM in the Community Earth System Model. However, the urban morphological parameters calculated in U-Surf, including building height, canyon height-to-width ratio, roof fraction, pervious canyon floor fraction, and urban percentage, differ from the UCPs required by WRF-UCM and therefore cannot be directly used in the WRF model. Therefore, the aim of this study is to use a newly developed building-scale height map to further produce a global spatially continuous high-resolution UCP dataset (hereafter referred to as GloUCP), updating the default parameters in the WRF model to improve simulation accuracy.
2.1 Global building footprint dataset
Vector data that include building outline and height information are essential for computing UCPs. Currently, many studies primarily focus on estimating building heights at the grid scale, often with limited spatial coverage and resolution. This constraint makes it difficult to derive comprehensive global UCPs. Recently, the first global three-dimensional building footprint (3D-GloBFP) dataset was created by leveraging Earth observation data and advanced machine learning techniques (Che et al., 2024). This dataset combines global building boundaries derived from Microsoft's building footprints and the research by Shi et al. (2024), achieving average precisions of over 90 % and 80 %, respectively, across different regions. Together, these two open-source datasets provide a thorough global spatially continuous building boundary dataset for 2020.
To ensure maximum coverage of reference building heights worldwide, the 3D-GloBFP dataset integrates building footprint data with height information from ONEGEO Map, Microsoft building footprints, Baidu Maps, and Emu Analytics (Che et al., 2024). Additionally, they developed height estimation models for 33 global subregions using the extreme gradient boosting (XGBoost) regression method, integrating various remote sensing and building morphology features. The height estimation models demonstrate good performance globally, with R2 values between 0.66 and 0.96, and root mean square errors (RMSEs) ranging from 1.9 to 14.6 m across the 33 subregions. Overall, the 3D-GloBFP dataset, which can provide global building 2D footprint polygons along with their heights, is the most comprehensive among existing building vector data, making it a robust foundation for calculating UCPs in this study.
2.2 Development of global 1 km spatially continuous UCPs for the WRF model
Urban morphological parameters required by the WRF-UCM model can be calculated using building-scale outline and height data, allowing for the derivation of UCPs at any spatial resolution. These parameters include mean building height, standard deviation of building height, area-weighted mean building height, plan area fraction, ratio of building surface to plan area, frontal area index, and distribution of building heights, as detailed in Table 1. They can be applied to three types of UCMs in the WRF model: single-layer urban canopy model (SLUCM), building effect parameterization (BEP), and BEP-building energy model (BEM). In this study, all the UCPs are developed globally at a resolution of approximately 1 km (i.e., °) based on the building-scale information (i.e., building outline and height) provided by the 3D-GloBFP dataset.
Table 1Calculation of GloUCP for the WRF model and the applied UCP schemes.
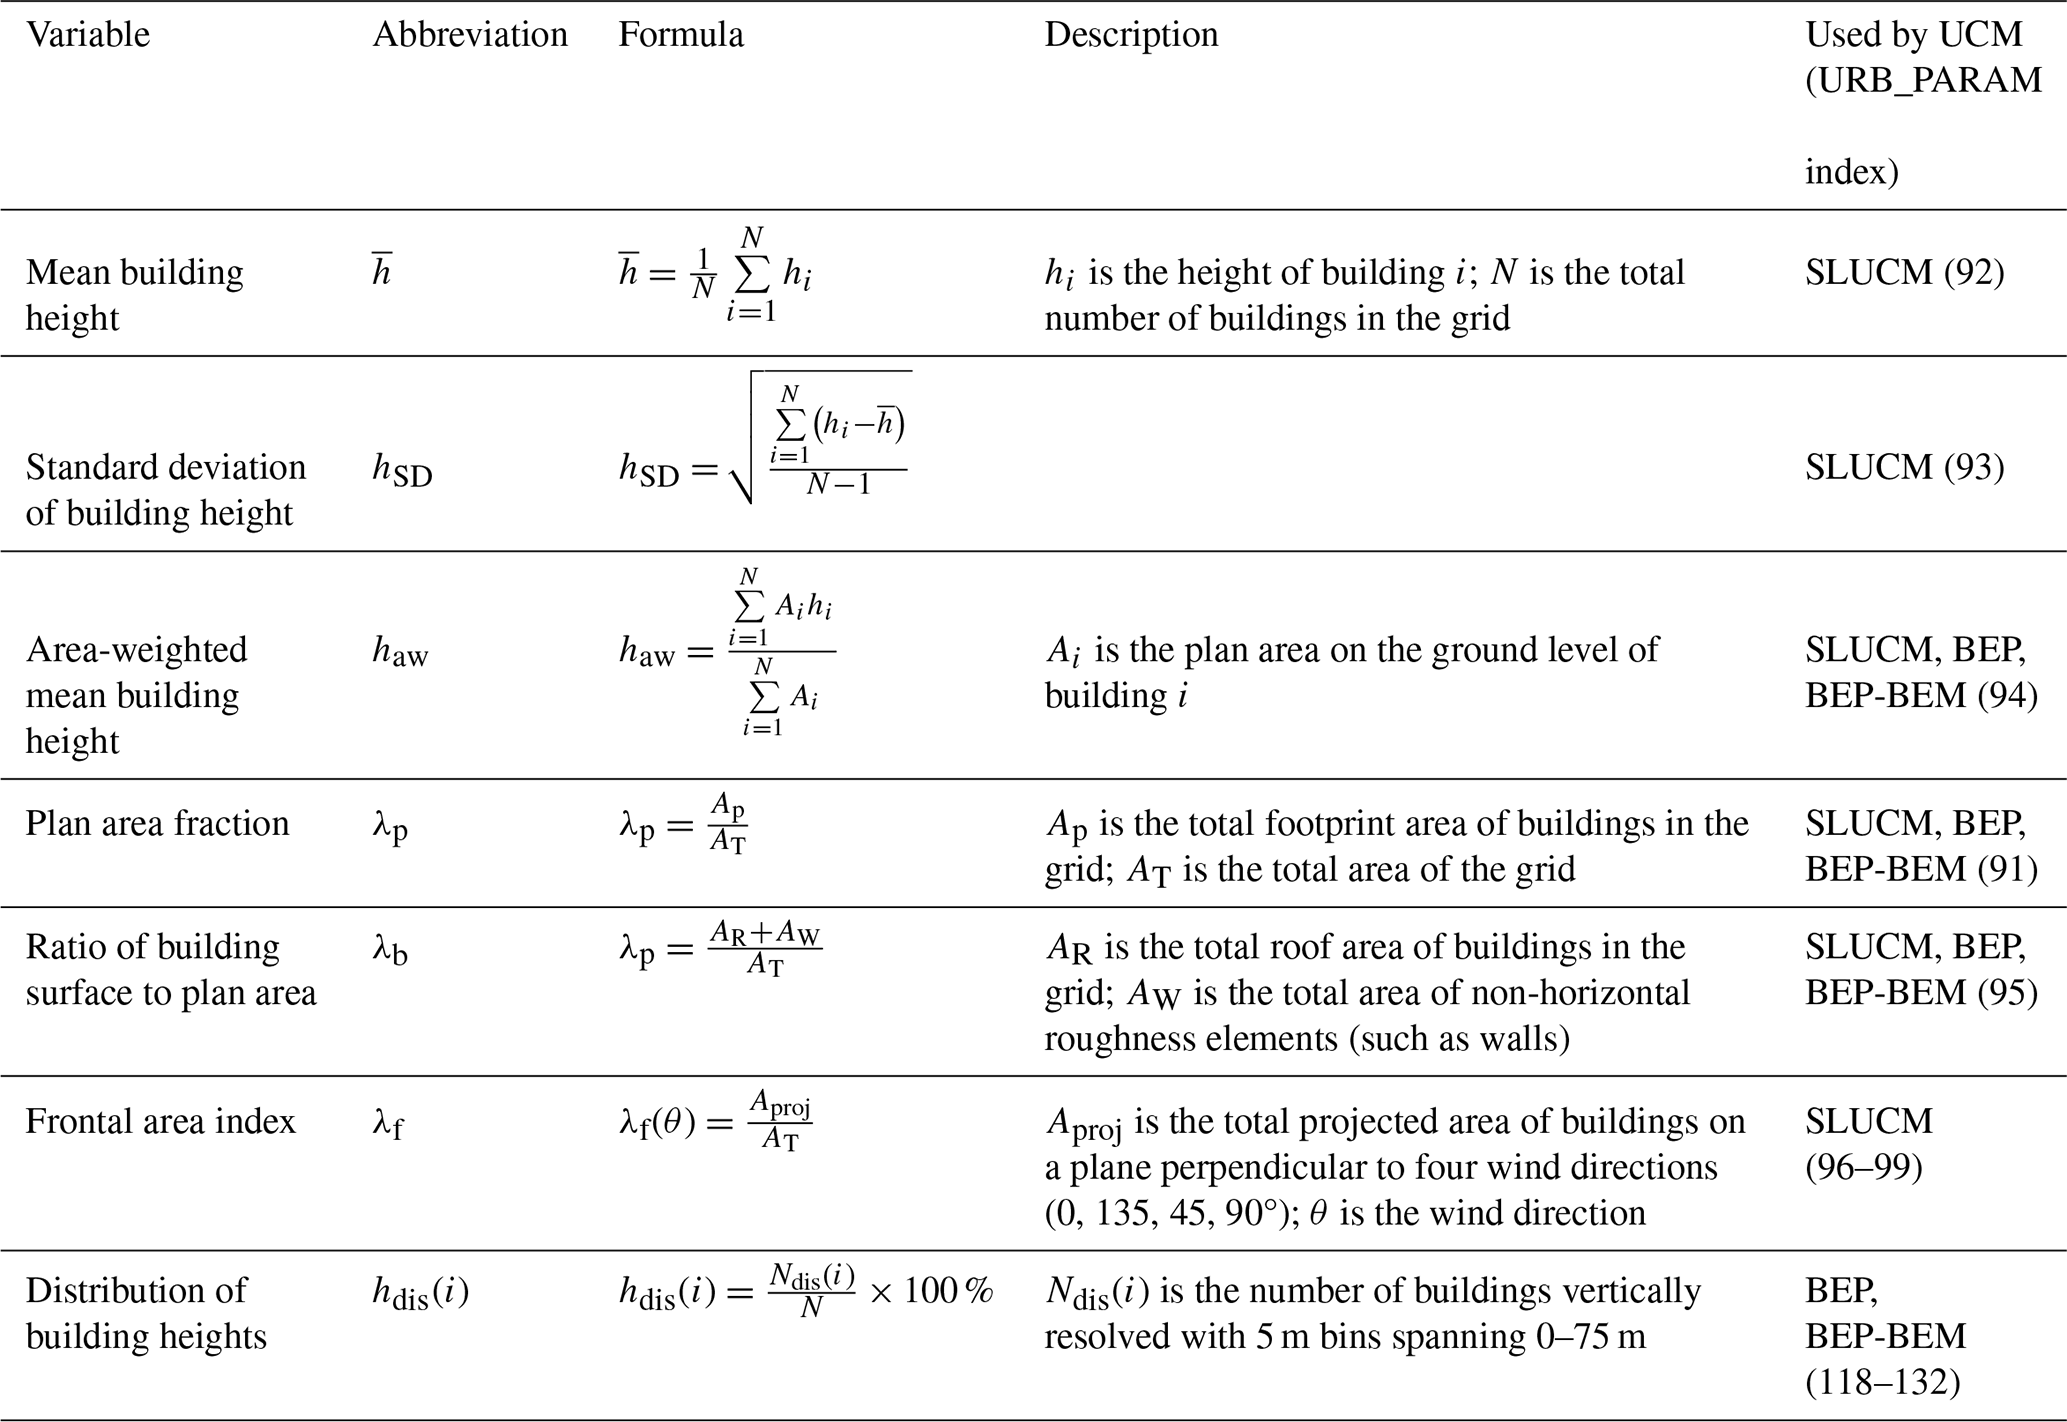
UCM: urban canopy model, SLUCM: single-layer urban canopy model, BEP: building effect parameterization, BEM: building energy model. The values in parentheses in the last column represent the index of the UCP in the URB_PARAM array.
Additionally, to ensure the consistency of the calculation area with the existing impervious surface extent, we further use the Global Artificial Impervious Area (GAIA) dataset for 2020 as a mask for UCP calculation. The GAIA dataset is generated based on long-term optical remote sensing data from the Landsat series of satellites, supplemented by VIIRS nighttime light data and Sentinel-1 radar data (Gong et al., 2020). It uses spatial masking and feature evaluation algorithms to achieve rapid mapping of impervious surfaces and employs a time consistency verification algorithm to filter and infer logical sequences of impervious surfaces, ensuring their spatial and temporal rationality. In our dataset, only grids with an impervious surface ratio exceeding 1 % are retained. Moreover, we provide 1 km resolution impervious surface fraction data for urban areas for 2020 derived from the GAIA dataset as well. This allows users to conveniently define urban categories (i.e., low-density residential, high-density residential, and industrial/commercial) in WRF simulations based on the consistent impervious fraction data. Once the urban type of each grid is determined, our dataset can be used to reassign urban morphological parameters for each grid, thereby providing a more detailed and accurate depiction of urban morphological variations within the study areas.
2.3 Comparison between new and existing UCPs for the WRF model
To demonstrate the reliability of the GloUCP dataset generated in this study, we select three major urban agglomerations in China (i.e., Beijing–Tianjin–Hebei region, Yangtze River Delta, and Guangdong–Hong Kong–Macau Greater Bay Area) and three important cities in the United States (i.e., Seattle, San Francisco, and Philadelphia) as representatives. This selection is based on the availability of data and the representativeness of their geographical distribution. We systematically evaluate the consistency between reference data, our new dataset, and comparison datasets using the coefficient of determination (R2) and RMSE as statistical indicators.
For China, we use building height data obtained from the Baidu Maps API (https://ditu.baidu.com, last access: 1 September 2024) as the reference data and the UCP dataset released by Sun et al. (2021) (hereafter referred to as Sun2021) as the comparison dataset. Both GloUCP and Sun2021 have a spatial resolution of 1 km, while the Baidu Maps data are at the building scale. Considering the differences in resolution among these datasets, we process the building-scale Baidu Maps data using the same method as for the initial building height estimation dataset, resulting in 1 km resolution urban height data from Baidu Maps. We then conduct a consistency analysis using the pixel values within the spatial extent where all three datasets overlap.
For the United States, we use a building footprint dataset with height information released by Microsoft in 2017 (https://wiki.openstreetmap.org/wiki/Microsoft_Building_Footprint_Data#March_2017_Release, last access: 1 September 2024) as the reference data and the NUDAPT dataset, which includes UCPs for 44 cities in the United States developed from airborne lidar data (Ching et al., 2009), as the comparison dataset. Both our GloUCP dataset and NUDAPT dataset have a spatial resolution of 1 km, while the Microsoft data are at the building scale. Similarly to the analysis in China, we process the building-scale Microsoft data to obtain 1 km resolution urban height data and conduct a consistency analysis using the overlapping spatial extent of all three datasets.
To demonstrate the advantages of our dataset, we further compared it with the recently released UT-GLOBUS dataset by Kamath et al. (2024) and the global urban morphological dataset developed by Khanh et al. (2023). Additionally, we compare the spatial distribution of the default UCPs for low-density residential areas, high-density residential areas, and industrial/commercial areas defined in the current WRF model with our GloUCP dataset. This comparison aims to assess not only the heterogeneity in their geographical distribution but also the differences in their numerical characteristics. This provides a basis for further exploring the feasibility of using the new dataset in WRF simulations to enhance urban climate modeling performance.
3.1 Global distribution of the GloUCP
Figure 1 illustrates the spatial distribution of mean building height across global land. Overall, in economically developed and highly urbanized regions, such as the eastern coast of the United States, western Europe, Japan, and eastern China, the mean building height is relatively high. Conversely, in most parts of Africa and South America, the mean building height is much lower. The area-weighted mean building height follows a similar spatial pattern to that of the mean building height, with it being higher in regions with advanced urbanization and lower in areas where urbanization is less developed.
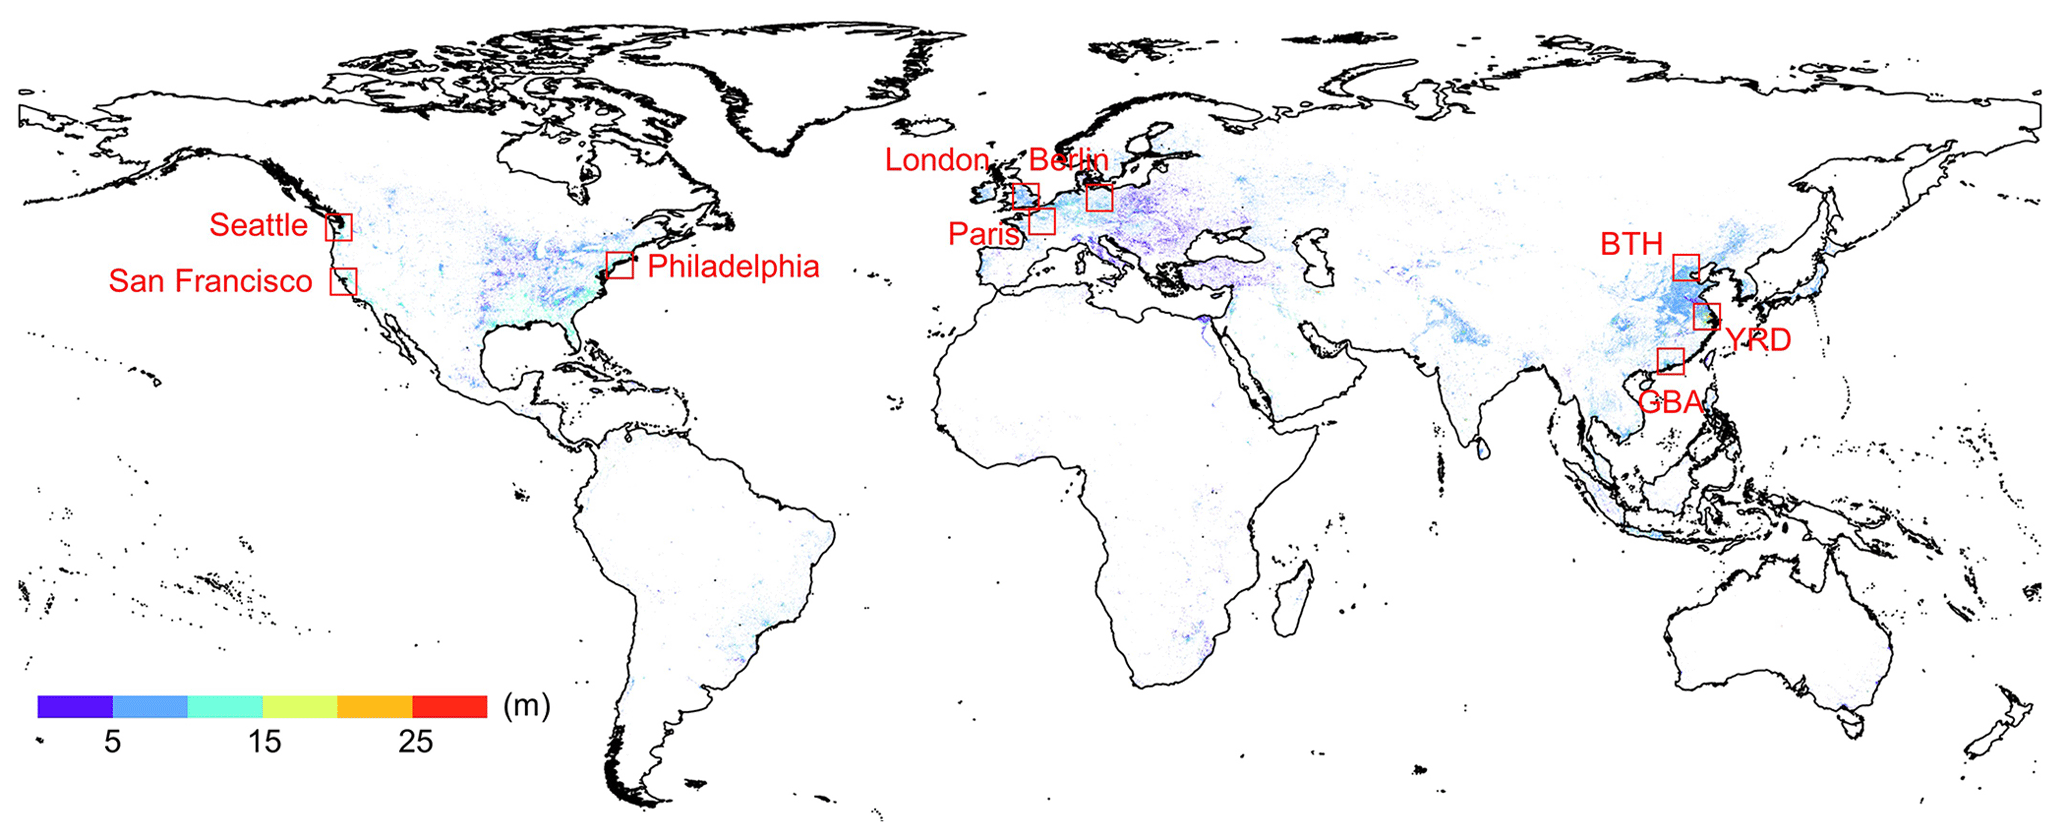
Figure 1The spatial pattern of mean building height across global land.
We further examine the spatial distribution patterns of mean building height within the three study regions: China, the contiguous United States, and Europe. In China, the mean building height generally follows a pattern of being higher in the east than in the west and higher in coastal areas than in inland regions. For instance, the mean building heights in some eastern coastal cities, such as Shanghai, Beijing, and Tianjin, respectively, are significantly higher than those in inland areas. At the provincial level, most provinces in China are dominated by low-rise buildings, while the proportion of multi-rise buildings is higher in the eastern region, and high-rise buildings are more prevalent in Hong Kong SAR and Macau SAR (Fig. S1a in the Supplement). Focusing on the three major urban agglomerations in China, the Yangtze River Delta (YRD) stands out with a larger scale of multi-rise and high-rise buildings compared to the other two regions. The mean building height in the YRD is 10.62 m, higher than the 9.93 m in the Guangdong–Hong Kong–Macau Greater Bay Area (GBA) and the 8.24 m in the Beijing–Tianjin–Hebei (BTH) region (Fig. 2a1–c1).
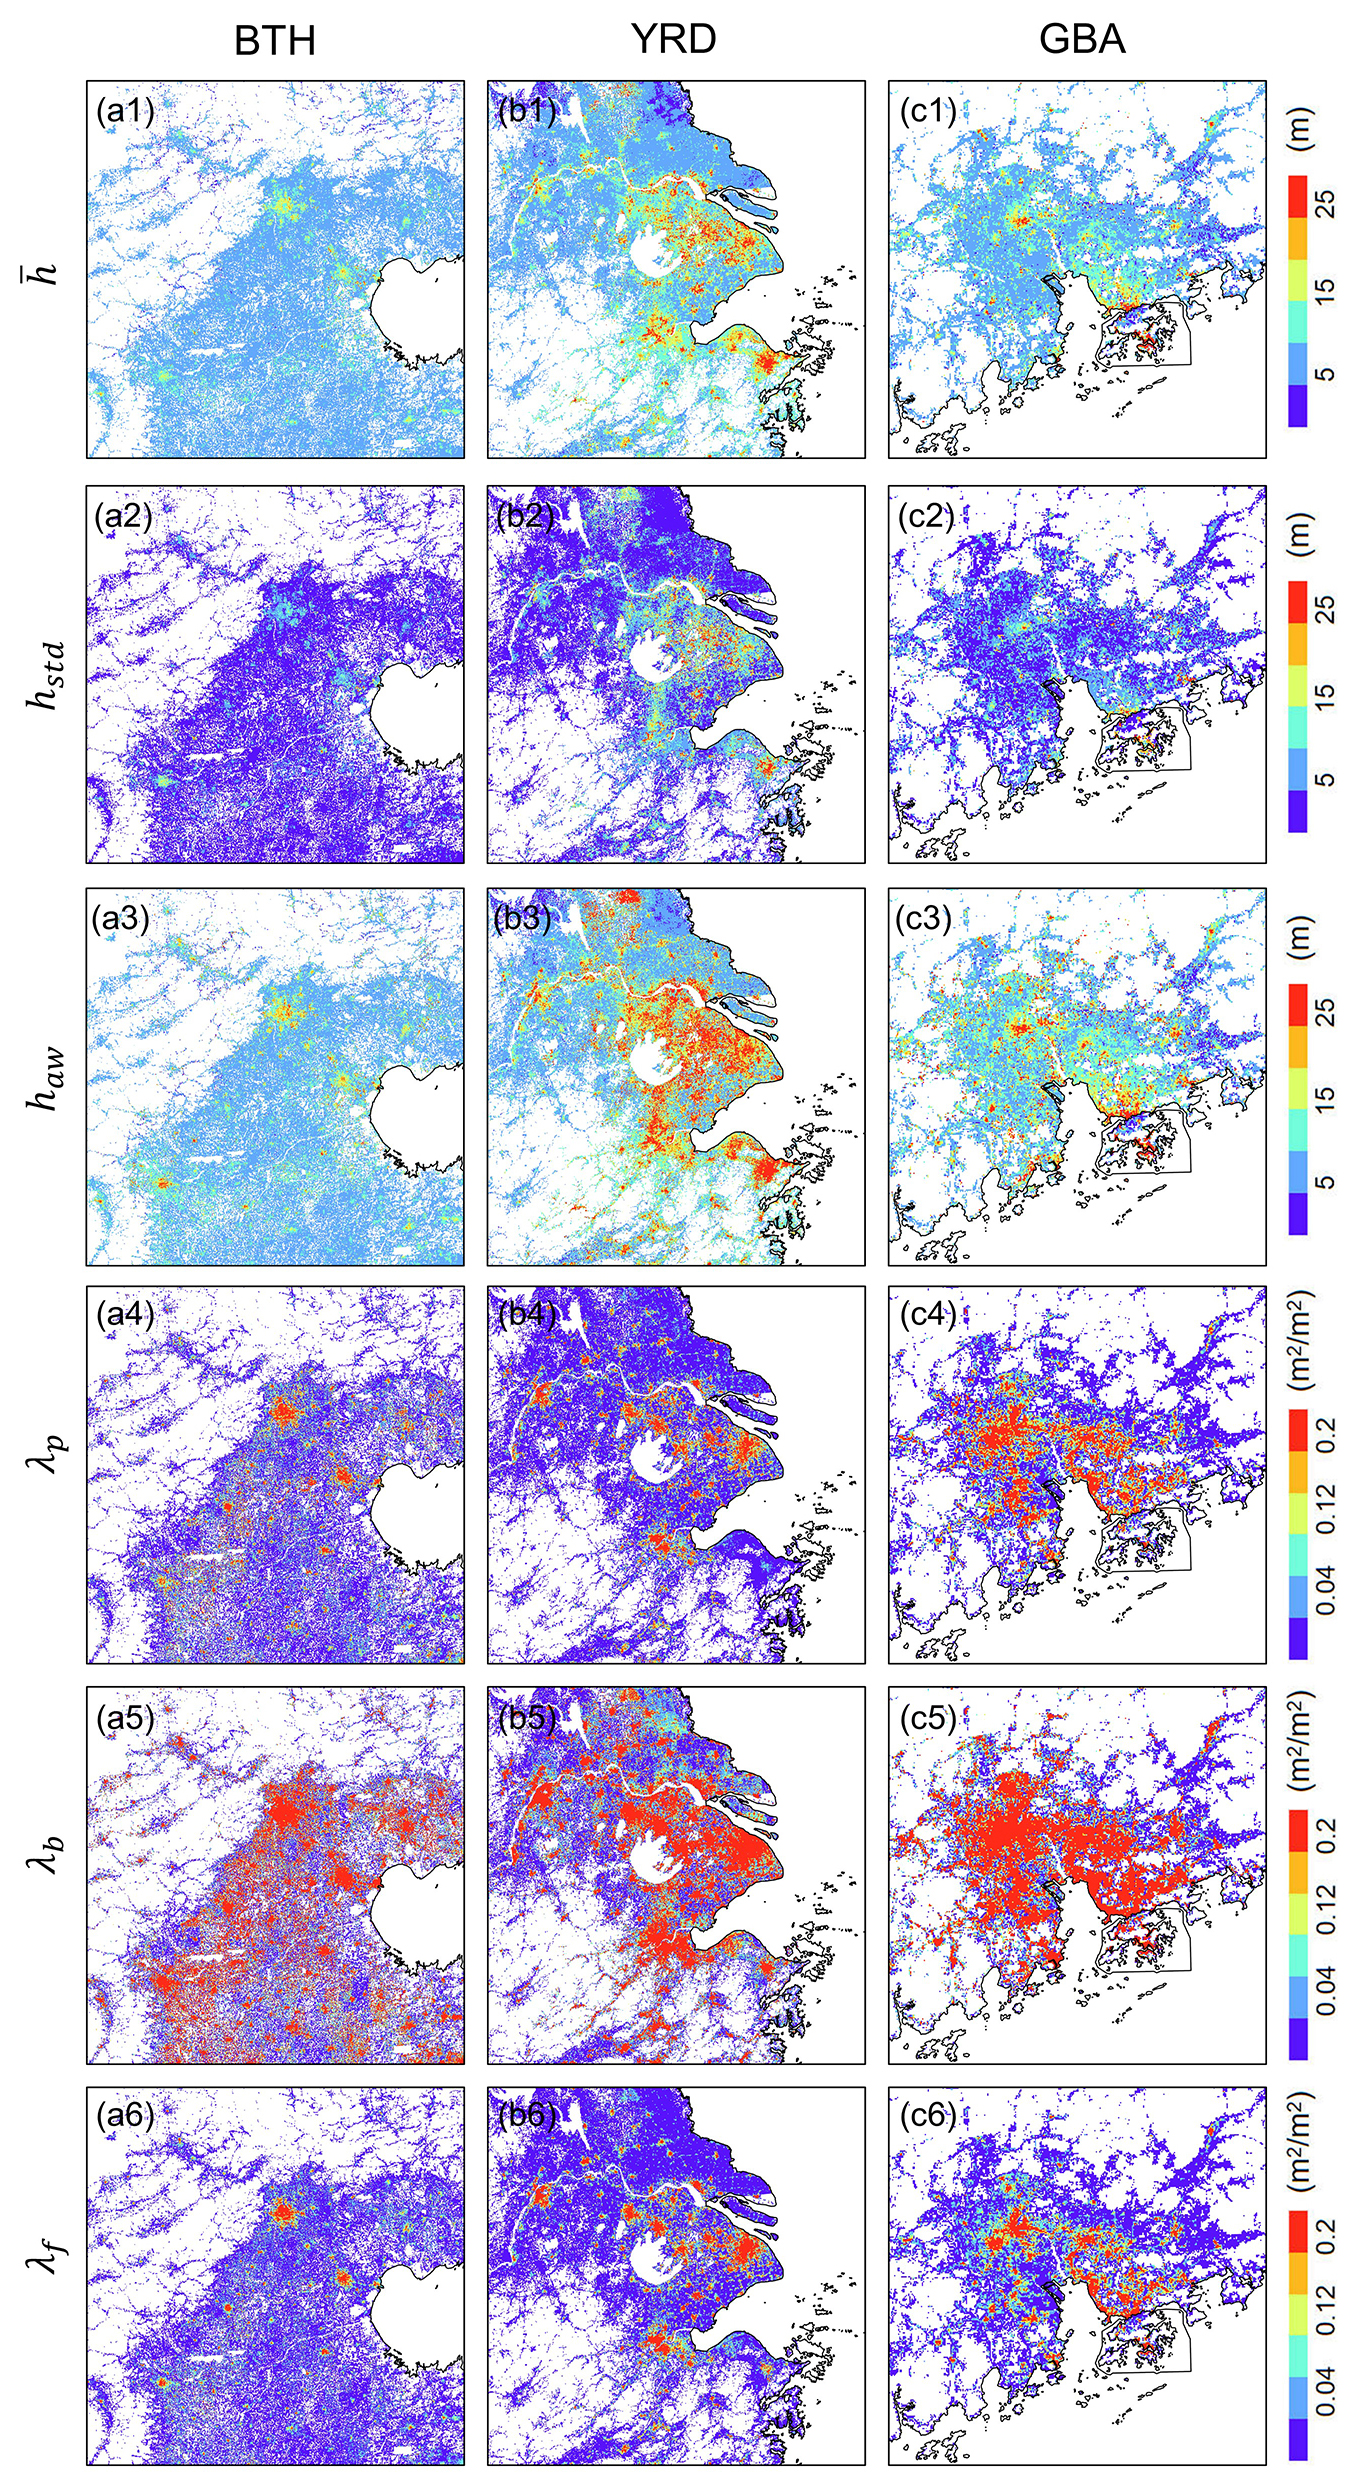
Figure 2The spatial distribution of UCPs in three major urban agglomerations in China, i.e., Beijing–Tianjin–Hebei region, Yangtze River Delta, and Guangdong–Hong Kong–Macau Greater Bay Area, as highlighted in Fig. 1. Panels (1)–(6) show the spatial distribution of mean building height, standard deviation of building height, area-weighted mean building height, plan area fraction, ratio of building surface to plan area, and frontal area index, respectively.
In the United States, building height distribution follows a general pattern of decreasing heights from coastal areas to inland regions. The vast agricultural states in the Midwest and western regions have low mean building heights, mostly below 10 m, while the northeastern states, as well as California and Florida, have higher mean building heights (Fig. 3a1–c1). At the state level, apart from Washington, DC, the proportion of high-rise buildings in other states is very small, with the proportion of multi-rise buildings decreasing from the coasts to the interior (Fig. S1b). In Europe, the proportion of high-rise buildings is generally low across different countries (Fig. S1c). The mean building height in European countries is about 6.81 m, lower than the 8.75 m observed in the United States and the 8.33 m in China. Moreover, the proportion of high-rise building area in the city centers of European regions is also less compared to both the United States and China (Fig. 4a1–c1).
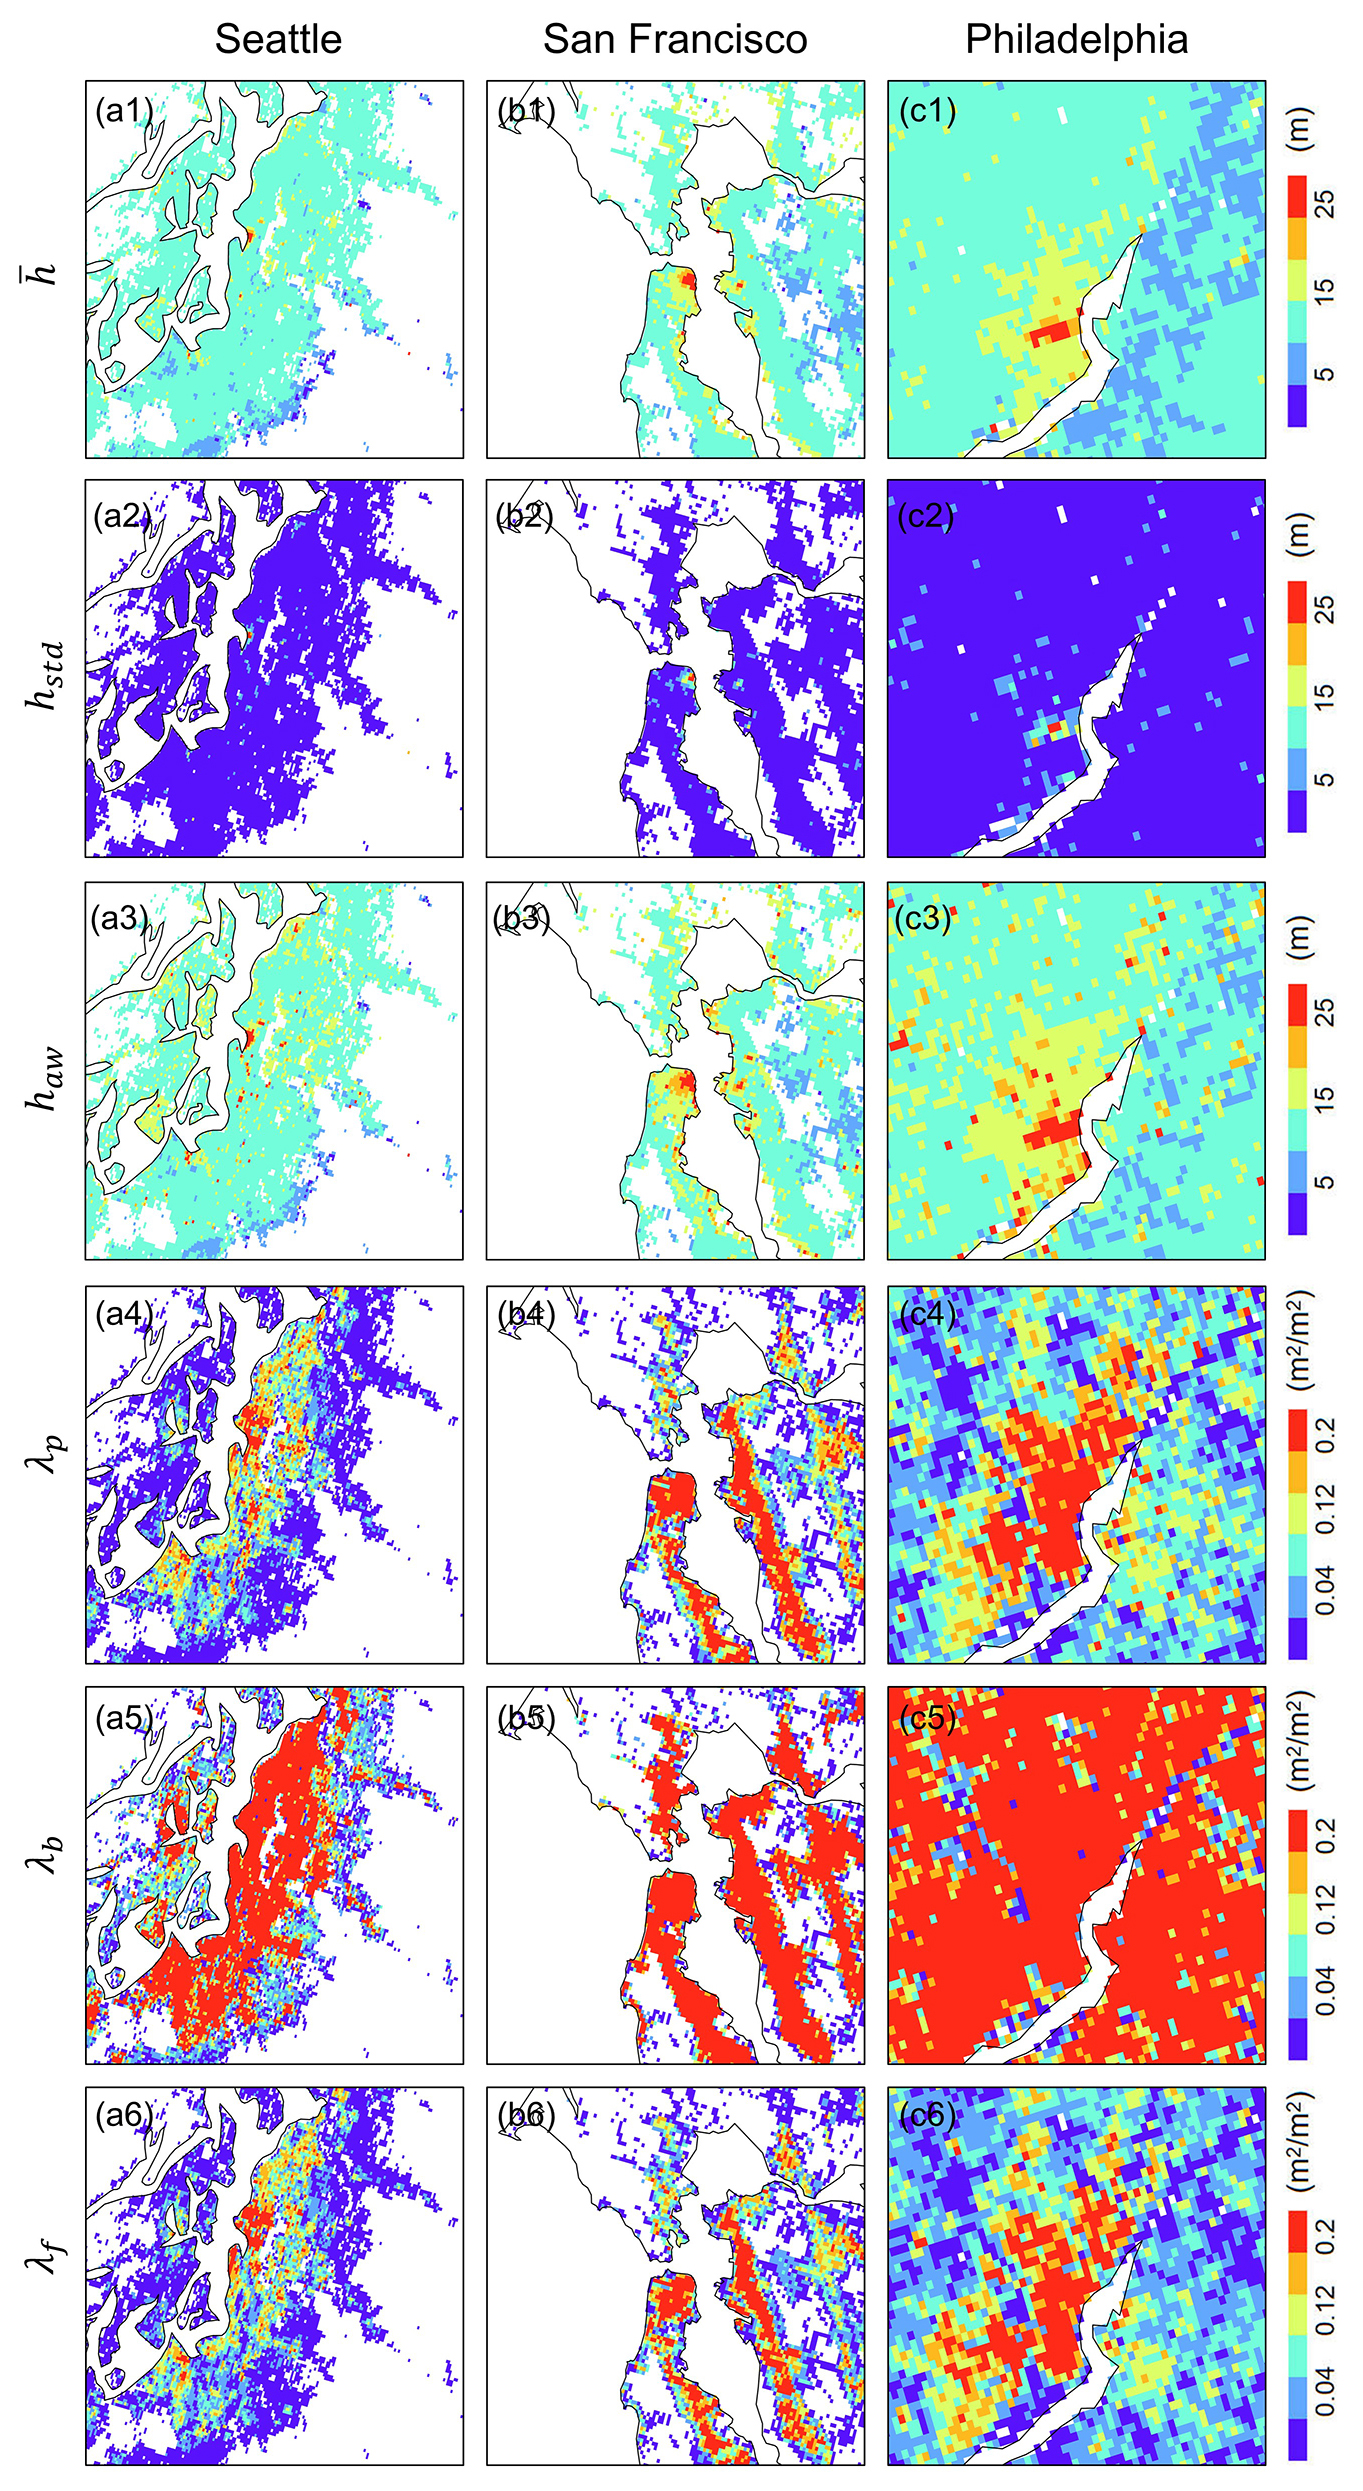
Figure 3The spatial distribution of UCPs in three major cities in the contiguous United States, i.e., Seattle, San Francisco, and Philadelphia, as highlighted in Fig. 1. Panels (1)–(6) show the spatial distribution of mean building height, standard deviation of building height, area-weighted mean building height, plan area fraction, ratio of building surface to plan area, and frontal area index, respectively.
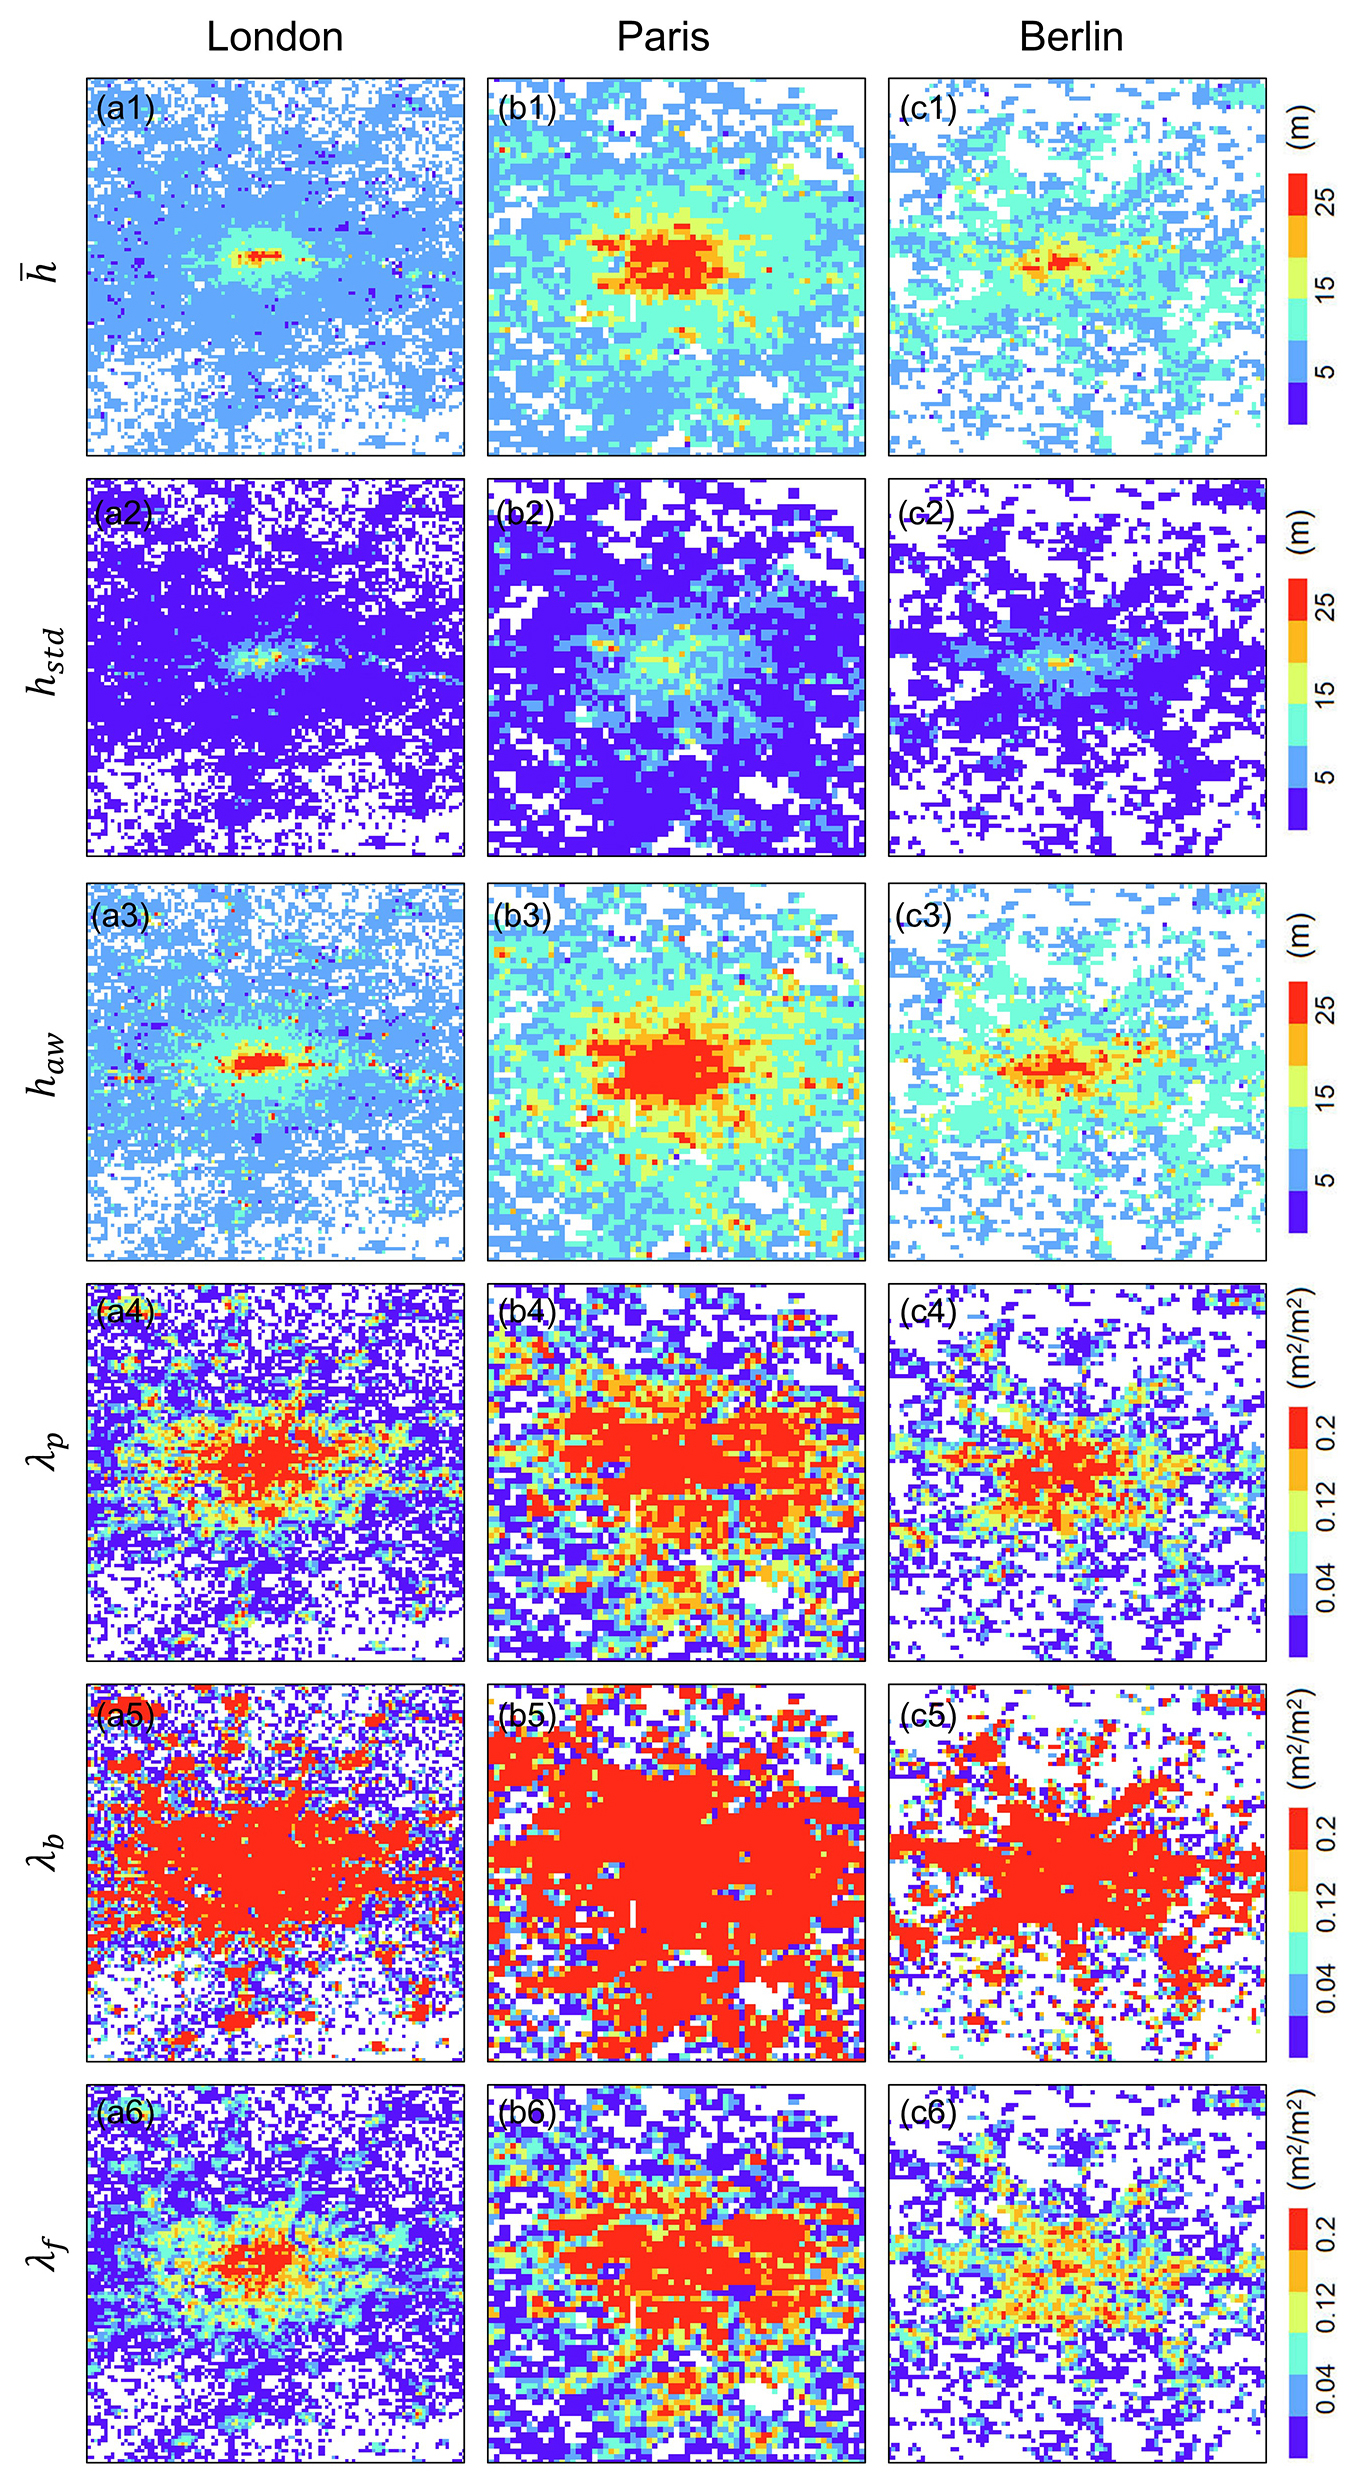
Figure 4The spatial distribution of UCPs in three major cities in Europe, i.e., London, Paris, and Berlin, as highlighted in Fig. 1. Panels (1)–(6) show the spatial distribution of mean building height, standard deviation of building height, area-weighted mean building height, plan area fraction, ratio of building surface to plan area, and frontal area index, respectively.
The standard deviation of building height reflects the spatial heterogeneity of building distributions and is often used to indicate surface roughness. Overall, the standard deviation of building height is larger in major cities in Europe, Japan, South Korea, and the eastern coastal areas of China (Fig. S2b). In China, the standard deviation of building height is about 2.91 m. Its spatial distribution exhibits a pattern where southern regions have higher values than northern regions and coastal areas have higher values than inland areas. The YRD (5.71 m) and GBA (6.20 m) have similar standard deviation values, both significantly higher than that of the BTH region (3.10 m) (Fig. 2a2–c2). In the United States, apart from some northeastern states, the standard deviation is generally low, with values below 1.5 m in most areas. Specifically, Seattle has a standard deviation of 2.38 m, San Francisco of 5.10 m, and Philadelphia of 3.48 m (Fig. 3a2–c2). In suburban areas, buildings are generally low and flat, with significant building height variations occurring only in certain parts of city centers. In Europe, the standard deviation of building height is about 2.34 m and is relatively uniform across regions, except in a few countries. For instance, Paris has a notably higher standard deviation of 10.84 m, which is significantly larger than those in London (3.42 m) and Berlin (4.87 m) (Fig. 4a2–c2). Overall, the spatial distribution of height standard deviation exhibits a certain similarity to that of mean building height. Regions with higher mean building heights also tend to have greater height standard deviations.
The plan area fraction and ratio of building surface to plan area help to understand building density and land use efficiency. These indicators show higher values in major cities in North America, western Europe, Japan, southeast Asia, and the eastern coastal areas of China, where high urbanization levels lead to extensive surface coverage by tall and densely clustered buildings (Fig. S3). The spatial distribution of the frontal area index generally mirrors that of the plan area fraction (Fig. S4). Overall, this pattern suggests that building density is higher in Europe followed by the United States and China.
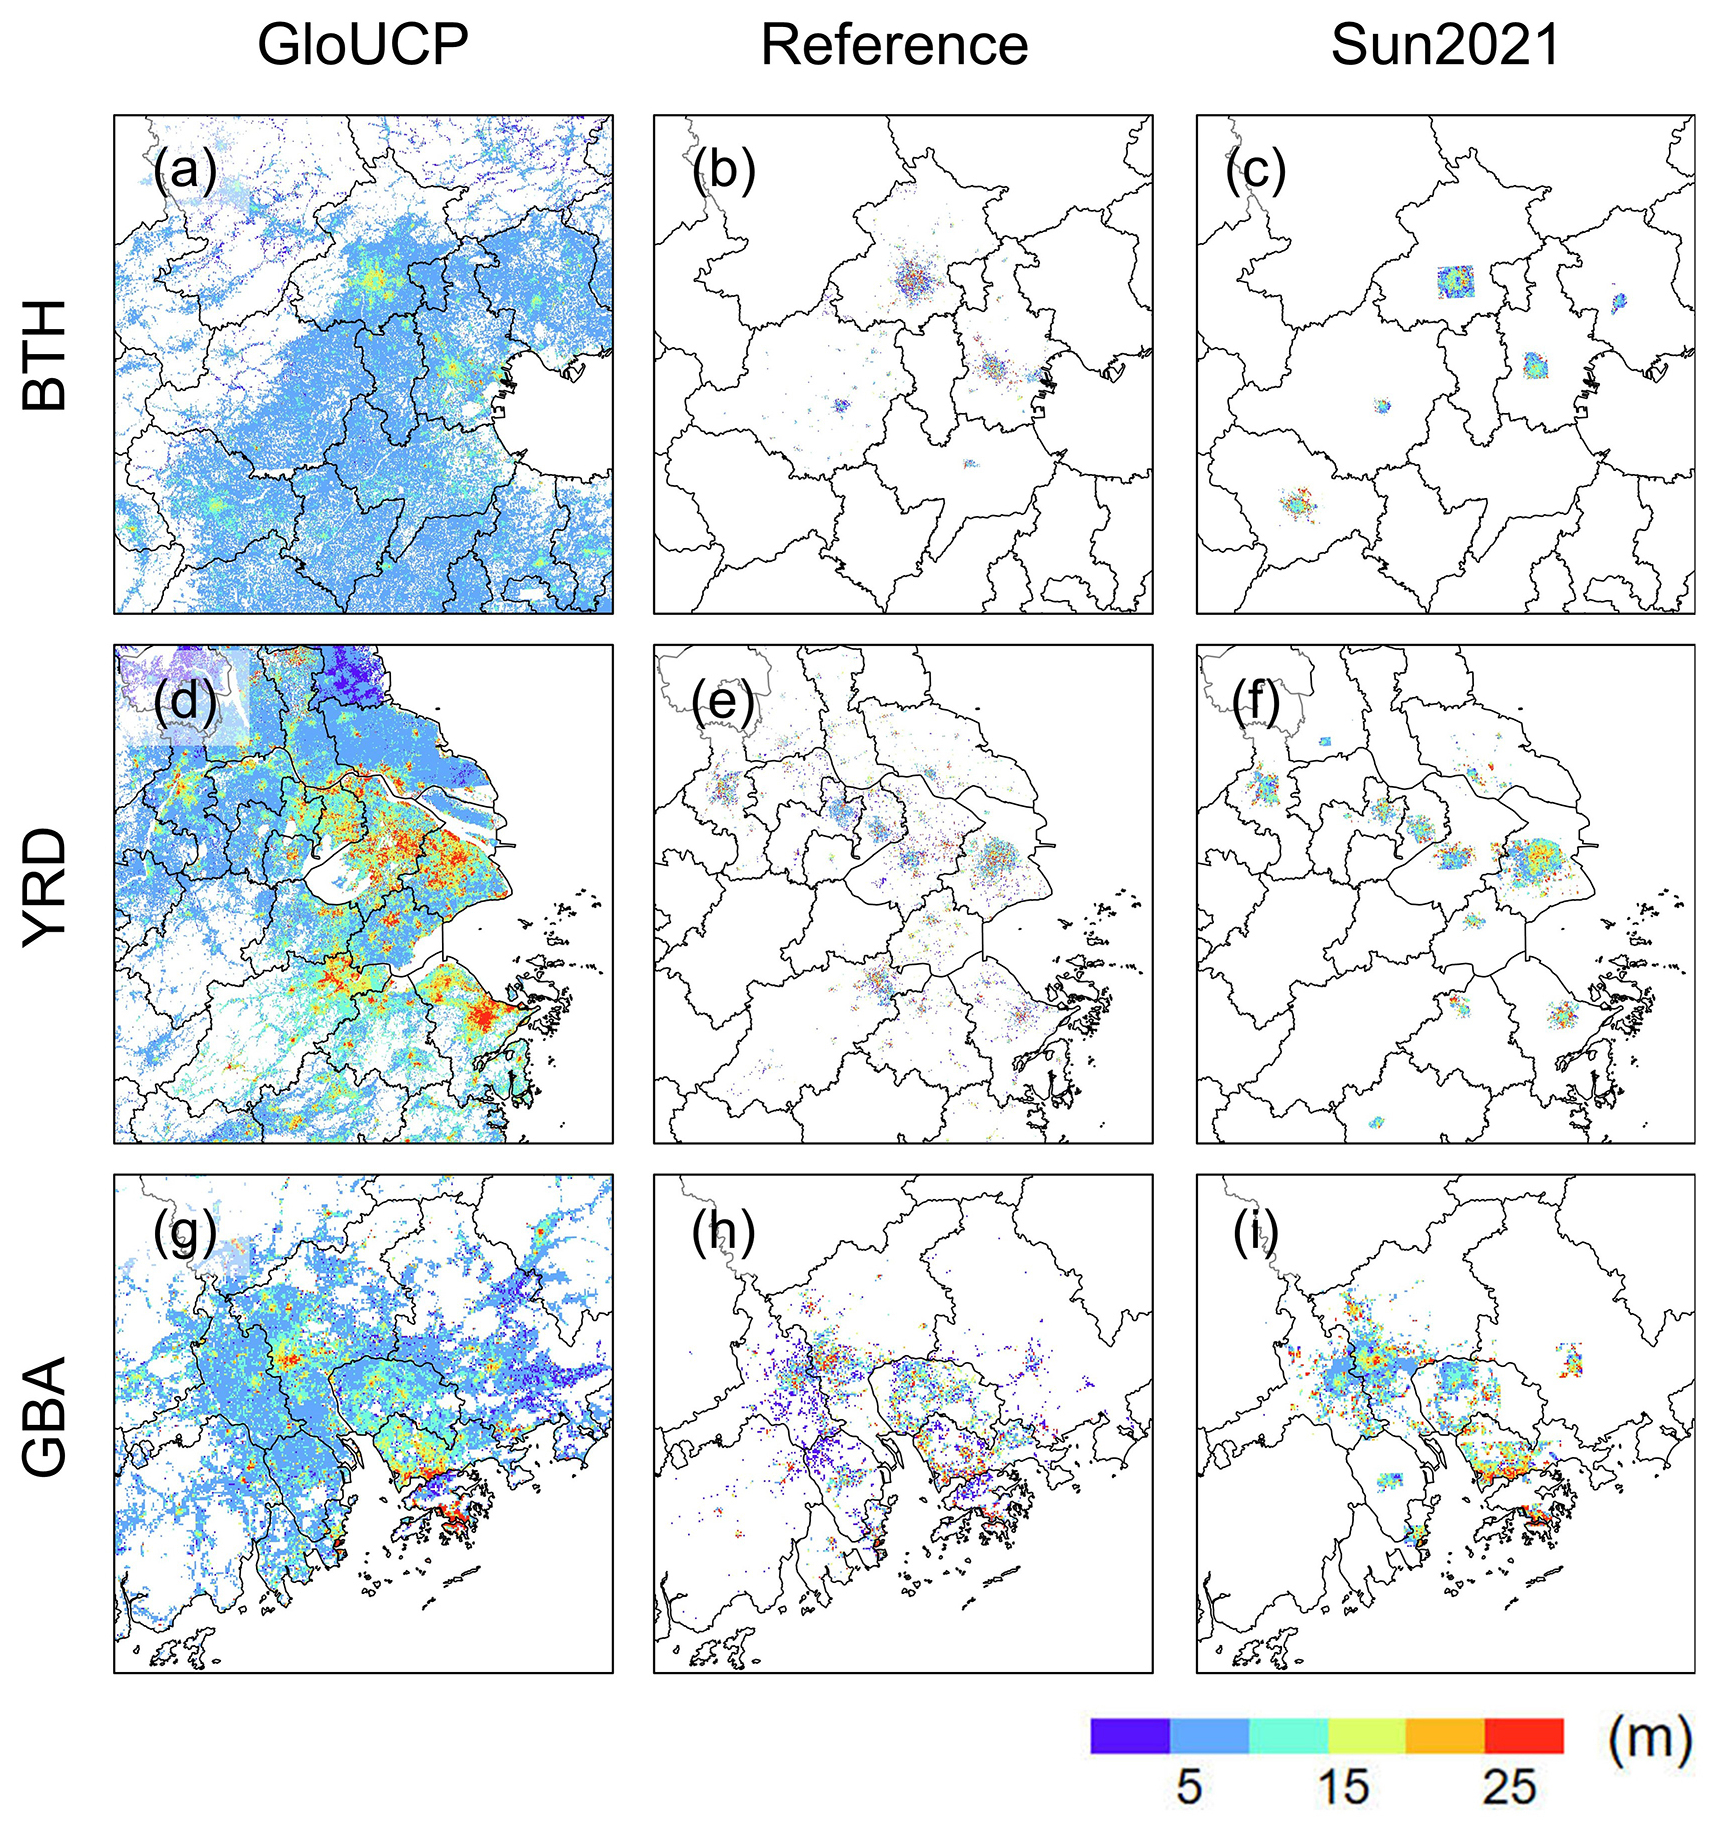
Figure 5Comparison of the spatial distribution of mean building heights in GloUCP, reference data, and Sun2021 across three major urban agglomerations in China.
3.2 Comparison with existing UCP products for the WRF model
In China, we used Baidu's building height data as reference data. By comparing this with the Sun2021 dataset, we found that our GloUCP dataset significantly outperforms in terms of spatial continuity and coverage. GloUCP effectively fills in gaps in existing datasets, particularly for buildings in suburban areas of large cities as well as in small to medium-sized cities and rural areas (Fig. 5). This comprehensive spatial coverage is crucial for regional climate modeling; without it, WRF-UCM would rely on lookup tables to fill in missing UCP values for areas not covered by data. This could lead to inconsistencies in UCPs across the simulation domain, potentially compromising the accuracy of the simulation results.
Figure 6 shows a pixel-scale comparison of mean building heights in GloUCP, reference data, and Sun2021 across three major urban agglomerations in China. In these three regions, the coefficient of determination (R2) for GloUCP is 0.19, 0.20, and 0.17 in BTH, YRD, and GBA regions, respectively, which is higher than the 0.09, 0.06, and 0.07 for Sun2021 (Table S1 in the Supplement). This indicates that although the accuracy is relatively low, GloUCP more accurately reflects the true distribution of building heights in these areas. From the perspective of RMSE, GloUCP consistently outperforms Sun2021 across all three regions, with lower RMSE values, indicating higher accuracy in building height predictions. In the BTH region, GloUCP has an RMSE of 14.32 m, which is lower than Sun2021's 15.22 m; in YRD, GloUCP's RMSE is 15.88 m, which is well below Sun2021's 16.79 m; and in GBA, GloUCP's RMSE is 17.88 m, which is also better than Sun2021's 19.29 m (Table S1). Furthermore, when the RMSE is compared across different building height intervals (i.e., ≤10, 10–24, and >24 m), GloUCP generally shows lower RMSE values than Sun2021 in nearly all height categories, with a particularly noticeable advantage in lower buildings. This also indicates that, for both our GloUCP dataset and the Sun2021 dataset, the errors in mean building height primarily stem from taller buildings. Nevertheless, GloUCP has a significant advantage in predicting building height data across China, especially in complex urban areas and for high-rise buildings. Overall, GloUCP not only better reflects the actual distribution of building heights but also exhibits superior spatial coverage across different geographical regions.
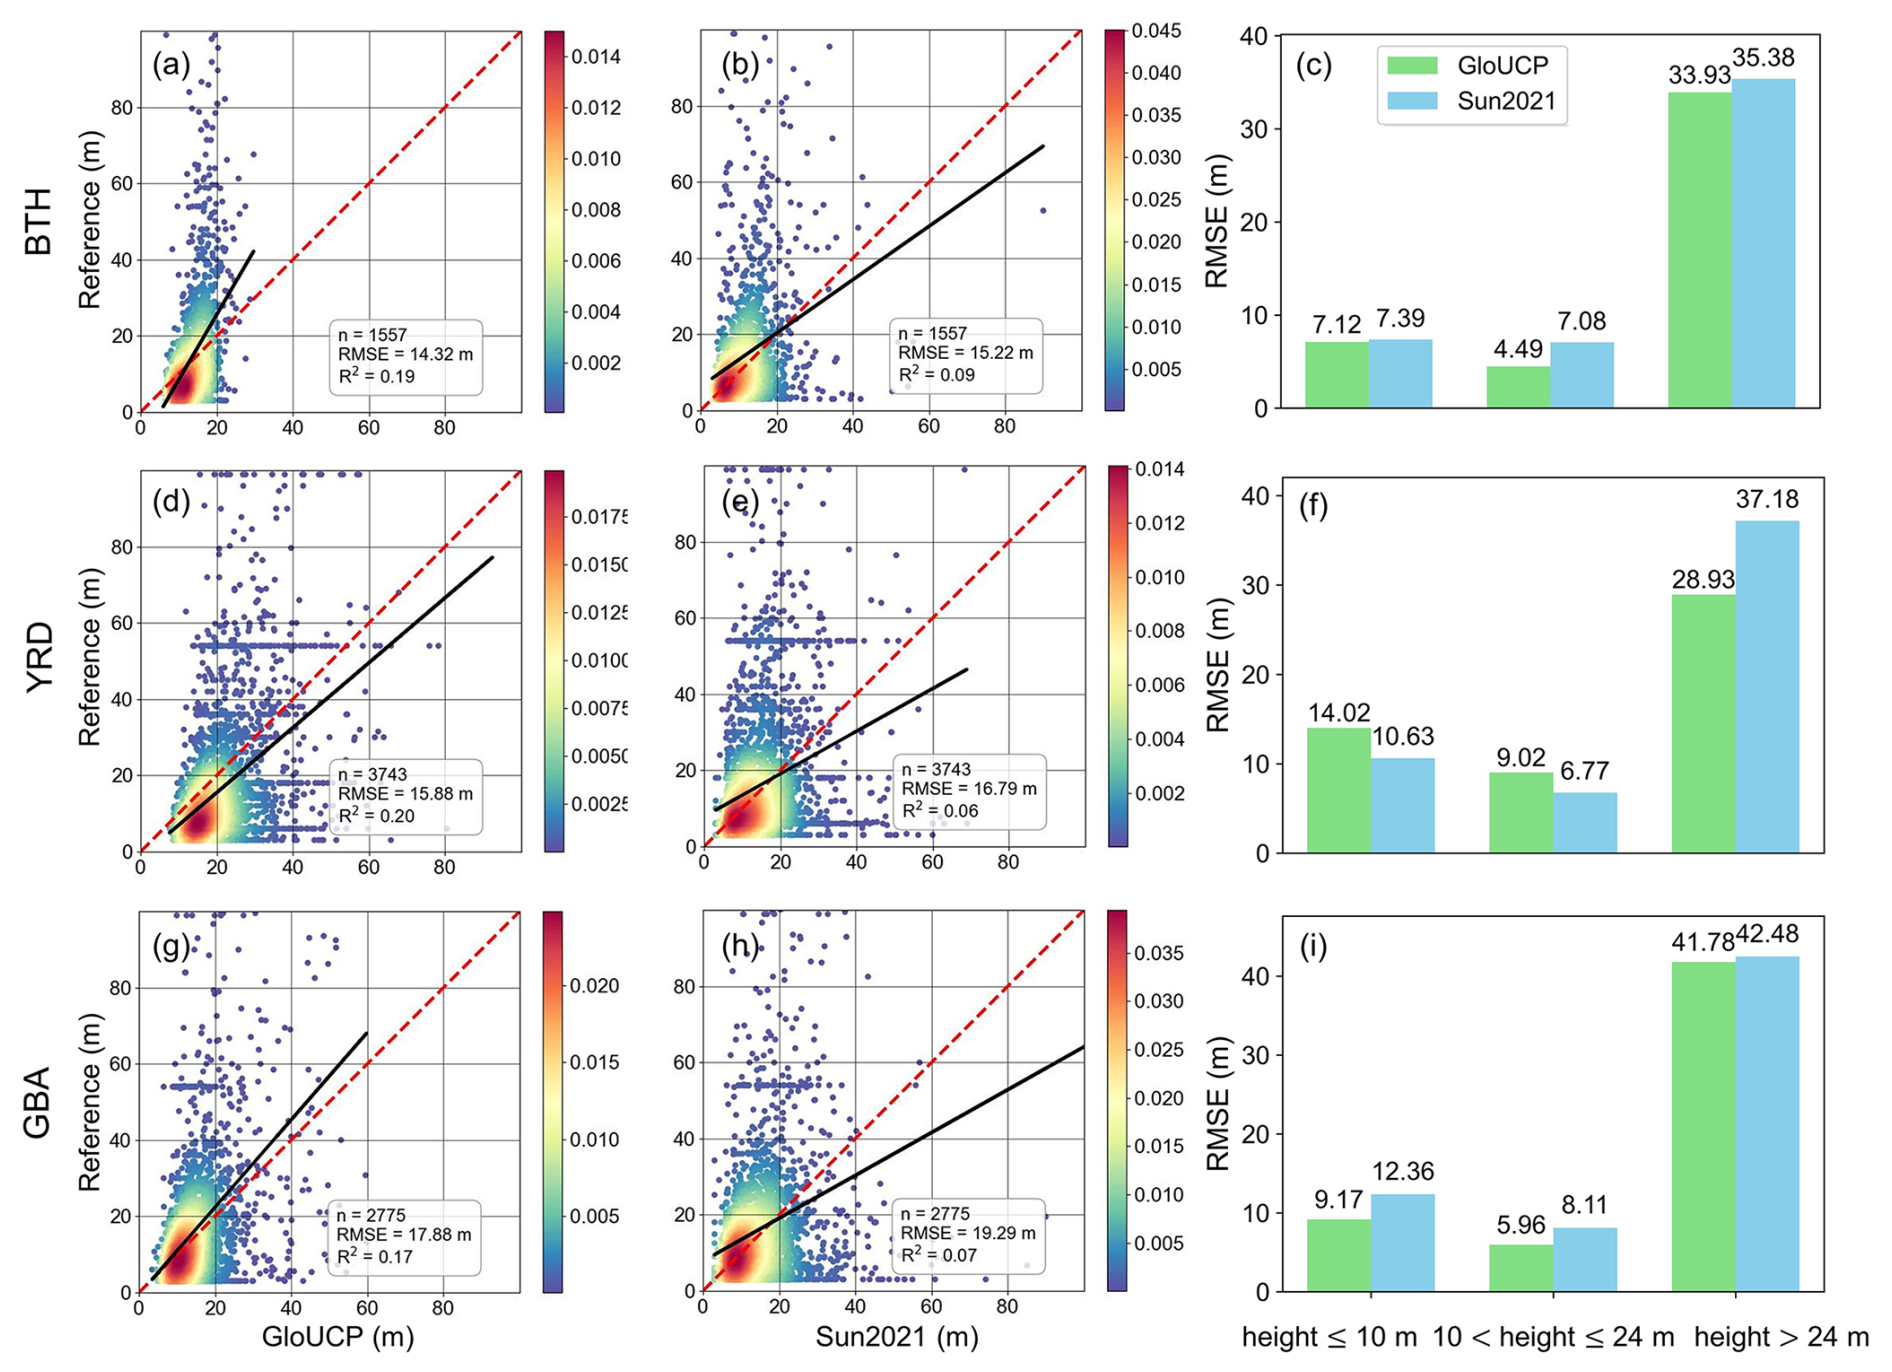
Figure 6Pixel-scale comparison of mean building heights in GloUCP, reference data, and Sun2021 across three major urban agglomerations in China. The dashed red line represents the 1:1 line, while the solid black line indicates the fitted regression line.
For the results in the United States, we used a building footprint dataset with height information released by Microsoft in 2017 as the reference data. Comparing this with the NUDAPT dataset, we found that GloUCP demonstrates a more comprehensive distribution of building heights across the three cities. GloUCP's coverage is more extensive, capturing a wider area and performing well in both lower and higher building heights, such as in the southern region of Philadelphia (Fig. 7). In contrast, the NUDAPT data are primarily concentrated in the city centers, with a more limited and concentrated height distribution that fails to cover a broader area. This limitation is particularly evident in Seattle and Philadelphia, where NUDAPT's spatial coverage is restricted.
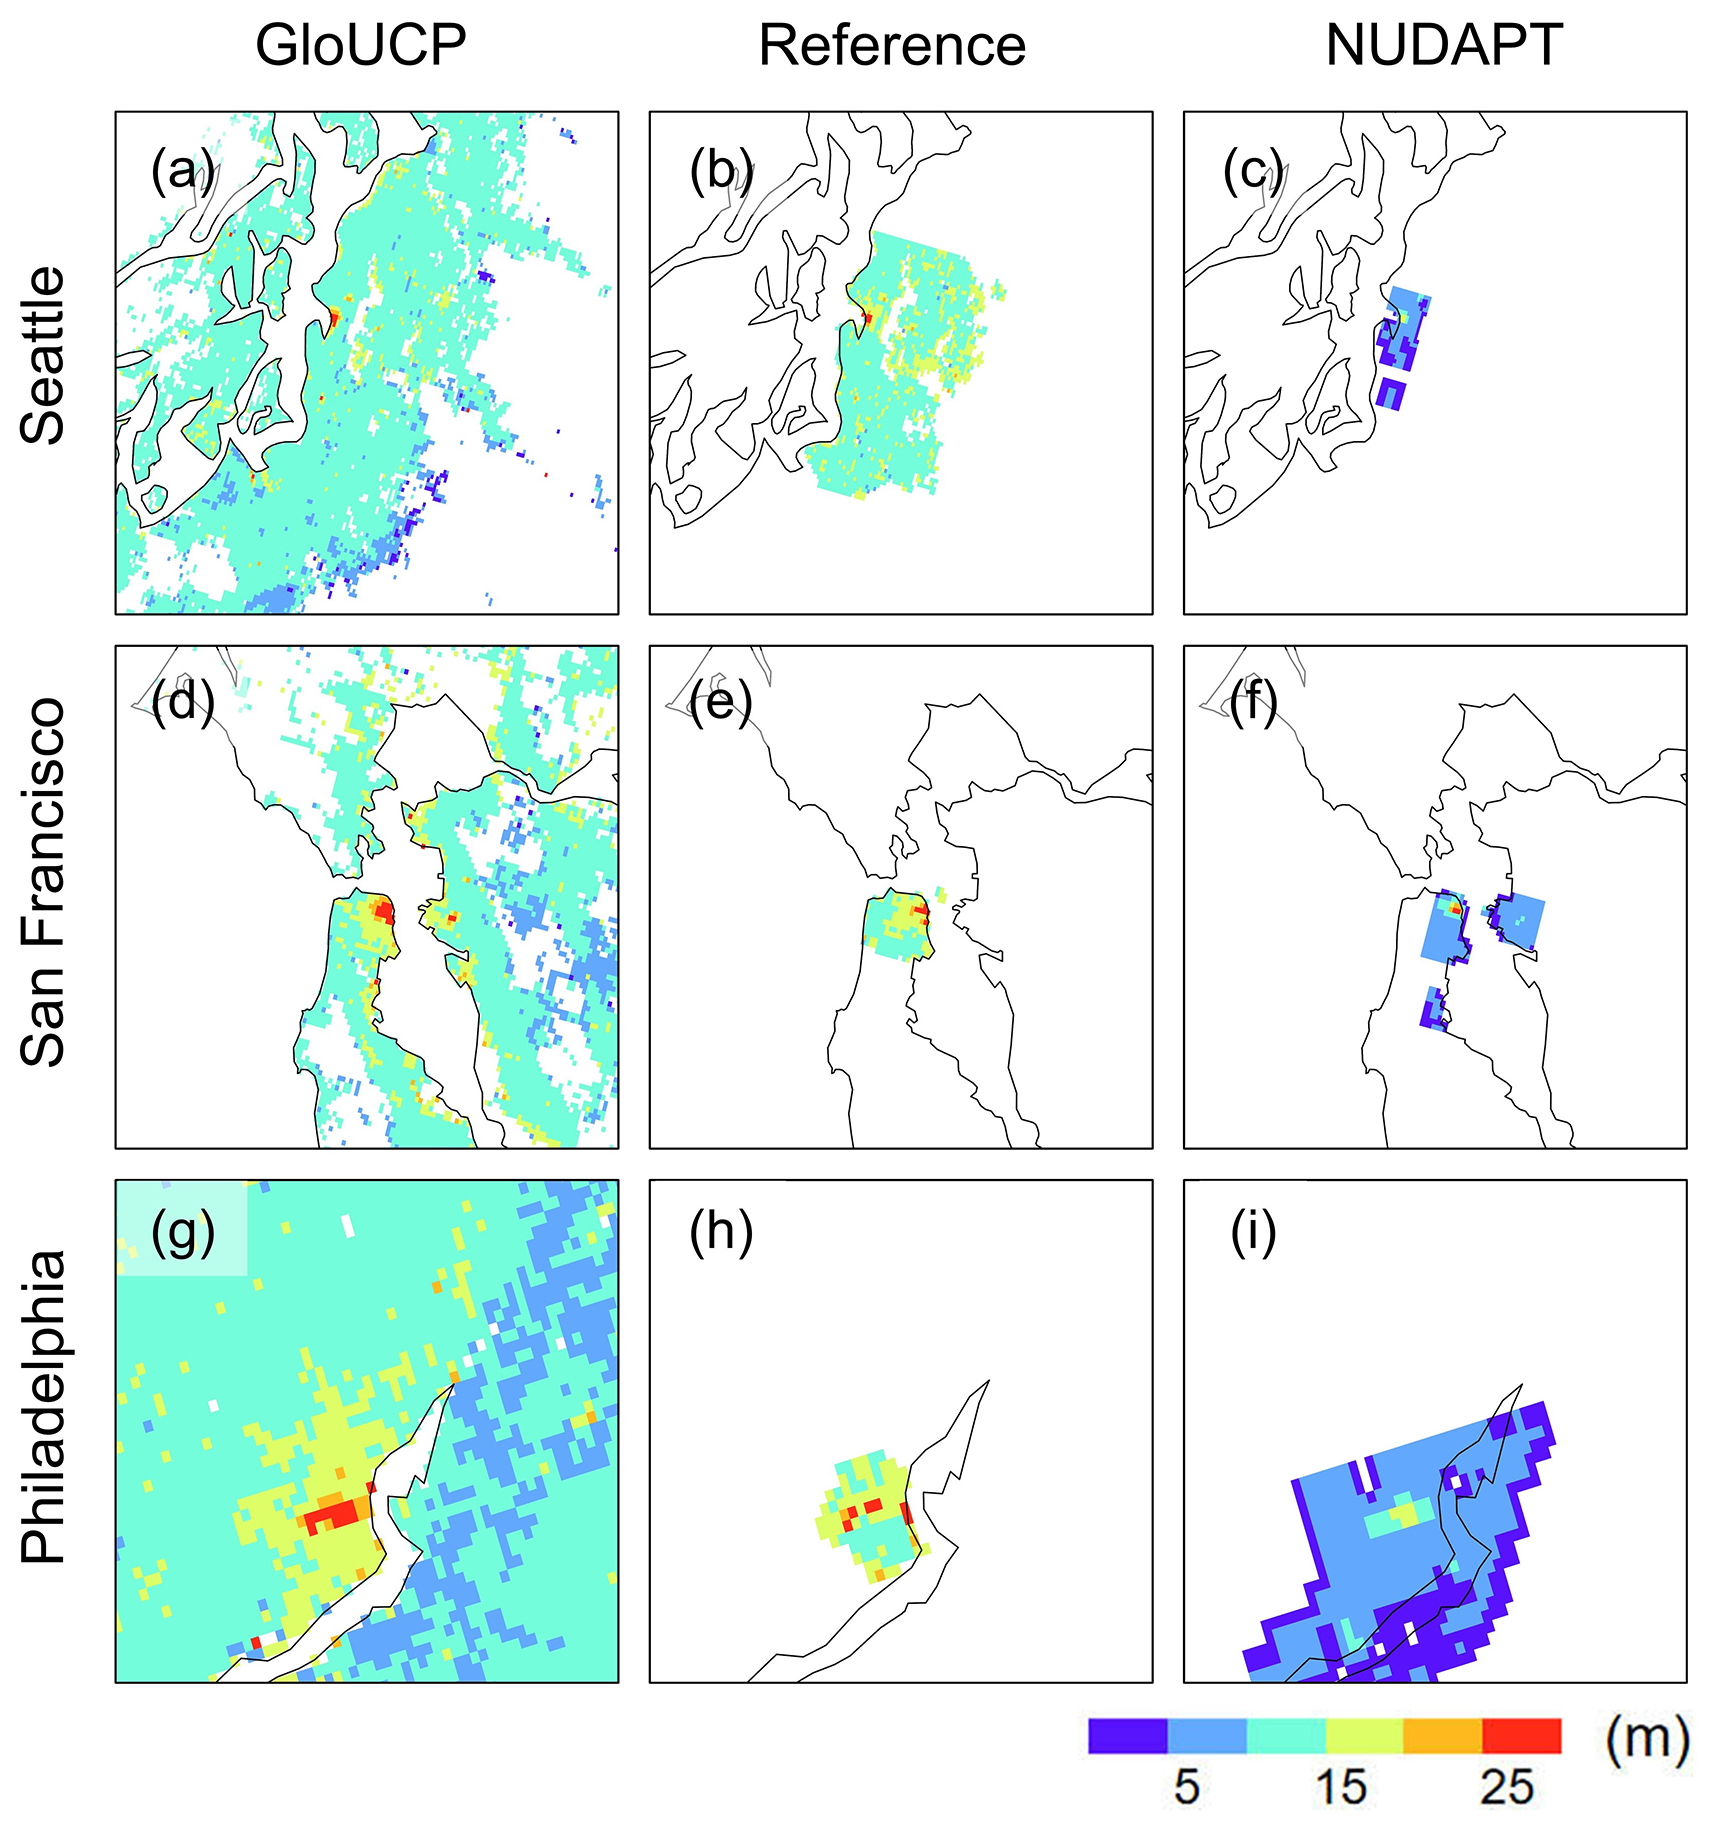
Figure 7Comparison of the spatial distribution of mean building heights in GloUCP, reference data, and NUDAPT across three representative cities in the United States.
In terms of building height consistency, GloUCP's R2 values in Seattle, San Francisco, and Philadelphia are 0.81, 0.83, and 0.52, respectively, which is comparable to or better than NUDAPT's values of 0.64, 0.73, and 0.39 (Fig. 8 and Table S2). When looking at RMSE, GloUCP's values for Seattle, San Francisco, and Philadelphia are 2.51, 4.73, and 5.50 m, respectively, which is lower than NUDAPT's 9.03, 8.57, and 8.50 m. This indicates better consistency between GloUCP and the reference data. Furthermore, across different building height intervals in all three cities, GloUCP consistently shows lower RMSE values than NUDAPT. This highlights GloUCP's superior performance in predicting building heights. Overall, GloUCP outperforms NUDAPT in the three United States cities, particularly in terms of spatial coverage and prediction accuracy of building heights. GloUCP is better at capturing variations in building heights both within and around urban areas, and its exceptional performance makes it highly valuable for urban modeling and climate simulations.
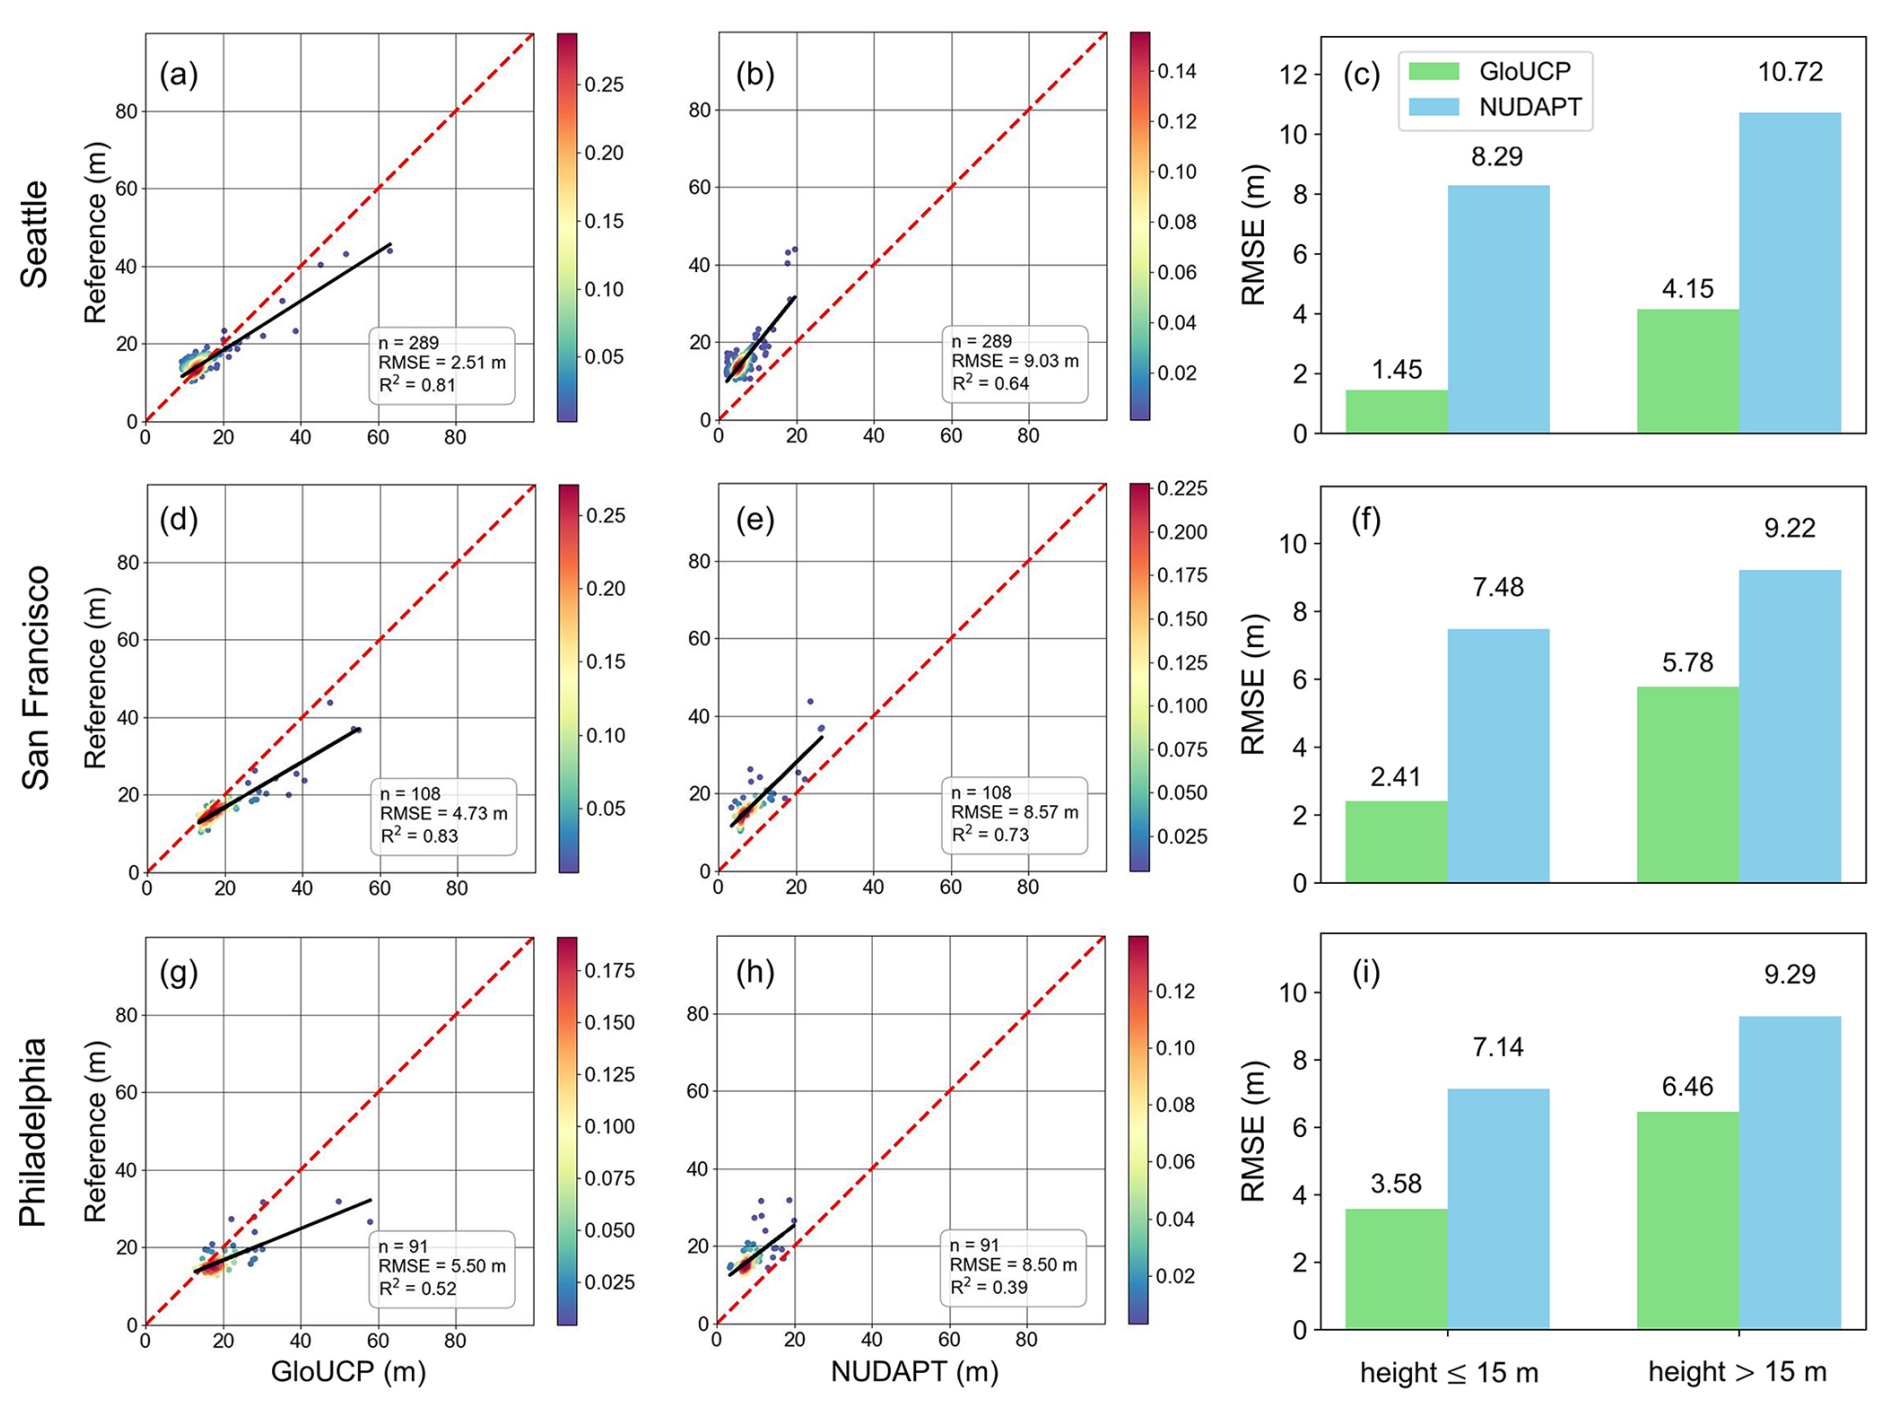
Figure 8Pixel-scale comparison of mean building heights in GloUCP, reference data and NUDAPT across three representative cities in the United States. The dashed red line represents the 1:1 line, while the solid black line indicates the fitted regression line.
Nevertheless, using Microsoft's data as reference does not necessarily imply that their height values are absolutely accurate. The heights in Microsoft's dataset were interpolated using a digital terrain model derived from very-high-resolution aerial photography, with building boundaries that were hand-digitized. NUDAPT's data were derived from lidar measurements, which are also highly accurate. However, it is important to note that the NUDAPT dataset was created using data from the year around 2009, whereas our dataset is based on data from around 2020, leading to a temporal discrepancy. As a result, there is some degree of uncertainty in these comparisons. When directly comparing the mean building heights between GloUCP and NUDAPT in these three cities, we find that GloUCP generally shows higher mean building heights than NUDAPT (Fig. S5). Additionally, the R2 values between GloUCP and NUDAPT for Seattle, San Francisco, and Philadelphia are 0.63, 0.87, and 0.70, respectively, indicating a strong level of consistency between our dataset and the NUDAPT data as well.
Furthermore, we compared our dataset with the recently released UT-GLOBUS dataset by Kamath et al. (2024) and the global urban morphological dataset developed by Khanh et al. (2023). Because the UT-GLOBUS dataset only provides three parameters (i.e., area-weighted mean building height, plan area fraction, and ratio of building surface to plan area), we conducted a comparison of these parameters in three cities in the United States (Figs. S56–S8). Overall, our GloUCP dataset and the UT-GLOBUS dataset exhibit similar levels of accuracy. Compared to the reference data, both datasets show relatively high estimation accuracy for most parameters except for an underestimation of the ratio of building surface to plan area. On average, the R2 values for our GloUCP dataset across the three cities are generally above 0.8, slightly outperforming the UT-GLOBUS dataset. Nevertheless, our dataset offers more comprehensive spatial coverage of global urban areas, particularly in east Asia. This broader coverage provides greater support for urban climate simulations, especially for small and medium-sized cities worldwide.
For the global urban morphological dataset developed by Khanh et al. (2023), we used their UCPs estimated based on GDP and population density information for 2010 (hereafter referred to as Khanh2010) to compare it with our data from the representative regions in China and the United States, respectively. Generally, the spatial coverage of our GloUCP dataset is still larger than that of Khanh2010 (Figs. S9 and S10). In China, compared to the reference data, the Khanh2010 dataset performs well in capturing low- to mid-rise buildings but significantly underestimates the height of high-rise buildings (Fig. S11). However, this issue is not as prominent in United States cities, where the accuracy of our GloUCP dataset and Khanh2010 is relatively similar, with our dataset performing slightly better across different building height categories (Fig. S12). This discrepancy in reproducibility between Chinese and United States cities may be attributed to differences in data sources (including the reference year) and estimation methods used in Khanh2010 and this study. Since Khanh2010 is based on data from 2010, it may not fully capture the rapid urban expansion and the widespread construction of high-rise buildings that occurred in China after 2010. In contrast, our dataset, derived from more recent data sources, better reflects contemporary urban morphology. Additionally, differences in estimation approaches – Khanh2010 relies on GDP and population density-based empirical models, while our dataset is constructed using building-scale vector data – could also contribute to these variations. Overall, while the Khanh2010 dataset already offers better spatial coverage than most existing datasets, our GloUCP dataset provides even more comprehensive coverage. In China, the accuracy of most datasets remains suboptimal, but our dataset slightly outperforms others, particularly in representing high-rise buildings.
3.3 Comparison with the default UCPs in the WRF model
To thoroughly assess the applicability of the dataset constructed in this study for WRF simulations, we compared it with the default UCPs currently widely used in the WRF model. To reflect the impact of urban three-dimensional structures on meteorological processes, the prevailing approach in WRF simulations is to further subdivide urban land cover into three categories, i.e., low-density residential areas, high-density residential areas, and commercial areas, each assigned a fixed UCP value. Specifically, low-density residential areas have an impervious surface ratio of less than 50 %, corresponding to a building height of 5 m; high-density residential areas have an impervious surface ratio between 50 % and 80 %, with a building height of 7.5 m; and industrial/commercial areas have an impervious surface ratio greater than 80 %, with a building height of 10 m. We extracted the default mean building height data from the WRF model and compared it with our GloUCP dataset to analyze the differences in data characteristics and spatial distribution.
Figure 9 compares the default mean building height in the WRF model with its distribution in GloUCP. Overall, the default height significantly underestimates building heights in various urban regions. Whether in the three major urban agglomerations in China or the three representative cities in the United States, many buildings in city centers reach heights of 10 m or even over 20 m, which the default data fail to capture, particularly in the case of high-rise buildings.
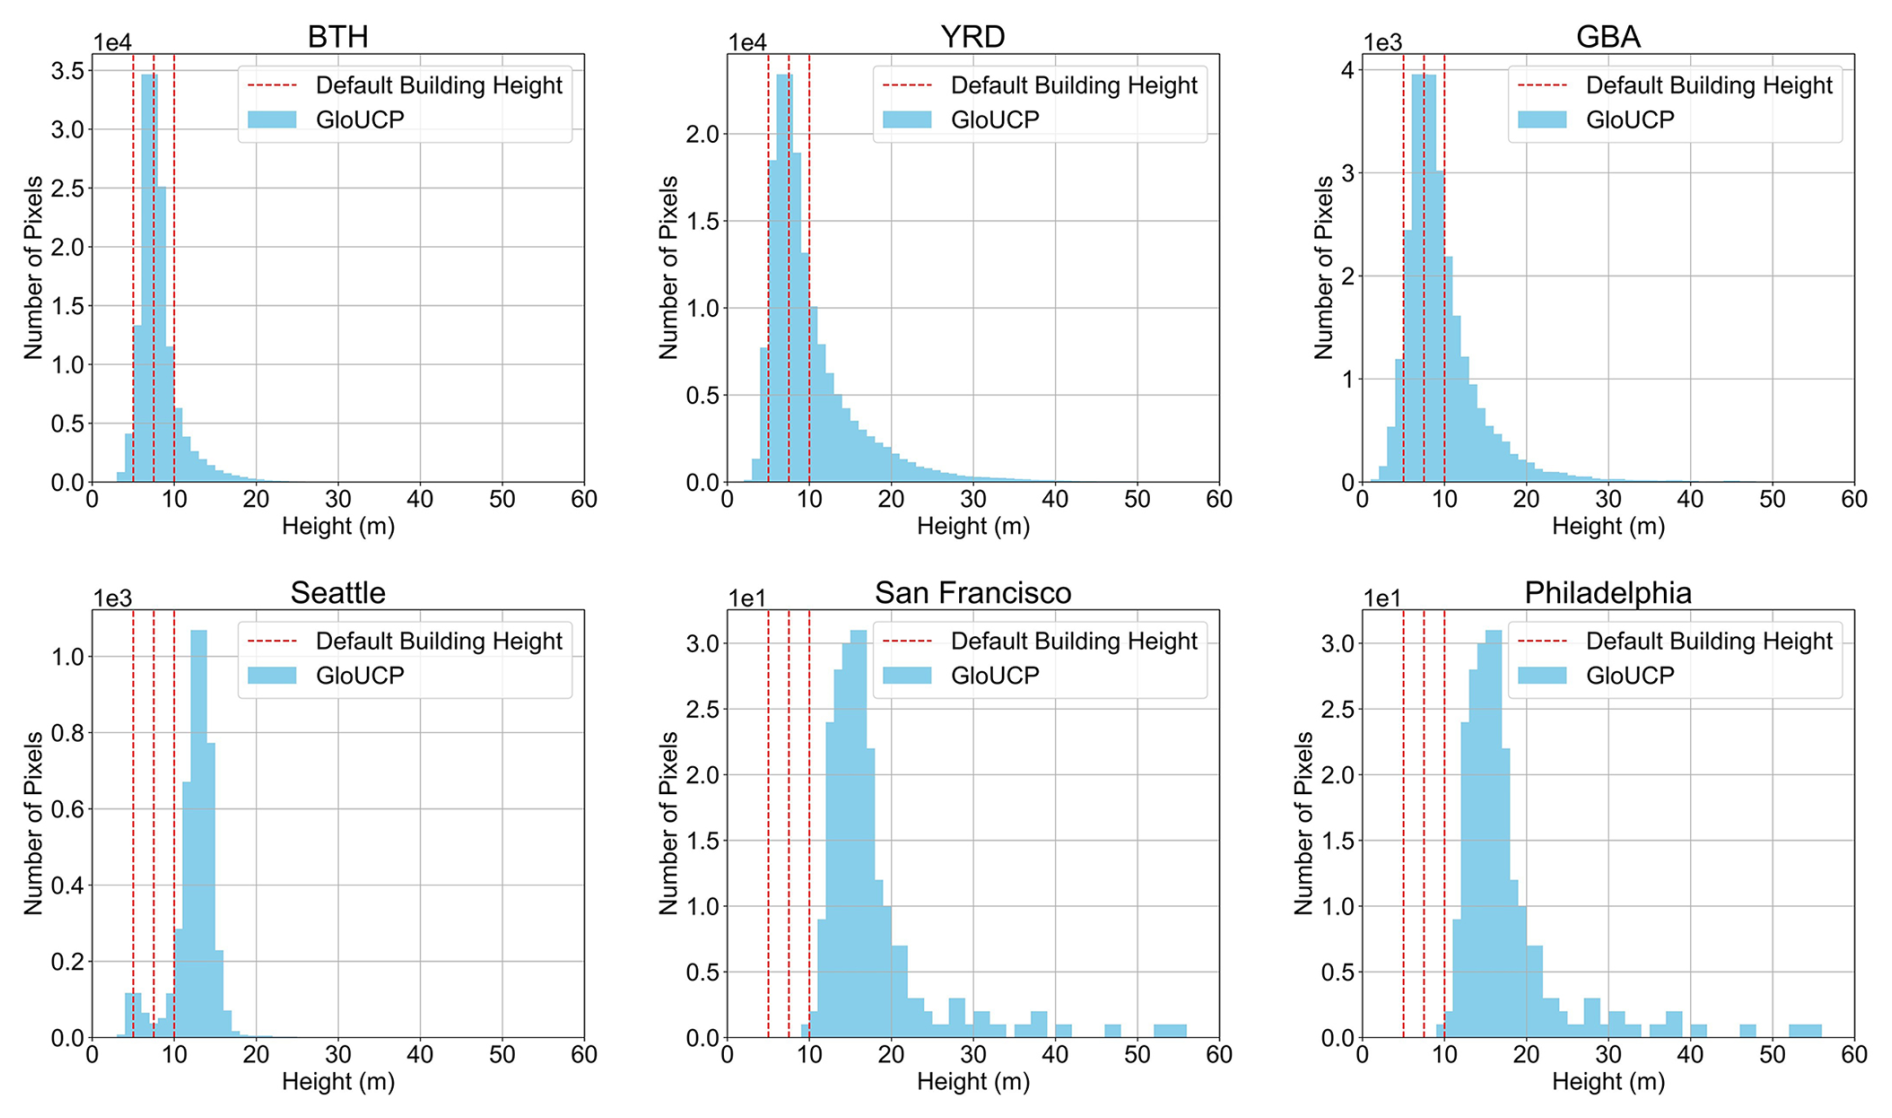
Figure 9Distribution of mean building height in three major urban agglomerations in China and three representative cities in the United States. The dashed red lines denote low-density residential areas with a default building height of 5 m, high-density residential areas with a default building height of 7.5 m, and industrial/commercial areas with a default building height of 10 m, respectively.
Figures 10 and 11 illustrate the spatial distribution of mean building heights in GloUCP and the default values in the WRF model across three major urban agglomerations in China and three representative cities in the United States, respectively. From a spatial distribution perspective, the default dataset can to some extent reflect the higher building heights in city center areas, but its height values are generally lower than those calculated by the GloUCP dataset. Moreover, GloUCP exhibits significantly greater spatial heterogeneity, providing a more detailed and accurate depiction of building height variations within the study areas.
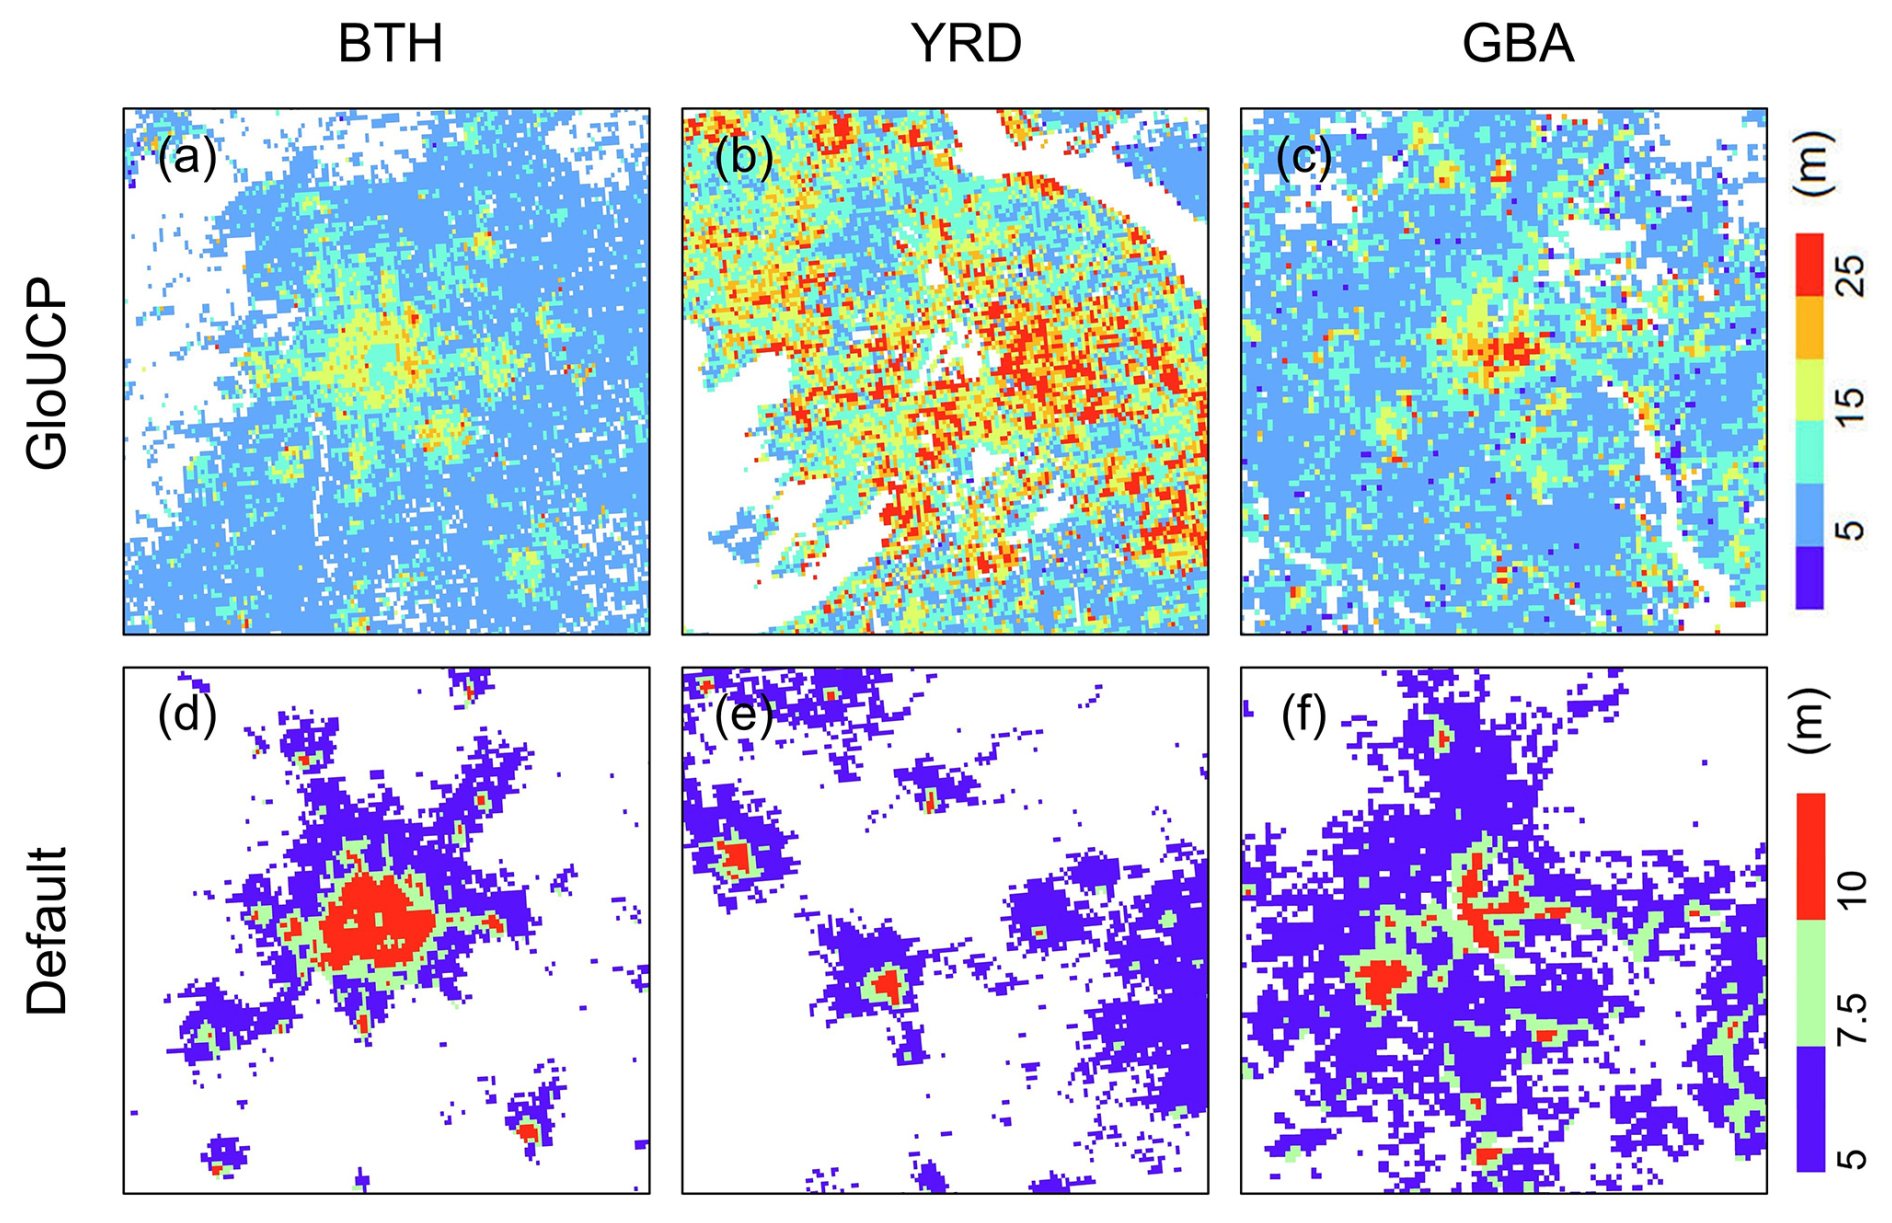
Figure 10Comparison of the spatial distribution of mean building heights in GloUCP and default values in the WRF model across three major urban agglomerations in China.
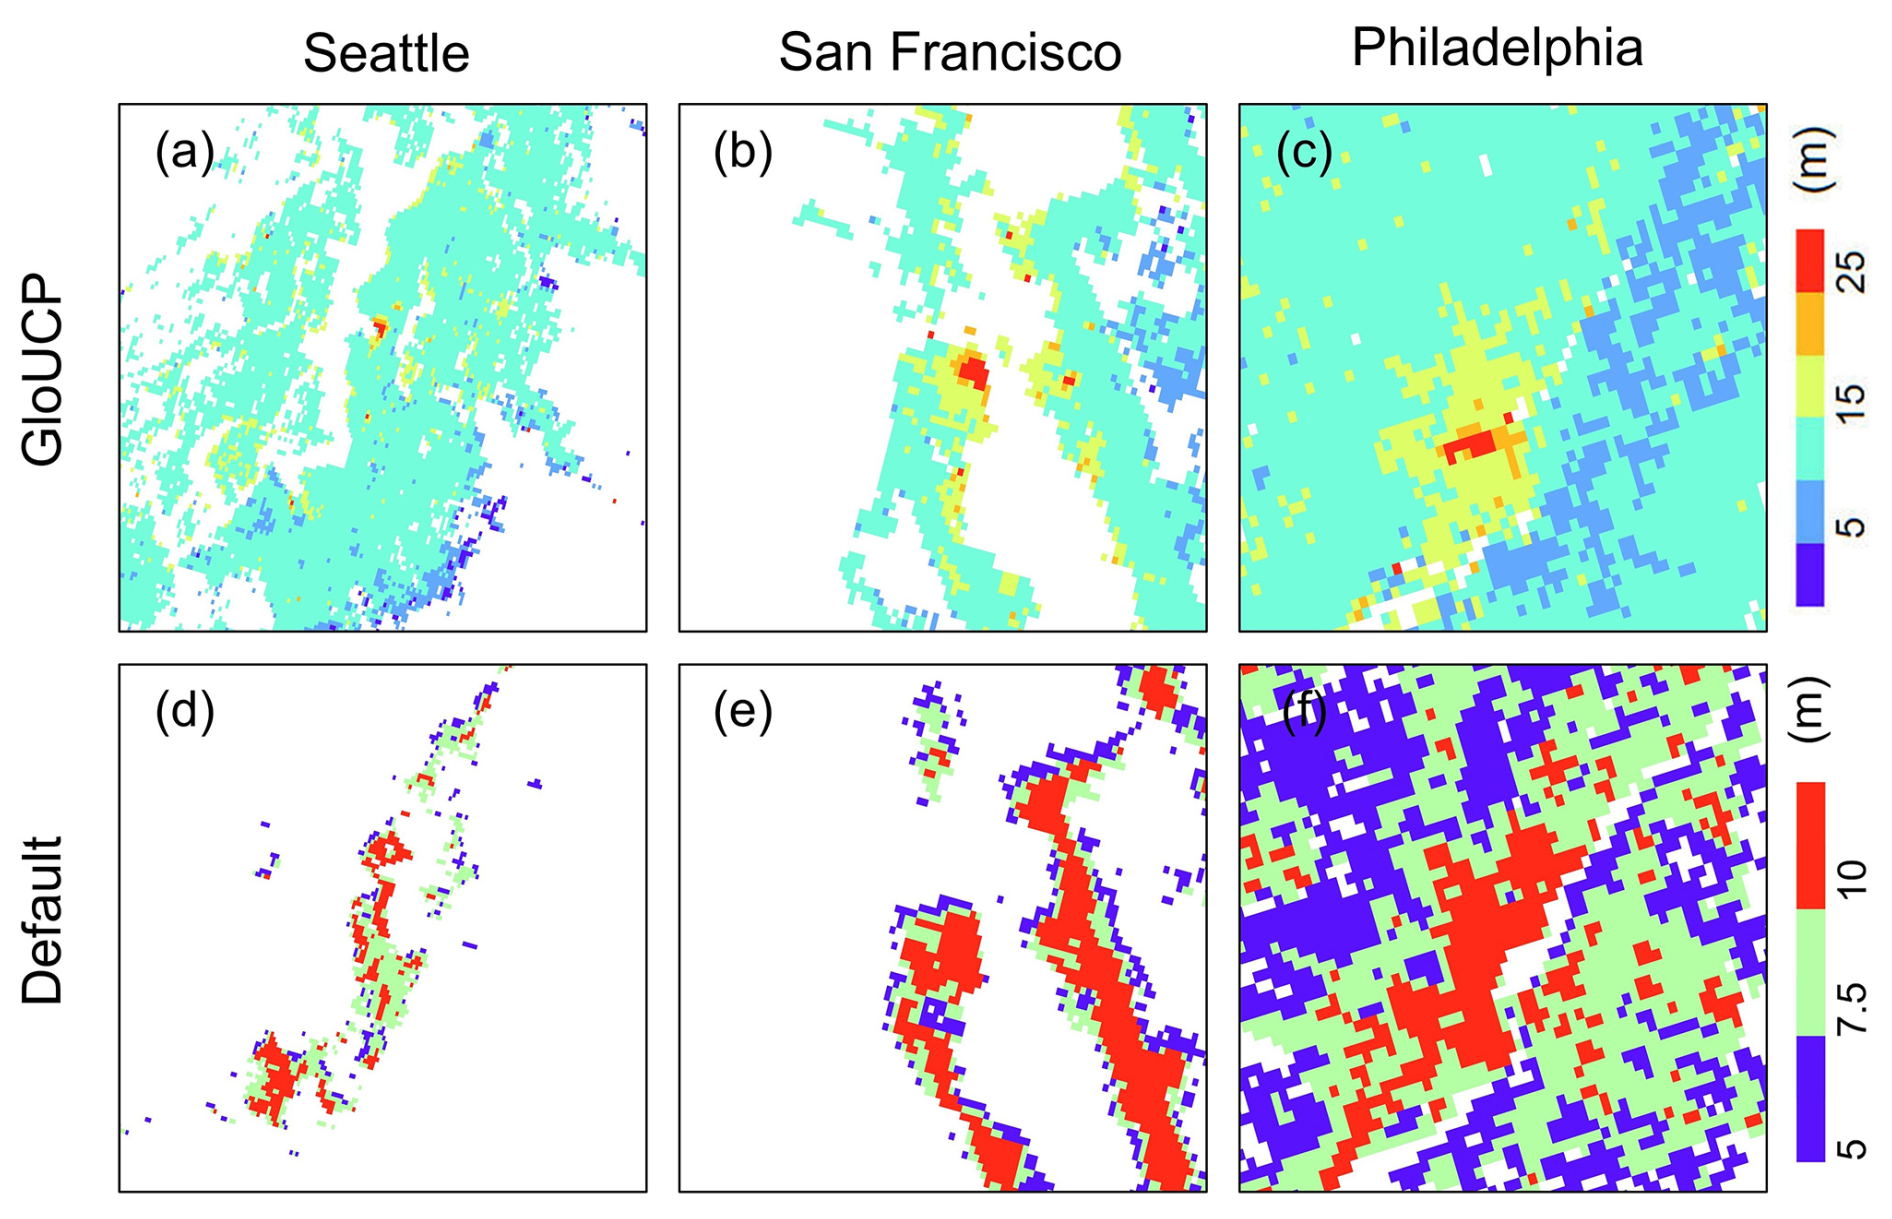
Figure 11Comparison of the spatial distribution of mean building heights in GloUCP and default values in the WRF model across three representative cities in the United States.
The primary purpose of GloUCP is to provide a global 1 km spatially continuous UCPs for three types of UCMs (i.e., SLUCM, BEP, and BEP-BEM) in the WRF model. The uncertainties in GloUCP data primarily originate from the 3D-GloBFP dataset, which is generated from multi-source datasets that integrate information with varying spatiotemporal coverage. Additionally, in regions with limited building height samples (e.g., Africa), the accuracy of building height estimation remains relatively low. Therefore, as the accuracy of the 3D-GloBFP dataset improves, the precision of the GloUCP dataset can also be further enhanced.
Considering computational and storage costs, this study only provides UCPs at a global scale with a 1 km resolution. However, based on building vector data, UCP datasets at any spatial resolution can be generated. When regional climate simulations require a higher spatial resolution, the resolution of UCP calculations can be adjusted to meet the needs of high-resolution climate modeling. It is important to acknowledge these limitations and uncertainties when using GloUCP data for modeling and analysis. Despite these limitations, GloUCP provides globally comprehensive urban canopy parameters, supporting detailed urban climate simulations on a global scale.
The 1 km GloUCP dataset which is stored in WRF binary file format is publicly available on figshare: https://doi.org/10.6084/m9.figshare.27011491 (Liao et al., 2025).
UCPs play a critical role in urban climate modeling as they significantly influence the accuracy of simulations that are essential for understanding the impacts of urbanization on local and regional climates. Despite the importance of UCPs, publicly available datasets for the WRF model are currently limited, covering only 44 cities in the United States and 60 in China. Although several global UCP datasets have been released in recent years, they still have limitations in terms of spatial coverage and accuracy. These limitations underscore the need for more comprehensive and globally applicable UCP datasets.
In this study, we developed a global 1 km spatially continuous UCP dataset – GloUCP, utilizing the latest available building-level information for 2020. It can be applied to all three types of UCMs (i.e., SLUCM, BEP, and BEP-BEM) in the WRF model. The GloUCP dataset has proven to be highly effective and accurate in capturing UCPs across various regions, including highly urbanized areas in China and key metropolitan areas in the United States. Through extensive comparisons with existing datasets, such as Sun2021 in China, NUDAPT in the United States, UT-GLOBUS developed by Kamath et al. (2024), and global UCP developed by Khanh et al. (2023), GloUCP has demonstrated superior spatial coverage and improved precision in predicting building heights. These attributes make GloUCP a comprehensive and reliable dataset for global urban canopy parameterization, offering significant advancements over existing datasets.
The extensive coverage and high-resolution data provided by GloUCP are invaluable for researchers and urban planners aiming to enhance the accuracy of urban climate simulations. Such improvements are crucial for better understanding the impacts of urbanization on local and regional climates. Previous studies have already confirmed that using accurate UCP parameters can enhance the precision of urban climate simulations. However, the primary objective of this study is not to quantify the extent to which fine-scale and spatially complete UCPs improve simulation accuracy through case studies. Instead, our goal is to provide a globally complete and high-resolution UCP dataset that can serve as a foundational tool for future urban climate modeling research. We hope that subsequent studies will further explore the potential of this dataset to enhance urban climate simulations and contribute to more informed decision-making in urban planning and climate mitigation efforts.
The supplement related to this article is available online at https://doi.org/10.5194/essd-17-2535-2025-supplement.
WL and XL designed the research. YL, YW, and YC performed the experiments and organized the dataset. WL and YL wrote the original manuscript. All authors reviewed and revised the manuscript.
The contact author has declared that none of the authors has any competing interests.
Publisher's note: Copernicus Publications remains neutral with regard to jurisdictional claims made in the text, published maps, institutional affiliations, or any other geographical representation in this paper. While Copernicus Publications makes every effort to include appropriate place names, the final responsibility lies with the authors.
We gratefully acknowledge the creation and provision of the Building Footprint and Height dataset by Microsoft and Baidu Map.
This study was supported by the National Natural Science Foundation of China (grant nos. U2342227 and 42271419), National Science Fund for Distinguished Young Scholars (grant no. 42225107), Fundamental Research Funds for the Central Universities of Sun Yat-sen University (grant no. 23lgbj014), Young Talent Support Project of Guangzhou Association for Science and Technology (grant no. QT-2023-010), and Science and Technology Projects in Guangzhou (grant no. 2023A04J1515).
This paper was edited by Yuhan (Douglas) Rao and reviewed by two anonymous referees.
Best, M. J. and Grimmond, C. S. B.: Key Conclusions of the First International Urban Land Surface Model Comparison Project, B. Am. Meteorol. Soc., 96, 805–819, https://doi.org/10.1175/BAMS-D-14-00122.1, 2015.
Che, Y., Li, X., Liu, X., Wang, Y., Liao, W., Zheng, X., Zhang, X., Xu, X., Shi, Q., Zhu, J., Zhang, H., Yuan, H., and Dai, Y.: 3D-GloBFP: the first global three-dimensional building footprint dataset, Earth Syst. Sci. Data, 16, 5357–5374, https://doi.org/10.5194/essd-16-5357-2024, 2024.
Chen, F., Kusaka, H., Bornstein, R., Ching, J., Grimmond, C. S. B., Grossman-Clarke, S., Loridan, T., Manning, K. W., Martilli, A., Miao, S., Sailor, D., Salamanca, F. P., Taha, H., Tewari, M., Wang, X., Wyszogrodzki, A. A., and Zhang, C.: The integrated WRF/urban modelling system: development, evaluation, and applications to urban environmental problems, Int. J. Climatol., 31, 273–288, https://doi.org/10.1002/joc.2158, 2011.
Cheng, Y., Zhao, L., Chakraborty, T., Oleson, K., Demuzere, M., Liu, X., Che, Y., Liao, W., Zhou, Y., and Li, X.: U-Surf: a global 1 km spatially continuous urban surface property dataset for kilometer-scale urban-resolving Earth system modeling, Earth Syst. Sci. Data, 17, 2147–2174, https://doi.org/10.5194/essd-17-2147-2025, 2025.
Ching, J., Brown, M., Burian, S., Chen, F., Cionco, R., Hanna, A., Hultgren, T., McPherson, T., Sailor, D., Taha, H., and Williams, D.: National Urban Database and Access Portal Tool, B. Am. Meteorol. Soc., 90, 1157-1168, https://doi.org/10.1175/2009BAMS2675.1, 2009.
Dai, J., Wang, X., Dai, W., and Chang, M.: The impact of inhomogeneous urban canopy parameters on meteorological conditions and implication for air quality in the Pearl River Delta region, Urban Clim., 29, 100494, https://doi.org/10.1016/j.uclim.2019.100494, 2019.
Demuzere, M., Kittner, J., Martilli, A., Mills, G., Moede, C., Stewart, I. D., van Vliet, J., and Bechtel, B.: A global map of local climate zones to support earth system modelling and urban-scale environmental science, Earth Syst. Sci. Data, 14, 3835–3873, https://doi.org/10.5194/essd-14-3835-2022, 2022.
Demuzere, M., He, C., Martilli, A., and Zonato, A.: Technical documentation for the hybrid 100-m global land cover dataset with Local Climate Zones for WRF, Zenodo [data set], https://doi.org/10.5281/zenodo.7670792, 2023.
Deng, Z., Wang, Z., Wu, X., Lai, C., and Liu, W.: Effect difference of climate change and urbanization on extreme precipitation over the Guangdong-Hong Kong-Macao Greater Bay Area, Atmos. Res., 282, 106514, https://doi.org/10.1016/j.atmosres.2022.106514, 2023.
Esch, T., Brzoska, E., Dech, S., Leutner, B., Palacios-Lopez, D., Metz-Marconcini, A., Marconcini, M., Roth, A., and Zeidler, J.: World Settlement Footprint 3D – A first three-dimensional survey of the global building stock, Remote Sens. Environ., 270, 112877, https://doi.org/10.1016/j.rse.2021.112877, 2022.
Gong, P., Li, X., Wang, J., Bai, Y., Chen, B., Hu, T., Liu, X., Xu, B., Yang, J., Zhang, W., and Zhou, Y.: Annual maps of global artificial impervious area (GAIA) between 1985 and 2018, Remote Sens. Environ., 236, 111510, https://doi.org/10.1016/j.rse.2019.111510, 2020.
He, X., Li, Y., Wang, X., Chen, L., Yu, B., Zhang, Y., and Miao, S.: High-resolution dataset of urban canopy parameters for Beijing and its application to the integrated WRF/Urban modelling system, J. Clean. Product., 208, 373–383, https://doi.org/10.1016/j.jclepro.2018.10.086, 2019.
Herfort, B., Lautenbach, S., Porto de Albuquerque, J., Anderson, J., and Zipf, A.: A spatio-temporal analysis investigating completeness and inequalities of global urban building data in OpenStreetMap, Nat. Commun., 14, 3985, https://doi.org/10.1038/s41467-023-39698-6, 2023.
Jackson, T. L., Feddema, J. J., Oleson, K. W., Bonan, G. B., and Bauer, J. T.: Parameterization of Urban Characteristics for Global Climate Modeling, Ann. Assoc. Am. Geogr., 100, 848–865, https://doi.org/10.1080/00045608.2010.497328, 2010.
Kamath, H. G., Singh, M., Malviya, N., Martilli, A., He, L., Aliaga, D., He, C., Chen, F., Magruder, L. A., Yang, Z.-L., and Niyogi, D.: GLObal Building heights for Urban Studies (UT-GLOBUS) for city- and street- scale urban simulations: Development and first applications, Sci. Data, 11, 886, https://doi.org/10.1038/s41597-024-03719-w, 2024.
Khanh, D. N., Varquez, A. C. G., and Kanda, M.: Impact of urbanization on exposure to extreme warming in megacities, Heliyon, 9, e15511, https://doi.org/10.1016/j.heliyon.2023.e15511, 2023.
Li, H., Liu, Y., Zhang, H., Xue, B., and Li, W.: Urban morphology in China: Dataset development and spatial pattern characterization, Sustain. Cities Soc., 71, 102981, https://doi.org/10.1016/j.scs.2021.102981, 2021a.
Li, L., Bisht, G., Hao, D., and Leung, L. R.: Global 1 km land surface parameters for kilometer-scale Earth system modeling, Earth Syst. Sci. Data, 16, 2007–2032, https://doi.org/10.5194/essd-16-2007-2024, 2024.
Li, M., Koks, E., Taubenböck, H., and van Vliet, J.: Continental-scale mapping and analysis of 3D building structure, Remote Sens. Environ., 245, 111859, https://doi.org/10.1016/j.rse.2020.111859, 2020.
Li, M., Wang, Y., Rosier, J. F., Verburg, P. H., and van Vliet, J.: Global maps of 3D built-up patterns for urban morphological analysis, Int. J. Appl. Earth Obs. Geoinf., 114, 103048, https://doi.org/10.1016/j.jag.2022.103048, 2022.
Li, Y., Wang, W., Chang, M., and Wang, X.: Impacts of urbanization on extreme precipitation in the Guangdong-Hong Kong-Macau Greater Bay Area, Urban Clim., 38, 100904, https://doi.org/10.1016/j.uclim.2021.100904, 2021b.
Liao, J., Wang, T., Wang, X., Xie, M., Jiang, Z., Huang, X., and Zhu, J.: Impacts of different urban canopy schemes in WRF/Chem on regional climate and air quality in Yangtze River Delta, China, Atmos. Res., 145–146, 226–243, https://doi.org/10.1016/j.atmosres.2014.04.005, 2014.
Liao, J., Wang, T., Jiang, Z., Zhuang, B., Xie, M., Yin, C., Wang, X., Zhu, J., Fu, Y., and Zhang, Y.: WRF/Chem modeling of the impacts of urban expansion on regional climate and air pollutants in Yangtze River Delta, China, Atmos. Environ., 106, 204-214, https://doi.org/10.1016/j.atmosenv.2015.01.059, 2015.
Liao, W., Li, Y., Liu, X., Wang, Y., Che, Y., Shao, L., Chen, G., Yuan, H., Zhang, N., and Chen, F.: GloUCP: A global 1 km spatially continuous urban canopy parameters for the WRF model, figshare [data set], https://doi.org/10.6084/m9.figshare.27011491.v1, 2025.
Liu, X., Huang, Y., Xu, X., Li, X., Li, X., Ciais, P., Lin, P., Gong, K., Ziegler, A. D., Chen, A., Gong, P., Chen, J., Hu, G., Chen, Y., Wang, S., Wu, Q., Huang, K., Estes, L., and Zeng, Z.: High-spatiotemporal-resolution mapping of global urban change from 1985 to 2015, Nat. Sustainabil., 3, 564–570, https://doi.org/10.1038/s41893-020-0521-x, 2020.
Miao, S., Li, P., and Wang, X.: Building morphological characteristics and their effect on the wind in Beijing, Adv. Atmos. Sci., 26, 1115–1124, https://doi.org/10.1007/s00376-009-7223-7, 2009.
Oleson, K. W. and Feddema, J.: Parameterization and Surface Data Improvements and New Capabilities for the Community Land Model Urban (CLMU), J. Adv. Model. Earth Syst., 12, e2018MS001586, https://doi.org/10.1029/2018MS001586, 2020.
Oleson, K. W., Bonan, G. B., Feddema, J., and Jackson, T.: An examination of urban heat island characteristics in a global climate model, Int. J. Climatol., 31, 1848–1865, https://doi.org/10.1002/joc.2201, 2011.
Shen, C., Chen, X., Dai, W., Li, X., Wu, J., Fan, Q., Wang, X., Zhu, L., Chan, P., Hang, J., Fan, S., and Li, W.: Impacts of High-Resolution Urban Canopy Parameters within the WRF Model on Dynamical and Thermal Fields over Guangzhou, China, J. Appl. Meteorol. Clim., 58, 1155–1176, https://doi.org/10.1175/JAMC-D-18-0114.1, 2019.
Shi, Q., Zhu, J., Liu, Z., Guo, H., Gao, S., Liu, M., Liu, Z., and Liu, X.: The Last Puzzle of Global Building Footprints – Mapping 280 Million Buildings in East Asia Based on VHR Images, J. Remote Sens., 4, 0138, https://doi.org/10.34133/remotesensing.0138, 2024.
Stewart, I. D. and Oke, T. R.: Local Climate Zones for Urban Temperature Studies, B. Am. Meteorol. Soc., 93, 1879–1900, https://doi.org/10.1175/bams-d-11-00019.1, 2012.
Sun, Y., Zhang, N., Miao, S., Kong, F., Zhang, Y., and Li, N.: Urban Morphological Parameters of the Main Cities in China and Their Application in the WRF Model, J. Adv. Model. Earth Syst., 13, e2020MS002382, https://doi.org/10.1029/2020MS002382, 2021.
Wang, L. and Li, D.: Modulation of the urban boundary-layer heat budget by a heatwave, Q. J. Roy. Meteorol. Soc., 145, 1814–1831, https://doi.org/10.1002/qj.3526, 2019.
Zhao, L., Oleson, K., Bou-Zeid, E., Krayenhoff, E. S., Bray, A., Zhu, Q., Zheng, Z., Chen, C., and Oppenheimer, M.: Global multi-model projections of local urban climates, Nat. Clim. Change, 11, 1–6, https://doi.org/10.1038/s41558-020-00958-8, 2021.