the Creative Commons Attribution 4.0 License.
the Creative Commons Attribution 4.0 License.
 | 08 May 2025
The Earth Topography 2022 (ETOPO 2022) global DEM dataset
Michael MacFerrin
Christopher Amante
Kelly Carignan
Matthew Love
Elliot Lim
Here we present Earth TOPOgraphy (ETOPO) 2022, the latest iteration of NOAA's global seamless topographic–bathymetric dataset. ETOPO1, NOAA's prior release at 1 arcmin resolution, has been a widely used benchmark global digital elevation model (DEM) since its initial release in 2009 (Amante and Eakins, 2009). Tsunami forecasting, modeling, and warning systems critically rely upon accurate topographic and bathymetric data to predict and reproduce water movement across global ocean surfaces, wave heights at the coastline, and subsequent land inundation. ETOPO 2022 is an updated topographic–bathymetric dataset at 15 arcsec global resolution that incorporates bare-Earth datasets with forests and buildings removed. ETOPO 2022 integrates more than a dozen source datasets for land topography, sea bathymetry, lake bathymetry, and ice-sheet bed elevation data, all of which have been carefully evaluated for quality, accuracy, and seamless integration. We evaluate the relative and absolute vertical accuracies of all land-elevation input datasets, as well as the final ETOPO 2022 tiles, using a geographically optimized, independent database of bare-Earth elevation photons from NASA's ICESat-2 satellite mission over the calendar year 2021. Measured against more than 960 billion lidar measurements from ICESat-2 that span nearly the entire globe, ETOPO 2022 measures a global RMSE of 7.17 m. ETOPO 2022 is publicly available in both ice surface and bedrock versions that portray either the top layer of the ice sheets covering Greenland and Antarctica or the bedrock below, and both versions are also available in GeoTIFF and NetCDF formats in 15×15° tiles, as well as global tiles at 30 and 60 arcsec resolutions. ETOPO 2022 provides a new publicly available seamless, globally validated elevation dataset to meet the present and future needs of the scientific global hazard and mapping communities. Datasets for the ETOPO 2022 15 Arc-Second Global Relief Model are available at https://doi.org/10.25921/fd45-gt74 (NOAA National Centers for Environmental Information, 2022).
- Article
(12046 KB) - Full-text XML
- BibTeX
- EndNote


Earth scientists and modelers often rely upon accurate global models of Earth's surface elevation for a variety of earth-modeling applications. The National Centers for Environmental Information (NCEI) at the National Oceanic and Atmospheric Administration (NOAA) has long produced seamless earth topographic datasets by combining topographic and bathymetric data from a variety of sources. The “Earth TOPOgraphy” (ETOPO) datasets have been produced at 5 arcmin, 2 min, and 1 min horizontal resolutions covering the entire earth surface. ETOPO 2022 provides an updated global elevation at a refined spatial resolution of 15 arcsec from the ETOPO1 (1 arcmin) dataset last released in 2009. Primary end-users of ETOPO are coastal hazard and tsunami modelers; however, ETOPO is used as a baseline dataset in thousands of scientific papers, data products, and references worldwide (e.g., Friedlingstein et al., 2020; Schmidtko et al., 2017; Woodruff et al., 2013).
2.1 General description and file formats
ETOPO 2022 is a full-coverage seamless and gridded topographic and bathymetric elevation dataset. ETOPO 2022 is an updated higher-resolution version of previously released ETOPO5 (5 arcmin), ETOPO2 (2 arcmin), and ETOPO1 (1 arcmin) global grids. For further use in this document, references to “ETOPO” refer to the ETOPO 2022 release. References to any previous ETOPO grids (ETOPO1, ETOPO5, etc.) use the specific version names.
ETOPO is released as a global-coverage dataset comprised of 288 individual 15×15° tiles (latitude × longitude) at 15 arcsec geographic resolution. The tiles are provided in GeoTIFF and Network Common Data Form (NetCDF) formats, with identical information provided in each format. An additional 62 tiles have “bed” versions that provide bedrock elevations under the surface of the Greenland and Antarctic ice sheets. ETOPO is intended to represent a digital terrain model (DTM) with vegetated canopy and buildings removed. Elevations within each grid cell represent the “mean” elevation of bare-Earth terrain within that cell. All tiles are in horizontal WGS84 geographic coordinates (EPSG:4326) and vertically referenced in meters relative to the Earth Gravitational Model of 2008 (EGM2008) geoid surface (EPSG:3855). Each tile comes with an accompanying integer source ID (“sid”) tile specifying from which source dataset each ETOPO elevation was derived (see Sect. 3), as well as an accompanying “geoid” tile for converting EGM2008 geoid heights into WGS84 ellipsoid elevation heights (EPSG:4979). Since most other geoid, ellipsoid, and/or tidal vertical datums are defined by grids in reference to the WGS84 ellipsoid, this eases the conversion of ETOPO 2022 tiles into other vertical reference datums of the user's choice. For most purposes, EGM2008 is an adequate approximation of mean sea level at the 15 arcsec resolution of ETOPO.
The 15 arcsec global grid used in ETOPO 2022 is functionally identical to the grid used in similar products such as GEBCO (GEBCO Compilation Group, 2022) and the Shuttle Radar Topography Mission 15 arcsec DEM (SRTM15+) (Tozer et al., 2019), although the underlying datasets and processing steps are distinct.
2.2 File naming convention
ETOPO 2022 tiles are named in the following manner:
ETOPO_2022_v[#]_[RR]s_[N][YY][W][XXX][_suffix][.tif],
with the following information in place of the brackets [ ].
[#] – version number of the release, in this case, version 1;
[RR] – data tile resolution (15, 30, 60), in arc-seconds;
[N] – “N” or “S”, for Northern or Southern hemisphere;
[YY] – two-digit latitude of tile's northern (top) border, absolute value;
[W] – “W” or “E”, for Eastern or Western hemisphere;
[XXX] – three-digit longitude of the tile's western (left) border, absolute value;
[_suffix] – “_surface”: surface elevations, “_bed”: bed elevations, “_sid”: source ID numbers, “_geoid”: geoid heights;
[.tif] – file extension: “.tif” (GeoTIFF) or “.nc” (NetCDF) formats.
For example, a tile named
ETOPO_2022_v1_15s_N60W045_bed.tif
is a GeoTIFF file with a resolution of 15 arcsec, and its upper-left corner is located at a latitude of 60° N and a longitude of 45° W. In this case, the file contains data on bedrock elevations beneath the surface of the ice sheets of either Greenland or Antarctica.
2.3 Geoid conversion
To convert a given tile from EGM2008 to WGS84-referenced elevations (which can be easily converted to other vertical datums), add the values of the elevation tile to the geoid-height tile:
To enable easy conversion between vertical elevation reference grids, geoid files are distributed alongside each ETOPO elevation tile. In ice surface and bedrock versions, single global tiles are also provided at 30 and 60 arcsec (i.e., 1 arcmin) resolutions in both GeoTIFF and NetCDF format. Both 30 and 60 arcsec grids were downsampled from the 15 arcsec elevation tiles for more general uses and do not have accompanying SID tiles.
Table 1 lists the datasets that contributed elevation data in the ETOPO product. Other data sources were assessed and evaluated but were not included in the final ETOPO 2022 data product. The source name acronyms for each dataset are defined in the sections following Table 1.
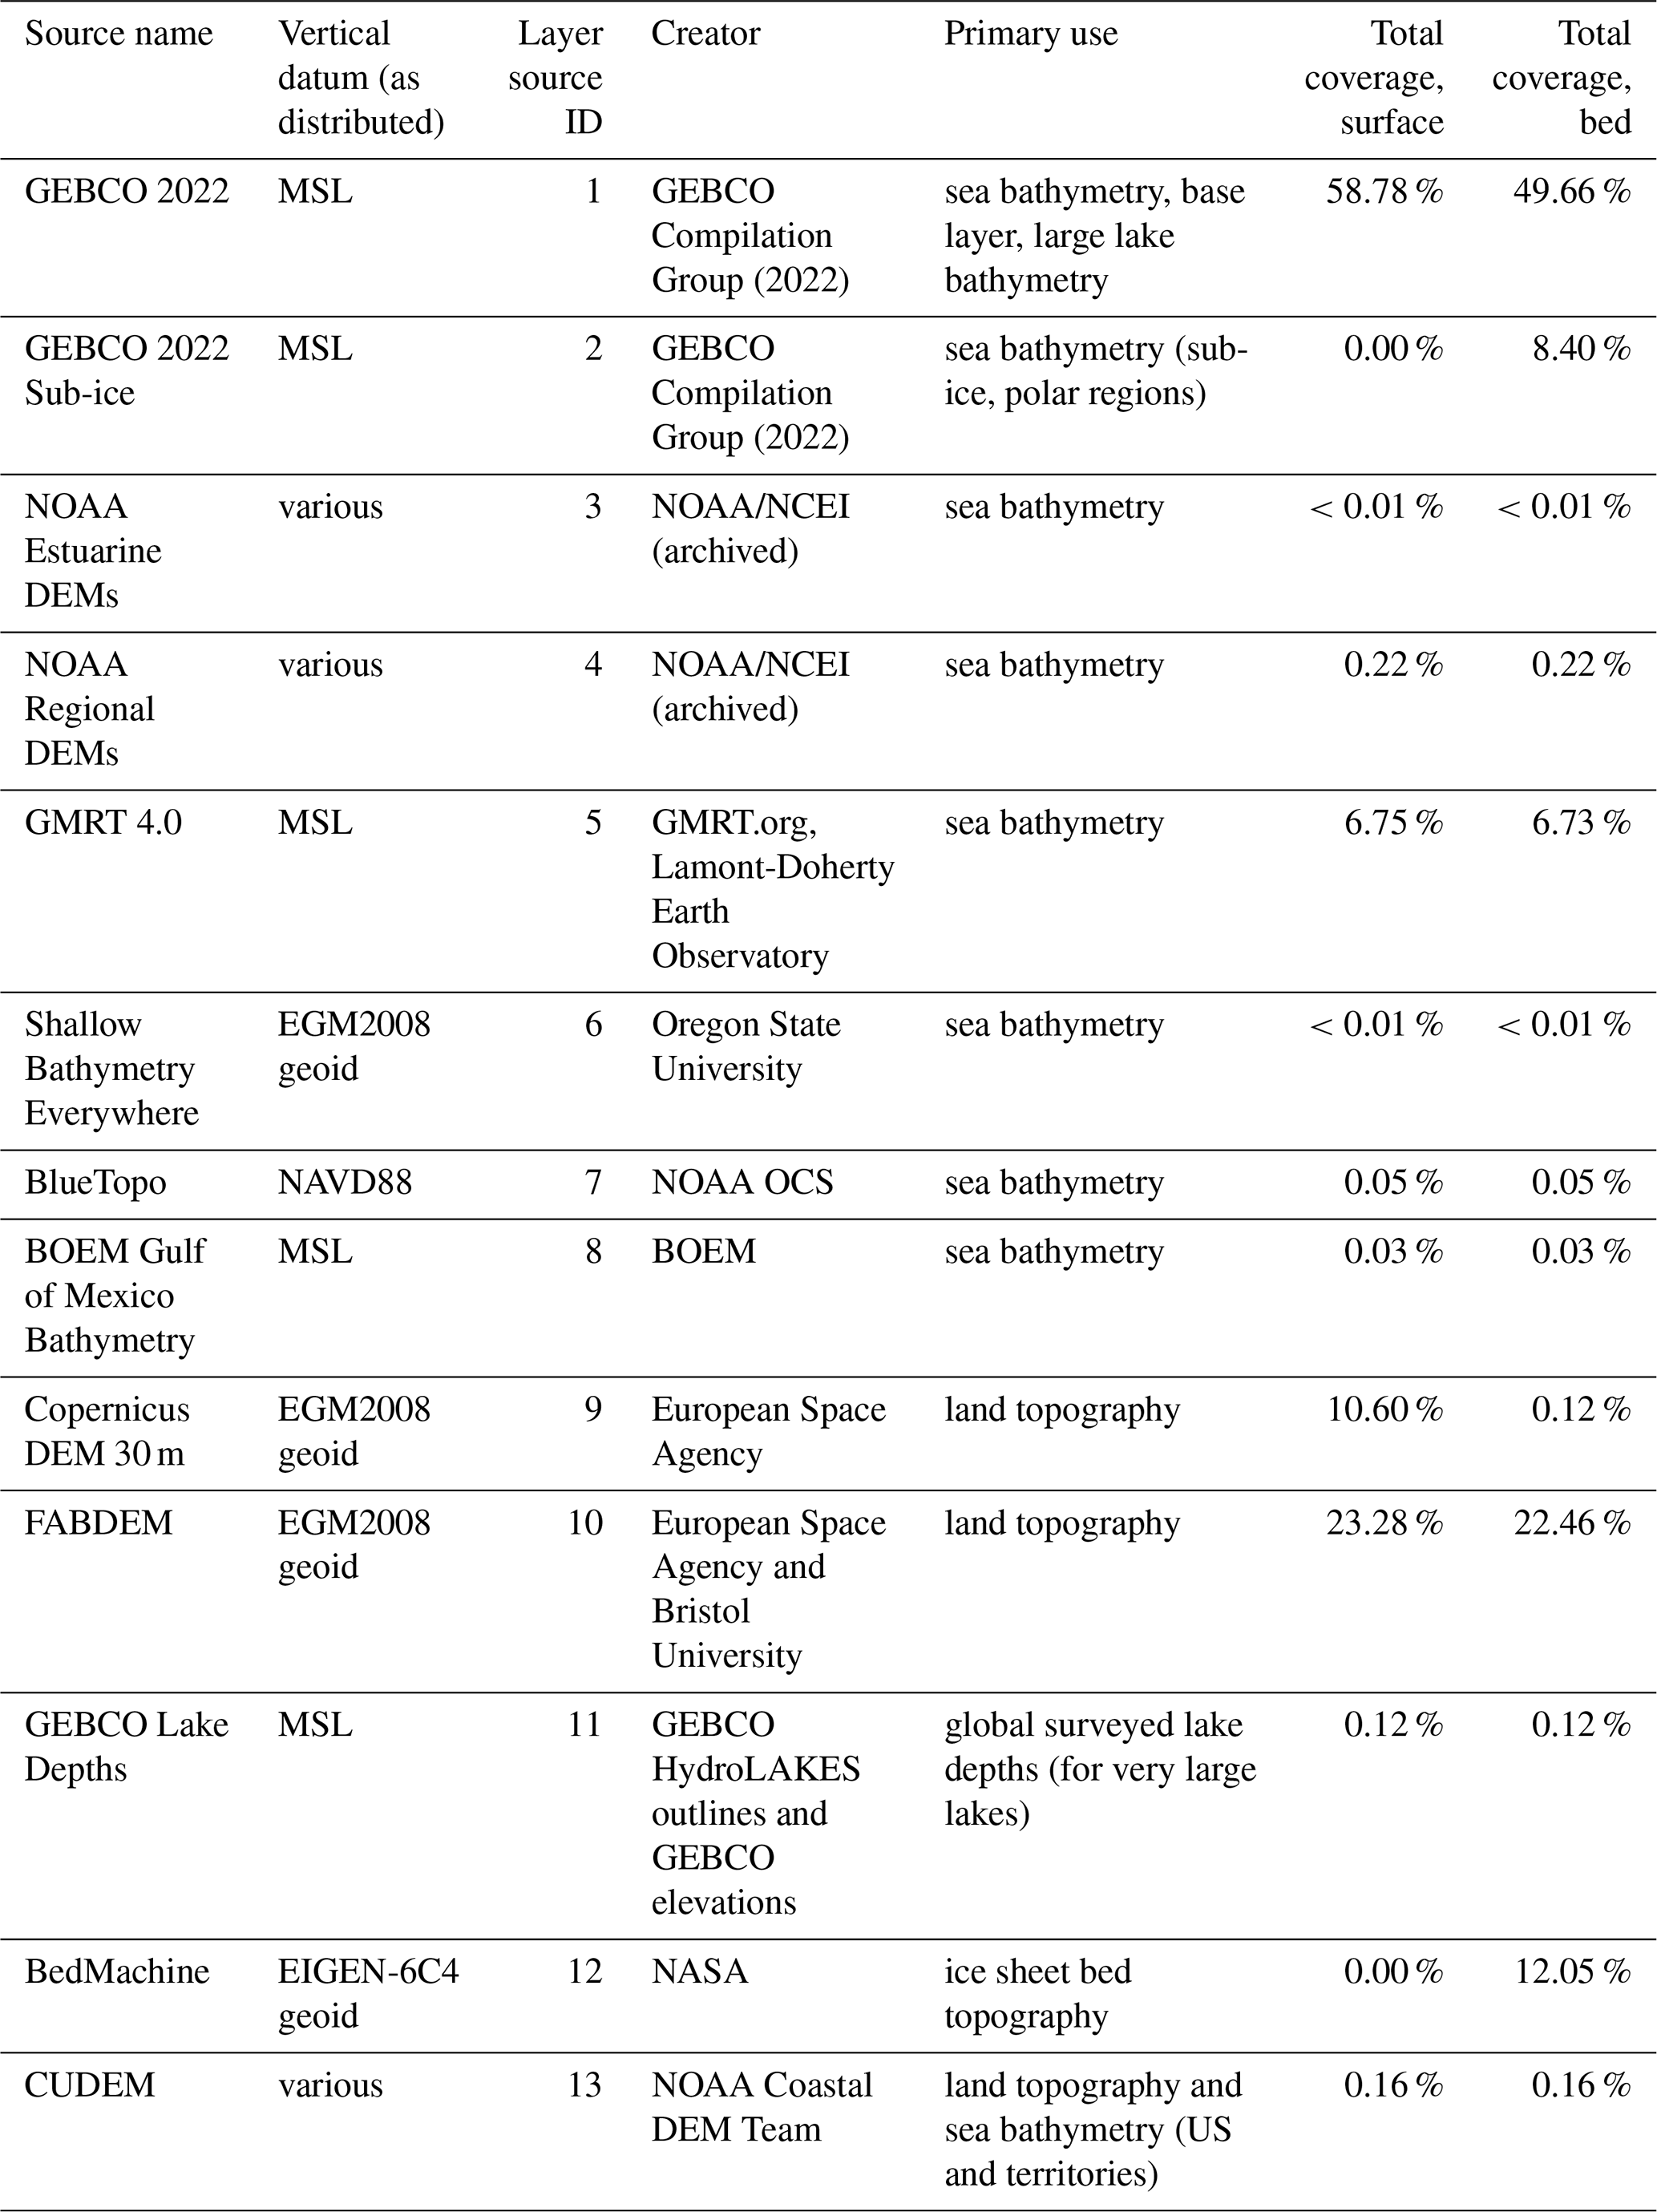
Figures 1 and 2 show the distribution of source datasets across the ETOPO 2022 product for the surface products (Fig. 1) and bed products (Fig. 2).
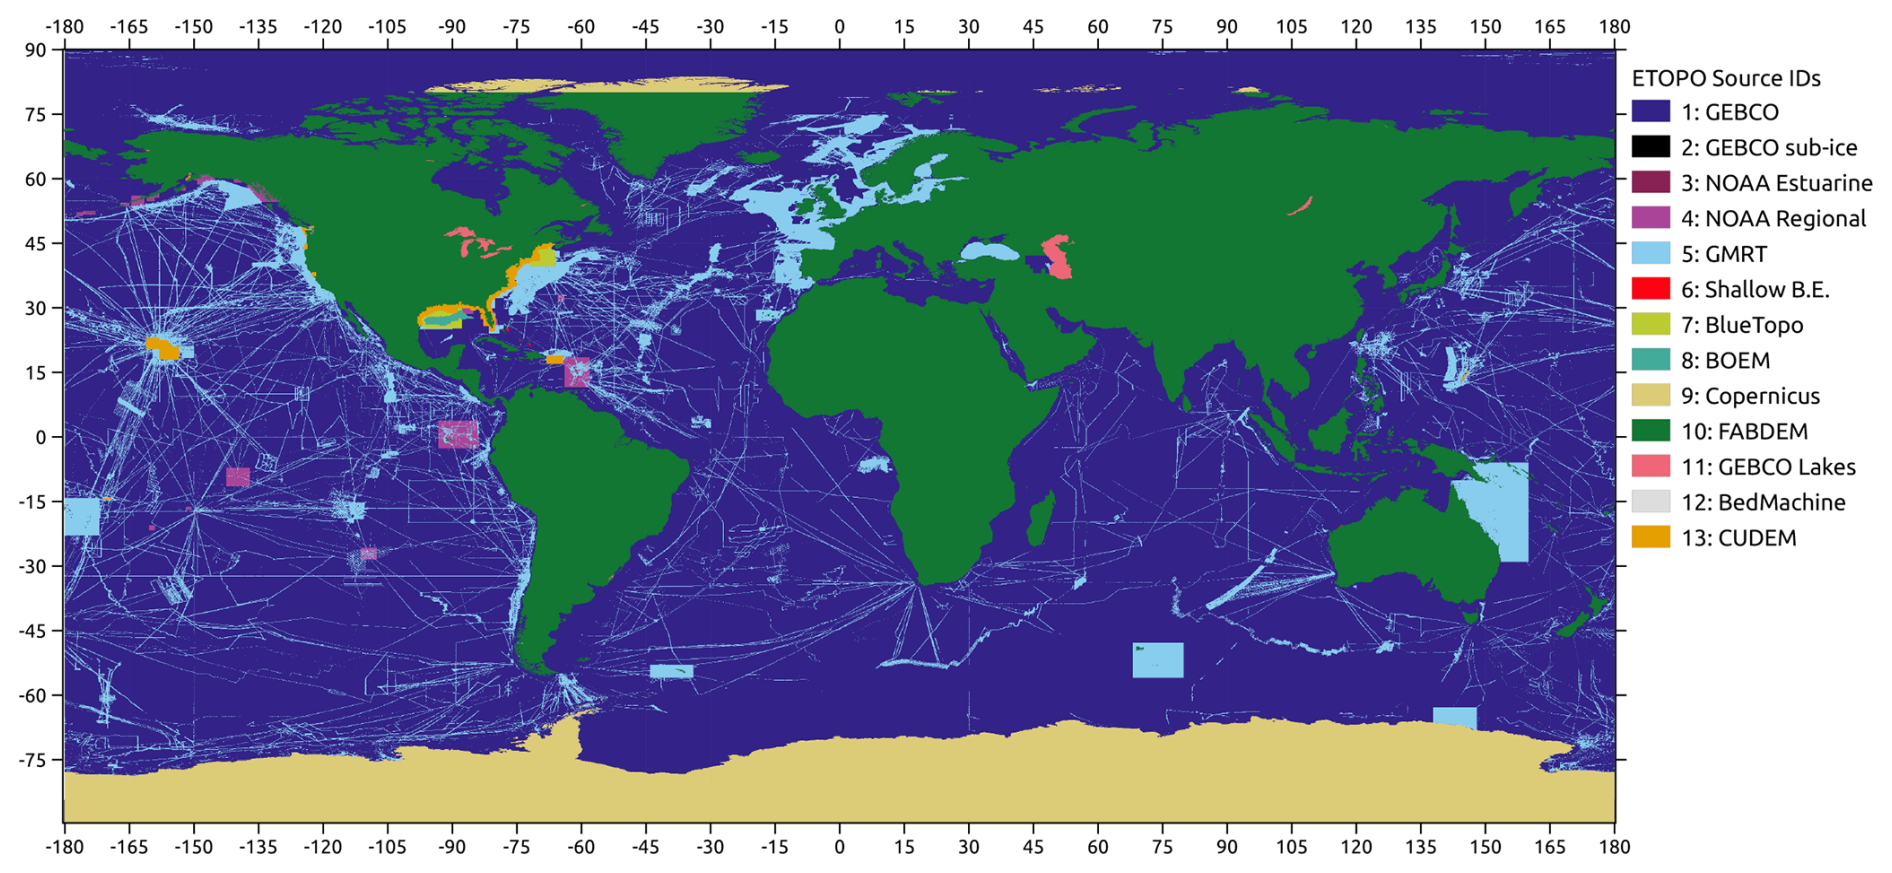
Figure 1Map of ETOPO 2022 surface source datasets.
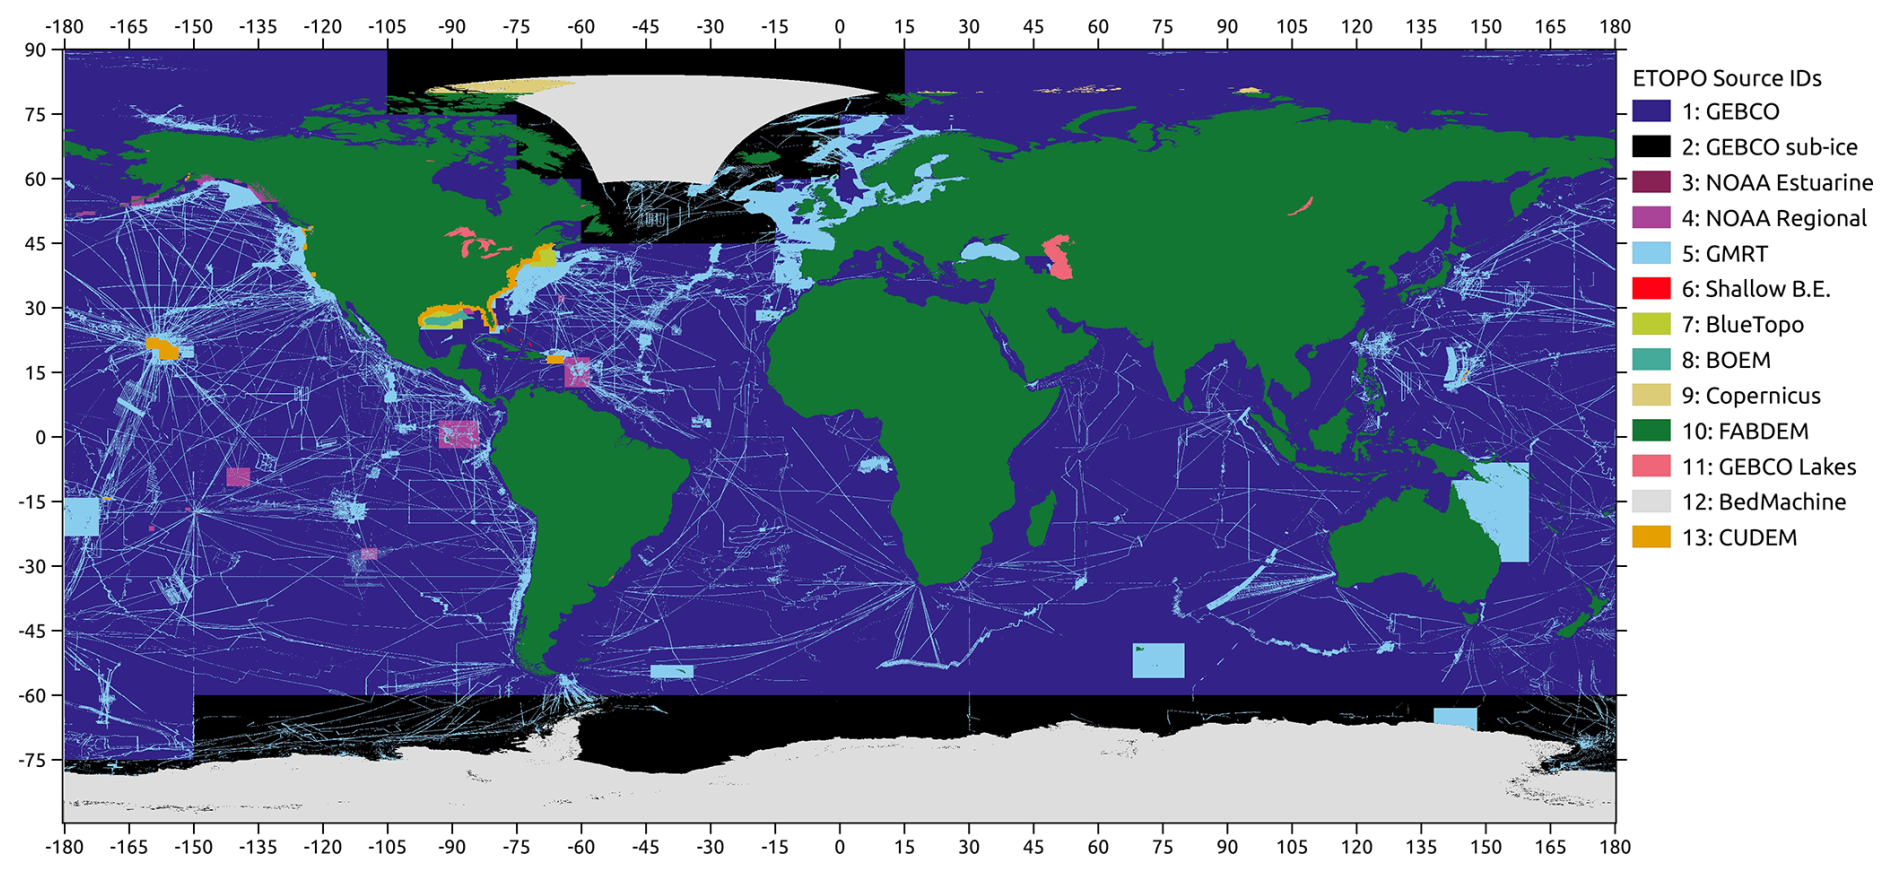
Figure 2Map of ETOPO 2022 bedrock source datasets.
The following datasets (Table 2) were not directly included in the ETOPO tiles but were used for the development, production, and/or validation of the source data layers, as described in further sections.
Table 2Datasets used in ETOPO production and validation but not contributing directly to ETOPO elevation values.
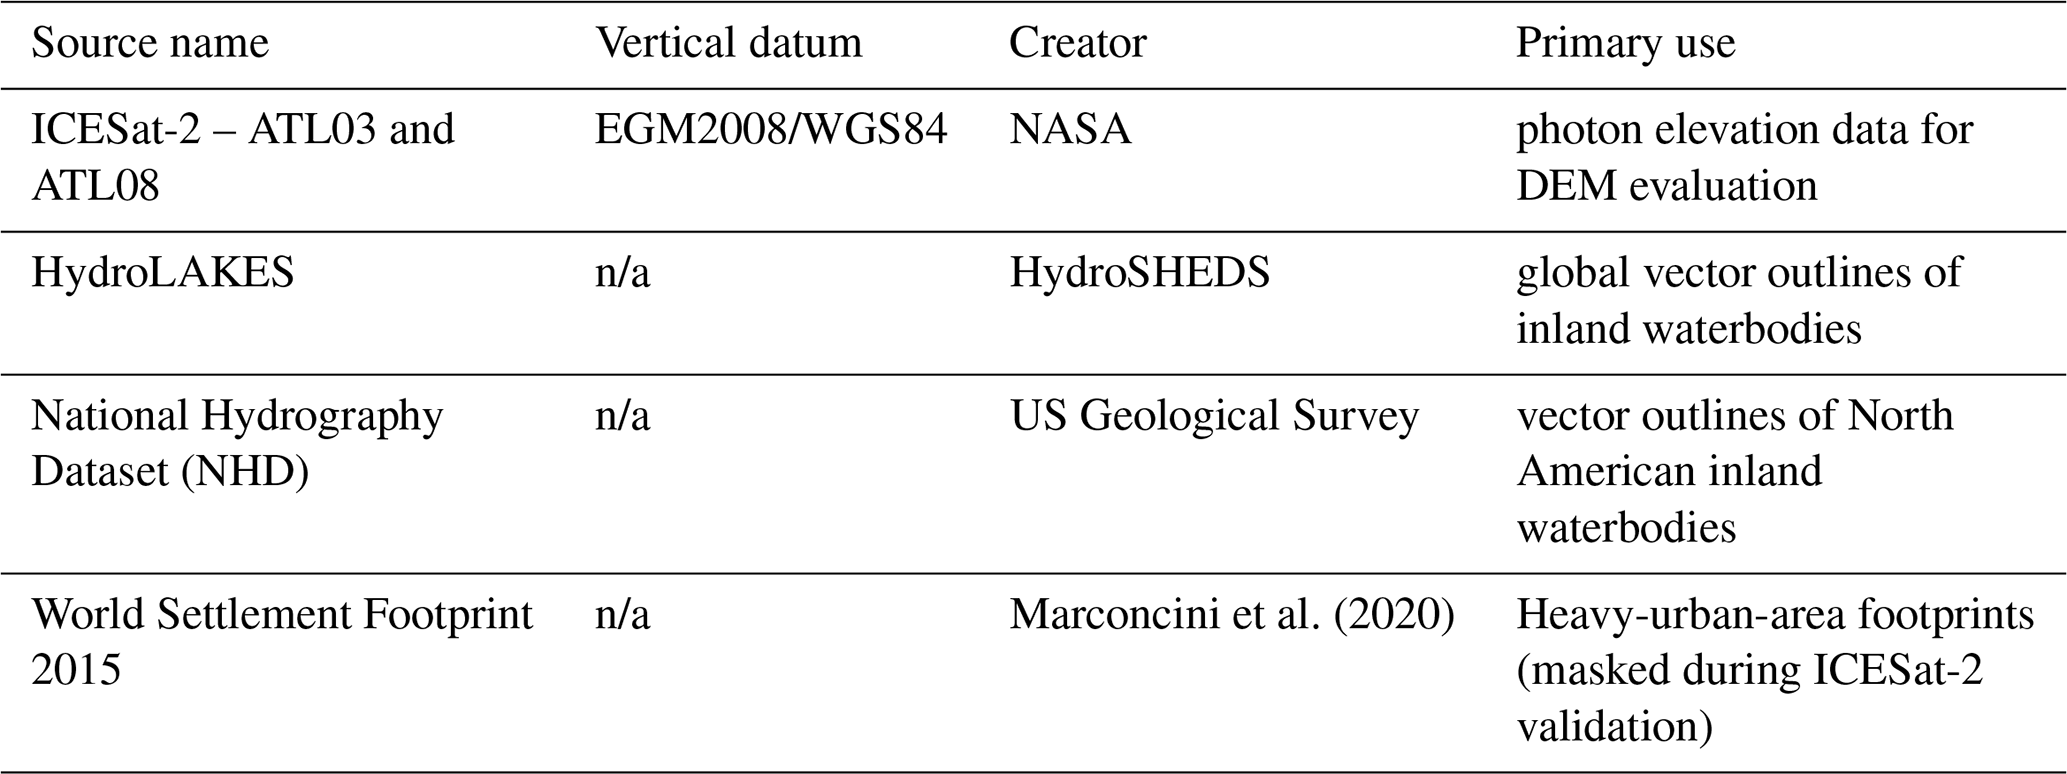
n/a stands for not applicable.
We performed the following pre-processing steps on each dataset before incorporation into the ETOPO 2022 product.
3.1 GEBCO 2022
The General Bathymetric Chart of the Oceans (GEBCO) is an annually produced global elevation product derived from a global consortium of institutions collaborating on the SEABED 2030 project, with the primary aim of mapping the world's ocean bathymetry in its entirety by the year 2030 (Mayer et al., 2018). GEBCO global elevation grids are produced at 15 arcsec resolution and incorporate a mix of data sources, including sonar soundings, lead-line measurements, and interpolated gravimetry data for bathymetry. ETOPO uses the global GEBCO grids as a “base layer”, using GEBCO data where other direct measurements are not available. The land-based portions of the GEBCO global grids are based upon reprocessed NASA Shuttle Radar Topography Mission (SRTM) data collected in February 2000 (Rodríguez et al., 2006). Although ETOPO 2022 includes GEBCO in its base layer even over land, the land-based portions of the ETOPO grid are based primarily on modern satellite radar-derived measurements, and as such, GEBCO data are not used over land for a majority of the ETOPO product.
Table 3Large lakes and estuarine areas from which approximate bathymetry was pulled from GEBCO.
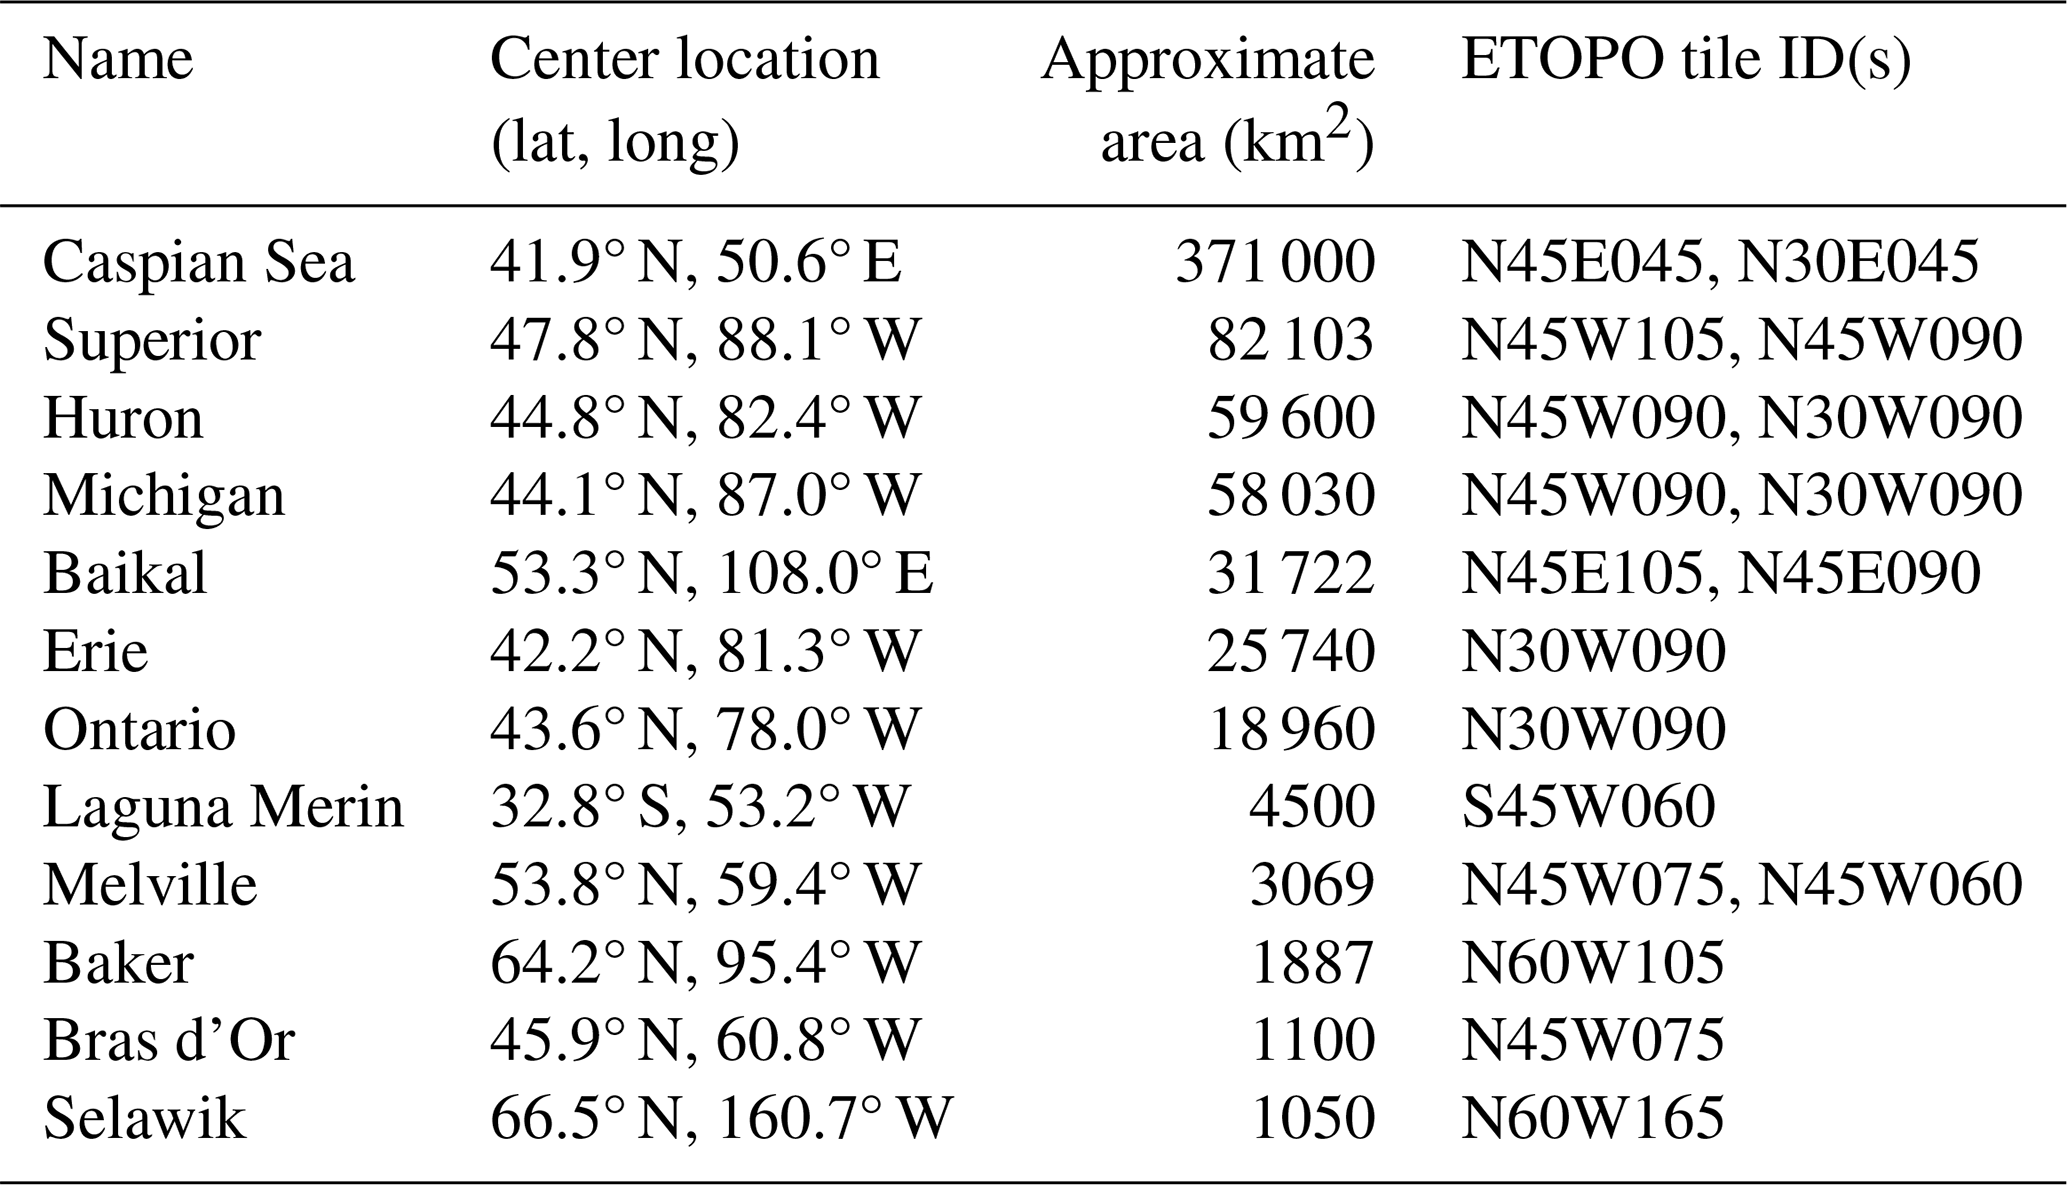
For a small set of large inland waterbodies, GEBCO contains surveyed bathymetry data derived from other sources. For each of the following lakes, raster masks for the lake areas were produced from digitizing outlines from the vector HydroLAKES dataset (Messager et al., 2016), part of the HydroSHEDS database of global land hydrography data. A separate data layer incorporating just the lake bathymetry from GEBCO was produced and given a higher topographic source ID number than the primary land-based topographic datasets such as Copernicus DEM and FABDEM, so that lake bathymetries supersede other surface topography datasets. The large lakes and coastal estuarine areas in which GEBCO includes plausible lake bathymetry are outlined in Table 3. These lakes were not chosen because they were inherently the biggest in the world (although several of them are the largest lakes on Earth by area) but rather because it was determined that GEBCO contained plausible bathymetry for these lakes, while using a “flat surface” for remaining lakes worldwide. Bathymetries of other large lakes may be included in further updates to the ETOPO data product.
3.2 NOAA estuarine DEMs
In 2018, NOAA updated the National Ocean Service's estuarine bathymetry DEMs, gridded representations of bathymetry for various estuaries in the United States, which were initially created in 1998 by the now defunct NOS Special Projects Office. The estuarine DEMs (National Centers for Environmental Information, 2020) provide nearshore and up-river bathymetry for multiple US-based estuarine areas, provided in mean lower-low water (MLLW) tidal elevations. Although these data still represent the “best available” gridded depictions of bathymetry in some locations, they are primarily based on antiquated historical data and do not include many modern survey data, in particular, high-resolution bathymetric attributed grid (BAG) format hydrographic data. The only available data digitized before 1997 were used in the original project. The majority of estuarine DEMs were included in ETOPO, while several others were omitted where higher-quality data were available from other sources. Most NOAA estuarine datasets were superseded by other more recent datasets and thus incorporate a small area of the final ETOPO product (less than 0.001 % of global land area).
3.3 NOAA regional DEMs
Before the initiation of NOAA's Continuously Updated Digital Elevation Model (CUDEM) program in 2014 (Amante et al., 2023), the NOAA Coastal Digital Elevation Model team produced numerous regional integrated topographic–bathymetric DEMs covering various regions within the coastal waters of the United States. These regional DEMs (NOAA National Centers for Environmental Information, 2022) are derived from a variety of available data sources at the time of creation and are output in various tidal vertical datums to fit the needs of individual organizations and groups (both internal and external to NOAA) that requested coastal DEMs. The regional DEMs are available on NOAA's THREDDS Catalog at https://www.ngdc.noaa.gov/thredds/catalog/regional/catalog.html (last access: 1 July 2022). Similar to the NOAA estuarine DEMs, some individual files were omitted from ETOPO due to the availability of higher-quality data in specific regions. In some areas, specific sub-areas were filtered out from individual regional DEMs due to artifacts prior to inclusion in ETOPO 2022. NOAA NCEI-created topographic and bathymetric data newer than the regional DEMs are included in the high-resolution CUDEM layer (Sect. 3.11).
3.4 GMRT v4.0
The Global Multi-Resolution Topography Synthesis project (Ryan et al., 2009) maintains a database of gridded high-resolution topographic and bathymetric datasets around the world. They are produced and distributed at multiple gridded resolutions. GMRT primarily focuses on the ingestion and processing of ship-based multibeam sonar data acquired by the United States Academic Research Fleet (ARF). Additionally, GMRT utilizes multibeam sonar and other relevant sources and projects where available. Elevations over land are derived from the United States National Elevation Dataset (NED) and NASA Advanced Spaceborne Thermal Emission and Reflection Radiometer (ASTER) global DEM. Other datasets were used for land elevations in ETOPO 2022, and GMRT is primarily used where multi-beam sonar data exist. ETOPO 2022 made use of GMRT 4.0 data as they existed in June 2022.
Some regions in the GMRT bathymetry data – specifically regions that were not derived from multibeam sonar – contained artifacts that did not reflect the true bathymetry in those locations. When such artifacts were found, we manually generated bounding boxes around such regions and filtered them out from the GMRT data (filling with no-data values) before ingesting GMRT into the ETOPO project. These “omitted” regions from GMRT data are outlined in the data file “GMRT_omitted_regions_15s.csv” included in this dataset.
3.5 Shallow Bathymetry Everywhere
The Shallow Bathymetry Everywhere project (Forfinski-Sarkozi and Parrish, 2019) maps shallow-water bathymetry using optical image techniques, primarily using the Landsat-8 satellite with machine learning techniques and validated against existing bathymetry surveys and remotely sensed ICESat-2 lidar data (Forfinski-Sarkozi and Parrish, 2019). At publication time, the dataset encompasses 12 specific regions worldwide, available for download at https://shallowbathymetryeverywhere.com/ (last access: 10 April 2022). Eleven regions covering shallow ocean bathymetry were included in ETOPO 2022 while excluding one dataset providing partial coverage over an inland lake (Tahoe, CA).
3.6 BlueTopo
BlueTopo is a suite of gridded coastal bathymetry datasets at nested resolutions released by the NOAA Office of Coast Survey (OCS) and distributed publicly (US Office of Coast Survey, 2022). BlueTopo surveys were used where the data were extracted from measurements, whereas regions of interpolated data (usually drawn as triangular irregular networks between isolated survey points) were omitted from ETOPO. Additionally, some data that were sourced from older datasets (e.g., older regional DEMs) for which more recent data were available from other sources were omitted. The BlueTopo tiles come in nested resolutions from 16 to 2 m grid-cell spacings, in powers of 2. Higher-resolution tiles were weighted above lower-resolution tiles where both existed, favoring the higher-resolution data when subsetting data into ETOPO grid cells. BlueTopo tiles were re-gridded from Universal Transverse Mercator (UTM) projections into the World Geodetic Survey 1984 geographic grids and vertically transformed from the North American Vertical Datum 1988 (NAVD88) into EGM 2008 elevations before inclusion in ETOPO.
3.7 Bureau of Ocean Energy Management (BOEM) Gulf of Mexico bathymetry
BOEM released a high-resolution bathymetric map of the northern Gulf of Mexico region from active seismic acoustic surveys in 2017 (John et al., 2018). The BOEM gridded dataset consists of 1.4 billion grid cells at 40 foot (12.192 m) by 40 foot horizontal resolution, with depths relative to mean sea level. BOEM is publicly available for download at https://www.boem.gov/oil-gas-energy/mapping-and-data/map-gallery/northern-gom-deepwater-bathymetry-grid-3d-seismic (last access: 10 April 2022). The two BOEM data grids (covering the eastern and western Gulf of Mexico) were each projected horizontally into WGS84 geographic coordinates before inclusion in ETOPO.
3.8 Copernicus DEM 30 m
The Copernicus DEM 30 m global digital elevation model (GLO-30) (European Space Agency, 2022) was produced by the European Space Agency's Copernicus program primarily using the TanDEM-X synthetic aperture radar. GLO-30 is provided worldwide with the exception of 25 1° tiles in the Armenia and Azerbaijan regions. A recent study compared the accuracies of multiple global land-elevation models (Copernicus DEM, 2022), and found that Copernicus provided the lowest vertical errors compared against high-accuracy airborne lidar datasets in select study areas. The GLO-30 product is a digital surface model, indicating it measures the top of tree canopies and buildings rather than bare-Earth elevations, which may result in biases when compared to bare-Earth elevation datasets. Copernicus was used as the primary land-elevation layer in the polar regions (Arctic and Antarctic), where forests and urban areas are rare or nonexistent.
3.9 FABDEM v1.0
The Forest and Buildings Removed Copernicus DEM (FABDEM) (Hawker et al., 2022) combines the Copernicus DEM GLO-30 product with canopy data products and modeling to produce a simulated global bare-Earth digital terrain model (DTM). Satellite-derived forest canopy height measurements come from NASA's Global Ecosystem Dynamics Investigation (GEDI) mission (Dubayah et al., 2020) Global Forest Canopy Height 2019 product (Potapov et al., 2021) as well as canopy elevations derived from ICESat-2 lidar measurements (Neuenschwander and Magruder, 2019), built-environment footprints from the World Settlement Footprint (WSF) (Marconcini et al., 2020) and numerous others data layers to produce a model for canopy and building elevation biases within the Copernicus 30 m GLO-30 product. Correcting for these biases, they produced the FABDEM v1.0 product, which was shown to reduce the errors in their respective study areas against reference DEMs produced by high-accuracy airborne lidar. FABDEM is available for land elevations between 60° S and 80° N latitudes and is used in ETOPO where available. Copernicus DEM was used in the polar regions south of 60° S latitude and north of 80° N. Since the release of ETOPO 2022, FABDEM has been updated (version 1.2) to further reduce biases and errors, especially in steeply sloped regions (Neal et al., 2023).
3.10 BedMachine Greenland and Antarctica
The BedMachine Greenland version 5 (Morlighem et al., 2017) and BedMachine Antarctica version 3 (Morlighem, 2020) datasets were used to produce the “bedrock” versions of ETOPO with the Greenland and Antarctic ice sheets removed. BedMachine derives gridded ice thickness data from a combination of NASA airborne radar-sounding measurements and a novel interpolation method that combines ice-flow velocities and model calculations to conserve mass across flowlines of glaciers to provide likely estimates of interpolated bed elevations between direct radar measurements. BedMachine elevations were converted from the Eigen-6C4 geoid to the EGM 2008 vertical references and converted from polar stereo projections into WGS84 geographic grids for inclusion in ETOPO. In offshore waters surrounding Greenland, BedMachine derives most of its bathymetric elevation data from the same sources as GEBCO. BedMachine elevations were used without masking for areas underneath the Greenland Ice Sheet as well as surrounding waters (Fig. 2). Although BedMachine Antarctica and BedMachine Greenland are different datasets, they do not overlap spatially, and they were combined into the same dataset layer for ETOPO (Table 1). BedMachine data are only used in the ETOPO 2022 bedrock elevation products overlapping the Greenland and Antarctic ice sheets and are not used in the ETOPO surface tiles.
3.11 CUDEM
The Continuously Updated Digital Elevation Model (CUDEM) framework at NOAA produces high-resolution coastal topographic and bathymetric bare-Earth DEMs for US states and territories (Amante et al., 2023). CUDEM combines a suite of airborne, spaceborne, and shipborne data to produce seamless topographic and bathymetric datasets in coastal areas for coastal hazard modeling and management, in a framework that allows for frequent on-demand updates after significant coastal changes. The CUDEMs are currently the highest-resolution seamless depiction of the entire US Atlantic and Gulf coasts in the public domain; coastal topographic–bathymetric DEMs have a spatial resolution of 1/9 arc-second (∼3 m) and offshore bathymetric DEMs coarsen to 1/3 arc-second (∼10 m; Amante el al., 2023). CUDEMs also provide high-resolution DEM coverage for Hawaii, US territories, and portions of the US Pacific Coast. CUDEM tiles generated prior to August 2022 were included in ETOPO 2022.
4.1 CUDEM stacks
The Continuously Updated Digital Elevation (CUDEM) framework (Amante et al., 2023) at the NOAA Centers for Environmental Information (NCEI) and the Cooperative Institute for Research in Environmental Sciences (CIRES) at the University of Colorado build and provide a series of Python-based software tools for the efficient building of seamless DEM data products from a variety of sources. ETOPO was built primarily using the CUDEM “stacks” module, which stacks raster layers such as those listed in Table 1 from a variety of datasets (in various horizontal projections) using weights provided by the user. The stacks module computes output DEMs using a weighted average of the source datasets overlapping a given output grid cell or, if the “supersede” flag is set, using the highest-ranked dataset of all data overlapping a given grid cell. ETOPO was built from the source datasets listed in Table 1 using the stacks module with the supersede flag set. Source data that were at equal or lower resolution than the output ETOPO grid cells were interpolated using bilinear interpolation from the source dataset. Source data that were higher resolution than the ETOPO grid cells were interpolated using an average of overlapping grid cells.
4.2 Vertical datum transformations
Gridded input datasets whose vertical reference datum differed from the EGM2008 geoid, and for which transformation grids are available, were transformed vertically into EGM2008 reference elevations using the CUDEM “vdatums” module described in previous literature (Amante et al., 2023). The core of the vdatums module uses the NOAA VDatum Tool, version 4.4 (US Department of Commerce, 2022), which itself incorporates processing methods from NOAA's Horizontal Time-Dependent Positioning (HTDP) and NGS Coordinate Conversion and Transformation (NCAT) tools. BedMachine data products (Greenland and Antarctica) were vertically transformed from the EIGEN-6C4 geoid into WGS84 ellipsoid elevations using the geoid grids included with BedMachine, and then into EGM2008 using vdatums. In some individual cases (such as NOAA estuarine and regional DEMs), individual DEMs in local tidal datums (such as MLLW) were converted using interpolated grids from local tide stations into WGS84 ellipsoidal elevations, and from there to EGM2008. Some datasets presented as being referenced to mean sea level (MSL) were not referenced to any global datum, and these were unable to be mathematically converted to EGM2008. These datasets were primarily used in offshore regions where the differences between MSL and the EGM2008 geoid heights are far less than the uncertainties in the bathymetry measurements themselves. In such cases, MSL-referenced data were included unchanged in ETOPO 2022. Any uncertainties added from this implicit non-conversion of data are included in the uncertainty estimates of the ETOPO product.
4.3 Coastline masking of Copernicus and FABDEM
Copernicus and FABDEM provided the majority of land-elevation data for the ETOPO 2022 product. Both datasets contain zero values over ocean waters, which are treated as “NoData.” When Copernicus and FABDEM are resampled from their native 1 arcsec resolutions to the ETOPO 2022 15 arcsec resolutions, it can cause the shoreline to creep by 1 pixel, because any 15 arcsec grid cell would be classified as coming from Copernicus or FABDEM if even a fraction of a single 1 arcsec grid cell from those datasets were included anywhere in the ETOPO grid cell. To avoid this, both Copernicus and FABDEM were resampled into the ETOPO 15 arcsec grid using both mean and nearest-neighbor interpolation methods. The nearest-neighbor dataset only contained data if the source dataset overlapped with the center of the ETOPO-grid cell, providing a more realistic shoreline outline than using the mean-derived data. Mean-derived elevations were used but were masked only to grid cells that contained data when using nearest-neighbor resampling, where Copernicus or FABDEM data overlap the center of an ETOPO grid cell. These resampled and masked tiles were used in the final production of the ETOPO tiles.
4.4 Production of 30 and 60 arcsec tiles
The ETOPO 15 arcsec dataset is available in 288 global tiles at 15° latitude and longitude intervals. For users with global applications who do not need the highest resolution, ETOPO is produced in 30 and 60 arcsec (1 arcmin) resolutions in single global files, in both surface and bedrock versions. The 30 and 60 arcsec global tiles were produced by mean-interpolating and stitching the 15 arcsec ETOPO tiles into a single file. Since the lower-resolution files were generated by averaging the higher-resolution ETOPO, no source ID (sid) files are produced for the ETOPO 30 and 60 arcsec versions.
The Ice, Cloud, and land Elevation Satellite 2 (ICESat-2) is a photon-counting spaceborne altimetric lidar. ICESat-2 data were used to rank datasets and to validate the ETOPO 2022 product over land. ICESat-2 photons from the calendar year 2021 were assimilated and used to assess the bare-Earth elevations of land photons over grid cells that underlie ICESat-2 orbit passes. A small number of ICESat-2 granules were discarded due to the presence of data artifacts.
Figure 3 shows a point cloud of a single ICESat-2 orbit track over the northeast US from 1 June 2022. By linking ICESat-2's ATL03 v5 Photon data product (Neumann et al., 2021) with its ATL08 Land and Vegetation Elevation (Neuenschwander and Pitts, 2019) data product, we classified photons as land surface, canopy, canopy top, and noise. Atmospheric (noise) photons, seen in gray in Fig. 3, were discarded. Although canopy and canopy-top photons were used for assessing approximate vegetation cover, they were not used directly in validation processing against the ETOPO bare-Earth dataset. Only photons that were classified as land or ice surface in the ATL03 product with a “high” confidence level were included. Since ETOPO is a bare-Earth elevation product and ICESat-2 does not filter out photons reflected from the tops of urban structures, validating ETOPO in regions with high rooftops introduces a false negative bias in ETOPO validations using ICESat-2. We used the World Settlement Footprint (WSL) dataset to filter out regions of heavy-urban building cover to help alleviate this bias. In higher-resolution validations, we use the OpenStreetMap database to filter out photons at individual building levels, but such a mask was infeasible at ETOPO's 15 arcsec resolution. Lastly, we filtered out photons that likely reflected off regions of open water using the US National Hydrography Dataset Plus (NHDplus) (Moore et al., 2019) as well as the global HydroLAKES (Khazaei et al., 2022) dataset. Best attempts were made to only validate ETOPO against ICESat-2 over grid cells that represent the land topography.
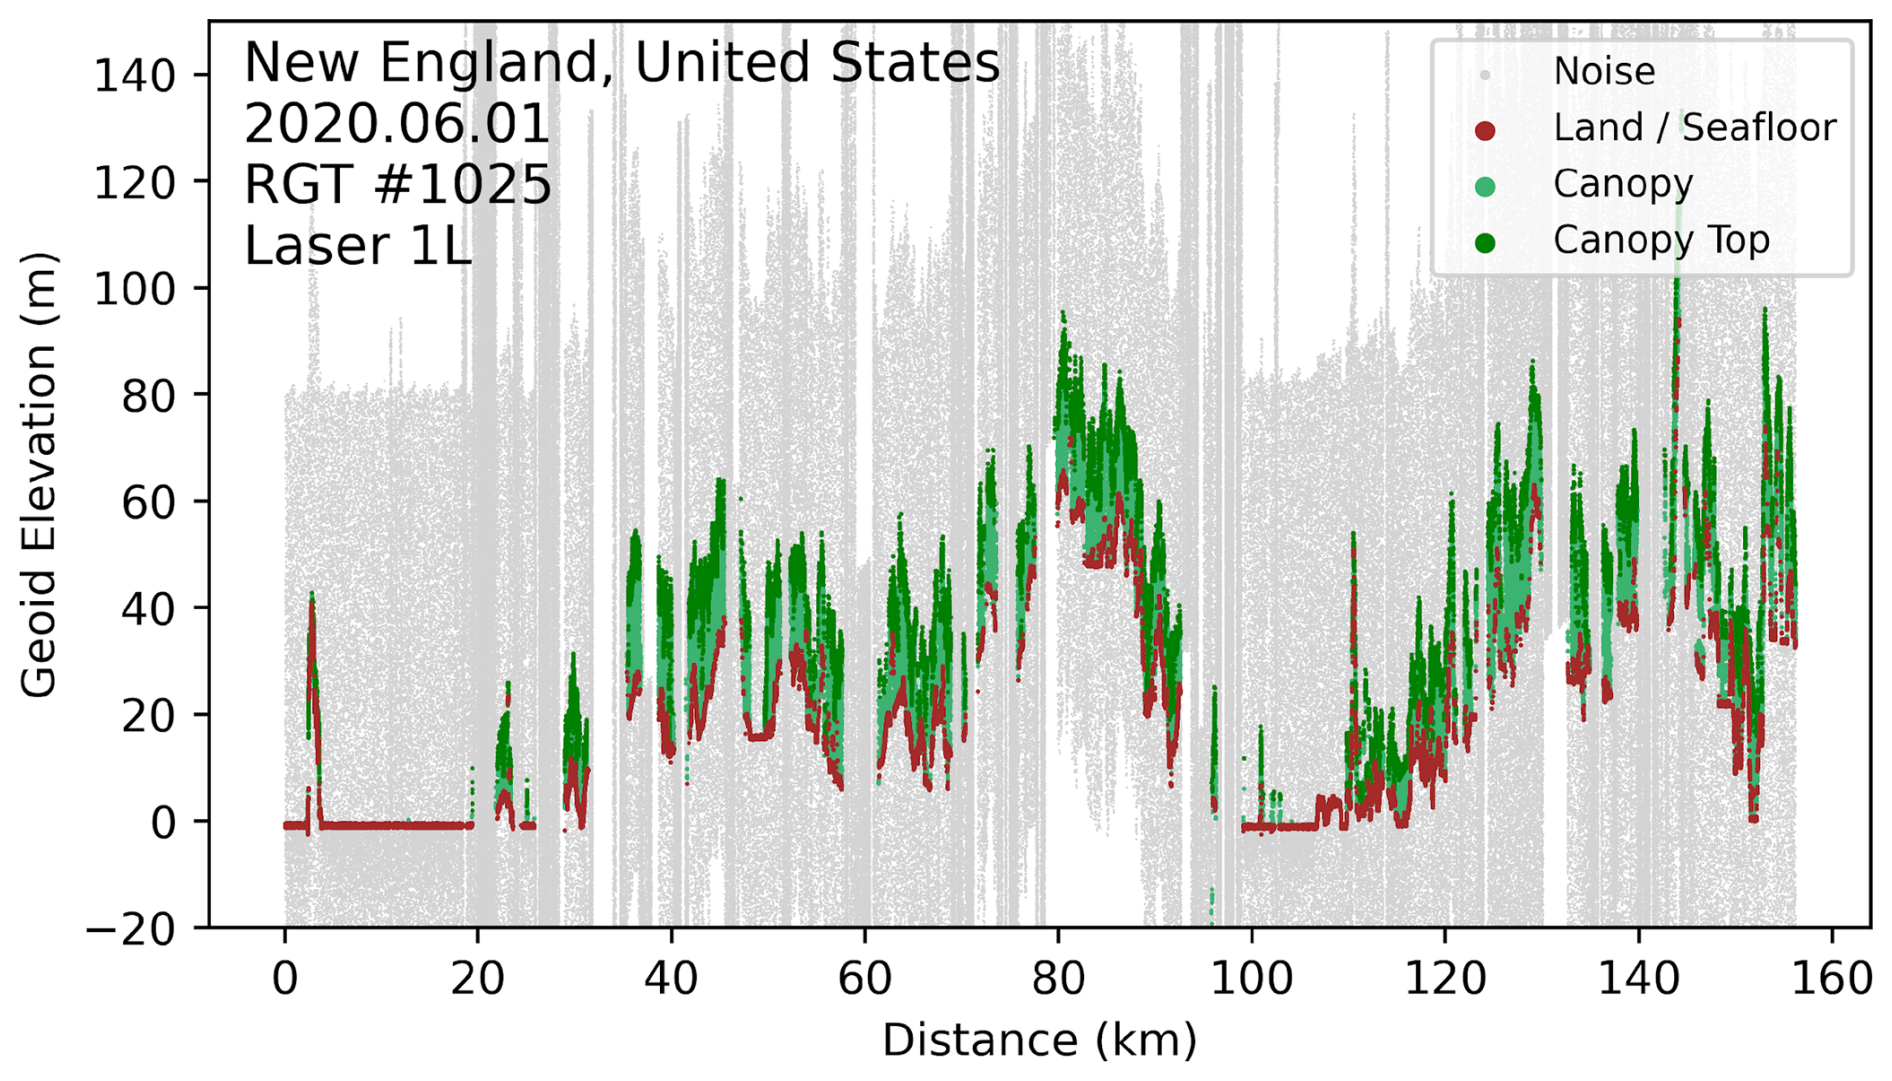
Figure 3An ICESat-2 photon point cloud over New England, USA. Photons are classified to identify canopy, canopy top, ground, and noise, according to filtering in the ICESat-2 ATL08 data product, and mapped at an individual photon level in ATL03 granules.
ICESat-2 granules are stored and archived at the NASA Distributed Active Archive Center (DAAC) and the National Snow and Ice Data Center (NSIDC). Data granules are formatted and distributed in orbit-track segments, where a single full earth orbit of the satellite is divided into 14 sub-segments by elevation band. While this format is useful when processing individual orbit paths (such as for producing Fig. 3), it is inefficient for processing photons from multiple orbits that fall over an individual grid cell on a DEM. In those cases, large granule files must be repeatedly subsetted to extract the relatively small number of photons that lie within a specific grid cell, causing significant processing delays. The NSIDC DAAC provides a server-based “subsetter” for the data but does not allow for correctly combining the ATL03 and ATL08 datasets for photon classification, and thus was unusable for this project. To improve the performance of geospatial searches across multiple ICESat-2 granules, all ICESat-2 photons from calendar year 2021 were re-organized into geographic tiles. A total of 417 660 tiles were created over the Earth's land surface at 0.25×0.25° boundaries, and photons from all granules collected in the calendar year 2021 were subdivided into data tiles for each target tile in which data were recovered.
ETOPO was validated on a cell-by-cell basis. First, each 15° ETOPO data tile was subset into 225 1×1° “sub-tiles” to reduce the total data load for each tile validation. For each 1×1° tile, a coastline validation mask was created using the Copernicus DEM dataset outlines, with waterbodies and building footprints eliminated to ensure only bare-Earth land elevations are being validated from ICESat-2. For each DEM cell, photons falling within that grid cell are collected. The top and bottom deciles (< 10th and > 90th percentile of z elevations) of photons are eliminated to reduce the influence of outlier photons in the data.
With a spatial resolution of 15 arcsec (approximately 450 m at the Equator), spatial sampling errors were seen to be significantly skewing comparisons between ICESat-2 and DEM grid cells. A grid cell in a sloped or mountainous region, in which ICESat-2 only “clips the corner” of a grid cell while missing a majority of the cell's spatial coverage (Fig. 4, left), can produce errors of tens to hundreds of meters between the grid cell's average elevation and the average elevations of ICESat-2 photons over the same grid cell. To alleviate this spatial sampling bias, each 15 arcsec ETOPO grid cell that contained ICESat-2 data was divided into 15×15 1 arcsec subsets, photons were binned into each subset, and the total number of subsets was tallied in order to compute a rough-order “coverage” estimate of ICESat-2 photons across an ETOPO grid cell. Figure 4 shows a schematic representation of this process, in which two grid cells with substantially different numbers of ICESat-2 overlaps have differing coverage estimates.
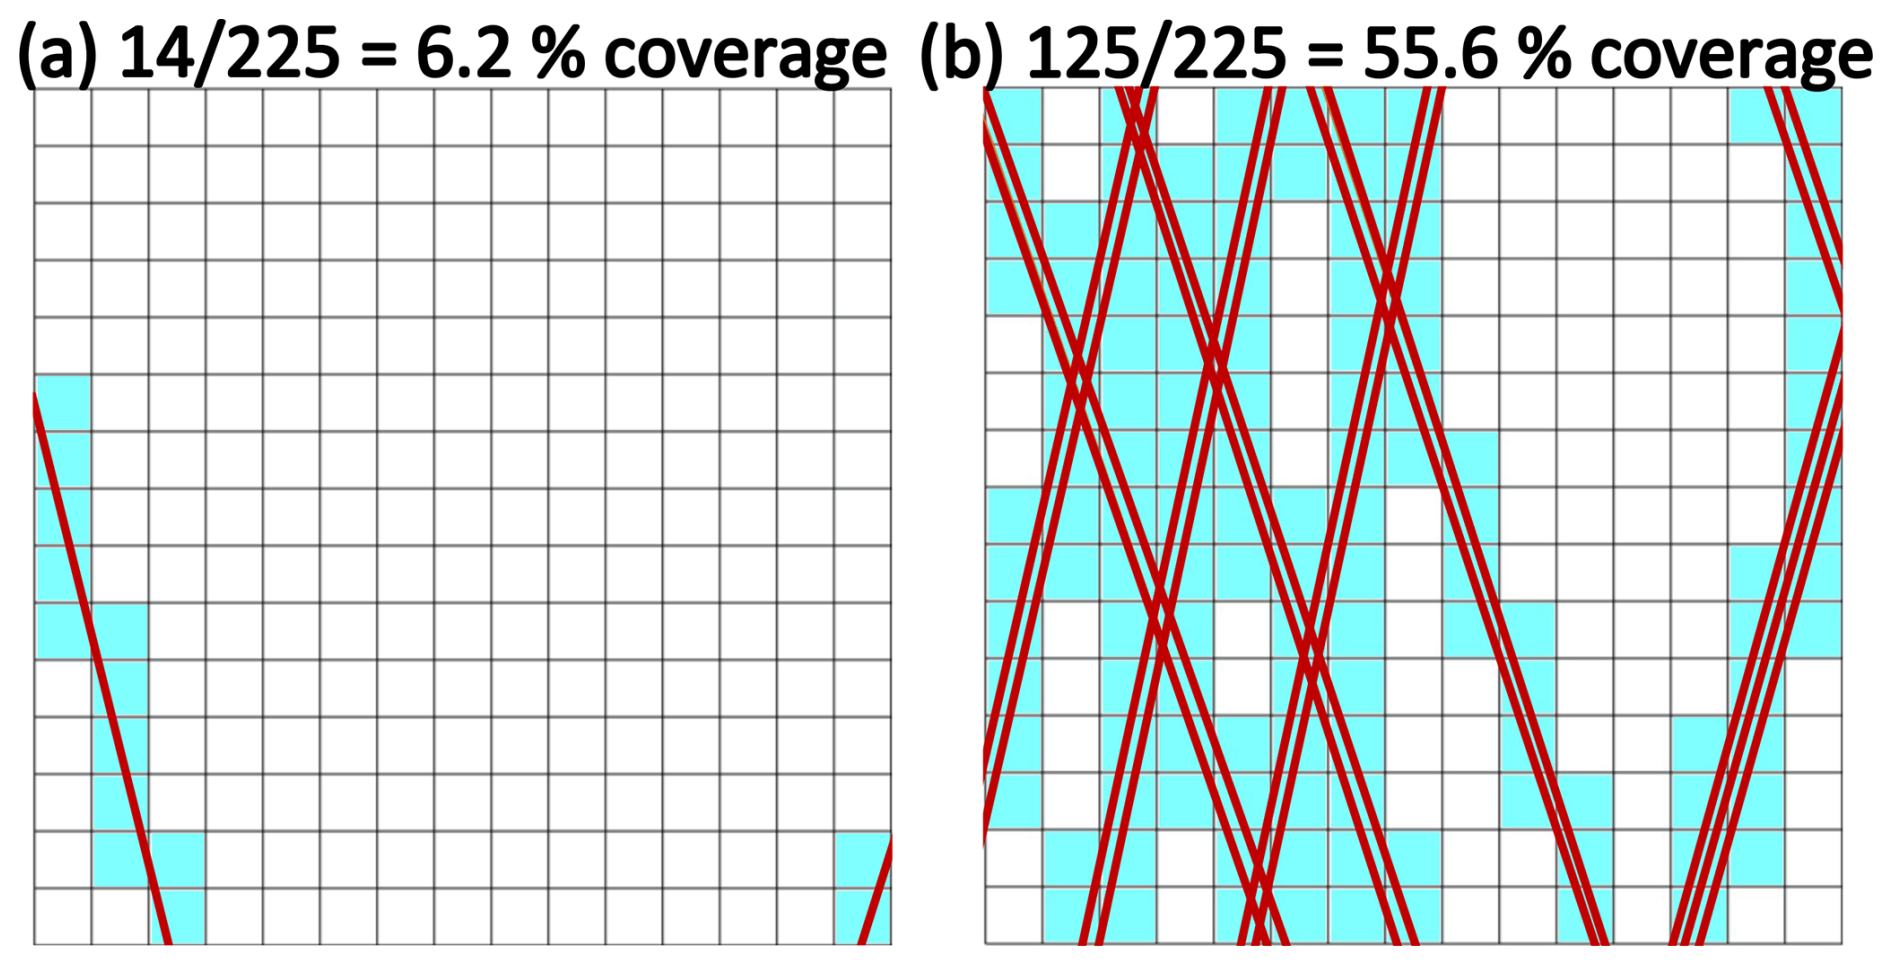
Figure 4A schematic representation of two ETOPO grid cells subdivided into 15×15 1 arcsec sub-cells to compute cell coverage from ICESat-2 orbits. (a) A cell with only two partial orbit passes clipping the corners of the grid cell, with lower overall coverage. (b) A cell with multiple ICESat-2 orbit passes and higher coverage.
Errors were computed for each ICESat-2 grid cell by subtracting the ICESat-2-derived mean elevation of the grid cell against the ETOPO elevation. Figure 5 clearly shows the effect of spatial biasing, where grid cells that have significantly higher coverage estimates (∼40 % coverage) have consistently lower mean RMSE values compared to ICESat-2 estimates. In Fig. 5, the two notable spikes in the histogram, at 7.5 % and 15 % coverage, correspond to ETOPO grid cells containing exactly one ICESat-2 orbit path, and exactly two orbit paths, respectively. Due to the converging orbits of ICESat-2 approaching its “pole hole” near 88° N and S, a significant majority of ETOPO grid cells with higher ICESat-2 coverages (above 40 %) are located in the polar regions, especially in Antarctica. This precluded using a set minimum coverage to filter out grid cells with low coverage to calculate the RMSE of the ETOPO global dataset. Any such estimate would be dominated by validations predominantly over Antarctica. In order to avoid spatially biasing the validation data to the polar regions, while still eliminating lower-coverage grid cells that suffer from spatial sampling biases, we computed the RMSE of errors within each 1×1° sub-grid cell used for validation and only chose grid cells that had the top 5 % coverage of all cells validated within that sub-tile. This provided validation data across a majority of Earth's land surface (Fig. 7, below) while minimizing errors introduced by spatial sampling biases, providing a geographically weighted estimate of ETOPO errors.
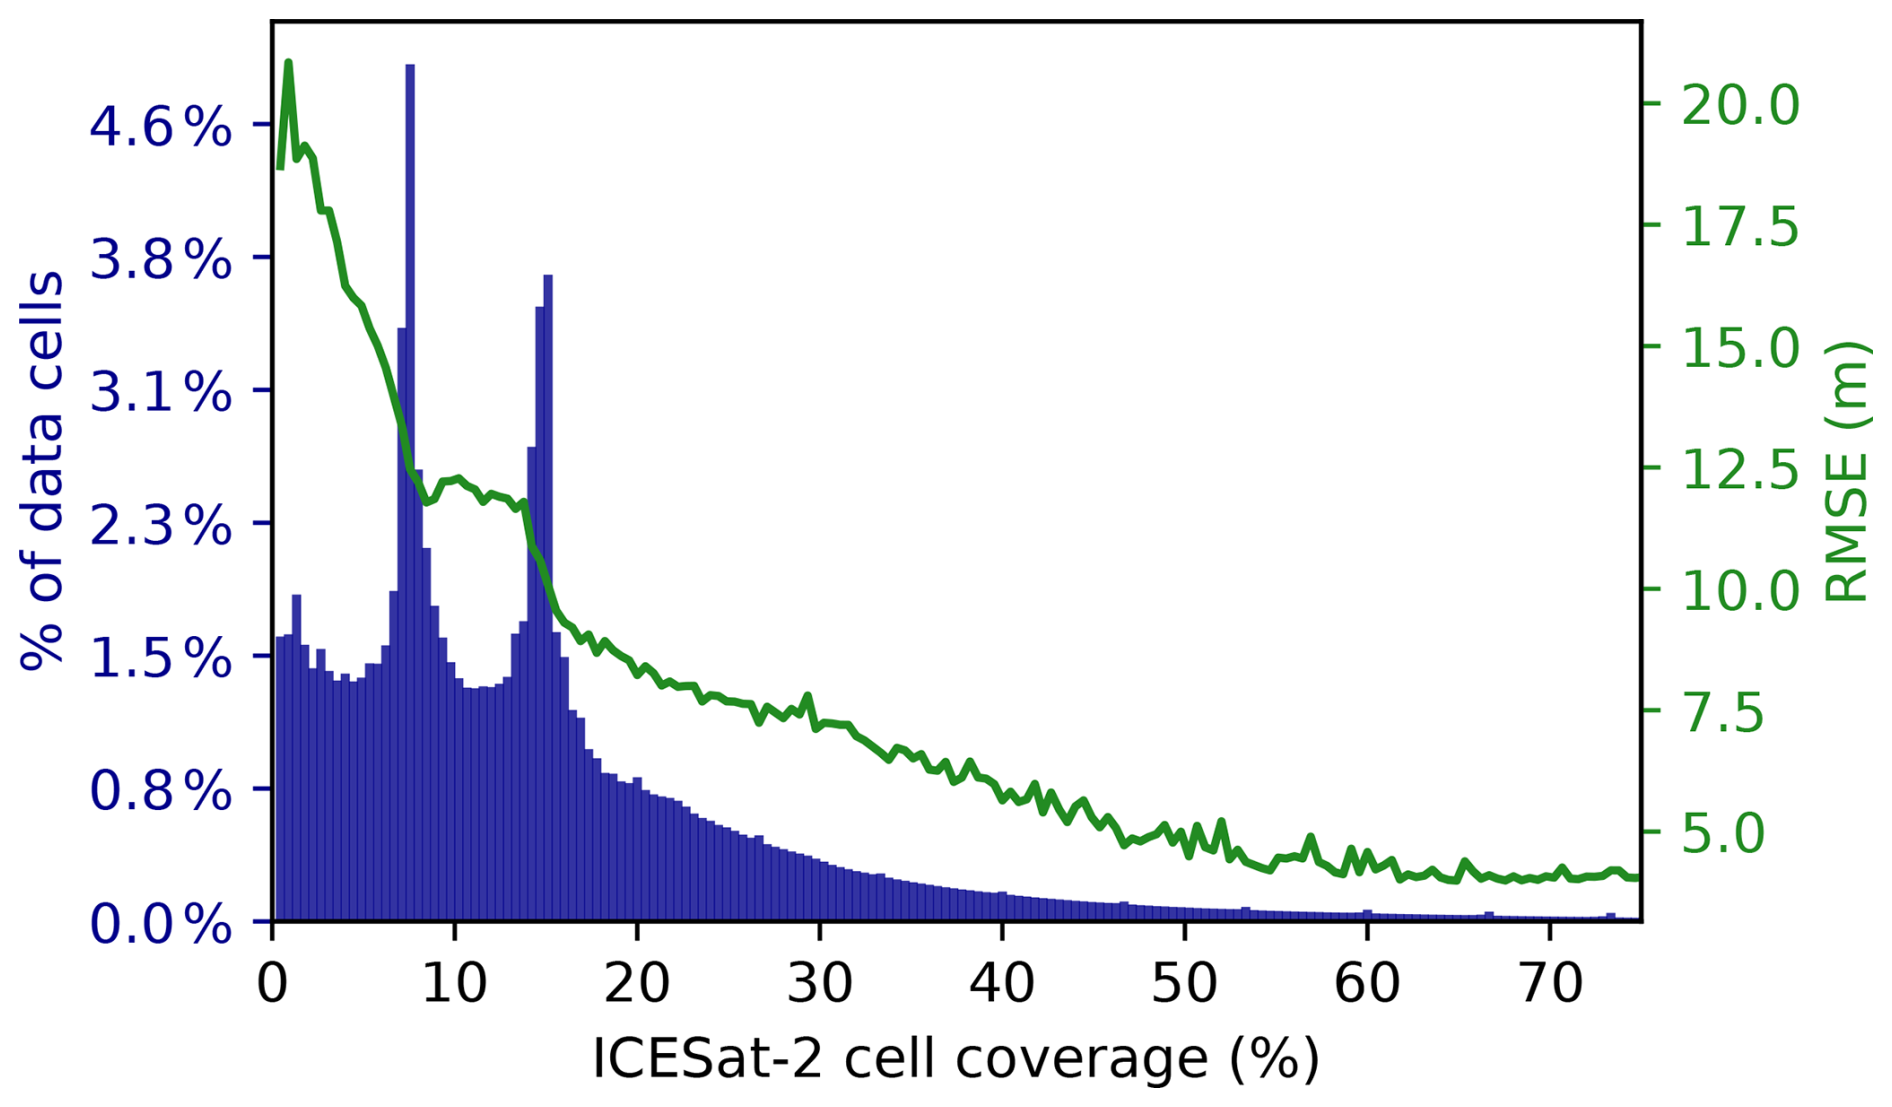
Figure 5Distribution (blue bars, left) and RMSE (green line, right) of validated ETOPO grid cells as a function of ICESat-2 grid-cell coverage.
A small number of individual ICESat-2 granule files were found to have biased elevations relative to other orbits (even crossing orbits) in the same DEM tile, providing bimodal error distributions due to artifacts in one particular ICESat-2 granule. These specific ICESat-2 granules were flagged as anomalous data and omitted from further analyses.
Only the 288 ETOPO 15 arcsec tiles were validated in this manner. Since ICESat-2 cannot validate bedrock elevations underneath the ice sheets, only land surface elevation tiles were validated. The ETOPO 30 and 60 arcsec global files were subsampled from ETOPO 15 arcsec tiles and were not independently validated.
Using the mean RMSE of the errors computed in grid cells within each 1×1° ETOPO sub-tile, we find that ETOPO has a mean RMSE over land of 7.17 m (Fig. 6). Sub-tiles here are used in order to not geographically bias the validation data to the poles, where more validation data exist. A map of these RMSE errors is provided in Fig. 7. The geographic distribution of errors clearly shows that RMSEs are greater in mountainous regions, a somewhat unsurprising result. The largest RMSEs were seen at the coastline of Antarctica, where unavoidable mismatches can occur at the ice edge where consistently calving icebergs can open large leads and result in open water. ICESat-2 measures a constantly changing surface while ETOPO attempts to represent a snapshot elevation dataset. Persistent negative biases of several meters are seen over the interior of the Greenland and Antarctic ice sheets (where ETOPO showed lower elevations than indicated by ICESat-2). Copernicus DEM's X-band radar signals from the TanDEM-X satellite can penetrate snow and firn by up to several meters, which could cause such biases there. They may also be, at least partially, an artifact of blowing snow caused by persistent katabatic winds, which is corrected for in ICESat-2's ATL06 Land Ice Elevation (Smith et al., 2023) data product but which was not used for these analyses because ATL06 version 5 did not provide indices to map ice elevations back to a photon level as ATL08 does. ATL06 may be worked into future validation efforts of other global DEMs beyond ETOPO 2022.
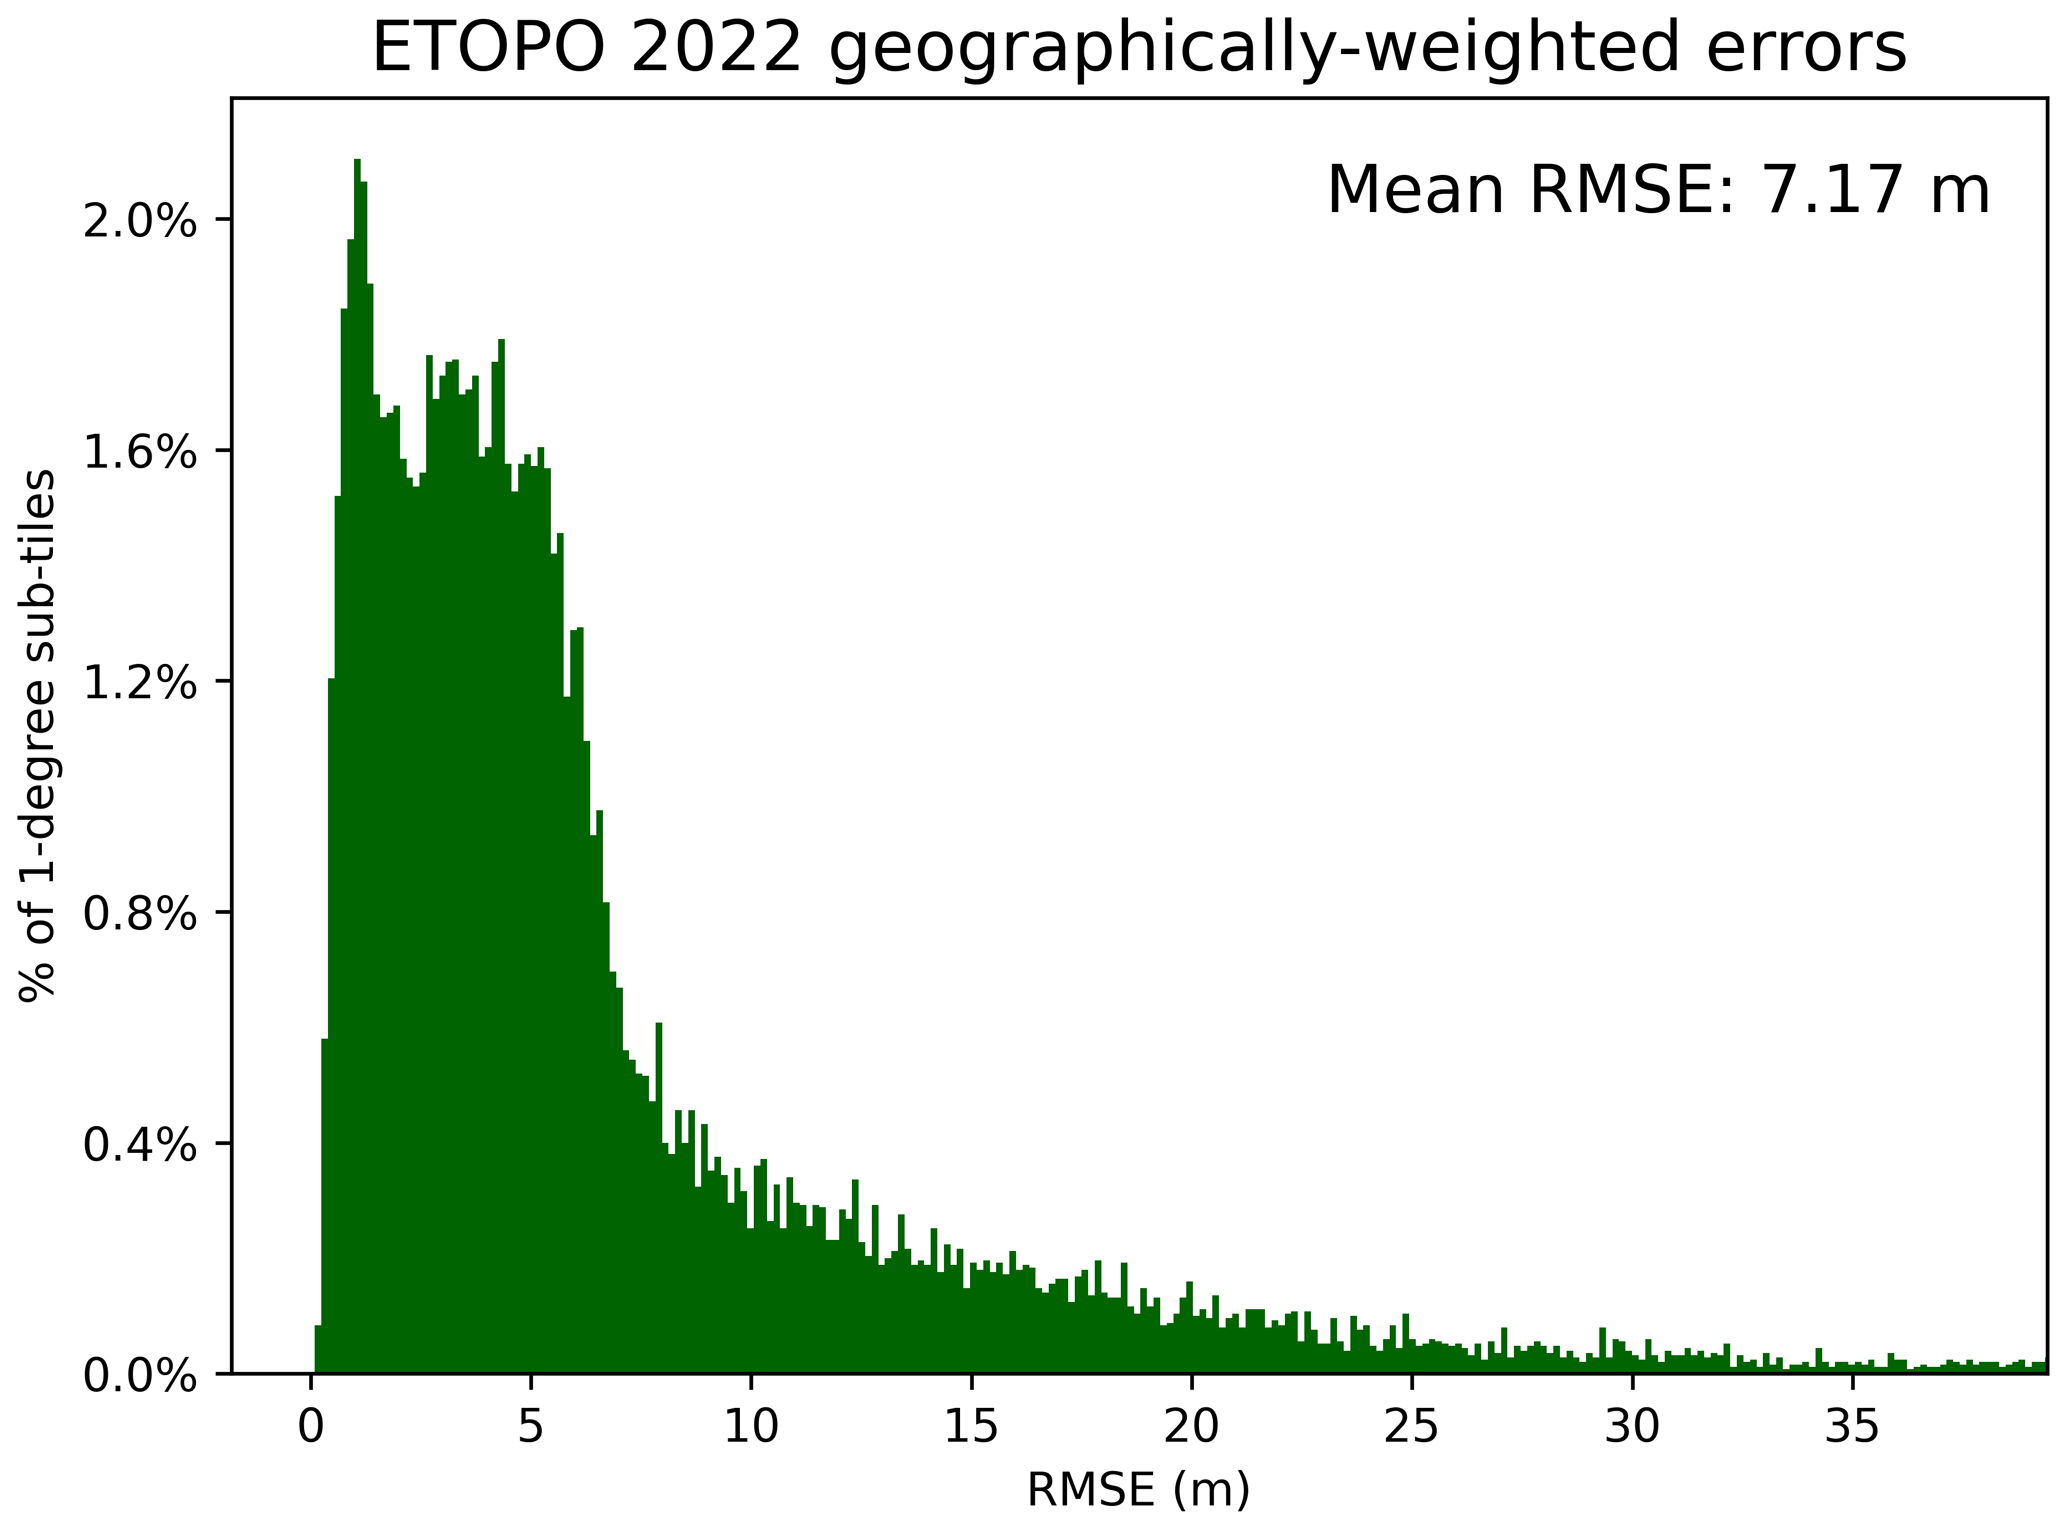
Figure 6Distribution of ICESat-2-derived RMSEs averaged over each 1×1° ETOPO sub-tile over land. The mean RMSE of the dataset is 7.17 m.
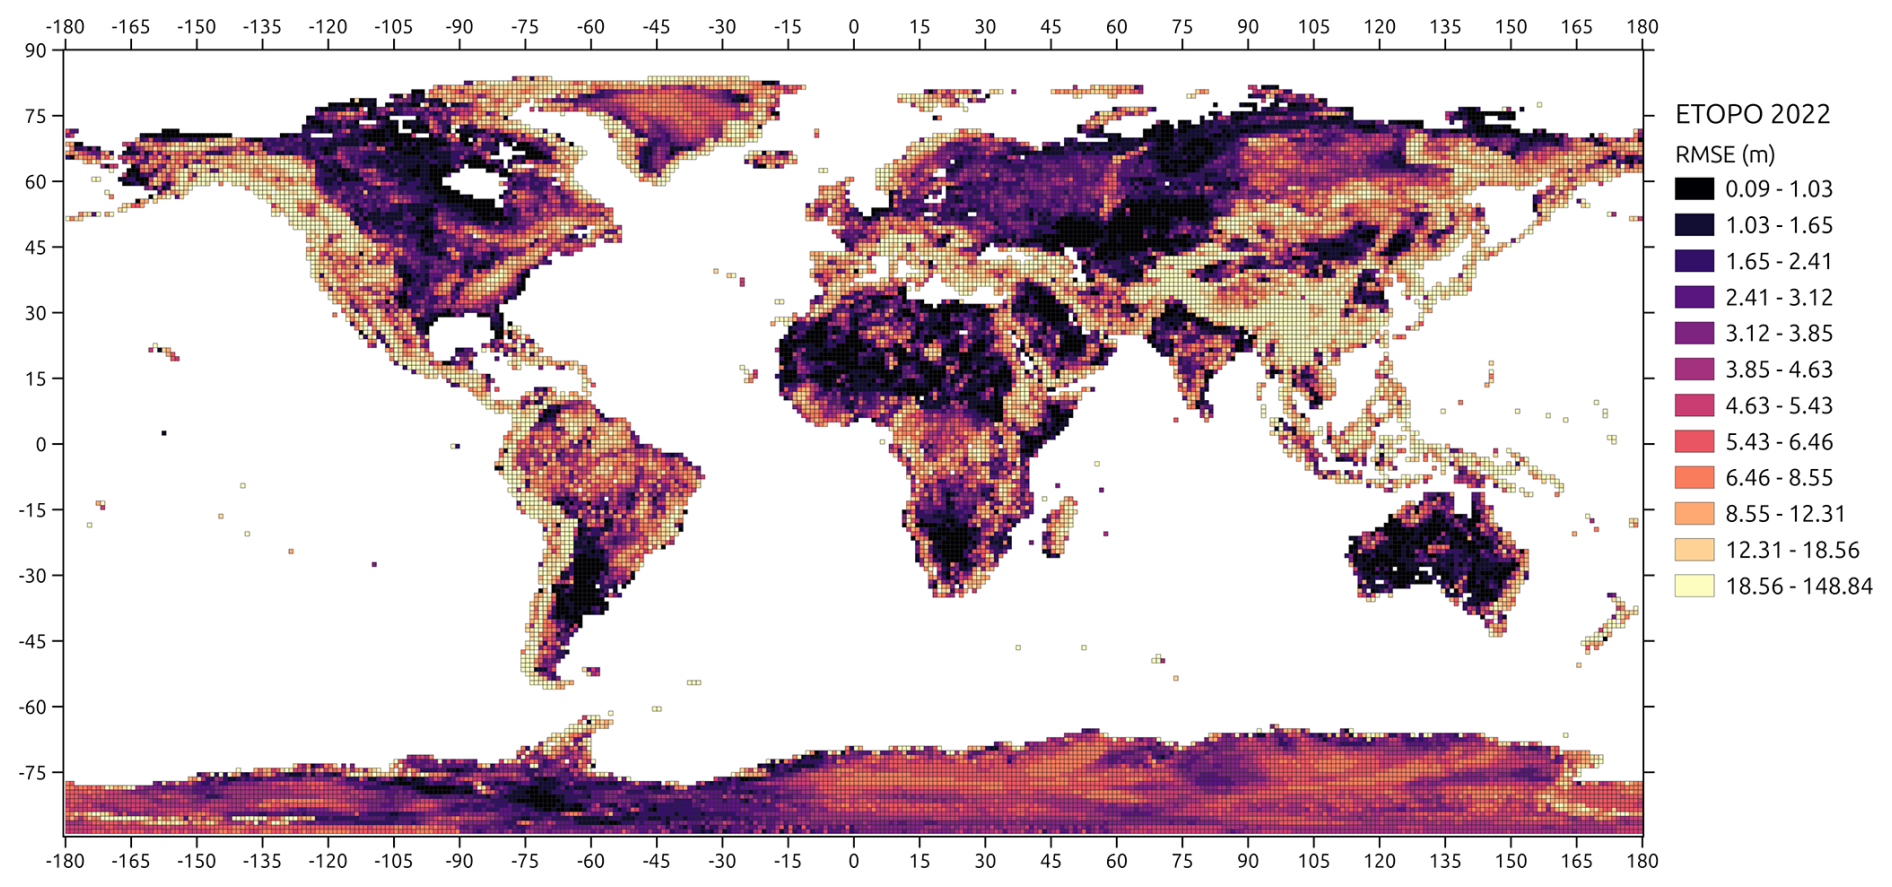
Figure 7Map of RMSEs of 1×1° ETOPO sub-tiles over land, validated against ICESat-2.
To our knowledge, this is one of the few instances where ICESat-2 has been used to validate a DEM on a global scale.
ETOPO1, the previous iteration of NOAA's global seamless topographic–bathymetric Earth elevation data product, was released in 2010 at 1 arcmin resolution, in both ice-surface and ice-bed versions (Amante and Eakins, 2009). Large quantities of elevation source data have been collected globally since ETOPO1's release, and as a result, ETOPO 2022 was built from entirely different datasets than ETOPO1, justifying a direct comparison. We compared the ETOPO 2022 60 arcsec bed and surface grids to the ETOPO1 products on the same grid. Maps of the elevation differences are presented in Figs. 8 and 9.
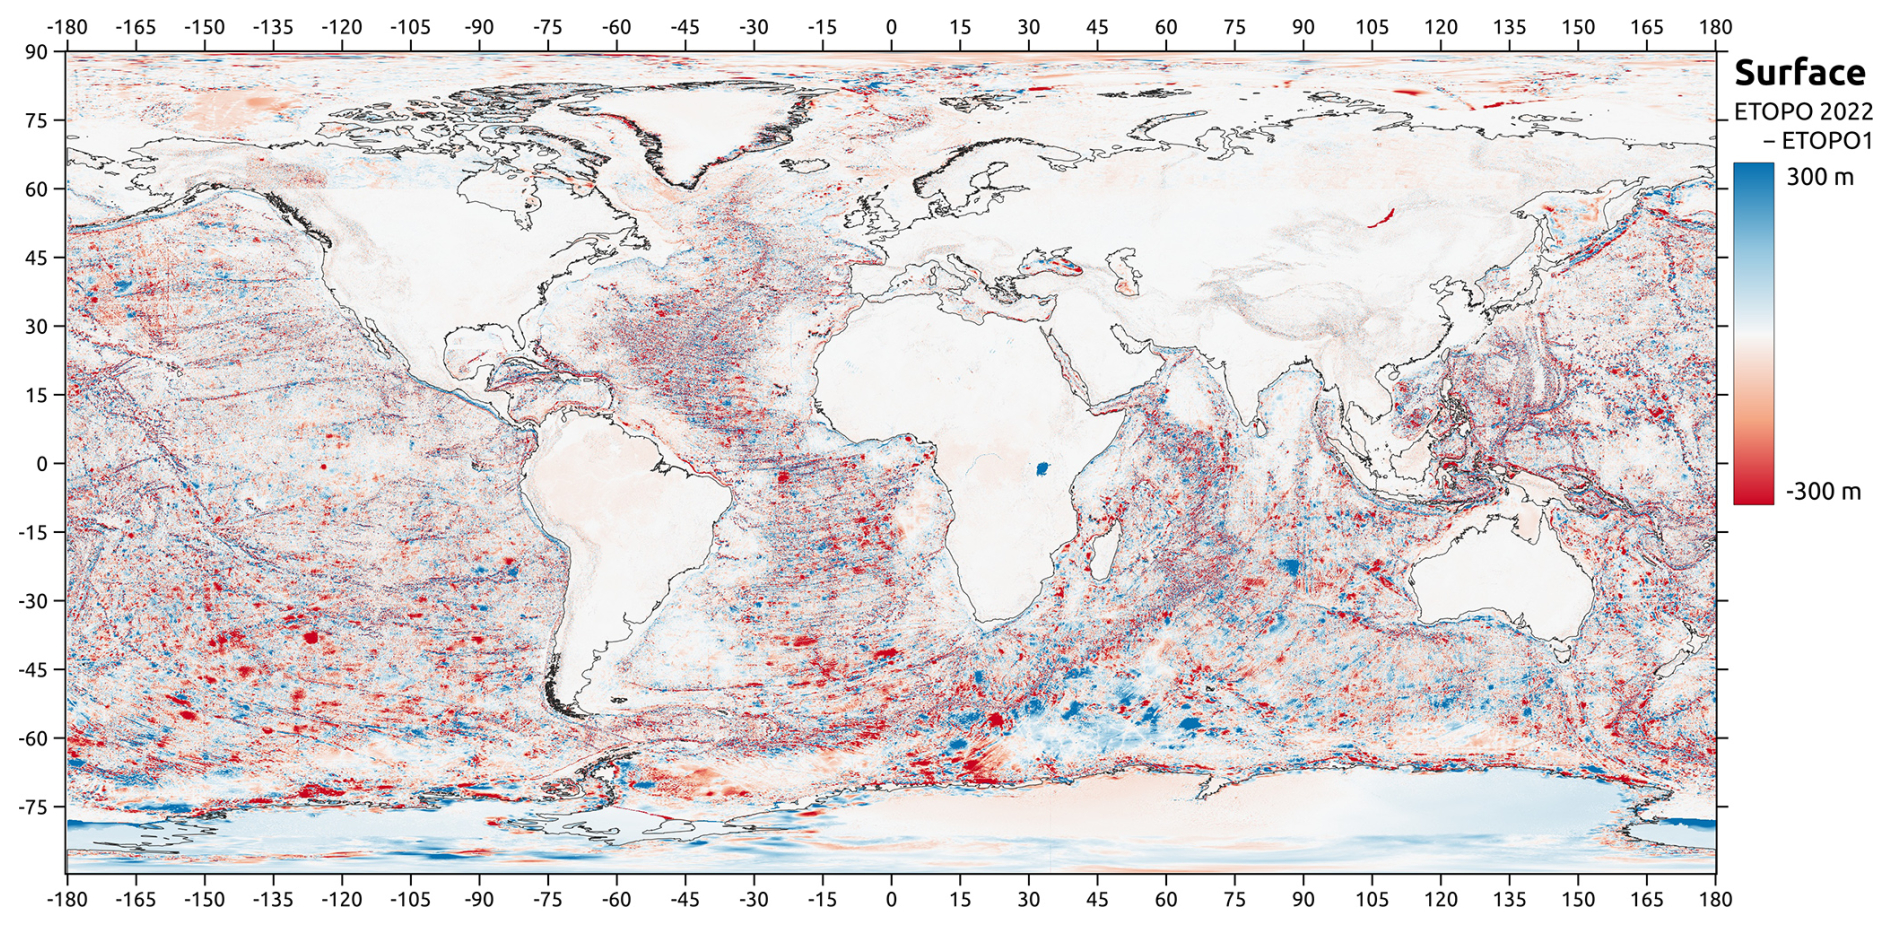
Figure 8Map of elevation differences between ETOPO 2022 and ETOPO1, for ice surface datasets.
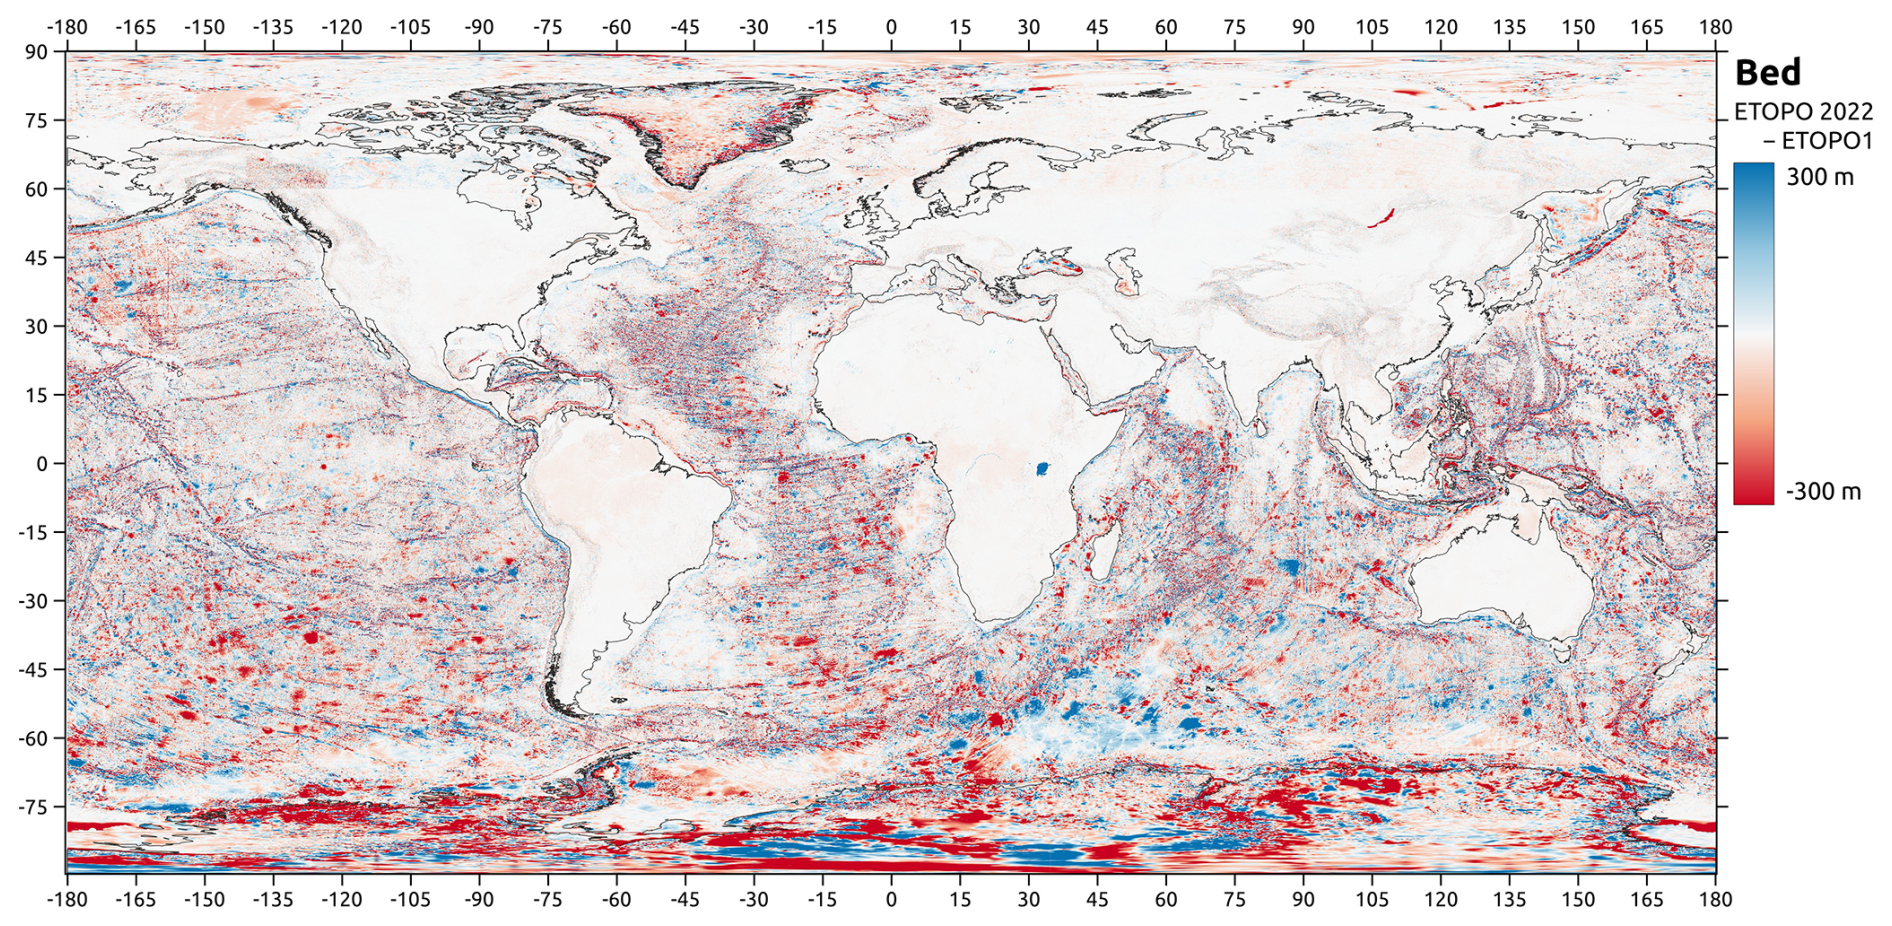
Figure 9Map of elevation differences between ETOPO 2022 and ETOPO1, for ice-bed datasets.
The greatest differences between ETOPO 2022 and the previous ETOPO1 product are in the ice-sheet bed elevations (Fig. 9 and 10d), which show a root-mean-square (RMS) difference of 291 m from ETOPO1 to ETOPO 2022. The large discrepancies between these two datasets are a result of a vastly greater number of direct measurements of the ice-sheet bed from ground-penetrating radar measurements, collected primarily via airborne measurements (MacGregor et al., 2021), and improved physically based interpolations between depth measurements (Morlighem, 2020; Morlighem et al., 2017). Similarly, differences are large between the ocean bathymetries of the two datasets (RMS 152 m), owing to vastly greater volumes of bathymetry data collected from new technologies such as swath-mapping multi-beam sonar. The differences are greatest in the Southern Ocean (Fig. 9), where spaceborne gravimetric bathymetry estimates have improved our understanding of deep ocean bathymetry even where direct measurements remain sparse. Land-elevation differences are relatively smaller (Fig. 10b, RMS 53.4 m). It is worth noting that in areas of heavy canopy cover, most notably in the Amazon and Congo rainforest basins, ETOPO 2022 records lower elevations than ETOPO1, largely due to the post-processing in FABDEM to reduce biases from canopy-top returns in spaceborne radar altimetry collections. Also noteworthy is a visible line at 60° N latitude in northern Canada and Russia. North of this line the elevation differences between ETOPO1 and ETOPO 2022 are of markedly greater magnitudes (both positive and negative) than south of the line. Land surface elevations in ETOPO1 were primarily derived from NASA's Shuttle Radar Topography Mission (SRTM), first released in 2010, which only spanned up to 60° N latitude but excluded the polar regions. Elevations north of that line were derived by other methods, including lower-resolution spaceborne altimeters and digitized map data.
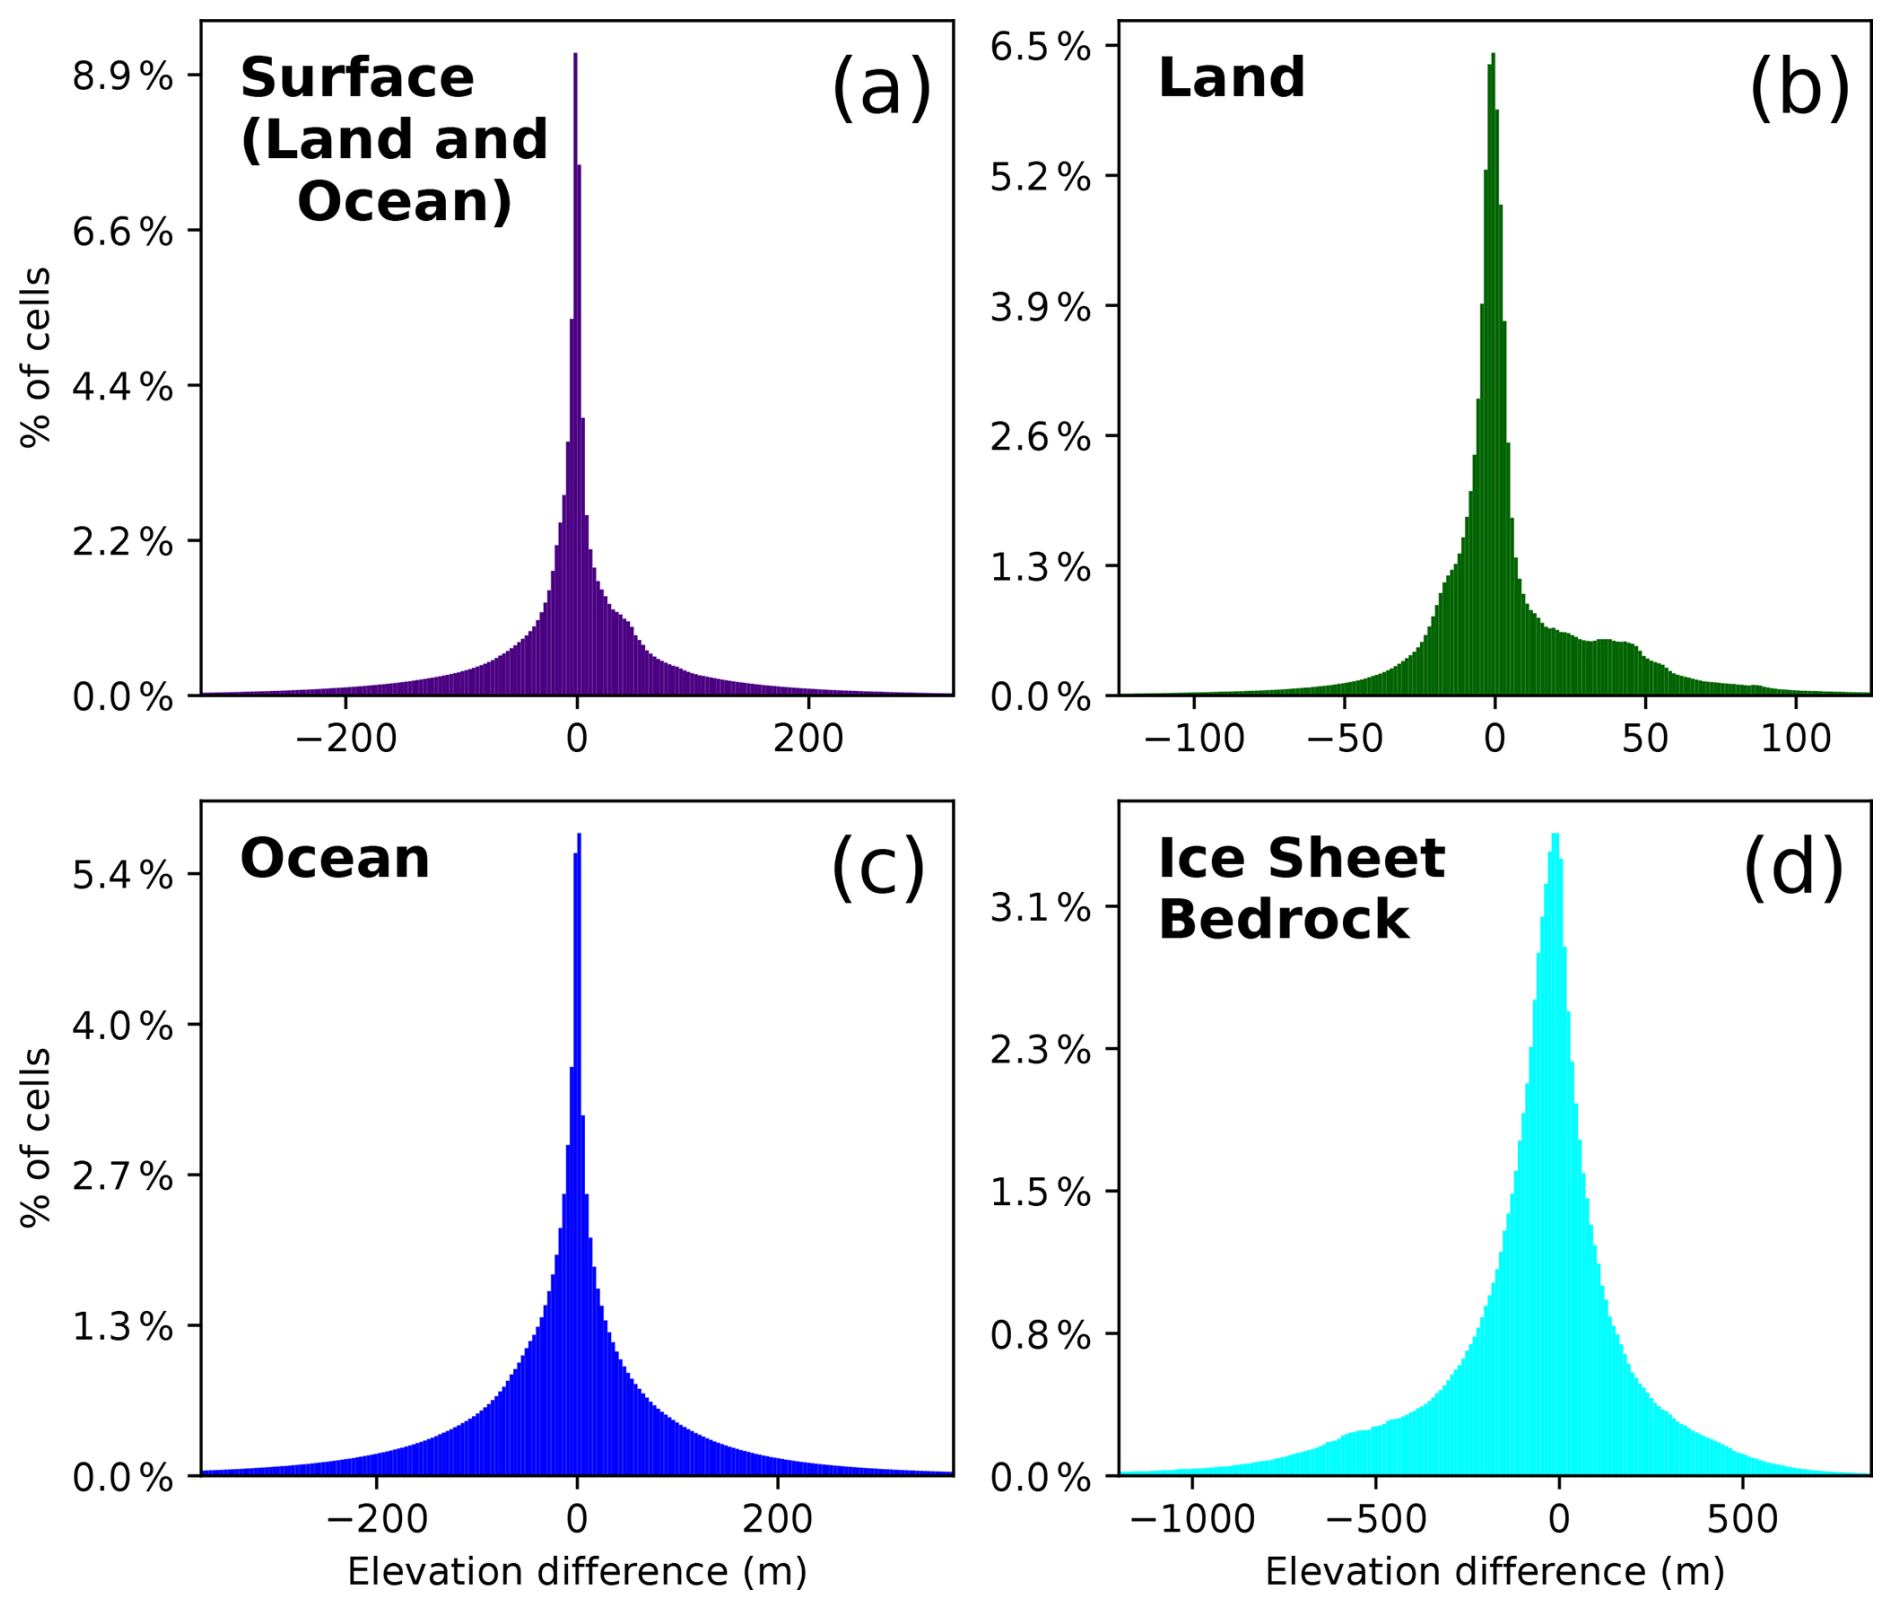
Figure 10Histograms of ETOPO 2022 (60 arcsec) – ETOPO1 elevations, (a) For all land and ocean surface elevations (Fig. 8, full map), (b) for land surface only, (c) for ocean bathymetry only, and (d) for ice-sheet bed elevations (see Greenland and Antarctic ice sheets in Fig. 9). Note the different x axes in the subplots.
ETOPO tiles are freely available to use for all private, academic, or commercial purposes except navigation. Data are available for download on the NOAA ETOPO landing page: https://www.ncei.noaa.gov/products/etopo-global-relief-model (NOAA National Centers for Environmental Information, 2025). Source datasets for ETOPO are all publicly available at their respective data repositories, outlined and referenced in Sect. 3. ETOPO data are covered by a Creative Commons Zero v1.0 Universal (CC0-1.0) license as described in NOAA's metadata description at https://data.noaa.gov/waf/NOAA/NESDIS/NGDC/MGG/DEM//iso/xml/etopo_2022.xml (last access: 22 April 2025). When using ETOPO 2022 data from either link, please reference this paper as well as https://doi.org/10.25921/fd45-gt74 (NOAA National Centers for Environmental Information, 2022).
A vast majority of processing for ETOPO 2022 was performed in Python 3.9, using open-source libraries and tools. The source code for the ETOPO workflow is maintained on its GitHub repository: https://github.com/ciresdem/ETOPO (Coastal DEM Team, 2022). The CUDEM suite of tools that ETOPO relies upon is maintained at its own repository: https://github.com/ciresdem/cudem/tree/version1 (Love et al., 2022), of which the “version 1” snapshot branch was archived when ETOPO 2022 was released. Both code repositories are covered by MIT open-access licenses (licenses viewable at each respective GitHub link).
The ETOPO 2022 User Guide is also available for download on the ETOPO landing page listed above. Although the present article covers the processing steps in greater detail than the User Guide, the latter will be periodically updated whenever errors are found or revisions are made to the data and is seen as the “most current” review of the dataset. The User Guide is recommended reading for data users.
Even with improved technologies, known issues exist in ETOPO 2022 that may be addressed in future versions. Large swaths of ETOPO 2022 ocean bathymetry come from the GEBCO data product, which itself comes from a wide variety of direct measurements and indirect interpolations. Since GEBCO and ETOPO 2022 use the same 15 arcsec global grid, users who wish to see which source dataset GEBCO used in an ETOPO grid cell can download the GEBCO Type Identifier (TID) grids for accompanying GEBCO 2022 tiles (Mayer et al., 2018). Since many regions of the ocean floor remain unmapped by direct surveys, other methods are used to gap-fill direct measurements, such as inverse satellite gravimetry or interpolations between existing surveys. Especially close to the coast, such methods can produce artifacts such as deep “pits” of dozens-to-hundreds of meters depth, which may affect the accuracy of tsunami models and other use-cases in certain regions (Amante and Eakins, 2016). We caution users when relying on GEBCO-derived nearshore bathymetry data to check the TID grids of the GEBCO surveys and pay attention to “indirect measurements” (TID #40–46) in those surveys.
Some ETOPO users may note that elevations in the ETOPO grid do not match known elevations of notable landmarks (e.g., the summit of Mt. Everest). Since ETOPO is computed as a “mean elevation” of a 15 arcsec grid cell (covering approximately ∼211 000 m2 at the Equator), it is natural for there to be at times notable differences between an ETOPO grid elevation and the elevation of a specific point within that cell, especially in steeply sloped terrain. For users wishing for closer matches to individual landmark points, we recommend higher-resolution datasets.
ETOPO 2022 is not intended for navigational use, especially nautical navigation. Ships should rely upon coastal surveys and other bathymetric charts designed for navigational use.
MM was the primary developer of the ETOPO product and ETOPO repository source code. ML was the primary author of the CUDEM source code and supporting software for the ETOPO 2022 project. CA and KC conceived the ETOPO 2022 project and managed its execution, funding, and deployment. All co-authors actively contributed to quality control and review of the ETOPO product in all stages of development and deployment. All co-authors contributed to authorship and edits of this peer-reviewed text.
The contact author has declared that none of the authors has any competing interests.
Publisher's note: Copernicus Publications remains neutral with regard to jurisdictional claims made in the text, published maps, institutional affiliations, or any other geographical representation in this paper. While Copernicus Publications makes every effort to include appropriate place names, the final responsibility lies with the authors.
The Coastal DEM Team would like to specifically thank Kelly Stroker for their continued support and management in ensuring the success of this project.
This research was supported by the National Oceanic and Atmospheric Administration (NOAA) cooperative agreement NA17OAR4320101 and NA22OAR4320151. The statements, findings, conclusions, and recommendations are those of the author(s) and do not necessarily reflect the views of NOAA or the US Department of Commerce.
This paper was edited by Jiafu Mao and reviewed by three anonymous referees.
Amante, C. and Eakins, B. A.: ETOPO1 1 Arc-Minute Global Relief Model: Procedures, Data Sources and Analysis, NOAA Technical Memorandum NESDIS NGDC-24, National Geophysical Data Center, NOAA, https://doi.org/10.7289/V5C8276M, 2009.
Amante, C. J. and Eakins, B. W.: Accuracy of Interpolated Bathymetry in Digital Elevation Models, J. Coastl Res., 76, 123–133, 2016.
Amante, C. J., Love, M., Carignan, K., Sutherland, M. G., MacFerrin, M., and Lim, E.: Continuously Updated Digital Elevation Models (CUDEMs) to Support Coastal Inundation Modeling, Remote Sens., 15, 1702, https://doi.org/10.3390/rs15061702, 2023.
Coastal DEM Group: ETOPO Source Code [Computer software], GitHub [code], https://github.com/ciresdem/ETOPO (last access: 29 September 2022), 2022.
Dubayah, R., Blair, J. B., Goetz, S., Fatoyinbo, L., Hansen, M., Healey, S., Hofton, M., Hurtt, G., Kellner, J., Luthcke, S., Armston, J., Tang, H., Duncanson, L., Hancock, S., Jantz, P., Marselis, S., Patterson, P. L., Qi, W., and Silva, C.: The Global Ecosystem Dynamics Investigation: High-resolution laser ranging of the Earth's forests and topography, Sci. Remote Sens., 1, 100002, https://doi.org/10.1016/j.srs.2020.100002, 2020.
European Space Agency: Copernicus DEM, https://spacedata.copernicus.eu/web/cscda/dataset-details?articleId=394198 (last access: 25 March 2022), 2022.
Forfinski-Sarkozi, N. A. and Parrish, C. E.: Active-Passive Spaceborne Data Fusion for Mapping Nearshore Bathymetry, Photogram. Eng. Remote Sens., 85, 281–295, https://doi.org/10.14358/PERS.85.4.281, 2019.
Friedlingstein, P., O'Sullivan, M., Jones, M. W., Andrew, R. M., Hauck, J., Olsen, A., Peters, G. P., Peters, W., Pongratz, J., Sitch, S., Le Quéré, C., Canadell, J. G., Ciais, P., Jackson, R. B., Alin, S., Aragão, L. E. O. C., Arneth, A., Arora, V., Bates, N. R., Becker, M., Benoit-Cattin, A., Bittig, H. C., Bopp, L., Bultan, S., Chandra, N., Chevallier, F., Chini, L. P., Evans, W., Florentie, L., Forster, P. M., Gasser, T., Gehlen, M., Gilfillan, D., Gkritzalis, T., Gregor, L., Gruber, N., Harris, I., Hartung, K., Haverd, V., Houghton, R. A., Ilyina, T., Jain, A. K., Joetzjer, E., Kadono, K., Kato, E., Kitidis, V., Korsbakken, J. I., Landschützer, P., Lefèvre, N., Lenton, A., Lienert, S., Liu, Z., Lombardozzi, D., Marland, G., Metzl, N., Munro, D. R., Nabel, J. E. M. S., Nakaoka, S.-I., Niwa, Y., O'Brien, K., Ono, T., Palmer, P. I., Pierrot, D., Poulter, B., Resplandy, L., Robertson, E., Rödenbeck, C., Schwinger, J., Séférian, R., Skjelvan, I., Smith, A. J. P., Sutton, A. J., Tanhua, T., Tans, P. P., Tian, H., Tilbrook, B., van der Werf, G., Vuichard, N., Walker, A. P., Wanninkhof, R., Watson, A. J., Willis, D., Wiltshire, A. J., Yuan, W., Yue, X., and Zaehle, S.: Global Carbon Budget 2020, Earth Syst. Sci. Data, 12, 3269–3340, https://doi.org/10.5194/essd-12-3269-2020, 2020.
GEBCO Compilation Group: GEBCO_2022 Grid, https://doi.org/10.5285/e0f0bb80-ab44-2739-e053-6c86abc0289c, 2022.
Hawker, L., Uhe, P., Paulo, L., Sosa, J., Savage, J., Sampson, C., and Neal, J.: A 30 m global map of elevation with forests and buildings removed, Environ. Res. Lett., 17, 024016, https://doi.org/10.1088/1748-9326/ac4d4f, 2022.
John, M. D., Campbell, K. J., and Devine, C. A.: BOEM's 3DX-Based Regional Bathymetric Data Set, Deepwater Gulf of Mexico: Automated Seafloor Characterization, Geohazards Assessment, and Engineering Planning, in: Offshore Technology Conference, April 2018, Houston, Texas, USA, https://doi.org/10.4043/28804-MS, 2018.
Khazaei, B., Read, L. K., Casali, M., Sampson, K. M., and Yates, D. N.: GLOBathy, the global lakes bathymetry dataset, Sci. Data, 9, 36, https://doi.org/10.1038/s41597-022-01132-9, 2022.
Love, M., Amante, C., Carignan, K., MacFerrin, M., and Lim, E.: CUDEM (Version 1.0) [Computer software], GitHub [code], https://github.com/ciresdem/cudem/tree/version1 (last access: 29 September 2022), 2022.
MacGregor, J. A., Boisvert, L. N., Medley, B., Petty, A. A., Harbeck, J. P., Bell, R. E., Blair, J. B., Blanchard-Wrigglesworth, E., Buckley, E. M., Christoffersen, M. S., Cochran, J. R., Csathó, B. M., Marco, E. L. D., Dominguez, R. T., Fahnestock, M. A., Farrell, S. L., Gogineni, S. P., Greenbaum, J. S., Hansen, C. M., Hofton, M. A., Holt, J. W., Jezek, K. C., Koenig, L. S., Kurtz, N. T., Kwok, R., Larsen, C. F., Leuschen, C. J., Locke, C. D., Manizade, S. S., Martin, S., Neumann, T. A., Nowicki, S. M. J., Paden, J. D., Richter-Menge, J. A., Rignot, E. J., Rodríguez-Morales, F., Siegfried, M. R., Smith, B. E., Sonntag, J. G., Studinger, M., Tinto, K. J., Truffer, M., Wagner, T. P., Woods, J. E., Young, D. A., and Yungel, J. K.: The Scientific Legacy of NASA's Operation IceBridge, Rev. Geophys., 59, e2020RG000712, https://doi.org/10.1029/2020RG000712, 2021.
Marconcini, M., Metz-Marconcini, A., Üreyen, S., Palacios-Lopez, D., Hanke, W., Bachofer, F., Zeidler, J., Esch, T., Gorelick, N., Kakarla, A., Paganini, M., and Strano, E.: Outlining where humans live, the World Settlement Footprint 2015, Sci. Data, 7, 242, https://doi.org/10.1038/s41597-020-00580-5, 2020.
Mayer, L., Jakobsson, M., Allen, G., Dorschel, B., Falconer, R., Ferrini, V., Lamarche, G., Snaith, H., and Weatherall, P.: The Nippon Foundation – GEBCO Seabed 2030 Project: The Quest to See the World's Oceans Completely Mapped by 2030, Geosciences, 8, 63, https://doi.org/10.3390/geosciences8020063, 2018.
Messager, M. L., Lehner, B., Grill, G., Nedeva, I., and Schmitt, O.: Estimating the volume and age of water stored in global lakes using a geo-statistical approach, Nat. Commun., 7, 13603, https://doi.org/10.1038/ncomms13603, 2016.
Moore, R. B., McKay, L. D., Rea, A. H., Bondelid, T. R., Price, C. V., Dewald, T. G., and Johnston, C. M.: User's guide for the National Hydrography Dataset plus (NHDPlus) High Resolution., Open-File Rep., US Geol. Surv., https://doi.org/10.3133/ofr20191096, 2019.
Morlighem, M.: MEaSUREs BedMachine Antarctica, Version 2, NASA National Snow and Ice Data Center Distributed Active Archive Center, https://doi.org/10.5067/E1QL9HFQ7A8M, 2020.
Morlighem, M., Williams, C. N., Rignot, E., An, L., Arndt, J. E., Bamber, J. L., Catania, G., Chauché, N., Dowdeswell, J. A., Dorschel, B., Fenty, I., Hogan, K., Howat, I., Hubbard, A., Jakobsson, M., Jordan, T. M., Kjeldsen, K. K., Millan, R., Mayer, L., Mouginot, J., Noël, B. P. Y., O'Cofaigh, C., Palmer, S., Rysgaard, S., Seroussi, H., Siegert, M. J., Slabon, P., Straneo, F., van den Broeke, M. R., Weinrebe, W., Wood, M., and Zinglersen, K. B.: BedMachine v3: Complete Bed Topography and Ocean Bathymetry Mapping of Greenland From Multibeam Echo Sounding Combined With Mass Conservation, Geophys. Res. Lett., 44, 11051–11061, https://doi.org/10.1002/2017GL074954, 2017.
National Centers for Environmental Information: Estuarine Bathymetric Digital Elevation Models, https://www.ncei.noaa.gov/products/estuarine-bathymetric-digital-elevation-models (last access: 7 November 2023), 2020.
National Centers for Environmental Information: NOAA Regional DEMs, https://www.ngdc.noaa.gov/thredds/catalog/regional/catalog.html (last access: 8 December 2022), 2022.
Neal, J., Hawker, L., Uhe, P., Paulo, L., Sosa, J., Savage, J., and Sampson, C.: FABDEM V1-2, University of Bristol, https://doi.org/10.5523/bris.s5hqmjcdj8yo2ibzi9b4ew3sn, 2023.
NOAA National Centers for Environmental Information: ETOPO 2022 15 Arc-Second Global Relief Model, NOAA National Centers for Environmental Information [data set], https://doi.org/10.25921/fd45-gt74, 2022.
NOAA National Centers for Environmental Information: ETOPO Global Relief Model, https://www.ncei.noaa.gov/products/etopo-global-relief-model (last access: 22 April 2025), 2025.
Neuenschwander, A. and Pitts, K.: The ATL08 land and vegetation product for the ICESat-2 Mission, Remote Sens. Environ., 221, 247–259, https://doi.org/10.1016/j.rse.2018.11.005, 2019.
Neuenschwander, A. L. and Magruder, L. A.: Canopy and Terrain Height Retrievals with ICESat-2: A First Look, Remote Sens., 11, 1721, https://doi.org/10.3390/rs11141721, 2019.
Neumann, T. A., Brenner, A., Hancock, D., Robbins, J., Saba, J., Harbeck, K., Gibbons, A., Lee, J., Luthcke, S. B., and Rebold, T.: ATLAS/ICESat-2 L2A Global Geolocated Photon Data, Version 5, NSIDC, https://doi.org/10.5067/ATLAS/ATL03.005, 2021.
Potapov, P., Li, X., Hernandez-Serna, A., Tyukavina, A., Hansen, M. C., Kommareddy, A., Pickens, A., Turubanova, S., Tang, H., Silva, C. E., Armston, J., Dubayah, R., Blair, J. B., and Hofton, M.: Mapping global forest canopy height through integration of GEDI and Landsat data, Remote Sens. Environ., 253, 112165, https://doi.org/10.1016/j.rse.2020.112165, 2021.
Rodríguez, E., Morris, C. S., and Belz, J. E.: A Global Assessment of the SRTM Performance, Photogram. Eng. Remote Sens., 72, 249–260, https://doi.org/10.14358/PERS.72.3.249, 2006.
Ryan, W. B. F., Carbotte, S. M., Coplan, J. O., O'Hara, S., Melkonian, A., Arko, R., Weissel, R. A., Ferrini, V., Goodwillie, A., Nitsche, F., Bonczkowski, J., and Zemsky, R.: Global Multi-Resolution Topography synthesis, Geochem. Geophys. Geosy., 10, Q03014, https://doi.org/10.1029/2008GC002332, 2009.
Schmidtko, S., Stramma, L., and Visbeck, M.: Decline in global oceanic oxygen content during the past five decades, Nature, 542, 335–339, https://doi.org/10.1038/nature21399, 2017.
Smith, B., Adusumilli,S., Csathó, B. M., Felikson, D., Fricker, H. A., Gardner, A., Holschuh, N., Lee, J., Nilsson, J., Paolo, F. S., Siegfried, M. R., Sutterley, T., and the ICESat-2 Science Team: ATLAS/ICESat-2 L3A Land Ice Height, Version 6, NASA National Snow and Ice Data Center Distributed Active Archive Center, https://doi.org/10.5067/ATLAS/ATL06.006, 2023.
Tozer, B., Sandwell, D. T., Smith, W. H. F., Olson, C., Beale, J. R., and Wessel, P.: Global Bathymetry and Topography at 15 Arc Sec: SRTM15+, Earth Space Sci., 6, 1847–1864, https://doi.org/10.1029/2019EA000658, 2019.
US Department of Commerce: NOAA/NOS Vertical Datums Transformation: https://vdatum.noaa.gov/welcome.html (last access: 6 November 2023), 2022.
US Office of Coast Survey: BlueTopo, https://www.nauticalcharts.noaa.gov/data/bluetopo.html (last access: 6 November 2023), 2022.
Woodruff, J. D., Irish, J. L., and Camargo, S. J.: Coastal flooding by tropical cyclones and sea-level rise, Nature, 504, 44–52, https://doi.org/10.1038/nature12855, 2013.
- Abstract
- Introduction
- Data description
- Input datasets and pre-processing
- Methods
- Validation methods
- Validation results
- Comparison with ETOPO1
- Code and data availability
- Known issues and limitations
- Author contributions
- Competing interests
- Disclaimer
- Acknowledgements
- Financial support
- Review statement
- References