the Creative Commons Attribution 4.0 License.
the Creative Commons Attribution 4.0 License.
 | 28 Apr 2025
Permafrost temperature baseline at 15 m depth on the Qinghai–Tibetan Plateau (2010–2019)
Guojie Hu
Erji Du
Guangyue Liu
Chong Wang
Wangping Li
Ground temperature at a fixed depth is a crucial boundary condition for understanding the properties of deep permafrost. However, the commonly used mean annual ground temperature at the depth of the zero annual amplitude (MAGTDZAA) has certain limitations for extensive application due to large spatial heterogeneity at observed depths. In this study, we utilized 231 borehole records of mean annual ground temperature at a depth of 15 m (MAGT15 m) from 2010 to 2019 and employed a method of support vector regression (SVR) to predict the gridded MAGT15 m at a spatial resolution of nearly 1 km across the Qinghai–Tibetan Plateau (QTP). The SVR model predictions demonstrated an R2 value of 0.48 with a negligible negative overestimation (−0.01 °C). The average MAGT15 m of the QTP permafrost was −1.85 ± 1.58 °C, with 90 % of the values ranging from −5.1 to −0.1 °C and 51.2 % greater than −1.5 °C. The ground surface freezing degree day (FDD) was the most significant predictor (p<0.001) of MAGT15 m, followed by the ground surface thawing degree day (TDD), mean annual precipitation (MAP), and soil bulk density (BD) (p<0.01). Overall, the MAGT15 m increased from northwest to southeast and decreased with rising elevation. Lower MAGT15 m values prevail in high mountainous areas with steep slopes. The MAGT15 m was lowest in the headwater areas of the Amu Darya, Indus, and Tarim river basins (−2.9 to −2.7 °C) and highest in the headwater areas of the Yangtze and Yellow river basins (−0.9 to −0.8 °C). The baseline dataset of the MAGT15 m for the QTP permafrost regions during 2010–2019 will facilitate simulations of deep permafrost characteristics and provide fundamental data for permafrost model validation and improvement. The dataset is openly available in the National Tibetan Plateau Data Center (https://doi.org/10.11888/Cryos.tpdc.301165, Zou et al., 2024b).
- Article
(6983 KB) - Full-text XML
- BibTeX
- EndNote


The ground temperature in a given depth range is a fundamental indicator for characterizing the thermal state of permafrost (Romanovsky et al., 2010). However, obtaining ground temperature at a deep depth is challenging due to the harsh climatic conditions in permafrost regions and time-consuming drilling operations (Zhao et al., 2024). Previous studies have commonly used the mean annual ground temperature (MAGT) at the depth of the zero annual amplitude (DZAA, representing the maximum depth that seasonal surface temperature variations can penetrate) (Dobinski, 2011). Biskaborn et al. (2019) used records of the MAGT at the DZAA (MAGTDZAA), demonstrating that most of the permafrost had experienced warming at a global scale with various magnitudes. The rate of increase in the MAGTDZAA is approximately 1 °C per decade in colder permafrost regions in the high-latitude Arctic and 0.3 °C per decade in warmer permafrost in the sub-Arctic regions (Smith et al., 2022).
In addition to indicating permafrost warming at a specific location, the assembled MAGTDZAA records can be utilized to map regional permafrost occurrence using spatialization methods. For instance, Aalto et al. (2018) produced a map of circum-Arctic permafrost based on MAGTDZAA derived from statistical forecasting models. However, these maps often do not include permafrost extent to the south of 30° N in the Northern Hemisphere. Although the European Space Agency (ESA) Climate Change Initiative (CCI) provides permafrost MAGT products for the Northern Hemisphere (Obu et al., 2021), the deepest depth reached is only 10 m, limiting the applicability to regions where the DZAA exceeds 10 m, such as the Qinghai–Tibetan Plateau (QTP). Recently, Ran et al. (2022) updated the Northern Hemisphere permafrost map by incorporating more observed MAGTDZAA data from the QTP and Northeast China and employing multiple machine learning models, demonstrating significant advancements in mapping permafrost distribution and thermal state.
A critical consideration is the DZAA variability across different regions because it depends on permafrost dynamics. Measurements from 1002 boreholes have shown that the DZAAs range from approximately 3 to 25 m in different permafrost regions (Ran et al., 2022). The DZAAs are typically shallower in peat and mineral soils and deeper in bedrock (Smith et al., 2010). The DZAAs generally range from 10 to 15 m in Central Asia, depending on surface land cover and substrate properties (Zhao et al., 2010). Furthermore, DZAAs undergo change with permafrost warming, as evidenced by in situ observations indicating a decrease rate of 0.14–0.17 m per year near the northern limit of elevational permafrost on the QTP from 2005 to 2017, leading to consequent changes in MAGTDZAA (Liu et al., 2021). The spatial and temporal variability of DZAAs complicates the use of the predicted MAGTDZAA maps for comparison and calibration with transient modeling results at specific depths and also limits their utility in estimating characteristics of permafrost at greater depths (e.g., permafrost thickness). Hence, establishing a baseline of MAGT at a specific depth and for a specific period is crucial for permafrost modeling studies.
The QTP has the largest permafrost region at low and middle latitudes and a typical high-altitude permafrost area (Zou et al., 2017). Over the past 2 decades, permafrost monitoring efforts on the QTP have established a substantial monitoring network and ground temperature datasets have been published (Zhao et al., 2021). Particularly since 2010, extensive monitoring has been conducted by various research groups in multiple regions, resulting in updated datasets. This study aims to establish a fixed-depth deep permafrost temperature baseline using data from the QTP for a decade (2010–2019) and a machine learning approach to address the limitations associated with the use of MAGTDZAA. Considering the availability of ground temperature records, the data of MAGT at 15 m depth are used for spatialization. The resulting dataset can serve as a reference for model simulations during this period and provide an upper boundary condition for estimating characteristics of permafrost at greater depths.
2.1 Compilation and processing of MAGT data
The dataset of mean annual ground temperature at 15 m depth (MAGT15 m) across the QTP permafrost regions consisted of a total of 231 boreholes (Fig. 1). For this dataset, 122 measurements were obtained from the permafrost monitoring networks of the QTP (Zhao et al., 2021) established by the Cryosphere Research Station, Chinese Academy of Sciences (CRS-CAS). The remaining 109 measurements were compiled from published articles (Cao et al., 2018; Li et al., 2012, 2014, 2016; Luo et al., 2012, 2013, 2018a; Sun et al., 2018; Liu and Shi, 2019). The observational period was from 2010 to 2019. The ground temperature in the boreholes was measured using a cable equipped with a string of thermistors at various depths. The thermistor probe was assembled and calibrated by the State Key Laboratory of Frozen Soil Engineering (SKLFSE, CAS), with a measurement accuracy of ±0.05 °C under laboratory conditions (Wu et al., 2010). All ground temperature measurements were obtained using the same equipment, ensuring the comparability of MAGT15 m across various permafrost regions.
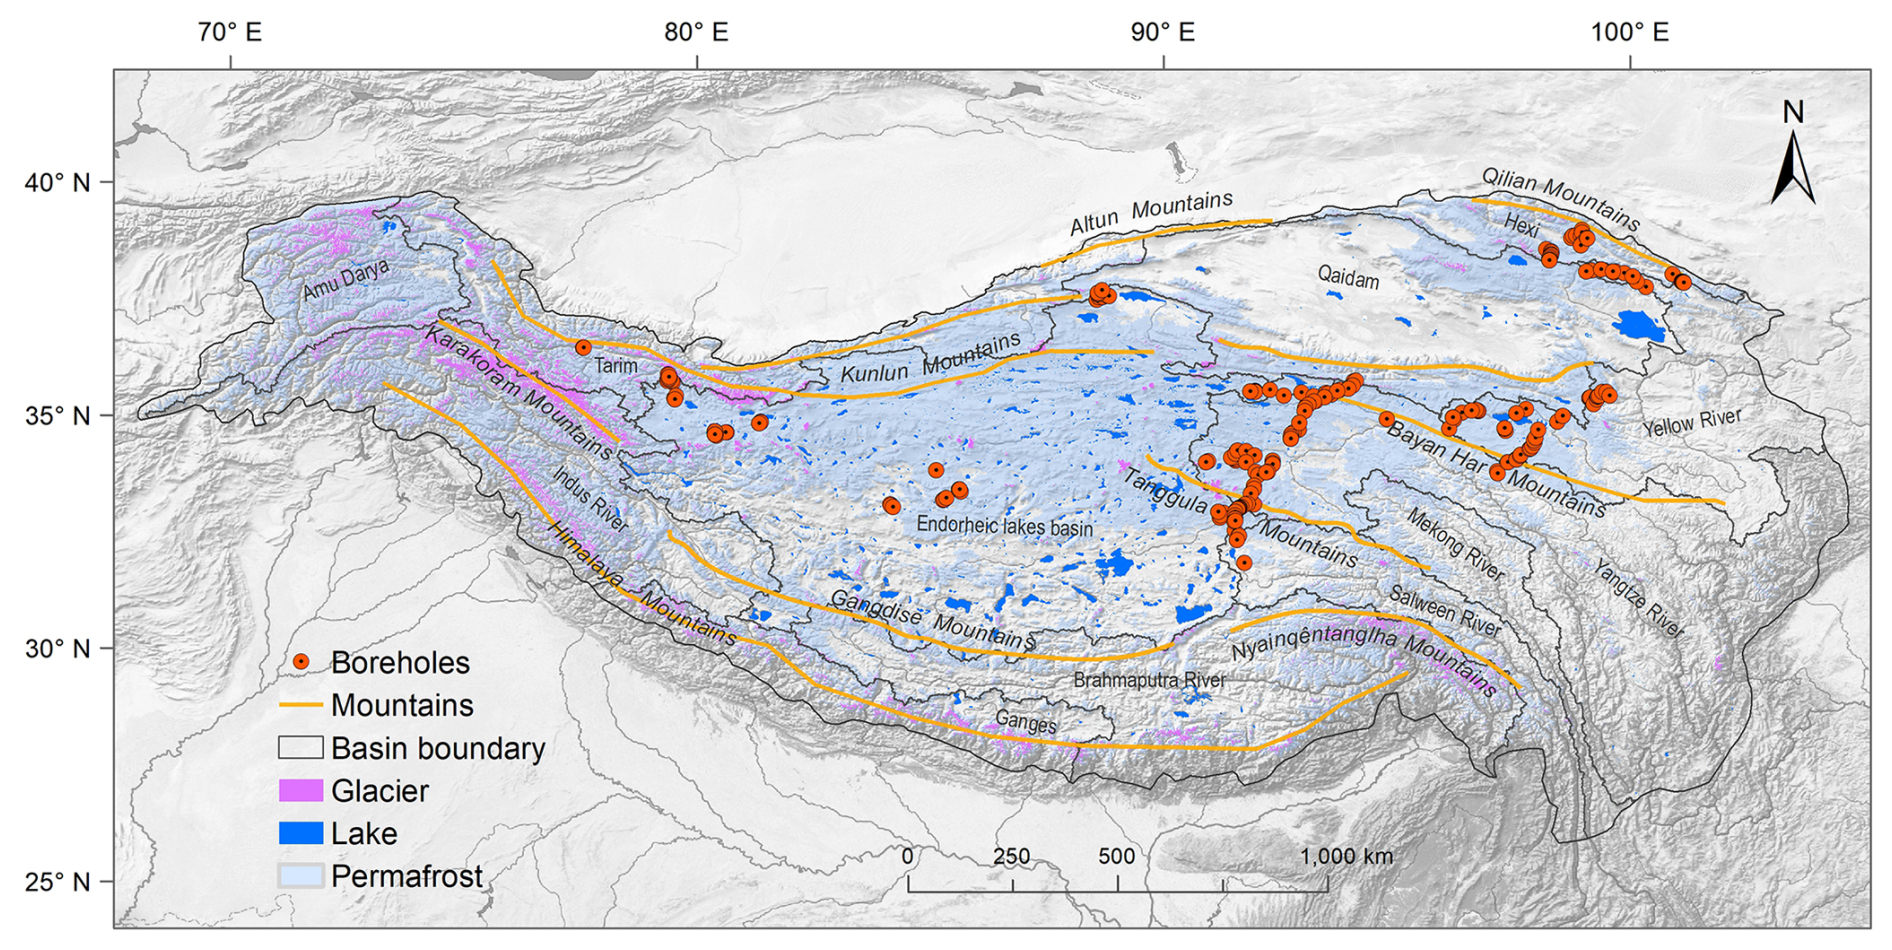
Figure 1Distribution of boreholes (n=231) for monitoring mean annual ground temperature at 15 m depth (MAGT15 m) on the Qinghai–Tibetan Plateau.
Of the 231 boreholes, 180 sites (approximately 78 %) only had single-year observations. To ensure that each site had values for each year from 2010 to 2019, we implemented the following processes:
-
For sites with multiple years of MAGT15 m observations, we calculated the warming rates from 2010 to 2019 (Fig. 2a) and established the linear relationship between the warming rates and the average MAGT15 m (2010–2019) (Fig. 2b). A rigorous selection process was used for the sites, with a minimum requirement of 3 observation years and a time span of 6 years. This selection criterion ensured that the chosen sites provided a robust basis for calculating the warming rate. Consequently, 51 sites were included in the analysis. The MAGT15 m range for these sites was −3.95 to 0.03 °C, encompassing a diverse temperature range in the dataset.
-
For sites that did not meet the first criterion, i.e., sites with observations of less than 3 years or a time span of less than 6 years (a total of 180 sites), we used the following linear relationship (Eq. 1) to estimate the missing values:
where the MAGT15 m warming rate represents the rate of warming in MAGT15 m from 2010 to 2019 and MAGT15 m is the mean MAGT value at a depth of 15 m from 2010 to 2019. As a result, approximately 1732 MAGT15 m values were estimated through linear regression, which accounts for 75 % of the total dataset.
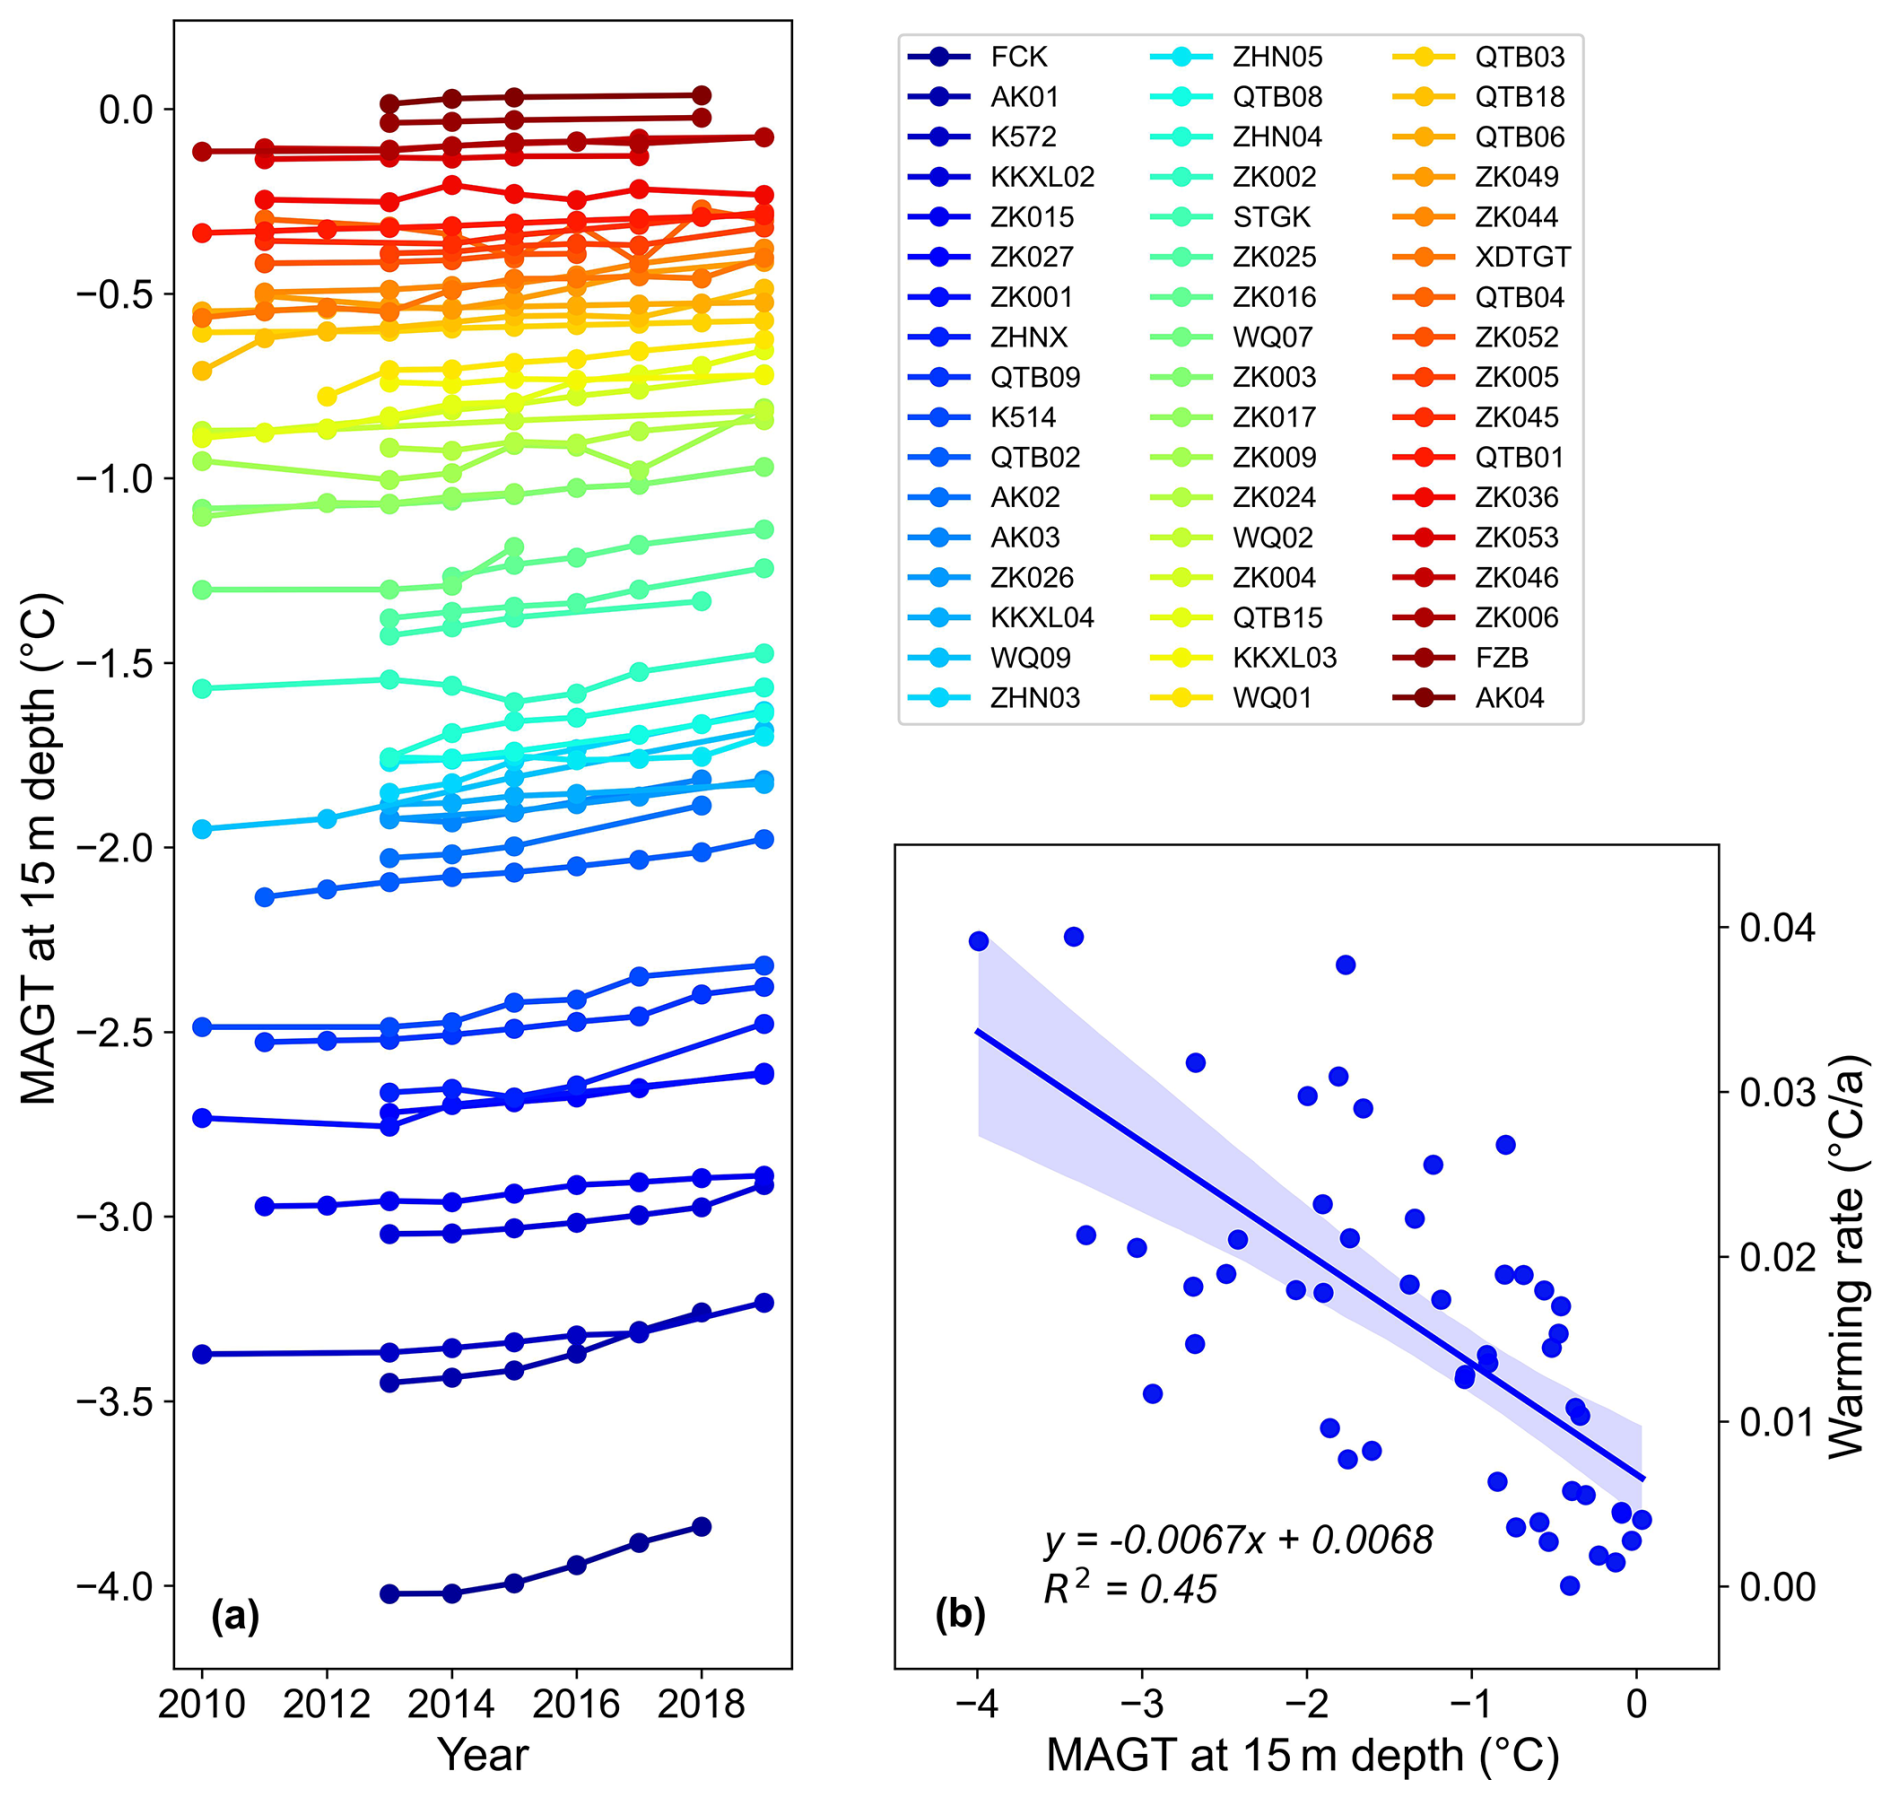
Figure 2Warming rates of MAGT15 m during 2010–2019 (a) and the relationship between warming rates and the average MAGT15 m (b).
After obtaining the yearly MAGT15 m values for all of the sites from 2010 to 2019, we computed the mean MAGT15 m value during the 10 years. It was used as the input for regional MAGT15 m predictions. This approach ensured the integration of long-term trends and provided a representative estimate of the regional MAGT.
2.2 Statistical learning model
In this study, the support vector regression (SVR) method (Basak et al., 2007) was adopted to predict the MAGT15 m. Although several machine learning models, including generalized linear model (GLM), generalized additive model (GAM), random forest (RF), and geographically weighted regression (GWR), have been commonly used in various regression analyses (Aalto et al., 2018; Wang et al., 2020; Ran et al., 2022), the SVR method has demonstrated better performance in predicting the MAGT in the QTP permafrost regions compared to other methods (Ran et al., 2021). Moreover, SVR is a deterministic prediction method, ensuring consistent and reproducible results for a fixed set of sample points, contributing to the reliability and replicability of predictions.
The SVR was implemented using the R package e1071. SVR is a nonparametric technique that seeks to find a function deviating from observations by a value not exceeding a threshold (ε) for the training points while minimizing the prediction error. The output model depends on kernel functions. Thus, the default radial kernel function has been utilized in this study. Model parameter selection was performed using a tuning method, with a cost parameter of 1000 employed to prevent overfitting and a gamma value of 0.0001. Model performance was assessed using the bias, root-mean-square error (RMSE), and coefficient of determination (R2) computed using 10-fold cross-validation with 1000 iterations. In each run, 90 % of the measurements were used to train the SVR model and the remaining 10 % to test predictions.
2.3 Environmental and climate data
Nine environmental and climate variables were selected in the prediction of MAGT15 m using the SVR method. They were selected based on previous studies (e.g., Aalto et al., 2018; Ran et al., 2021), and these variables were derived from high-quality datasets available at present (Table 1).
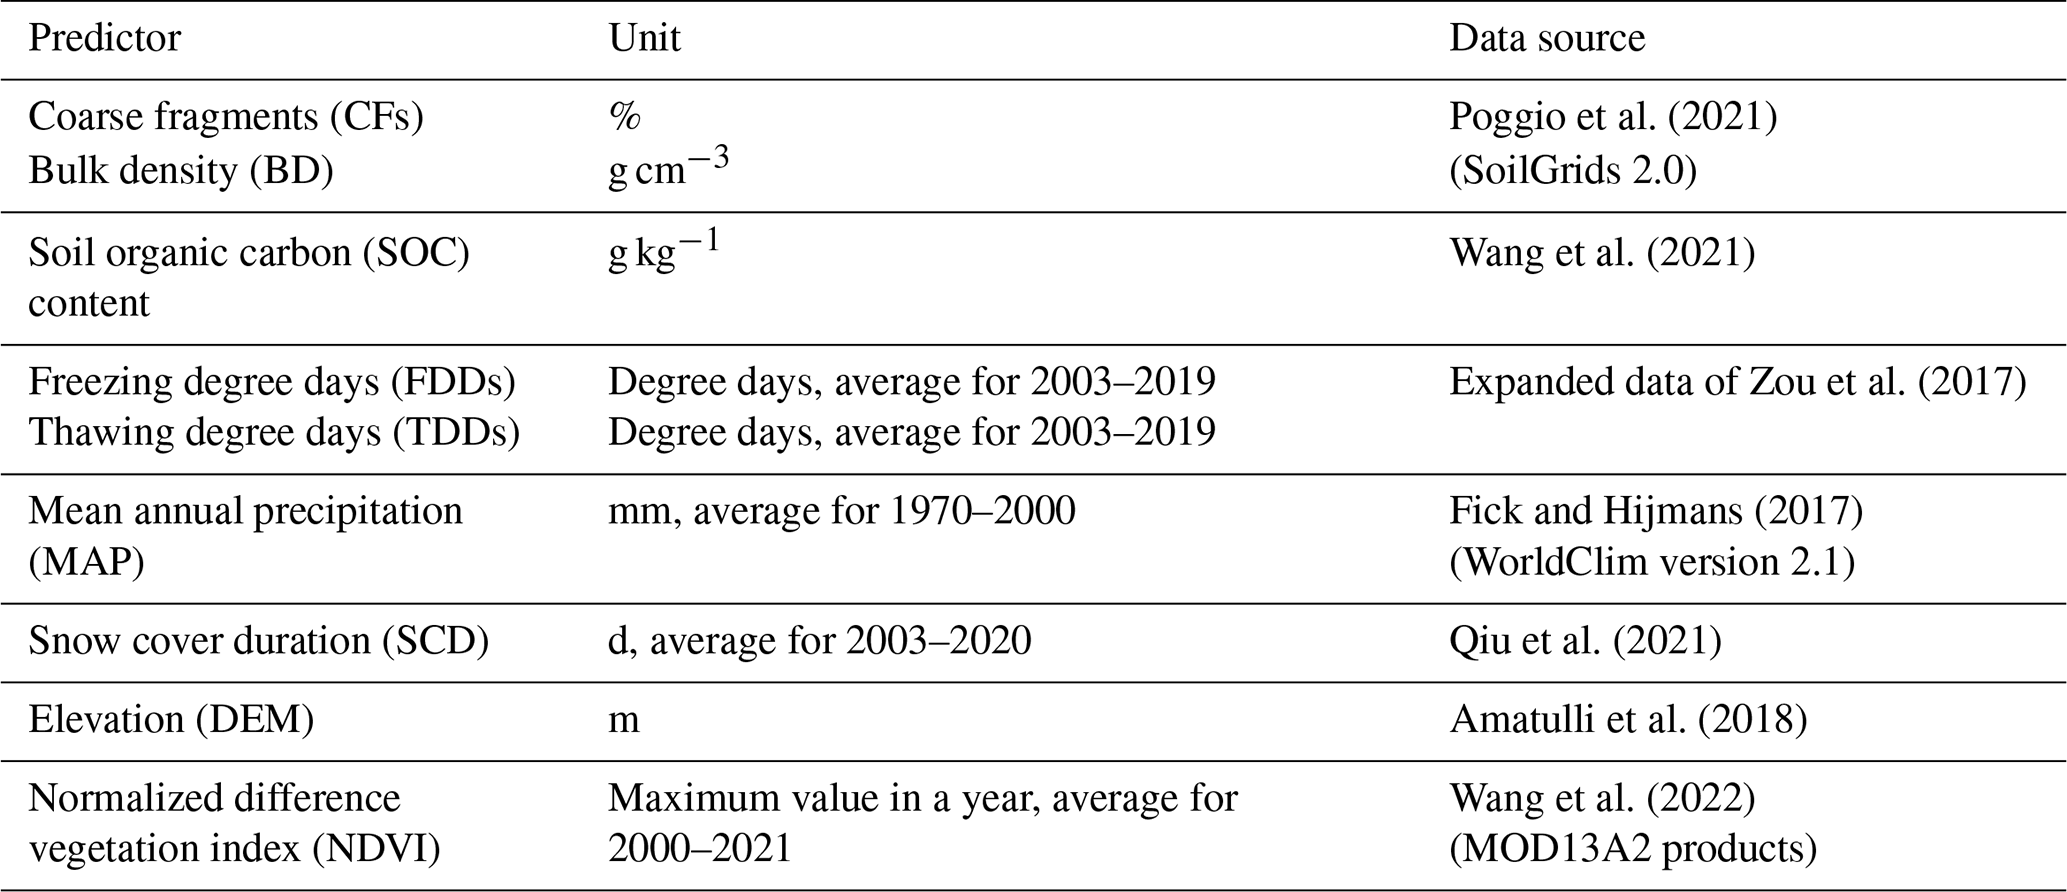
Volumetric coarse fragments (CFs, %) and bulk density (BD, g cm−3) in the soils were obtained from the SoilGrids 2.0 data (Poggio et al., 2021) with a spatial resolution of 1 × 1 km. In addition to soil texture, soil organic carbon (SOC, g kg−1) content data from the Third Pole (Wang et al., 2021) were used. Average values for a depth range of 0–2 m were used for all soil factors as model inputs. The number of freezing degree days (FDDs) and thawing degree days (TDDs) based on ground surface temperature (GST) were calculated following the method of Zou et al. (2017), and the data period was expanded to 2003–2019. GST, corrected based on the MODIS land surface temperature (LST), was selected in this study due to its superior performance to air temperature in permafrost modeling (Luo et al., 2018b). Mean annual precipitation (MAP, mm) from 1970 to 2000 was derived from the WorldClim version 2.1 dataset (Fick and Hijmans, 2017). Snow cover duration (SCD, d) from 2003 to 2020 was derived from the MODIS daily cloud-free snow cover product (Qiu et al., 2021). The multiyear averages of FDD, TDD, MAP, and SCD were calculated and used as model inputs. The elevation at 1 km resolution was obtained from a dataset compiled by Amatulli et al. (2018). The multiyear averaged maximum value of the normalized difference vegetation index (NDVI) from 2000 to 2021 was derived from the MOD13A2 products (Wang et al., 2022).
2.4 Ancillary data
Prior to calculating statistics, the SVR predictions were resampled to a spatial resolution of 1 km by 1 km. Additionally, areas covered by glaciers and lakes were masked from the output results. Glacier areas were masked using the Randolph Glacier Inventory (RGI6.0) data obtained from the National Snow and Ice Data Center (https://nsidc.org/data/nsidc-0770/versions/6, last access: 6 March 2024). Lake areas were masked by referencing the dataset of “lakes larger than 1 km2 in the Tibetan Plateau (v3.1) (1970–2022)” (Zhang et al., 2019) provided by the National Tibetan Plateau Data Center (http://data.tpdc.ac.cn/, last access: 6 March 2024).
3.1 Model performance
The cross-validation of 1000 runs demonstrated that the mean values of the three statistical indicators, i.e., bias, RMSE, and coefficient of determination (R2), were −0.01 °C (±0.11 °C), 0.71 °C (±0.13 °C), and 0.48 (±0.14), respectively. Figure 3 shows the scatterplot depicting the relationship between the predicted and observed MAGT15 m values. The fitted line is close to the 1:1 line, with a bias and RMSE of 0.01 and 0.73 °C, respectively, indicating a close agreement with the cross-validation results. The predictions exhibited slight underestimations at high MAGT15 m values and overestimations at lower ones.
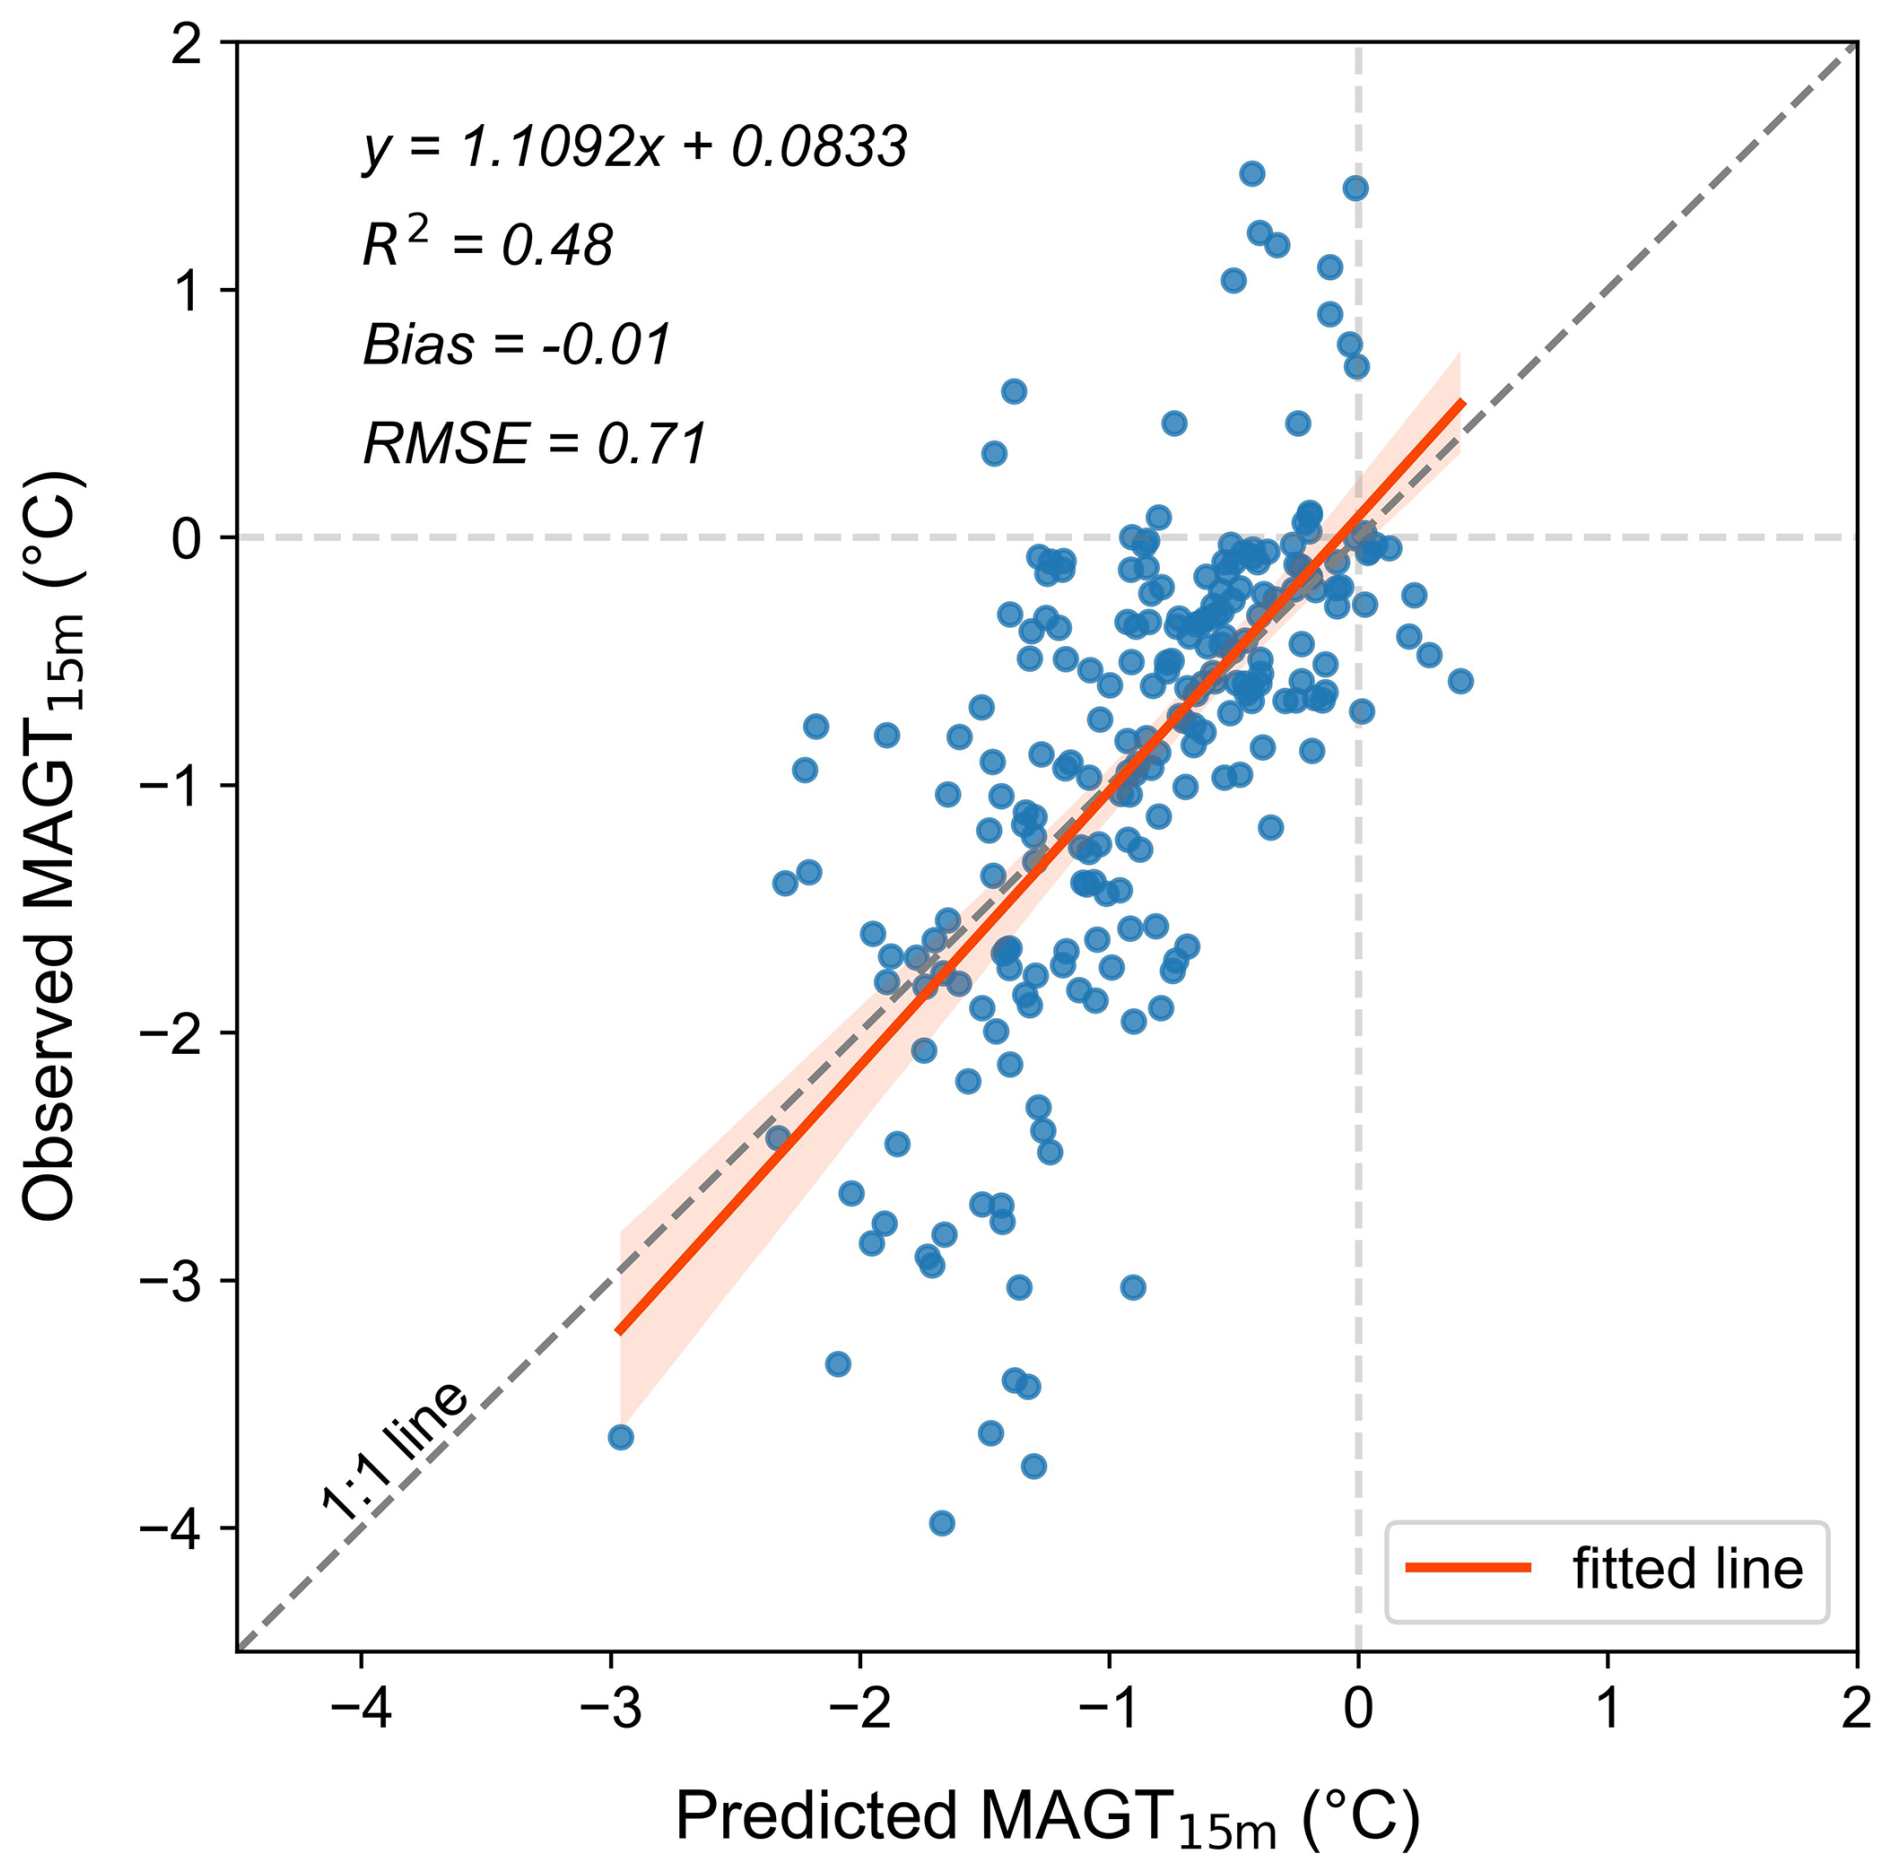
Figure 3Relationship between predicted and observed mean annual ground temperatures at 15 m depth (MAGT15 m) in permafrost regions on the Qinghai–Tibetan Plateau during 2010–2019.
Multilinear regression analysis revealed that the contribution of FDD to the MAGT15 m prediction was highly significant (p<0.001), whereas those of the TDD, MAP, and BD were significant (p<0.01). However, the contributions of the remaining five factors (DEM, SCD, SOC, CF, and NDVI) were insignificant. Overall, at the plateau scale, the ground surface temperature (especially for FDD), precipitation, and soil bulk density contributed the most to MAGT15 m, whereas the other environmental and climate factors modified this influence at the regional scale.
3.2 Distributive characteristics
3.2.1 General distribution characteristics of MAGT15 m
Figure 4 illustrates the spatial distribution patterns of the predicted MAGT15 m on the QTP for the period 2010–2019. Overall, the MAGT15 m exhibited a southeastward increasing trend. The regions with the lowest MAGT15 m (depicted as dark blue in Fig. 4) were primarily located in the high mountain regions of the western QTP, e.g., the western Kunlun, Karakoram, and western Himalaya mountains (as displayed in Fig. 1). Regions with lower MAGT15 m values were predominantly found in the central Kunlun, Tanggula, and Qilian mountains of the northern QTP. MAGT15 m increased southward and eastward, with high values concentrated in the majority of the Yangtze and Yellow river source areas as well as the southern areas of the endorheic lake basin. In other high mountainous regions, such as the Altun, Gangdise, eastern Himalaya, and Nyainqêntanglha mountains, MAGT15 m decreased rapidly over short distances due to the steep mountainous terrain.
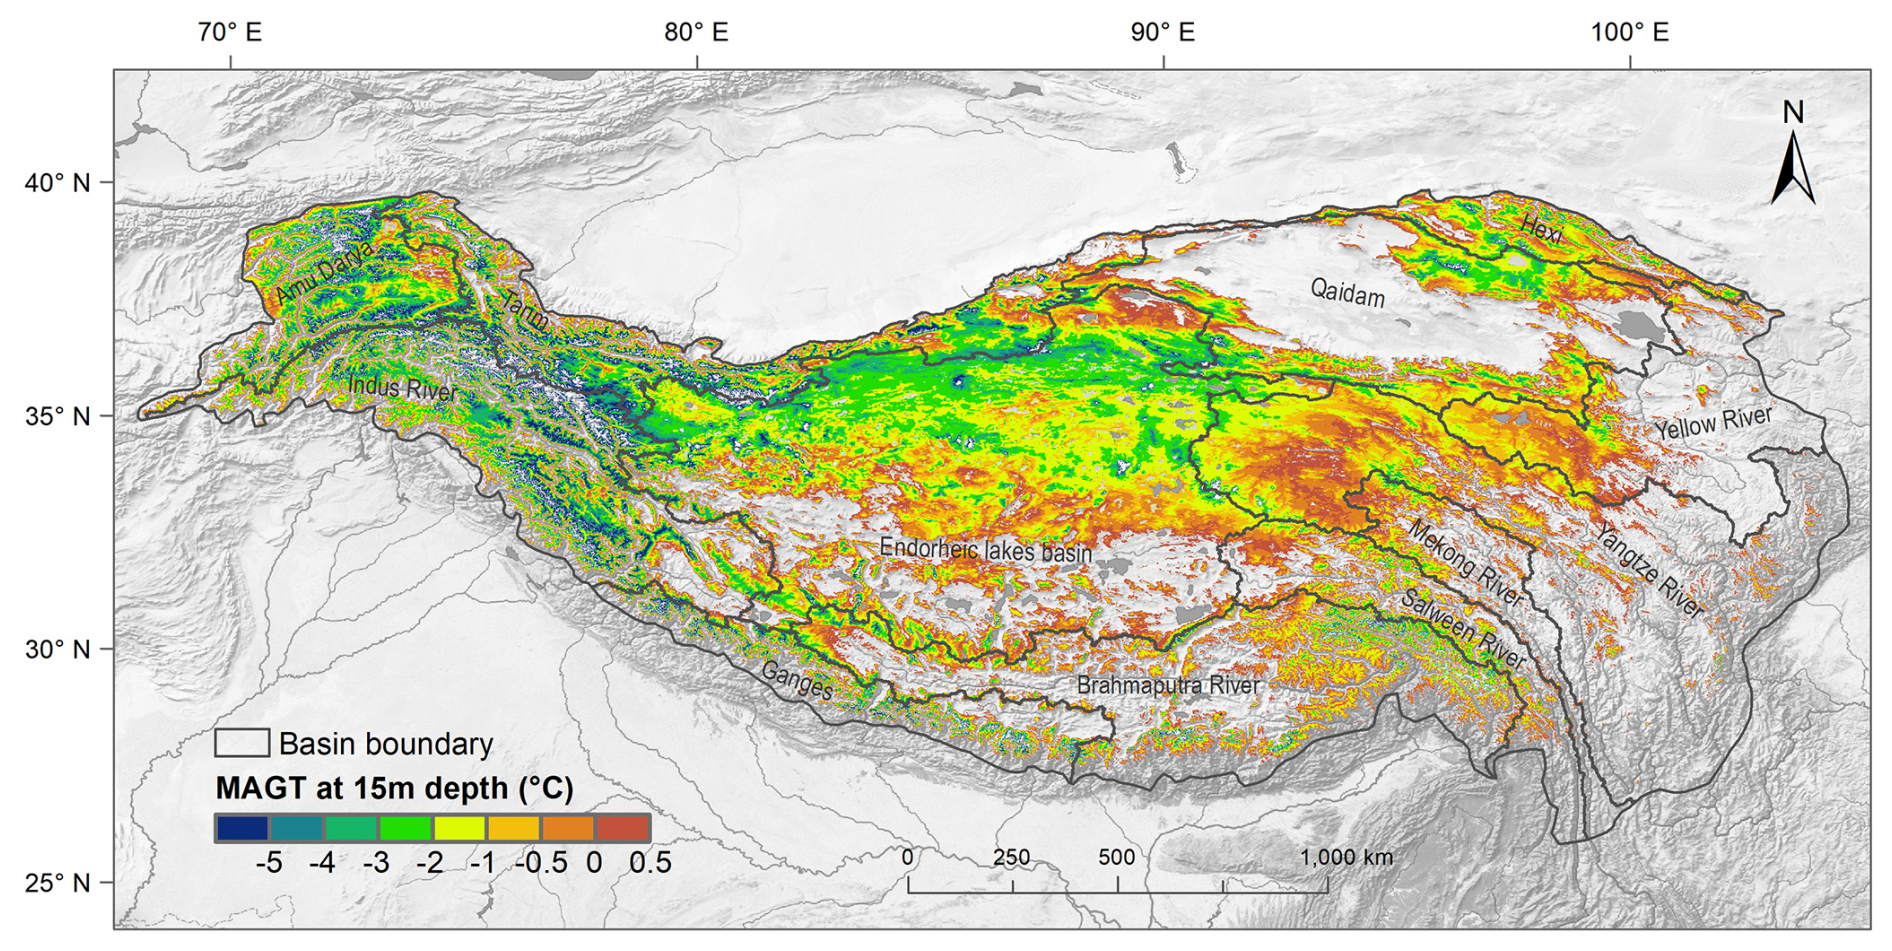
Figure 4Spatial distribution of the predicted MAGT15 m across the Qinghai–Tibetan Plateau during 2010–2019.
The regions with negative MAGT15 m values covered an area of 1.36 × 10⁶ km2 (excluding glacier and lake areas), accounting for approximately 44.0 % of the total QTP area. The average MAGT15 m was −1.85 ± 1.58 °C, and 90 % of the MAGT15 m values ranged from −5.1 to −0.1 °C. The zoning statistics of MAGT15 m indicated that the area with extremely low values was relatively small. The area with MAGT15 m below −5 °C was 0.07 × 10⁶ km2, accounting for only 5.1 % of the regions with negative MAGT15 m. The area with MAGT15 m below −3 °C was 0.25 × 10⁶ km2, representing 18.1 % of the regions with negative MAGT15 m. The areas for the MAGT15 m ranges of −3 to −2 °C, −2 to −1 °C, and −1 to 0 °C were 0.24, 0.38, and 0.49 × 10⁶ km2, accounting for 17.8 %, 28.0 %, and 36.1 %, respectively.
The three-dimensional ground thermal states across the QTP were investigated based on the predicted MAGT15 m. Figure 5a illustrates the distribution of the MAGT15 m at different elevations and the percentage of area. Area analysis reveals that approximately 90 % of the MAGT15 m values fell in the elevation range of 3840 to 5570 m a.s.l. Generally, MAGT15 m demonstrated a decreasing trend as elevation increased, and the variability in MAGT15 m was more pronounced at higher elevations and was less significant at lower elevations. Meanwhile, the lapse rate of MAGT15 m was relatively low at lower elevations and increased as the elevation rose.
The MAGT15 m in the west-to-east longitudinal transect increased monotonously (Fig. 5b). The western regions of the plateau exhibited the lowest MAGT15 m values (e.g., approximately −3 °C in the longitude range of 72 to 78° E), whereas the easternmost areas had the highest values (approximately −1 °C to the east of 100° E). Concurrently, the amplitude of the temperature variations gradually declined with the eastward-rising MAGT15 m. Figure 5c illustrates the MAGT15 m trend in the latitudinal transect. The regional average MAGT15 m was generally stable, at approximately −1.5 °C from 28° N in the Himalaya to 33° N in the Tanggula Mountains. MAGT15 m decreased slightly from 33° N northwards, and the average was lower than in areas south of 33° N. The lowest latitudinal MAGT15 m values occurred near 36° N, primarily in the regions of the Kunlun and Karakoram mountains.
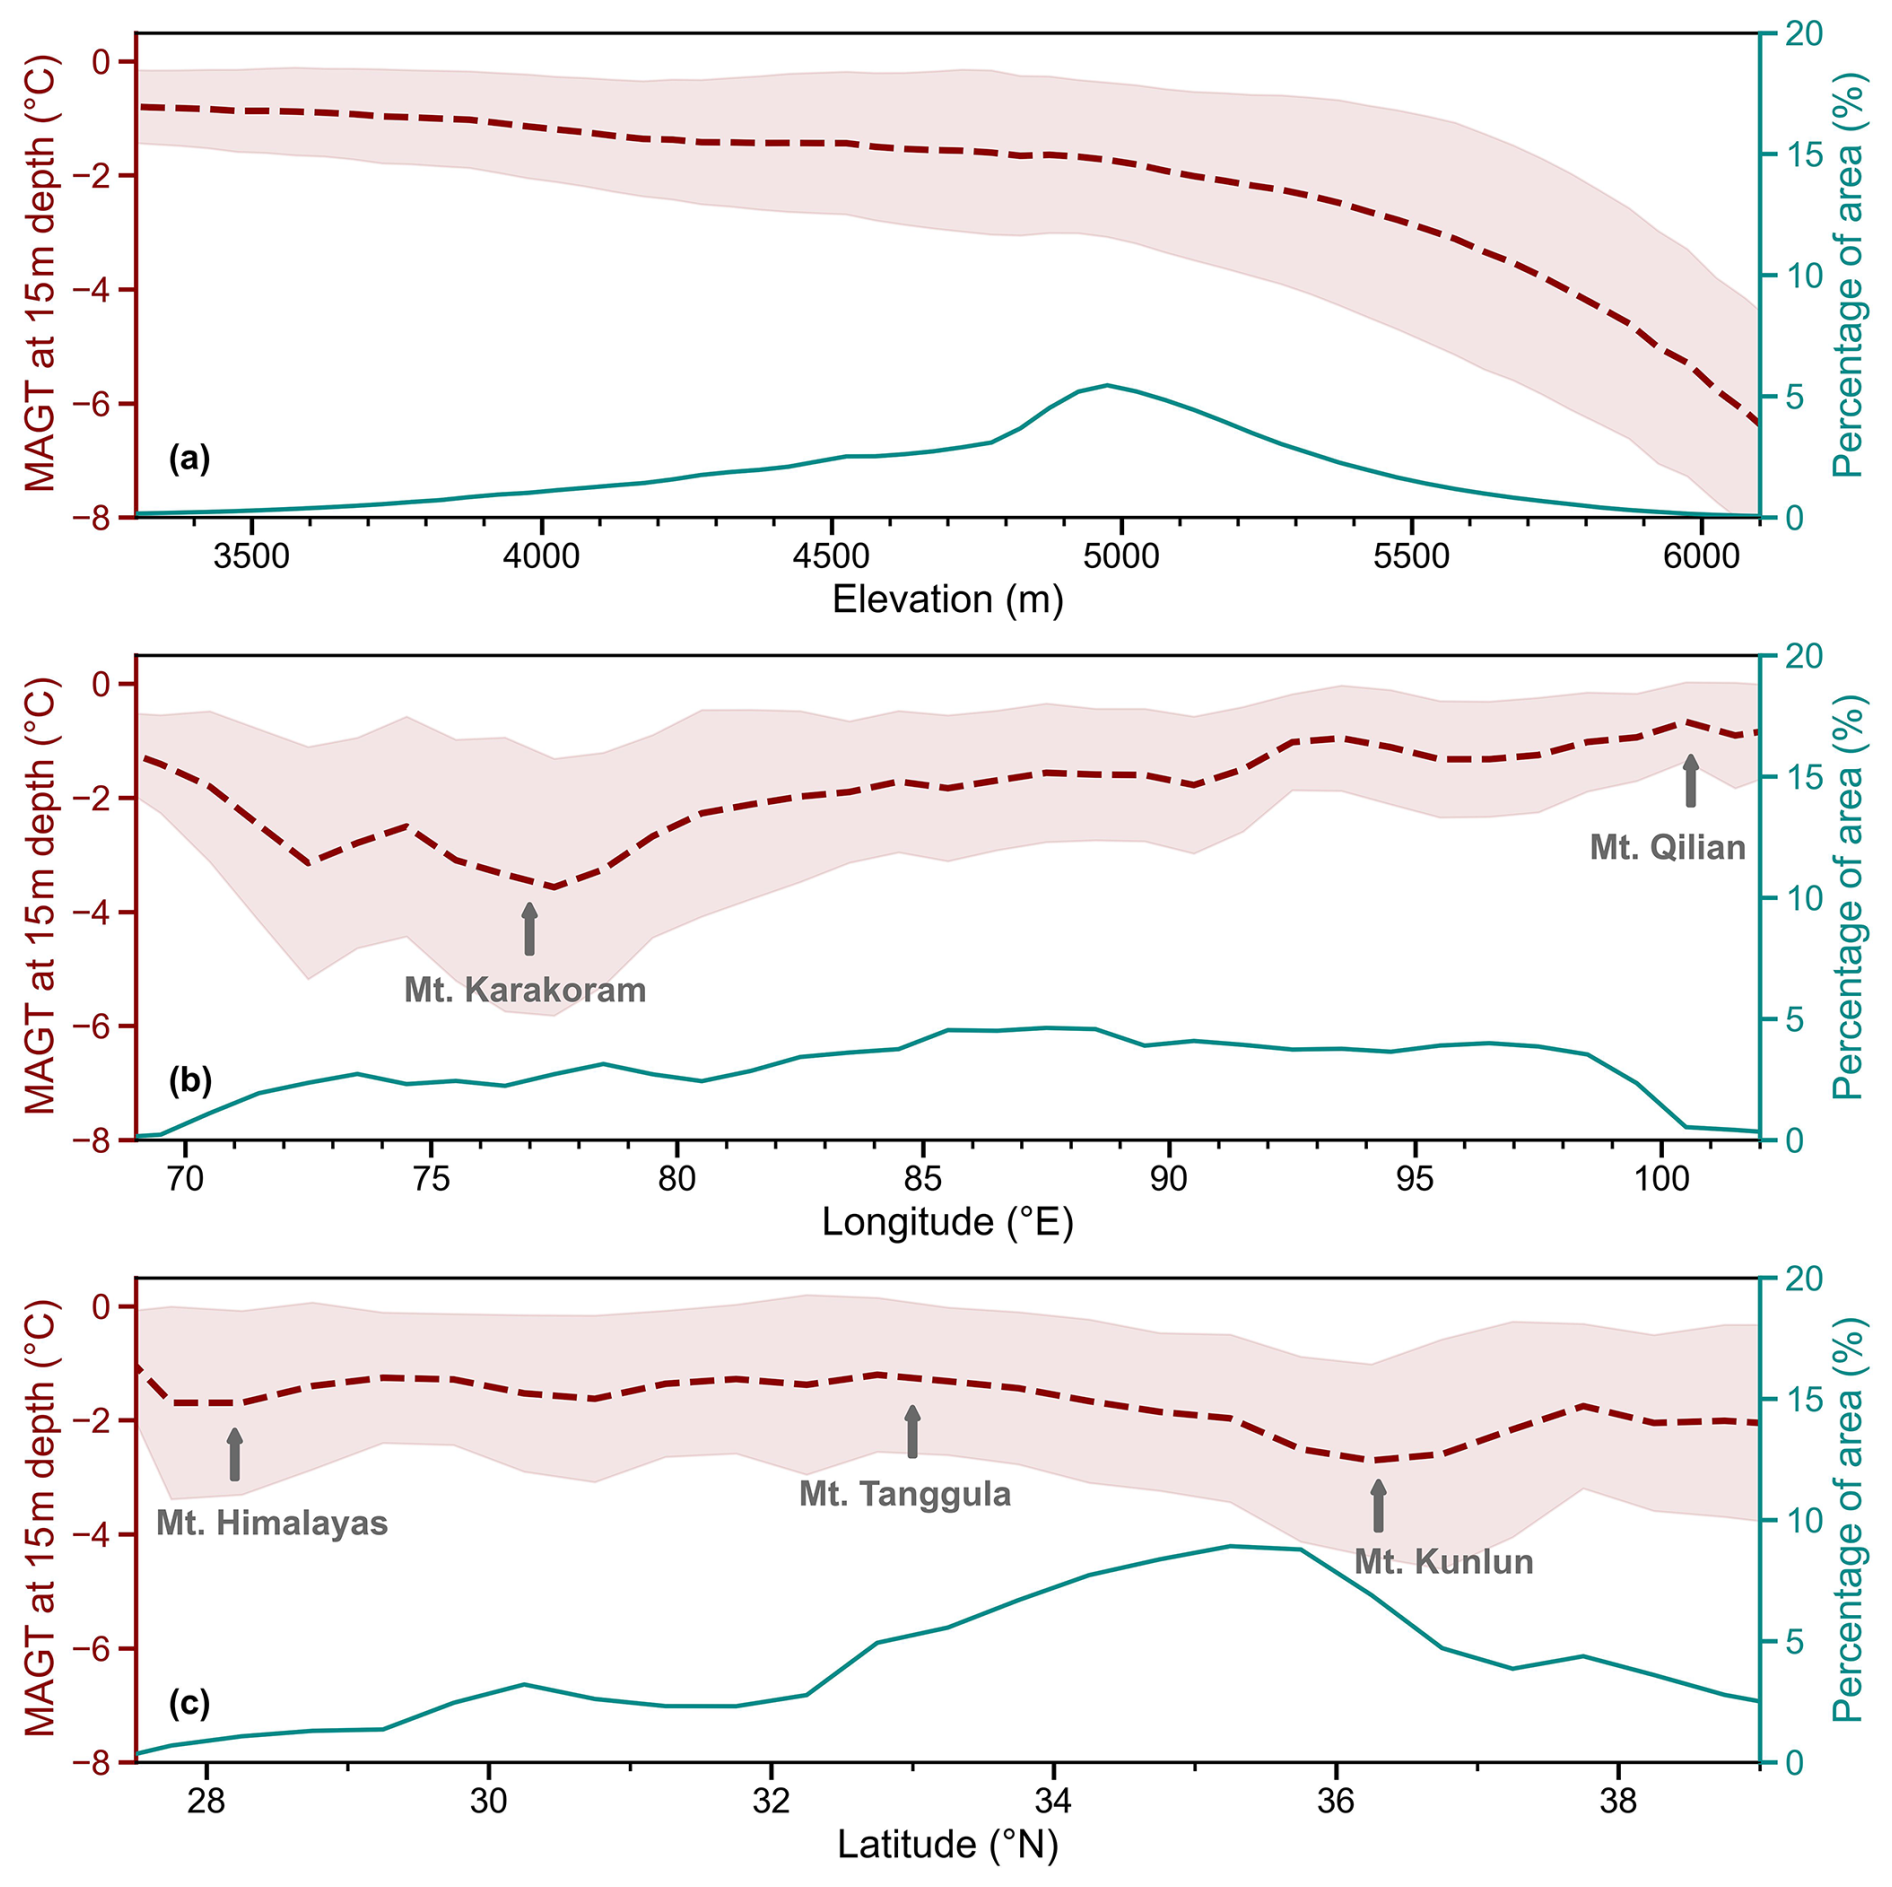
Figure 5Variations of MAGT15 m along elevation (a), longitude (b), and latitude (c) transects on the Qinghai–Tibetan Plateau (the dashed red line represents the mean MAGT15 m, and the light-red shaded area indicates its standard deviation; the cyan dashed line shows the areal percentage).
Due to the predominant mountainous and high-plateau terrain of the QTP, we utilized slope as a topographical indicator to assess the spatial distribution characteristics of the MAGT15 m. Considering the slope distribution pattern within the study areas, we aggregated the slope gradients into four classes: flat (slope < 2°), gentle (2 to 8°), moderate (8 to 17°), and steep (> 17°) (Soil Science Division Staff, 2017). Statistical analysis reveals that the percentage of area (PA, %) of flat, gentle, and moderate slopes was 16.2 %, 25.8 %, and 20.5 %, respectively. Regions with steep slopes comprised a significant portion, with a PA of 37.5 % (Fig. 6a). Overall, the average MAGT15 m exhibited a decreasing trend as the slope increased, indicating that lower MAGT15 m values were more prevalent in areas with steeper slopes (e.g., high mountainous regions of the QTP).
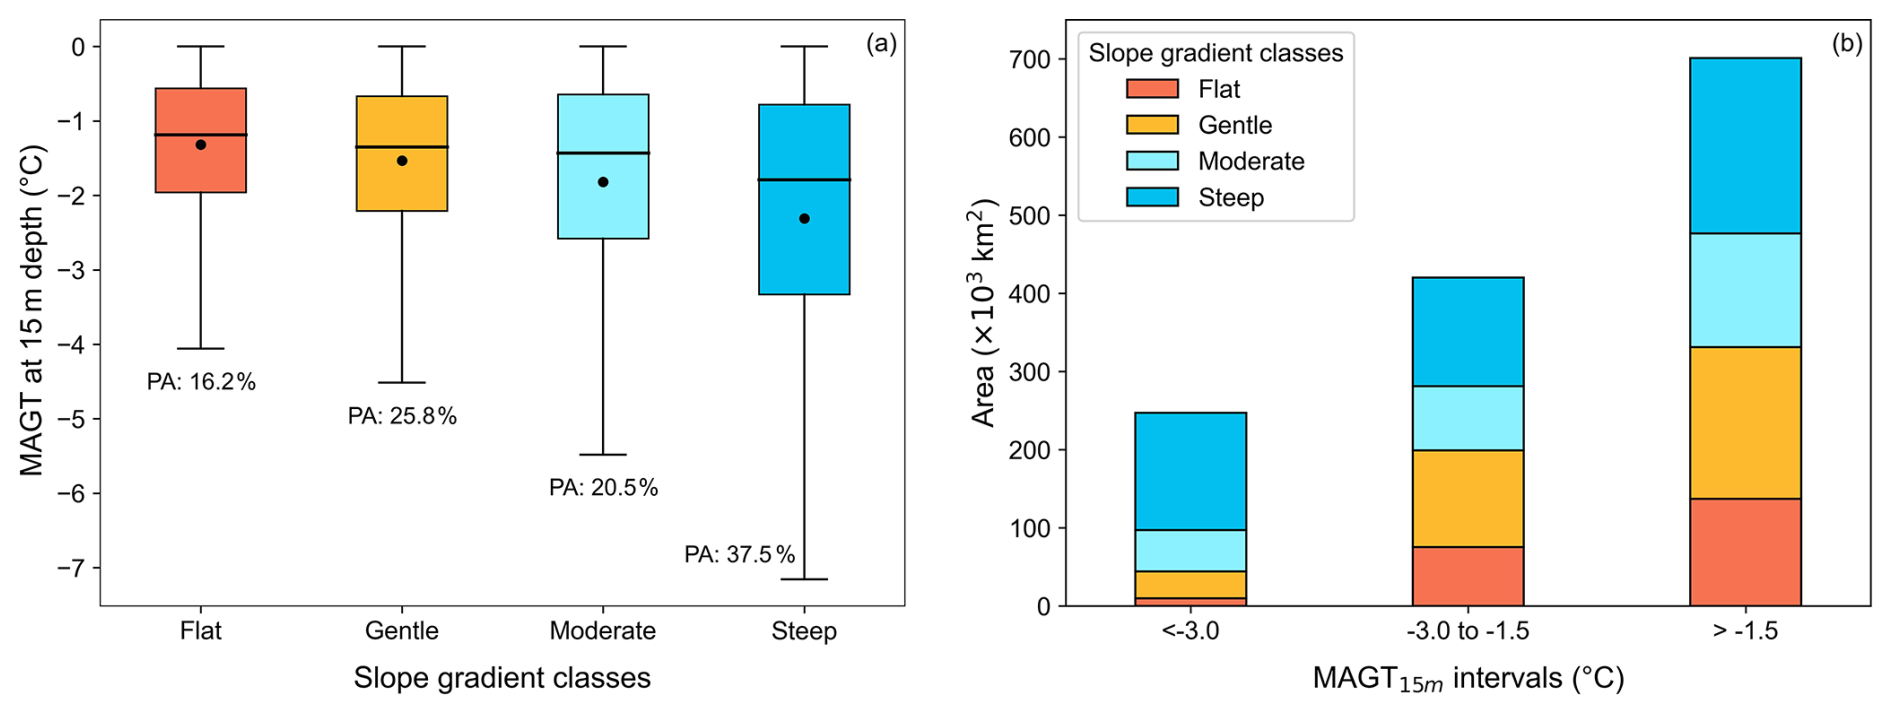
Figure 6MAGT15 m for different slope gradients on the Qinghai–Tibetan Plateau during 2010–2019 (PA: percentage of area).
Additionally, we analyzed the distribution of the four slope classes in three MAGT15 m intervals: low (< −3 °C), medium (−3 to −1.5 °C), and high (> −1.5 °C) (Fig. 6b). The areas of low-, medium-, and high-temperature regions were 24.5, 41.6, and 69.5 × 10⁴ km2, accounting for 18.1 %, 30.7 %, and 51.2 %, respectively. Most of the MAGT15 m values in the low-temperature interval were concentrated in regions with steep slopes and accounted for 60.6 % of the total area. The areas of moderate slopes account for 21.4 %, and the combined areas of flat and gentle slopes represent only 18.0 % of the total. The areas of flat, gentle, moderate, and steep slopes account for 17.9 %, 29.5 %, 19.5 %, and 33.1 % in the medium-temperature interval and 19.6 %, 27.7 %, 20.7 %, and 32.0 % in the high-temperature interval, indicating similar proportions. Moreover, the areas of flat and gentle slopes were predominant in the medium- and high-temperature intervals, representing more than half of the total area in each interval. Topographically, MAGT15 m values in high- and medium-temperature intervals (i.e., MAGT15 m > −3 °C) occurred substantially in areas with flat and gentle slopes, whereas low-temperature regions were rare on these slopes.
3.2.2 Regional distribution characteristics of MAGT15 m
To explore the spatial variability in different regions, we calculated the zonal statistics of the MAGT15 m for 12 primary river or lake basins on the QTP (Fig. 7). Figure 7a and b show the boxplots and cumulative plots of the three temperature intervals (< −3, −3 to −1.5, and > −1.5 °C) of MAGT15 m in these basins. Figure 7 is organized primarily from west to east based on the locations of the basins, showing an overall increasing trend in MAGT15 m that is consistent with the longitudinal profile results (Fig. 5b).
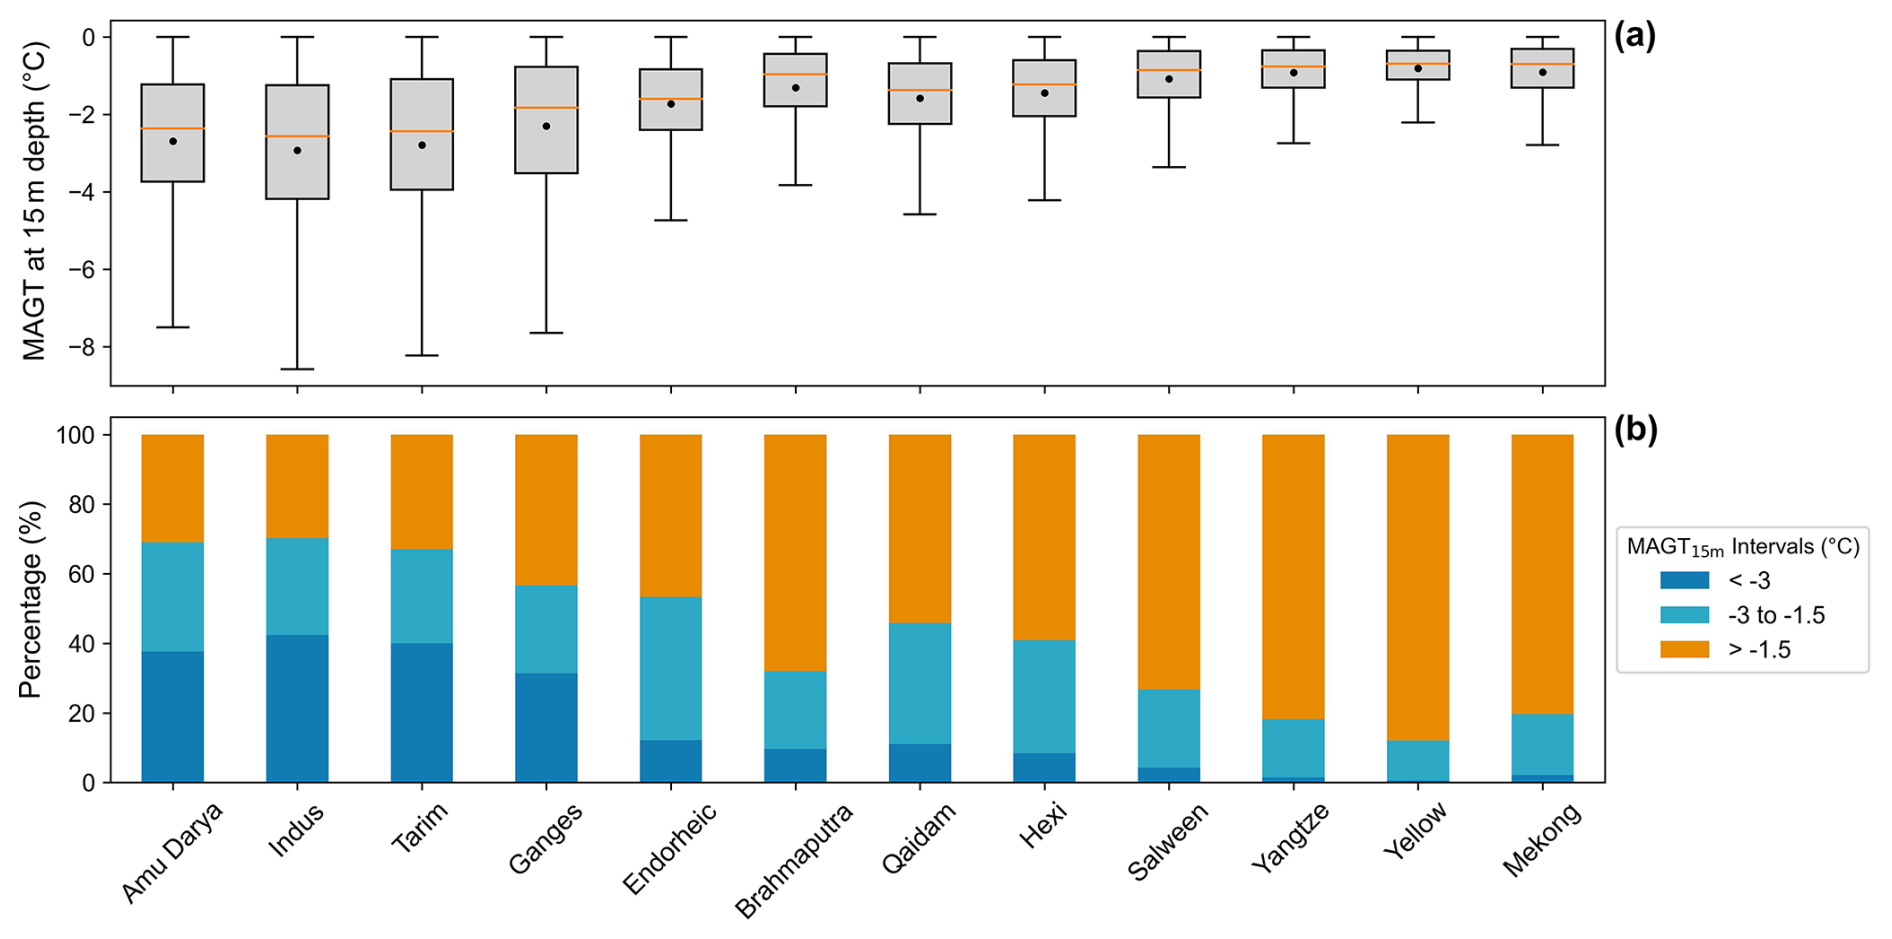
Figure 7Distribution (a) and percentage of area in three intervals (b) of MAGT15 m in 12 basins of the Qinghai–Tibetan Plateau during 2010–2019.
The lowest MAGT15 m values were observed in the headwater areas of the Amu Darya, Indus, and Tarim river basins in the western QTP, with average MAGT15 m values of −2.69, −2.93, and −2.80 °C, respectively. These three basins also exhibited the largest standard deviations, ranging from ±1.89 to ±2.11 °C. Low MAGT15 m values occurred throughout these basins, with areas of MAGT15 m < −3 °C comprising 37.7 % to 42.4 % and those < −5 °C comprising 12.0 % to 17.0 % of the total basin area. Another region with low MAGT15 m and high variability was the Ganges River basin on the southern QTP. The mean MAGT15 m was −2.30 ± 1.84 °C, and areas of MAGT15 m < −3 and < −5 °C comprised 31.4 % and 10.1 % of the total basin area.
The average MAGT15 m in the endorheic lake basin was −1.73 °C, higher than that in the western basins, with a small standard deviation of ±1.17 °C. This result indicates minimal spatial variability in MAGT15 m, despite the basin being the most extensive permafrost area of the QTP. Few low MAGT15 m values were observed in this basin, accounting for only 12.1 % and 1.4 % of areas with MAGT15 m < −3 and < −5 °C, respectively. The Brahmaputra River basin exhibited the highest mean MAGT15 m of the western and central QTP basins, reaching −1.31 ± 1.21 °C.
The six river basins on the eastern QTP generally exhibited higher MAGT15 m with smaller fluctuations. The Qaidam and Hexi basins on the northeastern QTP had lower MAGT15 m values of −1.59 ± 1.19 and −1.44 ± 1.11 °C, respectively. On the southeastern QTP, the Salween and Mekong river basins exhibited MAGT15 m values of −1.09 ± 0.93 and −0.91 ± 0.80 °C, respectively. These basins had few areas with MAGT15 m < −3 °C, with only 0.4 % and 0.2 % of the area falling below this threshold. Conversely, a substantial proportion had MAGT15 m > −1.5 °C, at 73.2 % and 80.3 %, respectively. The MAGT15 m values were slightly higher eastward in the Yangtze and Yellow river basins, with averages of −0.92 ± 0.74 and −0.80 ± 0.61 °C, respectively. The standard deviations in these basins were below 1 °C. Less than 0.2 % of the area had MAGT15 m < −3 °C, whereas the majority had MAGT15 m > −1.5 °C, accounting for 81.8 % and 87.9 %, respectively.
The SVR method exhibited more scattered predictions in the low-temperature range compared to the high-temperature range, as illustrated in Fig. 3. While performing well in the high-temperature range with slight overestimations, the SVR method may potentially result in some degree of underestimation in regions with lower temperatures. This variability could be attributed to the scarcity of MAGT15 m observations with colder temperatures. Notably, most of the MAGT15 m observations utilized in this study were obtained from the eastern QTP regions, particularly the source areas of the Yangtze and Yellow rivers, which are characterized by relatively higher MAGT15 m values. Additionally, the analysis suggests that the vertical lapse rate of the MAGT15 m increased with rising elevation. Hence, future monitoring efforts should prioritize colder permafrost areas at higher elevations to ensure adequate representation in the study area.
We considered negative MAGT15 m to be an indicator of permafrost and estimated the permafrost area to be approximately 1.36 × 10⁶ km2 (excluding glacier and lake areas), accounting for about 44.0 % of the total QTP. This finding broadly aligns with previous studies based on MAGTDZAA reporting permafrost extents of approximately 1.30 × 10⁶ km2 by Wang et al. (2020) and 1.32 × 10⁶ km2 by Zhao et al. (2024). The discrepancies may arise from differences in data samples. Our study benefited from integrating MAGT15 m records from 231 boreholes, providing a more comprehensive dataset in terms of spatial coverage and quantity, ensuring the reliability of our prediction. Furthermore, the estimated permafrost area within the Chinese territory of the QTP was approximately 1.11 × 10⁶ km2, comparable to values derived from the temperature at the top of the permafrost (TTOP) model (1.06 to 1.09 × 10⁶ km2) (Zou et al., 2017; Cao et al., 2023). Differences in measurement depths and temperature values between MAGTDZAA and MAGT15 m may have contributed to slight variations in permafrost area. Additionally, permafrost may still persist in areas where MAGT15 m exceeds 0 °C. Statistical analysis reveals that the areas with MAGT15 m within the ranges of 0–0.1 and 0–0.2 °C cover approximately 0.05 × 10⁶ and 0.10 × 10⁶ km2, respectively.
Based on the classification criteria established by MAGTDZAA, the permafrost can be categorized into cold (≤ −1.0 °C) and warm (> −1.0 °C) permafrost (Wu et al., 2010). Using the predicted MAGT15 m data, we analyzed the distribution characteristics of permafrost on the QTP based on this classification. Cold permafrost was the dominant type, covering 63.7 % of the permafrost regions, while warm permafrost accounted for 36.3 % during the period from 2010 to 2019. The modes of permafrost degradation vary depending on ground temperature regimes (Jin et al., 2006; Wu et al., 2010). The cold permafrost tends to be more prevalent in steep alpine regions on the QTP, as depicted in Fig. 6. These areas typically exhibit thin surface sediment layers and shallow burial depths of bedrock. These characteristics indicate that the degradation of cold permafrost on the QTP primarily involves increasing ground temperatures, particularly in regions with limited ground ice. In areas with ice-rich permafrost, the slope effect may contribute to an increased occurrence of thaw slumps (Luo et al., 2022). Notably, a significant portion of the warm permafrost area on the QTP is located on flat and gentle slopes, where ice-rich permafrost is often found (Zou et al., 2024a). Rapid permafrost thawing in these areas may increase surface deformation, resulting in ecological evolution (Jin et al., 2021), hydrological imbalance (Walvoord and Kurylyk, 2016), and engineering stability (Ma et al., 2011). Of particular concern are the headwater areas of the Yangtze and Yellow river basins, where warm permafrost is predominant, making these regions highly susceptible to the impacts of short-term permafrost thaw.
The gridded MAGT15 m data generated in this study represent the average values in the period from 2010 to 2019, providing valuable boundary conditions for future permafrost dynamics on the QTP. For instance, these data can be leveraged in conjunction with geothermal datasets to more accurately estimate permafrost thickness. Moreover, the fixed-depth MAGT baseline can serve as robust data for validating numerical model simulations of long-term changes in permafrost temperature. These validations are crucial for enhancing our understanding of QTP permafrost responses to environmental drivers and climate change. Additionally, the MAGT15 m data offer critical insights for understanding geological processes and ecosystem dynamics, thereby supporting related studies in the QTP permafrost regions.
The gridded data generated by this study are publicly available and can be downloaded at the National Tibetan Plateau Data Center (TPDC) (https://doi.org/10.11888/Cryos.tpdc.301165, Zou et al., 2024b). The data in GeoTIFF format can be used with GIS software.
This study produced gridded data of MAGT15 m during 2010–2019 at a spatial resolution of nearly 1 km in permafrost regions on the QTP. Regions with negative MAGT15 m covered 1.36 × 10⁶ km2 (excluding glacier and lake areas), or 44.0 % of the QTP area. The average MAGT15 m was −1.85 ± 1.58 °C, with 90 % of the values in the range of −5.1 to −0.1 °C and 51.2 % higher than −1.5 °C. The FDD was the most significant predictor of MAGT15 m, followed by TDD, MAP, and BD. Across the QTP, MAGT15 m exhibited a monotonous eastward increase, a slight northward decrease, and an accelerated upward decrease. Lower MAGT15 m values were more prevalent in alpine areas with steep slopes. Areas with flat and gentle slopes accounted for approximately half of both the medium (−3.0 to −1.5 °C) and high (−1.5 to 0 °C) MAGT15 m intervals. The lowest MAGT15 m values (−2.9 to −2.7 °C) were observed in the headwater areas of the Amu Darya, Indus, and Tarim river basins of the western QTP. Conversely, the Yangtze and Yellow river basins exhibited the highest MAGT15 m (−0.9 to −0.8 °C), and more than 80 % of the areas were warm permafrost regions. Our gridded MAGT15 m dataset can serve as a valuable resource for further studies on characteristics of elevational permafrost at greater depths of the QTP, particularly for estimating permafrost thickness.
DZ and LZ: conceptualization. DZ, GH, and ED: methodology. GL and WL: data processing and analysis. DZ and CW: original draft writing. LZ and GH: review and editing. LZ: supervision. LZ and GH: funding acquisition.
The contact author has declared that none of the authors has any competing interests.
Publisher’s note: Copernicus Publications remains neutral with regard to jurisdictional claims made in the text, published maps, institutional affiliations, or any other geographical representation in this paper. While Copernicus Publications makes every effort to include appropriate place names, the final responsibility lies with the authors.
We would like to express our gratitude to all of the colleagues and students for their fieldwork contributions in collecting valuable in situ data on the Qinghai–Tibetan Plateau.
This research has been supported by the Second Tibetan Plateau Scientific Expedition and Research (STEP) program (grant no. 2019QZKK0201), the National Natural Science Foundation of China (grant nos. 42322608 and U23A2062), the Chinese Academy of Sciences “Light of West China” program (grant no. xbzg-zdsys-202304), Gansu Provincial Science and Technology Program (grant no. 22ZD6FA005), the Program of the State Key Laboratory of Cryospheric Science and Frozen Soil Engineering, CAS (grant no. CSFSE-TZ-2402).
This paper was edited by Achim A. Beylich and reviewed by four anonymous referees.
Aalto, J., Karjalainen, O., Hjort, J., and Luoto, M.: Statistical forecasting of current and future circum-Arctic ground temperatures and active layer thickness, Geophys. Res. Lett., 45, 4889–4898, https://doi.org/10.1029/2018GL078007, 2018.
Amatulli, G., Domisch, S., Tuanmu, M. N., Parmentier, B., Ranipeta, A., Malczyk, J., and Jetz, W.: A suite of global, cross-scale topographic variables for environmental and biodiversity modeling, Sci. Data, 5, 180040, https://doi.org/10.1038/sdata.2018.40, 2018.
Basak, D., Pal, S., and Patranabis, D. C.: Support Vector Regression, Neural Information Processing – Letters and Reviews, 11, 203–224, 2007.
Biskaborn, B. K., Smith, S. L., Noetzli, J., Matthes, H., Vieira, G., Streletskiy, D. A., Schoeneich, P., Romanovsky, V. E., Lewkowicz, A. G., Abramov, A., Allard, M., Boike, J., Cable, W. L., Christiansen, H. H., Delaloye, R., Diekmann, B., Drozdov, D., Etzelmüller, B., Grosse, G., Guglielmin, M., Ingeman-Nielsen, T., Isaksen, K., Ishikawa, M., Johansson, M., Johannsson, H., Joo, A., Kaverin, D., Kholodov, A., Konstantinov, P., Kröger, T., Lambiel, C., Lanckman, J. P., Luo, D., Malkova, G., Meiklejohn, I., Moskalenko, N., Oliva, M., Phillips, M., Ramos, M., Sannel, A. B. K., Sergeev, D., Seybold, C., Skryabin, P., Vasiliev, A., Wu, Q., Yoshikawa, K., Zheleznyak, M., and Lantuit, H.: Permafrost is warming at a global scale, Nat. Commun., 10, 1–11, https://doi.org/10.1038/s41467-018-08240-4, 2019.
Cao, B., Zhang, T., Peng, X., Mu, C., Wang, Q., Zheng, L., Wang, K., and Zhong, X.: Thermal characteristics and recent changes of permafrost in the upper reaches of the Heihe River Basin, western China, J. Geophys. Res., 123, 7935–7949, https://doi.org/10.1029/2018JD028442, 2018.
Cao, Z., Nan, Z., Hu, J., Chen, Y., and Zhang, Y.: A new 2010 permafrost distribution map over the Qinghai–Tibet Plateau based on subregion survey maps: a benchmark for regional permafrost modeling, Earth Syst. Sci. Data, 15, 3905–3930, https://doi.org/10.5194/essd-15-3905-2023, 2023.
Dobinski, W.: Permafrost, Earth-Sci. Rev., 108, 158–169, https://doi.org/10.1016/j.earscirev.2011.06.007, 2011.
Fick, S. E. and Hijmans, R. J.: WorldClim 2: new 1-km spatial resolution climate surfaces for global land areas, Int. J. Climatol., 37, 4302–4315, https://doi.org/10.1002/joc.5086, 2017.
Jin, H., Zhao, L., Wang, S., and Jin, R.: Thermal regimes and degradation modes of permafrost along the Qinghai-Tibet Highway, Sci. China Ser. D, 49, 1170–1183, doi.org/10.1007/s11430-006-2003-z, 2006.
Jin, X., Jin, H., Iwahana, G., Marchenko, S. S., Luo, D., Li, X., and Liang, S.: Impacts of climate-induced permafrost degradation on vegetation: A review, Adv. Clim. Chang. Res., 12, 29–47, https://doi.org/10.1016/j.accre.2020.07.002, 2021.
Li, J., Sheng, Y., Wu, J., Wang, J., Zhang, B., Ye, B., Zhang, X., and Qin, X.: Modeling regional and local-scale permafrost distribution in Qinghai-Tibet Plateau using equivalent-elevation method, Chinese Geogr. Sci., 22, 278–287, https://doi.org/10.1007/s11769-012-0520-6, 2012.
Li, J., Sheng, Y., Chen, J., Wu, J., and Wang, S.: Variations in permafrost temperature and stability of alpine meadows in the source area of the Datong River, northeastern Qinghai-Tibet Plateau, China, Permafrost Periglac., 25, 307–319, https://doi.org/10.1002/ppp.1822, 2014.
Li, J., Sheng, Y., Wu, J., Feng, Z., Ning, Z., Hu, X., and Zhang, X.: Landform-related permafrost characteristics in the source area of the Yellow River, eastern Qinghai-Tibet Plateau, Geomorphology, 269, 104–111, https://doi.org/10.1016/j.geomorph.2016.06.024, 2016.
Liu, G., Xie, C., Zhao, L., Xiao, Y., Wu, T., Wang, W., and Liu, W.: Permafrost warming near the northern limit of permafrost on the Qinghai-Tibetan Plateau during the period from 2005 to 2017: A case study in the Xidatan area, Permafrost Periglac., 32, 323–334, https://doi.org/10.1002/ppp.2089, 2021.
Liu, J. and Shi, R.: Characteristics of permafrost development in Jingyangling Pass of National Highway 227, Qinghai Province, Highway, 64, 75–80, 2019 (in Chinese).
Luo, D., Jin, H., Lin, L., He, R., Yang, S., and Chang, X.: New progress on permafrost temperature and thickness in the source area of the Huanghe River, Sci. Geogr. Sin., 32, 898–904, 2012 (in Chinese).
Luo, D., Jin, H., Lin, L., You, Y., Yang, S., and Wang, Y.: Distributive features and controlling factors of permafrost and the active layer thickness in the Bayan Har Mountains along the Qinghai-Kangding Highway on northeastern Qinghai-Tibet Plateau, Sci. Geogr. Sin., 33, 635–640, 2013 (in Chinese).
Luo, D., Jin, H., Jin, X., He, R., Li, X., Muskett, R. R., Marchenko, S. S., and Romanovsky, V. E.: Elevation-dependent thermal regime and dynamics of frozen ground in the Bayan Har Mountains, northeastern Qinghai-Tibet Plateau, southwest China, Permafrost Periglac., 29, 257–270, https://doi.org/10.1002/ppp.1988, 2018a.
Luo, D., Jin, H., Marchenko, S. S., and Romanovsky, V. E.: Difference between near-surface air, land surface and ground surface temperatures and their influences on the frozen ground on the Qinghai-Tibet Plateau, Geoderma, 312, 74–85, doi.org/10.1016/j.geoderma.2017.09.037, 2018b.
Luo, J., Niu, F., Lin, Z., Liu, M., Yin, G., and Gao, Z.: Inventory and frequency of retrogressive thaw slumps in permafrost region of the Qinghai–Tibet Plateau, Geophys. Res. Lett., 49, e2022GL099829, https://doi.org/10.1029/2022GL099829, 2022.
Ma, W., Mu, Y., Wu, Q., Sun, Z., and Liu, Y.: Characteristics and mechanisms of embankment deformation along the Qinghai-Tibet Railway in permafrost regions, Cold Reg. Sci. Technol., 67, 178–186, https://doi.org/10.1016/j.coldregions.2011.02.010, 2011.
Obu, J., Westermann, S., Barboux, C., Bartsch, A., Delaloye, R., Grosse, G., Heim, B., Hugelius, G., Irrgang, A., Kääb, A., Kroisleitner, C., Matthes, H., Nitze, I., Pellet, C., Seifert, F., Strozzi, T., Wegmüller, U., Wieczorek, M., and Wiesmann, A.: ESA Permafrost Climate Change Initiative (Permafrost_cci): Permafrost ground temperature for the Northern Hemisphere (v3.0), CEDA Archive [data set], https://doi.org/10.5285/b25d4a6174de4ac78000d034f500a268, 2021.
Poggio, L., de Sousa, L. M., Batjes, N. H., Heuvelink, G. B. M., Kempen, B., Ribeiro, E., and Rossiter, D.: SoilGrids 2.0: producing soil information for the globe with quantified spatial uncertainty, SOIL, 7, 217–240, https://doi.org/10.5194/soil-7-217-2021, 2021.
Qiu, Y., Guo, H., Chu, D., Zhang, H., Shi, J., Shi, L., Zheng, Z., and Laba, Z.: MODIS daily cloud-free snow cover product over the Tibetan Plateau (V3), Science Data Bank [data set], https://datapid.cn/31253.11.sciencedb.55 (last access: 21 December 2023), 2021.
Ran, Y., Li, X., Cheng, G., Nan, Z., Che, J., Sheng, Y., Wu, Q., Jin, H., Luo, D., Tang, Z., and Wu, X.: Mapping the permafrost stability on the Tibetan Plateau for 2005–2015, Sci. China Earth Sci., 64, 62–79, https://doi.org/10.1007/s11430-020-9685-3, 2021.
Ran, Y., Li, X., Cheng, G., Che, J., Aalto, J., Karjalainen, O., Hjort, J., Luoto, M., Jin, H., Obu, J., Hori, M., Yu, Q., and Chang, X.: New high-resolution estimates of the permafrost thermal state and hydrothermal conditions over the Northern Hemisphere, Earth Syst. Sci. Data, 14, 865–884, https://doi.org/10.5194/essd-14-865-2022, 2022.
Romanovsky, V. E., Smith, S. L., and Christiansen, H. H.: Permafrost thermal state in the polar Northern Hemisphere during the international polar year 2007–2009: a synthesis, Permafrost Periglac., 21, 106–116, https://doi.org/10.1002/ppp.689, 2010.
Smith, S. L., Romanovsky, V. E., Lewkowicz, A. G., Burn, C. R., Allard, M., Clow, G. D., Yoshikawa, K., and Throop, J.: Thermal state of permafrost in North America: a contribution to the international polar year, Permafrost Periglac., 21, 117–135, https://doi.org/10.1002/ppp.690, 2010.
Smith, S. L., O'Neill, H. B., Isaksen, K., Noetzli, J., and Romanovsky, V. E.: The changing thermal state of permafrost, Nat. Rev. Earth Environ., 3, 10–23, https://doi.org/10.1038/s43017-021-00240-1, 2022.
Soil Science Division Staff: Soil survey manual, edited by: Ditzler, C., Scheffe, K., and Monger, H. C., USDA Handbook 18, Government Printing Office, Washington, D.C., 2017.
Sun, Z., Ma, W., Mu, Y., Liu, Y., Zhang, S., and Wang, H.: Permafrost change under natural sites along the Qinghai-Tibet railway during the years of 2006–2015, Adv. Earth Sci., 33, 248–256, 2018 (in Chinese).
Walvoord, M. A. and Kurylyk, B. L.: Hydrologic impacts of thawing permafrost – A review, Vadose Zone J., 15, vzj2016.01.0010, https://doi.org/10.2136/vzj2016.01.0010, 2016.
Wang, D., Wu, T., Zhao, L., Mu, C., Li, R., Wei, X., Hu, G., Zou, D., Zhu, X., Chen, J., Hao, J., Ni, J., Li, X., Ma, W., Wen, A., Shang, C., La, Y., Ma, X., and Wu, X.: A 1 km resolution soil organic carbon dataset for frozen ground in the Third Pole, Earth Syst. Sci. Data, 13, 3453–3465, https://doi.org/10.5194/essd-13-3453-2021, 2021.
Wang, H., Zhan, J., Wang, C., Liu, W., Yang, Z., Liu, H., and Bai, C.: Greening or browning? The macro variation and drivers of different vegetation types on the Qinghai-Tibetan Plateau from 2000 to 2021, Front. Plant Sci., 13, 1045290, https://doi.org/10.3389/fpls.2022.1045290, 2022.
Wang, T., Yang, D., Yang, Y., Piao, S., Li, X., Cheng, G., and Fu, B.: Permafrost thawing puts the frozen carbon at risk over the Tibetan Plateau, Sci. Adv., 6, eaaz3513, https://doi.org/10.1126/sciadv.aaz3513, 2020.
Wu, J., Sheng, Y., Wu, Q., and Wen, Z.: Processes and modes of permafrost degradation on the Qinghai-Tibet Plateau, Sci. China Ser. D, 53, 150–158, doi.org/10.1007/s11430-009-0198-5, 2010.
Wu, Q., Zhang, T., and Liu, Y.: Permafrost temperatures and thickness on the Qinghai-Tibet Plateau, Global Planet. Change, 72, 32–38, https://doi.org/10.1016/j.gloplacha.2010.03.001, 2010.
Zhang, G., Luo, W., Chen, W., and Zheng, G.: A robust but variable lake expansion on the Tibetan Plateau, Sci. Bull., 64, 1306–1309, https://doi.org/10.1016/j.scib.2019.07.018, 2019.
Zhao, L., Wu, Q., Marchenko, S. S., and Sharkhuu, N.: Thermal state of permafrost and active layer in Central Asia during the international polar year, Permafrost Periglac., 21, 198–207, https://doi.org/10.1002/ppp.688, 2010.
Zhao, L., Zou, D., Hu, G., Wu, T., Du, E., Liu, G., Xiao, Y., Li, R., Pang, Q., Qiao, Y., Wu, X., Sun, Z., Xing, Z., Sheng, Y., Zhao, Y., Shi, J., Xie, C., Wang, L., Wang, C., and Cheng, G.: A synthesis dataset of permafrost thermal state for the Qinghai–Tibet (Xizang) Plateau, China, Earth Syst. Sci. Data, 13, 4207–4218, https://doi.org/10.5194/essd-13-4207-2021, 2021.
Zhao, L., Hu, G., Liu, G., Zou, D., Wang, Y., Xiao, Y., Du, E., Wang, C., Xing, Z., Sun, Z., Zhao, Y., Liu, S., Zhang, Y., Wang, L., Zhou, H., and Zhao, J.: Investigation, monitoring, and simulation of permafrost on the Qinghai-Tibet Plateau: A review, Permafrost Periglac., 35, 412–422, https://doi.org/10.1002/ppp.2227, 2024.
Zou, D., Zhao, L., Sheng, Y., Chen, J., Hu, G., Wu, T., Wu, J., Xie, C., Wu, X., Pang, Q., Wang, W., Du, E., Li, W., Liu, G., Li, J., Qin, Y., Qiao, Y., Wang, Z., Shi, J., and Cheng, G.: A new map of permafrost distribution on the Tibetan Plateau, The Cryosphere, 11, 2527–2542, https://doi.org/10.5194/tc-11-2527-2017, 2017.
Zou, D., Pang, Q., Zhao, L., Wang, L., Hu, G., Du, E., Liu, G., Liu, S., and Liu, Y.: Estimation of permafrost ground ice to 10 m depth on the Qinghai-Tibet Plateau, Permafrost Periglac., 35, 423–434, https://doi.org/10.1002/ppp.2226, 2024a.
Zou, D., Zhao, L., Hu, G., Du, E., Liu, G., Wang, C., and Li, W.: Permafrost temperature baseline at 15 meters depth in the Qinghai–Tibet Plateau (2010–2019), National Tibetan Plateau/Third Pole Environment Data Center [data set], https://doi.org/10.11888/Cryos.tpdc.301165, 2024b.