the Creative Commons Attribution 4.0 License.
the Creative Commons Attribution 4.0 License.
 | 16 Apr 2025
Homogenized daily sunshine duration over China from 1961 to 2022
Yanyi He
Kun Yang
Chunlüe Zhou
Changkun Shao
Changjian Yin
Inhomogeneities in the sunshine duration (SSD) observational series, caused by non-climatic factors like China's widespread transition from manual to automatic SSD recorders in 2019 or station relocations, have hindered the accurate estimation of near-surface solar radiation. These issues significantly affect the analysis of global dimming and brightening, as well as related applications, such as solar energy planning and agriculture management. This study compiled raw SSD observational data from 1961 to 2022 from more than 2200 stations in China and clearly found that the improved precision from 0.1 h to 1 min following the instrument update in 2019 led to a sudden reduction in the frequency of zero SSD from 2019 onward, referred to as the day0-type discontinuity. For the first time, we systematically corrected this known day0-type discontinuity at 378 stations (17 %) in China, resulting in an SSD series with comparable frequencies of zero value before and after 2019. On this basis, we constructed a homogenization procedure to detect and adjust discontinuities in both the variance and mean of the daily SSD from 1961 to 2022. Results show that a total of 1363 (60 %) stations experienced breakpoints in SSD, of which ∼65 % were confirmed to be associated with station relocations and instrument replacements. Compared to the raw SSD, the homogenized SSD is more continuous to the naked eye for various periods and presents weakened dimming (p<0.05) across China from 1961 to 1990 but a non-significant positive trend with a reduction of 60 % in the Tibetan Plateau, suggesting that the homogenized SSD tends to better capture the dimming phenomenon. Northern regions continue dimming from 1991 to 2022, but southern regions of China brighten slightly. The implementation of the Action Plan for Air Pollution Prevention and Control since 2013 has contributed to a reversal of SSD trends thereafter, which is better reflected in the homogenized SSD, with a trend shift from −0.02 to 0.07 h d−1 per decade from 2013 to 2022 in China, especially in heavily polluted regions. Besides this, the relationships of cloud cover fraction and aerosol optical depth with SSD are intensified in the homogenized dataset. These results highlight the importance of the homogenized SSD in accurately understanding the dimming and brightening phenomena. The homogenized SSD dataset is publicly available for community use at https://doi.org/10.11888/Atmos.tpdc.301478 (He et al., 2024).
- Article
(11410 KB) - Full-text XML
- BibTeX
- EndNote


Sunshine duration (SSD) is one of the indispensable observation indicators in ground-based meteorological measurements. It captures the duration of direct sunlight reaching the Earth's surface (Wild et al., 2009; He et al., 2018). As an essential reference indicator to explore variations in surface incident solar radiation (Rs), SSD has profound implications for monitoring climate change, weather forecasting, ecosystem management, and solar energy generation (Stanhill and Cohen, 2003; Baumgartner et al., 2018). Therefore, making high-quality homogenized SSD data publicly accessible to diverse industries is crucial for research, decision-making, and planning across various sectors.
SSD measurement dates back 170 years, when the sum of sub-periods for which direct solar radiation exceeds 120 W m−2 is defined as SSD (WMO, 2014). SSD measurements can be broadly categorized into manual and automatic SSD recorders according to the need for human supervision (Wang et al., 2021). The commonly used manual SSD recorders include the Campbell–Stokes sunshine recorder and the Jordan sunshine recorder (Baumgartner et al., 2018). These instruments operate by focusing direct solar radiation onto the photosensitized paper, which burns and leaves one or more continuous traces that represent one or multiple sub-periods of sunshine duration (Che et al., 2005; Zhao et al., 2010). SSD is calculated as the sum of the sub-periods of the burn within a calendar day. Automatic sunshine recorders employ sensors for observations, and the types are diverse, including pyrheliometers, pyranometers, and photovoltaic sunshine recorders (Lv et al., 2015).
Since the 1950s, the Jordan sunshine recorder has been the primary instrument for measuring SSD in most meteorological stations in China. As reported, only 18 stations in the Heilongjiang Province of Northeast China utilized the Campbell–Stokes sunshine recorder, which was subsequently replaced by the Jordan sunshine recorder in 2012 (Lu et al., 2012). In 2019, China carried out a widespread replacement of the Jordan sunshine recorders, transitioning to the photoelectric digital SSD recorders at more than 2400 stations to achieve the automation of SSD measurement (Wang et al., 2020). In the first half of 2019, parallel observations were conducted using both instruments, but, starting from the second half of the year, only automatic sunshine recorders were used to record SSD. Compared to traditional manual methods, automatic sunshine recorders have higher precision and automation (Wang et al., 2020).
Recent studies have compared parallel observations for the two measurements at some stations for certain regions of China (Lv et al., 2015; Hu et al., 2019; Lu et al., 2019; Lang et al., 2021; Zhou et al., 2021b; Dai et al., 2022). They reported a relatively strong consistency between both observations, but a certain degree of discrepancy still remains, which is closely tied to the position of the sun and varying weather conditions: (1) the photoelectric digital recorders tend to record higher values during weak direct radiation at sunrise and sunset and lower values during strong noon radiation compared to manual observations, and (2) under persistently sunny weather, the more sensitive photoelectric digital recorders have slightly longer SSD than the manual recorders, but the manual recorders, under cloudy conditions with intermittent sunshine, tend to register artificially higher values due to lower instrument accuracy and the spot effect.
Manual sunshine recorders do not suffer from a sensitivity drift issue in SSD observations, attributed to the daily replacement of photosensitized paper (Sanchez-Lorenzo and Wild, 2012). However, the consistency of observational data still faces a challenge due to the subjectivity introduced by different observers in practice. On the other hand, due to the limitations of current observation technology, the photoelectric digital SSD recorders also have shortcomings, such as a narrow spectral response range, high sensitivity to the nearby environment, complex instrument maintenance, and instrument sensitivity drift and difficulty in calibration (Wang et al., 2015, 2021). Several studies have confirmed that the replacement of instruments can lead to non-climatic shifts in SSD and also applied a homogenization to SSD in the Iberian Peninsula (Sanchez-Lorenzo et al., 2007), Switzerland (Sanchez-Lorenzo and Wild, 2012), Italy (Manara et al., 2015), and Japan (Ma et al., 2022). Besides this, other non-climatic factors such as station relocations could also introduce some systematic errors in SSD.
Given the aforementioned issues in SSD observations, it is imperative to detect and adjust the discontinuities in SSD series in China, especially in the presence of artificial errors caused by changes in observing instruments, station locations, nearby environmental conditions, observing procedures, or other factors. To achieve this, this study compiled raw SSD data and systematically corrected the known day0-type discontinuity, as described in Sect. 2.1 and 2.2. In Sect. 2.3, a homogenization procedure is described to detect and adjust series discontinuities in the variance and mean of daily SSD, establishing a reliable reference series. Section 3.1 and 3.2 analyze the detected breakpoints and assess the impacts of series homogenization on trends across various periods. Furthermore, we examine the influence of cloud cover and aerosols on SSD variations in China in Sect. 3.3. This study produced a 62-year (1961–2022) homogenized daily SSD dataset for China, which is publicly accessible. The dataset can be used to support research on China's dimming and brightening phenomena, to improve the assessment of solar radiation simulations and future projections, and to provide valuable data for various applications such as solar energy layouts.
2.1 Data
The daily observed SSD values at 2425 meteorological stations from 1961 to 2022 were collected from the China Meteorological Administration (CMA, http://data.cma.cn/en/, last access: 10 March 2024). After screening stations based on data continuity and length, i.e., ≥15 d of data per month, ≥10 months per year, and ≥50 years during the entire period, a total of 2263 stations were selected for this study. Again, a widespread replacement of instruments across China occurred around 2019, transitioning from dark-tube sunshine recorders to photoelectric digital sunshine recorders (Wang et al., 2020).
Rs is highly correlated with SSD, but serious concerns have been raised with regard to the reliability of observational Rs data due to poor spatial representativeness, temporal discontinuity, and the effects of urbanization (Wild et al., 2005; Wang et al., 2014; He et al., 2018). In particular, for China, issues related to instrument aging, sensitivity drift, and instrument replacements have notably contributed to spurious variations in Rs observations at ∼100 stations (He and Wang, 2020). Therefore, Rs series from nearby stations are insufficient to serve as reference series during homogenization due to their sparse distributions and data inhomogeneity. Reanalysis products have dynamically consistent and spatiotemporally complete atmospheric fields with high-resolution and open-access data, addressing these limitations in Rs observations (Zhou et al., 2017). Among these reanalysis products, ERA5 has been verified to perform best with regard to Rs simulations across hourly, daily, monthly, interannual, and decadal scales in China (He et al., 2021; Li et al., 2023). Leveraging the ERA5 Rs data (https://cds.climate.copernicus.eu/cdsapp#!/dataset/reanalysis-era5-single-levels, last access: 10 March 2024), we estimated sunshine duration based on the criteria of hourly direct Rs exceeding 120 W m−2, which is consistent with instrument measurements (He et al., 2018), to serve as a reference series for homogenizing the observational SSD data. Meanwhile, SSD estimates from MERRA-2 hourly direct Rs from 1980 to 2022 (https://gmao.gsfc.nasa.gov/reanalysis/MERRA-2/, last access: 10 March 2024) were used as an aid in constructing the reference series.
To examine the effects of cloud and aerosol on SSD variations, daily cloud cover fraction (CCF) and aerosol optical depth (AOD) at 550 nm from 2003 to 2022 were obtained from a MODIS product at 1°×1° resolution (MCD06COSP_D3, https://ladsweb.modaps.eosdis.nasa.gov/archive/allData/62/MCD06COSP_D3_MODIS, last access: 10 March 2024) (Pincus et al., 2012; Swales et al., 2018). Cloud cover fraction is calculated as the percentage of a grid cell that is covered by clouds, with values ranging from 0 (no clouds) to 1 (completely overcast). AOD at 550 nm is a measure of the total aerosol content in the atmosphere, quantifying how much sunlight is absorbed and scattered by aerosols, with values ranging from 0 (no aerosols) to values greater than 1 (high aerosol loading).
According to topography and administrative divisions in China, seven sub-regions were identified, as shown in Fig. 1a, i.e., Northwest China (I), the Tibetan Plateau (II), Southwest China (III), Northeast China (IV), North China (V), Southeast China (VI), and the Loess Plateau (VII). A station relocation event was defined as Δlatitude > 0.01°, Δlongitude > 0.01°, or Δaltitude > 10 m before and after a specific date. The history of station relocations in China is reflected by the number of relocations in Fig. 1a and the fraction of the stations with relocations from 1961 to 2022 in Fig. 1b. The average number of relocations in China is about four (Fig. 1a). The unusually frequent relocations in 2019 result from changes in measurement altitude when the instruments were replaced at the time, were accompanied by changes in measurement height (Fig. 1b).
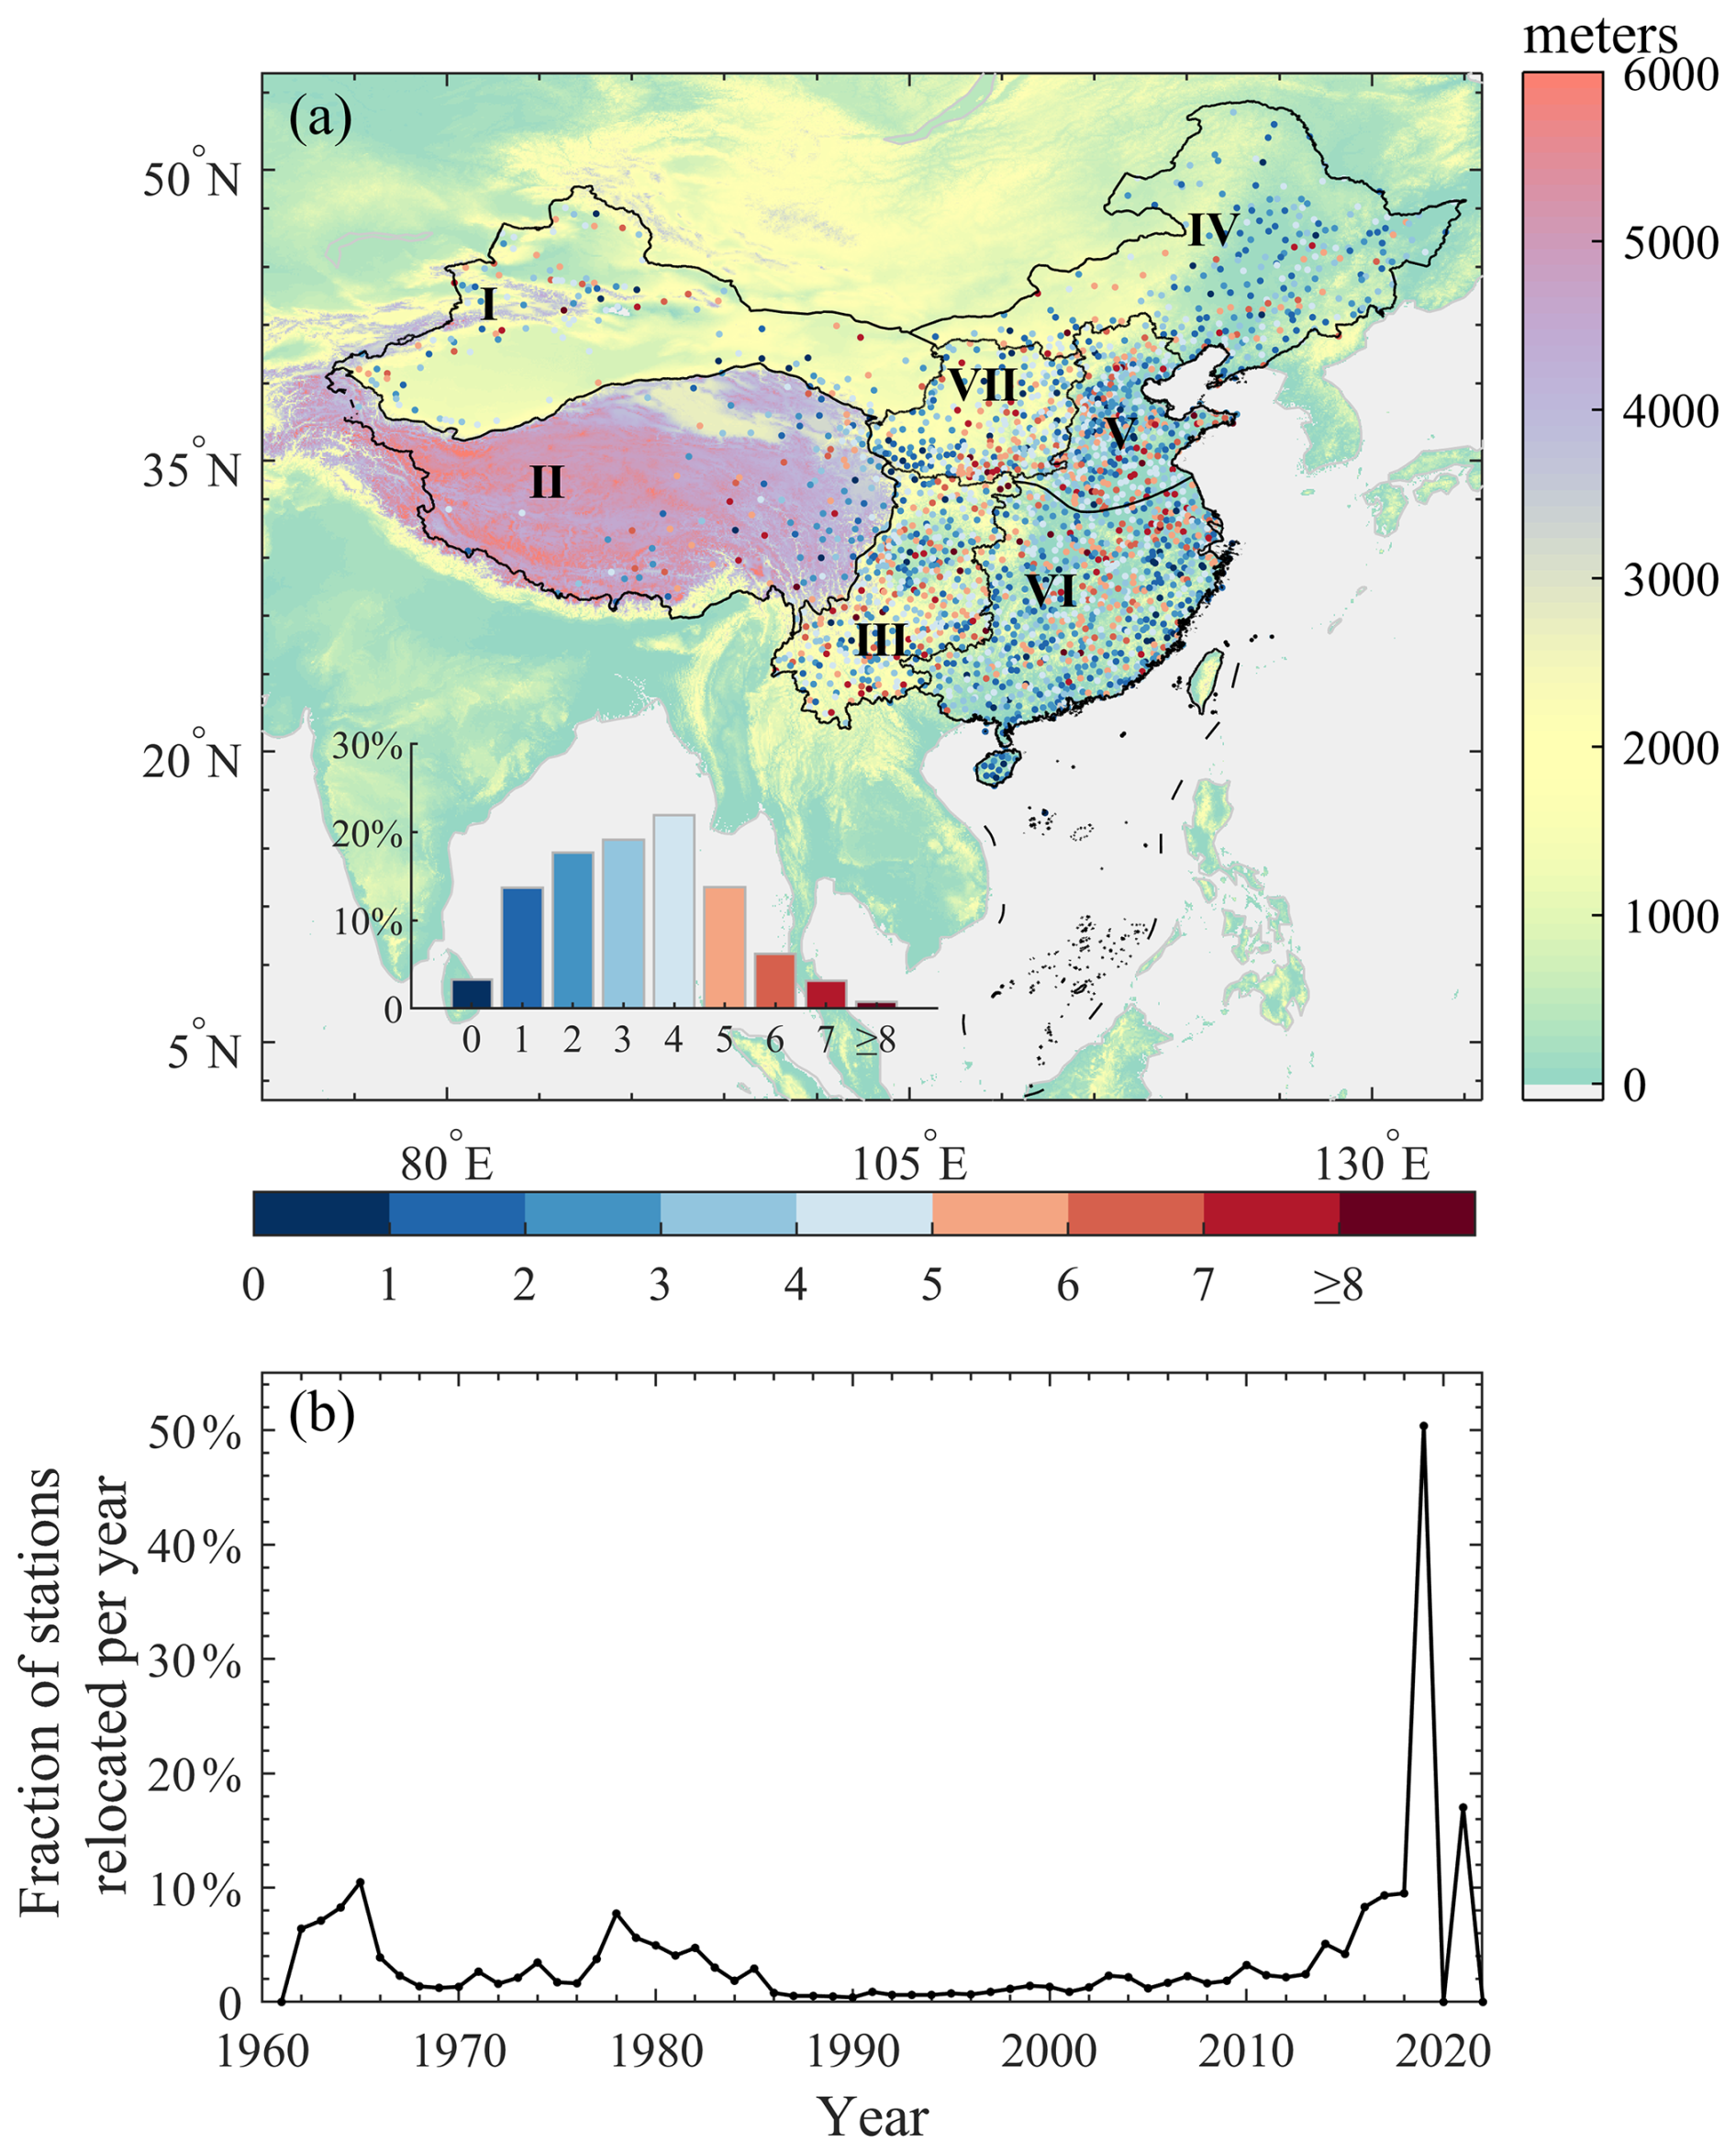
Figure 1(a) Map of the number of relocations for 2263 national meteorological stations (dots colored according to the bottom color bar, unit: times) in China during the period of 1961 to 2022. A relocation event is defined as Δlatitude > 0.01°, Δlongitude > 0.01°, or Δaltitude > 10 m before and after a specific date. The elevation map serves as the background and is colored according to the color bar on the right-hand side. The sub-figure in the bottom left illustrates the percentage of stations corresponding to the number of relocations for all stations. According to the topography and administrative divisions of China, seven sub-regions were identified, i.e., Northwest China (I), the Tibetan Plateau (II), Southwest China (III), Northeast China (IV), North China (V), Southeast China (VI), and the Loess Plateau (VII). (b) Time series of the fraction of stations (%) that underwent one or more relocations per year. The unusually frequent relocations in 2019 were accompanied by the instrument replacements that occurred that year.
2.2 Correction of known day0-type discontinuity
Following the update of automatic sunshine recorders around 2019, which improved the measurement precision from 0.1 h to 1 min (Lang et al., 2021), we observed a sudden reduction in the frequency of zero SSD at specific stations in China. In most instances, raw daily SSD values of zero are absent for more than 6 consecutive months, which is significantly different from the series pattern observed prior to 2019. We identified the segments with this known day0-type discontinuity characterized by more than 6 consecutive months of non-zero SSD.
Results show that the day0-type discontinuity occurs in almost one segment per station, totaling 378 stations (i.e., 17 % of stations in China), mainly distributed across northern regions of China, the Tibetan Plateau, and part of Southwest China (Fig. 2a), and is concentrated in 2019 to 2020 (Fig. 2b). Note that the improved precision may not lead to a notable day0-type discontinuity in some regions, or such minor discontinuities may not be easily identifiable. The spatial distribution of discontinuities and the years of their most frequent occurrence align with the update to automatic sunshine recorders in 2019 or later, as well as with station relocations (Fig. 1 vs. Fig 2). We employed the quantile-matching (QM) algorithm to correct the segments with the identified day0-type discontinuities by utilizing the longest segment that is free of the discontinuity, which produced the SSD0 series for the subsequent homogenization. The magnitude of correction reaches up to −5 h d−1 at two example stations in Northeast China and Northwest China (Fig. 3a and d). After correction, the frequency of low values, especially zero values, increases visibly in 2019 or later in the SSD0 series compared to the raw SSD series and is comparable to the frequency of the raw SSD series before 2019 (Fig. 3b and e). The monthly SSD0 anomaly appears to be more continuous (Fig. 3c and f). Note that the mean shift of the segment after 2020, like at station no. 51627 (Fig. 3f), would be statistically homogenized in the following sections.
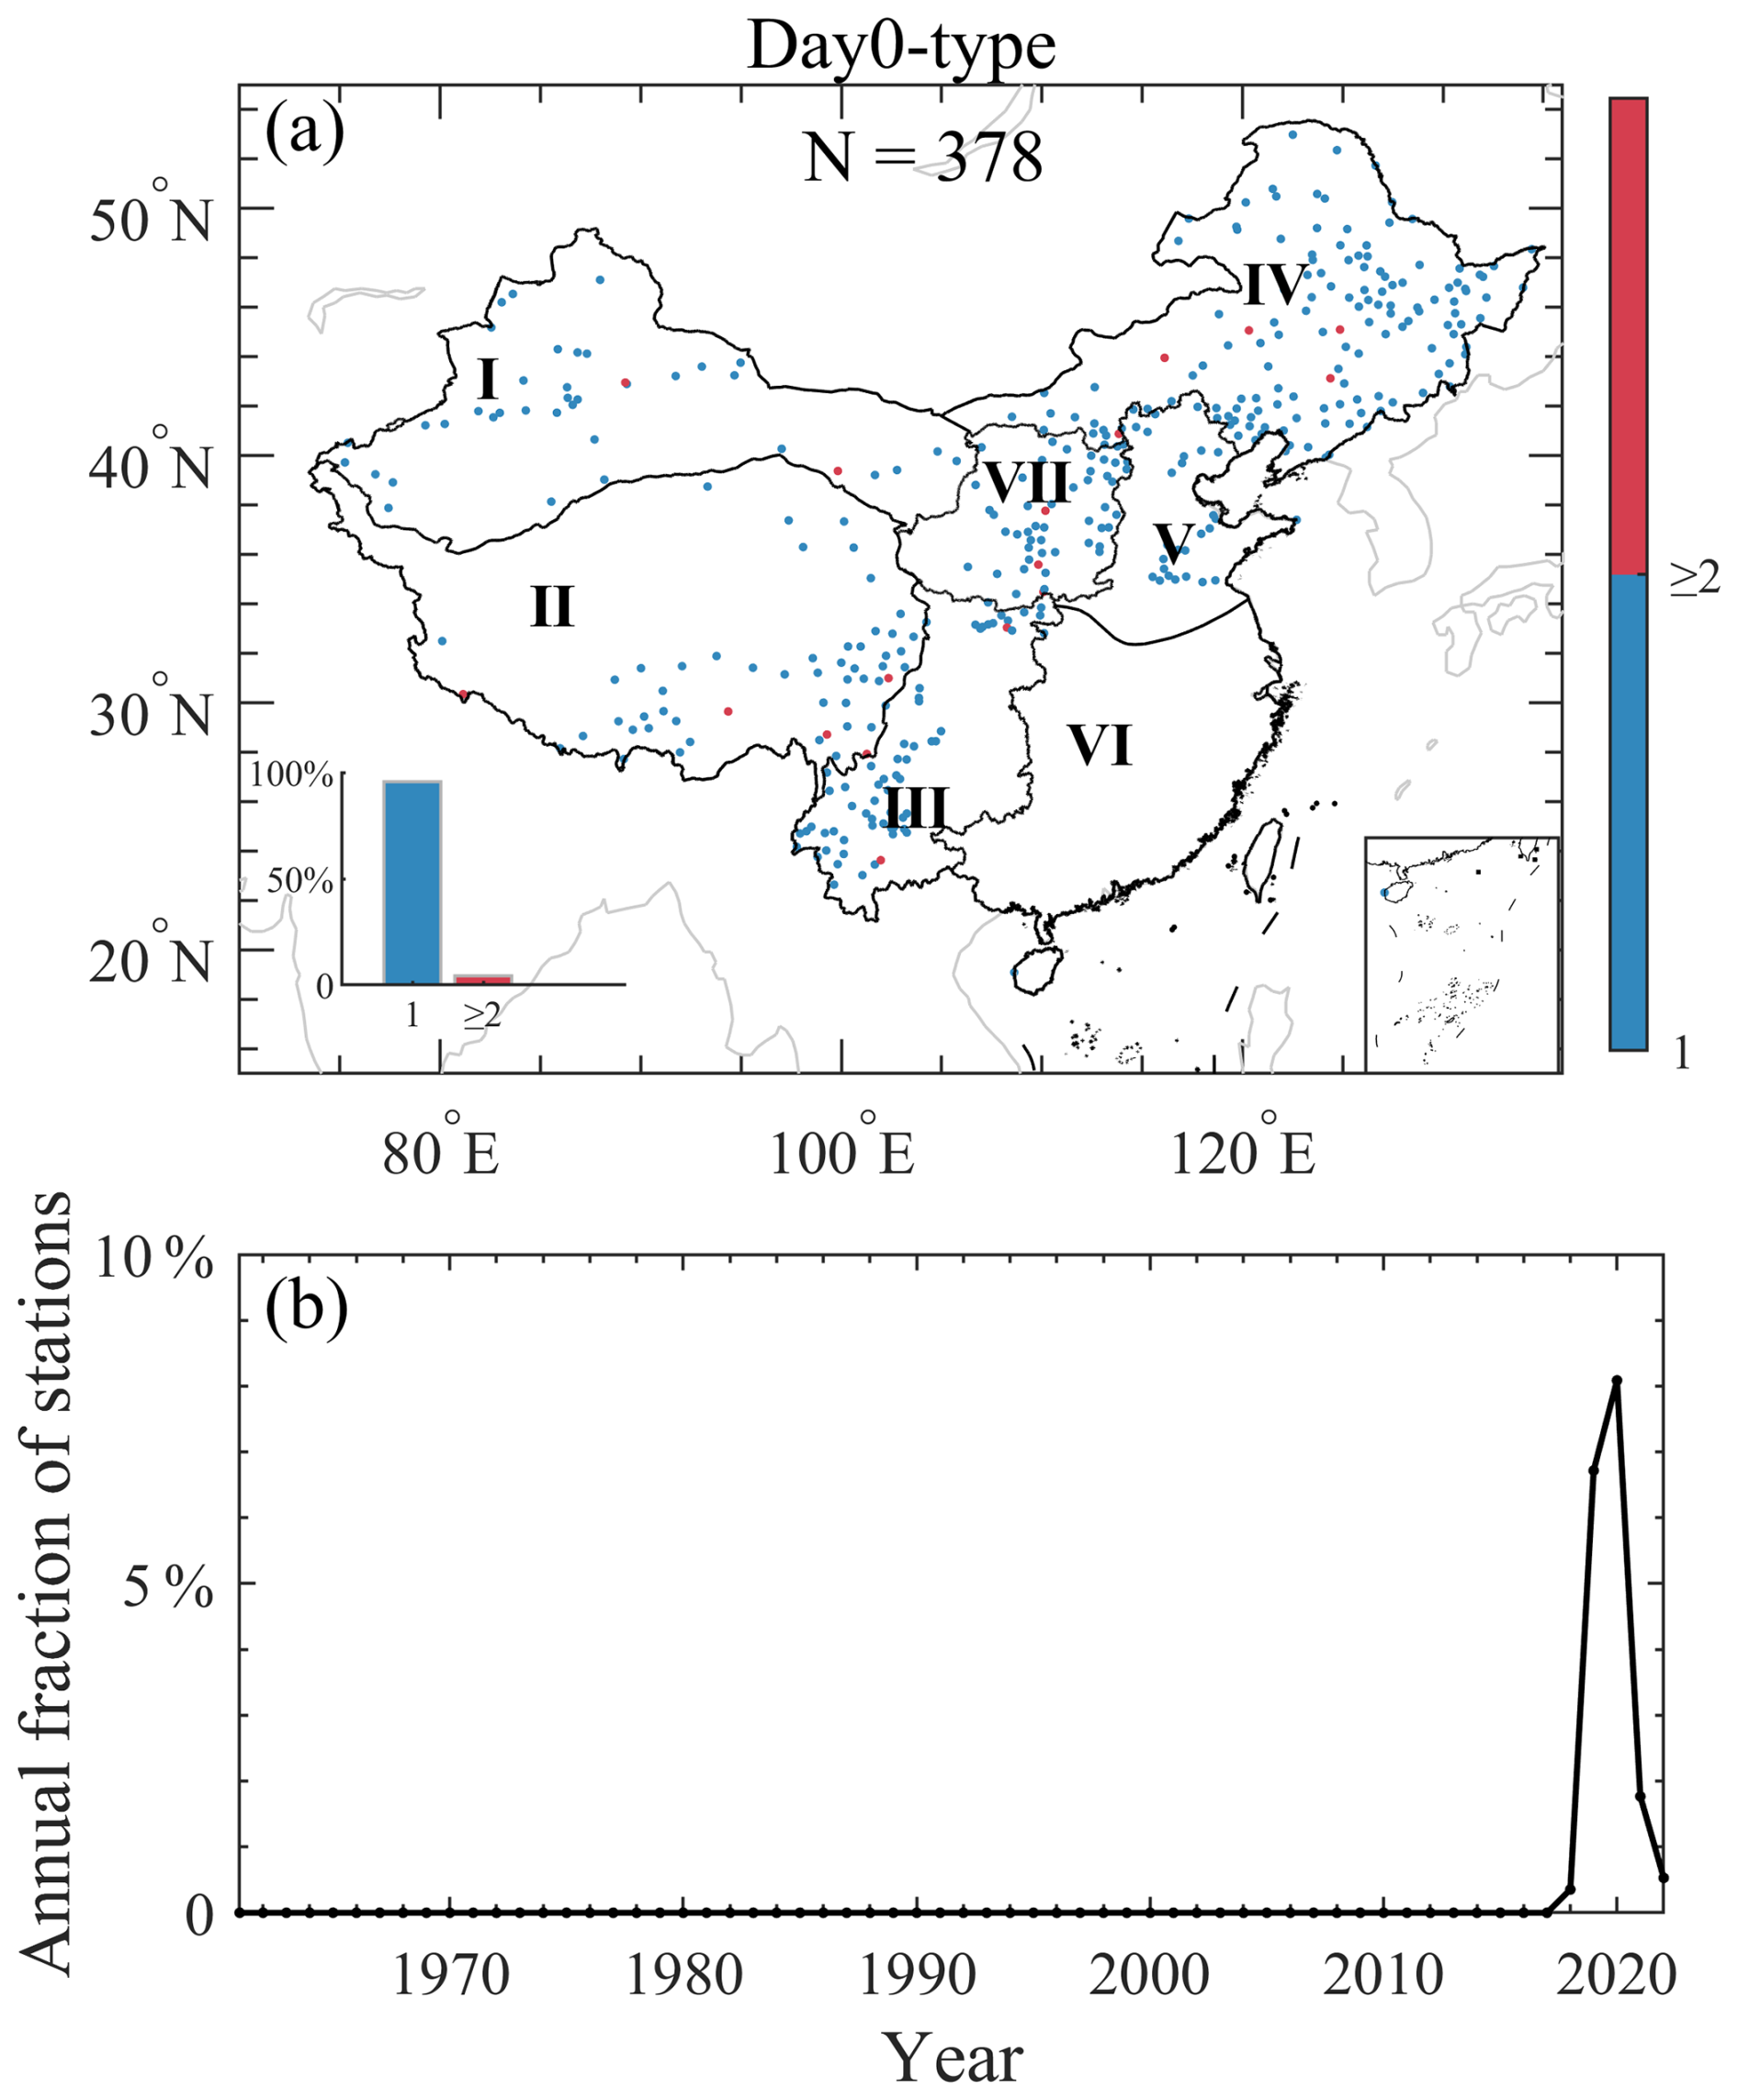
Figure 2(a) Map of stations with the day0-type discontinuities in the monthly count of days with zero sunshine duration. The color bar on the right-hand side illustrates the total number of segments with the day0-type discontinuities for each station. The sub-figure in the bottom left shows the percentage of stations with different numbers of such segments per station. A total of 378 stations were identified as presenting the day0-type discontinuities. (b) Annual fraction (%) of stations with the day0-type discontinuities from 1961 to 2022.
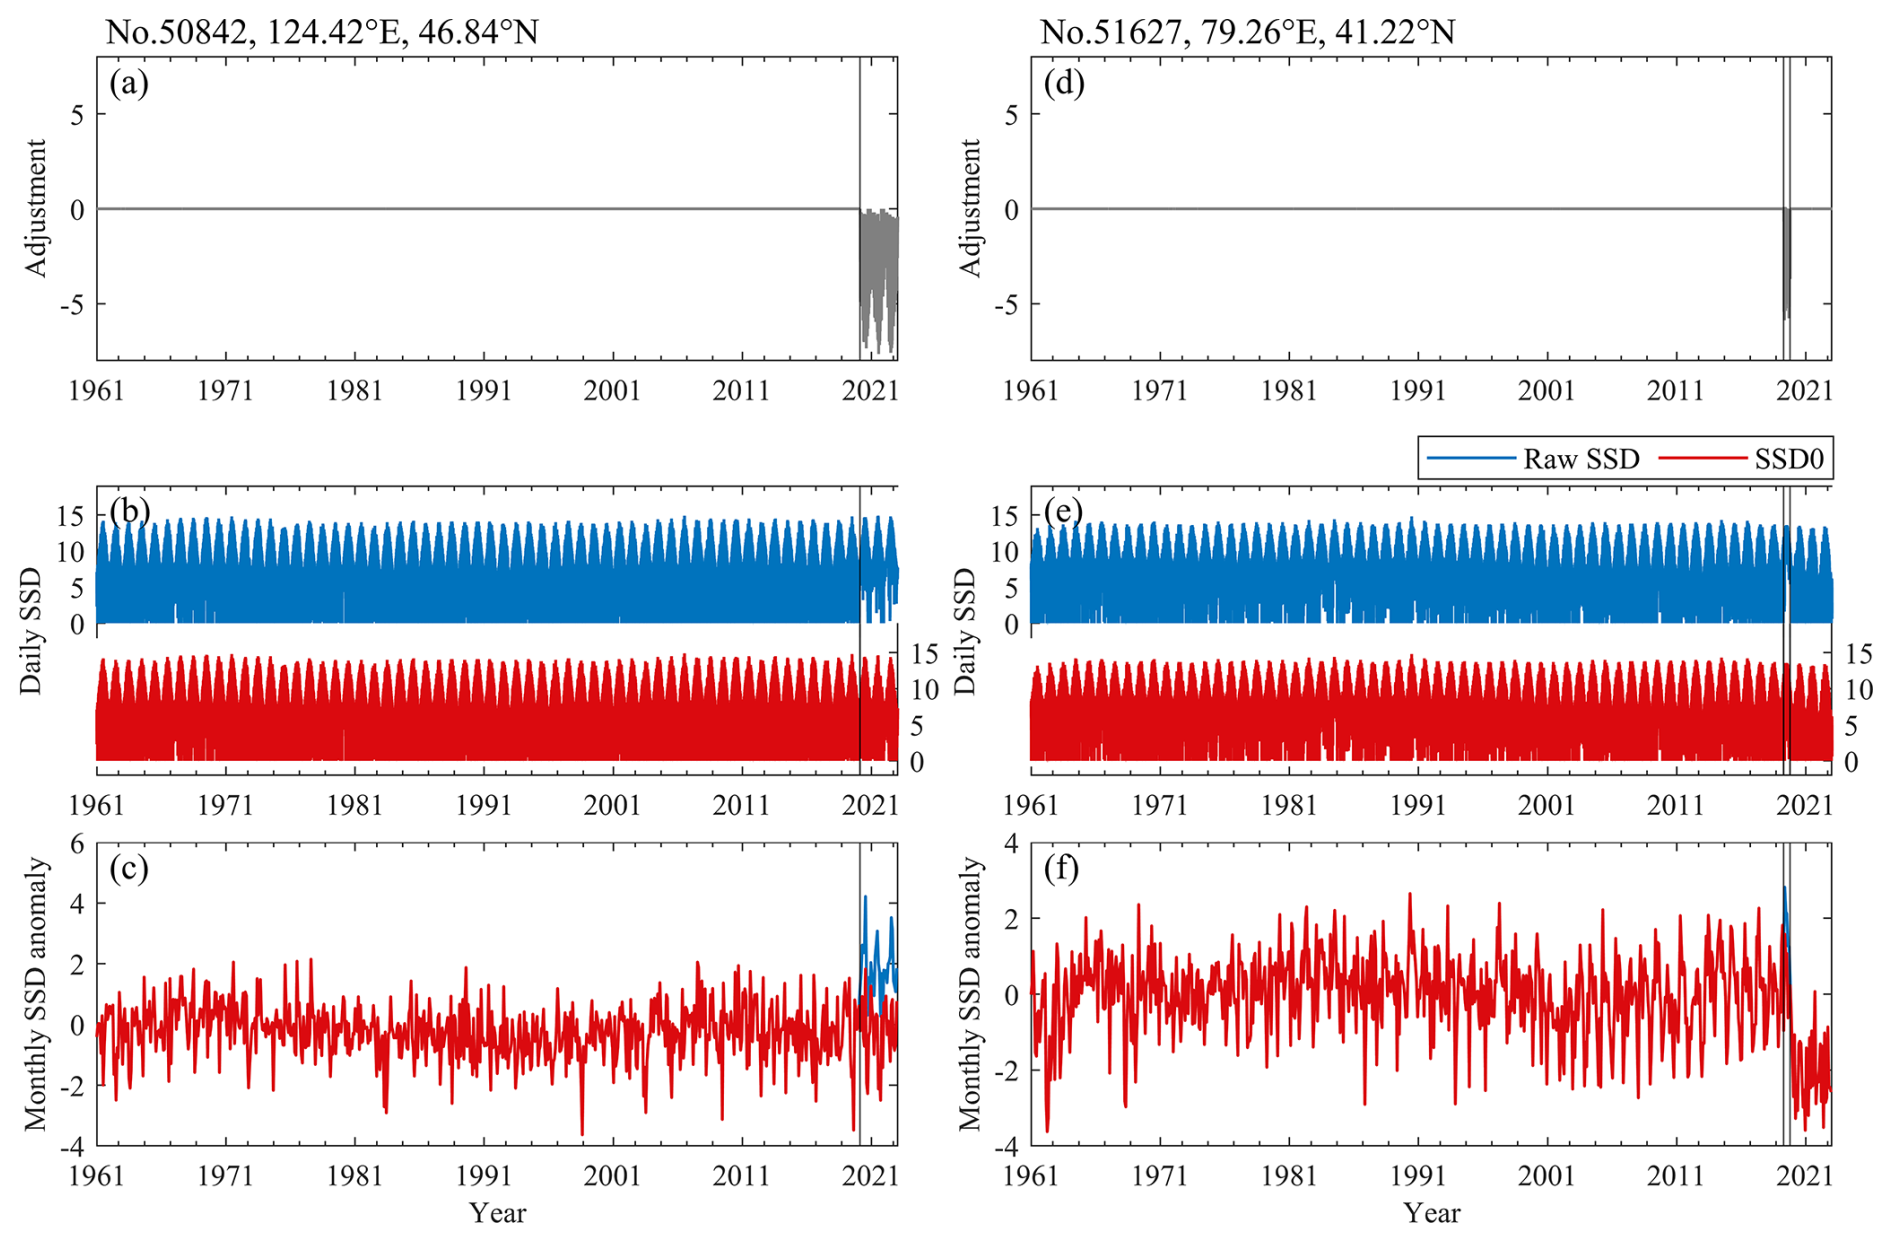
Figure 3Comparison of raw sunshine duration (raw SSD; blue line; h d−1) with the day0-type-corrected sunshine duration (SSD0; red line; h d−1) at two example stations in (a–c) Northeast China and (d–f) Northwest China. (a, d) QM adjustments added to the raw SSD. (b, e) Daily time series of the raw SSD and SSD0. (c, f) As in (b, e) but for the monthly SSD anomalies. The vertical gray lines indicate the start and end dates of segments identified as presenting with the day0-type discontinuities.
2.3 Homogenization procedure
Since parallel observations for the photoelectric digital SSD recorder and manual SSD recorder are not publicly available, we are unable to directly explore the relationship between the two datasets. Data series homogenization offers us an effective way to address discontinuities in climate time series caused by non-climatic factors like station relocations and instrument replacements. Much effort has been devoted to developing homogenization methods, such as the standard normal homogeneity test (SNHT) (Alexandersson, 1986), two-phase regression-based methods (Solow, 1987), Bayesian-based methods (Perreault et al., 2000; Chu and Zhao, 2004), the penalized maximal T test (PMT) (Wang et al., 2007), and the penalized maximal F test (PMF) (Wang, 2008a). Reeves et al. (2007) compared these methods and argued that the SNHT may work best when trend and periodic effects are diminished by using homogeneous reference series. However, Wang et al. (2007) and Wang (2008a) pointed out that unequal sample sizes affect the false-alarm rate and detection power of SNHT-type tests.
The aforementioned authors demonstrated that PMT and PMF tests, with the incorporation of penalized empirical corrections, offer higher detection power and are suitable for long-term series with significant climate trends (Wang, 2008b; Wang et al., 2010). The PMT test searches for the most likely location of mean shifts in segments of the difference between the candidate and reference series using a recursive-testing algorithm (Wang et al., 2007). The PMF test, on the other hand, detects undocumented mean shifts in the difference series with a linear trend by employing a common-trend two-phase regression model (Wang, 2008a). Both test algorithms account for the lag-1 autocorrelation of the series. Since their release, PMT and PMF tests have been successfully applied to various climate elements, including temperature, precipitation, humidity, wind speed, and Rs (Wang et al., 2010; Dai et al., 2011; Domonkos, 2011; Yang et al., 2018; Zhou et al., 2018, 2022; Ma et al., 2022), making them the chosen methods for this study. For variance shifts in the series, an improved Kolmogorov–Smirnov (K–S) test has been widely used to assess whether two samples follow similar or different distributions (Press et al., 1992). To account for the effects of the lag-1 autocorrelation and sample size, Dai et al. (2011) and Zhou et al. (2021a) developed critical values for certain significance levels through a series of Monte Carlo simulations.
During the homogenization, a well-established reference series is essential for sufficiently detecting and adjusting inhomogeneities in long-term climate time series as it helps remove most real climate changes and synoptic variations (i.e., noise), enhancing the signal-to-noise ratio of discontinuities and enabling statistical detection and the removal of spurious shifts (Dai et al., 2011; Zhou et al., 2022). In this study, we first established a reliable reference series to account for background weather and climate variations and then detected and adjusted spurious breakpoints in the mean and variance of the non-zero daily SSD0 series using the well-established ERA5 reference series, resulting in a homogenized daily SSD observational dataset.
2.3.1 Construction of the reference series
A reliable reference series should effectively capture most background weather and climate variations while remaining homogeneous. ERA5 SSD series are highly correlated with the SSD0 series on daily and monthly timescales across China (Fig. 4a and d), which ensures that ERA5 SSD as a reference series can remove most background weather and climate variations from the SSD0 series, thereby facilitating the detection of breakpoints.
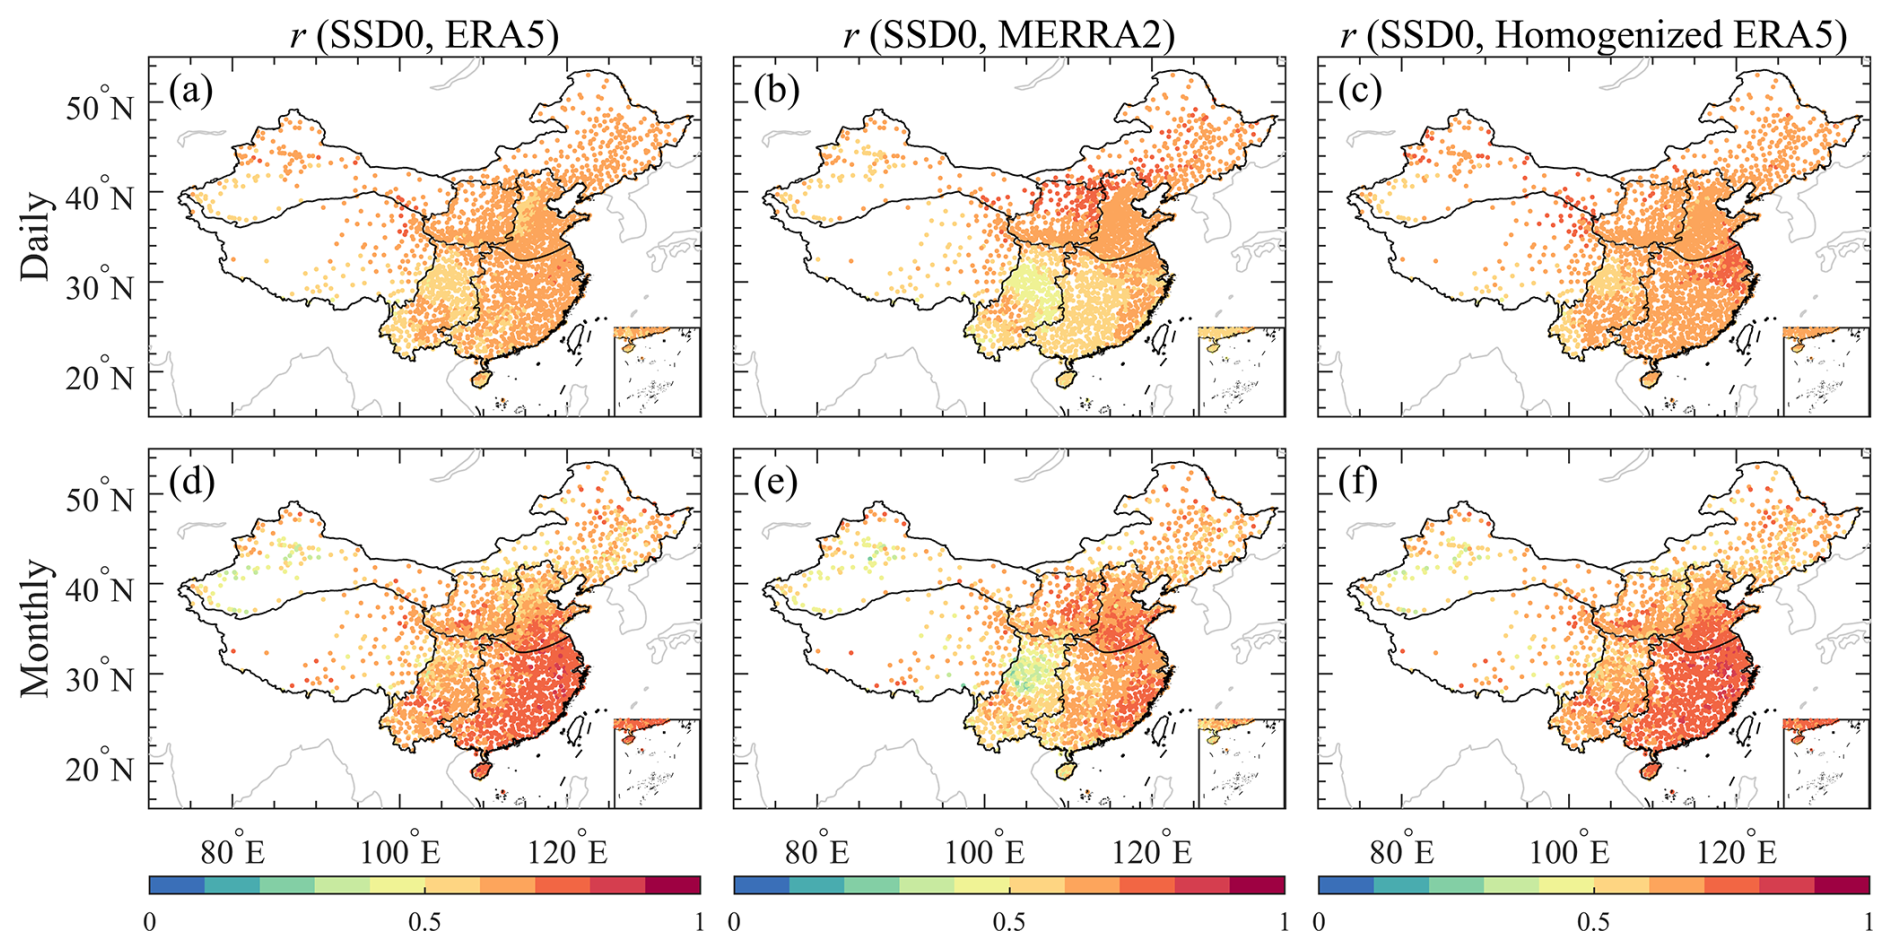
Figure 4Maps of the correlation coefficients of sunshine duration at daily, monthly, and annual timescales between the day0-type-corrected observation (SSD0) and ERA5, MERRA-2, and the homogenized ERA5.
Previous studies have indicated that ERA5 significantly overestimates the variation in Rs from 2003 to 2010 in China (He et al., 2021; Shao et al., 2022). This overestimation is inherited in the SSD estimated from hourly direct Rs of ERA5, presenting inhomogeneities during this period, particularly in North China and Southeast China (Fig. 5). We evaluated multiple reanalysis products and found that the SSD estimated from the hourly direct Rs of MERRA-2 does not suffer from this issue (Fig. 5), maybe since MERRA-2 assimilates space-based observations of aerosols and improves Rs simulations in China to some extent (Feng and Wang, 2021). Meanwhile, the MERRA-2 SSD is also highly correlated with the SSD0 series (Fig. 4b and e). To resolve the discontinuity of ERA5 SSD from 2003 to 2010, we took the MERRA-2 SSD as the reference series and applied the PMT test to detect breakpoints in the monthly ERA5 SSD series. After obtaining the breakpoints, we employed the QM algorithm to adjust discontinuities in the daily ERA5 SSD series, using the longest segment as the reference. Note that, to minimize potential uncertainties arising from incorporating the MERRA-2 SSD as much as possible, the detection and adjustment described above are strictly limited to the period of 2003–2010. Results show that the homogenized ERA5 SSD not only exhibits higher correlations with the SSD0 series on daily and monthly timescales (Fig. 4c and f) but also greatly alleviated the overestimation from 2003 to 2010 (Fig. 5), which makes it a suitable reference series for the subsequent homogenization.
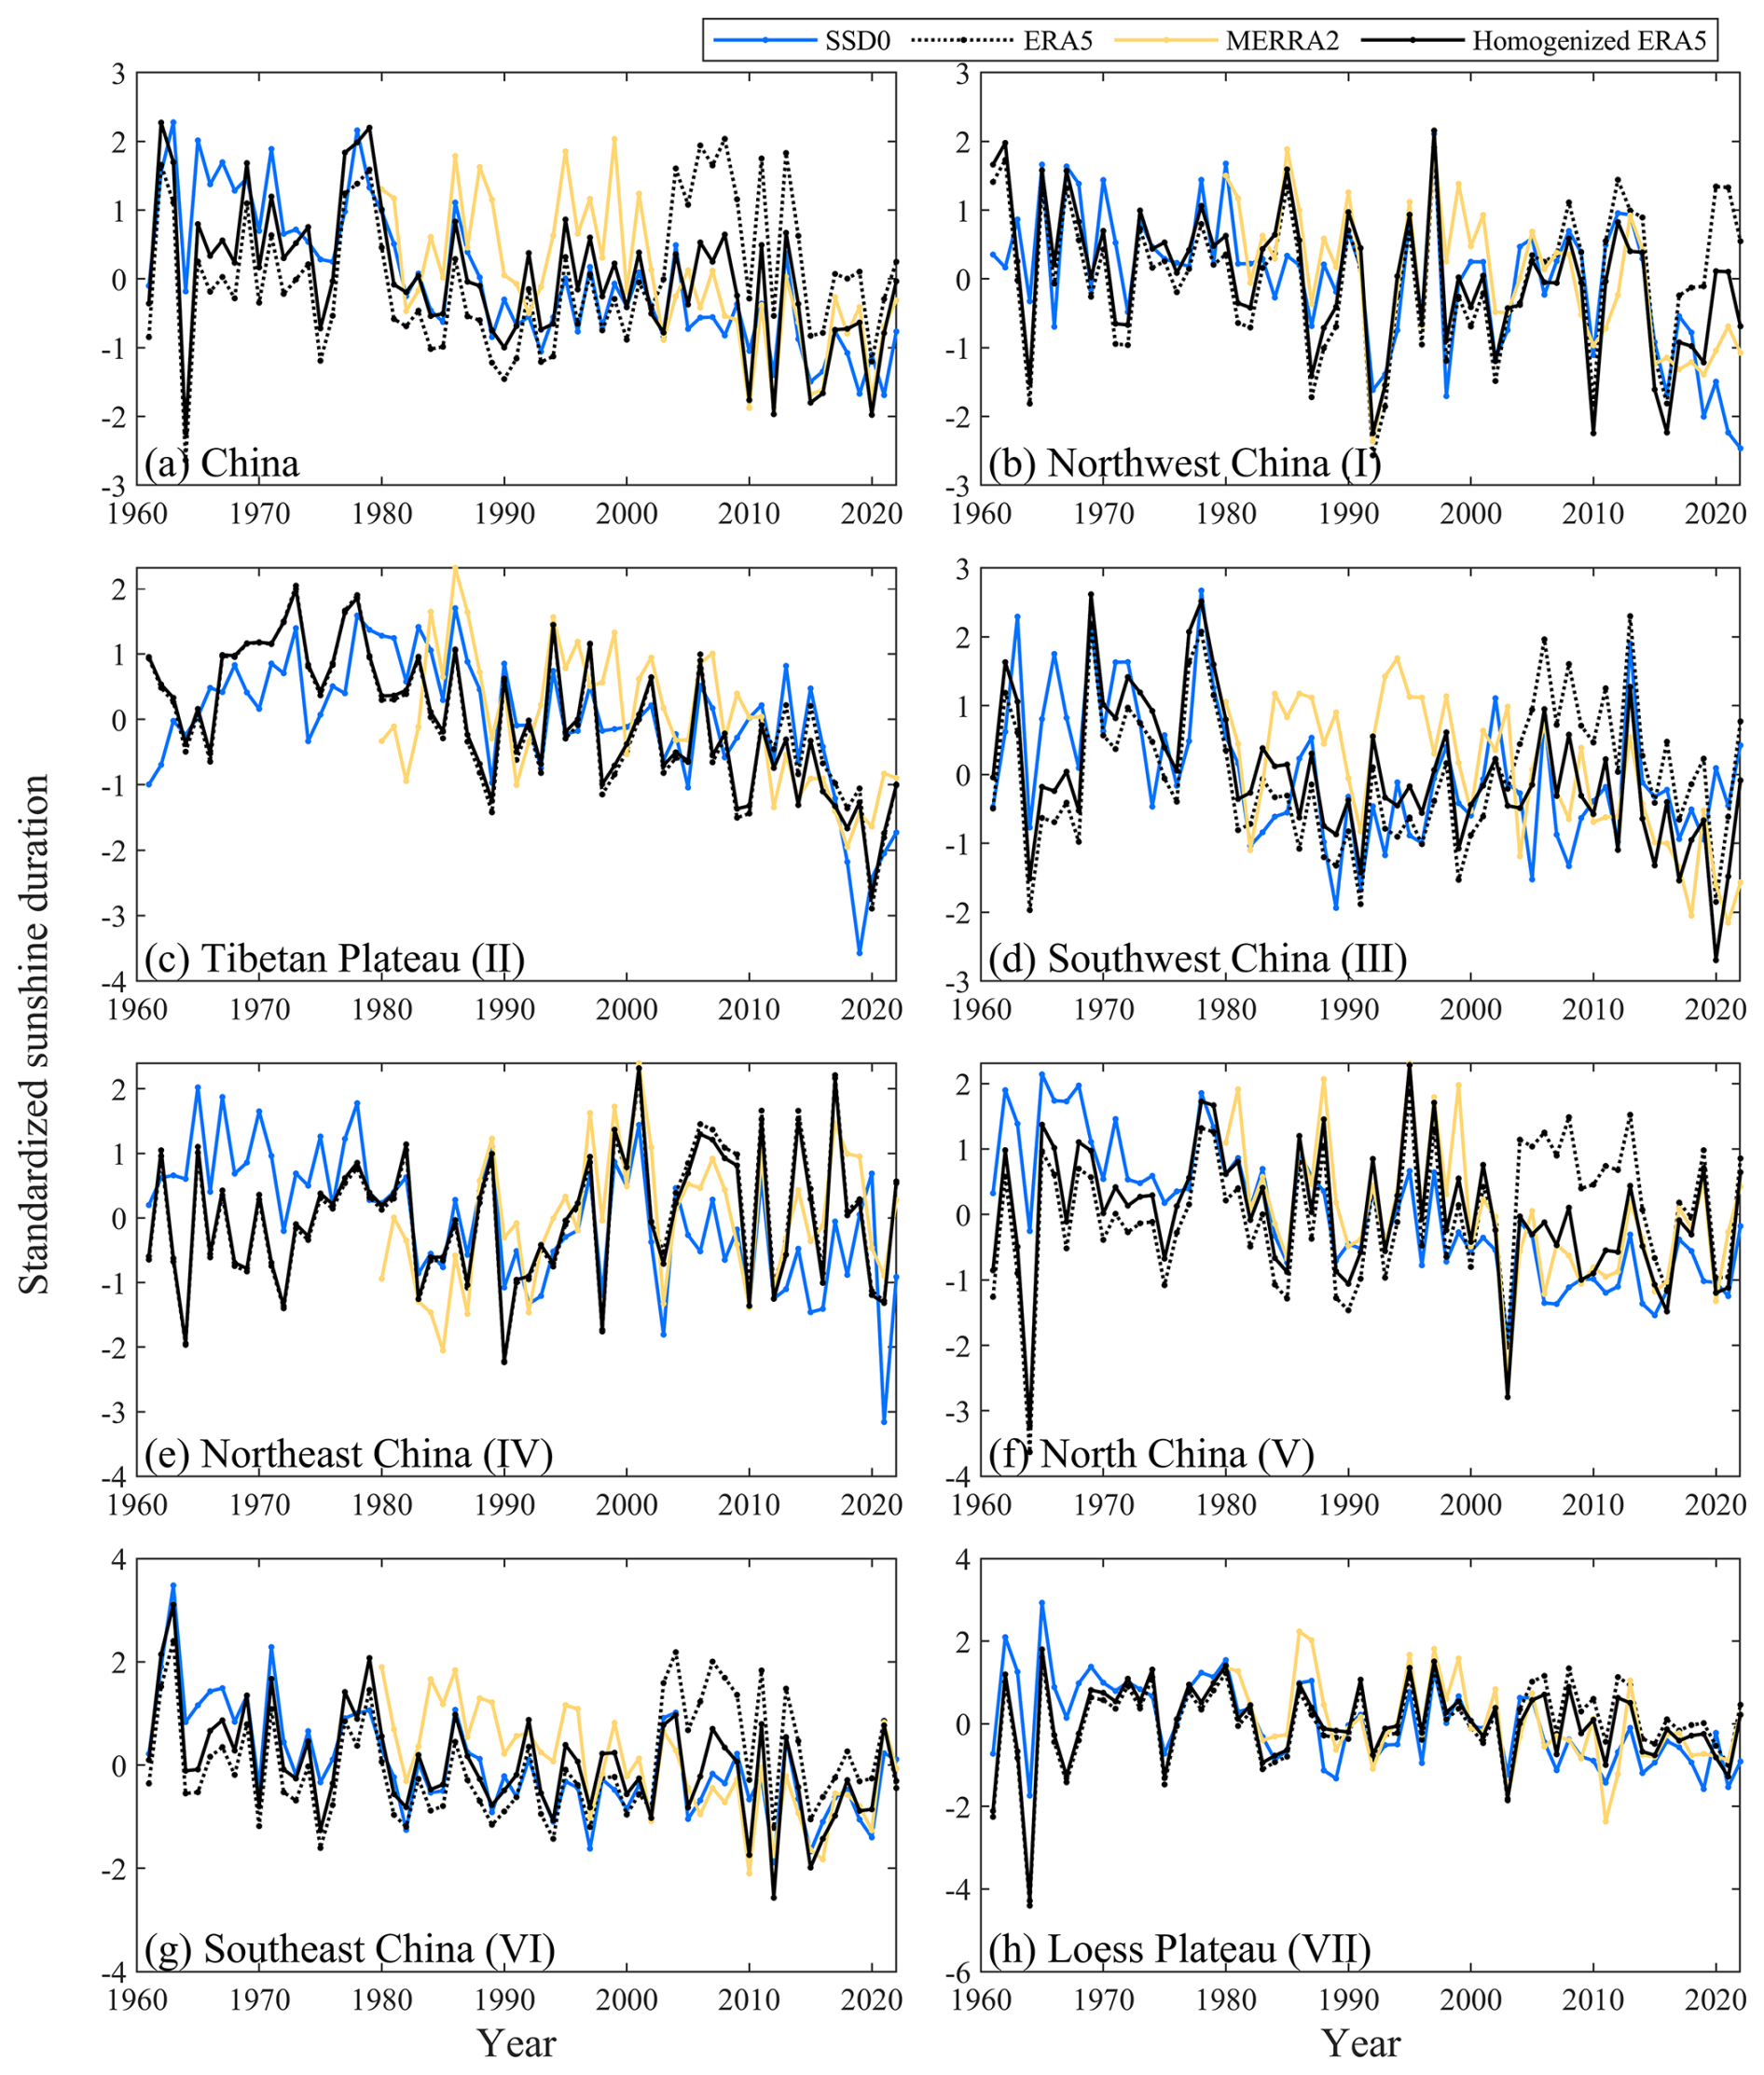
Figure 5Time series of the standardized sunshine duration from the day0-type-corrected observation (SSD0, blue line), ERA5 (dotted black line), MERRA-2 (yellow line), and the homogenized ERA5 (black line) in (a) China and (b–h) its seven sub-regions.
2.3.2 Detection and adjustment of breakpoints in non-zero daily SSD0 series
Zero values in a daily meteorological series should remain unaltered unless supported by evidence or reports of trace occurrences or changes in measuring precision (Wang et al., 2010). After the known day0-type discontinuity has been corrected, as in Sect. 2.2 above, the subsequent homogenization was performed based on the variance and mean of non-zero daily SSD0 series. To achieve this, we decomposed the non-zero daily SSD0 series into two components: intra-monthly and monthly.
Firstly, we applied an improved Kolmogorov–Smirnov (K–S) test (Dai et al., 2011; Zhou et al., 2021a) at a 99.9 % significance level to the intra-monthly component of the daily difference series (DSSDdintra) for detecting breakpoints in the variance of the non-zero daily SSD0 series:
where SSDdobs and SSDdERA5 are the non-zero daily values of SSD0 and the homogenized ERA5 SSD, SSDmobs and SSDmERA5 are the monthly mean SSDdobs and SSDdERA5, SSDaobs and SSDaERA5 are the daily anomalies of SSDdobs and SSDdERA5, and α is the linear regression coefficient of SSDaobs against SSDaERA5. α displays higher values in the Tibetan Plateau, Northwest China, and the Loess Plateau while remaining around 1 in the other regions (Fig. 6a). Systematic biases in the reanalysis and the effect of the station-versus-grid discrepancies can also be greatly eliminated by the regression against the observation.
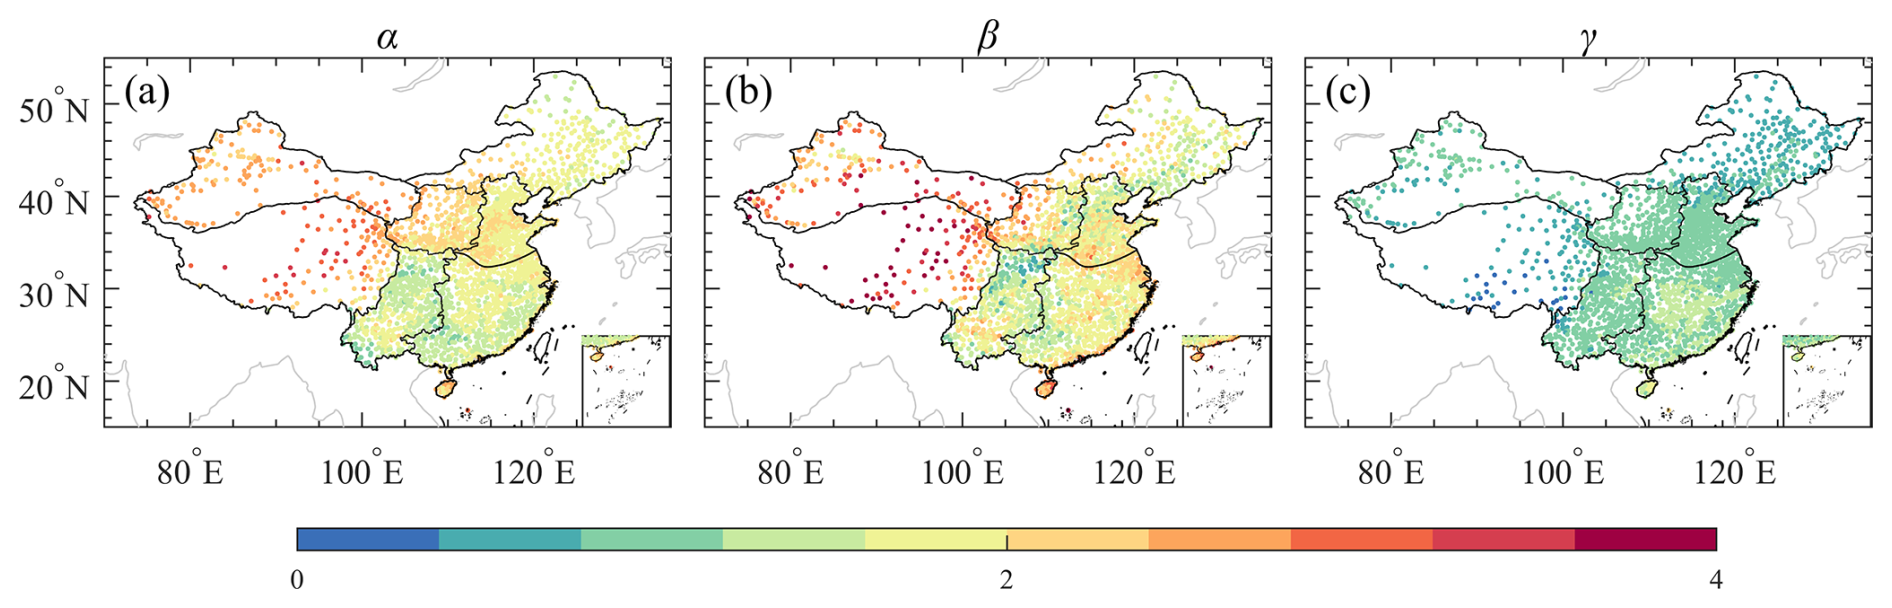
Figure 6(a) Map of the linear regression coefficient (α) of the daily anomalies of SSDdobs against SSDdERA5. (b, c) Same as (a) but showing β for SSDmobs against SSDmERA5 and γ for SSDdobs against SSDdERA5, respectively. For more details, refer to Eqs. (1), (4), and (5).
Secondly, we applied both PMT and PMF tests, developed by Wang et al. (2007) and Wang (2008b), at a 99 % significance level to detect breakpoints in the monthly mean of the non-zero SSD0 series. The breakpoints detected by both methods within 1 year were kept. In the PMT test, SSDmERA5 was taken as the input of reference series. Consistently, the monthly difference series (DSSDm) requested in the PMF test was constructed as follows:
where β is the linear regression coefficient between SSDmobs and SSDmERA5. β exhibits a similar pattern to α, showing high values in the northwest and low values in the southeast (Fig. 6b). To obtain a manageable number of breakpoints in the final, we followed the approach of Zhou et al. (2021a) by setting 365 d between breakpoints as the threshold to merge the detected breakpoints above. For cases with three or more breakpoints within 365 d of each other, we retained only the middle breakpoint, and for two breakpoints, we kept the one with the larger test statistic.
Finally, we adopted the QM algorithm from Wang et al. (2010) to remove the merged breakpoints in the daily difference series (DSSDd) that is the residual series from the regression (the slope γ, as in Fig. 6c, showing a relatively uniform pattern) of SSDdobs based on SSDdERA5:
This produced a homogenized daily SSD dataset for China, covering the period from 1961 to 2022, with zero values backfilled. The longest segment was chosen as the baseline segment, primarily due to its relative homogeneity and reliability. Despite the use of advanced automated instruments with higher precision from 2019 onward, the segment is still too short to fully meet the criteria for a reliable baseline segment. The segment after 2019 will be considered to be the baseline segment when the dataset is updated in the coming years.
3.1 Detection and adjustment of breakpoints
One or two breakpoints in the variance of the DSSDdintra series were detected at 328 stations, mainly in Northwest China, Northeast China, North China, and the Loess Plateau (Fig. 7a). Most of these breakpoints occur around 2019 (Fig. 7a2), coinciding with the instrument replacements, namely from dark-tube sunshine recorders to photoelectric digital sunshine recorders, as well as the station relocations (Fig. 1b). During the period of 1961–2022, 1238 stations (55 %) in China suffered from breakpoints in the mean of the DSSDm series (Fig. 7b1). These breakpoints are evenly distributed across China (Fig. 7b1), with many occurring around 2019 and with two additional small peaks around 1972 and 2003 (Fig. 7b2). Approximately 52 % of the stations in China are found to have one breakpoint, 32 % were found to have two breakpoints, 12 % have three, and few stations have more than four breakpoints (Fig. 7b1). After merging the two types of breakpoints above, a total of 1363 stations experienced breakpoints, accounting for approximately 60 % of the stations in China (Fig. 7c1). The merged breakpoints are densely concentrated in northern regions of China, where approximately 71 % of the stations are affected, with the highest density (74 %) being observed on the Loess Plateau, while approximately 47 % of the stations are affected in southern regions of China (Fig. 7c1). A higher fraction of stations with breakpoints is found around 2019 after merging (Fig. 7c2).
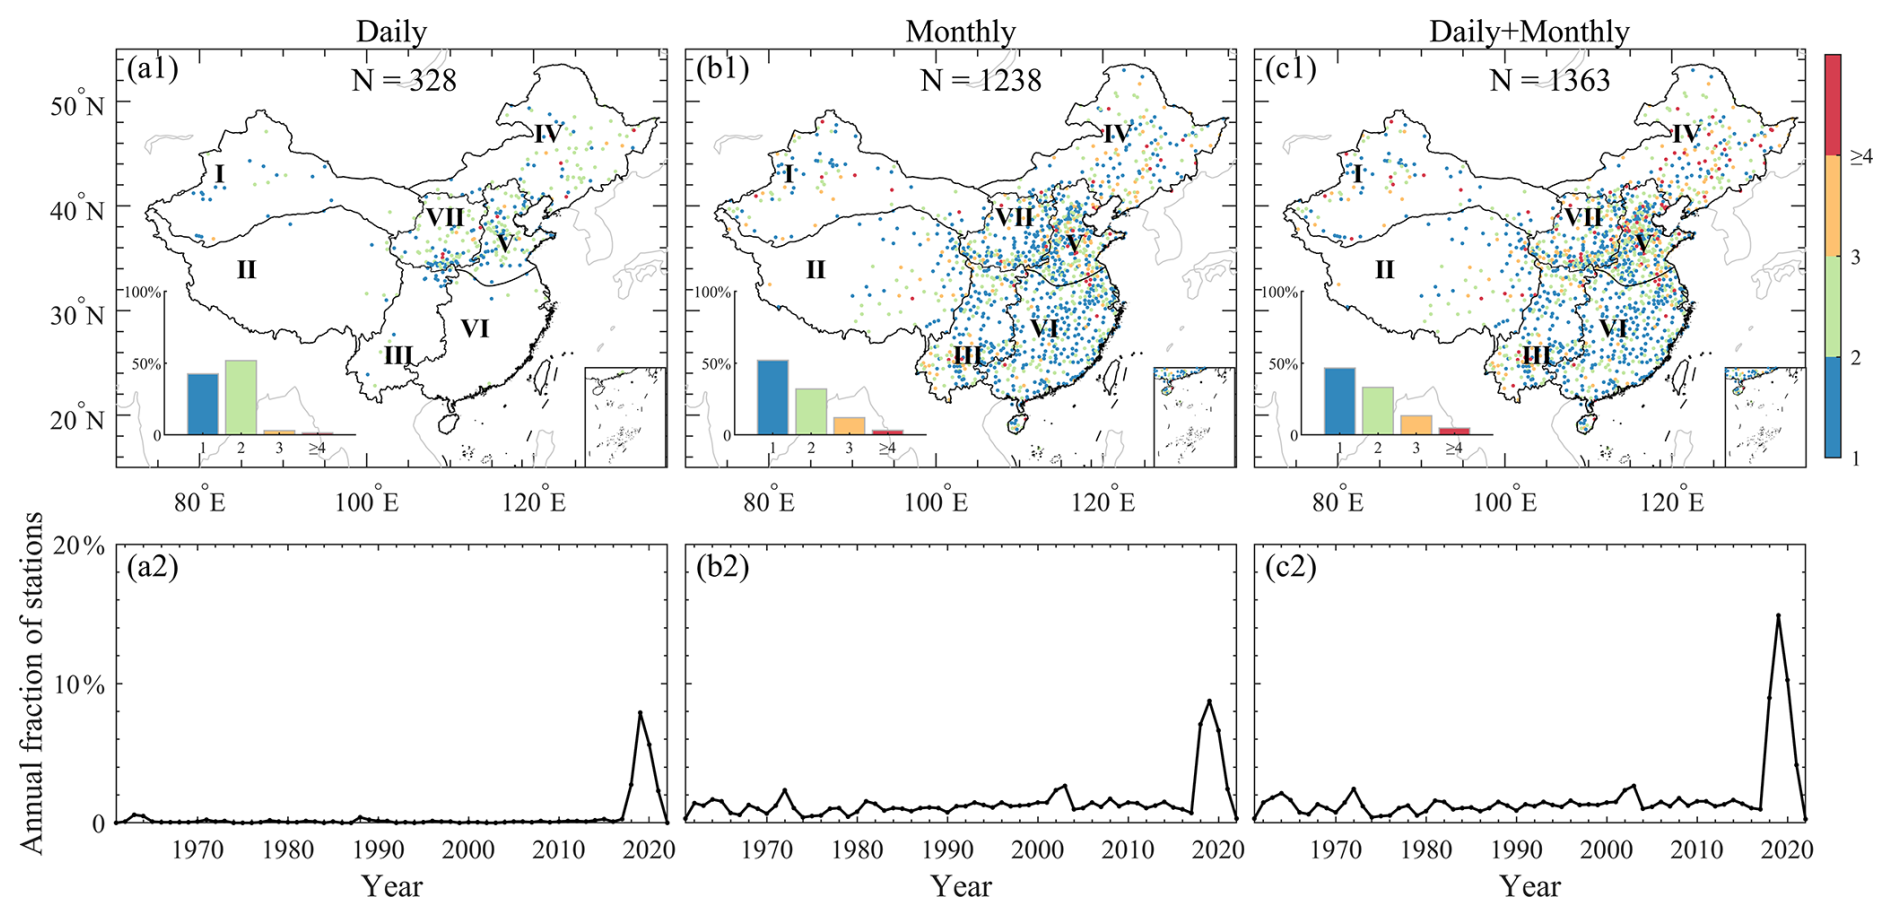
Figure 7(a1, b1) Maps of the number of breakpoints detected in the daily variance and monthly mean of the non-zero SSD0 series, respectively. (c1) Map of the number of breakpoints merged based on those in (a1) and (b1). The total number (N) of stations with one or more breakpoints from 1961 to 2022 is shown in each panel. (a2, b2, c2) Annual fraction (unit: %) of stations with breakpoints from 1961 to 2022.
The detected breakpoints may be associated with factors such as instrument replacements, station relocations, equipment malfunctions, and operation errors, any of which may contribute to data series inhomogeneity (Sanchez-Lorenzo and Wild, 2012; Wang et al., 2020). To empirically demonstrate this, we attempted to collect such types of information but were only able to compile a detailed set of information about station relocation. We found that over 50 % of stations in 2019 were relocated (Fig. 1b), mostly because they needed to change their positions or heights due to instrument replacements or urbanization. The hit probability for matching detected breakpoints with station relocations is approximately 65 %. Since the date of a station relocation does not always align with the date of a statistically detected breakpoint, this value is calculated as the ratio of the number of stations that experienced one or more relocations within 1 year of the breakpoint to the total number of breakpoints. Note that the breakpoints may be caused by factors other than station relocations, some station locations may not have resulted in any breakpoints, or certain breakpoints may not have emerged from the background weather or climate variations that are not easily detected by a statistical method.
To remove the artificial breakpoints detected above, the QM algorithm was implemented to achieve homogenization by aligning the empirical distributions of all segments. For example, three breakpoints in the variance and mean of the SSD0 series were detected at station no. 51627 (Fig. 8). The first two breakpoints are associated with the station relocations, and the last breakpoints are related to the replacement of instruments in 2019. The adjustments estimated based on the QM algorithm for the three breakpoints are approximately 1, −0.5, and 2.8 h d−1 (Fig. 8b). After adjustments, the monthly SSD0 anomaly series appears to be continuous and reasonable, particularly after 2019 (Fig. 8c).
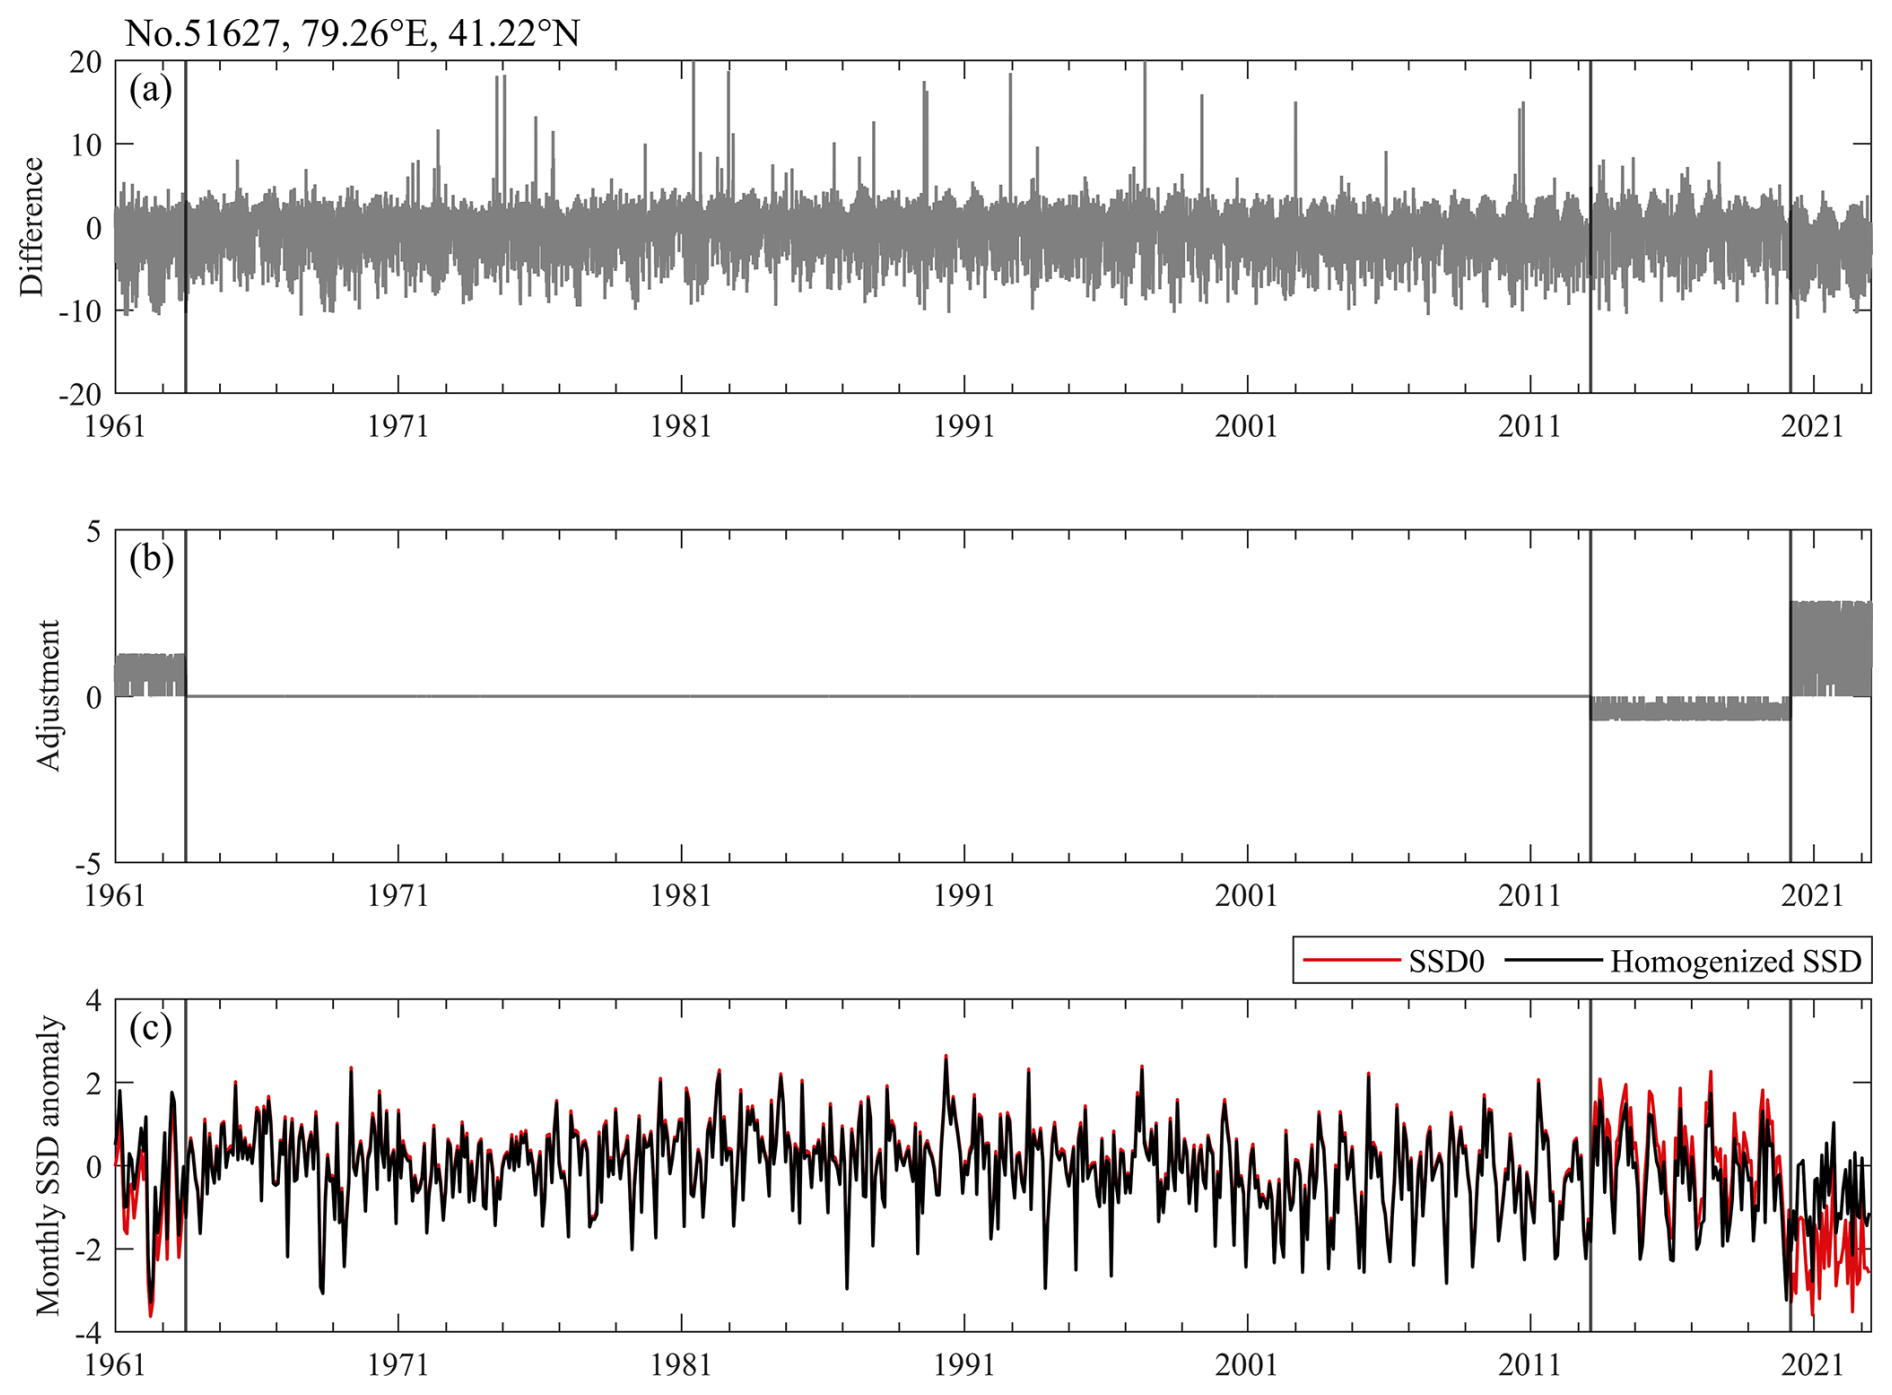
Figure 8Comparison of the day0-type-corrected sunshine duration (SSD0, red line) before and after homogenization (homogenized SSD, black line) at station no. 51627 in Northwest China. (a) Daily SSD difference (unit: h d−1) between the SSD0 and the corrected ERA5 reference series. (b) QM adjustments added to the SSD0. (c) Monthly anomaly series of the SSD0 (red line) and homogenized data (black line). The vertical lines indicate the dates of the breakpoints detected.
3.2 Comparison of trends before and after homogenization
The discontinuities hidden in the series are bound to affect the estimate of long-term trends of SSD. Figure 9 shows series comparisons among the raw SSD, SSD0, and homogenized SSD averaged over China and its seven sub-regions. The most significant adjustments are evident in 2019 or later, occurring across China (Fig. 9). This is results jointly from two aspects, namely the high robustness of dark-tube sunshine recorders in measuring SSD before 2019 and the widespread switch to photoelectric digital sunshine recorders in 2019, which caused notable shifts compared to the earlier period. Based on the periods of dimming and brightening in China, as revealed by prior research (He et al., 2018; He and Wang, 2020), trend analysis was conducted for two major periods: 1961–1990 and 1991–2022.
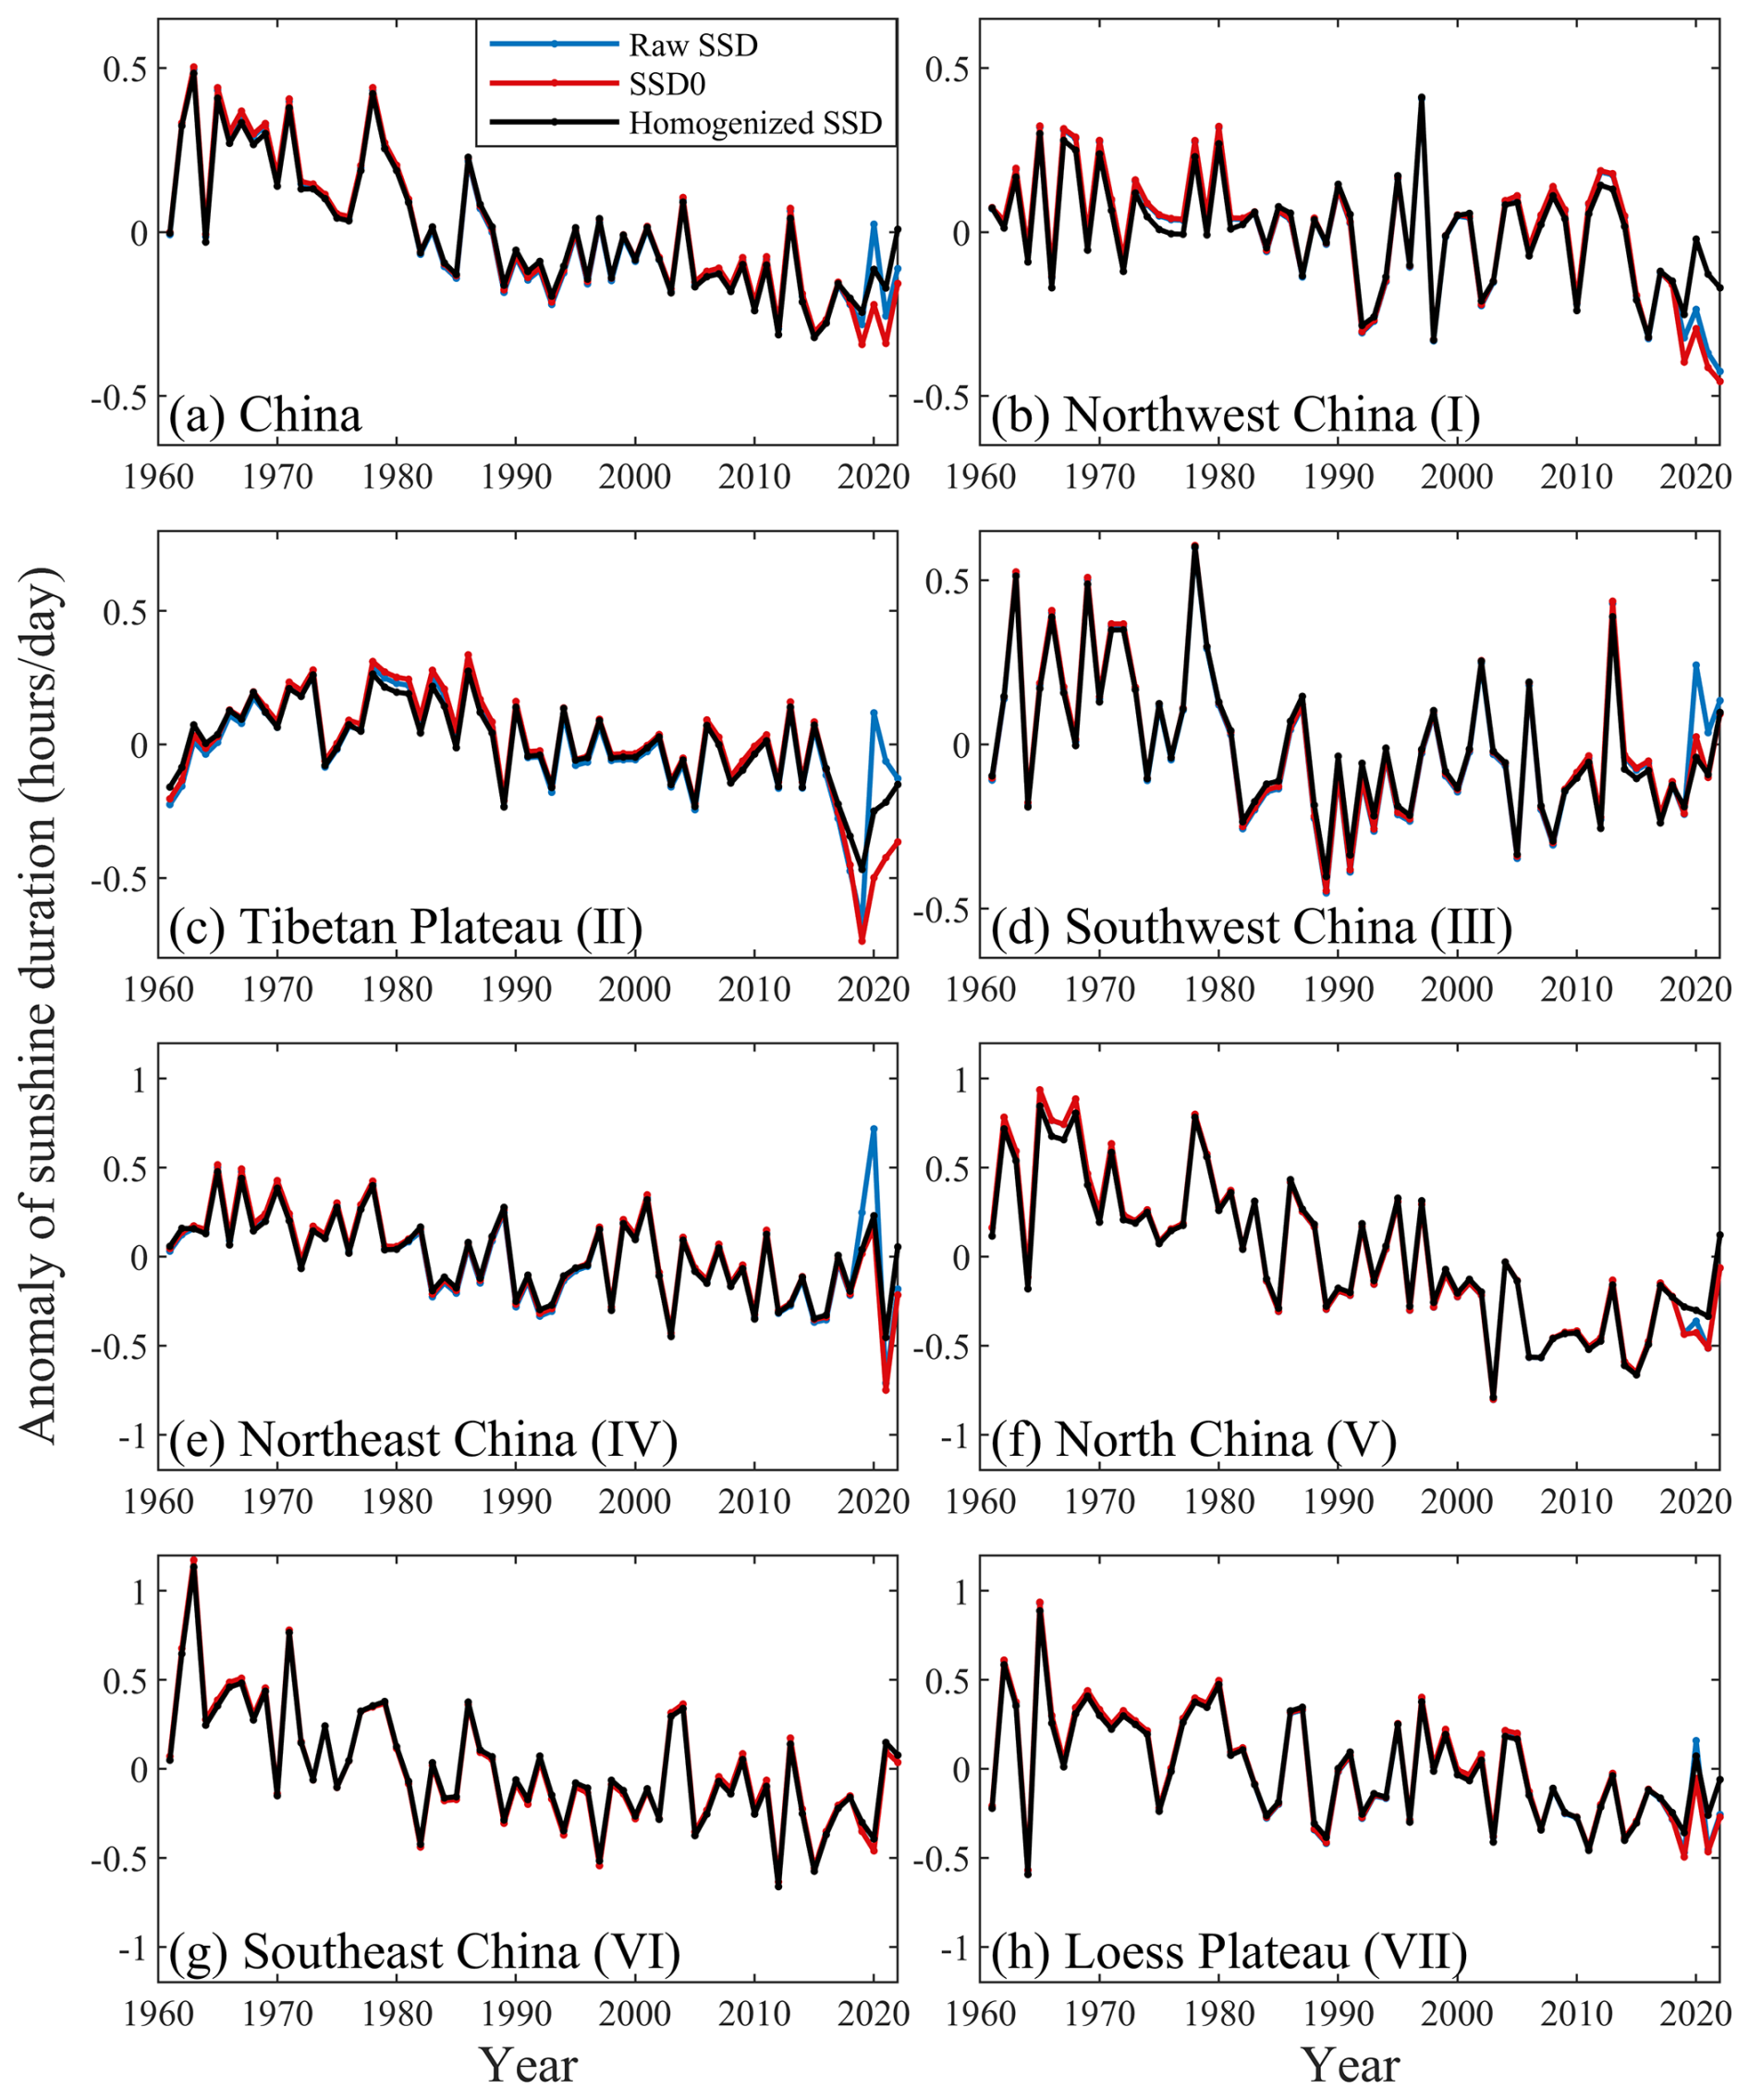
Figure 9Time series of raw sunshine duration (raw SSD, blue line), the day0-type-corrected SSD0 (red line), and the homogenized SSD (black line) in (a) China and (b–h) its seven sub-regions from 1961 to 2022. The anomaly is referenced to the average for the entire period.
During the period of 1961–1990, the homogenized SSD exhibits a significant downward trend of −0.11 h d−1 per decade (p<0.05) in China compared to a slightly steeper decline of −0.13 h d−1 per decade (p<0.05) in the raw SSD (Figs. 9–10 and Table 1), though the difference between the two is not evident. After homogenization, the dimming of homogenized SSD weakens across China, except in the Tibetan Plateau, with the most pronounced weakening in North China at 0.04 h d−1 per decade compared to the raw SSD (Figs. 9–10 and Table 1). Meanwhile, the Tibetan Plateau shows a reduced and non-significant increase in the homogenized SSD (0.02 h d−1 per decade, with a reduction of 60 %; p>0.10) compared to the raw SSD (0.05 h d−1 per decade; p<0.10) during the dimming period of China (i.e., 1961 to 1990) (Figs. 9–10 and Table 1), suggesting that the homogenized SSD tends to better describe the dimming phenomenon.
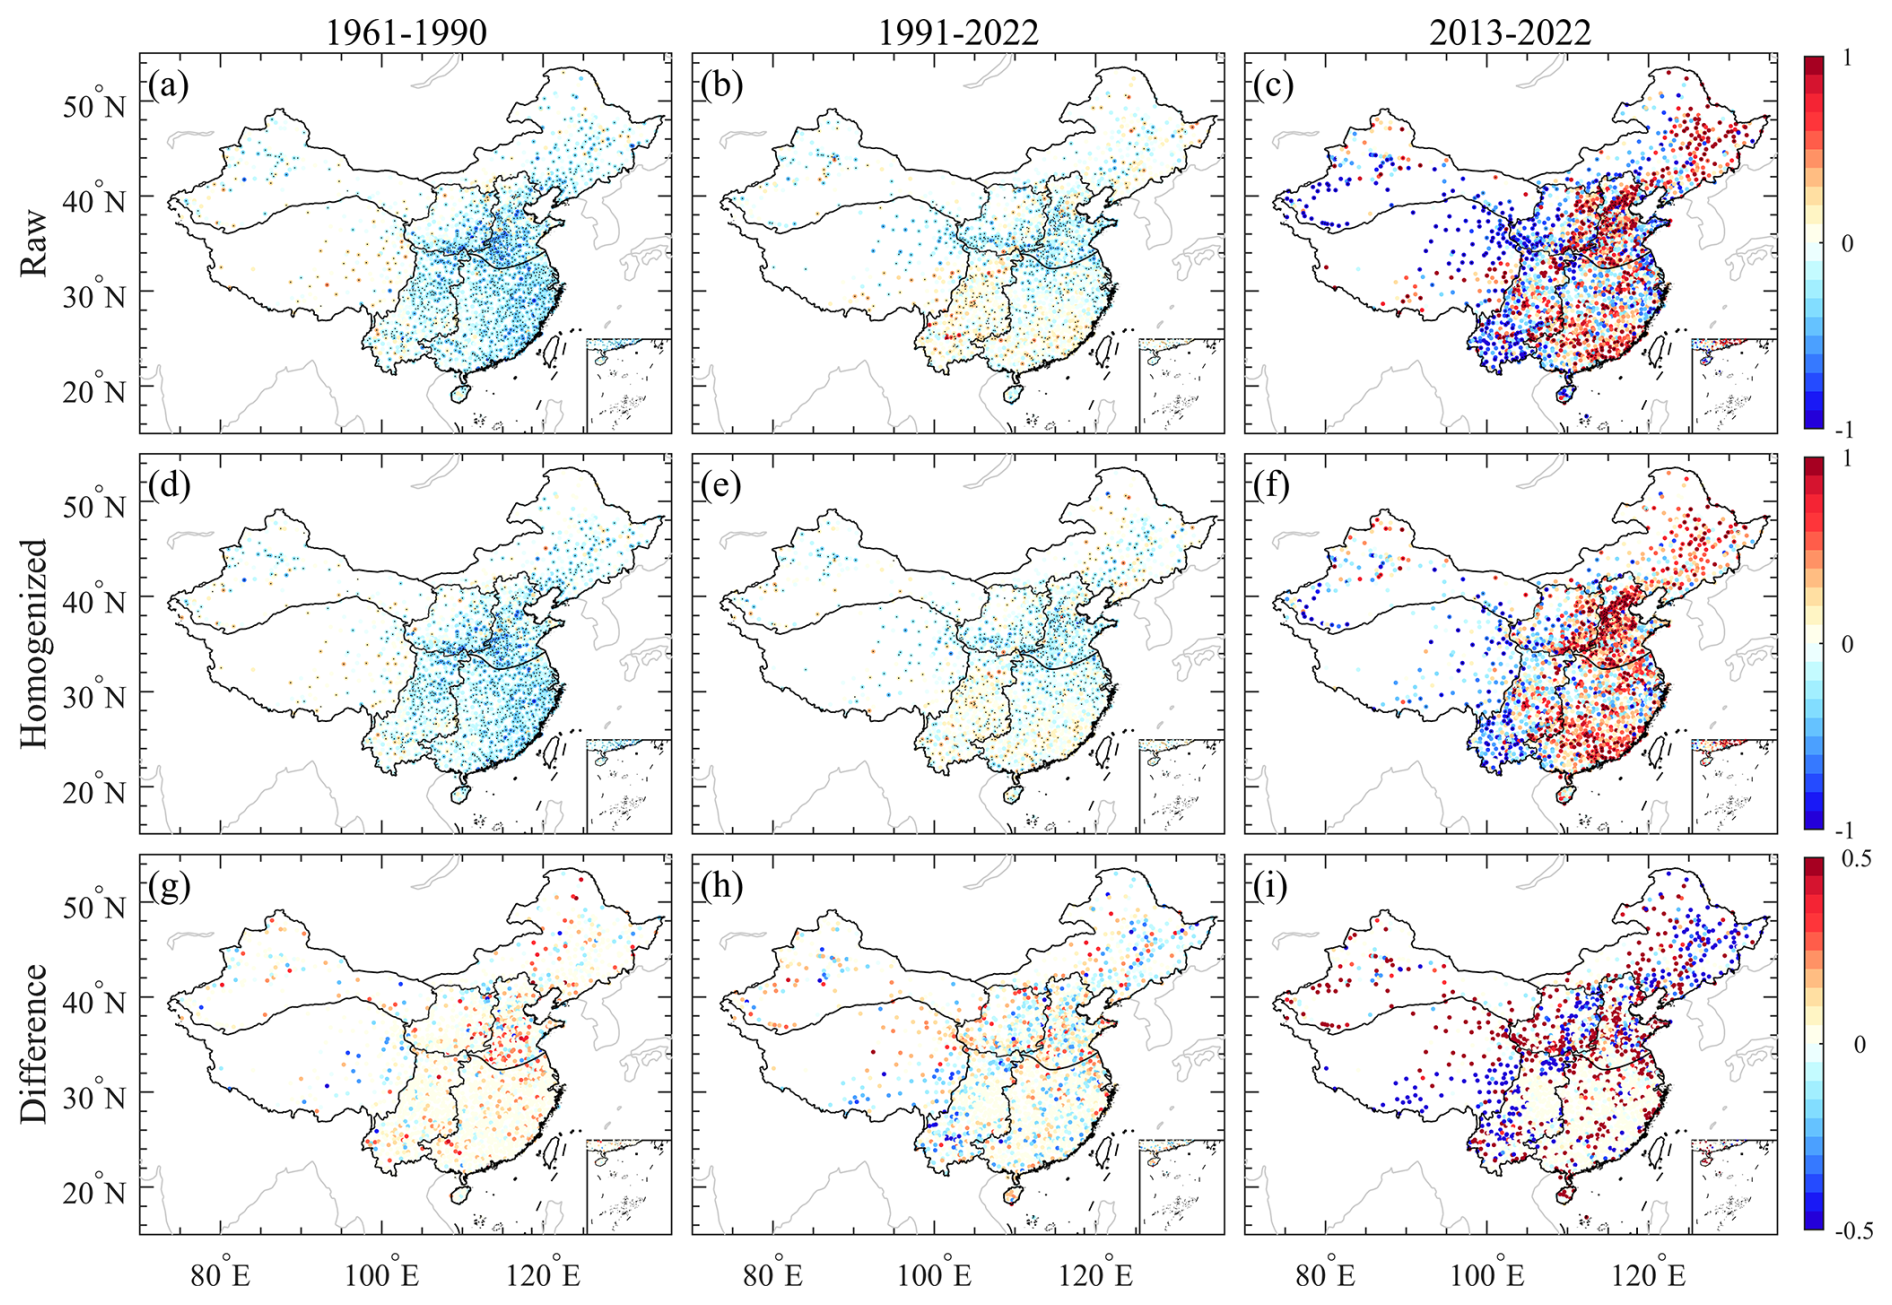
Figure 10Maps of the decadal changes (h d−1 per decade) in (a–c) raw and (d–f) homogenized SSD and (g–i) their difference over China during three periods of 1961–1990, 1991–2022, and 2013–2022. Black dots superimposed on the colored circles indicate a significance level of 0.10.
Table 1Trends in sunshine duration (h d−1 per decade) before and after homogenization in China and its seven sub-regions, i.e., Northwest China (I), the Tibetan Plateau (II), Southwest China (III), Northeast China (IV), North China (V), Southeast China (VI), and the Loess Plateau (VII), during three periods of 1961–1990, 1991–2022, and 2013–2022. Trends with a significance level of 0.05 are shown in bold, while those with a significance level of 0.1 are italicized.
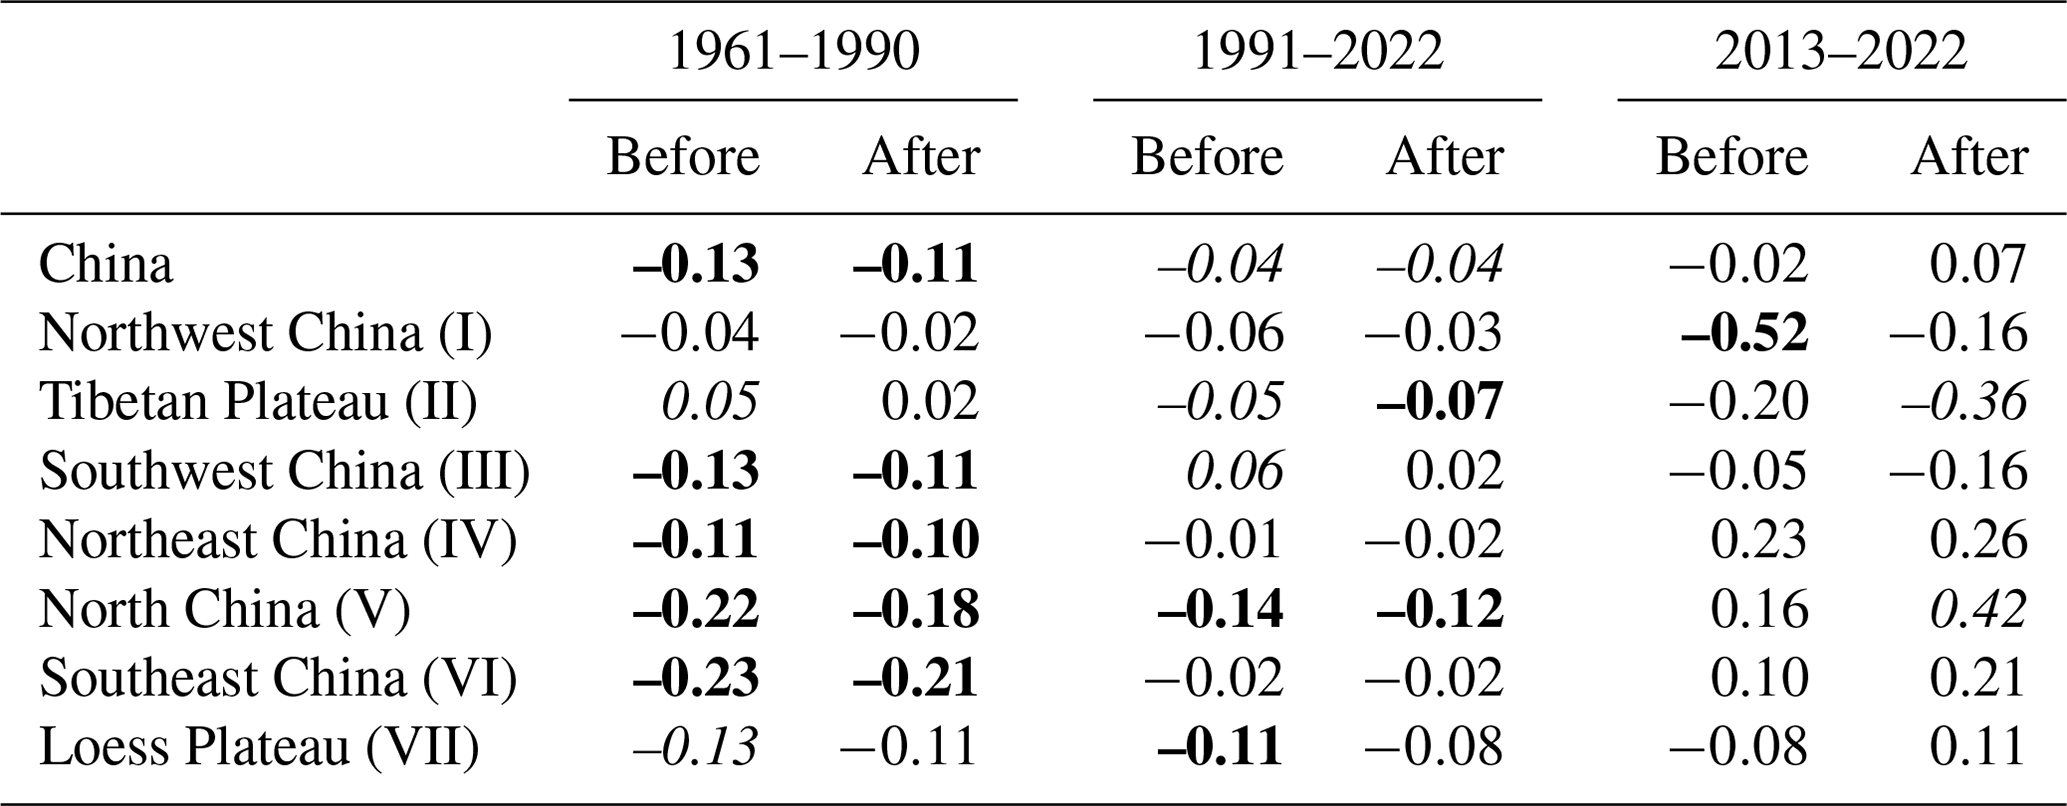
During the period of 1991–2022, only southern regions of China experienced slight brightening, whereas northern regions of China continued dimming (Fig. 10). The national average SSD trend of China remains unchanged before and after homogenization, with a decline of about −0.04 h d−1 per decade (p<0.10) (Table 1). However, the magnitudes of decadal trends change significantly across various regions. In heavily polluted regions such as North China and the Loess Plateau, the degree of dimming diminishes in homogenized SSD. Specifically, the SSD trend decreases from −0.14 h d−1 per decade (p<0.05) to −0.12 h d−1 per decade (p<0.05) in North China and from −0.11 h d−1 per decade (p<0.05) to −0.08 h d−1 per decade (p>0.10) in the Loess Plateau (Figs. 9–10 and Table 1). In addition, for the Tibetan Plateau and Northeast China, the SSD after homogenization presents a more pronounced decline compared to the raw data (Figs. 9–10 and Table 1).
In 2013, China issued and implemented the Air Pollution Prevention and Control Action Plan (APPCAP) to address severe air pollution and its associated health risks. The subsequent strengthening of air quality measures may have contributed to a reversal of SSD trends thereafter. During the period of 2013–2022, the national average SSD in China shifts from a decrease of −0.02 h d−1 per decade to an increase of 0.07 h d−1 per decade after homogenization, reflecting the effect of the APPCAP implementation on the SSD trend reversal compared to earlier periods well (Figs. 9–10 and Table 1). Especially for heavily polluted regions like North China, Southeast China, the Loess Plateau, and Northeast China, the homogenized SSD shows more brightening after homogenization, with the most notable increase in North China, where the trend increases from 0.16 (p>0.10) to 0.42 (p<0.10) h d−1 per decade (Figs. 9–10 and Table 1). Due to the instrument replacement in 2019, the artificial breakpoints in the SSD series have been removed, and the homogenized SSD series appear to be more continuous to the naked eye (Fig. 9b–e). Specifically, the homogenized SSD has a weakened trend (−0.16 h d−1 per decade, p>0.10) compared to the raw data (−0.52 h d−1 per decade, p<0.05) in Northwest China. The homogenized SSD declines at −0.36 h d−1 per decade (p<0.10) and −0.16 h d−1 per decade (p>0.10) in the Tibetan Plateau and Southwest China, respectively (Fig. 9b–d). In summary, considering the uncertainties brought about by series inhomogeneities caused by non-climatic factors such as instrument replacements and station relocations, addressing these inhomogeneities is so necessary, particularly in studies focused on detecting and attributing global dimming and brightening.
3.3 Relationships of clouds and aerosols with sunshine duration
Clouds and aerosols affect the amount of solar radiation reaching the Earth's surface through sunlight reflection, absorption, and scattering, making their combined effects on solar radiation a key factor in understanding global dimming and brightening (Wild, 2009, 2012; Feng and Wang, 2021; Ma et al., 2022). SSD serves as a core indicator of solar radiation, which is modulated by both cloud cover and aerosols. Due to the limitations of satellite data, this section focuses on the relationships of cloud cover fraction (CCF) and aerosol optical depth (AOD) in relation to SSD variations solely over the 20-year period starting from 2003.
Figure 11 shows maps of the decadal changes in AOD, CCF, and the homogenized SSD and their time series at the locations collocated with stations in China. For the entire period of 2003–2022, the correlation coefficient of the averaged CCF in China against the raw SSD is −0.53 (p<0.05), and its coefficient against the homogenized SSD reaches −0.71 (p<0.05). On the other hand, in the heavily polluted regions such as North China and Northeast China, the correlation coefficient between AOD and SSD is significantly negative, and the relationships are intensified after homogenization, i.e., from −0.40 (p<0.10) to −0.56 (p<0.05) and from −0.41 (p<0.10) to −0.54 (p<0.10), respectively. These relationship changes indicate a stronger relationship with CCF and AOD in the homogenized SSD dataset.
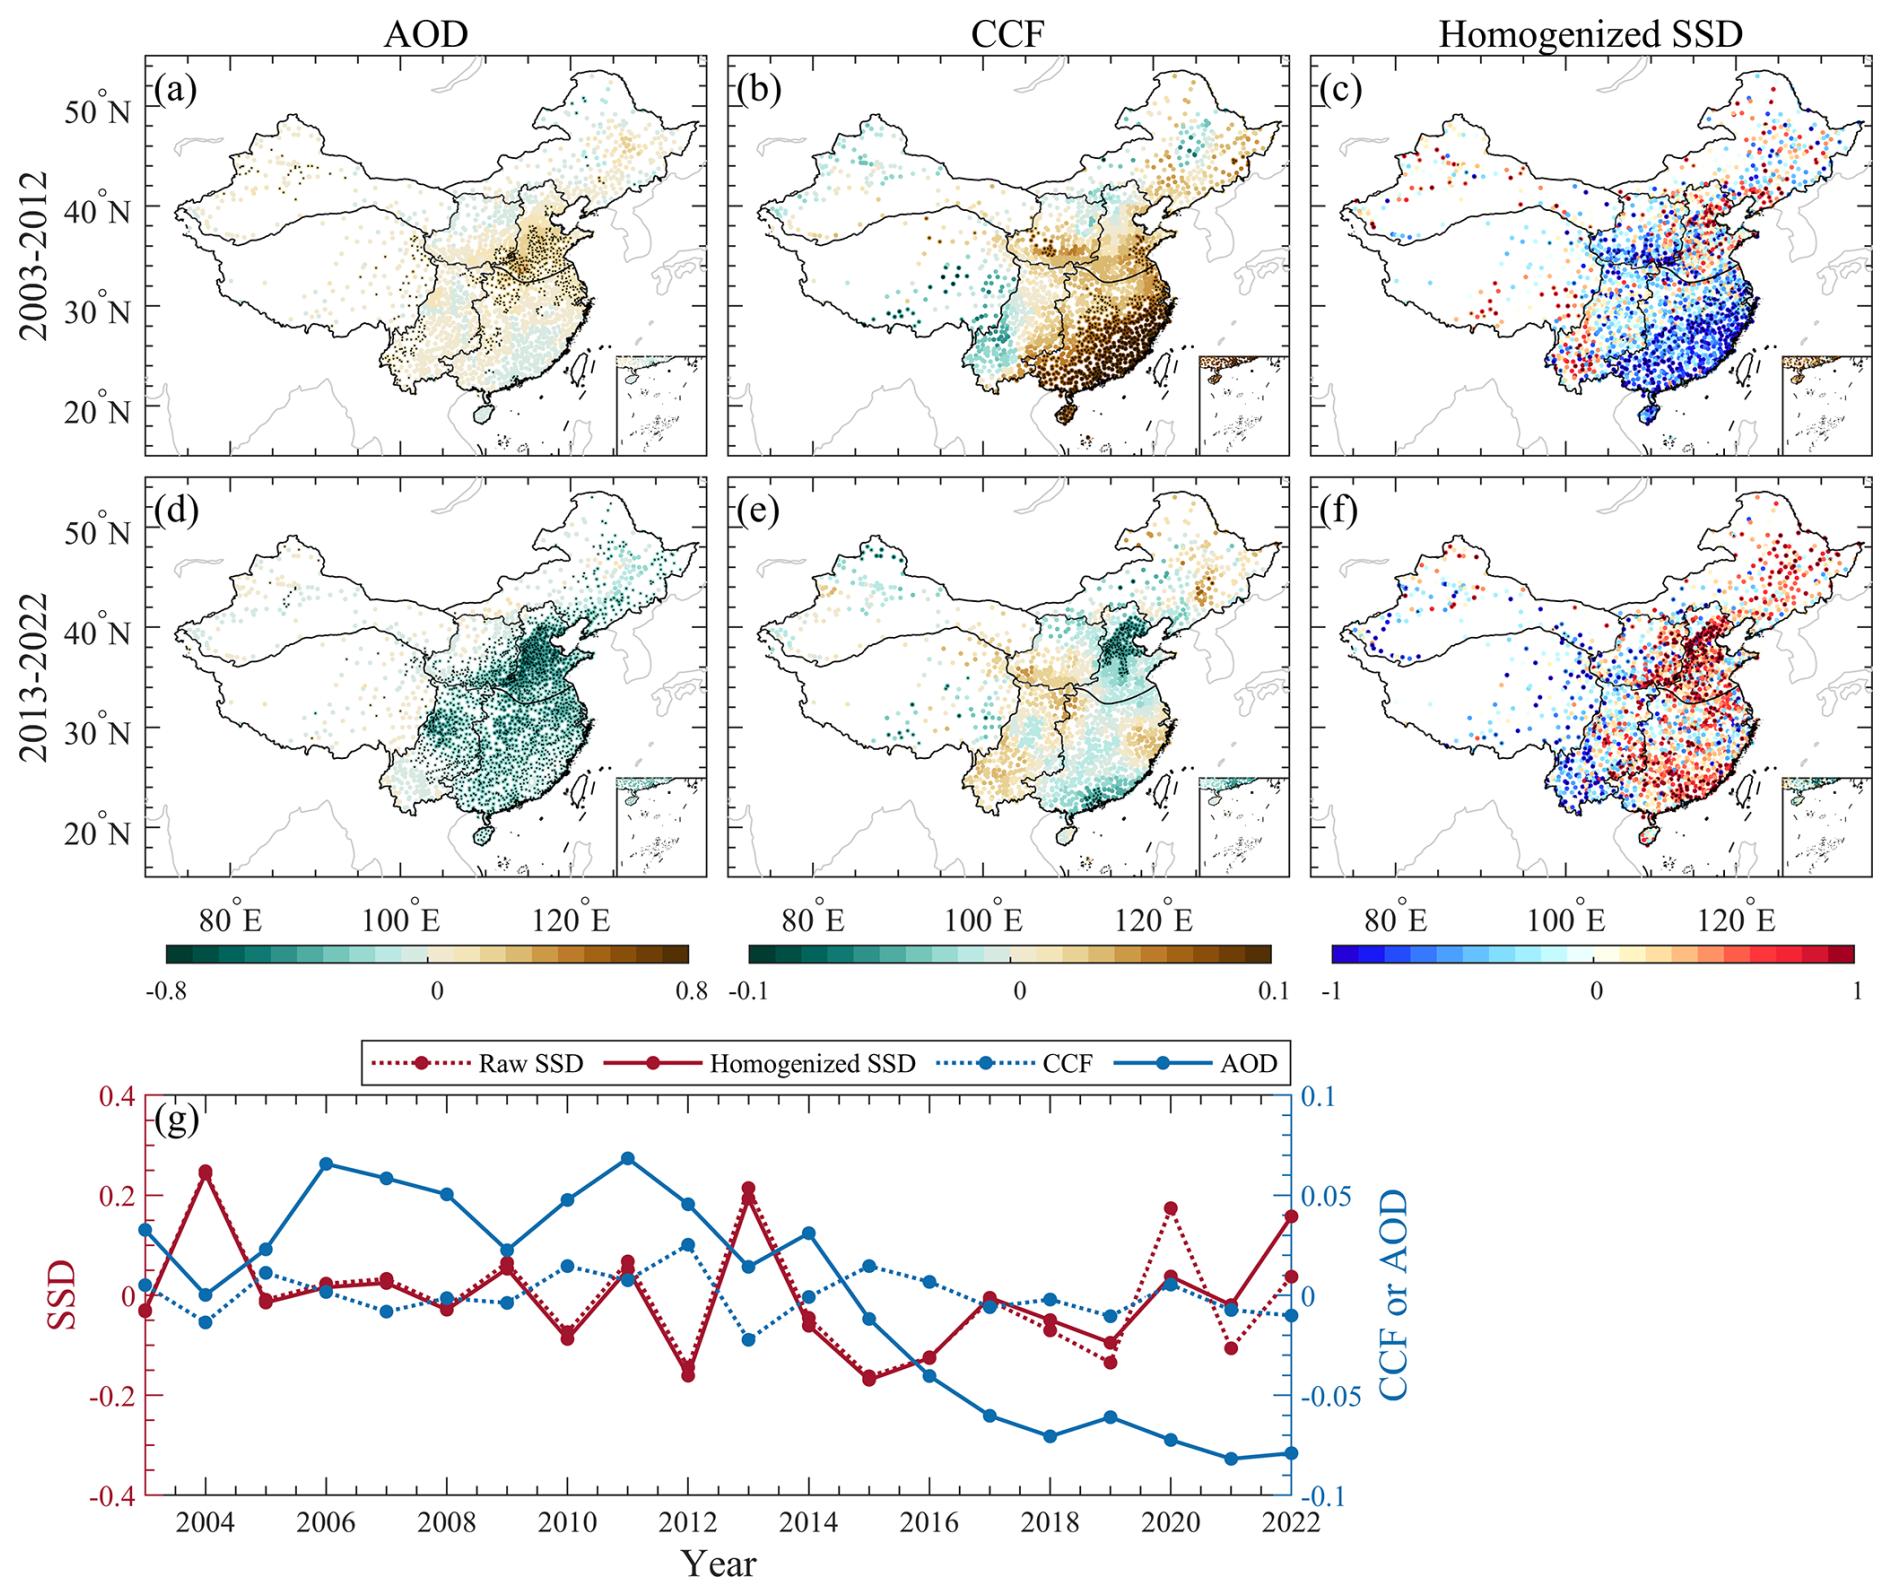
Figure 11(a–c) Maps of the decadal changes in aerosol optical depth (AOD, unit: 1 per decade), cloud cover fraction (CCF; 1 per decade), and homogenized sunshine duration (homogenized SSD; h d−1 per decade) over China from 2003 to 2012. (d–f) Same as (a–c) but from 2013 to 2022. Black dots indicate a significance level of 0.10. (g) Time series of the raw SSD (dotted red line), homogenized SSD (solid red line), CCF (dotted blue line), and AOD (solid blue line) from 2003 to 2022.
During the period of 2003–2012, the average SSD in China decreases at a rate of −0.20 h d−1 per decade (p>0.10), accompanied by slight increases in both CCF and AOD (Fig. 11g). With regard to regional details, the significant increase in AOD in North China (Fig. 11a) and the significant increase in CCF in Southeast China (Fig. 11b) jointly contribute to regional divergences in the SSD decadal changes of China during this period (Fig. 11c).
The effect of the APPCAP implementation on AOD can be clearly seen, with a rapid reduction after 2013 (Fig. 11a, d, and g). CCF also exhibits a corresponding shift from the perspective of the spatial distribution of its decadal changes, especially in North China (Fig. 11b vs. Fig. 11e), which may be due to various cloud–aerosol interactions. These changes in AOD and CCF contribute to the SSD brightening after 2013, which is reflected in the maps and time series of their decadal changes (Fig. 11). During the period of 2013–2022, the spatially coherent pattern in AOD decadal reductions (−0.12 1 per decade, p<0.05) inevitably lead to an overall SSD brightening, on the basis of which the spatial detail of the CCF decadal changes further inversely shapes the pattern of SSD decadal changes (Fig. 11d–f). This results in a decadal change of 0.07 h d−1 per decade (p>0.10) in the national average SSD (Fig. 11g). In heavily polluted regions such as North China, it is clear that decreases in both AOD and CCF jointly result in the enhanced brightening of the localized SSD (Fig. 11d–f).
The homogenized, at 2.0×2.0 spatial resolution dataset of daily sunshine duration in China for the period from 1961 to 2022 generated in this study provides a valuable database for assessing and attributing solar radiation variations. It will also be key for various applications in the solar energy industry, agricultural management, and ecology and climatology research. The homogenized dataset is freely accessed via the following link: https://doi.org/10.11888/Atmos.tpdc.301478 (He et al., 2024).
Inhomogeneities in climate series, stemming from non-climatic factors such as instrument replacements and station relocations, inevitably affect the estimation of long-term trends. While dark-tube sunshine recorders robustly measured SSD in China prior to 2019, the widespread transition to photoelectric digital sunshine recorders in 2019 introduced significant non-climate discontinuities in SSD. After compiling raw SSD observational data, we first noted a sudden reduction in the frequency of zero SSD in segments from 2019 onward, attributable to improved measurement precision (from 0.1 h to 1 min) following the instrument update in 2019. This known day0-type discontinuity affected a total of 378 stations (∼17 % of stations in China), occurring almost in one segment per station, predominantly located in northern regions of China, the Tibetan Plateau, and parts of Southwest China. We applied the quantile-matching algorithm to correct the segments with the day0-type discontinuities, using the longest segment unaffected by the discontinuity, which produced the SSD0 series that has comparable frequencies of zero SSD before and after 2019.
To further address the remaining discontinuities, we developed a homogenization procedure for producing a 62-year (1961–2022) homogenized daily SSD dataset in China. First, a well-established ERA5 SSD was constructed as a reliable reference series with the help of MERRA-2 SSD to eliminate the background weather and climate variations (i.e., noise) for enhancing the signal-to-noise ratio of artificial discontinuities. Second, two separate steps were taken to statistically detect discontinuities in the variance and mean of the non-zero daily SSD0 series. Results show that breakpoints in the variance are mainly concentrated in the northern part of China, while the breakpoints in the mean are evenly distributed across China. After merging the two types of breakpoints mentioned above, a total of 1363 stations experienced breakpoints, accounting for ∼60 % of the stations in China. The peak in the number of breakpoints occurs in 2019, coinciding with the nationwide transition from manual to automated SSD recorders. In all, ∼65 % of the detected breakpoints were confirmed to be associated with station relocations and associated instrument replacements. Finally, the merged breakpoints were removed by the quantile-matching algorithm to produce the final homogenized daily dataset.
Compared to the raw SSD, the homogenized SSD shows more continuous variations across various timescales, providing a solid basis for estimating reliable long-term trends for various periods. During the dimming (1961 to 1990), the homogenized SSD presents weakened dimming across China compared to the raw SSD and shows a trend shift in the Tibetan Plateau from significantly positive to non-significant positive with a reduction of 60 %, suggesting that the homogenized SSD tends to better describe the dimming phenomenon. Xia (2010) reported a homogenized SSD trend in China during this period that is consistent with our result but did not address the day0-type discontinuity issue and only limited the analysis to 2005. The future use of the homogenized SSD in solar radiation estimation could better correct the largest spurious dimming trend in China during this period, as revealed by low-quality ground-based observations of solar radiation (Wild, 2012; He et al., 2018; Tang et al., 2023). During the period of 1991–2022, only southern regions of China experienced slight brightening, whereas northern regions continued dimming. In heavily polluted regions such as North China and the Loess Plateau, the extent of dimming is diminished in the homogenized SSD. The subsequent strengthening of air quality measures after issuing the APPCAP in 2013 in China may have contributed to a reversal of SSD trends thereafter. During the period of 2013–2022, the national average SSD in China shifts from a decrease of −0.02 h d−1 per decade to an increase of 0.07 h d−1 per decade after homogenization, reflecting the effect of the APPCAP implementation on the SSD trend reversal compared to earlier periods well. Especially in heavily polluted regions, the homogenized SSD shows more brightening after homogenization, with the most notable increase being observed in North China.
We further examined the regulatory effects of clouds and aerosols on SSD changes using the satellite data from 2003 to 2022. Our analysis reveals that the relationships of CCF and AOD with SSD are intensified in the homogenized dataset. During the period of 2003–2012, the average SSD in China decreases at a rate of −0.20 h d−1 per decade (p>0.10), accompanied by slight increases in both CCF and AOD. The effect of the APPCAP implementation on AOD is evident, with a rapid reduction in AOD after 2013. In the subsequent period from 2013 to 2022, the spatially coherent pattern of AOD decadal reductions results in an overall SSD brightening on the basis of which the spatial detail of CCF decadal changes further inversely shapes the pattern of SSD decadal changes. This leads to a national average SSD change of 0.07 h d−1 per decade (p>0.10). These regulatory effects of clouds and aerosols on SSD obtained using only 20 years of satellite CCF and AOD data were also confirmed by prior studies relating to Rs. For instance, earlier studies have demonstrated that clouds were only able to explain Rs changes in the southern part of China before 1990 but accounted for changes across the entirety of China after 1990 (Yang et al., 2013; He and Wang, 2020). Wang et al. (2012) suggested that seasonal and interannual variations in Rs are predominantly affected by clouds, while decadal variations are mainly affected by aerosols. It would be valuable to further investigate whether urbanization effects on SSD emerge after the APPCAP implementation in 2013 despite Wang et al. (2017) reporting no such effect before 2013.
Our long-term homogenized daily SSD dataset provides a solid database for various empirical and machine learning models to predict solar radiation (Fan et al., 2019). It not only enables a reliable assessment of global dimming and brightening in China but also provides valuable insights for planning, designing, and evaluating benefits across multiple sectors, including solar energy, agriculture, and environmental management. Moreover, the homogenization experience, including constructing a reference series with the aid of current atmospheric reanalysis, could be adapted to have broader applications in the homogenization of other climate elements or over other regions to develop a global dataset.
YH, KW, and KY designed the research. YH performed the analysis and wrote the draft. CZ advised on the homogenization method. KW and CY collected raw SSD observational data, and YH compiled all the remaining data. All the authors jointly contributed to interpreting the results and editing the final paper.
The contact author has declared that none of the authors has any competing interests.
Regarding the maps used in this paper, please note that Figs. 1, 2, 4, 6, 7, 10, and 11 contain disputed territories.
Publisher's note: Copernicus Publications remains neutral with regard to jurisdictional claims made in the text, published maps, institutional affiliations, or any other geographical representation in this paper. While Copernicus Publications makes every effort to include appropriate place names, the final responsibility lies with the authors.
This study was supported by the National Natural Science Foundation of China (grant no. 42205171), the Starting Grant for Introduced Talents of Sun Yat-sen University (grant no. 37000-12255011), and the Central University Basic Research Business Fee on the Training of Young Teachers (grant no. 37000-31610006). Sunshine duration and other meteorological observations at 2425 stations were obtained from the China Meteorological Administration (CMA, http://data.cma.cn/en, last access: 10 March 2024). ERA5 and MERRA-2 data were downloaded from, respectively, https://www.ecmwf.int/en/forecasts/datasets/reanalysis-datasets/era5 (last access: 10 March 2024) and https://gmao.gsfc.nasa.gov/reanalysis/MERRA-2/ (last access: 10 March 2024). MODIS data were downloaded from https://ladsweb.modaps.eosdis.nasa.gov/archive/allData/62/MCD06COSP_D3_MODIS (last access: 10 March 2024).
This research has been supported by the National Natural Science Foundation of China (grant no. 42205171), the Starting Grant for Introduced Talents of Sun Yat-sen University (grant no. 37000-12255011), and the Central University Basic Research Business Fee on the Training of Young Teachers (grant no. 37000-31610006).
This paper was edited by Qingxiang Li and reviewed by two anonymous referees.
Alexandersson, H.: A homogeneity test applied to precipitation data, J. Climatol., 6, 661–675, 1986.
Baumgartner, D., Pötzi, W., Freislich, H., Strutzmann, H., Veronig, A., Foelsche, U., and Rieder, H.: A comparison of long-term parallel measurements of sunshine duration obtained with a Campbell-Stokes sunshine recorder and two automated sunshine sensors, Theor. Appl. Climatol., 133, 263–275, 2018.
Che, H. Z., Shi, G. Y., Zhang, X. Y., Arimoto, R., Zhao, J. Q., Xu, L., Wang, B., and Chen, Z. H.: Analysis of 40 years of solar radiation data from China, 1961–2000, Geophys. Res. Lett., 32, L06803, https://doi.org/10.1029/2004gl022322, 2005.
Chu, P.-S. and Zhao, X.: Bayesian change-point analysis of tropical cyclone activity: The central North Pacific case, J. Climate, 17, 4893–4901, 2004.
Dai, A. G., Wang, J. H., Thorne, P. W., Parker, D. E., Haimberger, L., and Wang, X. L. L.: A New Approach to Homogenize Daily Radiosonde Humidity Data, J. Climate, 24, 965–991, https://doi.org/10.1175/2010JCLI3816.1, 2011.
Dai, H., Huang, S., Wang, Y., and Lai, L.: Analysis and evaluation based on parallel observation data of artificial and automatic sunshine observation in Jiangxi province, Jiangxi Sci., 40, 370–373, 2022.
Domonkos, P.: Efficiency evaluation for detecting inhomogeneities by objective homogenisation methods, Theor. Appl. Climatol., 105, 455–467, 2011.
Fan, J., Wu, L., Zhang, F., Cai, H., Zeng, W., Wang, X., and Zou, H.: Empirical and machine learning models for predicting daily global solar radiation from sunshine duration: A review and case study in China, Renew. Sustain. Energ. Rev., 100, 186–212, 2019.
Feng, F. and Wang, K. C.: Merging ground-based sunshine duration observations with satellite cloud and aerosol retrievals to produce high-resolution long-term surface solar radiation over China, Earth Syst. Sci. Data, 13, 907–922, https://doi.org/10.5194/essd-13-907-2021, 2021.
He, Y. and Wang, K.: Variability in direct and diffuse solar radiation across China from 1958 to 2017, Geophys. Res. Lett., 47, e2019GL084570, https://doi.org/10.1029/2019gl084570, 2020.
He, Y., Wang, K. C., Zhou, C. L., and Wild, M.: A revisit of global dimming and brightening based on the sunshine duration, Geophys. Res. Lett., 45, 4281–4289, https://doi.org/10.1029/2018gl077424, 2018.
He, Y., Wang, K., and Feng, F.: Improvement of ERA5 over ERA-Interim in simulating surface incident solar radiation throughout China, J. Climate, 34, 3853–3867, 2021.
He, Y., Wang, K., Yang, K., Zhou, C., Shao, C., and Yin, C.: Homogenized daily sunshine duration at 2°×2° over China from 1961 to 2022 (v1.0), Github [data set], https://doi.org/10.11888/Atmos.tpdc.301478, 2024 (data available at: https://yanyihe-rad.github.io/files/homog-daily-ssd-China-v1.0.mat, last access: 9 April 2025).
Hu, S., Mo, Y., Ding, L., and Wang, Z.: Comparative analysis on the performance of digital sunshine recorder based on photoelectric principle, Meteorological, Hydrolog. Mar. Instrum., 4, 23–28, 2019.
Lang, G., An, C., and Yuan, Q.: Comparison and analysis of sunshine duration between DFC1 photoelectric digital sunshine recorder and dark-tube sunshine recorder, Mid-low Lat. Mount. Meteorol., 45, 100–103, 2021.
Li, Z., Yang, X., and Tang, H.: Evaluation of the hourly ERA5 radiation product and its relationship with aerosols over China, Atmos. Res., 294, 106941, https://doi.org/10.1016/j.atmosres.2023.106941, 2023.
Lu, Z., Yu, S., and Hou, S.: Discussions on measurement uncertainty of sunshine duration by Jordan and Campbell-Stokes sunshine recorders, Heilongjiang Meteorol., 29, 31–32, 2012.
Lu, Z., Zhang, Y., Wang, J., Wang, F., and Zhou, Y.: Comparative analysis of manual and automatic sunlight observation data, Heilongjiang Meteorol., 36, 31–32, 2019.
Lv, W., Chong, W., and Ding, L.: Test and analysis on performance comparison of photoelectric automatic sunshine duration recorder, J. Elect. Meas. Instrum., 29, 928–933, 2015.
Ma, Q., Wang, K. C., He, Y. Y., Su, L. Y., Wu, Q. Z., Liu, H., and Zhang, Y. R.: Homogenized century-long surface incident solar radiation over Japan, Earth Syst. Sci. Data, 14, 463–477, https://doi.org/10.5194/essd-14-463-2022, 2022.
Manara, V., Beltrano, M. C., Brunetti, M., Maugeri, M., Sanchez-Lorenzo, A., Simolo, C., and Sorrenti, S.: Sunshine duration variability and trends in Italy from homogenized instrumental time series (1936–2013), J. Geophys. Res.-Atoms., 120, 3622–3641, https://doi.org/10.1002/2014jd022560, 2015.
Perreault, L., Bernier, J., Bobée, B., and Parent, E.: Bayesian change-point analysis in hydrometeorological time series. Part 1. The normal model revisited, J. Hydrol., 235, 221—41, 2000.
Pincus, R., Platnick, S., Ackerman, S. A., Hemler, R. S., and Patrick Hofmann, R. J.: Reconciling simulated and observed views of clouds: MODIS, ISCCP, and the limits of instrument simulators, J. Climate, 25, 4699–4720, 2012.
Press, W. H., Teukolsky, S. A., Vetterling, W. T., and Flannery, B. P.: Numerical recipes in Fortran 77: the art of scientific computing, Cambridge University Press, Cambridge, https://sharif.ir/~moosavi/Numerical ecipes in Fortran.pdf (last access: 9 April 2025), 1992.
Reeves, J., Chen, J., Wang, X. L., Lund, R., and Lu, Q. Q.: A review and comparison of changepoint detection techniques for climate data, J. Appl. Meteorol. Clim., 46, 900–915, 2007.
Sanchez-Lorenzo, A. and Wild, M.: Decadal variations in estimated surface solar radiation over Switzerland since the late 19th century, Atmos. Chem. Phys., 12, 8635–8644, https://doi.org/10.5194/acp-12-8635-2012, 2012.
Sanchez-Lorenzo, A., Brunetti, M., Calbo, J., and Martin-Vide, J.: Recent spatial and temporal variability and trends of sunshine duration over the Iberian Peninsula from a homogenized data set, J. Geophys. Res.-Atoms., 112, D20115, https://doi.org/10.1029/2007jd008677, 2007.
Shao, C., Yang, K., Tang, W., He, Y., Jiang, Y., Lu, H., Fu, H., and Zheng, J.: Convolutional neural network-based homogenization for constructing a long-term global surface solar radiation dataset, Renew. Sustein. Energ. Rev., 169, 112952, https://doi.org/10.1016/j.rser.2022.112952, 2022.
Solow, A. R.: Testing for climate change: An application of the two-phase regression model, J. Clim. Appl. Meteorol., 26, 1401–1405, 1987.
Stanhill, G. and Cohen, S.: Solar radiation changes in the United States during the twentieth century: Evidence from sunshine duration measurements, J. Climate, 18, 1503–1512, 2003.
Swales, D. J., Pincus, R., and Bodas-Salcedo, A.: The Cloud Feedback Model Intercomparison Project Observational Simulator Package: Version 2, Geosci. Model Dev., 11, 77–81, https://doi.org/10.5194/gmd-11-77-2018, 2018.
Tang, W., He, J., Qi, J., and Yang, K.: A dense station-based, long-term and high-accuracy dataset of daily surface solar radiation in China, Earth Syst. Sci. Data, 15, 4537–4551, https://doi.org/10.5194/essd-15-4537-2023, 2023.
Wang, K., Dickinson, R. E., Wild, M., and Liang, S.: Atmospheric impacts on climatic variability of surface incident solar radiation, Atmos. Chem. Phys., 12, 9581–9592, https://doi.org/10.5194/acp-12-9581-2012, 2012.
Wang, K., Ma, Q., Wang, X., and Wild, M.: Urban impacts on mean and trend of surface incident solar radiation, Geophys. Res. Lett., 41, 4664–4668, https://doi.org/10.1002/2014gl060201, 2014.
Wang, K., Ma, Q., Li, Z., and Wang, J.: Decadal variability of surface incident solar radiation over China: Observations, satellite retrievals, and reanalyses, J. Geophys. Res.-Atmos., 120, 6500–6514, https://doi.org/10.1002/2015jd023420, 2015.
Wang, X. L., Wen, Q. H., and Wu, Y.: Penalized maximal t test for detecting undocumented mean change in climate data series, J. Appl. Meteorol. Clim., 46, 916–931, 2007.
Wang, X. L. L.: Penalized maximal F test for detecting undocumented mean shift without trend change, J. Atmos. Ocean. Tech., 25, 368–384, https://doi.org/10.1175/2007jtecha982.1, 2008a.
Wang, X. L. L.: Accounting for autocorrelation in detecting mean shifts in climate data series using the penalized maximal t or F test, J. Appl. Meteorol. Clim., 47, 2423–2444, https://doi.org/10.1175/2008jamc1741.1, 2008b.
Wang, X. L. L., Chen, H. F., Wu, Y. H., Feng, Y., and Pu, Q. A.: New Techniques for the Detection and Adjustment of Shifts in Daily Precipitation Data Series, J. Appl. Meteorol. Clim., 49, 2416–2436, https://doi.org/10.1175/2010jamc2376.1, 2010.
Wang, Y., Wild, M., Sanchez-Lorenzo, A., and Manara, V.: Urbanization effect on trends in sunshine duration in China, Ann. Geophys., 35, 839–851, https://doi.org/10.5194/angeo-35-839-2017, 2017.
Wang, Y., Zhang, G., Sun, G., Liu, S., and Yang, J.: Research survey and development trend of sunshine recorder, Chinese J. Scient. Instrum., 41, 1–14, 2020.
Wang, Y., Zhang, G., Sun, G., Liu, S., Xu, D., Yang, S., and Wu, L.: A review on sunshine recorders: Evolution of operation principle and construction, Measurement, 186, 110–138, 2021.
Wild, M.: Global dimming and brightening: A review, J. Geophys. Res.-Atmos., 114, D00D16, https://doi.org/10.1029/2008jd011470, 2009.
Wild, M.: Enlightening global dimming and brightening, B. Am. Meteorol. Soc., 93, 27–37, 2012.
Wild, M., Gilgen, H., Roesch, A., Ohmura, A., Long, C. N., Dutton, E. G., Forgan, B., Kallis, A., Russak, V., and Tsvetkov, A.: From dimming to brightening: decadal changes in solar radiation at Earth's surface, Science, 308, 847–850, https://doi.org/10.1126/science.1103215, 2005.
Wild, M., Truessel, B., Ohmura, A., Long, C. N., Koenig-Langlo, G., Dutton, E. G., and Tsvetkov, A.: Global dimming and brightening: an update beyond 2000, J. Geophys. Res.-Atmos., 114, D00D13, https://doi.org/10.1029/2008jd011382, 2009.
WMO: Guide to Meteorological Instruments and Methods of Observation, WMO-No. 8, Secretariat of the WMO, Geneva, https://community.wmo.int/en/activity-areas/imop/wmo-no_8 (last access: 9 April 2025), 2014.
Xia, X.: Spatiotemporal changes in sunshine duration and cloud amount as well as their relationship in China during 1954–2005, J. Geophys. Res.-Atmos., 115, D00K06, https://doi.org/10.1029/2009JD012879, 2010.
Yang, S., Shi, G., Wang, B., Yang, H., and Duan, Y.: Trends in Surface Solar Radiation (SSR) and the Effect of Clouds on SSR during 1961–2009 in China, Chinese J. Atmos. Sci., 37, 963–970, 2013.
Yang, S., Wang, X. L., and Wild, M.: Homogenization and trend analysis of the 1958–2016 in situ surface solar radiation records in China, J. Climate, 31, 4529–4541, https://doi.org/10.1175/jcli-d-17-0891.1, 2018.
Zhao, D., Luo, Y., Gao, G., Zhu, C., and Shen, Y.: Long-Term Changes and Essential Climatic Characteristics of Sunshine Duration over China during 1961–2007, Resour. Sci., 32, 701–711, 2010.
Zhou, C., Wang, K., and Ma, Q.: Evaluation of eight current reanalyses in simulating land surface temperature from 1979 to 2003 in China, J. Climate, 30, 7379–7398, https://doi.org/10.1175/jcli-d-16-0903.1, 2017.
Zhou, C., He, Y., and Wang, K.: On the suitability of current atmospheric reanalyses for regional warming studies over China, Atmos. Chem. Phys., 18, 8113–8136, https://doi.org/10.5194/acp-18-8113-2018, 2018.
Zhou, C., Wang, J., Dai, A., and Thorne, P.: A New Approach to Homogenize Global Subdaily Radiosonde Temperature Data from 1958 to 2018, J. Climate, 34, 1163–1183, https://doi.org/10.1175/jcli-d-20-0352.1, 2021a.
Zhou, C., Azorin-Molina, C., Engström, E., Minola, L., Wern, L., Hellström, S., Lönn, J., and Chen, D.: HomogWS-se: a century-long homogenized dataset of near-surface wind speed observations since 1925 rescued in Sweden, Earth Syst. Sci. Data, 14, 2167–2177, https://doi.org/10.5194/essd-14-2167-2022, 2022.
Zhou, H., Quan, W., Wang, Z., Li, X., Li, Y., and Zhao, H.: Comparison of sunshine duration measurements between a Jordan sunshine recorder and three automatic sensors at Shangdianzi GAW station, J. Meteorol. Res., 35, 716–728, 2021b.