the Creative Commons Attribution 4.0 License.
the Creative Commons Attribution 4.0 License.
Data supporting the North Atlantic Climate System Integrated Study (ACSIS) programme, including atmospheric composition; oceanographic and sea-ice observations (2016–2022); and output from ocean, atmosphere, land, and sea-ice models (1950–2050)
Bablu Sinha
Maria R. Russo
Emily Matthews
Freya A. Squires
N. Luke Abraham
Stephane J.-B. Bauguitte
Thomas J. Bannan
Thomas G. Bell
David Berry
Lucy J. Carpenter
Andrew Coward
Peter Edwards
Daniel Feltham
Dwayne Heard
Jim Hopkins
James Keeble
Elizabeth C. Kent
Brian A. King
Isobel R. Lawrence
James Lee
Claire R. Macintosh
Alex Megann
Bengamin I. Moat
Katie Read
Chris Reed
Malcolm J. Roberts
Reinhard Schiemann
David Schroeder
Timothy J. Smyth
Loren Temple
Navaneeth Thamban
Lisa Whalley
Simon Williams
Huihui Wu
Mingxi Yang
The North Atlantic Climate System Integrated Study (ACSIS) was a large multidisciplinary research programme funded by the UK's Natural Environment Research Council (NERC). ACSIS ran from 2016 to 2022 and brought together around 80 scientists from seven leading UK-based environmental research institutes to deliver major advances in the understanding of North Atlantic climate variability and extremes. Here, we present an overview of the data generated by the ACSIS programme. The datasets described cover the North Atlantic Ocean, the atmosphere above it (including its composition), and Arctic sea ice.
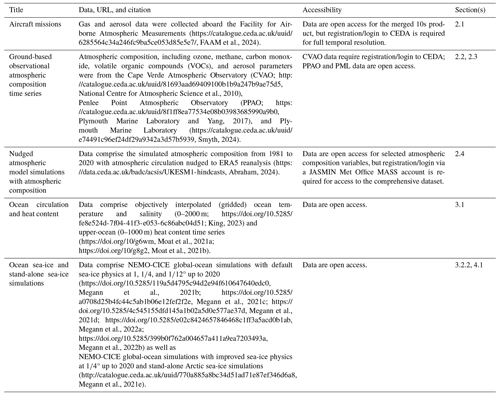
Atmospheric composition datasets include measurements from seven aircraft campaigns (45 flights in total, 0–10 km altitude range) in the northeastern Atlantic (∼ 15–55° N, ∼ 40° W–5° E) made at intervals of 6 months to 2 years between February 2017 and May 2022. The flights measured chemical species (including greenhouse gases; ozone precursors; and volatile organic compounds – VOCs) and aerosols (organic aerosol – OA; SO4; NH4; NO3; and non-sea salt chloride – nss-Cl) (https://doi.org/10.5285/6285564c34a246fc9ba5ce053d85e5e7, FAAM et al., 2024). Ground-based stations at the Cape Verde Atmospheric Observatory (CVAO), Penlee Point Atmospheric Observatory (PPAO), and Plymouth Marine Laboratory (PML) recorded ozone, ozone precursors, halocarbons, greenhouse gases (CO2 and methane), SO2, and photolysis rates (CVAO; http://catalogue.ceda.ac.uk/uuid/81693aad69409100b1b9a247b9ae75d5, National Centre for Atmospheric Science et al., 2010); O3 and CH4 (PPAO, https://catalogue.ceda.ac.uk/uuid/8f1ff8ea77534e08b03983685990a9b0 (Plymouth Marine Laboratory and Yang, 2017); and aerosols (PML, https://doi.org/10.5285/e74491c96ef24df29a9342a3d57b5939, Smyth, 2024), respectively.
Complementary model simulations of atmospheric composition were performed with the UK Earth System Model (UKESM1) for the period from 1982 to 2020 using Coupled Model Intercomparison Project Phase 6 (CMIP6) historical forcing up to 2014 and Shared Socioeconomic Pathways (SSP) scenario SSP3-7.0 from 2015 to 2020. Model temperature and winds were relaxed towards ERA reanalysis. Monthly mean model data for ozone, NO, NO2, CO, methane, stratospheric ozone tracers, and 30 regionally emitted tracers are available for download (https://data.ceda.ac.uk/badc/acsis/UKESM1-hindcasts, Abraham, 2024).
ACSIS also generated new ocean heat content diagnostics (https://doi.org/10/g6wm, https://doi.org/10/g8g2, Moat et al., 2021a–b) and gridded temperature and salinity based on objectively mapped Argo measurements (https://doi.org/10.5285/fe8e524d-7f04-41f3-e053-6c86abc04d51 King, 2023).
An ensemble of atmosphere-forced global-ocean sea-ice simulations using the NEMO-CICE model was performed with horizontal resolutions of and ° covering the period from 1958 to 2020 using several different atmosphere-reanalysis-based surface forcing datasets, supplemented by additional global simulations and stand-alone sea-ice model simulations with advanced sea-ice physics using the CICE model (http://catalogue.ceda.ac.uk/uuid/770a885a8bc34d51ad71e87ef346d6a8, Megann et al., 2021e). Output is stored as monthly averages and includes 3D potential temperature, salinity, zonal velocity, meridional velocity, and vertical velocity; 2D sea-surface height, mixed-layer depth, surface heat, and freshwater fluxes; ice concentration and thickness; and a wide variety of other variables.
In addition to the data presented here, we provide a very brief overview of several other datasets that were generated during ACSIS and have been described previously in the literature.
- Article
(8388 KB) - Full-text XML
- BibTeX
- EndNote
The North Atlantic Climate System Integrated Study (ACSIS) was a 6-year research programme (2016–2022) commissioned by the UK Natural Environment Research Council (NERC) as part of the first wave of a new series of Long-Term Science Multi-centre (LTSM) programmes. ACSIS connected research in the physical and chemical components of the atmosphere–hydrosphere–cryosphere nexus within the North Atlantic region and provided an opportunity for NERC scientists from different disciplines to come together and deliver new insights into a region undergoing rapid change in the ocean and atmosphere temperatures and circulation; sea-ice thickness and extent; and key atmospheric constituents, such as ozone, methane, and aerosols (Sutton et al., 2018). The ACSIS team included members of the National Centre for Atmospheric Science (NCAS), Plymouth Marine Laboratory (PML), the National Oceanography Centre (NOC), the British Antarctic Survey (BAS), the National Centre for Earth Observation (NCEO), the Centre for Polar Observation and Modelling (CPOM), and the Met Office.
ACSIS was designed to answer the following key questions about the North Atlantic climate system:
-
How have changes in natural and anthropogenic emissions and atmospheric circulation combined to shape multiyear trends in the North Atlantic atmospheric composition and radiative forcing?
-
How have natural variability and radiative forcing combined to shape multiyear trends in the North Atlantic physical climate system?
-
To what extent are changes in the North Atlantic climate system predictable on multiyear timescales?
In order to answer these questions, ACSIS was arranged into a series of interlinked work packages involving a broad representation of scientists from the different NERC centres involved in ACSIS. These work packages delivered new scientific understanding, delivered through several key synthesis papers (Sutton et al., 2018; Robson et al., 2018, 2020; Hirschi et al., 2020) as well as a wealth of data. The objectives of ACSIS were as follows:
- a.
to provide the UK science community with sustained observations, data syntheses, leading-edge numerical simulations and analysis tools to facilitate world-class research on changes in the North Atlantic climate system and their impacts;
- b.
to provide a quantitative and multivariate description of how the North Atlantic climate system is changing;
- c.
to determine the primary drivers and processes that are shaping changes in the North Atlantic climate system now and will shape changes in the near future;
- d.
to determine the extent to which future changes in the North Atlantic climate system are predictable.
In this paper we focus on objective (a) of the ACSIS project, which included the creation of new datasets to underpin the ACSIS project and support wider work on the North Atlantic climate system by the UK and international science communities.
In this paper we outline the underpinning datasets generated as part of the ACSIS project, how they can be obtained (guided by the FAIR principles; Wilkinson et al., 2016), and the motivation for their creation.
1.1 Overview of data holdings
A summary of the datasets that are generated by ACSIS and freely available to the community is given in Table 1. Note that the new data presented in this paper are archived across two platforms: the British Oceanographic Data Centre (https://www.bodc.ac.uk, last access: 19 December 2024; ocean observations) and the Centre for Environmental Data Analysis (https://www.ceda.ac.uk, last access: 19 December 2024; all other data). A schematic map giving an overview of the footprints of all of the observational datasets can be found in Fig. 1. The three general areas covered are as follows: atmospheric composition, covering aircraft and ground station data along with nudged historical atmospheric chemistry/circulation model simulations; ocean observations, covering gridded in situ temperature and salinity (0–2000 m) and 0–1000 m heat content; forced historical ocean-ice simulations at eddy-permitting and eddy-resolving resolutions and stand-alone Arctic sea-ice simulations. In Sects. 2, 3, and 4, we describe the individual archived datasets in detail. Several other datasets, previously described in the literature, have been generated by the ACSIS programme including simulations to generate volcanic forcing data for climate models, coupled climate model simulations with a high-resolution atmosphere and/or ocean, gridded sea-surface temperature based on in situ ocean observations, and observation-based estimates of the Atlantic Meridional Overturning Circulation (AMOC) and Arctic-wide sea-ice thickness. We anticipate that all of the different types of data used here could be used in synergy, and users should consider the different uncertainties associated with the different datasets. In particular, modelled ice, ocean, and atmospheric composition are forced by a variety of different atmospheric meteorological data, and this may introduce some further uncertainty into the attribution of trends and variability across the different realms. For completeness (and because the new datasets described here will likely be used in conjunction with existing published datasets), we provide a very brief overview of the latter in Sect. 5.
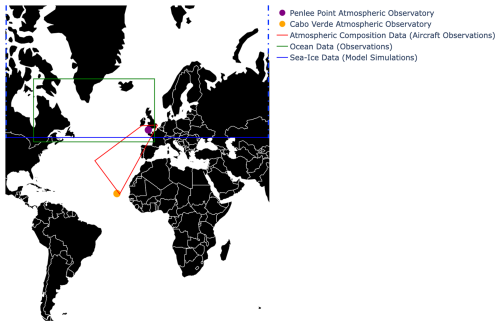
Figure 1Schematic overview of the footprints of all of the observational datasets presented in this paper.
The composition of the atmosphere is changing at an unprecedented pace. Changes in the levels of stratospheric ozone, surface ozone, and other secondary pollutants are driven by human activities (e.g. Griffiths et al., 2021; Keeble et al., 2021; Turnock et al., 2020). The North Atlantic region has undergone significant growth and decline in air pollution over the last 3 decades, and modelling studies have all shown the significant human health benefits of these more recent reductions (Turnock et al., 2016; Archibald et al., 2017; Daskalakis et al., 2016). However, whilst we have a broad understanding of the distribution of key air pollutants and short-lived climate forcers, our understanding of the variability in these species and their trends is hampered across the North Atlantic owing to a paucity of observations. The North Atlantic is frequently impacted by the transport of transboundary pollution from anthropogenic sources and fires (Boylan et al., 2015; Helmig et al., 2015; Kumar et al., 2013) as well as from local natural marine and shipping emissions (e.g. Yang et al., 2016a). High-altitude research stations in the eastern North Atlantic in the Azores (Mount Pico) and Canary Islands (Izaña) and coastal observatories on the west coast of Ireland (Mace Head), and in the Republic of Cabo Verde have provided long-term datasets with which to better understand the sources and processes controlling reactive trace gases and aerosols across the North Atlantic.
In ACSIS, a series of work packages were conducted to (a) further our understanding of the distribution and variability of key trace gases and aerosols using aircraft campaigns and long-term measurements, (b) understand the processes controlling these, and (c) improve model simulations, which can be used to forecast the future evolution of these species. In the following sections, we outline the data that were generated to support these objectives.
2.1 Aircraft campaigns in the North Atlantic
During ACSIS, approximately biannual gas and aerosol composition measurements were made during aircraft missions from the UK to the Azores, focusing on obtaining vertical context for composition, to complement surface observations and provide linkage with satellite data.
Measurements were collected using the UK's Atmospheric Research Aircraft (ARA). The ARA is a BAe 146-301 which has been in service since 2004 and is managed by the Facility for Airborne Atmospheric Measurements (FAAM), an airborne laboratory funded by the UK government. The FAAM aircraft is capable of carrying a 4 t instrument load and can operate at altitudes between 50 and 30 000 ft (15–9140 m), allowing the study of processes in the troposphere and boundary layer. ARA missions as part of ACSIS provide the longest record of composition change in the lower free troposphere over the North Atlantic (Sutton et al., 2018) and further complement historic research flights conducted with the ARA in the region (e.g. Parrington et al., 2012; Reeves et al., 2002) as well as more recent flights by other platforms (e.g. ATom – Wofsy et al., 2018; NAAMES – e.g. Behrenfeld et al., 2019, and Sinclair et al., 2020; and ACE-ENA – Zawadowicz et al., 2021).
2.1.1 Campaign flights
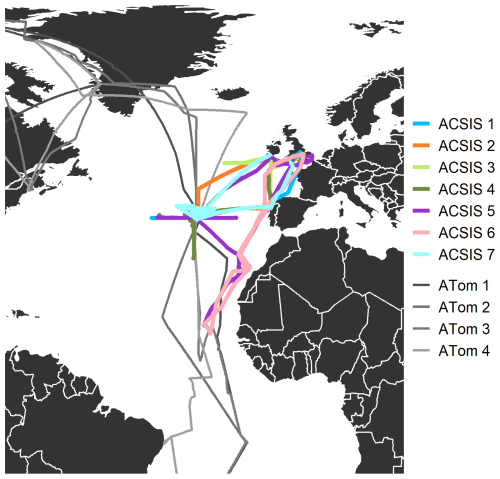
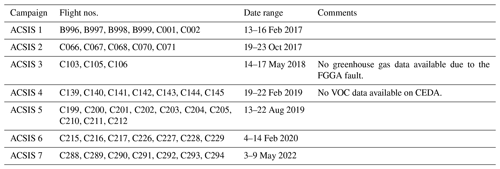
A series of (daytime) research flights were carried out across the North Atlantic Ocean from February 2017 to May 2022. Figure 2 shows the location of the ACSIS flight tracks, colour-coded by the campaign number. There were a total of 45 flights as part of the ACSIS campaign, comprising close to 200 h of measurement data. Measurements were made from approximately 50 m over the sea surface to 9140 m. ACSIS 1, 2, 4, 5, and 7 were predominantly based out of the Azores, whilst flights for ACSIS 3 were based out of Cork, Ireland, and ACSIS 6 flights were based out of Cabo Verde.
Also shown in Fig. 2 are parts of the flight tracks for the NASA Atmospheric Tomography Mission (ATom) mission. The ATom campaigns aimed to improve the representation of reactive gases and short-lived climate forcers in global atmospheric chemistry and climate models by measuring atmospheric composition along a global circuit flight track (Prather et al., 2017). Four ATom campaigns occurred between August 2016 and May 2018. The ATom dataset is complementary to that collected during the ACSIS flight campaigns; ATom flights provided a broad overview at a global scale, whereas ACSIS flights intensively measured the North Atlantic region. ACSIS 1 overlapped with ATom 2 and ACSIS 2 overlapped with ATom 3.
2.1.2 Instrumentation
A wide range of instrumentation is fitted on the ARA, including measurements of key meteorological parameters (such as temperature, humidity, wind speed, and direction) and a range of in situ trace gas measurements (including carbon monoxide, CO; ozone, O3; oxides of nitrogen, NOx= NO+NO2; and the greenhouse gases carbon dioxide, CO2, and methane, CH4). Table 2 summarizes the measurement techniques, uncertainties, and limit of detection (i.e. precision 3σ) aboard the ARA that were used during ACSIS flights.
Table 2A summary of atmospheric chemistry instrumentation used aboard the FAAM BAe 146-301 ARA during the ACSIS flights. NA denotes not available, whereas X denotes available.
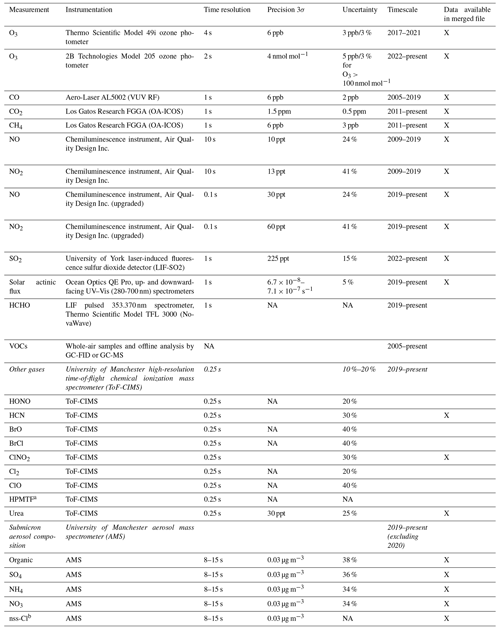
a Hydroperoxymethyl thioformate. b Non-sea salt chloride. Undefined abbreviations used in the table are as follows: VUV RF – vacuum UV resonance fluorescence; FGGA – Fast Greenhouse Gas Analyser; OA-ICOS – off-axis integrated cavity output spectroscopy; ppt – parts per thousand; GC-FID – gas chromatography flame ionization detector; GC-MS – gas chromatography mass spectroscopy.
2.1.3 Vertical distribution of pollutants
Data collected during flights from all seven ACSIS campaigns have been analysed together to give insights into the spatial and vertical characteristics of atmospheric composition over the North Atlantic Ocean. Data from all seven campaigns have been combined and grouped into 1000 m altitude bins. Figure 3 shows the vertical distribution of O3, CO, CO2, CH4, NO, and NO2. Table 3 summarizes the flights and times that were used in this bulk analysis.
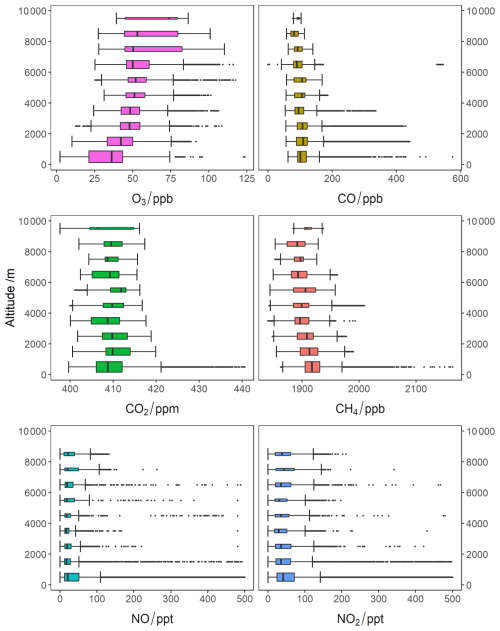
Figure 3Box plots showing the vertical distribution of O3, CO, CO2, CH4, NO, and NO2 for all seven ACSIS campaigns. The vertical line in the centre of each box represents the median value, while the edges of the boxes show the 25th and 75th percentiles. The bars extending from the box show the minimum and maximum values no more than 1.5 times the interquartile range. The height of the box is proportional to the number of observations within each altitude bin, with taller boxes corresponding to a higher number of observations. Note that sporadic high mixing ratios of CO, NO, and NO2 at low altitudes, likely due to local pollution sources, have been filtered so that the bulk of the data is clearly shown. Cutoff values of 600 ppbv for CO and 500 pptv for NO and NO2 were used. The NOx instrument has a ceiling of ∼ 8200 m, so there are no data for the 9000–10 000 m bin.
2.1.4 Data archive
To accompany this paper, a 10 s averaged merged file has been created for each flight listed in Table 3 (https://catalogue.ceda.ac.uk/uuid/6285564c34a246fc9ba5ce053d85e5e7/, Facility for Airborne Atmospheric Measurements et al., 2024). The merged files are open access and designed to be a tool for an initial exploration of the data and to highlight the breadth of the atmospheric composition data collected during the ACSIS programme. However, for further analysis, the original-frequency data should be used; details on where these files can be found is included in the header information of the merged files. The merged files are in ASCII format and consist of a short explanatory paragraph followed by a list of variables and finally the data arranged as columns, with one variable per column, with rows corresponding to the values at each 10 s time interval.
2.2 Cape Verde Atmospheric Observatory (CVAO)
ACSIS supported composition measurements at Cabo Verde from 2016 to 2021 in order to deliver quantitative analyses of composition variability and its relationship to other climate parameters; trend analyses on the long-term surface-based datasets; and understanding of how these link to patterns identified in the aircraft and satellite observations. The Global Atmospheric Watch (GAW) Cape Verde Atmospheric Observatory (https://amof.ac.uk/observatory/cape-verde-atmospheric-observatory-cvao/, last access: 19 December 2024) is situated in Calhau on the island of São Vicente in the Republic of Cabo Verde (16.848° N, 24.871° W; 10 m above sea level). Measurements were started in October 2006 to further our understanding of atmospheric chemistry within the tropical marine boundary layer and North Atlantic region. The site receives air from a wide variety of sources with 10 d back trajectories reaching to North America, Europe, and sub-Saharan Africa (see Carpenter et al., 2010, for details). Long-term high-frequency measurements allow investigation into the trends of climate gases such as CO2 and CH4, whilst measurements of pollutants from the continents (such as hydrocarbons and nitrogen oxides) provide better constraints of global emission changes and their effect on the long-term background of the North Atlantic (e.g. Helmig et al., 2016). The observatory regularly hosts field campaigns that focus on process studies such as sea-surface interactions and the role of aerosols in atmospheric chemistry (Read et al., 2008; McFiggans et al., 2009; Lawler et al., 2011; van Pinxteren et al., 2020).
2.2.1 Time series of meteorological parameters and chemical composition
Table 4 provides a summary of the chemical species recorded at the CVAO, and Fig. 4 shows time series of meteorological parameters and concentrations of chemical species. During ACSIS, these time series were used to estimate trends, particularly in ozone, carbon monoxide, methane, and NOx. Here, we make some general observations concerning the time series of these four species. Ozone concentrations at the CVAO show seasonal variability, with the highest concentrations in spring and the lowest in summer, consistent with ozone's role as a secondary pollutant. In summer, the site occasionally receives air from the Southern Hemisphere during the early stages of the Atlantic cyclonic activity, which leads to very low concentrations of ozone (< 10 ppb) observed along with episodes of intense precipitation. Carbon monoxide is a primary pollutant emitted from anthropogenic sources and from biomass burning. Since 2008, CO has been decreasing at CVAO. Global methane concentrations have increased substantially over the last 10 years, attributed to increased primary emissions of hydrocarbons and increased emissions from wetlands due to increasing temperatures (Jackson et al., 2020; Thompson et al., 2018). At CVAO, methane has been increasing steadily. Concerning NOx, in extremely clean air containing low levels of CO and volatile organic compounds (VOCs), Andersen et al. (2022) showed good agreement between NO2 levels observed at the CVAO and those derived from the photostationary state (PSS), utilizing measured NO, O3, and jNO2 and photochemical box model predictions of peroxy radicals. However, in clean air containing small amounts of aged pollution, as typically encountered in winter, higher levels of NO2 were observed than inferred from the PSS, implying underestimation of peroxy radicals or unattributed NO2 measurement artefacts.
Table 4Summary of atmospheric data recorded at CVAO.
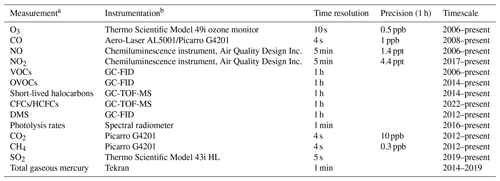
a VOCs – volatile organic compounds; OVOCs – oxygenated volatile organic compounds; CFCs/HCFCs – chlorofluorocarbons/hydrochlorofluorocarbons; DMS – dimethyl sulfide. b GC-FID – gas chromatography flame ionization detector; GC-TOF-MS – gas chromatography time-of-flight mass spectroscopy.
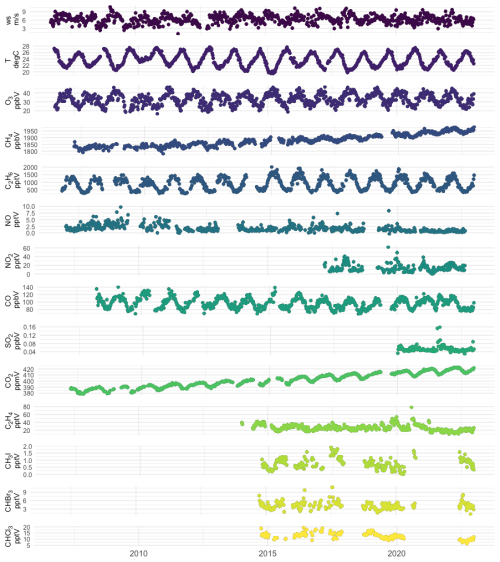
Figure 4Time series of weekly averaged Cabo Verde data showing a range of species and meteorological parameters measured from 7.5 m between 2016 and 2023. From the top, the parameters are as follows: wind speed (ws), temperature (T), ozone (O3), methane (CH4), ethane (C2H6), nitrogen monoxide (NO), nitrogen dioxide (NO2), carbon monoxide (CO), sulfur dioxide (SO2), carbon dioxide (CO2), ethene (C2H2), methyl iodide (CH3I), bromoform (CHBr3), and chloroform (CHCl3).
2.2.2 Data archive
Cabo Verde data collected under the auspices of ACSIS are available from CEDA: http://catalogue.ceda.ac.uk/uuid/81693aad69409100b1b9a247b9ae75d5 (National Centre for Atmospheric Science et al., 2010). Note that there are a number of subdirectories, some of which are not relevant to the data described in this paper. The relevant subdirectories are labelled with the variable or variable group and the time period, e.g. “Cape Verde Atmospheric Observatory: Ozone measurements (2006 onwards)”. The data format is ASCII, consisting of a header explaining the variables listed followed by the data in columnar format (one column per variable), with the data values in rows appearing in chronological order. We note that specific Cabo Verde data are also archived at the World Data Centre for Greenhouse Gases (https://gaw.kishou.go.jp, last access: 19 December 2024; CO2, CH4, and CO) and at EBAS (https://ebas.nilu.no, last access: 19 December 2024; VOCs, NOx, SO2, and halocarbons).
2.3 Penlee Point Atmospheric Observatory
As with CVAO, ACSIS also supported atmospheric composition observations at Penlee Point, UK. Situated on the eastern edge of the North Atlantic, the Penlee Point Atmospheric Observatory (PPAO; 50°19.08′ N, 4°11.35′ W; https://www.westernchannelobservatory.org.uk/penlee/, last access: 19 December 2024) was established by the Plymouth Marine Laboratory (PML) in 2014 on the southwestern coast of the UK. PPAO is a few tens of metres from the water edge and about 11 m above mean sea level. The site is exposed to marine air over a very wide sector (wind directions of ∼ 110–260°). Typical southwesterly winds tend to bring relatively clean background air from the North Atlantic, with little terrestrial influence. Winds from the southeast are often contaminated by exhaust plumes from passing ships, while winds from the north are influenced by terrestrial emissions. We are particularly interested in the North Atlantic air mass at this coastal location, as this represents the background condition for the UK during the typical southwesterly conditions.
In close proximity to the Western Channel Observatory marine sampling stations, high-frequency observations at PPAO enable both long-term monitoring of trends and process-based studies of atmosphere–ocean interactions. Current/recent work has assessed trace gas burdens and air–sea fluxes, including greenhouse gases (Yang et al., 2016b, c, 2019a); volatile organic carbon (Phillips et al., 2021); and sulfur- (Yang et al., 2016c), halogen- (Sommariva et al., 2018), and nitrogen-containing gases (ongoing). Further works include aerosol composition and fluxes, with particular foci on ship emissions (ongoing as a part of the ACRUISE project), sea-spray production (Yang et al., 2019b), macro/micronutrient deposition (White et al., 2021), and reaction between atmospheric ozone and the sea-surface microlayer (Loades et al., 2020).
Continuous observations most relevant to ACSIS include ground-based ozone and methane from PPAO as well as column aerosols from the rooftop of PML (10 km north/northeast of PPAO). These measurements are detailed in Table 5.
2.3.1 Ozone
Due to the short lifetime of O3, it is sensitive to local sources/sinks and heterogeneities associated with a coastal environment. This presents a good opportunity to compare two different methods of identifying the southwest (i.e. Atlantic) wind sector: (1) by air mass dispersion history (NAME – Numerical Atmospheric-dispersion Modelling Environment; see e.g. Yang and Fleming, 2019) and (2) by local wind direction. Data from the first 2 years of observations (May 2014 to April 2016, when NAME model output was available) show that defining the PPAO open-ocean sector either by local wind direction (210 to 260°) or by air mass history (> 80 % in the Atlantic Ocean region over the last 5 d) yields fairly comparable results, with a mean difference of about 1.5 ppb. We conclude that the North Atlantic air mass can reasonably be identified from the local wind direction between 210 and 260°, and we use this definition in Sect. 2.3.2 below.
2.3.2 Methane
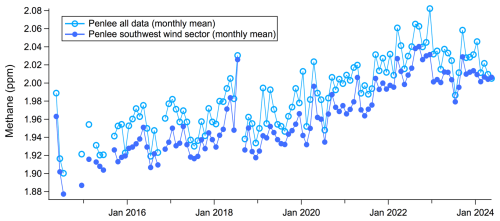
As shown in Fig. 5, the overall mean CH4 mixing ratio is about 0.02–0.03 ppm higher than the mean CH4 from the southwest wind sector (defined as wind direction between 210 and 260° here). This illustrates the importance of considering wind sectors in the interpretation of coastal observations. The long-term trends in the CH4 mixing ratio are similar with or without the wind sector consideration and are in line with observations made globally (e.g. Nisbet et al., 2019). We expect measurements from the southwest wind sector to be more representative of the Atlantic and, thus, background Northern Hemisphere. That the all-direction mean mixing ratio is higher reflects local and regional emissions of methane.
Methane shows a mean seasonal amplitude of ∼ 0.03 ppm (relative difference of ∼ 1.5 %). The summer minimum is most likely due to an increased sink of methane by the OH radical. These data suggest no significant deviation from the long-term trend over the last few years (2019–2022), when it has been postulated that the COVID lockdowns changed the atmospheric oxidizing capacity and, thus, the OH sink (e.g. Monks et al., 2015).
2.3.3 Aerosols from sun photometers
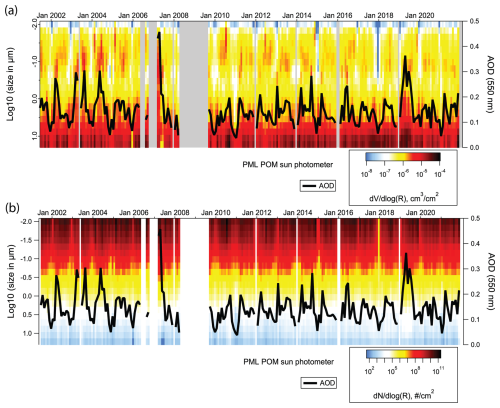
Long-term aerosol measurements (starting from 2001) have been made from the rooftop of PML (50.3661° N, 4.1482° W; about 10 km north-northeast of Penlee Point). The retrieved, cloud-filtered data are averaged to monthly intervals (as shown in Fig. 6a). Overall, there is no obvious long-term trend in the aerosol optical depth (AOD) at this site, in contrast to many other locations in western Europe that tend to show a gradual reduction. This may be because of the predominance of sea-spray aerosols at this location (Yang et al., 2019b).
The inferred size distributions are also shown (Fig. 6b). The volume distribution (ddlog(R)) is dominated by supermicron aerosols, while the number distribution (dN/dlog(R)) is dominated by submicron aerosols. There appears to be a gradual reduction in the springtime aerosol maximum at around 100 nm radius from 2010 to 2021, which could be related to reduced terrestrial or ship anthropogenic emissions (e.g. due to air-quality-related regulations).
2.3.4 Data archive
Penlee Point Atmospheric Observatory data are archived at CEDA: https://catalogue.ceda.ac.uk/uuid/8f1ff8ea77534e08b03983685990a9b0 (Plymouth Marine Laboratory and Yang, 17). Data from the PML sun photometer can be found at https://doi.org/10.5285/e74491c96ef24df29a9342a3d57b5939 (Smyth, 2024). The data format is ASCII, consisting of a header explaining the variables listed followed by the data in columnar format (one column per variable), with the data values in rows appearing in chronological order.
2.4 Atmospheric composition modelling with UK Earth System Model (UKESM1)
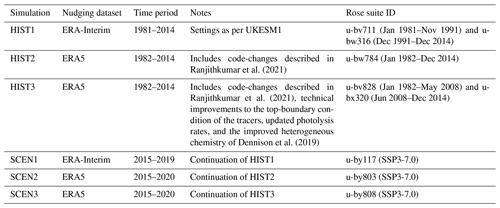
To complement the observational data, ACSIS performed climate model experiments with full atmospheric chemistry included. The experimental design for these simulations was focussed around providing simulations and output that could support observational campaigns and allowed for a detailed analysis of model transport and composition processes. As well as all of the chemical and aerosol fields, fluxes through all chemical reactions and deposition processes were output as monthly means. Model restart files were also saved to allow for rerunning short sections with an increased (and higher-frequency) output request for comparison against flight campaigns. Updates to the experiments were made throughout the project, incorporating bugfixes and model improvements. The simulations performed are listed in Table 6.
Model integrations were performed using a nudged (Telford et al., 2008) configuration of the UKESM1 (Sellar et al., 2019) at Unified Model version 11.5. For nudged-model integrations, the horizontal wind fields and potential temperature are relaxed to either the ERA-Interim (Dee et al., 2011) or ERA5 (Hersbach et al., 2020) datasets using an e-folding relaxation timescale of 6 h. Sea-surface temperatures and sea-ice fields were prescribed from the Reynolds dataset (Reynolds et al., 2002). UKESM simulations were performed using the StratTrop chemical scheme which simulates the Ox, HOx, and NOx chemical cycles and the oxidation of carbon monoxide, ethane, propane, and isoprene in addition to chlorine and bromine chemistry, including heterogeneous processes on polar stratospheric clouds (PSCs) and liquid sulfate aerosols (SAs). The two-moment GLOMAP-mode aerosol scheme from the United Kingdom Chemistry and Aerosols (UKCA) model (Mulcahy et al., 2020) is used to simulate sulfate and secondary organic aerosol (SOA) formation and is driven by prescribed oxidant fields. For further details on the UKESM chemistry and aerosols scheme, the reader is referred to Archibald et al. (2020). Simulations were performed from 1981 to 2014 using CMIP historical forcings (labelled as HIST) and continued until 2019 (ERA-Interim) or 2020 (ERA5) using Shared Socioeconomic Pathways (SSP) scenario SSP3-7.0 forcings (labelled as SCEN), as per the AerChemMIP experiment definition (Collins et al., 2017); see Table 6 for details.
In order to identify the impact of transport on modelled tropospheric ozone in the North Atlantic, two sets of diagnostic tracers were defined.
First, four different stratospheric ozone tracers (O3S) were added. These are constrained in the stratosphere and evolve freely in the troposphere where they follow equivalent loss processes to the prognostic ozone field simulated by the model. The four O3S tracers are described below:
- 1.
Stratospheric concentrations are set to the prognostic ozone field above a model-diagnosed tropopause defined by the 2PV+380K surface.
- 2.
Stratospheric concentrations are fixed at 1 ppmv above a model-diagnosed tropopause defined by the 2PV+380K surface.
- 3.
Stratospheric concentrations are set to the prognostic ozone field above a model-diagnosed tropopause defined by the World Meteorological Organization (WMO) tropopause definition.
- 4.
Stratospheric concentrations are fixed at 1 ppmv above a model-diagnosed tropopause defined by the WMO tropopause definition.
Tracers 1 and 3 are similar to the O3S tracers used in the Chemistry Climate Model Initiative (CCMI) experiments (Abalos et al., 2020) and represent tropospheric ozone originating from the stratosphere, while tracers 2 and 4 (also referred to as constant O3S tracers or O3S-C) give a complementary measure of downward transport from the stratosphere that is not affected by the stratospheric ozone geographical distribution or trends (Russo et al., 2023). An example of a tracer-1 tropospheric column and its seasonal variation is given in Fig. 7a–d.
Second, 30 regionally emitted tracers were included to diagnose long-range transport into the North Atlantic region. These have a lifetime of either 5 or 30 d, and emission regions are sketched in Fig. 7e.
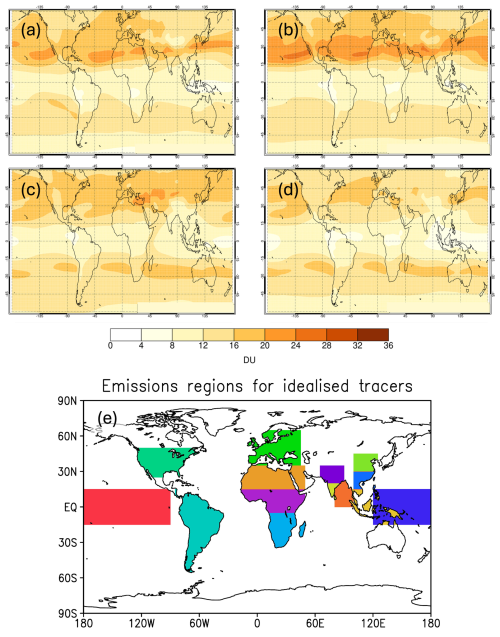
Figure 7Integrated tropospheric column O3S tracer (in Dobson units, DU) defined using prognostic ozone and the 2PV+380K tropopause, averaged over 2005–2017 using HIST1 and SCEN1 simulations (see Table 6 for details) for (a) December–January (DJF), (b) March–May (MAM), (c) June–August (JJA), and (d) September–November (SON). (e) Emission regions for the 5 and 30 d regional tracers.
2.4.1 Data archive
A total of 892 Tb of UKESM1 model data was generated through the ACSIS project. A huge number of model diagnostics were output, including high-temporal-frequency fields (hourly) across the North Atlantic Basin. These are listed here at https://www.ukca.ac.uk/wiki/index.php/ACSIS/u-bv711/STASH (last access: 19 December 2024). Owing to the large nature of the model dataset, selected core chemical species and tracers are available for download as monthly mean files from the CEDA dataset https://data.ceda.ac.uk/badc/acsis/UKESM1-hindcasts (Abraham, 2024). These include ozone and ozone precursors (O3, NO, NO2, CO, and methane) and the idealized tracers used to diagnose transport in the North Atlantic (4 stratospheric tracers and 30 regionally emitted tracers). These data are available for all of the model runs described in Table 6. The data are in Met Office PP format, which can be read using open-access Python libraries (Python cf package) held at https://ncas-cms.github.io/cf-python (last access: 19 December 2024). If desired, users may also apply for a Met Office MASS (offline tape archive) account at the UK JASMIN data facility (https://jasmin.ac.uk, last access: 19 December 2024) and search the Rose suite IDs given in Table 6 for access to data from the specific experiments performed.
The North Atlantic Ocean is a major component of the overall North Atlantic climate system, and one of the key objectives of the ACSIS programme was to document the significant changes in ocean circulation and heat content which have taken place since the middle of the 20th century, to investigate the physical processes responsible, and to identify their external drivers. Another objective was to understand how the ocean might change in the next several decades and to evaluate the potential impacts of these changes on human society and activities. In order to fulfil these objectives, we compiled a substantial number of new data products and new model simulations.
The data products were compiled on the underlying principle of estimating components of the North Atlantic heat budget plus the sea-surface temperature and sea-surface height (dynamic and thermosteric), as these latter two are key to the wider impacts of the ocean on the atmosphere and on coastal sea level. Thus, we brought together a new water-mass-preserving, objectively interpolated ocean temperature and salinity dataset based on the international Argo float array described in Sect. 3.1 (King, 2023) with two basin-scale observational estimates of the horizontal ocean volume and heat transports at 26° N and at ∼ 55° N described in previous publications (RAPID – https://rapid.ac.uk/rapidmoc/, McCarthy et al., 2015, and Moat et al., 2020, 2022; and OSNAP – https://www.ukosnap.org, Lozier et al., 2019) and a new high spatial and temporal resolution Atlantic sea-surface temperature dataset previously described by Williams and Berry (2020). On the modelling side, we undertook new cutting-edge NEMO-forced ocean model simulations with a variety of surface forcing datasets at resolutions of and °, described in Sect. 3.2, complementary to similar coupled ocean–atmosphere integrations performed at both high and low atmospheric resolution (previously published and described as an additional dataset in Sect. 5.2).
3.1 Ocean temperature and salinity and the upper-ocean heat content
In order to understand and quantify decadal climate variability and trends in the North Atlantic region, the NOC has produced new ocean temperature and salinity datasets based on the Argo float array using objectively mapped Argo profiles based on density levels, which preserve ocean water masses (Desbruyères et al., 2017). The dataset covers the period from 2004 to present and extends to depths of up to 2000 m. Two versions are available with spatial resolutions of 2 and 1° respectively. During ACSIS, the main use of this dataset has been to calculate the subtropical and subpolar heat content alongside other available estimates in order to understand the interannual to decadal variability in the North Atlantic heat budget (Fig. 8).
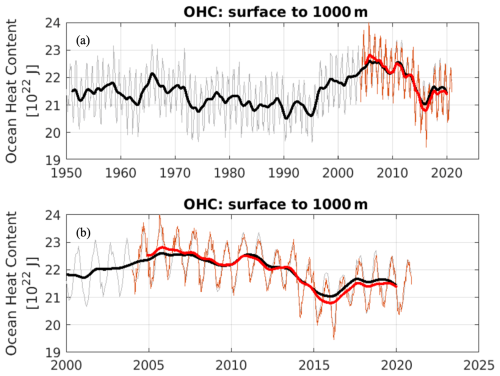
Figure 8Subpolar ocean heat content index (in units of 1022 J) using EN4 (black) and Argo OI (red) for (a) 1950–2020 and (b) during the Argo period (2004–2020). Thick lines have a low-pass filter applied with variability on periods shorter than 1.8 years removed.
Here, we illustrate the subpolar ocean heat content (SOHC), which is an indicator of long-term changes in the heat supply to the North Atlantic region (Fig. 9). Changes in the SOHC are thought to be important precursors of Atlantic Multidecadal Variability (e.g. Sutton et al., 2018) and have been linked to changes in climate extremes – for example, the number of Atlantic hurricanes (Dunstone et al., 2011). The ACSIS SOHC time series are integrated from the region between 45 and 67° N and between 80° W and 0° E. The time series are calculated from gridded EN4.2.2 (Good et al., 2013) and Argo objectively mapped 1° × 1° temperature datasets (King, 2023). The SOHC calculated from the new dataset developed during ACSIS is shown in red (based only on Argo measurements), while another calculation using the standard Met Office EN4 product (based on Argo, hydrographic, and remote-sensing measurements) is shown in black. The two datasets agree well over the overlapping period from 2004 to present, and the differences between the decadally filtered lines give a useful indication of the uncertainty in the heat content estimates due to the method of calculation. This dataset can be used in conjunction with RAPID and OSNAP as well as with the new Williams and Berry (2020) sea-surface temperature (SST) dataset mentioned in the introduction to this section.
3.1.1 Data archive
Objectively mapped temperature and salinity data and are available for download from the British Oceanographic Data Centre (BODC) as self-describing NetCDF (https://doi.org/10.5065/D6H70CW6, NSF Unidata, 2023) files: https://doi.org/10.5285/fe8e524d-7f04-41f3-e053-6c86abc04d51 (King, 2023). BODC also provides upper-ocean heat content time series (in NetCDF format): https://doi.org/10/g6wm nd https://doi.org/10/g8g2 (Moat et al., 2021a–b).
3.2 Forced ocean-ice simulations
Multiple forced ocean-ice simulations were run under ACSIS in order to elucidate the mechanisms of variability seen in the observations (e.g. Fig. 8). A particular emphasis was placed on understanding how uncertainty in surface forcing (meteorological conditions, such as wind stress and air temperature) impacts predictions of climatically important processes such as the AMOC (Sect. 3.2.1). Another focus was on understanding the impact of modelling at higher (eddy-resolving/eddy-rich) horizontal resolution on the simulated ocean variability and trends compared with using a standard (eddy-permitting) resolution (Sect. 3.2.2).
3.2.1 The ° ocean models forced with three different surface meteorological datasets
Three integrations of a global-ocean and sea-ice configuration, consisting of Global Ocean v6 (GO6; Storkey et al., 2018) and Global Sea Ice v8.1 (GSI8.1; Ridley et al., 2018), were carried out to provide a tool for scientific investigation of the mechanisms of variability in the AMOC and other modes of variability in the Atlantic Ocean. GO6 is based on NEMO v3.6 (Madec et al., 2016), whereas GSI8.1 is based on CICE v5.2.1 (Hunke et al., 2013; Ridley et al., 2018) The GO6 ocean configuration was chosen to be the same as that developed under the Joint Marine Modelling Programme (JMMP; https://www.metoffice.gov.uk/research/approach/collaboration/joint-marine-modelling-programme, last access: 19 December 2024) as the ocean component of the UK's submissions under CMIP6, namely GC3.1 (Williams et al., 2017) and UKESM1 (Sellar et al., 2019), and informed choices made in the UK Ocean Model Intercomparison Project (OMIP; Griffies et al., 2016) integrations. Three forcing datasets were used to assess the sensitivity of the models to the choice of forcing data. These were the CORE2 (Large and Yeager, 2009), DFS5.2 (Brodeau et al., 2010), and JRA-55 (Tsujino et al., 2018) datasets, each supplying gridded surface meteorological variables (air temperature, humidity, and surface winds at subdaily intervals), surface radiative fluxes (downwelling shortwave and longwave radiation at daily intervals), and freshwater input (snow and precipitation at monthly intervals).
The simulations were run on a global domain on the eORCA025 ° grid, with 75 vertical levels. The integrations were run from 1958 to 2007 (CORE2), from 1958 to 2015 (DFS5.2), and from 1958 to 2020 (JRA-55), and monthly means are archived. Variables archived include full-depth potential temperature and salinity; horizontal and vertical velocity components; surface fluxes of heat, freshwater, and momentum; mixed-layer depth; and sea-ice cover and thickness. However, many other state and process variables were also archived. Note that sea-ice files from the JRA-forced run are only available for the years 1990–2001 and 2002–2020. These forced ocean-ice simulations use the same configuration as the ocean component of the coupled simulations described in Sect. 5.2.
A comparison of the model drifts in globally averaged temperature and salinity is shown in Fig. 9. The reason for showing model drifts is to alert users to the magnitude and sign of biases present in these model simulations. Biases exist in all model simulations and must be taken into account when using them to understand historical ocean circulation changes. There is a large positive drift in upper-ocean salinity in the DFS5.2-forced simulation (Fig. 9e) and a relatively large freshening in the CORE2 simulation (Fig. 9d). Overall, the JRA-55-forced simulation shows moderate drift in both variables (Fig. 9f). Thus, this ensemble is suitable for understanding the impact of model biases on the representation of historical ocean circulation variability. For example, simulated interannual to multidecadal changes in the Atlantic Ocean circulation are similar between the models despite differences in the mean surface temperature and salinity (Fig. 10). More details on the three simulations, including their AMOC variability, are given by Megann et al. (2021a).
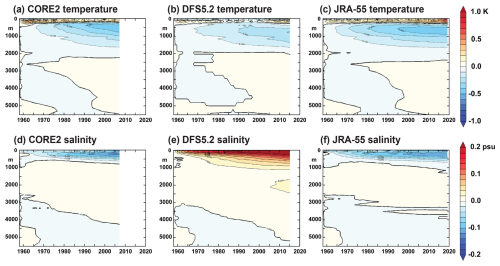
Figure 9Annual drifts in global mean (a–c) temperature (K) and (d–f) salinity (psu – practical salinity units) as a function of depth in simulations forced with the ACSIS ° ocean model. Panels (a) and (d) are from the CORE2-forced simulation, panels (b) and (e) are from the DFS5.2-forced simulation, and panels (c) and (f) are from the JRA-55-forced simulation.
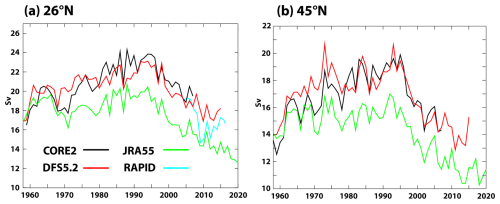
Figure 10AMOC time series (Sv) for 1960–2020 from simulations forced with the ACSIS ° ocean model at (a) 26° N and (b) 45° N. Time series from all three integrations are shown in each panel: CORE2-forced simulation (black); DFS5.2-forced simulation (red); and JRA-55-forced simulation (green). The AMOC derived from observations at 26° N (the RAPID-MOCHA array), available from 2004 onwards, is plotted in cyan in panel (a).
3.2.2 The ° and ° “twin” simulations
Two integrations of the Global Ocean v8p7 (GO8p7) ocean and sea-ice configuration simulation were run under the ACSIS programme. This is based on NEMO v4.0.4 (Madec et al., 2019), including the SI3 sea-ice model, and has been developed under the JMMP (see https://www.metoffice.gov.uk/research/approach/collaboration/joint-marine-modelling-programme, last access: 19 December 2024). The simulations are identical apart from the ocean horizontal resolution: one uses a ° grid, whereas the other uses a ° grid. They are forced with the JRA-55 surface forcing dataset (Tsujino et al., 2018) from 1958 to 2021. The integrations are intended to provide a tool for scientific investigation of the mechanisms of variability in the AMOC and ocean heat content of the Atlantic Ocean at an eddy-rich resolution. The GO8p7 configuration is close to that expected to be incorporated in the GC5.1 coupled climate model and the UKESM2, both aimed at CMIP7. The configuration was implemented at the two resolutions, with the parameter and physics setting as close as possible (there are some necessary changes to lateral friction which are required for numerical stability at a higher resolution), to investigate the sensitivity of the circulation, numerical mixing, and other metrics to the resolution.
As in Sect. 3.2.1, the integrations were carried out on a global domain on eORCA025 ° and eORCA12 ° grids, with 75 vertical levels. The integrations were run from 1958 to 2021, and monthly and annual means of the 3D and 2D model fields were saved (including full-depth potential temperature and salinity; horizontal and vertical velocity components; surface fluxes of heat, freshwater, and momentum; mixed-layer depth; and sea-ice cover and thickness). The 5 d means of a selection of surface fields (including SST, mixed-layer depth, and sea-surface height) are also archived.
To illustrate the simulations, we show time series of some key globally integrated variables from the twin simulations as well as (for context) from the three ° simulations already described in Sect. 3.2.1 (Fig. 11). Global mean temperature drifts are of the order of 0.05 K over the ∼ 50-year integrations (or 0.001 K yr−1). The ° simulation has a smaller drift than its twin ° resolution. The twin simulations show a positive temperature drift, whereas the other simulations show a negative drift. We expect to see an SST warming trend under the influence of anthropogenic warming superimposed on interannual and decadal variability. All of the simulations show strong interannual variability with about the same amplitude and timing, forced by interannual changes in wind stress and buoyancy forcing, and not influenced by global temperature and salinity drifts. On decadal and longer timescales the difference between variability, secular trends, and model drifts can be blurred. The models all show a small reduction in global mean SST from initialization to the late 1970s. The DFS5.2-forced simulation then continues to reduce its SST until the mid-1980s, after which the SST remains more or less stable until about 2010; however, all of the other simulations increase their SST at a fairly steady rate throughout the 1980s, 1990s, and 2000s. From about 2010 onwards, all of the simulations experience strong surface warming. Globally integrated downward net surface heat flux (sum of turbulent and radiative components) is consistent with the global mean surface temperature evolution with a negative net surface flux in the early decades for the three simulations with different surface flux forcing and a positive net flux for the twin simulations. The net heat flux for the twin simulations is generally positive, whereas it only becomes positive around the year 2000 for the other simulations, and this is when the global mean temperature in those simulations starts to rise. The downward heat flux clearly shows the signals of large volcanic eruptions (Agung in 1964, El Chichón in 1982, and Pinatubo in 1991) as well as the 1997 El Niño event (see Balmaseda et al., 2013). The sharp downward dip in 2009 is interesting and possibly linked to the sudden AMOC reduction at that time, but further research is required to investigate this. With the exception of the DFS5.2-forced simulations, global mean salinity and global mean surface salinity show quite small trends consistent with a reasonably balanced surface freshwater flux. The DFS5.2-forced simulation shows strong salinification consistent with a net loss of freshwater through the surface. The twin runs show the best conservation of freshwater. Finally, the net heating/cooling and freshening/salinification of the simulations is reflected in the global mean sea-surface height, which is most stable in the twin simulations.
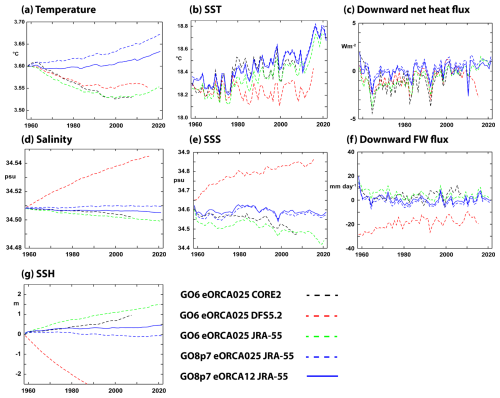
Figure 11Time series of key variables in simulations forced with the ACSIS and ° ocean model. The variables plotted are as follows: (a) global mean temperature; (b) global mean sea-surface temperature; (c) global mean net downward air–sea heat flux; (d) global mean salinity; (e) global mean sea-surface salinity; (f) downward freshwater flux; and (g) global mean sea-surface height. Dashed lines are from the ° model (CORE2-forced simulation – black; DFS5.2-forced simulation – red; JRA-55-forced, ° twin simulation – blue), whilst the solid blue line is from the ° twin simulation. Note that the green and blue lines are all from JRA-55-forced model simulations but with different model code versions and configurations (see text).
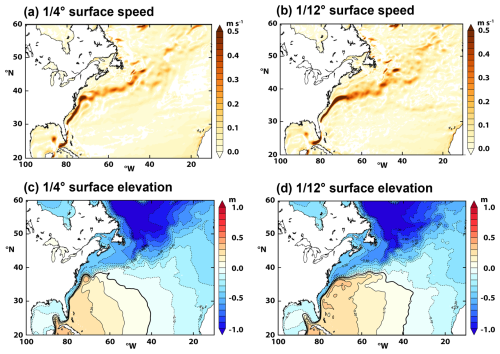
Figure 12Surface North Atlantic circulation from the ACSIS GO8p7 twin simulations averaged over years from 2000 to 2009. Surface speed (in m s−1) for (a) the ° simulation and (b) the ° simulation and sea-surface height (in m) for (c) the 1/4° simulation and (d) the ° simulation. In panels (c) and (d), the global mean surface height has been subtracted to make comparison easier.
A final illustration shows the mean surface circulation in the North Atlantic from the twin simulations (Fig. 12). The most obvious difference in the surface current speed (Fig. 12a, b) is that the Gulf Stream separation is more realistic in the ° simulation, in which the current moves northeastwards off Cape Hatteras (∼ 38° N). This contrasts with the ° simulation, in which the current shifts direction anticlockwise to remain quite close to the coast. The kink in the Gulf Stream Extension at the northwestern corner (40° N, ∼ 50° W) is also more realistic in the ° simulation; moreover, there is a discernible signature of the Azores Current (zonal feature around 34° N), which is extremely faint in the ° simulation. Similar features can be seen in the mean sea-surface height from the two simulations (Fig. 12c, d). One interesting difference is in the penetration of the Labrador Current much further south in the ° simulation – where the low sea-surface heights characteristic of the subpolar gyre penetrate southwest along the North American shelf/slope region north of the Gulf Stream Extension (between 35 and 45° N and between 80 and 50° W). Decadal variability in the position of the Gulf Stream has been shown to be linked to salinity anomalies that are advected southwards by the Labrador Current (New et al., 2021); therefore, these differences between the simulations are likely to impact their simulation of AMOC variability.
3.2.3 Data archive
Data from all of the ocean simulations are archived in NetCDF format, with four separate files for each month of simulation. Variables in NEMO are divided into four types that are discretized on slightly different numerical grids. known as the T grid for tracers (such as temperature and salinity) and the U, V, and W grids for the corresponding components (positive eastward, northward, and upward respectively) of the 3D velocity (Madec et al., 2016, 2019). Each variable has a long name that gives a detailed description of the variable (see Madec et al., 2016, 2019 for an explanation of the data output format). Separate monthly NetCDF files contain sea-ice variables on the CICE grid and Lagrangian iceberg properties and trajectories. The data are archived at CEDA (Megann et al., 2021b, c, d):
-
CORE2-forced run – https://doi.org/10.5285/119a5d4795c94d2e94f610647640edc0 (Megann et al., 2021b);
-
DFS5.2-forced run – https://doi.org/10.5285/a0708d25b4fc44c5ab1b06e12fef2f2e (Megann et al., 2021c);
-
JRA-55-forced run – https://doi.org/10.5285/4c545155dfd145a1b02a5d0e577ae37d (Megann et al., 2021d);
-
° twin simulation – https://doi.org/10.5285/e02c8424657846468c1ff3a5acd0b1ab (Megann et al., 2022a);
-
1/12° twin simulation – https://doi.org/10.5285/399b0f762a004657a411a9ea7203493a (Megann et al., 2022b).
4.1 Advanced sea-ice model simulations
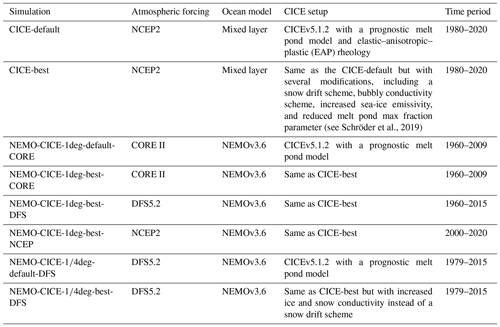
Results from six forced ocean-ice simulations and two stand-alone ice simulations are included to document the impact of sea-ice physics and atmospheric forcing data on the Arctic sea-ice evolution. All of them use the same sea-ice model CICE configuration GSI8.1 (Ridley et al., 2018), and the ocean-ice simulations use the same ocean model NEMO GO6.0 (Storkey et al., 2018) as the forced ocean-ice simulations of Sect. 3.2 and the HadGEM3 climate model of Sect. 5.2. Three different atmospheric forcing datasets are applied: NCEP Reanalysis-2 (NCEP2) data (Kanamitsu et al., 2002, updated 2020), CORE2 surface data (Large and Yeager, 2009), and the DFS5.2 atmospheric forcing dataset (Dussin et al., 2016). Regarding the sea-ice component, we use the default CICE setup as in HadGEM3 (CICE-default) and an advanced setup (CICE-best) in which a new process is added (snow loss due to drifting snow) and some adjustments have been made to model physics and parameters. See Schröder et al. (2019) and Table 7 for details.
The impact of our changes to the sea-ice model on the fidelity of the model sea-ice simulation is shown in Fig. 13. All simulations with the default CICE setup (thin lines) underestimate the mean Arctic sea-ice thickness during winter. Figure 13 shows that the mean Arctic CryoSat-2 sea-ice thickness is more than 50 cm thicker in April than in those simulations (see Sect. 5.3 for the source of our ice thickness estimates). By applying the advanced CICE setup, all simulations (stand-alone, NEMO-CICE 1°, and NEMO-CICE °; thick lines) show realistic mean April sea-ice thickness. The advanced setup also leads to improvements in simulating summer sea-ice extent(not shown) and highlights the importance of sea-ice physics for accurate model simulations for the Arctic.
4.2 Data archive
Data from the global-ocean simulations with advanced sea ice are archived in NetCDF format, as described in Sect. 3.2.3. Stand-alone sea-ice simulations are similar, but output consists of a single NetCDF file containing sea-ice variables on the CICE grid for each month of simulation. The data are accessible via CEDA: http://catalogue.ceda.ac.uk/uuid/770a885a8bc34d51ad71e87ef346d6a8 (see Megann et al., 2021e).
The new datasets described in the previous sections should be viewed in the context of (and potentially used in conjunction with) several other datasets generated in whole or in part by the ACSIS programme and already published and described in the scientific literature. Here, we provide a very brief overview of these other datasets and include links to where they can be accessed. The subsections below correspond to the preceding sections on atmospheric composition (Sect. 5.1, corresponding to Sect. 2), ocean observations and model simulations (Sect. 5.2, corresponding to Sect. 3), and sea-ice model simulations (Sect. 5.3, corresponding to Sect. 4).
5.1 Stratospheric aerosol surface area density from explosive volcanic eruptions
The MajorVolc datasets are model simulations within the high-top N96L85 GA4 UM-UKCA composition–climate model (Walters et al., 2014) of the monthly progression of the volcanic aerosol clouds from the three largest volcanic eruptions of the 20th century – Agung in 1963, El Chichón in 1982, and Pinatubo in 1991. The latter two eruptions fell within the period covered by the UKESM simulations described in Sect. 2.4 and, thus, could be useful in interpreting the aerosol distributions in those simulations. The simulations are based on the Historical Eruption SO2 Emission Assessment (HErSEA) experiment protocol (Timmreck et al., 2018). They apply v8.2 of the GLOMAP-mode aerosol microphysics module (Mann et al., 2010; Dhomse et al., 2014; Mann et al., 2015; Brooke et al., 2017; Dhomse et al., 2020) and improve on the CMIP6 volcanic aerosol dataset (Arfeuille et al., 2014; Luo, 2016). The datasets are described by Dhomse (2020). Dataset identifiers are as follows: https://doi.org/10.17632/n3g2htz9hk.1 (Dhomse, 2020) and https://doi.org/10.5281/zenodo.4739170 (Feng et al., 2021) for Pinatubo; https://doi.org/10.5281/zenodo.4744633 (Dhomse et al., 2021a) for El Chichón; and https://doi.org/10.5281/zenodo.4744686 (Dhomse et al., 2021b) for Agung.
5.2 CMIP6 HighResMIP global climate model simulations
All of the model- and observation-based datasets described in Sects. 2–4 may be placed in the context of Phase 6 of the Coupled Model Intercomparison Project (CMIP6) HighResMIP (https://www.highresmip.org/, last access: 19 December 2024) subproject (Haarsma et al., 2016; Roberts et al., 2018, 2019). The UK contribution to this subproject was based on the HadGEM3 global climate model (Hewitt et al., 2011), with a resolution of ∼ 50 km in the atmosphere and ∼ 0.25° in the ocean, and was delivered as part of the EU Horizon 2020 PRIMAVERA project (https://www.primavera-h2020.eu/, last access: 19 December 2024). The NEMO ocean component in these simulations is the same configuration as the forced ocean model simulations described in Sect. 3.2. The HadGEM3 PRIMAVERA simulations most relevant to this paper were atmosphere-only simulations with horizontal resolutions of N256 (∼ 50 km; http://doi.org/10.22033/ESGF/CMIP6.6029, Roberts, 2017a; http://doi.org/10.22033/ESGF/CMIP6.6013, Roberts, 2019a) and N512 (∼ 25 km; http://doi.org/10.22033/ESGF/CMIP6.6024, Roberts, 2017b; http://doi.org/10.22033/ESGF/CMIP6.6008, Roberts, 2019b) and analogous fully coupled simulations with an ocean resolution of ° (http://doi.org/10.22033/ESGF/CMIP6.6040, Roberts, 2018a; http://doi.org/10.22033/ESGF/CMIP6.5984, Roberts, 2019c; http://doi.org/10.22033/ESGF/CMIP6.6041 and http://doi.org/10.22033/ESGF/CMIP6.5985, Schiemann et al. 2019a, b). The simulations were conducted in pairs consisting of a historical simulation from 1950 to 2014 and a future simulation from 2015 to 2050. Two further cutting-edge simulations were performed at even higher resolution in both the ocean and atmosphere, at ° and ∼ 25 km (N512) respectively (https://doi.org/10.22033/ESGF/CMIP6.5881, Roberts, 2018b; https://doi.org/10.22033/ESGF/CMIP6.1822, Coward and Roberts, 2018). The first was a control 1950s climate running from 1950 to 2014, whereas the second was a future simulation (SSP5-8.5) from 2015 to 2050. Roberts et al. (2020) provide an assessment of the simulated AMOC in this and other HighResMIP simulations.
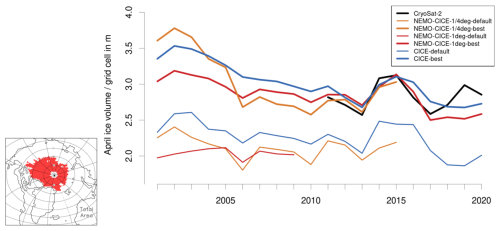
Figure 13Mean April Arctic sea-ice volume per grid cell area over the red region shown in the inset for several model simulations in comparison with CryoSat-2 estimates. CryoSat-2 thickness values are multiplied by the sea-ice concentration from the Special Sensor Microwave/Imager (SSM/I) using the NASA-Team Bootstrap algorithm (Comiso, 2017). The selected region represents the area over which CryoSat-2 data are available for the whole period from 2010 to 2020 (October to April). Table 7 provides more information about the setup of the model simulations.
5.3 Ice observations
Pan-Arctic sea-ice thickness is estimated using satellite data from the European Space Agency (ESA) CryoSat-2 (CS2) mission. Launched in 2010, CryoSat-2's main payload is a Ku-band radar altimeter (SIRAL) that measures the elevation of Earth's surface. Sea-ice freeboard (the portion of an ice floe above the waterline) is measured by differencing the elevation of the sea-ice floe and that of the surrounding ocean. Sea-ice freeboard is then converted to thickness by assuming that sea ice floats in hydrostatic equilibrium in the ocean and by assuming values for snow depth and for snow, ice, and ocean density. CryoSat-2's orbit repeats every ∼ 30 d, providing Arctic-wide sea-ice thickness estimates every month from October to April. The method and dataset are detailed in full in Tilling et al. (2018), and monthly sea-ice thickness data, gridded at 5 km, are available from the CPOM data portal http://www.cpom.ucl.ac.uk/csopr/seaice.php (last access: 19 December 2024).
For the purposes of the ACSIS project, we binned individual CryoSat-2 sea-ice thickness estimates provided by CPOM into the five default ice thickness (h) categories of the CICE sea-ice model on a rectangular 50 km grid: (1) h<0.6 m, (2) 0.6 m m, (3) 1.4 m m, (4) 2.4 m 3.6 m, and (5) h>3.6 m (Schröder et al., 2019). The mean area fraction and mean thickness are then derived for each thickness category. One of the key motivations of binning the CS2 along-track data into sub-grid ice thickness classes is to assess the role of the ice thickness distribution (ITD) in model initialization and to quantify the realism of the CS2 ITD against independent estimates from airborne data. In addition to the bespoke data described above, monthly (October–April 2010–2021) 5 km gridded sea-ice thickness estimates are available (in ASCII and NetCDF formats) on the CPOM data portal: http://www.cpom.ucl.ac.uk/csopr/seaice.php (last access: 19 December 2024).
Code availability is not applicable for this article. However, the programs and scripts used for plotting the figures in this article are stored in a Zenodo repository: https://doi.org/10.5281/zenodo.13972335 (Sinha, 2024). All data have been deposited in reliable data repositories, and access is detailed in Table 1 of this article. The main data sets are as follows:
-
atmospheric composition datasets – https://doi.org/10.5285/6285564c34a246fc9ba5ce053d85e5e7 (FAAM et al., 2024);
-
ground-based station data – http://catalogue.ceda.ac.uk/uuid/81693aad69409100b1b9a247b9ae75d5 (National Centre for Atmospheric Science et al., 2010), https://catalogue.ceda.ac.uk/uuid/8f1ff8ea77534e08b03983685990a9b0 (Plymouth Marine Laboratory and Yang, 2017), and https://doi.org/10.5285/e74491c96ef24df29a9342a3d57b5939 (Smyth, 2024);
-
model simulations of atmospheric composition – https://data.ceda.ac.uk/badc/acsis/UKESM1-hindcasts (Abraham, 2024);
-
ocean heat content diagnostics and gridded temperature and salinity – https://doi.org/10/g6wm, https://doi.org/10/g8g2 (Moat et al., 2021a, b), and https://doi.org/10.5285/fe8e524d-7f04-41f3-e053-6c86abc04d51 (King, 2023);
-
atmosphere-forced global-ocean sea-ice simulations and stand-alone sea-ice model simulations with advanced sea-ice physics – http://catalogue.ceda.ac.uk/uuid/770a885a8bc34d51ad71e87ef346d6a8 (Megann et al., 2021e).
We have described the multidisciplinary model and observational datasets that were produced by the UK ACSIS programme and how and where the data can be accessed. The scope of ACSIS was very broad, covering atmospheric composition, atmospheric circulation, ocean circulation, ice sheets (not covered in this paper), sea ice, and their interactions, and this breadth is reflected in the rich variety of datasets generated. We note that, whilst the focus of the ACSIS programme was the North Atlantic, most of the model products covered the global domain, and many of the observational products have both global and regional significance. Despite its great size and scope, the ACSIS programme had finite resources; thus, it was not able to fully exploit the data it generated. The landmark ACSIS papers cited here can be seen as starting points for further research. Therefore, we believe there is a major opportunity to repurpose our data for new research studies to build on the substantial financial and intellectual investment that ACSIS represents, and we express the hope that the ACSIS datasets provide a lasting legacy to the international environmental science community.
A1 The University of Manchester time-of-flight chemical ionization mass spectrometer
The University of Manchester high-resolution time-of-flight chemical ionization mass spectrometer (UoM ToF-CIMS) is described in detail by Matthews et al. (2023) for aircraft deployment. Briefly, iodide ions cluster with sample gases in the ion–molecule reaction (IMR) region, creating a stable adduct. The flow is then sampled through a critical orifice into the first of the four differentially pumped chambers in the TOF-CIMS, the short-segmented quadrupole (SSQ). Quadrupole ion guides transmit the ions through these stages. The ions are then subsequently pulsed into the drift region of the ToF-CIMS where the arrival time is detected with a pair of microchannel plate detectors with an average mass resolution of 4000 (m/Δm).
The inlet design is an atmospheric-pressure, rearward-facing, short-residence-time inlet, consisting of 3/8 in. diameter polytetrafluoroethylene (PTFE) tubing with a total length to the instrument of 48 cm. A constant flow of 12 slpm (standard litres per minute) is mass-flow-controlled to the IMR region using a rotary vane pump (Picolino VTE-3). A total of 1 slpm is then subsampled into the IMR for measurement.
An Iris system, as described by Lee et al. (2018), was employed to pressurize and mass-flow-control the sample flow into the instrument, avoiding sensitivity changes that would be associated with variations in pressure in flight that are not controlled sufficiently by the constant-flow inlet. This works upon the principle of the manipulation of the size of the critical orifice in response to changes in the IMR pressure. As with the Lee et al. (2018) design, this works by having a stainless-steel plate with a critical orifice and a movable PTFE plate on top of this, also with a critical orifice. These orifices either align fully and allow maximum flow into the instrument or misalign to reduce flow. This movement is controlled by the 24 V DC output of the IMR Pirani pressure gauge in relation to the set point and was designed collaboratively with Aerodyne Research Inc. The IMR set point was 72 ± 3 mbar for the aircraft campaigns, which was set through a combination of pumping capacity on the region (Agilent IDP3), mass-flow-controlled reagent ion flow, and sample flow. The reagent ion flow is 1 slpm of ultrahigh-purity (UHP) nitrogen mixed with 2 sccm (standard cubic centimetres per minute) of a pressurized, known-concentration gas mix of CH3I in nitrogen, passed through the radioactive source (210Po). The total flow through the IMR is measured at the exhaust of the Agilent IDP3 pump, thereby not only monitoring the IMR pressure but also the sample flow. All mass flow controllers and mass flow meters are measured and controlled using the standard Aerodyne Research Inc. EyeOn control unit and software.
A pressure controller is also employed on the SSQ region to make subtle adjustments in this region, independently of any small IMR changes that may occur during flight. This works upon the principle of controlling an electrically actuated solenoid valve in a feedback loop with the SSQ pressure gauge to actively control a leak of air into the SSQ pumping line. The SSQ is pumped using an Ebara PDV 250 pump and held at 1.8 ± 0.01 mbar.
Instrument backgrounds are programmatically run for 6 s every 1 min for the entire flight, by overflowing the inlet with UHP nitrogen at the point of entry into the IMR. Here, a 1/16 in. PTFE line enters through the movable PTFE top plate, ensuring that the flow exceeds that of the sample flow. Inlet backgrounds are also manually run multiple times during campaigns by overflowing as close to the end of the inlet as possible with UHP nitrogen. Data are taken at 4 Hz during a flight and are routinely averaged to 1 Hz for analysis. Of the six points in each background, the first two and the last point are unused, and the mean of the background is calculated using custom Python scripting. Backgrounds are humidity-corrected, and, using linear interpolation, a time series of the instrument background is determined and then subtracted to give the final time series (Matthews, 2023).
A2 The UoM aerosol mass spectrometer
The chemical composition of non-refractory submicron aerosols (organic aerosol – OA; sulfate; nitrate; ammonium; and non-sea-salt chloride – nss-Cl) can be measured by a compact time-of-flight aerosol mass spectrometer (C-ToF-AMS; Aerodyne Research Inc., Billerica, MA, USA) (Drewnick et al., 2005), which provides chemical characterization across a range of ion mass-to-charge () ratios from 10 to 500. The detailed operation of the AMS, including calibration and correction factors, during aircraft deployment has been described previously (Morgan et al., 2009). In brief, aerosols enter the instrument via an aerodynamic lens inlet, focusing the incoming particles into a narrow beam. The aerodynamic lens system of the AMS in this study is tailored to sample submicron aerosols. Particles exit the aerodynamic lens into the particle-sizing chamber, which is evacuated to progressively lower pressures as the particle beam passes through and removes the majority of the gaseous material. Non-refractory components of the particles are then flash-vaporized on a resistively heated porous tungsten surface. The resultant gaseous molecules are ionized by a 70 eV electron beam released from a tungsten filament. These fragment ions are analysed by a time-of-flight mass spectrometer (ToF-MS). The AMS mass spectra were recorded every 8 or 15 s during the ACSIS campaign (ACSIS 1 and ACSIS 3–6). The AMS data were processed using the standard SQUIRREL (SeQUential Igor data RetRiEvaL, v.1.65C) ToF-AMS software package. The AMS data were also calibrated using monodisperse ammonium nitrate and ammonium sulfate particles. A time- and composition-dependent collection efficiency (CE) was applied to the data based on the algorithm by Middlebrook et al. (2012).
A3 The University of York LIF-SO2
The University of York LIF-SO2 instrument is a custom-built system for the highly sensitive detection of SO2 via laser-induced fluorescence and is based on the system originally demonstrated by Rollins et al. (2016). The basic operating principle is the excitation of SO2 at 216.9 nm, generated from the fifth harmonic of a custom-built tuneable fibre-amplified semiconductor diode laser system at 1084.5 nm, and the subsequent detection of the resultant fluorescence photons. The laser wavelength is rapidly (∼ 10 Hz) tuned back and forth between a wavelength which is resonant for SO2 transition and another which is not resonant for SO2, with the difference between these signals being directly proportional to the SO2 concentration within the sample cell. The laser wavelength is tracked using a reference cell containing a known SO2 concentration.
The ACSIS 7 experiment was part of the first field deployment for the York LIF-SO2; thus, it was, in part, a learning experience regarding the operation of the instrument aboard an aircraft. The sample flow rate was maintained at 2 slpm, and the use of a ram inlet allowed both the sample and reference cells to be operated at 400 mbar for the full altitude range of the campaign to maximize instrument sensitivity. Multi-point calibrations were carried out across the expected concentration range approximately every 30 min to ensure that the instrument sensitivity was well characterized. To assess (1) the possible quenching effect of excited SO2 by water vapour or (2) increased wall losses when sampling humid air, calibrations in both stable ambient air and dry zero air were carried out, for which this effect proved negligible. The uncertainty in the LIF-SO2 measurements was calculated predominantly from the uncertainty in the instrument sensitivity (typically 6 %). However, due to inconsistencies in the laser power and laser linewidth, the sensitivity was seen to vary during the course of each flight. Therefore, a mean sensitivity has been applied, and this variation has been conservatively added to the sensitivity uncertainty on a flight-by-flight basis to give an overall uncertainty of ∼ 15 % (using the mean of this variation). The 3σ precision of 225 ppt has also been determined conservatively from stable ambient measurements due to issues with completely overflowing the instrument inlet with zero air during flight.
ATA and BS prepared the original draft of the manuscript with input from TJB, LJC, EM, KR, MRR, FAS, KR, LT, LW, HW, and MY; BS, EM, and MRR edited the original draft; and all authors reviewed the manuscript. SJJB, TJB, EM, CR. FAS, LT, NT, LW, and HW acquired data. ATA, LJC, HC, PE, JL, BS, and MY acquired funding.
The contact author has declared that none of the authors has any competing interests.
Publisher’s note: Copernicus Publications remains neutral with regard to jurisdictional claims made in the text, published maps, institutional affiliations, or any other geographical representation in this paper. While Copernicus Publications makes every effort to include appropriate place names, the final responsibility lies with the authors.
The authors gratefully acknowledge financial support provided by the UK Natural Environment Research Council with respect to the extensive data collection efforts during the ACSIS project. Airborne data were obtained using the BAe 146-301 Atmospheric Research Aircraft flown by Airtask Group and managed by the FAAM Airborne Laboratory, jointly operated by UK Research and Innovation and the University of Leeds. We would like to give special thanks to the Airtask Group pilots and engineers as well as all staff at the FAAM Airborne Laboratory for their hard work in helping plan and execute successful flight campaigns during ACSIS. Peter Edwards and Loren Temple were supported by NERC award nos. NE/T008555/1 and NE/S007458/1 regarding the development and operation of the LIF-SO2. Mingxi Yang, Thomas Bell, and the Penlee Point Atmospheric Observatory measurements were supported by the NERC ACSIS (grant no. NE/N018044/1) and MOYA (grant no. NE/N015932/1) projects. Tim Smyth and the Plymouth sun photometer measurements were supported by the NERC ACRUISE (grant no. NE/S005390/1) project and by the Western Channel Observatory, which is funded by NERC through its National Capability Long-term Single Centre Science Programme, Climate Linked Atlantic Sector Science (grant no. NE/R015953/1). We further thank Frances Hopkins, Jani Pewter, Daniel Phillips, and Simone Louw for instrument maintenance at Penlee Point Atmospheric Observatory. We are also grateful to Luis Neves (Instituto Nacional de Meteorologia e Geofísica, São Vicente – INMG, Mindelo, Cabo Verde) and Shalini Punjabi (WACL) for technical assistance with the CVAO measurements. Model simulations were performed at NCAS, NOC, and CPOM (under ACSIS grant nos. NE/N018001/1 and NE/N018044/1).
This research has been supported by the Natural Environment Research Council (grant nos. NE/N018044/1, NE/N018001/1, NE/R015953/1, NE/S005390/1, NE/N015932/1, NE/N018044/1, NE/S007458/1, and NE/T008555/1).
This paper was edited by Baptiste Vandecrux and reviewed by two anonymous referees.
Abalos, M., Orbe, C., Kinnison, D. E., Plummer, D., Oman, L. D., Jöckel, P., Morgenstern, O., Garcia, R. R., Zeng, G., Stone, K. A., and Dameris, M.: Future trends in stratosphere-to-troposphere transport in CCMI models, Atmos. Chem. Phys., 20, 6883–6901, https://doi.org/10.5194/acp-20-6883-2020, 2020.
Abraham, L.: Data provided by UKESM1 Hindcast simulations for the North Atlantic Climate System Integrated Study (ACSIS), https://data.ceda.ac.uk/badc/acsis/UKESM1-hindcasts (last access: 31 January 2024), 2024.
Andersen, S. T., Nelson, B. S., Read, K. A., Punjabi, S., Neves, L., Rowlinson, M. J., Hopkins, J., Sherwen, T., Whalley, L. K., Lee, J. D., and Carpenter, L. J.: Fundamental oxidation processes in the remote marine atmosphere investigated using the NO–NO2–O3 photostationary state, Atmos. Chem. Phys., 22, 15747–15765, https://doi.org/10.5194/acp-22-15747-2022, 2022.
Archibald, A. T., Folberth, G., Wade, D. C., and Scott, D.: A world avoided: impacts of changes in anthropogenic emissions on the burden and effects of air pollutants in Europe and North America, Faraday Discuss., 200, 475–500, 2017.
Archibald, A. T., O'Connor, F. M., Abraham, N. L., Archer-Nicholls, S., Chipperfield, M. P., Dalvi, M., Folberth, G. A., Dennison, F., Dhomse, S. S., Griffiths, P. T., Hardacre, C., Hewitt, A. J., Hill, R. S., Johnson, C. E., Keeble, J., Köhler, M. O., Morgenstern, O., Mulcahy, J. P., Ordóñez, C., Pope, R. J., Rumbold, S. T., Russo, M. R., Savage, N. H., Sellar, A., Stringer, M., Turnock, S. T., Wild, O., and Zeng, G.: Description and evaluation of the UKCA stratosphere–troposphere chemistry scheme (StratTrop vn 1.0) implemented in UKESM1, Geosci. Model Dev., 13, 1223–1266, https://doi.org/10.5194/gmd-13-1223-2020, 2020.
Arfeuille, F., Weisenstein, D., Mack, H., Rozanov, E., Peter, T., and Brönnimann, S.: Volcanic forcing for climate modeling: a new microphysics-based data set covering years 1600–present, Clim. Past, 10, 359–375, https://doi.org/10.5194/cp-10-359-2014, 2014.
Balmaseda, M. A., Trenberth, K. E., and Källén, E.: Distinctive climate signals in reanalysis of global ocean heat content, Geophysical Res. Lett., 40, 1754–1759, https://doi.org/10.1002/grl.50382, 2013.
Behrenfeld, M. J., Moore, R. H., Hostetler, C. A., Graff, J., Gaube, P., Russell, L. M., Chen, G., Doney, S. C., Giovannoni, S., Liu, H., Proctor, C., Bolaños, L. M., Baetge, N., Davie-Martin, C., Westberry, T. K., Bates, T. S., Bell, T. G., Bidle, K. D., Boss, E. S., Brooks, S. D., Cairns, B., Carlson, C., Halsey, K., Harvey, E. L., Hu, C., Karp-Boss, L., Kleb, M., Menden-Deuer, S., Morison, F., Quinn, P. K., Scarino, A. J., Anderson, B., Chowdhary, J., Crosbie, E., Ferrare, R., Hair, J. W., Hu, Y., Janz, S., Redemann, J., Saltzman, E., Shook, M., Siegel, D. A., Wisthaler, A., Martin, M. Y., and Ziemba, L.: The North Atlantic Aerosol and Marine Ecosystem Study (NAAMES): Science Motive and Mission Overview, Front, Mar. Sci., 6, 122, https://doi.org/10.3389/fmars.2019.00122, 2019.
Boylan, P., Helmig, D., Oltmans, S., and Miller, L. A.: Ozone in the Atlantic Ocean marine boundary layer, Elementa, 3, 000045, https://doi.org/10.12952/journal.elementa.000045, 2015.
Brodeau, L. Barnier, B., Treguier, A.-M., Penduff, T., and Gulev, S.: An ERA40-based atmospheric forcing for global ocean circulation models, Ocean Model., 31, 88–104, 2010.
Brooke, J. S. A., Feng, W., Carrillo-Sánchez, J. D., Mann, G. W., James, A. D., Bardeen, C. G., Marshall, L., Dhomse, S. S., and Plane, J. M. C.: Meteoric smoke deposition in the polar regions: A comparison of measurements with global atmospheric models, J. Geophys. Res., 122, 11112–11130, 2017.
Carpenter, L., Fleming, Z., Read, K., Lee, J., Moller, S., Hopkins, J., Purvis, R., Lewis, A., Mueller, K., Heinold, B., Herrmann, H., Fomba, K., Pinxteren, D., Müller, C., Tegen, I., Wiedensohler, A., Müller, T. , Niedermeier, N., Achterberg, E., Patey, M. D., Kozlova, E. A., Heimann, M., Heard, D. E., Plane, J. M. C., Mahajan, A., Oetjen, H., Ingham, T., Stone, D., Whalley, L. K., Evans, M. J., Pilling, M. J., Leigh, R. J., Monks, P. S., Karunaharan, A., Vaughan, S., Arnold, S. R., Tschritter, J., Pöhler, D., Frieß, U., Holla, R., Mendes, L. M., Lopez, H., Faria, B., Manning A. J., and Wallace, D. W. R.: Seasonal characteristics of tropical marine boundary layer air measured at the Cape Verde Atmospheric Observatory, J. Atmos. Chem., 67, 87–140, 2010.
Collins, W. J., Lamarque, J.-F., Schulz, M., Boucher, O., Eyring, V., Hegglin, M. I., Maycock, A., Myhre, G., Prather, M., Shindell, D., and Smith, S. J.: AerChemMIP: quantifying the effects of chemistry and aerosols in CMIP6, Geosci. Model Dev., 10, 585–607, https://doi.org/10.5194/gmd-10-585-2017, 2017.
Comiso, J. C.: Bootstrap Sea Ice Concentrations from Nimbus-7 SMMR and DMSP SSM/I-SSMIS, Version 3, 1979–2022, Boulder, Colorado USA, NASA National Snow and Ice Data Center Distributed Active Archive Center [data set], https://doi.org/10.5067/7Q8HCCWS4I0R2017, 2017.
Coward, A. and Roberts, M.: NERC HadGEM3-GC31-HH model output prepared for CMIP6 HighResMIP, Version 20240131, Earth System Grid Federation [data set], https://doi.org/10.22033/ESGF/CMIP6.1822, 2018.
Daskalakis, N., Tsigaridis, K., Myriokefalitakis, S., Fanourgakis, G. S., and Kanakidou, M.: Large gain in air quality compared to an alternative anthropogenic emissions scenario, Atmos. Chem. Phys., 16, 9771–9784, https://doi.org/10.5194/acp-16-9771-2016, 2016.
Dee, D. P., Uppala, S. M., Simmons, A. J., Berrisford, P., Poli, P., Kobayashi, S., Andrae, U., Balmaseda, M. A., Balsamo, G., Bauer, P., Bechtold, P., Beljaars, A. C. M., van de Berg, L., Bidlot, J., Bormann, N., Delsol, C., Dragani, R., Fuentes, M., Geer, A. J., Haimberger, L., Healy, S. B., Hersbach, H., Hólm, E. V., Isaksen, L., Kållberg, P., Köhler, M., Matricardi, M., McNally, A. P., Monge-Sanz, B. M., Morcrette, J.-J., Park, B.-K., Peubey, C., de Rosnay, P., Tavolato, C., Thépaut, J.-N., and Vitart, F.: The ERA-Interim reanalysis: configuration and performance of the data assimilation system, Q. J. Roy. Meteor. Soc., 137, 553–597, https://doi.org/10.1002/qj.828, 2011 (data available at: https://www.ecmwf.int/en/forecasts/datasets/reanalysis-datasets/era-interim, last access: 12 January 2023).
Dennison, F., Keeble, J., Morgenstern, O., Zeng, G., Abraham, N. L., and Yang, X.: Improvements to stratospheric chemistry scheme in the UM-UKCA (v10.7) model: solar cycle and heterogeneous reactions, Geosci. Model Dev., 12, 1227–1239, https://doi.org/10.5194/gmd-12-1227-2019, 2019.
Desbruyères, D., McDonagh, E. L., King, B. A., and Thierry, V.: Global and full-depth ocean temperature trends during the early twenty-first century from Argo and repeat hydrography, J. Climate, 30, 1985–1997, https://doi.org/10.1175/JCLI-D-16-0396.1, 2017.
Dhomse, S.: UMUKCA_Volcanic_Forcing_Data_Dhomse2020, Mendeley Data, V1 [data set], https://doi.org/10.17632/n3g2htz9hk.1, 2020.
Dhomse, S. S., Emmerson, K. M., Mann, G. W., Bellouin, N., Carslaw, K. S., Chipperfield, M. P., Hommel, R., Abraham, N. L., Telford, P., Braesicke, P., Dalvi, M., Johnson, C. E., O'Connor, F., Morgenstern, O., Pyle, J. A., Deshler, T., Zawodny, J. M., and Thomason, L. W.: Aerosol microphysics simulations of the Mt. Pinatubo eruption with the UM-UKCA composition-climate model, Atmos. Chem. Phys., 14, 11221–11246, https://doi.org/10.5194/acp-14-11221-2014, 2014.
Dhomse, S. S., Mann, G. W., Antuña Marrero, J. C., Shallcross, S. E., Chipperfield, M. P., Carslaw, K. S., Marshall, L., Abraham, N. L., and Johnson, C. E.: Evaluating the simulated radiative forcings, aerosol properties, and stratospheric warmings from the 1963 Mt Agung, 1982 El Chichón, and 1991 Mt Pinatubo volcanic aerosol clouds, Atmos. Chem. Phys., 20, 13627–13654, https://doi.org/10.5194/acp-20-13627-2020, 2020.
Dhomse, S., Feng, W., Rap, A., Carslaw, K., Bellouin, N., and Mann, G.: SMURPHS/ACSIS El Chichon volcanic forcing dataset (mapped to UM wavebands) – from HErSEA ensemble of interactive strat-aerosol GA4 UM-UKCA runs (Dhomse et al., 2020, ACP) (Version v1), Zenodo [data set], https://doi.org/10.5281/zenodo.4744634, 2021a.
Dhomse, S., Feng, W., Rap, A., Carslaw, K., Bellouin, N., and Mann, G.: SMURPHS/ACSIS Agung volcanic forcing dataset (mapped to UM wavebands) – from HErSEA ensemble of interactive strat-aerosol GA4 UM-UKCA runs (Dhomse et al., 2020, ACP) (Version v1), Zenodo [data set], https://doi.org/10.5281/zenodo.4744687, 2021b.
Drewnick, F., Hings, S. S., DeCarlo, P., Jayne, J. T., Gonin, M., Fuhrer, K., Weimer, S., Jimenez, J. L., Demerjian, K. L., Borrmann, S., and Worsnop, D. R.: A new time-of-flight aerosol mass spectrometer (TOF-AMS) – Instrument description and first field deployment, Aerosol Sci. Tech., 39, 637–658, https://doi.org/10.1080/02786820500182040, 2005.
Dunstone, N. J., Smith, D. M., and Eade, R.: Multi-year predictability of the tropical Atlantic atmosphere driven by the high-latitude North Atlantic Ocean, Geophys. Res. Lett., 38, L14701, https://doi.org/10.1029/2011GL047949, 2011.
Dussin, R., Barnier, B., Brodeau, L., and Molines, J. M.: The making of the DRAKKAR forcing set DFS5, DRAKKAR (MyOcean report 01-04-16), LGGE, Grenoble, France, Zenodo, https://doi.org/10.5281/zenodo.1209243, 2016.
Facility for Airborne Atmospheric Measurements (FAAM), Natural Environment Research Council, Met Office, Archibald, A., Matthews, E., Squires, F., Wu, H., and Temple, L.: ACSIS: Merged airborne chemistry data from instruments on board the FAAM aircraft, NERC EDS Centre for Environmental Data Analysis [data set], https://doi.org/10.5285/6285564c34a246fc9ba5ce053d85e5e7, 2024.
Feng, W., Dhomse, S., Rap, A., Carslaw, K., Bellouin, N., and Mann, G.: SMURPHS/ACSIS Pinatubo volcanic forcing dataset (mapped to UM wavebands) – from HErSEA ensemble of interactive strat-aerosol GA4 UM-UKCA runs (Dhomse et al., 2020, ACP) (v1), Zenodo [data set], https://doi.org/10.5281/zenodo.4739171, 2021.
Good, S. A., Martin, M. J., and Rayner, N. A.: 2013. EN4: quality controlled ocean temperature and salinity profiles and monthly objective analyses with uncertainty estimates, J. Geophys. Res.-Oceans, 118, 6704–6716, https://doi.org/10.1002/2013JC009067, 2013.
Griffies, S. M., Danabasoglu, G., Durack, P. J., Adcroft, A. J., Balaji, V., Böning, C. W., Chassignet, E. P., Curchitser, E., Deshayes, J., Drange, H., Fox-Kemper, B., Gleckler, P. J., Gregory, J. M., Haak, H., Hallberg, R. W., Heimbach, P., Hewitt, H. T., Holland, D. M., Ilyina, T., Jungclaus, J. H., Komuro, Y., Krasting, J. P., Large, W. G., Marsland, S. J., Masina, S., McDougall, T. J., Nurser, A. J. G., Orr, J. C., Pirani, A., Qiao, F., Stouffer, R. J., Taylor, K. E., Treguier, A. M., Tsujino, H., Uotila, P., Valdivieso, M., Wang, Q., Winton, M., and Yeager, S. G.: OMIP contribution to CMIP6: experimental and diagnostic protocol for the physical component of the Ocean Model Intercomparison Project, Geosci. Model Dev., 9, 3231–3296, https://doi.org/10.5194/gmd-9-3231-2016, 2016.
Griffiths, P. T., Murray, L. T., Zeng, G., Shin, Y. M., Abraham, N. L., Archibald, A. T., Deushi, M., Emmons, L. K., Galbally, I. E., Hassler, B., Horowitz, L. W., Keeble, J., Liu, J., Moeini, O., Naik, V., O'Connor, F. M., Oshima, N., Tarasick, D., Tilmes, S., Turnock, S. T., Wild, O., Young, P. J., and Zanis, P.: Tropospheric ozone in CMIP6 simulations, Atmos. Chem. Phys., 21, 4187–4218, https://doi.org/10.5194/acp-21-4187-2021, 2021.
Haarsma, R. J., Roberts, M. J., Vidale, P. L., Senior, C. A., Bellucci, A., Bao, Q., Chang, P., Corti, S., Fučkar, N. S., Guemas, V., von Hardenberg, J., Hazeleger, W., Kodama, C., Koenigk, T., Leung, L. R., Lu, J., Luo, J.-J., Mao, J., Mizielinski, M. S., Mizuta, R., Nobre, P., Satoh, M., Scoccimarro, E., Semmler, T., Small, J., and von Storch, J.-S.: High Resolution Model Intercomparison Project (HighResMIP v1.0) for CMIP6, Geosci. Model Dev., 9, 4185–4208, https://doi.org/10.5194/gmd-9-4185-2016, 2016.
Helmig, D., Muñoz, M., Hueber, J., Mazzoleni, C., Mazzoleni, L., Owen, R. C., Val-Martin, M., Fialho, P., Plass-Duelmer, C., Palmer, P. I., and Lewis, A. C.: Climatology and atmospheric chemistry of the non-methane hydrocarbons ethane and propane over the North AtlanticNMHC at Pico Mountain, Elementa, 3, 000054, https://doi.org/10.12952/journal.elementa.000054 2015.
Helmig, D., Rossabi, S., Hueber, J., Tans, P., Montzka, S., A. Masarie, K., Thoning, K., Plass-Duelmer, C., Claude, A., Carpenter, L., J. Lewis, A., Punjabi, S., Reimann, S., Vollmer, M., K. Steinbrecher, R., Hannigan, J., W. Emmons, L., K. Mahieu, E., Franco, B., Smale, D., and Pozzer A.: Reversal of global atmospheric ethane and propane trends largely due to US oil and natural gas production, Nat. Geosci., 9, 490–495, https://doi.org/10.1038/ngeo2721, 2016.
Hersbach, H., Bell, B., Berrisford, P., Hirahara, S., Horányi, A., Muñoz-Sabater, J., Nicolas, J., Peubey, C., Radu, R., Schepers, D., Simmons, A., Soci, C., Abdalla, S., Abellan, X., Balsamo, G., Bechtold, P., Biavati, G., Bidlot, J., Bonavita, M., De Chiara, G., Dahlgren, P., Dee, D., Diamantakis, M., Dragani, R., Flemming, J., Forbes, R., Fuentes, M., Geer, A., Haimberger, L., Healy, S., Hogan, R. J., Hólm, E., Janisková, M., Keeley, S., Laloyaux, P., Lopez, P., Lupu, C., Radnoti, G., de Rosnay, P., Rozum, I., Vamborg, F., Villaume, S., and Thépaut J.: The ERA5 global reanalysis, Q. J. Roy. Meteor. Soc., 146, 1999–2049, 2020.
Hewitt, H. T., Copsey, D., Culverwell, I. D., Harris, C. M., Hill, R. S. R., Keen, A. B., McLaren, A. J., and Hunke, E. C.: Design and implementation of the infrastructure of HadGEM3: the next-generation Met Office climate modelling system, Geosci. Model Dev., 4, 223–253, https://doi.org/10.5194/gmd-4-223-2011, 2011.
Hirschi, J. J.-M., Barnier, B., Böning, C., Biastoch, A., Blaker, A. T., Coward, A., Danilov, S., Drijfhout, S., Getzlaff, K., Griffies, S. M., Hasumi, H., Hewitt, H., Iovino, D., Kawasaki, T., Kiss, A. E., Koldunov, N., Marzocchi, A., Mecking, J. V., Moat, B., Molines, J.-M., Myers, P. G., Penduff, T., Roberts, M., Treguier, A.-M., Sein, D. V., Sidorenko, D., Small, J., Spence, P., Thompson, L., Weijer, W., and Xu, X.: The Atlantic meridional overturning circulation in high resolution models, J. Geophys. Res.-Oceans, 125, e2019JC015522, https://doi.org/10.1029/2019JC015522, 2020.
Hunke, E. C., Lipscomb, W. H, Turner, A. K., Jeffery, N., and Elliott, S.: CICE: The Los Alamos Sea ice model, documentation and software user’s manual, version 5.0 (Tech. Rep.), Los Alamos National Laboratory, https://citeseerx.ist.psu.edu/document?repid=rep1&type=pdf&doi=5eca93a8fbc716474f8fd80c804319b630f90316 (last access: 20 December 2024), 2013.
Jackson, R. B., Saunois, M., Bousquet, P., Canadell, J. G., Poulter, B., Stavert, A. R., Bergamaschi, P., Niwa, Y., Segers, A., and Tsuruta, A.: Increasing anthropogenic methane emissions arise equally from agricultural and fossil fuel sources, Environ. Res. Lett., 15, 071002, https://doi.org/10.1088/1748-9326/ab9ed2, 2020.
Kanamitsu, M., Ebisuzaki, W., Woollen, J., Yang, S.-K., Hnilo, J. J., Fiorino, M., and Potter, G. L.: NCEP–DOE AMIP-II reanalysis (R-2), B. Am. Meteorol. Soc., 83, 1631–1644, https://doi.org/10.1175/BAMS-83-11-1631, 2002.
Keeble, J., Hassler, B., Banerjee, A., Checa-Garcia, R., Chiodo, G., Davis, S., Eyring, V., Griffiths, P. T., Morgenstern, O., Nowack, P., Zeng, G., Zhang, J., Bodeker, G., Burrows, S., Cameron-Smith, P., Cugnet, D., Danek, C., Deushi, M., Horowitz, L. W., Kubin, A., Li, L., Lohmann, G., Michou, M., Mills, M. J., Nabat, P., Olivié, D., Park, S., Seland, Ø., Stoll, J., Wieners, K.-H., and Wu, T.: Evaluating stratospheric ozone and water vapour changes in CMIP6 models from 1850 to 2100, Atmos. Chem. Phys., 21, 5015–5061, https://doi.org/10.5194/acp-21-5015-2021, 2021.
King, B. A.: Objectively mapped Argo profiling float data and RAPID moored microcat data from the North Atlantic Ocean, 2004–2022, NERC EDS British Oceanographic Data Centre NOC [data set], https://doi.org/10.5285/fe8e524d-7f04-41f3-e053-6c86abc04d51, 2023.
Kumar, A., Wu, S., Weise, M. F., Honrath, R., Owen, R. C., Helmig, D., Kramer, L., Val Martin, M., and Li, Q.: Free-troposphere ozone and carbon monoxide over the North Atlantic for 2001–2011, Atmos. Chem. Phys., 13, 12537–12547, https://doi.org/10.5194/acp-13-12537-2013, 2013.
Large, W. G. and Yeager, S. G.:. The global climatology of an interannually varying air–sea flux data set, Clim. Dynam., 33, 341–364, https://doi.org/10.1007/s00382-008-0441-3, 2009.
Lawler, M. J., Sander, R., Carpenter, L. J., Lee, J. D., von Glasow, R., Sommariva, R., and Saltzman, E. S.: HOCl and Cl2 observations in marine air, Atmos. Chem. Phys., 11, 7617–7628, https://doi.org/10.5194/acp-11-7617-2011, 2011.
Lee, B. H., Lopez-Hilfiker, F. D., Mohr, C., Kurtén, T., Worsnop, D. R., and Thornton, J. A.: An iodide-adduct high-resolution time-of-flight chemical-ionization mass spectrometer: Application to atmospheric inorganic and organic compounds, Environ. Sci. Technol., 48, 6309–6317, 2018.
Loades, D. C., Yang, M., Bell, T. G., Vaughan, A. R., Pound, R. J., Metzger, S., Lee, J. D., and Carpenter, L. J.: Ozone deposition to a coastal sea: comparison of eddy covariance observations with reactive air–sea exchange models, Atmos. Meas. Tech., 13, 6915–6931, https://doi.org/10.5194/amt-13-6915-2020, 2020.
Lozier, M. S., Li, F., Bacon, S., Bahr, F., Bower, A., Cunningham, S., de Jong, F., de Steur, L., de Young, B., Fischer, J., Gary, S., Greenan, B., Holliday, N. P., Houk, A., Houpert, L., Inall, M., Johns, B., Johnson, H., Johnson, C., Karstensen, J., Koman, G., LeBras, I., Lin, X., Mackay, N., Marshall, D., Mercier, H., Oltmanns, M., Pickart, R., Ramsay, A., Rayner, D., Straneo, F., Thierry, V., Torres, D., Williams, R., Wilson, C., Yang, J., Yashayaev, I., and Zhao, J.: A sea change in our view of overturning in the Subpolar North Atlantic Program, Science, 363 516–521, https://doi.org/10.1126/science.aau6592, 2019.
Luo, B.: Stratospheric aerosol data for use in CMIP6 models, ftp://iacftp.ethz.ch/pub_read/luo/CMIP6/Readme_Data_Description.pdf (last access: 19 December 2024), 2016.
Madec, G. and the NEMO Team: NEMO ocean engine, Note du Po^le de mode ìlisation de l'Institut Pierre-Simon Laplace No 27 ISSN No 1288-1619, 2016.
Madec, G., Bell, M., Blaker, A., Bricaud, C., Bruciaferri, D., Castrillo, M., Calvert, D., Chanut, J., Clementi, E., Coward, A., Epicoco, I., Éthé, C., Ganderton, J., Harle, J., Hutchinson, K., Iovino, D., Lea, D., Lovato, T., Martin, M., Martin, N., Mele, F., Martins, D., Masson, S., Mathiot, P., Mele, F., Mocavero, S., Müller, S., George Nurser, A. J., Paronuzzi, S., Peltier, M., Person, R., Rousset, C., Rynders, S., Samson, G., Téchené, S., Vancoppenolle, M., and Wilson, C.: NEMO ocean engine, Scientific Notes of Climate Modelling Center (27), Zenodo [data set], https://doi.org/10.5281/zenodo.1464816, 2019.
Mann, G. W., Carslaw, K. S., Spracklen, D. V., Ridley, D. A., Manktelow, P. T., Chipperfield, M. P., Pickering, S. J., and Johnson, C. E.: Description and evaluation of GLOMAP-mode: a modal global aerosol microphysics model for the UKCA composition-climate model, Geosci. Model Dev., 3, 519–551, https://doi.org/10.5194/gmd-3-519-2010, 2010.
Mann, G., Dhomse S., Deshler, T., Timmreck, C., Schmidt, A., Neely, R., and Thomason, L.: Evolving particle size is the key to improved volcanic forcings, Past Global Change, 23, 52–53, https://doi.org/10.22498/pages.23.2.52, 2015.
Matthews, E., Bannan, T. J., Khan, M. A. H., Shallcross, D. E., Stark, H., Browne, E. C., Archibald, A. T., Mehra, A., Bauguitte, S. J. B., Reed, C., Thamban, N. M., Wu, H., Barker, P., Lee, J., Carpenter, L. J., Yang, M., Bell, T. G., Allen, G., Jayne, J. T., Percival, C. J., McFiggans, G., Gallagher, M., and Coe, H.: Airborne observations over the North Atlantic Ocean reveal the importance of gas-phase urea in the atmosphere, P. Natl. Acad. Sci. USA, 120, e2218127120, https://doi.org/10.1073/pnas.2218127120, 2023.
Matthews, E.: Examining novel atmospheric chemistry in the marine environment with an iodide chemical ionisation mass spectrometer, Ph.D. Thesis, The University of Manchester, 2023.
McCarthy, G. D., Smeed, D. A., Johns, W. E., Frajka-Williams, E., Moat, B. I. Rayner, D., Baringer, M. O., Meinen, C. S., Collins, J., and Bryden, H. L.: Measuring the Atlantic Meridional Overturning Circulation at 26° N, Prog. Oceanogr., 130, 91–111, https://doi.org/10.1016/j.pocean.2014.10.006, 2015.
McFiggans, G. B., Ball, S. M., Carpenter, L. J., Gallagher, M. W., Heard, D. E., and Plane, J. M. C.: Novel findings in the Reactive Halogens in the Marine Boundary Layer (RHaMBLe) project, Geochim. Cosmochim. Ac., 73, A857–A857, 2009.
Megann, A., Blaker, A., Josey, S., New, A., and Sinha, B.: Mechanisms for late 20th and early 21st Century decadal AMOC variability, J. Geophys. Res.-Oceans, 126, e2021JC017865, https://doi.org/10.1029/2021JC017865, 2021a.
Megann, A., Sinha, B., and Blaker, A.: Monthly ocean and sea-ice output from 1/4° NEMO GO6 integration forced by CORE2 data, CEDA Archive [data set], https://doi.org/10/gm8vf7, 2021b.
Megann, A., Sinha, B., and Blaker, A.: Monthly ocean and sea-ice output from 1/4° NEMO (GO6 integration forced by DFS5.2 data, NERC EDS British Oceanographic Data Centre [data set], https://doi.org/10/gm8vf5, 2021c.
Megann, A., Sinha, B., and Blaker, A.: Monthly ocean and sea-ice output from 1/4° NEMO GO6 integration forced by JRA-55 data, NERC EDS British Oceanographic Data Centre [data set], https://doi.org/10/gm8vf8, 2021d.
Megann, A., Sinha, B., Blaker, A., Schroeder, D., and Feltham, D.: The North Atlantic Climate System Integrated Study: model run output, NERC EDS British Oceanographic Data Centre NOC [data set], http://catalogue.ceda.ac.uk/uuid/770a885a8bc34d51ad71e87ef346d6a8 (last access: 19 December 2024), 2021e.
Megann, A., Blaker, A., Coward, A., Guiavarc'h, C., and Storkey, D.: Model output from 1/4°, global JRA55-forced integration of GO8p7 global ocean-sea ice model from 1958 to 2021, NERC British Oceanographic Data Centre [data set], https://doi.org/10.5285/e02c8424657846468c1ff3a5acd0b1ab, 2022a.
Megann, A., Blaker, A., Coward, A., Guiavarc'h, C., and Storkey, D.: Model output from 1/12° global JRA55-forced integration of GO8p7 global ocean-sea ice model from 1958 to 2021, NERC British Oceanographic Data Centre [data set], https://doi.org/10.5285/399b0f762a004657a411a9ea7203493a, 2022b.
Middlebrook, A. M., Bahreini, R., Jimenez, J. L., and Canagaratna, M. R.: Evaluation of composition-dependent collection efficiencies for the aerodyne aerosol mass spectrometer using field data, Aerosol Sci. Tech., 46, 258–271, https://doi.org/10.1080/02786826.2011.620041, 2012.
Moat, B. I., Smeed, D. A., Frajka-Williams, E., Desbruyères, D. G., Beaulieu, C., Johns, W. E., Rayner, D., Sanchez-Franks, A., Baringer, M. O., Volkov, D., Jackson, L. C., and Bryden, H. L.: Pending recovery in the strength of the meridional overturning circulation at 26° N, Ocean Sci., 16, 863–874, https://doi.org/10.5194/os-16-863-2020, 2020.
Moat, B. I., King, B. A., and Macintosh, C. R.: Subpolar North Atlantic ocean heat content (surface to 1000m) using the EN4.2.2 temperature data set, NERC EDS British Oceanographic Data Centre NOC [data set], https://doi.org/10/g6wm, 2021a.
Moat, B. I., King, B. A., and Macintosh, C. R.: Subpolar North Atlantic ocean heat content (surface to 1000 m) using objectively mapped Argo profiling float data, NERC EDS British Oceanographic Data Centre NOC [data set], https://doi.org/10/g8g2, 2021b.
Moat, B. I., Frajka-Williams, E., Smeed, D. A., Rayner, D., Johns, W. E., Baringer, M. O., Volkov, D., and Collins, J.: Atlantic meridional overturning circulation observed by the RAPID-MOCHA-WBTS (RAPID-Meridional Overturning Circulation and Heatflux Array-Western Boundary Time Series) array at 26N from 2004 to 2020 (v2020.2), British Oceanographic Data Centre – Natural Environment Research Council, UK [data set], https://doi.org/10.5285/e91b10af-6f0a-7fa7-e053-6c86abc05a09, 2022.
Monks, P. S., Archibald, A. T., Colette, A., Cooper, O., Coyle, M., Derwent, R., Fowler, D., Granier, C., Law, K. S., Mills, G. E., Stevenson, D. S., Tarasova, O., Thouret, V., von Schneidemesser, E., Sommariva, R., Wild, O., and Williams, M. L.: Tropospheric ozone and its precursors from the urban to the global scale from air quality to short-lived climate forcer, Atmos. Chem. Phys., 15, 8889–8973, https://doi.org/10.5194/acp-15-8889-2015, 2015.
Morgan, W. T., Allan, J. D., Bower, K. N., Capes, G., Crosier, J., Williams, P. I., and Coe, H.: Vertical distribution of sub-micron aerosol chemical composition from North-Western Europe and the North-East Atlantic, Atmos. Chem. Phys., 9, 5389–5401, https://doi.org/10.5194/acp-9-5389-2009, 2009.
Mulcahy, J. P., Johnson, C., Jones, C. G., Povey, A. C., Scott, C. E., Sellar, A., Turnock, S. T., Woodhouse, M. T., Abraham, N. L., Andrews, M. B., Bellouin, N., Browse, J., Carslaw, K. S., Dalvi, M., Folberth, G. A., Glover, M., Grosvenor, D. P., Hardacre, C., Hill, R., Johnson, B., Jones, A., Kipling, Z., Mann, G., Mollard, J., O'Connor, F. M., Palmiéri, J., Reddington, C., Rumbold, S. T., Richardson, M., Schutgens, N. A. J., Stier, P., Stringer, M., Tang, Y., Walton, J., Woodward, S., and Yool, A.: Description and evaluation of aerosol in UKESM1 and HadGEM3-GC3.1 CMIP6 historical simulations, Geosci. Model Dev., 13, 6383–6423, https://doi.org/10.5194/gmd-13-6383-2020, 2020.
National Centre for Atmospheric Science, Carpenter, L. J., Hopkins, J. R., Lewis, A. C., Neves, L. M., Moller, S., Pilling, M. J., Read, K. A., Young, T. D., and Lee, J. D.: Continuous Cape Verde Atmospheric Observatory Observations, NCAS British Atmospheric Data Centre [data set], http://catalogue.ceda.ac.uk/uuid/81693aad69409100b1b9a247b9ae75d5 (last access: 31 January 2024), 2010.
New, A. L., Smeed, D. A., Czaja, A., Blaker, A. T., Mecking, J. V., Mathews, J. P., and Sanchez-Franks, A.: Labrador Slope Water connects the subarctic with the Gulf Stream, Environ. Res. Lett., 16, 084019, https://doi.org/10.1088/1748-9326/ac1293, 2021.
Nisbet, E. G., Manning, M. R., Dlugokencky, E. J., Fisher, R. E., Lowry, D., Michel, S. E., Myhre, C. L., Platt, S. M., Allen, G., Bousquet, P., and Brownlow, R.: Very strong atmospheric methane growth in the 4 years 2014–2017: Implications for the Paris Agreement, Global Biogeochem. Cy., 33, 318–342, 2019.
NSF Unidata: NetCDF version 4.9.2, NSF Unidata [code], https://doi.org/10.5065/D6H70CW6 (last access: 20 December 2024), 2023.
Parrington, M., Palmer, P. I., Henze, D. K., Tarasick, D. W., Hyer, E. J., Owen, R. C., Helmig, D., Clerbaux, C., Bowman, K. W., Deeter, M. N., Barratt, E. M., Coheur, P.-F., Hurtmans, D., Jiang, Z., George, M., and Worden, J. R.: The influence of boreal biomass burning emissions on the distribution of tropospheric ozone over North America and the North Atlantic during 2010, Atmos. Chem. Phys., 12, 2077–2098, https://doi.org/10.5194/acp-12-2077-2012, 2012.
Phillips, D. P., Hopkins, F. E., Bell, T. G., Liss, P. S., Nightingale, P. D., Reeves, C. E., Wohl, C., and Yang, M.: Air–sea exchange of acetone, acetaldehyde, DMS and isoprene at a UK coastal site, Atmos. Chem. Phys., 21, 10111–10132, https://doi.org/10.5194/acp-21-10111-2021, 2021.
Plymouth Marine Laboratory and Yang, M.: Penlee Point Atmospheric Observatory: Meteorological and chemical observations 2014–present, Centre for Environmental Data Analysis [data set], https://catalogue.ceda.ac.uk/uuid/8f1ff8ea77534e08b03983685990a9b0 (last access: 31 January 2024), 2017.
Prather, M. J., Zhu, X., Flynn, C. M., Strode, S. A., Rodriguez, J. M., Steenrod, S. D., Liu, J., Lamarque, J.-F., Fiore, A. M., Horowitz, L. W., Mao, J., Murray, L. T., Shindell, D. T., and Wofsy, S. C.: Global atmospheric chemistry – which air matters, Atmos. Chem. Phys., 17, 9081–9102, https://doi.org/10.5194/acp-17-9081-2017, 2017.
Ranjithkumar, A., Gordon, H., Williamson, C., Rollins, A., Pringle, K., Kupc, A., Abraham, N. L., Brock, C., and Carslaw, K.: Constraints on global aerosol number concentration, SO2 and condensation sink in UKESM1 using ATom measurements, Atmos. Chem. Phys., 21, 4979–5014, https://doi.org/10.5194/acp-21-4979-2021, 2021.
Read, K. A., Mahajan, A. S., Carpenter, L. J., Evans, M. J., E Faria, B. V., Heard, D. E., Hopkins, J. R., Lee, J. D., Moller, S. J., Lewis, A. C., Mendes, L., McQuaid, J. B., Oetjen, H., Saiz-Lopez, A., Pilling, M. J., and Plane, J. M. C.: Extensive halogen-mediated ozone destruction over the tropical Atlantic Ocean, Nature, 453, 1232–1235, 2008.
Reeves, C. E., Penkett, S. A., Bauguitte, S., Law, K. S., Evans, M. J., Bandy, B. J., Monks, P. S., Edwards, G. D., Phillips, G., Barjat, H., and Kent, J.: Potential for photochemical ozone formation in the troposphere over the North Atlantic as derived from aircraft observations during ACSOE, J. Geophys. Res.-Atmos., 107, 1–14, https://doi.org/10.1029/2002JD002415, 2002.
Reynolds, R. W., Rayner, N. A., Smith, T. M., Stokes, D. C., and Wang, W.: An improved in situ and satellite SST analysis for climate, J. Climate, 15, 1609–1625, 2002.
Ridley, J. K., Blockley, E. W., Keen, A. B., Rae, J. G. L., West, A. E., and Schroeder, D.: The sea ice model component of HadGEM3-GC3.1, Geosci. Model Dev., 11, 713–723, https://doi.org/10.5194/gmd-11-713-2018, 2018.
Roberts, M.: MOHC HadGEM3-GC31-MM model output prepared for CMIP6 HighResMIP highresSST-present, Version 20240131, Earth System Grid Federation [data set], https://doi.org/10.22033/ESGF/CMIP6.6029, 2017a.
Roberts, M.: MOHC HadGEM3-GC31-HM model output prepared for CMIP6 HighResMIP highresSST-present, Version 20240131, Earth System Grid Federation [data set], https://doi.org/10.22033/ESGF/CMIP6.6024, 2017b.
Roberts, M.: MOHC HadGEM3-GC31-HM model output prepared for CMIP6 HighResMIP hist-1950, Version 20240131, Earth System Grid Federation [data set], https://doi.org/10.22033/ESGF/CMIP6.6040, 2018a.
Roberts, M.: MOHC HadGEM3-GC31-HH model output prepared for CMIP6 HighResMIP control-1950, Version 20240131, Earth System Grid Federation [data set], https://doi.org/10.22033/ESGF/CMIP6.5881, 2018b.
Roberts, M.: MOHC HadGEM3-GC31-MM model output prepared for CMIP6 HighResMIP highresSST-future, Version 20240131, Earth System Grid Federation [data set], https://doi.org/10.22033/ESGF/CMIP6.6013, 2019a.
Roberts, M.: MOHC HadGEM3-GC31-HM model output prepared for CMIP6 HighResMIP highresSST-future, Version 20240131, Earth System Grid Federation [data set], https://doi.org/10.22033/ESGF/CMIP6.6008, 2019b.
Roberts, M.: MOHC HadGEM3-GC31-HM model output prepared for CMIP6 HighResMIP highres-future, Version 20240131, Earth System Grid Federation [data set], https://doi.org/10.22033/ESGF/CMIP6.5984, 2019c.
Roberts, M. J., Vidale, P. L., Senior, C., Hewitt, H. T., Bates, C., Berthou, S., Chang, P., Christensen, H. M., Danilov, S., Demory, M.-E., Griffies, S. M., Haarsma, R., Jung, T., Martin, G., Minobe, S., Ringler, T., Satoh, M., Schiemann, R., Scoccimarro, E., Stephens, G., and Wehner, M. F.: The Benefits of Global High Resolution for Climate Simulation: Process Understanding and the Enabling of Stakeholder Decisions at the Regional Scale, B. Am. Meteorol. Soc., 99, 2341–2359, https://doi.org/10.1175/BAMS-D-15-00320.1, 2018.
Roberts, M. J., Baker, A., Blockley, E. W., Calvert, D., Coward, A., Hewitt, H. T., Jackson, L. C., Kuhlbrodt, T., Mathiot, P., Roberts, C. D., Schiemann, R., Seddon, J., Vannière, B., and Vidale, P. L.: Description of the resolution hierarchy of the global coupled HadGEM3-GC3.1 model as used in CMIP6 HighResMIP experiments, Geosci. Model Dev., 12, 4999–5028, https://doi.org/10.5194/gmd-12-4999-2019, 2019.
Roberts, M. J., Jackson, L. C., Roberts, C. D., Meccia, V., Docquier, D., Koenigk, T., Ortega, P., Moreno-Chamarro, E., Bellucci, A., Coward, A., Drijfhout, S., Exarchou, E., Gutjahr, O., Hewitt, H., Iovino, D., Lohmann, K., Putrasahan, D., Schiemann, R., Seddon, J., Terray, L., Xu, X., Zhang, Q., Chang, P., Yeager, S. G., Castruccio, F. S., Zhang, S., and Wu, L.: Sensitivity of the Atlantic meridional overturning circulation to model resolution in CMIP6 HighResMIP simulations and implications for future changes, J. Adv. Model. Earth Sy., 12, e2019MS002014, https://doi.org/10.1029/2019MS002014, 2020.
Robson, J., Sutton, R. T., Archibald, A., Cooper, F., Christensen, M., Gray, L. J., Holliday, N. P., Macintosh, C., McMillan, M., Moat, B., Russo, M., Tilling, R., Carslaw, K., Desbruyères, D., Embury, O., Feltham, D. L., Grosvenor, Daniel P., Josey, S., King, B., Lewis, A., McCarthy, G. D., Merchant, C., New, A. L., O'Reilly, C. H., Osprey, S. M., Read, K., Scaife, A., Shepherd, A., Sinha, B., Smeed, D., Smith, D., Ridout, A., Woollings, T., and Yang, M.: Recent multivariate changes in the North Atlantic climate system, with a focus on 2005–2016, Int. J. Climatol., 38, 5050–5076, https://doi.org/10.1002/joc.5815, 2018.
Robson, J., Aksenov, Y., Bracegirdle, T. J., Dimdore-Miles, O., Griffiths, P. T., Grosvenor, D. P., Hodson, D. L. R., Keeble, J., Megann, A., Osprey, S., Povey, A. C., Schröder, D., Yang, M., Archibald, A. T., Carslaw, K. S., Gray, L., Jones, C., Kerridge, B., Knappett, D., Kuhlbrodt, T., Russo, M., Sellar, A., Siddans, R., Sinha, B., Sutton, R., Walton, J., and Wilcox, L. J.: The evaluation of the North Atlantic climate system in UKESM1 historical simulations for CMIP6, J. Adv. Model. Earth Sy., 12, e2020MS002126, https://doi.org/10.1029/2020MS002126, 2020.
Rollins, A. W., Thornberry, T. D., Ciciora, S. J., McLaughlin, R. J., Watts, L. A., Hanisco, T. F., Baumann, E., Giorgetta, F. R., Bui, T. V., Fahey, D. W., and Gao, R.-S.: A laser-induced fluorescence instrument for aircraft measurements of sulfur dioxide in the upper troposphere and lower stratosphere, Atmos. Meas. Tech., 9, 4601–4613, https://doi.org/10.5194/amt-9-4601-2016, 2016.
Russo, M. R., Kerridge, B. J., Abraham, N. L., Keeble, J., Latter, B. G., Siddans, R., Weber, J., Griffiths, P. T., Pyle, J. A., and Archibald, A. T.: Seasonal, interannual and decadal variability of tropospheric ozone in the North Atlantic: comparison of UM-UKCA and remote sensing observations for 2005–2018, Atmos. Chem. Phys., 23, 6169–6196, https://doi.org/10.5194/acp-23-6169-2023, 2023.
Schiemann, R., Vidale, P., Hatcher, R., and Roberts, M.: NERC HadGEM3-GC31-HM model output prepared for CMIP6 HighResMIP hist-1950, Version 20240131, Earth System Grid Federation [data set], https://doi.org/10.22033/ESGF/CMIP6.6041, 2019a.
Schiemann, R., Vidale, P. L., Hatcher, R., and Roberts, M.: NERC HadGEM3-GC31-HM model output prepared for CMIP6 HighResMIP highres-future, Version 20240131, Earth System Grid Federation [data set], https://doi.org/10.22033/ESGF/CMIP6.5985, 2019b.
Schröder, D., Feltham, D. L., Tsamados, M., Ridout, A., and Tilling, R.: New insight from CryoSat-2 sea ice thickness for sea ice modelling, The Cryosphere, 13, 125–139, https://doi.org/10.5194/tc-13-125-2019, 2019.
Sellar, A. A., Jones, C. G., Mulcahy, J. P., Tang, Y., Yool, A., Wiltshire, A., O'Connor, F. M., Stringer, M., Hill, R., Palmieri, J., Woodward, S., de Mora, L., Kuhlbrodt, T., Rumbold, S. T., Kelley, D. I., Ellis, R.; Johnson, C. E., Walton, J., Abraham, N. L., Andrews, M. B., Andrews, T., Archibald, A. T., Berthou, S., Burke, E., Blockley, E., Carslaw, K., Dalvi, M., Edwards, J., Folberth, G. A., Gedney, N., Griffiths, P. T., Harper, A. B., Hendry, M. A., Hewitt, A. J., Johnson, B., Jones, A., Jones, C. D., Keeble, J., Liddicoat, S., Mordenstern, O., Parker, R. J., Predoi, V., Robertson, E., Siahaan, A., Smith, R. S., Swaminathan, R., Woodhouse, M. T., Zeng, G., and Zerroukat, M.: UKESM1: description and evaluation of the U.K. Earth System Model, J. Adv. Model. Earth Sy., 11, 4513–4558, https://doi.org/10.1029/2019MS001739, 2019.
Sinclair, K., van Diedenhoven, B., Cairns, B., Alexandrov, M., Moore, R., Ziemba, L. D., and Crosbie, E.: Observations of aerosol-cloud interactions during the North Atlantic aerosol and marine ecosystem study, Geophys. Res. Lett., 47, e2019GL085851, https://doi.org/10.1029/2019GL085851, 2020.
Sinha, B.: Figure plotting scripts/programs for Earth System Science Data publication https://doi.org/10.5194/essd-2023-405 (v1.0), Zenodo [code], https://doi.org/10.5281/zenodo.13972336, 2024.
Smyth, T.: ACSIS: Sunphotometer aerosol measurements at Plymouth Marine Laboratory – Version 1. 2001–2023, NERC EDS Centre for Environmental Data Analysis [data set], https://catalogue.ceda.ac.uk/uuid/e74491c96ef24df29a9342a3d57b5939 (last access: 31 January 2024), 2024.
Sommariva, R., Hollis, L. D. J., Sherwen, T., Baker, A. R., Ball, S. M., Bandy, B. J., Bell, T. G., Chowdhury, M. N., Cordell, R. L., Evans, M. J., Lee, J. D., Reed, C., Reeves, C. E., Roberts, J. M., Yang, M., and Monks, P. S.: Seasonal and geographical variability of nitryl chloride and its precursors in Northern Europe, Atmos. Sci. Lett., 19, e844, https://doi.org/10.1002/asl.844, 2018.
Storkey, D., Blaker, A. T., Mathiot, P., Megann, A., Aksenov, Y., Blockley, E. W., Calvert, D., Graham, T., Hewitt, H. T., Hyder, P., Kuhlbrodt, T., Rae, J. G. L., and Sinha, B.: UK Global Ocean GO6 and GO7: a traceable hierarchy of model resolutions, Geosci. Model Dev., 11, 3187–3213, https://doi.org/10.5194/gmd-11-3187-2018, 2018.
Sutton, R. T., McCarthy, G. D., Robson, J., Sinha, B., Archibald, A. T., and Gray, L. J.: Atlantic multidecadal variability and the UK ACSIS program, B. Am. Meteorol. Soc., 99, 415–425, 2018.
Telford, P. J., Braesicke, P., Morgenstern, O., and Pyle, J. A.: Technical Note: Description and assessment of a nudged version of the new dynamics Unified Model, Atmos. Chem. Phys., 8, 1701–1712, https://doi.org/10.5194/acp-8-1701-2008, 2008.
Thompson, R. L., Nisbet, E. G., Pisso, I., Stohl, A., Blake, D., Dlugokencky, E. J., Helmig, D., and White, J. W. C.: Variability in atmospheric methane from fossil fuel and microbial sources over the last three decades, Geophys. Res. Lett., 45, 11499–11508, 2018.
Tilling, R. L., Ridout, A., and Shepherd, A.: Estimating Arctic sea ice thickness and volume using CryoSat-2 radar altimeter data, Adv. Space Res., 62, 1203–1225, 2018.
Timmreck, C., Mann, G. W., Aquila, V., Hommel, R., Lee, L. A., Schmidt, A., Brühl, C., Carn, S., Chin, M., Dhomse, S. S., Diehl, T., English, J. M., Mills, M. J., Neely, R., Sheng, J., Toohey, M., and Weisenstein, D.: The Interactive Stratospheric Aerosol Model Intercomparison Project (ISA-MIP): motivation and experimental design, Geosci. Model Dev., 11, 2581–2608, https://doi.org/10.5194/gmd-11-2581-2018, 2018.
Tsujino, H., Urakawa, S., Nakano, H., Small, R. J., Kim, W. M., Yeager , S. G., Danabasoglu, G., Suzuki, T., Bamber, J. L., Bentsen, M., Böning, C. W., Bozec, A., Chassignet, E. P., Curchitser, E., Boeira Dias, F., Durack, P. J., Griffies, S. M., Harada, Y., Ilicak, M., Josey, S. A., Kobayashi, C., Kobayashi, S., Komuro, Y., Large, W. G., Le Sommer, J., Marsland, S. J., Masina, S., Scheinert, M., Tomita, H., Valdivieso, M., and Yamazaki, D.: JRA-55 based surface dataset for driving ocean-sea ice models (JRA55-do) Ocean Model., 130, 79-139, https://doi.org/10.1016/j.ocemod.2018.07.002, 2018.
Turnock, S. T., Butt, E. W., Richardson, T. B., Mann, G. W., Reddington, C. L., Forster, P. M., Haywood, J., Crippa, M., Janssens-Maenhout, G., Johnson, C. E., and Bellouin, N.: The impact of European legislative and technology measures to reduce air pollutants on air quality, human health and climate, Environ. Res. Lett., 11, 024010, https://doi.org/10.1088/1748-9326/11/2/024010, 2016.
Turnock, S. T., Allen, R. J., Andrews, M., Bauer, S. E., Deushi, M., Emmons, L., Good, P., Horowitz, L., John, J. G., Michou, M., Nabat, P., Naik, V., Neubauer, D., O'Connor, F. M., Olivié, D., Oshima, N., Schulz, M., Sellar, A., Shim, S., Takemura, T., Tilmes, S., Tsigaridis, K., Wu, T., and Zhang, J.: Historical and future changes in air pollutants from CMIP6 models, Atmos. Chem. Phys., 20, 14547–14579, https://doi.org/10.5194/acp-20-14547-2020, 2020.
van Pinxteren, M., Fomba, K. W., Triesch, N., Stolle, C., Wurl, O., Bahlmann, E., Gong, X., Voigtländer, J., Wex, H., Robinson, T.-B., Barthel, S., Zeppenfeld, S., Hoffmann, E. H., Roveretto, M., Li, C., Grosselin, B., Daële, V., Senf, F., van Pinxteren, D., Manzi, M., Zabalegui, N., Frka, S., Gašparović, B., Pereira, R., Li, T., Wen, L., Li, J., Zhu, C., Chen, H., Chen, J., Fiedler, B., von Tümpling, W., Read, K. A., Punjabi, S., Lewis, A. C., Hopkins, J. R., Carpenter, L. J., Peeken, I., Rixen, T., Schulz-Bull, D., Monge, M. E., Mellouki, A., George, C., Stratmann, F., and Herrmann, H.: Marine organic matter in the remote environment of the Cape Verde islands – an introduction and overview to the MarParCloud campaign, Atmos. Chem. Phys., 20, 6921–6951, https://doi.org/10.5194/acp-20-6921-2020, 2020.
Walters, D. N., Williams, K. D., Boutle, I. A., Bushell, A. C., Edwards, J. M., Field, P. R., Lock, A. P., Morcrette, C. J., Stratton, R. A., Wilkinson, J. M., Willett, M. R., Bellouin, N., Bodas-Salcedo, A., Brooks, M. E., Copsey, D., Earnshaw, P. D., Hardiman, S. C., Harris, C. M., Levine, R. C., MacLachlan, C., Manners, J. C., Martin, G. M., Milton, S. F., Palmer, M. D., Roberts, M. J., Rodríguez, J. M., Tennant, W. J., and Vidale, P. L.: The Met Office Unified Model Global Atmosphere 4.0 and JULES Global Land 4.0 configurations, Geosci. Model Dev., 7, 361–386, https://doi.org/10.5194/gmd-7-361-2014, 2014.
White, C., Ussher, S. J., Fitzsimons, M. F., Atkinson, S., Woodward, E. M. S., Yang, M., and Bell, T. G.: Inorganic nitrogen and phosphorus in Western European aerosol and the significance of dry deposition flux into stratified shelf waters, Atmos. Environ., 261, 118391, https://doi.org/10.1016/j.atmosenv.2021.118391, 2021.
Williams, K. D., Copsey, D., Blockley, E. W., Bodas-Salcedo, A., Calvert, D., Comer, R., Davis, P., Graham, T., Hewitt, H. T., Hill, R., Hyder, P., Ineson, S., Johns, T. C., Keen, A. B., Lee, R. W., Megann, A., Milton, S. F., Rae, J. G. L., Roberts, M. J., Scaife, A. A., Schiemann, R., Storkey, D., Thorpe, L., Watterson, I. G., Walters, D. N., West, A., Wood, R. A., Woollings, T., and Xavier, P. K.,: The Met Office Global Coupled Model 3.0 and 3.1 (GC3.0 and GC3.1) Configurations, J. Adv. Model. Earth Sy., 10, 357–380, https://doi.org/10.1002/2017MS001115, 2017.
Williams, S. D. P. and Berry, D. I.: ACSIS Atlantic Ocean medium resolution SST dataset: Reconstructed 5-day, -degree, Atlantic Ocean SST (1950–2014), Geosci. Data J., 7, 135–148, https://doi.org/10.1002/gdj3.94, 2020.
Wilkinson, M. D., Dumontier, M., Aalbersberg, I. J., Appleton, G., Axton, M., Baak, A., Blomberg, N., Boiten, J. W., da Silva Santos, L. B., Bourne, P. E., and Bouwman, J.: The FAIR Guiding Principles for scientific data management and stewardship, Sci. Data, 3, 1–9, 2016.
Wofsy, S. C., Afshar, S., Allen, H. M., Apel, E., Asher, E. C., Barletta, B., Bent, J., Bian, H., Biggs, B. C., Blake, D. R., Blake, N., Bourgeois, I., Brock, C. A., Brune, W. H., Budney, J. W., Bui, T. P., Butler, A., Campuzano-Jost, P., Chang, C S., Chin, M., Commane, R., Correa, G., Crounse, J. D., Cullis, P. D., Daube, B. C., Day, D. A., Dean-Day, J. M., Dibb, J. E., DiGangi, J. P., Diskin, G. S., Dollner, M., Elkins, J. W., Erdesz, F., Fiore, A. M., Flynn, C. M., Froyd, K., Gesler, D. W., Hall, S. R., Hanisco, T. F., Hannun, R. A., Hills, A. J., Hintsa, E. J., Hoffman, A., Hornbrook, R. S., Huey, L. G., Hughes, S., Jimenez, J. L., Johnson, B. J., Katich, J. M., Keeling, R. F., Kim, M. J., Kupc, A., Lait, L. R., Lamarque, J.-F., Liu, J., McKain, K., Mclaughlin, R. J., Meinardi, S., Miller, D. O., Montzka, S. A., Moore, F. L., Morgan, E. J., Murphy, D. M., Murray, L. T., Nault, B. A., Neuman, J. A., Newman, P. A., Nicely, J. M., Pan, X., Paplawsky, W., Peischl, J., Prather, M. J., Price, D. J., Ray, E., Reeves, J. M., Richardson, M., Rollin, s A. W., Rosenlof, K. H., Ryerson, T. B., Scheuer, E., Schill, G. P., Schroder, J. C., Schwarz, J. P., St. Clair, J. M., Steenrod, S. D., Stephens, B. B., Strode, S. A., Sweeney, C., Tanner, D., Teng, A. P., Thames, A. B., Thompson, C. R., Ullmann, K., Veres, P. R., Vieznor, N., Wagner, N. L., Watt, A., Weber, R., Weinzierl, B., Wennberg, P., Williamson, C. J., Wilson, J. C., Wolfe, G. M., Woods, C. T., and Zeng, L. H.: ATom: Merged Atmospheric Chemistry, Trace Gases, and Aerosols, ORNL DAAC [data set], Oak Ridge, Tennessee, USA, https://doi.org/10.3334/ORNLDAAC/1581, 2018.
Yang, M. and Fleming, Z. L.: Estimation of atmospheric total organic carbon (TOC) – paving the path towards carbon budget closure, Atmos. Chem. Phys., 19, 459–471, https://doi.org/10.5194/acp-19-459-2019, 2019.
Yang, M., Bell, T. G., Hopkins, F. E., and Smyth, T. J.: Attribution of atmospheric sulfur dioxide over the English Channel to dimethyl sulfide and changing ship emissions, Atmos. Chem. Phys., 16, 4771–4783, https://doi.org/10.5194/acp-16-4771-2016, 2016a.
Yang, M., Bell, T. G., Hopkins, F. E., Kitidis, V., Cazenave, P. W., Nightingale, P. D., Yelland, M. J., Pascal, R. W., Prytherch, J., Brooks, I. M., and Smyth, T. J.: Air–sea fluxes of CO2 and CH4 from the Penlee Point Atmospheric Observatory on the south-west coast of the UK, Atmos. Chem. Phys., 16, 5745–5761, https://doi.org/10.5194/acp-16-5745-2016, 2016b.
Yang, M., Prytherch, J., Kozlova, E., Yelland, M. J., Parenkat Mony, D., and Bell, T. G.: Comparison of two closed-path cavity-based spectrometers for measuring air–water CO2 and CH4 fluxes by eddy covariance, Atmos. Meas. Tech., 9, 5509–5522, https://doi.org/10.5194/amt-9-5509-2016, 2016c.
Yang, M., Bell, T. G., Brown, I. J., Fishwick, J. R., Kitidis, V., Nightingale, P. D., Rees, A. P., and Smyth, T. J.: Insights from year-long measurements of air–water CH4 and CO2 exchange in a coastal environment, Biogeosciences, 16, 961–978, https://doi.org/10.5194/bg-16-961-2019, 2019a.
Yang, M., Norris, S. J., Bell, T. G., and Brooks, I. M.: Sea spray fluxes from the southwest coast of the United Kingdom – dependence on wind speed and wave height, Atmos. Chem. Phys., 19, 15271–15284, https://doi.org/10.5194/acp-19-15271-2019, 2019b.
Zawadowicz, M. A., Suski, K., Liu, J., Pekour, M., Fast, J., Mei, F., Sedlacek, A. J., Springston, S., Wang, Y., Zaveri, R. A., Wood, R., Wang, J., and Shilling, J. E.: Aircraft measurements of aerosol and trace gas chemistry in the eastern North Atlantic, Atmos. Chem. Phys., 21, 7983–8002, https://doi.org/10.5194/acp-21-7983-2021, 2021.
- Abstract
- The North Atlantic climate system
- Composition datasets
- Ocean datasets
- Ice datasets
- Synergies with previously published work
- Code and data availability
- Summary
- Appendix A: Overview of select aircraft composition instruments
- Author contributions
- Competing interests
- Disclaimer
- Acknowledgements
- Financial support
- Review statement
- References


