the Creative Commons Attribution 4.0 License.
the Creative Commons Attribution 4.0 License.
A post-processed carbon flux dataset for 34 eddy covariance flux sites across the Heihe River basin, China
Xufeng Wang
Jingfeng Xiao
Tonghong Wang
Junlei Tan
Yang Zhang
Zhiguo Ren
Liying Geng
Haibo Wang
Ziwei Xu
Shaomin Liu
The eddy covariance (EC) technique is currently the most widely used method for measuring carbon exchange between terrestrial ecosystems and the atmosphere at the ecosystem scale. Using this technique, a regional carbon flux network comprising a total of 34 sites has been established in the Heihe River basin (HRB) in northwest China. This network has been measuring the net ecosystem exchange (NEE) of CO2 for a variety of vegetation types. In this study, we have compiled and post-processed half-hourly flux data from these 34 EC flux sites in the HRB to create a continuous, homogenized time series dataset. We employ standardized processing procedures to fill data gaps in meteorological and NEE measurements at half-hourly intervals. NEE measurements are also partitioned into gross primary production (GPP) and ecosystem respiration (Reco). Furthermore, half-hourly meteorological and NEE data are aggregated into daily, weekly, monthly, and yearly timescales. As a result, we produced a continuous carbon flux and auxiliary meteorological dataset, which includes 18 sites with continuous multi-year observations during 2008–2022 and 16 sites observed only during the 2012 growing season, amounting to a total of 1513 site months. Evapotranspiration and energy flux measurements are also included. Using the post-processed dataset, we explored the temporal and spatial characteristics of carbon exchange in the HRB. In the diurnal variation curve, GPP, net carbon uptake, and Reco peak later for ecosystems in the artificial oasis (cropland and wetlands) compared to those outside the artificial oasis (grassland, forest, woodland, and Gobi/desert). Seasonal net carbon uptake, GPP, and Reco peak in early July for grassland, forest, woodland, and cropland but remain close to zero throughout the year for Gobi/desert. In the last decade, net carbon uptake of wetlands has significantly increased, while NEE for other ecosystems has not exhibited significant trends. Annual net carbon uptake, GPP, and Reco are significantly higher for sites inside the artificial/natural oasis compared to those outside the oasis. This post-processed carbon flux dataset has numerous applications, including exploring the carbon exchange characteristics of alpine and arid ecosystems, analyzing ecosystem responses to climate extremes, conducting cross-site synthesis from regional to global scales, supporting regional and global upscaling studies, interpreting and calibrating remote sensing products, and evaluating and calibrating carbon cycle models. The dataset can be accessed at https://doi.org/10.11888/Terre.tpdc.301321 (Wang et al., 2024).
- Article
(9301 KB) - Full-text XML
- BibTeX
- EndNote
Terrestrial ecosystems absorb around 30 % of anthropogenic carbon emissions (Friedlingstein et al., 2023) and thereby play a crucial role in the global carbon cycle. However, due to the complexity of the terrestrial ecosystems, efforts to quantify their carbon uptake capacity still face significant challenges. The eddy covariance (EC) technique is currently the most widely used method to measure the carbon exchange between terrestrial ecosystems and the atmosphere at the ecosystem scale (Baldocchi et al., 2001), providing insights into terrestrial carbon uptake capacity. Numerous regional and global carbon flux networks, such as FLUXNET, AmeriFlux, ICOS, AsiaFlux, TERN-OzFlux, and ChinaFLUX, have been established to coordinate EC flux measurements across diverse terrestrial ecosystems. Despite the presence of over 1000 EC sites worldwide, these sites are predominantly located in North America, Europe, and east Asia (Pastorello et al., 2020). Many regions, such as northwest China and central Asia, remain underrepresented, which hinders accurate quantification of carbon sinks in these areas and global-scale synthesis and upscaling studies.
The Heihe River basin (HRB) is the second-largest inland river basin in China and serves as an ideal experimental region for studying the carbon cycle in northwest China (Cheng et al., 2014). Due to the significant gradients in elevation (ranging from 1500 m a.s.l. downstream to 5000 m a.s.l. upstream) and precipitation (from 50 mm downstream to 600 mm upstream), the HRB encompasses diverse landscapes, including snow/glacier, permafrost, alpine grassland, subalpine forest, irrigated cropland, riparian ecosystems, wetlands, and Gobi/desert from the upstream to the downstream (Li et al., 2013). A carbon flux observation network in the HRB was established through two comprehensive field experiments: the Watershed Allied Telemetry Experimental Research (WATER) conducted from 2007 to 2010 (Li et al., 2009) and the Heihe Watershed Allied Telemetry Experimental Research (HiWATER) conducted from 2012 to 2017 (Li et al., 2013).
There are a total of 34 sites in the Heihe carbon flux network (Liu et al., 2018), among which 10 are long-term observation sites, while the rest are temporary sites that have been dismantled. The network started observing carbon flux data in 2008, and the quality-controlled 30 min data are released annually by the National Tibetan Plateau Data Center. However, the released data contain numerous gaps due to instrument malfunctions and routine maintenance. Additionally, the net ecosystem exchange (NEE) has not been partitioned into gross primary productivity (GPP) and ecosystem respiration (Reco), two widely used carbon flux components in carbon cycle studies. These issues hinder the effective use of the dataset. To provide uniform and continuous carbon flux and auxiliary data, it is necessary to compile and post-process all the flux data in the HRB. Therefore, the objectives of this work are to (1) effectively fill the gaps in carbon flux data and auxiliary meteorological data of the Heihe carbon flux network and produce a high-quality, uniform, and continuous carbon flux dataset in the HRB; (2) partition the half-hourly NEE measurements into GPP and Reco; and (3) explore the diurnal, seasonal, and inter-annual variability of carbon flux across diverse ecosystems in the HRB based on the gap-filled, partitioned dataset.
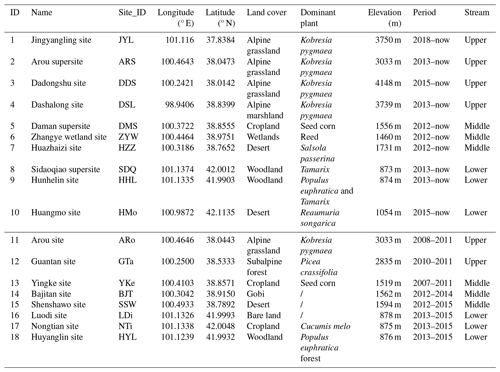
The Heihe carbon flux network encompasses the main ecosystem types in the HRB, including alpine grassland, subalpine forest, wetlands, irrigated cropland, riparian woody land, and Gobi/desert (Fig. 1). Detailed information on these sites is provided in Tables 1 and 2. The development of the Heihe carbon flux network has passed through three stages. The first stage spans from 2007 to 2011, during which the WATER experiment was conducted. During this period, the network comprised three sites: Arou site, Guantan site, and Yingke site (Table 1) (Li et al., 2009). These three sites were dismantled in 2012.
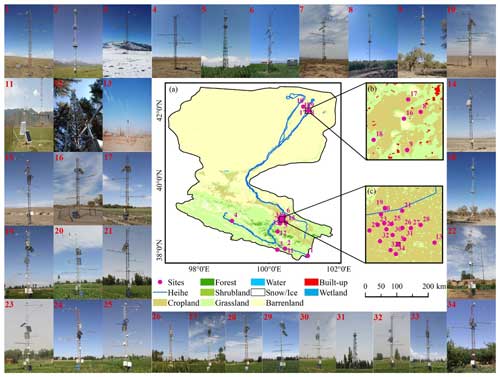
Figure 1Distribution of eddy covariance (EC) observation sites in the Heihe River basin (HRB). (a) EC site distribution map in the Heihe River basin with land cover as the background. Panels (b) and (c) show the distribution of the EC sites in the matrix experiment area in the middle reaches and core experiment area in the lower reaches. The photos labeled from 1 to 34 illustrate the underlying landscapes of the EC sites.
Table 2Information on sites in the eddy covariance matrix experiment in the middle reaches of the HRB in 2012.
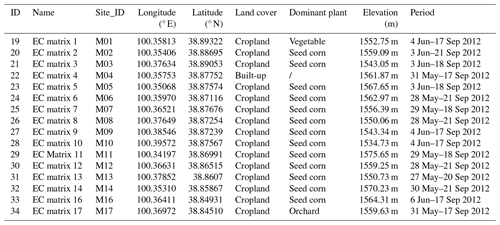
The second stage spans from 2012 to 2015 when the HiWATER experiment was conducted (Li et al., 2013; Liu et al., 2018). During this period, the Heihe carbon flux network underwent comprehensive updates. In 2012, five new flux sites were established in and around the artificial oasis in the middle reaches of the HRB: Daman supersite, Zhangye wetland site, Huazhaizi site, Bajitan site, and Shenshawo site (Table 1). Additionally, from May to September 2012, a flux matrix consisting of 17 sites was being set up in the middle-stream artificial oasis (Table 2). In the summer of 2013, three flux sites were established in the upstream areas of the HRB: Arou supersite, Dadongshu site, and Dashalong site (Table 1). Simultaneously, five sites were set up in the downstream areas of the HRB: Sidaoqiao supersite, Hunhelin site, Huyanglin site, Nongtian site, and Luodi site (Table 1).
The third stage spans from 2016 to the present, and the network was optimized to enhance its representativeness at the basin scale and to make maintenance more manageable (Liu et al., 2018). In 2016, four sites (Bajitan site, Shenshawo site, Luodi site, and Nongtian site) were dismantled, and two new flux sites were established: Huangmo site and Jingyangling site. Currently, 10 sites are operational as long-term observing sites, with 4 in the upper reaches (Arou supersite, Dashalong site, Dadongshu site, and Jingyangling site), 3 in the middle reaches (Daman supersite, Zhangye wetland site, and Huazhaizi site), and 3 in the lower reaches (Sidaoqiao supersite, Hunhelin site, and Huangmo site).
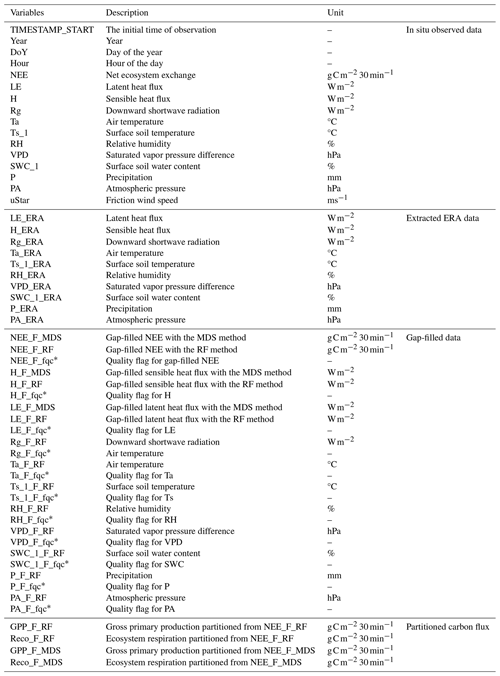
At each site of the carbon flux network in the HRB, flux and auxiliary meteorological factors, including CO2 flux (Fc), latent heat flux (LE), sensible heat flux (H), downward solar radiation (Rg), air temperature (Ta), soil temperature (Ts), relative humidity (RH), vapor pressure deficit (VPD), soil water content (SWC), precipitation (P), and atmospheric pressure (PA), are recorded half-hourly or processed to half-hourly data. The 30 min data have been performed quality control (Xu et al., 2020; Liu et al., 2018, 2023; Che et al., 2019) and released at the National Tibetan Plateau Data Center (TPDC, https://data.tpdc.ac.cn/zh-hans/topic/heihe, last access: 10 May 2024). This released half-hourly carbon flux and auxiliary data include a lot of gaps, and the NEE data are not partitioned into GPP and Reco.
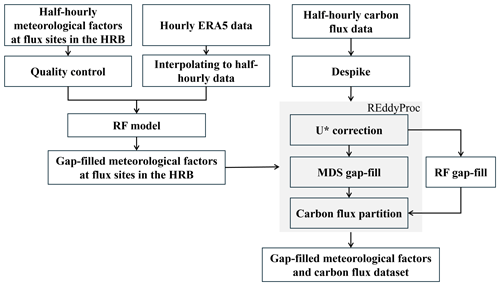
In this work, the data post-process includes three steps: (1) performing quality control on the auxiliary meteorological data and filling the gaps in the meteorological data by combining meteorological reanalysis data; (2) conducting quality control of the NEE measurements and filling the flux data gaps; and (3) partitioning the half-hourly NEE measurements to GPP and Reco. The flow diagram for the data post-processing is shown in Fig. 2.
3.1 Meteorological data post-processing
The half-hourly meteorological data underwent quality control to remove outliers, and only high-quality records were retained (Xu et al., 2020; Liu et al., 2018). In this work, we selected eight meteorological factors (Rg, Ta, Ts, RH, VPD, SWC, P, and PA) measured at the flux sites in the HRB for post-processing as these factors are highly related to carbon fluxes and are also available in the ERA5-Land (ECMWF Reanalysis v5) dataset. The ERA5-Land dataset is a global reanalysis dataset with a spatial resolution of 0.1° and temporal resolution of 1 h (Muñoz-Sabater et al., 2021). The corresponding factors were extracted from the ERA5-Land dataset according to the geographical coordinates of each site. To match the temporal resolution of the in situ observed data, the extracted hourly ERA5-Land data were linearly interpolated to half-hourly data for Rg, Ta, Ts, RH, VPD, SWC, and PA. For precipitation (P), linear interpolation could result in the overestimation of the yearly precipitation amount, and therefore the hourly precipitation was equally divided into two half-hour periods. After temporal matching between in situ observations and extracted ERA5-Land data, a random forest (RF) model was trained for each factor. In the RF model, the tree number (n_estimators) was set 800, the random_state variable was set to 30, test sample size was set to 0.3, and other parameters were kept at their default values as provided in the sklearn package. To further test the accuracy of the RF model in meteorological gap filling, 5 d of continuous artificial gaps were created in the meteorological factors, and these were then used to assess the performance of the gap-filling method. The RF model was able to accurately predict the missing meteorological observations for all variables except P using ERA5-Land variables as input (Fig. 3).
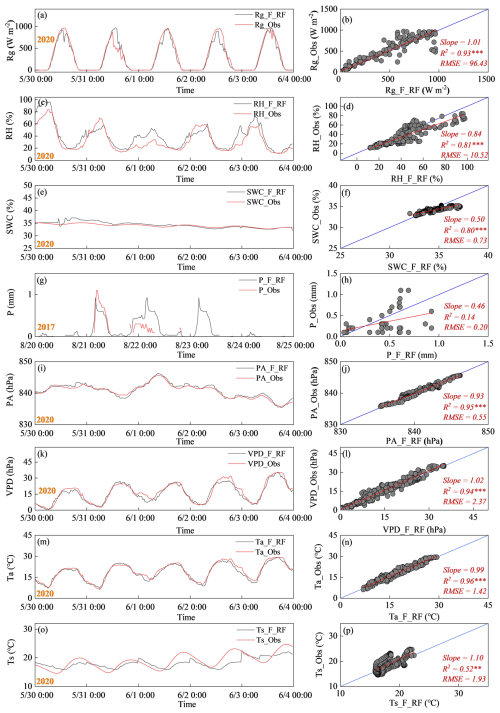
Figure 3The performance of RF models in the gap filling of the meteorological data. Rg: downward shortwave radiation, RH: relative humidity, SWC: soil water content, P: precipitation, PA: atmospheric pressure, VPD: vapor pressure deficit, Ta: air temperature, Ts: soil temperature. The suffix _Obs indicates the observed values. The suffix _RF indicates the random-forest-predicted values.
3.2 Carbon flux data post-processing
The original 10 Hz EC data were processed into 30 min flux data by Xu and Liu (Xu et al., 2020; Liu et al., 2018). Here, we further processed the 30 min data to obtain continuous GPP, NEE, and Reco. First, outliers in the 30 min NEE data were excluded based on a 3-standard-deviations criterion (Rousseeuw and Croux, 1993), which is a widely used method in meteorological aberrant values detection.
Second, to further exclude poor-quality NEE data, u∗ filtering was applied using the REddyProc package (Wutzler et al., 2018), a post-processing tool for half-hourly EC measurements. During the night, stable stratification often occurs, leading to the underestimation of nighttime NEE. This issue was identified by examining the relationship between NEE and u∗. Nighttime NEE values with u∗ lower than a threshold u∗ were filtered as invalid. A revised breakpoint detection method (Barr et al., 2013) in the REddyProc package was used to determine the threshold u∗. After u∗ filtering, the gaps in the half-hourly data increased.
Third, it was necessary to fill these gaps to obtain continuous NEE data. In this study, both marginal distribution sampling (MDS) (Reichstein et al., 2005) and RF are implemented to fill the gaps by combining gap-filled Rg, Ta, and VPD data with valid NEE data. The MDS method fills half-hourly NEE gaps using different schemes depending on the availability of meteorological data and is included in REddyProc package. For the RF method, a RF model is built using high-quality observed NEE and auxiliary meteorological factors (Rg, Ta, and VPD). This model is then used to fill the NEE gaps by inputting the gap-filled Rg, Ta, and VPD data. Since the MDS method uses Rg, Ta, and VPD to fill the gaps, we built the RF gap-filling model using the same three variables. Additionally, Rg, Ta, and VPD are the main factors that control ecosystem carbon exchange. The RF model settings are identical to those used for meteorological data gap filling. Both MDS and RF are effective in filling the gaps in NEE, with R2 values of 0.77 for MDS and 0.84 for RF between the filled and observed values (Fig. 4). While RF can fill all the gaps in NEE, MDS still leaves some large gaps unfilled (Fig. 5).
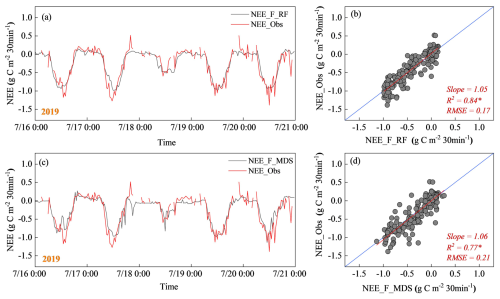
Figure 4The performance of RF models in carbon flux gap filling. The suffix _Obs indicates the observed values. The suffix _RF indicates the gap-filled values acquired by the random forest method. The suffix _MDS indicates the gap-filled values acquired by the MDS method.
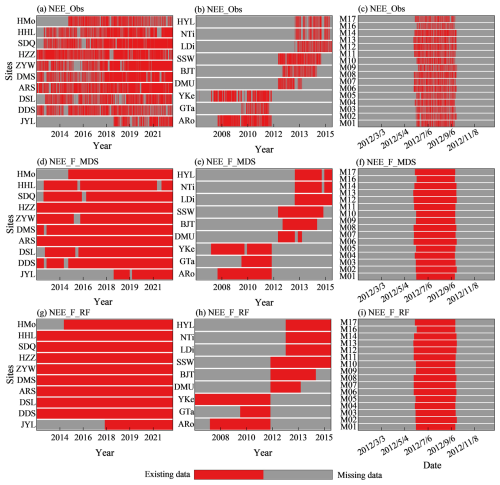
Figure 5Data gaps in NEE before and after gap filling. The suffix _Obs indicates the observed values. The suffix _RF indicates the gap-filled values with the random forest method. The suffix _MDS indicates the gap-filled values with the MDS method.
Fourth, the gap-filled NEE data are partitioned into GPP and Reco, two critical variables in carbon cycle studies. The NEE partitioning is also performed using the REddyProc package. During nighttime (), NEE equals Reco because there is no photosynthesis. The Lloyd–Taylor respiration function (Lloyd and Taylor, 1994) was fitted using nighttime NEE and Ta. This fitted Lloyd–Taylor respiration function was then applied to estimate daytime Reco, with GPP being the difference between Reco and NEE during the daytime (Wang et al., 2012).
To improve user convenience, the dataset variables were aggregated at multiple time intervals, including daily (_DD), weekly (_WW), monthly (_MM), and yearly (_YY). Variables such as GPP, Reco, NEE, and precipitation were aggregated over longer intervals using the sum. In contrast, variables like Rg, Ta, Ts, SWC, RH, VPD, PA, LE, and H were aggregated using the average.
Considering the close performance of the MDS and RF methods and the fact that the RF method can fill all gaps in the data, the subsequent analysis of carbon flux in the HRB is based on the RF results.
The post-processed dataset includes 34 sites with time spans ranging from a few months to 10 years. For each site, the data comprise both original and gap-filled auxiliary meteorological factors (downward solar radiation, Rg; air temperature, Ta; soil temperature, Ts; relative humidity, RH; soil water content, SWC; precipitation, P; and atmospheric pressure, PA) and flux data (net ecosystem exchange, NEE; gross primary productivity, GPP; ecosystem respiration, Reco; latent heat flux, LE; and sensible heat flux, H). The data are provided at multiple temporal scales: half-hourly (_HH), daily (_DD), weekly (_WW), monthly (_MM), and yearly (_YY). The folder for each specific site is named according to the following convention: Site_ID + start year + end year + temporal scale suffix. The data are saved in CSV format. Fields with the suffix _ERA indicate data extracted from ERA5-Land. Fields with the suffix _F represent gap-filled data. The explanation of the fields in the post-processed data is shown in Table 3.
5.1 Diurnal variations of carbon fluxes for various ecosystem types in the HRB
To explore the temporal dynamics of the carbon fluxes for diverse ecosystem types in the HRB, the carbon fluxes were averaged for different ecosystems, including subalpine forest, alpine grassland, cropland, wetlands, riparian woodland and Gobi/desert. The averaged diurnal cycle curves and statistic metrics of these ecosystems in the growing season (May to September) are shown in Fig. 6 and Table 4. The time mentioned in the text is in Beijing time (BJT), with 12:00 denoting noon and 00:00 midnight. Note that negative NEE values indicate net carbon uptake, while positive NEE values indicate net carbon release. Over the course of the diurnal cycle, NEE, GPP, and Reco varied greatly for subalpine forest, alpine grassland, cropland, and wetlands but only slightly for Gobi/desert. The half-hourly NEE reached a minimum (i.e., the largest net carbon uptake) at 11:30 for subalpine forest, alpine grassland, and riparian woodland; 12:30 for cropland; 13:00 for wetlands; and 11:30 for Gobi/desert. The GPP varied greatly in subalpine forest, alpine grassland, cropland, wetlands, and riparian woodland and kept a constant value close to zero in Gobi/desert. The half-hourly GPP reached a maximum at 23:30 for subalpine forest and alpine grassland; 12:30 for riparian woodland, cropland, and Gobi/desert; and 13:00 for wetlands. The half-hourly Reco reached a maximum at 16:30 for subalpine forest and Gobi/desert, 17:00 for riparian woodland, 15:30 for alpine grassland, and 16:00 for cropland and wetlands (Table 4 and Fig. 6).
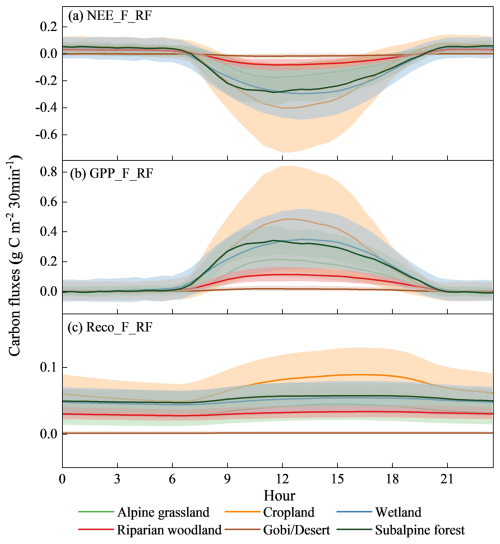
Figure 6Diurnal variation in the growing season of carbon fluxes of different ecosystems in the HRB. The time in the figure is in Beijing time (BJT).
Table 4Statistical metrics of carbon flux diurnal curves for ecosystems in the HRB. (NEEMin is the minimum NEE in diurnal course, and NEEMin time is the corresponding time. GPPMax is the maximum GPP in diurnal course, and GPPMax time is the corresponding time. RecoMax is the maximum Reco in diurnal course, and RecoMax time is the corresponding time. The unit for NEEMin, GPPMax, and RecoMax is g C m−2 30 min−1.

5.2 Seasonal variation of carbon fluxes for ecosystems in the HRB
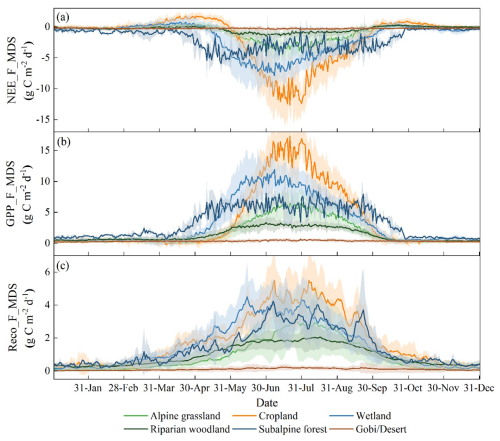
The 18 sites (Table 1) with more than 1 year of data were selected to explore the seasonal dynamics of carbon fluxes for different ecosystems in the HRB. These sites were grouped into six ecosystem types. The seasonal dynamics of carbon fluxes for these ecosystems are shown in Fig. 7.
Seasonal NEE varied significantly throughout the year for subalpine forest, alpine grassland, wetlands, cropland, and riparian woodland but remained close to 0 year-round for Gobi/desert. During the non-growing season, NEE was close to zero for all ecosystems except forest. In the transition period from the non-growing to the growing season, NEE slightly increased and became positive. During the growing season, NEE was notably less than zero for all ecosystems except Gobi/desert, indicating that these ecosystems except Gobi/desert exhibited net carbon uptake. The minimum net carbon uptake for all ecosystems occurred in July, with values of for subalpine forest, for riparian woodland, for alpine grassland, for cropland, for wetlands, and for Gobi/desert (Table 5).
Table 5Statistical metrics of carbon flux seasonal curves for ecosystems in the HRB. (NEEMean and NEEMin are the daily average and minimum NEE values over the year. GPPMean and GPPMax are the daily average and minimum GPP values over the year. RecoMean and RecoMax are the daily average and minimum GPP values over the year. The unit for NEEMean, NEEMin, GPPMean, GPPMax, RecoMean, and RecoMax is .)

Seasonal GPP also varied significantly throughout the year. During the non-growing season, GPP was very close to zero for all ecosystems except for subalpine forest. During the growing season, GPP was obviously higher than zero for all ecosystems except Gobi/desert. Seasonal GPP reached its maximum value in July, with values of 8.11 for subalpine forest, 3.08 for riparian woodland, 6.62 for alpine grassland, 16.84 for cropland, 10.98 for wetlands, and 0.75 for Gobi/desert (Table 5).
Seasonal Reco followed a temporal pattern similar to seasonal GPP. Reco also reached its maximum in July, with values of 3.93 for subalpine forest, 1.98 for riparian woodland, 2.96 for alpine grassland, 5.64 for cropland, 3.41 for wetlands, and 0.17 for Gobi/desert (Table 5).
5.3 Inter-annual variations of carbon fluxes for various ecosystem types in the HRB
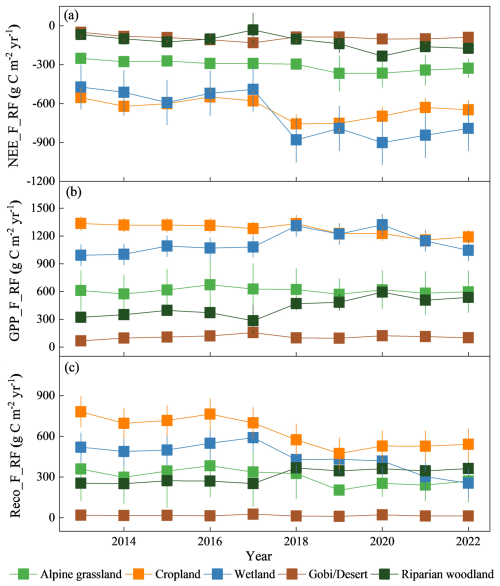
To explore the inter-annual variations of carbon fluxes in different ecosystem types of the HRB, nine sites with more than 7 years of data are selected. These sites are grouped into five ecosystem types. The yearly dynamics of GPP, Reco, and NEE is shown in Fig. 8.
The multi-year average NEE was in riparian woodland, in alpine grassland, in cropland, in wetlands, and in Gobi/desert. Yearly net carbon uptake was the highest in cropland and the lowest in Gobi/desert. Annual net carbon uptake of wetlands significantly increased during the last decade, while other ecosystems exhibited relatively stable NEE, with slight inter-annual variations (Fig. 8a). The multi-year average GPP was 431.47 for riparian woodland, 609.22 for alpine grassland, 1269.19 for cropland, 1127.88 for wetlands, and 108.22 for Gobi/desert. Over the last decade, the annual GPP of wetlands and riparian woodland slightly increased, while the GPP of other ecosystems remained relatively stable (Fig. 8b). The multi-year average Reco was 308.03 for riparian woodland, 301.38 for alpine grassland, 630.42 for cropland, 448.26 for wetlands, and 16.18 for Gobi/desert. The Reco in the HRB slightly decreased for cropland and wetlands but remained relatively stable for other ecosystem types over the last decade (Fig. 8c).
5.4 Spatial variations of carbon fluxes in the HRB
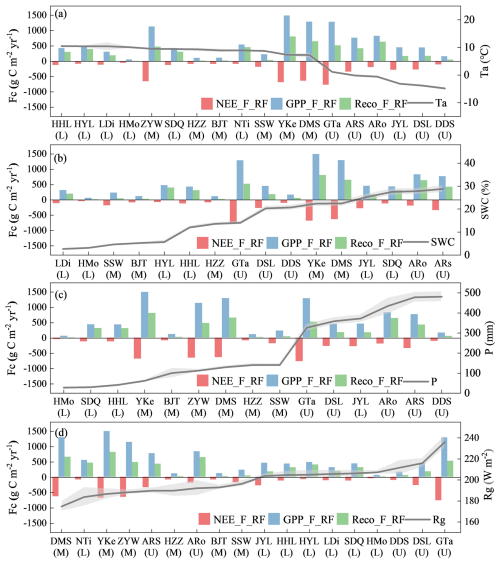
To examine the spatial patterns of carbon fluxes, the annual net carbon uptake, GPP, and Reco of the 18 sites with at least 1 year of data were compared. Annual NEE, GPP, and Reco of the 18 sites in the HRB are shown in Fig. 9. In the upper reaches of the river basin, annual NEE and GPP were the highest at the GTa site and the lowest at the DDS site. In the middle reaches, net carbon uptake and GPP were the highest at the ZYW, DMS, and YKe sites, which are in an artificial oasis. In the lower reaches, net carbon uptake and GPP were higher at HHL, HYL, SDQ, and NTi than at HMo and LDi. In the upper reaches, the net carbon uptake, GPP, and Reco generally increased with elevation. In the middle and lower reaches, net carbon uptake, GPP, and Reco of the sites inside the artificial/natural oasis were obviously higher than those of the sites outside the artificial/natural oasis.
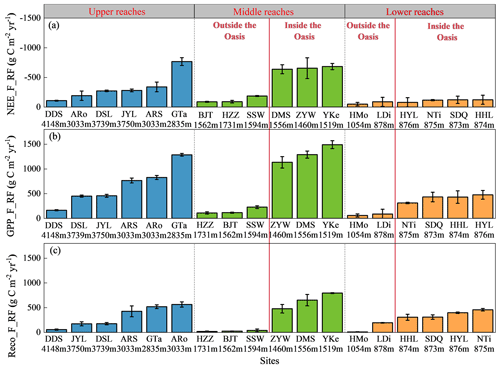
Figure 9Yearly carbon fluxes of the 18 sites with more than 1 year of data for the upper, middle, and lower reaches of the HRB. The number under each site ID indicates the elevation of the site.
To explore the carbon flux change along the environmental gradients, we sorted the carbon flux sites based on air temperature, precipitation, soil water content, and downward shortwave radiation. We then explored the carbon flux variation in relation to these four factors. The yearly average air temperature increases from the upper reaches to the middle and lower reaches of the HRB. However, the GPP, Reco, and NEE did not show a similar gradient pattern with air temperature. The GPP, Reco, and net carbon uptake were significantly higher at DMS, YKe, GTa, and ZYW than at other sites, and the temperature at these sites is at an intermediate level among all the sites (Fig. 10a). In the upper reaches of the HRB, the net carbon uptake, GPP, and Reco of the sites decreased as annual average temperature decreased, while in the middle and lower reaches of the HRB, NEE, GPP, and Reco did not change with the temperature gradient. NEE, GPP, and Reco generally follow the same spatial pattern, with higher carbon fluxes at sites with higher soil water content. The cropland and wetlands with irrigation in the middle reaches had the highest GPP, Reco, and net carbon uptake (Fig. 10b). Precipitation decreased from about 500 mm in the upper reaches to about 50 mm in the lower reaches of the HRB. The GPP, Reco, and NEE of these sites did not strictly increase or decrease with the spatial precipitation gradient (Fig. 10c). GPP, Reco, and NEE did not change with the gradient of Rg among the sites in the HRB (Fig. 10d).
6.1 Carbon flux pattern and its drivers in the HRB
EC-based carbon flux data are perhaps the most effective data source to quantify the carbon sequestration capacity of ecosystems at the ecosystem scale. As the HRB is a typical inland river basin, the temporal and spatial patterns of carbon fluxes in this region provide insight into the carbon dynamics of inland river basins in northwest China and central Asia more broadly.
The diurnal pattern of carbon flux shows that GPP and net carbon uptake peak around midday when downward shortwave radiation is at its highest, while Reco reaches its peak later in the afternoon when temperatures are at their maximum. This indicates that during the growing season, the diurnal NEE curve is primarily driven by GPP variations. The GPP diurnal pattern is largely influenced by downward shortwave radiation, whereas the Reco pattern is controlled by temperature (Kato et al., 2004). The half-hourly GPP and NEE of subalpine forest, riparian woodland, alpine grassland, and Gobi/desert peak slightly earlier than those of cropland and wetlands. This difference is likely due to the fact that cropland and wetlands are not limited by water or heat, whereas the other ecosystems experience stress caused by either heat or water (Lin et al., 2019).
The seasonal patterns of NEE, GPP, and Reco vary significantly among different ecosystems. In Gobi/desert, NEE, GPP, and Reco remain close to zero throughout the year due to sparse vegetation coverage and low soil organic matter content. For alpine grassland, net carbon uptake, GPP, and Reco begin to increase later in spring and decrease earlier in autumn compared to subalpine forest, wetlands, and riparian woodland. This can be attributed to the lower temperatures and higher elevations of alpine grassland (Wang et al., 2022). In cropland, NEE, GPP, and Reco also show a late start in spring and an early decline in autumn, which is mainly driven by agricultural management practices (Guo et al., 2021).
The upper reaches of the HRB are humid and cold, and the alpine grassland are weak carbon sinks, with an annual NEE range from −108 to . This is consistent with the previous studies on alpine grassland at the Haibei site (Zhao et al., 2005) and the Dangxiong site (Shi et al., 2006). The subalpine forest (Picea crassifolia) in the upper reaches is a strong carbon sink, with NEE of , which has been rarely reported on. The carbon flux in the upstream region of the HRB is mainly stressed by low temperature (Sun et al., 2019).
The middle reaches of the HRB are dry and hot, with significant differences in carbon fluxes between sites inside and outside the artificial oasis. Sites within the artificial oasis have a strong carbon uptake capacity, with NEE exceeding due to irrigation. In contrast, sites outside the artificial oasis have a very weak carbon uptake capacity, with NEE of less than . Inside the artificial oasis, high temperatures and high soil water content promote vegetation growth, while outside the artificial oasis, high temperatures and low soil water content inhibit vegetation growth. Due to intensive irrigation, the carbon fluxes of sites inside the artificial oasis are decoupled from precipitation in this region (Wang et al., 2019).
The lower reaches are even drier and hotter than the middle reaches in the HRB. The NEE of the sites in this region ranges from −49.72 to . The natural oasis in the lower reaches consists of riparian ecosystems distributed along the main river channels. Vegetation in the natural oasis survives by relying on a lateral water supply from the river channel and shallow groundwater. Vegetation in the natural oasis faces slightly severe water stress compared to vegetation in the artificial oasis in the middle reaches. The vegetation outside the natural oasis in the lower reaches faces more severe water stress than vegetation outside the artificial oasis in the middle reaches due to lower precipitation and soil water availability in the downstream region.
6.2 Possible sources of uncertainty in the carbon data in the HRB
Data post-processing can introduce uncertainties to carbon flux measurements. Due to instrument malfunctions and maintenance, data gaps are inevitable, yet continuous carbon flux data are essential for assessing an ecosystem's carbon uptake capacity. In post-processing, three key steps – u∗ correction, gap filling, and carbon flux partitioning – can result in uncertainties. The u∗ correction can filter out a large proportion of nighttime carbon flux data, with different methods yielding different u∗ thresholds and varying proportions of filtered data. This correction can impact data availability for building lookup tables or training models in the gap-filling process.
The gap-filling process uses mathematical methods aided by meteorological data to fill in missing data, which can introduce significant uncertainties. The MDS and random forest methods are the two primary techniques currently used for data gap filling (Zhu et al., 2022), and both are evaluated in this work for the HRB. The performance of MDS and random forest methods is very close, and both can effectively fill gaps in half-hourly NEE data. While previous studies have reported that MDS may systematically overestimate carbon emissions and underestimate CO2 sequestration (Vekuri et al., 2023), we did not observe this phenomenon in the HRB. However, MDS cannot effectively fill gaps longer than 2 weeks, whereas the RF method can fill all gaps if the corresponding auxiliary meteorological data are available.
The NEE partitioning method can also introduce uncertainties into GPP and Reco data (Tramontana et al., 2020). Although the nighttime-based method is recommended as a standard by FLUXNET, it has some limitations. It only considers temperature in the respiration estimation, neglecting other environmental factors that could influence respiration. Additionally, it does not account for variations in respiration between nighttime and daytime under different light conditions (Oikawa et al., 2017; Raj et al., 2016; Chen et al., 2024). Since direct measurements of GPP and Reco are difficult, especially in ecosystems with tall vegetation, assessing uncertainties in the NEE partitioning process remains challenging.
In addition to uncertainties introduced by data processing, harsh weather, complex terrain, and instrument maintenance can contribute to uncertainties in carbon flux observations in the HRB. In the upstream regions, extremely cold temperatures during the non-growing season can occasionally lead to frost formation on the gas analyzer, affecting the CO2 concentration signals. In the midstream and downstream areas, sandstorms can disrupt the optical path of the gas analyzer. Furthermore, finding large, flat, ideal locations for EC instrumentation can be challenging for certain ecosystems. For example, subalpine forest in the upstream area is primarily located on shaded hill slopes, suggesting that carbon fluxes at the GTa site may require additional processing to account for terrain effects. Additionally, instrument degradation and updates can introduce uncertainties or inconsistencies into the original observation data.
Data are fully public but should be appropriately referenced by citing this paper and the database (see Sect. 8). We suggest that researchers planning to use this dataset as a core dataset for their analysis contact and collaborate with the first or corresponding authors of this paper.
The post-processed carbon flux and auxiliary data in the HRB are available at https://doi.org/10.11888/Terre.tpdc.301321 (Wang et al., 2024).
Over the past decade, a comprehensive carbon flux network has been established in the Heihe River basin (HRB) in northwest China. In this study, carbon flux and auxiliary meteorological data from the network were post-processed to create an analysis-ready dataset. This dataset encompasses 34 sites across six dominant ecosystems in the HRB: alpine grassland, subalpine forest, cropland, wetlands, riparian woodland, and Gobi/desert. Overall, 18 of these sites have continuous multi-year observations, while 16 sites were observed only during the 2012 growing season, totaling 1513 site months. Based on this dataset, the following temporal and spatial characteristics of carbon exchange in the HRB were identified. (1) In the diurnal variation curve, GPP, NEE, and Reco peak later for ecosystems in the artificial oasis (cropland and wetlands) compared to those outside the artificial oasis (grassland, forest, woodland, and Gobi/desert). (2) Seasonal NEE, GPP, and Reco peak in early July for grassland, forest, woodland, and cropland, while they remain close to zero throughout the year for Gobi/desert. (3) In the last decade, NEE of wetlands significantly increased, while NEE for other ecosystems slightly fluctuated inter-annually. (4) NEE, GPP, and Reco are significantly higher for sites inside the artificial/natural oasis compared to those outside of it. This post-processed carbon flux dataset has many applications, e.g., exploring carbon exchange characteristic of alpine and arid ecosystem, ecosystem responses to climate extremes, cross-site synthesis at regional to global scales, regional and global upscaling studies, interpreting and calibrating remote sensing products, and evaluating and calibrating carbon cycle models.
XFW, TC, JFX, XL, and SML designed the research. XFW and THW processed and analyzed the data. JLT, YZ, ZGR, ZWX, LYG, and HBW collected the data, maintained carbon flux network in the HRB, and processed the original data. XFW, TC, THW, and JFX wrote the paper.
The contact author has declared that none of the authors has any competing interests.
Publisher's note: Copernicus Publications remains neutral with regard to jurisdictional claims made in the text, published maps, institutional affiliations, or any other geographical representation in this paper. While Copernicus Publications makes every effort to include appropriate place names, the final responsibility lies with the authors.
We thank all the scientists, engineers, and students who contributed to the establishment and maintenance of the carbon flux network in the Heihe River basin. We appreciate the contributions of the editors and reviewers to this paper.
This work has been supported by grants from the Key Research Program of Gansu Province (grant no. 23ZDKA0004); the Foundation for Distinguished Young Scholars of Gansu Province (grant no. 22JR5RA046); the funds of the National Natural Science Foundation of China (grant nos. 42371386 and U22A202690); the Program of the State Key Laboratory of Cryospheric Science and Frozen Soil Engineering, CAS (grant nos. CSFSE-ZQ-2408 and CSFSE-TZ-2409); and the Youth Innovation Promotion Association, CAS, to Xufeng Wang. (grant no. 2020422). Jingfeng Xiao was supported by the Iola Hubbard Climate Change Endowment managed by the Earth Systems Research Center at the University of New Hampshire.
This paper was edited by Bo Zheng and reviewed by Zheng Fu and Fei Li.
Baldocchi, D., Falge, E., Gu, L., Olson, R., Hollinger, D., Running, S., Anthoni, P., Bernhofer, C., Davis, K., Evans, R., Fuentes, J., Goldstein, A., Katul, G., Law, B., Lee, X., Malhi, Y., Meyers, T., Munger, W., Oechel, W., Paw U, K. T., Pilegaard, K., Schmid, H. P., Valentini, R., Verma, S., Vesala, T., Wilson, K., and Wofsy, S.: FLUXNET: A New Tool to Study the Temporal and Spatial Variability of Ecosystem-Scale Carbon Dioxide, Water Vapor, and Energy Flux Densities, B. Am. Meteorol. Soc., 82, 2415–2434, https://doi.org/10.1175/1520-0477(2001)082<2415:FANTTS>2.3.CO;2, 2001.
Barr, A., Richardson, A., Hollinger, D., Papale, D., Arain, M., Black, T., Bohrer, G., Dragoni, D., Fischer, M., and Gu, L.: Use of change-point detection for friction–velocity threshold evaluation in eddy-covariance studies, Agr. Forest Meteorol., 171, 31–45, https://doi.org/10.1016/j.agrformet.2012.11.023, 2013.
Che, T., Li, X., Liu, S., Li, H., Xu, Z., Tan, J., Zhang, Y., Ren, Z., Xiao, L., Deng, J., Jin, R., Ma, M., Wang, J., and Yang, X.: Integrated hydrometeorological, snow and frozen-ground observations in the alpine region of the Heihe River Basin, China, Earth Syst. Sci. Data, 11, 1483–1499, https://doi.org/10.5194/essd-11-1483-2019, 2019.
Chen, H., Li, H., Wei, Y., McBean, E., Liang, H., Wang, W., and Huang, J. J.: Partitioning eddy covariance CO2 fluxes into ecosystem respiration and gross primary productivity through a new hybrid four sub-deep neural network, Agr. Ecosyst. Environ., 361, 108810, https://doi.org/10.1016/j.agee.2023.108810, 2024.
Cheng, G., Li, X., Zhao, W., Xu, Z., Feng, Q., Xiao, S., and Xiao, H.: Integrated study of the water–ecosystem–economy in the Heihe River Basin, Natl. Sci. Rev., 1, 413–428, https://doi.org/10.1093/nsr/nwu017, 2014.
Friedlingstein, P., O'Sullivan, M., Jones, M. W., Andrew, R. M., Bakker, D. C. E., Hauck, J., Landschützer, P., Le Quéré, C., Luijkx, I. T., Peters, G. P., Peters, W., Pongratz, J., Schwingshackl, C., Sitch, S., Canadell, J. G., Ciais, P., Jackson, R. B., Alin, S. R., Anthoni, P., Barbero, L., Bates, N. R., Becker, M., Bellouin, N., Decharme, B., Bopp, L., Brasika, I. B. M., Cadule, P., Chamberlain, M. A., Chandra, N., Chau, T.-T.-T., Chevallier, F., Chini, L. P., Cronin, M., Dou, X., Enyo, K., Evans, W., Falk, S., Feely, R. A., Feng, L., Ford, D. J., Gasser, T., Ghattas, J., Gkritzalis, T., Grassi, G., Gregor, L., Gruber, N., Gürses, Ö., Harris, I., Hefner, M., Heinke, J., Houghton, R. A., Hurtt, G. C., Iida, Y., Ilyina, T., Jacobson, A. R., Jain, A., Jarníková, T., Jersild, A., Jiang, F., Jin, Z., Joos, F., Kato, E., Keeling, R. F., Kennedy, D., Klein Goldewijk, K., Knauer, J., Korsbakken, J. I., Körtzinger, A., Lan, X., Lefèvre, N., Li, H., Liu, J., Liu, Z., Ma, L., Marland, G., Mayot, N., McGuire, P. C., McKinley, G. A., Meyer, G., Morgan, E. J., Munro, D. R., Nakaoka, S.-I., Niwa, Y., O'Brien, K. M., Olsen, A., Omar, A. M., Ono, T., Paulsen, M., Pierrot, D., Pocock, K., Poulter, B., Powis, C. M., Rehder, G., Resplandy, L., Robertson, E., Rödenbeck, C., Rosan, T. M., Schwinger, J., Séférian, R., Smallman, T. L., Smith, S. M., Sospedra-Alfonso, R., Sun, Q., Sutton, A. J., Sweeney, C., Takao, S., Tans, P. P., Tian, H., Tilbrook, B., Tsujino, H., Tubiello, F., van der Werf, G. R., van Ooijen, E., Wanninkhof, R., Watanabe, M., Wimart-Rousseau, C., Yang, D., Yang, X., Yuan, W., Yue, X., Zaehle, S., Zeng, J., and Zheng, B.: Global Carbon Budget 2023, Earth Syst. Sci. Data, 15, 5301–5369, https://doi.org/10.5194/essd-15-5301-2023, 2023.
Guo, H., Li, S., Wong, F.-L., Qin, S., Wang, Y., Yang, D., and Lam, H.-M.: Drivers of carbon flux in drip irrigation maize fields in northwest China, Carbon Balance and Management, 16, 12, https://doi.org/10.1186/s13021-021-00176-5, 2021.
Kato, T., Tang, Y., Gu, S., Hirota, M., Cui, X., Du, M., Li, Y., Zhao, X., and Oikawa, T.: Seasonal patterns of gross primary production and ecosystem respiration in an alpine meadow ecosystem on the Qinghai-Tibetan Plateau, J. Geophys. Res.-Atmos., 109, D12109, https://doi.org/10.1029/2003JD003951, 2004.
Li, X., Li, X., Li, Z., Ma, M., Wang, J., Xiao, Q., Liu, Q., Che, T., Chen, E., and Yan, G.: Watershed allied telemetry experimental research, J. Geophys. Res.-Atmos., 114, D22103, https://doi.org/10.1029/2008JD011590, 2009.
Li, X., Cheng, G. D., Liu, S. M., Xiao, Q., Ma, M. G., Jin, R., Che, T., Liu, Q. H., Wang, W. Z., Qi, Y., Wen, J. G., Li, H. Y., Zhu, G. F., Guo, J. W., Ran, Y. H., Wang, S. G., Zhu, Z. L., Zhou, J., Hu, X. L., and Xu, Z. W.: Heihe Watershed Allied Telemetry Experimental Research (HiWATER): Scientific Objectives and Experimental Design, B. Am. Meteorol. Soc., 94, 1145–1160, https://doi.org/10.1175/Bams-D-12-00154.1, 2013.
Lin, C., Gentine, P., Frankenberg, C., Zhou, S., Kennedy, D., and Li, X.: Evaluation and mechanism exploration of the diurnal hysteresis of ecosystem fluxes, Agr. Forest Meteorol., 278, 107642, https://doi.org/10.1016/j.agrformet.2019.107642, 2019.
Liu, S., Li, X., Xu, Z., Che, T., Xiao, Q., Ma, M., Liu, Q., Jin, R., Guo, J., and Wang, L.: The Heihe Integrated Observatory Network: A basin-scale land surface processes observatory in China, Vadose Zone J., 17, 1–21, https://doi.org/10.2136/vzj2018.04.0072, 2018.
Liu, S., Xu, Z., Che, T., Li, X., Xu, T., Ren, Z., Zhang, Y., Tan, J., Song, L., Zhou, J., Zhu, Z., Yang, X., Liu, R., and Ma, Y.: A dataset of energy, water vapor, and carbon exchange observations in oasis–desert areas from 2012 to 2021 in a typical endorheic basin, Earth Syst. Sci. Data, 15, 4959–4981, https://doi.org/10.5194/essd-15-4959-2023, 2023.
Lloyd, J. and Taylor, J.: On the temperature dependence of soil respiration, Funct. Ecol., 8, 315–323, 1994.
Muñoz-Sabater, J., Dutra, E., Agustí-Panareda, A., Albergel, C., Arduini, G., Balsamo, G., Boussetta, S., Choulga, M., Harrigan, S., Hersbach, H., Martens, B., Miralles, D. G., Piles, M., Rodríguez-Fernández, N. J., Zsoter, E., Buontempo, C., and Thépaut, J.-N.: ERA5-Land: a state-of-the-art global reanalysis dataset for land applications, Earth Syst. Sci. Data, 13, 4349–4383, https://doi.org/10.5194/essd-13-4349-2021, 2021.
Oikawa, P. Y., Sturtevant, C., Knox, S. H., Verfaillie, J., Huang, Y. W., and Baldocchi, D. D.: Revisiting the partitioning of net ecosystem exchange of CO2 into photosynthesis and respiration with simultaneous flux measurements of 13CO2 and CO2, soil respiration and a biophysical model, CANVEG, Agr. Forest Meteorol., 234–235, 149–163, https://doi.org/10.1016/j.agrformet.2016.12.016, 2017.
Pastorello, G., Trotta, C., Canfora, E., Chu, H., Christianson, D., Cheah, Y.-W., Poindexter, C., Chen, J., Elbashandy, A., Humphrey, M., Isaac, P., Polidori, D., Reichstein, M., Ribeca, A., van Ingen, C., Vuichard, N., Zhang, L., Amiro, B., Ammann, C., Arain, M. A., Ardö, J., Arkebauer, T., Arndt, S. K., Arriga, N., Aubinet, M., Aurela, M., Baldocchi, D., Barr, A., Beamesderfer, E., Marchesini, L. B., Bergeron, O., Beringer, J., Bernhofer, C., Berveiller, D., Billesbach, D., Black, T. A., Blanken, P. D., Bohrer, G., Boike, J., Bolstad, P. V., Bonal, D., Bonnefond, J.-M., Bowling, D. R., Bracho, R., Brodeur, J., Brümmer, C., Buchmann, N., Burban, B., Burns, S. P., Buysse, P., Cale, P., Cavagna, M., Cellier, P., Chen, S., Chini, I., Christensen, T. R., Cleverly, J., Collalti, A., Consalvo, C., Cook, B. D., Cook, D., Coursolle, C., Cremonese, E., Curtis, P. S., D'Andrea, E., da Rocha, H., Dai, X., Davis, K. J., Cinti, B. D., Grandcourt, A. d., Ligne, A. D., De Oliveira, R. C., Delpierre, N., Desai, A. R., Di Bella, C. M., Tommasi, P. d., Dolman, H., Domingo, F., Dong, G., Dore, S., Duce, P., Dufrêne, E., Dunn, A., Dušek, J., Eamus, D., Eichelmann, U., ElKhidir, H. A. M., Eugster, W., Ewenz, C. M., Ewers, B., Famulari, D., Fares, S., Feigenwinter, I., Feitz, A., Fensholt, R., Filippa, G., Fischer, M., Frank, J., Galvagno, M., Gharun, M., Gianelle, D., Gielen, B., Gioli, B., Gitelson, A., Goded, I., Goeckede, M., Goldstein, A. H., Gough, C. M., Goulden, M. L., Graf, A., Griebel, A., Gruening, C., Grünwald, T., Hammerle, A., Han, S., Han, X., Hansen, B. U., Hanson, C., Hatakka, J., He, Y., Hehn, M., Heinesch, B., Hinko-Najera, N., Hörtnagl, L., Hutley, L., Ibrom, A., Ikawa, H., Jackowicz-Korczynski, M., Janouš, D., Jans, W., Jassal, R., Jiang, S., Kato, T., Khomik, M., Klatt, J., Knohl, A., Knox, S., Kobayashi, H., Koerber, G., Kolle, O., Kosugi, Y., Kotani, A., Kowalski, A., Kruijt, B., Kurbatova, J., Kutsch, W. L., Kwon, H., Launiainen, S., Laurila, T., Law, B., Leuning, R., Li, Y., Liddell, M., Limousin, J.-M., Lion, M., Liska, A. J., Lohila, A., López-Ballesteros, A., López-Blanco, E., Loubet, B., Loustau, D., Lucas-Moffat, A., Lüers, J., Ma, S., Macfarlane, C., Magliulo, V., Maier, R., Mammarella, I., Manca, G., Marcolla, B., Margolis, H. A., Marras, S., Massman, W., Mastepanov, M., Matamala, R., Matthes, J. H., Mazzenga, F., McCaughey, H., McHugh, I., McMillan, A. M. S., Merbold, L., Meyer, W., Meyers, T., Miller, S. D., Minerbi, S., Moderow, U., Monson, R. K., Montagnani, L., Moore, C. E., Moors, E., Moreaux, V., Moureaux, C., Munger, J. W., Nakai, T., Neirynck, J., Nesic, Z., Nicolini, G., Noormets, A., Northwood, M., Nosetto, M., Nouvellon, Y., Novick, K., Oechel, W., Olesen, J. E., Ourcival, J.-M., Papuga, S. A., Parmentier, F.-J., Paul-Limoges, E., Pavelka, M., Peichl, M., Pendall, E., Phillips, R. P., Pilegaard, K., Pirk, N., Posse, G., Powell, T., Prasse, H., Prober, S. M., Rambal, S., Rannik, Ü., Raz-Yaseef, N., Rebmann, C., Reed, D., Dios, V. R. d., Restrepo-Coupe, N., Reverter, B. R., Roland, M., Sabbatini, S., Sachs, T., Saleska, S. R., Sánchez-Cañete, E. P., Sanchez-Mejia, Z. M., Schmid, H. P., Schmidt, M., Schneider, K., Schrader, F., Schroder, I., Scott, R. L., Sedlák, P., Serrano-Ortíz, P., Shao, C., Shi, P., Shironya, I., Siebicke, L., Šigut, L., Silberstein, R., Sirca, C., Spano, D., Steinbrecher, R., Stevens, R. M., Sturtevant, C., Suyker, A., Tagesson, T., Takanashi, S., Tang, Y., Tapper, N., Thom, J., Tomassucci, M., Tuovinen, J.-P., Urbanski, S., Valentini, R., van der Molen, M., van Gorsel, E., van Huissteden, K., Varlagin, A., Verfaillie, J., Vesala, T., Vincke, C., Vitale, D., Vygodskaya, N., Walker, J. P., Walter-Shea, E., Wang, H., Weber, R., Westermann, S., Wille, C., Wofsy, S., Wohlfahrt, G., Wolf, S., Woodgate, W., Li, Y., Zampedri, R., Zhang, J., Zhou, G., Zona, D., Agarwal, D., Biraud, S., Torn, M., and Papale, D.: The FLUXNET2015 dataset and the ONEFlux processing pipeline for eddy covariance data, Scientific Data, 7, 225, https://doi.org/10.1038/s41597-020-0534-3, 2020.
Raj, R., Hamm, N. A. S., Tol, C. V. D., and Stein, A.: Uncertainty analysis of gross primary production partitioned from net ecosystem exchange measurements, Biogeosciences, 13, 1409–1422, https://doi.org/10.5194/bg-13-1409-2016, 2016.
Reichstein, M., Kätterer, T., Andrén, O., Ciais, P., Schulze, E.-D., Cramer, W., Papale, D., and Valentini, R.: Temperature sensitivity of decomposition in relation to soil organic matter pools: critique and outlook, Biogeosciences, 2, 317–321, https://doi.org/10.5194/bg-2-317-2005, 2005.
Rousseeuw, P. J. and Croux, C.: Alternatives to the median absolute deviation, J. Am. Stat. Assoc., 88, 1273–1283, 1993.
Shi, P., Sun, X., Xu, L., Zhang, X., He, Y., Zhang, D., and Yu, G.: Net ecosystem CO2 exchange and controlling factors in a steppe – Kobresia meadow on the Tibetan Plateau, Sci. China Ser. D, 49, 207–218, https://doi.org/10.1007/s11430-006-8207-4, 2006.
Sun, S., Che, T., Li, H., Wang, T., Ma, C., Liu, B., Wu, Y., and Song, Z.: Water and carbon dioxide exchange of an alpine meadow ecosystem in the northeastern Tibetan Plateau is energy-limited, Agr. Forest Meteorol., 275, 283–295, https://doi.org/10.1016/j.agrformet.2019.06.003, 2019.
Tramontana, G., Migliavacca, M., Jung, M., Reichstein, M., Keenan, T. F., Camps-Valls, G., Ogee, J., Verrelst, J., and Papale, D.: Partitioning net carbon dioxide fluxes into photosynthesis and respiration using neural networks, Glob. Change Biol., 26, 5235–5253, https://doi.org/10.1111/gcb.15203, 2020.
Vekuri, H., Tuovinen, J.-P., Kulmala, L., Papale, D., Kolari, P., Aurela, M., Laurila, T., Liski, J., and Lohila, A.: A widely-used eddy covariance gap-filling method creates systematic bias in carbon balance estimates, Sci. Rep.-UK, 13, 1720, https://doi.org/10.1038/s41598-023-28827-2, 2023.
Wang, H., Li, X., Xiao, J., Ma, M., Tan, J., Wang, X., and Geng, L.: Carbon fluxes across alpine, oasis, and desert ecosystems in northwestern China: The importance of water availability, Sci. Total Environ., 697, 133978, https://doi.org/10.1016/j.scitotenv.2019.133978, 2019.
Wang, S., Chen, W., Fu, Z., Li, Z., Wang, J., Liao, J., and Niu, S.: Seasonal and inter-annual variations of carbon dioxide fluxes and their determinants in an Alpine meadow, Front. Plant Sci., 13, 894398, https://doi.org/10.3389/fpls.2022.894398, 2022.
Wang, X., Ma, M., Huang, G., Veroustraete, F., Zhang, Z., Song, Y., and Tan, J.: Vegetation primary production estimation at maize and alpine meadow over the Heihe River Basin, China, Int. J. Appl. Earth Obs., 17, 94–101, https://doi.org/10.1016/j.jag.2011.09.009, 2012.
Wang, X., Che, C., Xiao, J., Wang, T., Tan, J., Zhang, Y., Ren, Z., Geng, L., Wang, H., Xu, Z., Liu, S., and Li, X.: A post-processed carbon flux dataset for 34 eddy covariance flux sites across the Heihe River Basin, China, National Tibetan Plateau Data Center [data set], https://doi.org/10.11888/Terre.tpdc.301321, 2024.
Wutzler, T., Lucas-Moffat, A., Migliavacca, M., Knauer, J., Sickel, K., Šigut, L., Menzer, O., and Reichstein, M.: Basic and extensible post-processing of eddy covariance flux data with REddyProc, Biogeosciences, 15, 5015–5030, https://doi.org/10.5194/bg-15-5015-2018, 2018.
Xu, Z., Liu, S., Zhu, Z., Zhou, J., Shi, W., Xu, T., Yang, X., Zhang, Y., and He, X.: Exploring evapotranspiration changes in a typical endorheic basin through the integrated observatory network, Agr. Forest Meteorol., 290, 108010, https://doi.org/10.1016/j.agrformet.2020.108010, 2020.
Zhao, L., Li, Y. N., Gu, S., Zhao, X. Q., Xu, S. X., and Yu, G. R.: Carbon dioxide exchange between the atmosphere and an alpine shrubland meadow during the growing season on the Qinghai-Tibetan Plateau, J. Integr. Plant Biol., 47, 271–282, https://doi.org/10.1111/j.1744-7909.2005.00066.x, 2005.
Zhu, S., Clement, R., McCalmont, J., Davies, C. A., and Hill, T.: Stable gap-filling for longer eddy covariance data gaps: A globally validated machine-learning approach for carbon dioxide, water, and energy fluxes, Agr. Forest Meteorol., 314, 108777, https://doi.org/10.1016/j.agrformet.2021.108777, 2022.


