the Creative Commons Attribution 4.0 License.
the Creative Commons Attribution 4.0 License.
 | 01 Apr 2025
A comprehensive in situ and remote sensing data set collected during the HALO–(𝒜 𝒞)3 aircraft campaign
Susanne Crewell
Andreas Herber
Marcus Klingebiel
Christof Lüpkes
Mario Mech
Sebastian Becker
Stephan Borrmann
Heiko Bozem
Matthias Buschmann
Hans-Christian Clemen
Elena De La Torre Castro
Henning Dorff
Regis Dupuy
Oliver Eppers
Florian Ewald
Geet George
Andreas Giez
Sarah Grawe
Christophe Gourbeyre
Jörg Hartmann
Evelyn Jäkel
Philipp Joppe
Olivier Jourdan
Zsófia Jurányi
Benjamin Kirbus
Johannes Lucke
Anna E. Luebke
Maximilian Maahn
Nina Maherndl
Christian Mallaun
Johanna Mayer
Stephan Mertes
Guillaume Mioche
Manuel Moser
Hanno Müller
Veronika Pörtge
Nils Risse
Greg Roberts
Sophie Rosenburg
Johannes Röttenbacher
Michael Schäfer
Jonas Schaefer
Andreas Schäfler
Imke Schirmacher
Johannes Schneider
Sabrina Schnitt
Frank Stratmann
Christian Tatzelt
Christiane Voigt
Andreas Walbröl
Anna Weber
Bruno Wetzel
Martin Wirth
Manfred Wendisch
The HALO–(𝒜𝒞)3 aircraft campaign was carried out in March and April 2022 over the Norwegian and Greenland seas, the Fram Strait, and the central Arctic Ocean. Three research aircraft – the High Altitude and Long Range Research Aircraft (HALO), Polar 5, and Polar 6 – performed 54 partly coordinated research flights on 23 flight days over areas of open ocean, the marginal sea ice zone (MIZ), and the central Arctic sea ice. The general objective of the research flights was to quantify the evolution of air mass properties during moist and warm-air intrusions (WAIs) and cold-air outbreaks (CAOs). To obtain a comprehensive data set, the three aircraft operated following different strategies. HALO was equipped with active and passive remote sensing instruments and dropsondes to cover the regional evolution of cloud and thermodynamic processes. Polar 5 carried a similar remote sensing payload to HALO, and Polar 6 was instrumented with in situ cloud, aerosol, and trace gas instruments focusing on the initial air mass transformation close to the MIZ. The processed, calibrated, and validated data are published in the World Data Center PANGAEA as instrument-separated data subsets and listed in aircraft-separated collections for HALO (Ehrlich et al., 2024a, https://doi.org/10.1594/PANGAEA.968885), Polar 5 (Mech et al., 2024a, https://doi.org/10.1594/PANGAEA.968883), and Polar 6 (Herber et al., 2024, https://doi.org/10.1594/PANGAEA.968884). A detailed overview of the available data sets is provided here. Furthermore, the campaign-specific instrument setup, the data processing, and quality are summarized. Based on measurements conducted during a specific CAO, it is shown that the scientific analysis of the HALO–(𝒜𝒞)3 data benefits from the coordinated operation of the three aircraft.
- Article
(11946 KB) - Full-text XML
- BibTeX
- EndNote


The Arctic is currently experiencing a strong warming that exceeds global warming by a factor of 2–4 (Rantanen et al., 2022). In addition to the remarkable sea ice retreat, the enhanced Arctic warming represents one of the most obvious results of Arctic-specific processes and feedback mechanisms causing significant climate changes in the Arctic that are widely referred to as Arctic amplification (Serreze et al., 2009). The effects and consequences of Arctic amplification have been extensively discussed in literature (e.g., Wendisch et al., 2023a). However, especially the role of clouds and air mass transport into and out of the Arctic and related transformation processes are still poorly understood. Therefore, in spring 2022 the HALO–(𝒜𝒞)3 campaign was conducted (Wendisch et al., 2021, 2024). HALO–(𝒜𝒞)3 combined aircraft-based, balloon-borne, and ground-based measurements, aiming to provide detailed observations of thermodynamic, cloud, aerosol, trace gas, and surface properties as they change during meridional air mass transport. Furthermore, the collected data will be compared to simulations conducted with numerical Arctic weather and climate models.
The focus area of HALO–(𝒜𝒞)3 was the North Atlantic Corridor of the Fram Strait between Greenland and Svalbard, also referred to as North Atlantic pathway, which is a major entrance/exit gate for air masses moving north or south between middle and high latitudes (Mewes and Jacobi, 2019; Dahlke et al., 2022; Papritz et al., 2022). In this region, warm and moist midlatitude air masses are pushed frequently northwards into the sea-ice-covered central Arctic (Pithan et al., 2018; Liang et al., 2023). Cold air masses moving southwards regularly form cold-air outbreaks (CAOs) over the open ocean (Dahlke et al., 2022). Due to the seasonally relatively stable sea ice edge in the Fram Strait and the permanent measurements collected on Svalbard, in particular at Ny-Ålesund research stations, this region has become a hot spot of Arctic research.
A series of airborne, ship-based, and ground-based campaigns, such as ASTAR (Arctic Study of Tropospheric Aerosol, Clouds and Radiation), ASCOS (Arctic Summer Cloud Ocean Study), ACLOUD (Arctic Cloud Observations Using airborne measurements during polar Day), PAMARCMiP (Polar Airborne Measurements and Arctic Regional Climate Model Simulation Project), Arctic Ocean 2018 expedition, AFLUX (Airborne measurements of radiative and turbulent Fluxes in the cloudy atmospheric boundary layer), NASCENT (Ny-Ålesund Aerosol Cloud Experiment), MOSAiC-ACA (Multidisciplinary drifting Observatory for the Study of Arctic Climate – Airborne observations in the Central Arctic), and COMBLE (Cold-Air Outbreaks in the Marine Boundary Layer Experiment) (Tjernström et al., 2014; Wendisch et al., 2019; Vüllers et al., 2021; Mech et al., 2022a; Pasquier et al., 2022; Geerts et al., 2022), have provided valuable data to enhance our understanding of the Arctic climate system and to validate and improve numerical Arctic weather models (e.g., Kretzschmar et al., 2020; McCusker et al., 2023; Solomon et al., 2023). However, most of the previous aircraft campaigns in the Fram Strait were limited to smaller areas due to restricted flight ranges of the involved planes, or they were focused on atmospheric processes over the open ocean, e.g., the downstream development of CAOs (Vüllers et al., 2021). Observations from ships such as MOSAiC (Shupe et al., 2022) provide longer-term measurements in the Arctic sea ice but are mostly restricted to the local scale. The permanent research stations on the ground are often influenced by orographic effects and are not always representative of the Arctic Ocean (Gierens et al., 2020). Therefore, the HALO–(𝒜𝒞)3 aircraft campaign was designed to combine different aircraft platforms, aiming for observations applying a quasi-Lagrangian approach.
To characterize air mass transformations and to quantify their consequences, measurements of thermodynamic parameters, cloud and aerosol particles properties, trace gas concentrations, and the radiative energy budget are of specific relevant. Especially close to the sea ice edge, these transformations can be fast, requiring small-scale observations (Murray-Watson et al., 2023; Kirbus et al., 2024c; Schirmacher et al., 2024). Therefore, three research aircraft equipped with state-of-the-art instrumentation were involved in HALO–(𝒜𝒞)3 to sample atmospheric parameters on different spatial scales and during different stages of air mass transformation (Wendisch et al., 2024).
The observations cover strong warm-air intrusions (WAIs), injecting warm and moist air into the central Arctic. Multiple cold-air outbreaks (CAOs) were characterized in their initial stage close to the sea ice edge by the instrumentation on Polar 5 and Polar 6. Partly, the Polar 5 and Polar 6 aircraft were flown in a quasi-Lagrangian perspective jointly with HALO. This approach allows one to quantify the air mass transformations by deriving changes in thermodynamic profiles, large-scale subsidence, and cloud properties over a period of 24 h. Individual events of high-latitude Arctic cirrus and the formation of a polar low are included in the data set. These synoptic events, the general meteorological conditions, and the sea ice distribution during HALO–(𝒜𝒞)3 are summarized and compared to the long-term climatology by Walbröl et al. (2024). They found that two WAI events were associated with an extraordinary strong moisture transport that led to record-breaking near-surface air temperatures and precipitation rates in Svalbard. Although these WAI events were followed by one of the longest CAO events on record, the entire campaign period was warmer than the climatological mean.
The collected aircraft-based data set includes a multitude of in situ and remote sensing instruments and provides measurements of thermodynamic quantities; the radiative energy budget; and cloud, aerosol, and trace gas properties. The aim of this paper is to give an overview of the available data sets of the aircraft-based measurements, their accessibility, and potential uncertainties that have to be considered when using the data. In Sect. 2 the general setup and an overview of the HALO–(𝒜𝒞)3 aircraft activities are summarized. The data sets and their availability are described in Sects. 3 and 4. To highlight the potential of merging the data of the different aircraft, Sect. 5 outlines examples of combined data analysis of one case study.
2.1 General setup
HALO–(𝒜𝒞)3 was designed as a concerted effort combining airborne, ground-based, and balloon-borne observations in the area around Svalbard and in the central Arctic. For the aircraft campaign in March and April 2022, the German High Altitude and Long Range Research Aircraft (HALO) operated by the German Aerospace Center (DLR; Krautstrunk and Giez, 2012) was equipped with a comprehensive suite of active and passive remote sensing instruments and dropsondes (Stevens et al., 2019). Based in Kiruna, northern Sweden, HALO with its extended flight range covered one of the major sectors of WAIs and CAOs (Mewes and Jacobi, 2019; Liang et al., 2023) and followed air masses into the central Arctic close to the North Pole (8000 km range in altitudes up to 13 km). The Polar 5 (remote sensing) and Polar 6 (in situ) aircraft of the Alfred Wegener Institute (AWI; Wesche et al., 2016) probed the lower troposphere out of Longyearbyen, Svalbard (1500 km range in altitudes up to 4 km). Both Polar 5 and Polar 6 aircraft mostly operated in the Fram Strait with a focus on the local transitions at the sea ice edge. Several coordinated flights between the three aircraft were conducted with Polar 6 sampling in situ aerosol, cloud, and precipitation particles within the boundary layer, Polar 5 observing clouds and precipitation from above roughly at 3 km altitude, and HALO providing the large-scale view following air masses with a quasi-Lagrangian flight strategy.
During the HALO–(𝒜𝒞)3 campaign period, an intensive atmospheric measurement program extending the permanent observations was conducted at the research base AWIPEV at Ny-Ålesund, Svalbard (78°55′ N, 11°55′ E; Neuber, 2006), jointly operated by the AWI and the French Polar Institute Paul-Émile Victor (IPEV). The tethered balloon BELUGA (Balloon-bornE moduLar Utility for profilinG the lower Atmosphere; Egerer et al., 2019) collected vertical profile data in the atmospheric boundary layer and the lower free troposphere from the ground to about 1 km height using sophisticated turbulence, radiation, and aerosol particle instrumentation (e.g., Pilz et al., 2023). An overview of the balloon-borne observations conducted during HALO–(𝒜𝒞)3 is given by Lonardi et al. (2024). During March and April 2022, the frequency of the regular radiosonde launches at AWIPEV was increased to six-hourly intervals. These data are published by Maturilli (2022a, b). A long-term data set of ground-based cloud remote sensing observations at AWIPEV is published by Chellini et al. (2023). To link the airborne measurements with the observations at AWIPEV, Polar 5 and Polar 6 regularly passed over the site during the outbound or inbound flights.
In parallel with HALO–(𝒜𝒞)3, the ISotopic Links to Atmospheric water's Sources (ISLAS; Sodemann, 2018) campaign and the airborne field campaign Arctic Cold Air Outbreak (ACAO; Raif et al., 2024) were performed. For ISLAS, the ATR-42 research aircraft operated by SAFIRE (French: Service des Avions Français Instrumentés pour la Recherche en Environnement; Lamorthe et al., 2016) was deployed with in situ cloud, aerosol, and trace gas probes and remote sensing instruments. ACAO used the BAE-146 operated by the Facility for Airborne Atmospheric Measurements (FAAM) to measure cloud, aerosol, and atmospheric quantities. Both aircraft were stationed in Kiruna and mostly operated in low altitudes between Svalbard and northern Scandinavia. To combine the efforts, HALO, ATR-42, and BAE-146 were coordinated in four flights.
2.2 Overview of flight activities
An overview of all HALO–(𝒜𝒞)3 research flights including information on the coordination and dropsondes is provided in Table 1; the flight tracks are illustrated in Fig. 1. In total, HALO performed 17 research flights (RFs), while Polar 5 and Polar 6 conducted 13 flights each. Nine HALO flights were coordinated with Polar 5 and/or Polar 6. For close spatial and temporal coordination of the three aircraft, a standard leg (SL) between two fixed waypoints (79°24′ N, 7° 37′ E and 79°56′ N, 1°31′ E) was defined and repeatedly implemented in the flight planning. This straight SL connects areas of open ocean to the east and the dense sea ice further west. Most of the time, the SL crossed the main direction of air mass advection in the boundary layer (Walbröl et al., 2024) and, therefore, allowed for detailed sampling of air masses crossing the sea ice edge. Four HALO flights were coordinated with the ATR-42 and/or BAE-146 aircraft, providing additional in situ cloud observations. For all research flights, individual flight reports were compiled by the team of participants and are published by Ehrlich et al. (2024c). These reports summarize the general objective of the research flights; motivate the flight pattern in combination with the current synoptic weather conditions; and provide notes by the instrument operators, quicklooks, and images from the flights. To identify how the flights were affected by the general meteorological and sea ice conditions during HALO–(𝒜𝒞)3, the reader is referred to Walbröl et al. (2024).
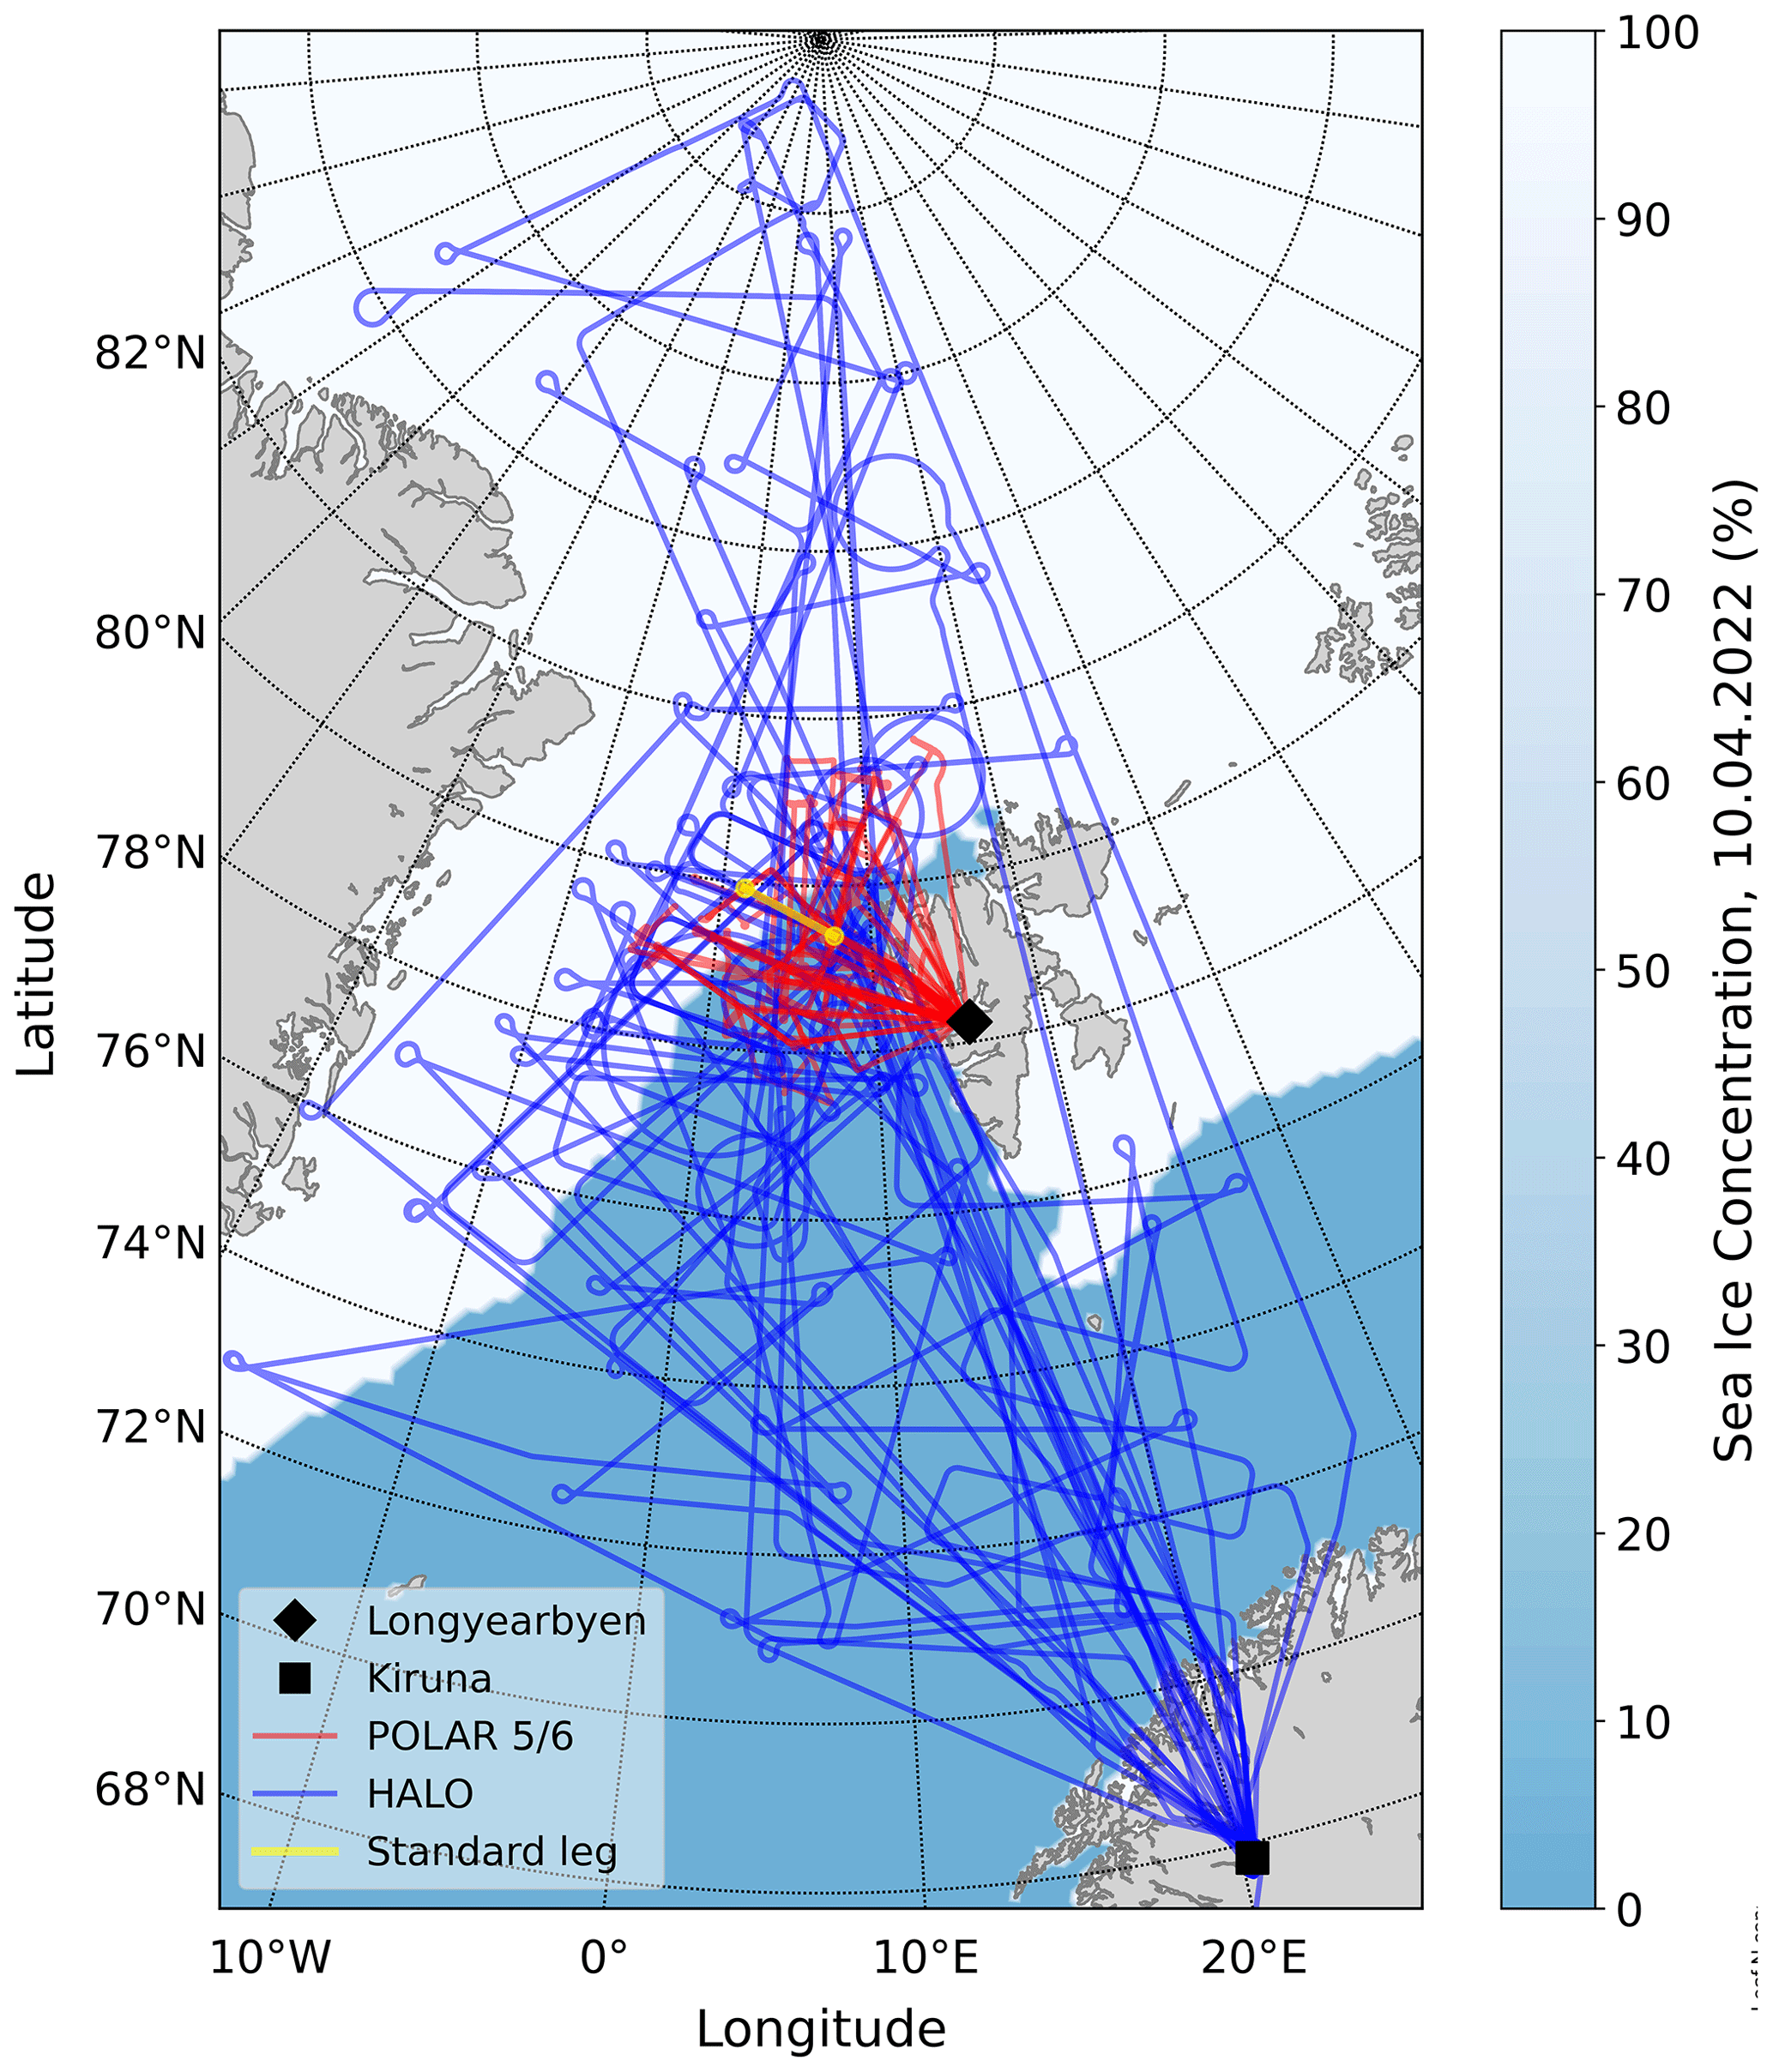
Figure 1Distribution of the flight tracks of all aircraft, Polar 5 and Polar 6 (red), and HALO (blue) during HALO–(𝒜𝒞)3. The sea ice cover corresponds to the middle of the campaign period: 30 March 2022. The yellow line indicates the standard flight leg.
Table 1Overview of HALO–(𝒜𝒞)3 research flights, including the research flight (RF) number and information on the coordination of HALO with the Polar 5 (P5), Polar 6 (P6), BAE-146, and ATR-42 aircraft. Flights covering the standard leg (SL) and overpasses of Polar 5 over AWIPEV station in Ny-Ålesund (NyÅ) are indicated. The number of successfully launched dropsondes from Polar 5 and HALO is given. For HALO dropsondes, the number of launches used in the Global Telecommunication System (GTS) data assimilation is specified in brackets.
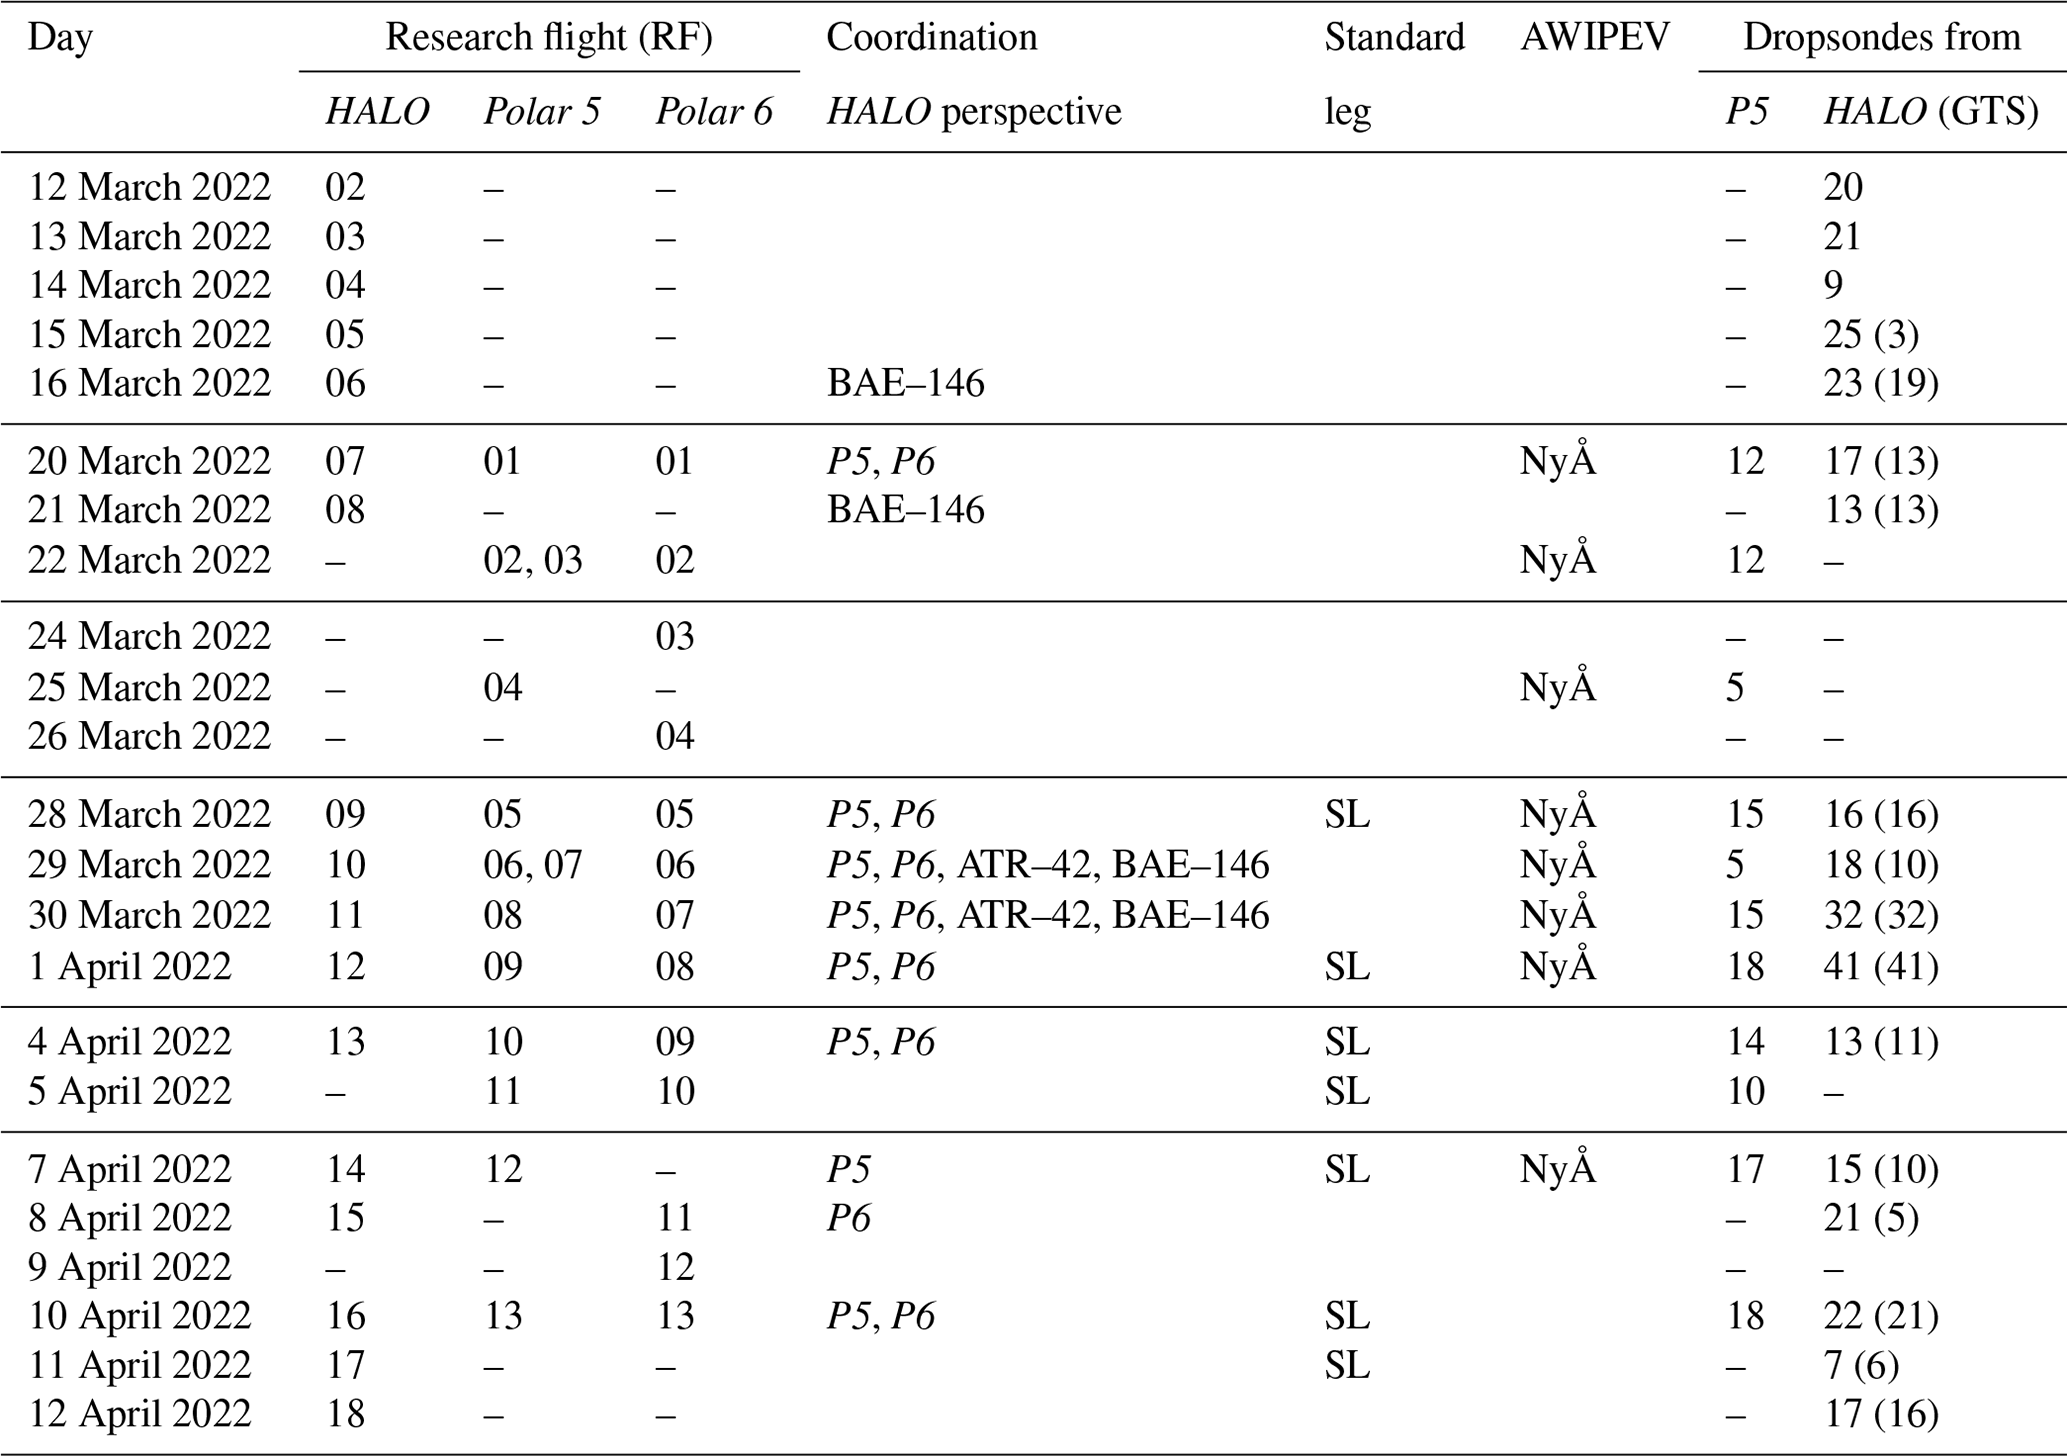
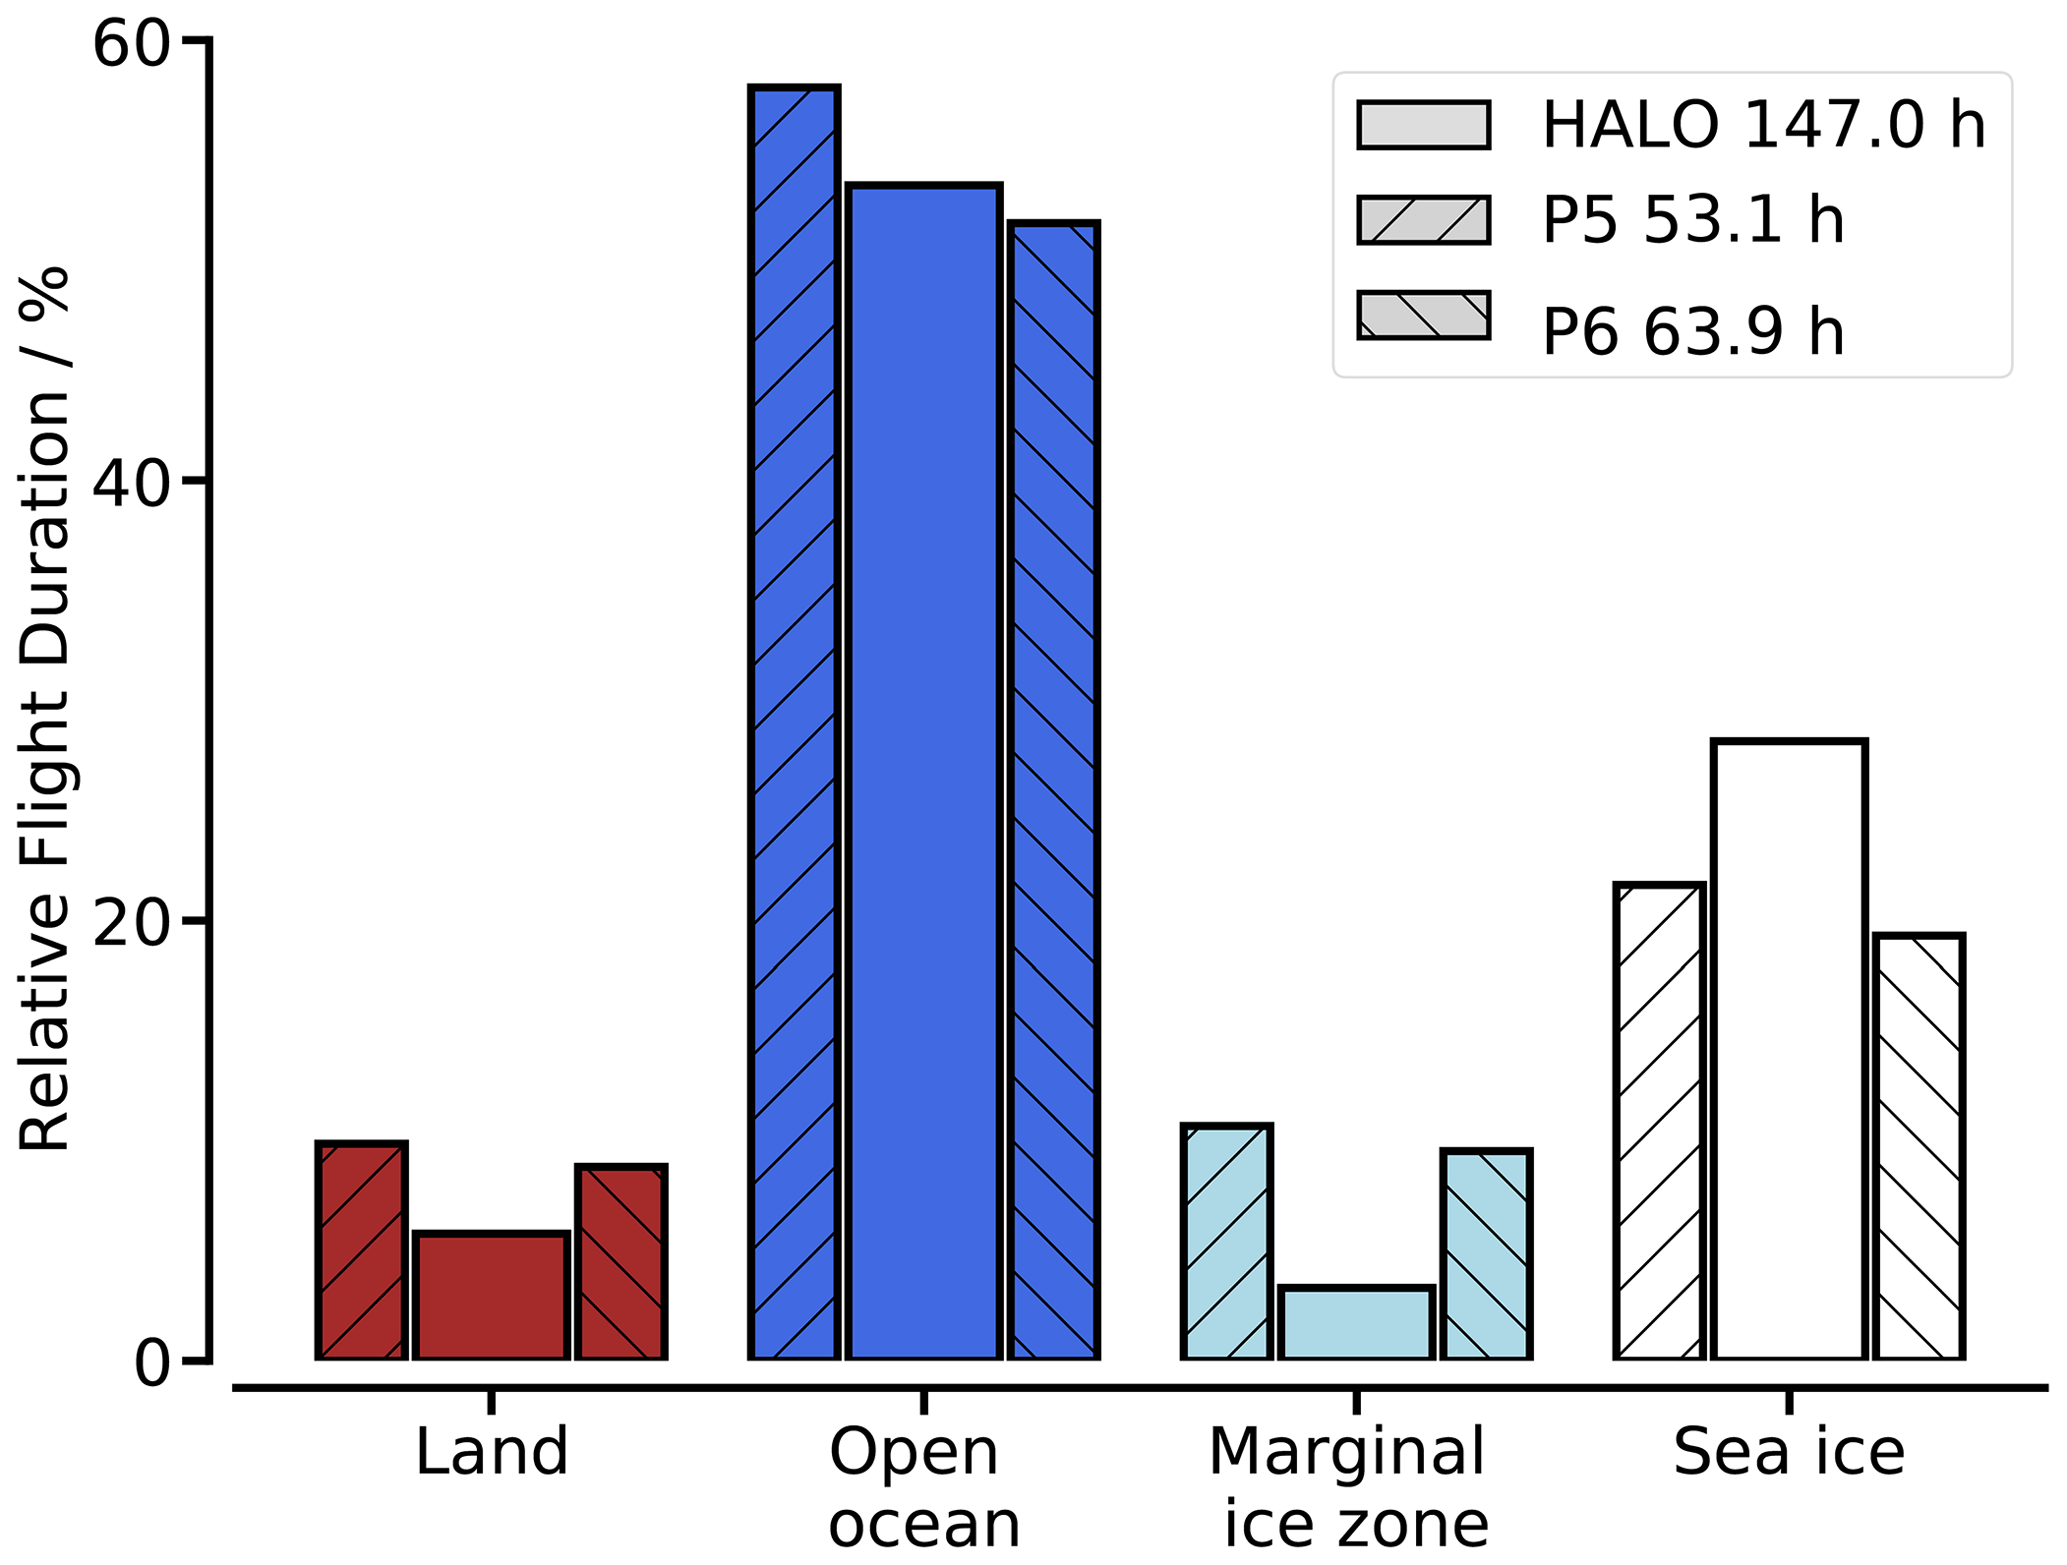
Figure 2Classification of flight times over specific surface types separated for all aircraft individually.
In total, the measurement time of HALO amounts to 143 h, covering a distance of 113 000 km. Polar 5 and Polar 6 operated for about 53 and 64 h, respectively. Due to the lower flight speed of the Polar 5 and Polar 6 aircraft, this corresponds to a distance of 36 000 km for each aircraft. The spatial distribution of measurements is illustrated in Fig. 1 and shows a focus of measurements around the sea ice edge in the Fram Strait. This accumulation mostly results from Polar 5 and Polar 6 flights and the intense coordination with HALO in this region. The SL features the highest density of measurements, as it was flown in collocation during five flights. The flights covered different surface conditions, including snow-covered land, open ocean, closed sea ice, and the marginal sea ice zone (MIZ), as summarized for each aircraft in Fig. 2. The classification uses satellite observations of sea ice concentrations provided by the Advanced Microwave Scanning Radiometer (AMSR-II; Spreen et al., 2008). The definition of the MIZ follows the common thresholds of sea ice concentration between 15 % and 80 % (Strong et al., 2017). With above 50 % of the flight time, open ocean is the dominant surface type observed by the three aircraft. Due to the longer endurance, HALO covered a higher fraction of observations over sea ice (30 % of total flight time) than Polar 5 and Polar 6 (20 %). The MIZ was sampled more intensively with Polar 5 and Polar 6. A similar amount of flight time of Polar 5 and Polar 6 was spent over land to coordinate with the columnar observations performed at AWIPEV in Ny-Ålesund. Vertically, the flight altitudes of all three aircraft were well separated. HALO stayed mostly at 9–13 km altitude for remote sensing measurements, while Polar 5 also conducted remote sensing observations at 3 km altitude. To quantify the surface energy budget, Polar 5 measured in low altitudes close to the surface during two flights. Polar 6 frequently changed altitude mostly in the atmospheric boundary layer between 0.1 and 2 km and regularly (once a flight) profiled the atmosphere up to 4 km altitude.
2.3 Instrumentation
HALO–(𝒜𝒞)3 made use of the collective experience of the author team in the past when Polar 5, Polar 6, and HALO were applied for atmospheric research and adapted the instrumentation from previous campaigns. HALO was set up for cloud and atmospheric remote sensing observations from high altitudes and in situ sampling of basic atmospheric parameters by dropsondes. The instrumentation on board HALO is listed in Table 2. It is identical to the cloud observatory instrument package applied in a series of missions such as the Next Generation Remote Sensing for Validation Studies (NARVAL) observations and the Elucidating the role of cloud–circulation coupling in climate (EUREC4A) campaign (Stevens et al., 2019; Konow et al., 2021).
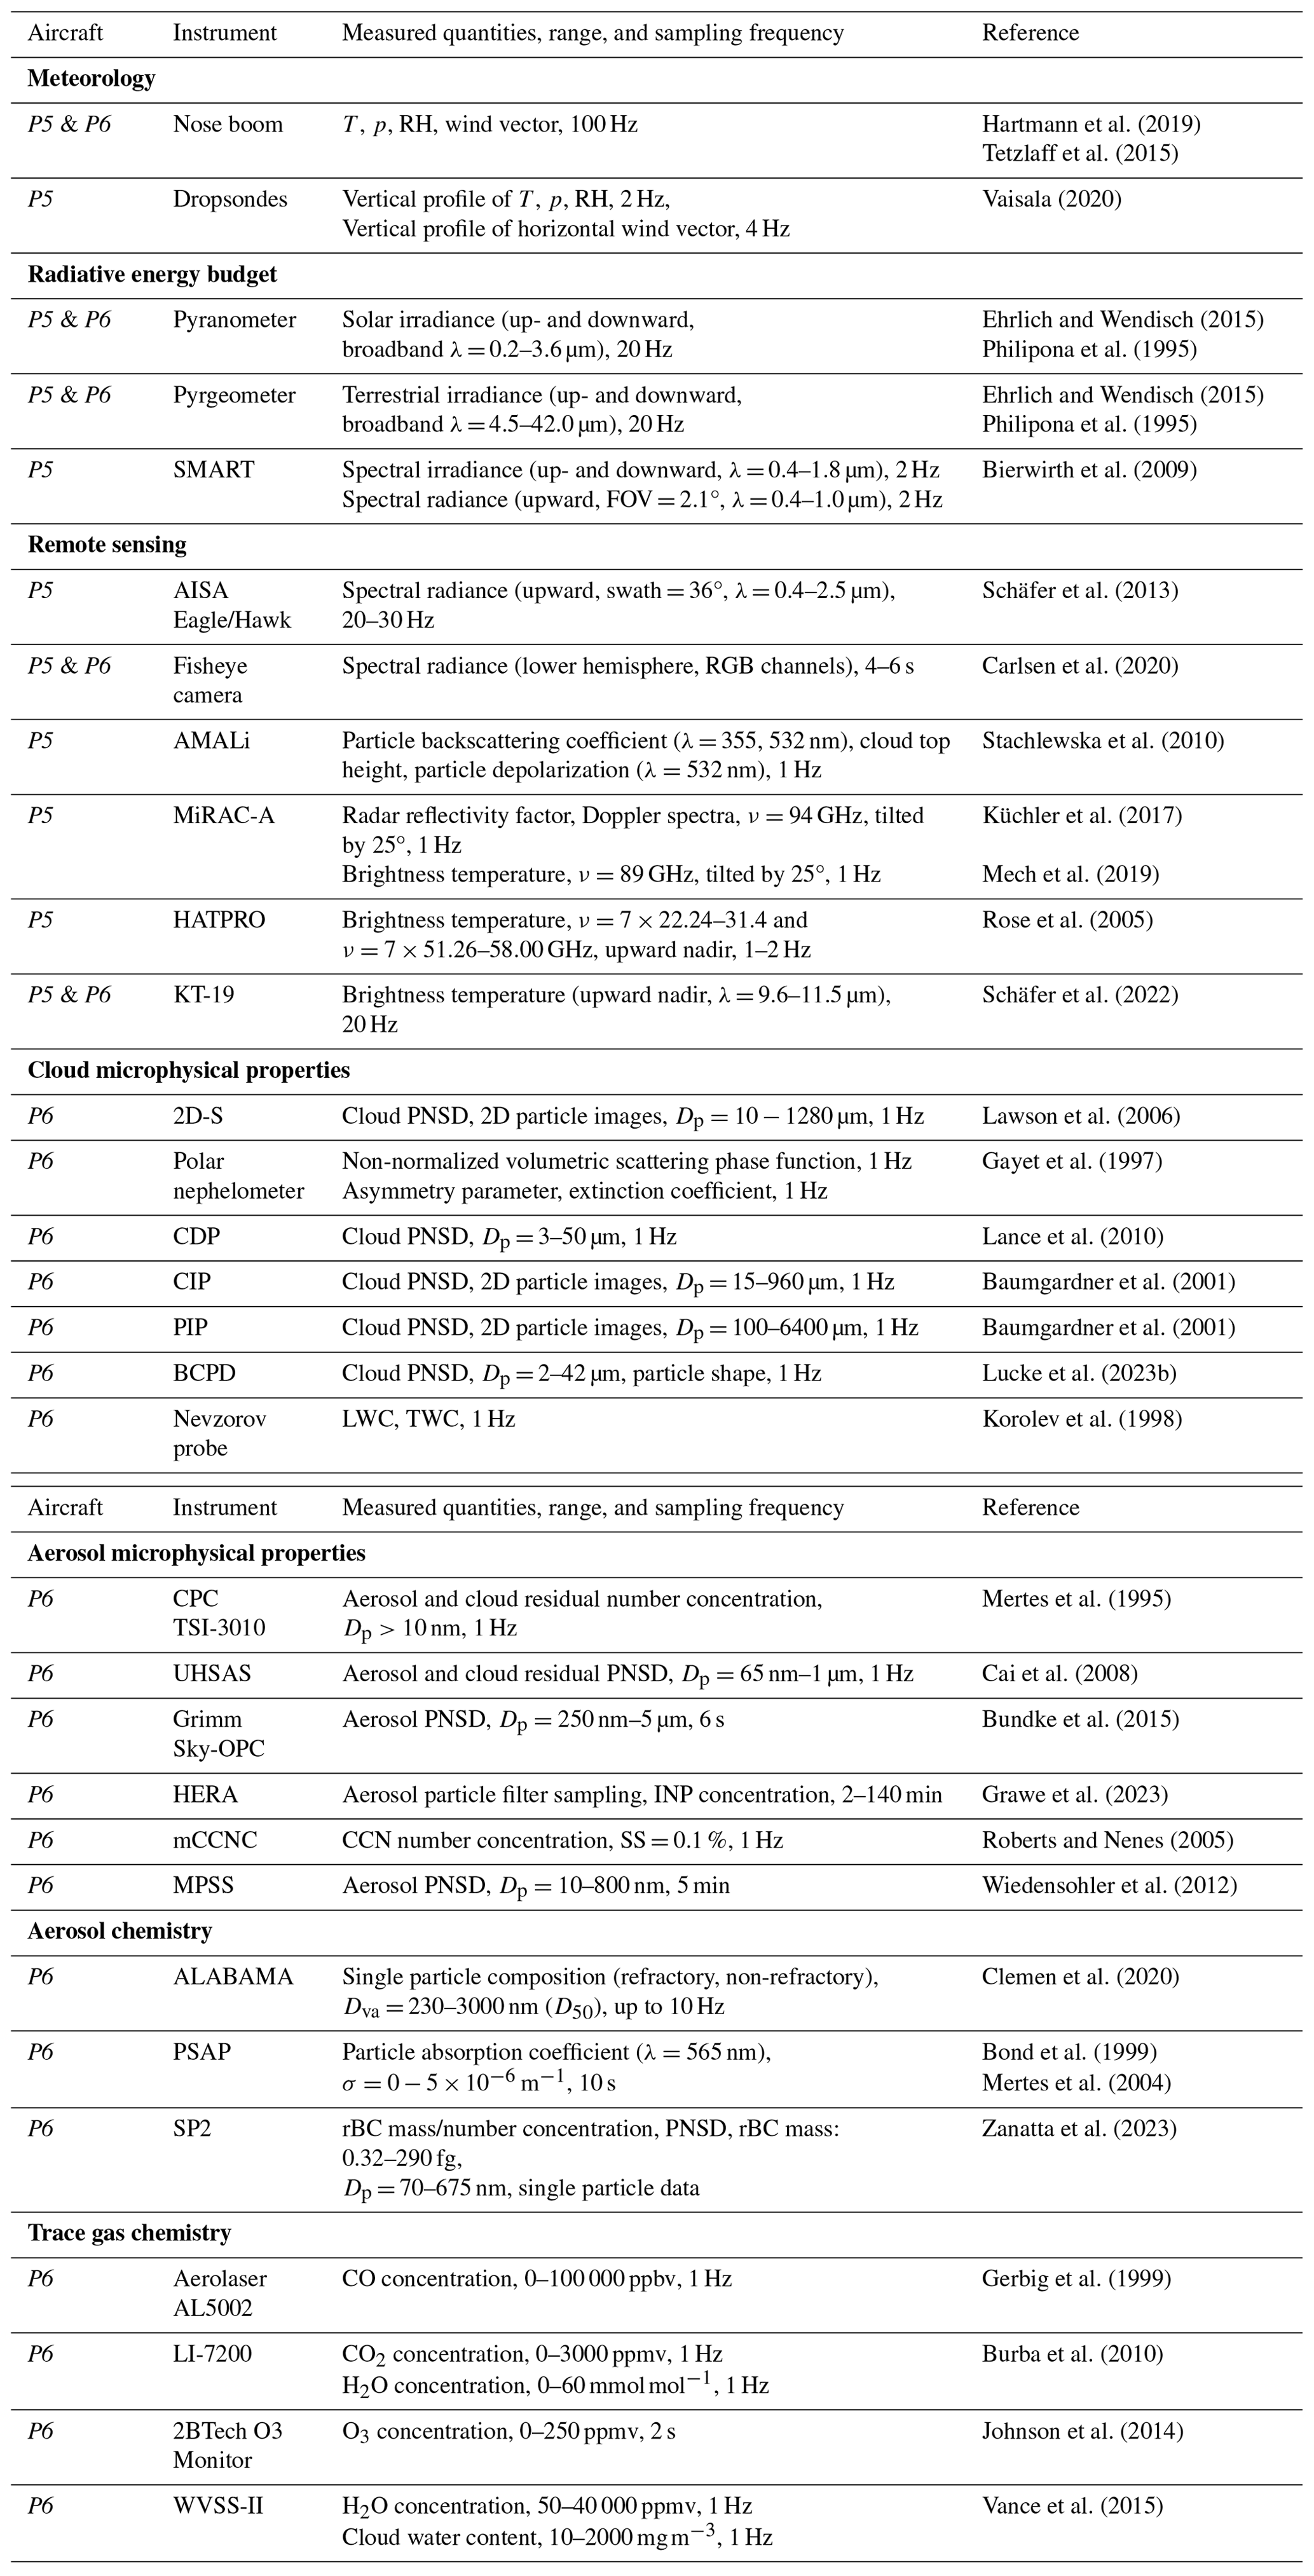
On Polar 5 and Polar 6, separate payloads for remote sensing (Polar 5) and in situ measurements (Polar 6) were installed in a similar configuration to that operated during ACLOUD (Ehrlich et al., 2019). The instruments on board Polar 5 and Polar 6 are listed in Table , including the main measured quantities and references providing detailed descriptions of the instruments and their uncertainties. Basic measurements of meteorological parameters and the radiative energy budget were conducted on both aircraft. The remote sensing (Polar 5) and cloud microphysical instruments (Polar 6) were operated with an almost identical setup to that used during the AFLUX and MOSAiC-ACA campaigns (Mech et al., 2022a). For HALO–(𝒜𝒞)3, the cloud microphysical devices were extended by a Back-scatter Cloud Probe with Polarization Detection (BCPD; Beswick et al., 2014). One major change in the Polar 6 instrumentation compared to Ehrlich et al. (2019) was in the aerosol particle microphysical instrumentation. The second ultra-high-sensitivity aerosol spectrometer (UHSAS) was replaced by the High-volume flow aERosol particle filter sAmpler (HERA), a mobility particle size spectrometer (MPSS), and a miniature cloud condensation nuclei counter (mCCNC).
Giez et al. (2021, 2023)Vaisala (2020)Ehrlich et al. (2023)Ehrlich et al. (2023)Wolf et al. (2019)Wirth et al. (2009)Mech et al. (2014)Mech et al. (2014)Ewald et al. (2016)Weber et al. (2024c)Schäfer et al. (2022)Schäfer et al. (2022)Table 2Overview of the instrumentation of HALO and the measured quantities that are part of the database. λ is wavelength, ν is frequency, T is air temperature, and p is atmospheric pressure. RH is relative humidity, and FOV is field of view.
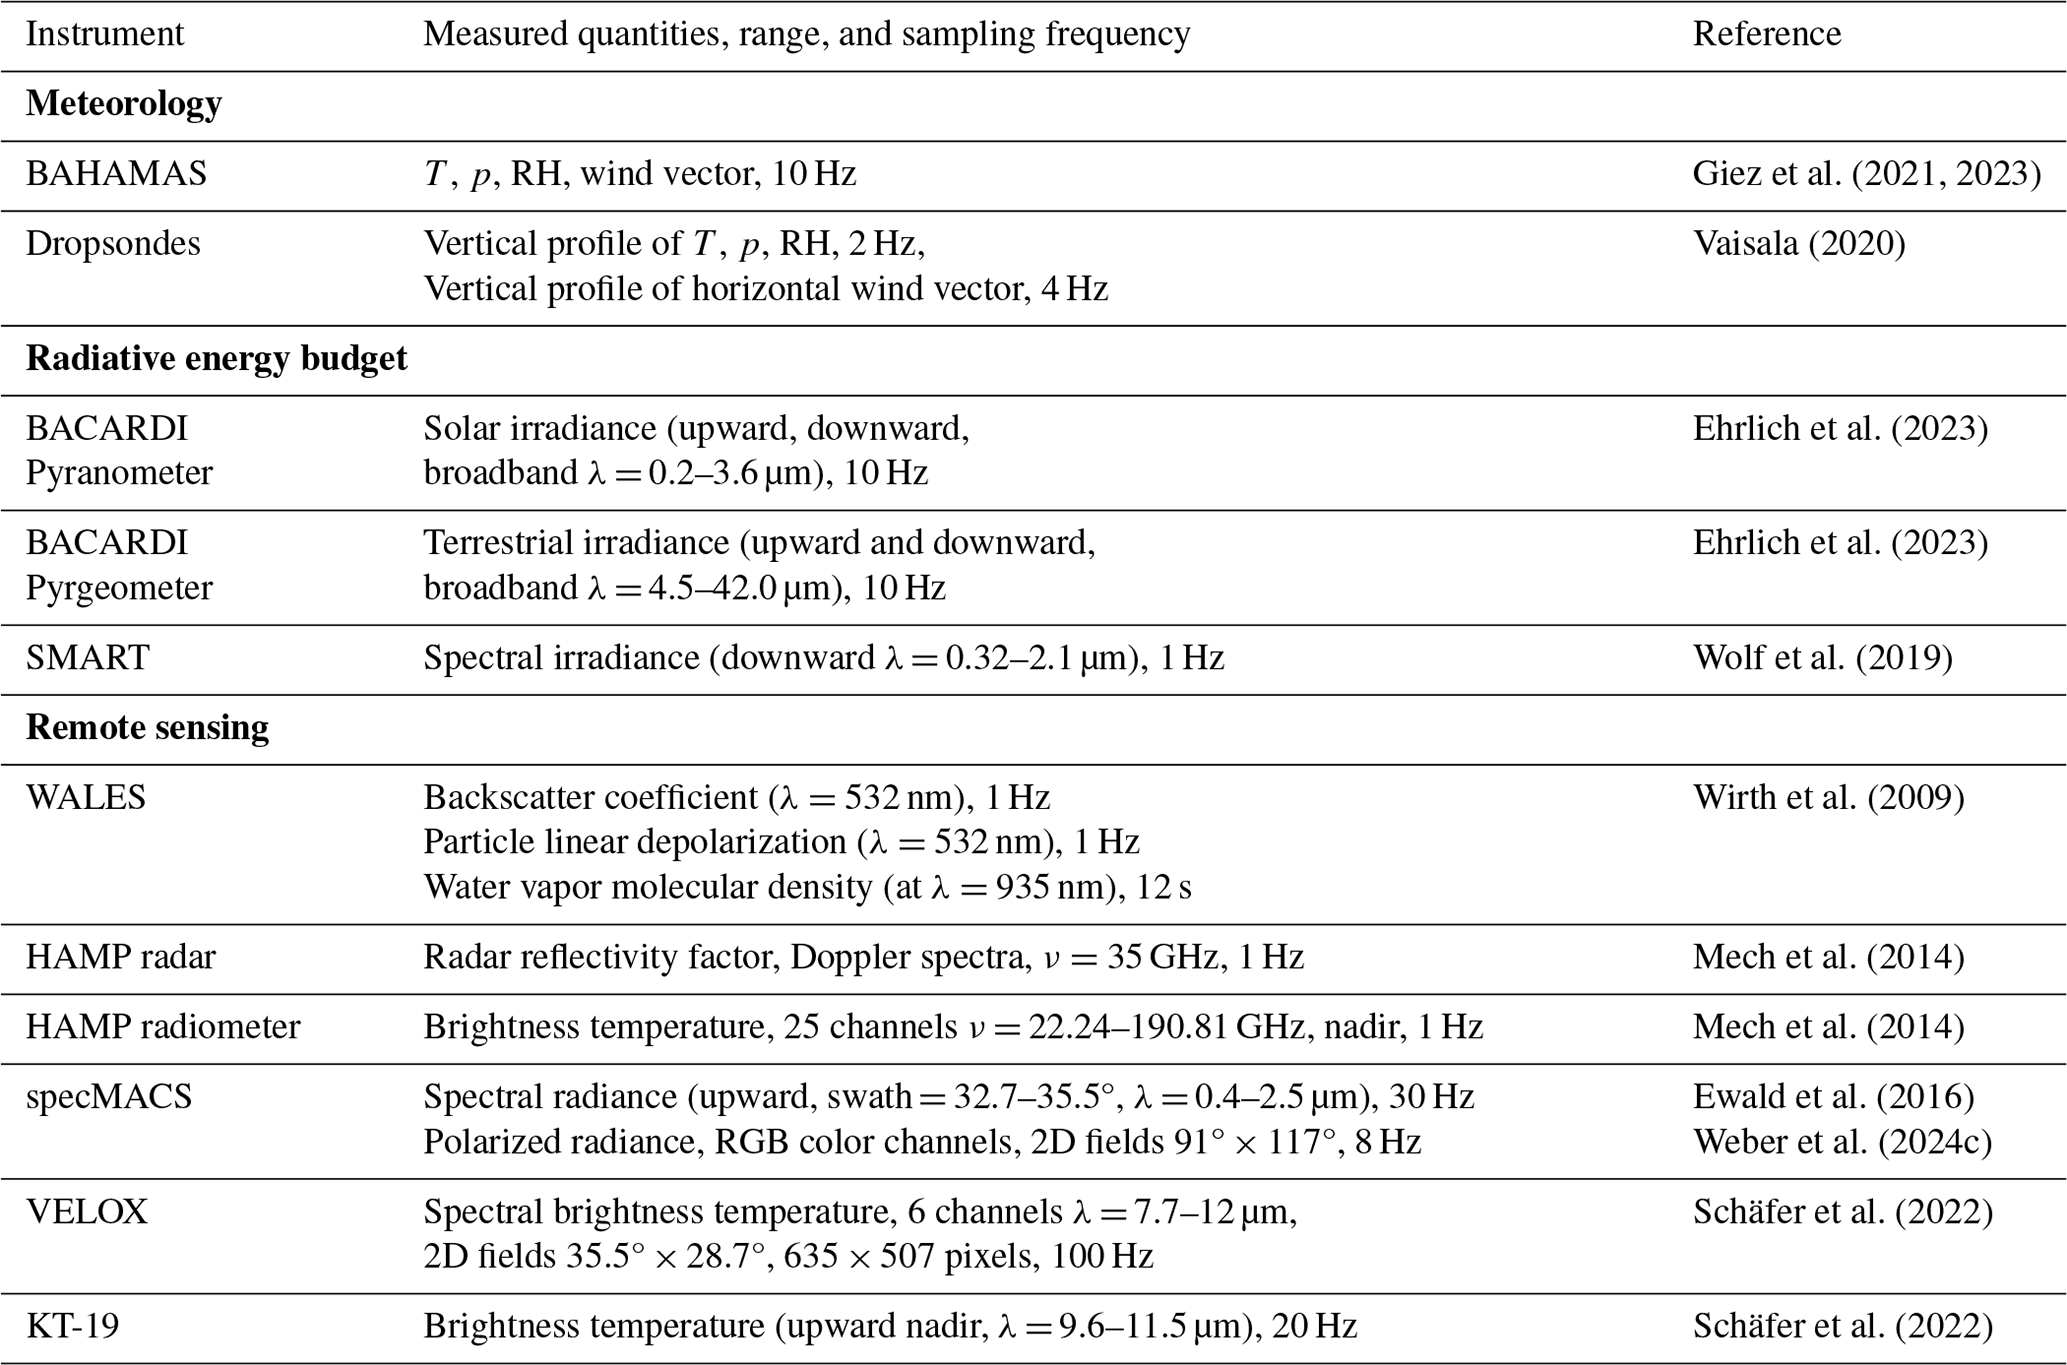
Table 3Overview of the instrumentation of Polar 5 and Polar 6 and the measured quantities that are part of the database. λ is wavelength, ν is frequency, T is air temperature, and p is atmospheric pressure. RH is relative humidity, FOV is field of view, PNSD is the particle number size distribution, rBC is refractory black carbon, SS is the level of supersaturation, and Dp symbolizes the particle diameter.
All data are published in the World Data Center PANGAEA (Felden et al., 2023) as instrument-separated data subsets and are marked by the tag “HALO–(𝒜𝒞)3”. Three collections of data sets for HALO, Polar 5, and Polar 6 link the data subsets by aircraft for a more structured overview.
-
HALO is available at https://doi.org/10.1594/PANGAEA.968885 (Ehrlich et al., 2024a).
-
Polar 5 is available at https://doi.org/10.1594/PANGAEA.968883 (Mech et al., 2024a).
-
Polar 6 is available at https://doi.org/10.1594/PANGAEA.968884 (Herber et al., 2024).
All data subsets, separated into the scientific subject, are introduced below. The subsection titles indicate which aircraft the data sets refer to.
3.1 Measurements of basic aircraft and fundamental meteorological parameters
3.1.1 HALO – basic aircraft data
The basic aircraft data obtained from instruments mounted on HALO (wind vector, thermodynamic state of the ambient air) were measured with the Basic HALO Measurement and Data System (BAHAMAS; Giez et al., 2021; Krautstrunk and Giez, 2012). For HALO–(𝒜𝒞)3, all processed data are published with 10 Hz sampling frequency in the HALO database (Giez et al., 2022, https://halo-db.pa.op.dlr.de/mission/130, last access: 24 March 2025). The measurements include aircraft location, speed and attitude, the three-dimensional (3D) wind vector, air pressure, static air temperature, and humidity. All data were corrected for dynamical effects due to the aircraft movement. The calibration procedure of the wind vector measurements is documented by Giez et al. (2021) and the static pressure measurements by Giez et al. (2020). A full uncertainty analysis of all measured quantities in high-latitude conditions is provided by Giez et al. (2023). The humidity measurements of BAHAMAS were evaluated in an intercomparison published by Kaufmann et al. (2018). For users only interested in the position data of HALO, master tracks of longitude, latitude, and altitude derived from the global positioning system (GPS) are published in PANGAEA (Ehrlich et al., 2024b).
3.1.2 Polar 5 and Polar 6 – basic aircraft data and high-frequency nose boom data
Slow and high-frequency measurements of wind, air temperature, and humidity were obtained on Polar 5 and Polar 6 from two identical nose boom systems and sensors mounted on a Rosemount housing interface as described by Mech et al. (2022a). The processed data sets for the nose boom measurements are available in ASCII format on PANGAEA at a 100 Hz resolution (Lüpkes et al., 2024a) and at 1 Hz resolution (Lüpkes et al., 2024b). For users only interested in the position data of the aircraft, master tracks of GPS longitude, latitude, and altitude are published for Polar 5 and Polar 6 (Herber et al., 2022a, b).
The 3D wind vector was derived from Aventech (Aventech Research Inc., Canada) five-hole probes for high-frequency pressure measurements combined with accurate position data, which were obtained from a high-precision GPS and from an inertial navigation system (INS). Pitch and roll angles were delivered at an accuracy of 0.1° while true heading angles had an accuracy of 0.4°. Finally, horizontal wind components were obtained with an absolute accuracy of 0.2 m s−1 for straight and level flight sections. Vertical wind was obtained only as the deviation from the average vertical wind. For sections several kilometers in length, an accuracy of about 0.05 m s−1 of the vertical wind speed relative to the average wind is estimated. Temperature was measured after correcting the adiabatic heating effect of the air by the dynamic pressure at an absolute accuracy of 0.3 K and with a resolution of 0.05 K.
For slow air humidity measurements (frequency of 1 Hz), a Vaisala HMT-333 with a temperature and HUMICAP humidity sensor was mounted on a Rosemount housing interface. Based on the temperature measurements (uncertainty of 0.1 K), the humidity data were corrected for adiabatic heating and reach an accuracy of 2 %. All data were recorded with a frequency of 100 Hz. Note that the calibration of the 100 Hz data is only valid for straight and level flights, when using these for the calculation of turbulent fluxes. The latter are not provided in the data set. Users who want to calculate fluxes with the eddy covariance method should consider only such flight sections where the aircraft was flying in a straight line.
During the HALO–(𝒜𝒞)3 campaign, the sensors mounted at the nose boom showed icing problems. As a result, high-resolution data are not available from all flights. Problems concerned especially data from Polar 5, where we cannot provide wind data from nine flights (RFs 08–16), while from Polar 6 wind data are missing from five flights (RFs 06–08, 12, 16). Icing is clearly marked in the published data.
3.1.3 HALO and Polar 5 – dropsonde data
Dropsondes were released from HALO and Polar 5 to measure vertical profiles of atmospheric air pressure, temperature, relative humidity, and the horizontal wind vector. HALO exclusively used the Vaisala RD41 dropsondes (Vaisala, 2020), whereas Polar 5 used the Vaisala RD94 for nine launches and Vaisala RD41 for the rest. Our data processing does not distinguish between the two instrument models. On both aircraft, the Advanced Vertical Atmospheric Profiling System (AVAPS) was operated for the release and data acquisition of the dropsondes. The spatial coverage of the dropsondes released during HALO–(𝒜𝒞)3 is mostly well distributed along the flight tracks (Fig. 3). However, due to limitations in flight operations, dropsondes were less frequently released in Danish airspace west of 0° longitude.
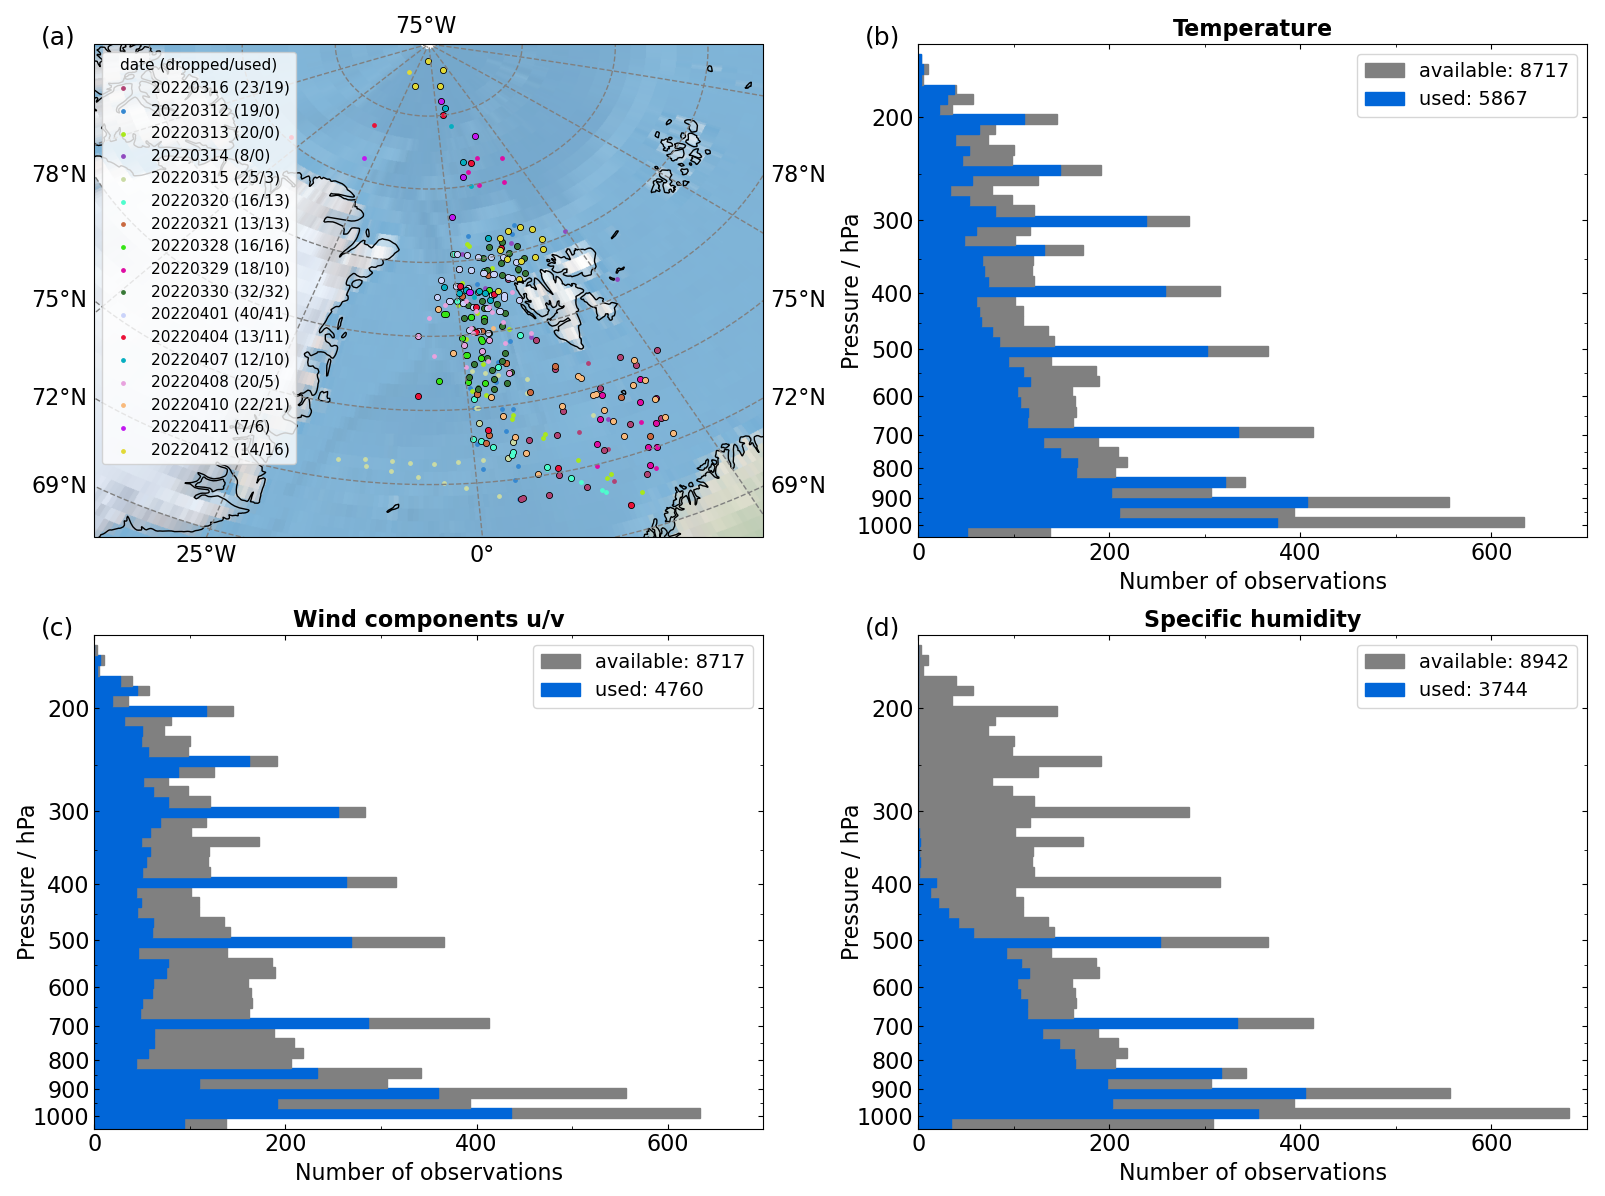
Figure 3Geographic locations (a) and altitudes (b–d) of dropsonde measurements of air temperature (b), horizontal wind speed (c), and specific humidity (d), which are available in the HALO–(𝒜𝒞)3 data set and were assimilated into GTS.
The dropsonde data are provided (George et al., 2024) in the same format as the Joint dropsonde Observations of the Atmosphere in tropical North atlaNtic meso-scale Environments (JOANNE) data set from the EUREC4A field campaign (George et al., 2021) and maintain the same definitions of the data-processing levels from Level-0 to Level-3 as in JOANNE. For processing the dropsondes' raw data (Level-0), the Atmospheric Sounding Processing ENvironment (ASPEN Version 4.0.0; Martin and Suhr, 2024) was used and provides the basic quality-controlled data (Level-1). All dropsondes underwent pre-flight reconditioning to restore the humidity sensor calibration status from drift due to trace gas pollutants, as also explained in Vömel et al. (2021). The dry bias correction applied in JOANNE was therefore omitted.
Level-2 data include sondes that passed an additional quality control (successful launch and landing detection) and only contain variables that were measured. Both Level-1 and Level-2 data are provided as one file per sounding. Level-3 provides a single NetCDF file, which combines all valid Level-2 soundings from HALO and Polar 5 with a uniform vertical grid spacing of 10 m. We exclude any Level-4 products here (otherwise present in JOANNE) because of varying sampling strategies of the campaign, which restricts simplified statistical analyses of area-averaged properties such as by George et al. (2023). Nevertheless, the retrievals for estimating the area-averaged properties during HALO–(𝒜𝒞)3 are detailed in the study by Paulus et al. (2024), and the user is recommended to use the provided Level-3 data for following their estimation.
3.1.4 HALO – communicating dropsonde data to GTS and assimilation to ECMWF services
Observations by the dropsondes released from HALO were submitted live during the flights via satellite communication to the Global Telecommunication System (GTS) to make the measurements available for data assimilation. On the basis of the European Centre for Medium-Range Weather Forecasts' (ECMWF) Integrated Forecasting System (IFS), the assimilated data are evaluated here. Data were sent only for a set of mandatory (main pressure levels) and significant levels (local extremes). Thinning and quality control within data assimilation did further reduce data coverage. In total, data of 216 dropsondes were assimilated for 14 analysis times. The number of sondes for each analysis time varies between 4 and 41 sondes. The geographical locations of the assimilated data are illustrated in Fig. 3a. There is no tendency to prefer data in sparsely covered high latitudes. Also data from highly spatially resolved flight patterns such as from RF 12 on 1 April 2022 were assimilated (41 sondes).
The vertical distribution of data availability in the native vertical grid of IFS is shown in Fig. 3b–d individually for wind speed, air temperature, and humidity. The distribution indicates an increased data coverage for the mandatory pressure levels. No air humidity measurements were used in the stratosphere where the accuracy of measurements is low. In the troposphere, the number of assimilated air humidity data is similar to the number of assimilated air temperature data. In total, 19 131 observations from 216 sondes were assimilated, including 5867 temperature observations (from 216 sondes), 4760 wind observations (from 216 sondes), and 3744 humidity observations (from 214 sondes).
3.1.5 HALO – quasi-Lagrangian matches
The HALO–(𝒜𝒞)3 campaign realized a quasi-Lagrangian flight strategy. As described by Wendisch et al. (2024), air masses were sampled by HALO twice or even more often between two research flights or during one flight. To promote the analysis of the air mass evolution, the locations of these quasi-Lagrangian matches are published in PANGAEA. Kirbus et al. (2024a) summarize the matches that occurred within 1 flight day, while matches between 2 consecutive flight days are listed by Kirbus et al. (2024b). For a reasonable analysis of air mass transformations, the data sets include only matches with a minimum threshold of 1 h between the first and second sampling. This limits the analysis to HALO flight tracks. The flight tracks of Polar 5 and Polar 6 did not cover such long distances along the trajectories.
Figure 4 illustrates the horizontal and vertical locations of quasi-Lagrangian matches that occurred within research flight number 3 (RF 03) performed on 13 March 2022. All locations where the air mass was sampled the first time (start points) are distributed on the zigzag leg directed northward. On the return flight leg these air masses were sampled a second time (end point). In total, seven quasi-Lagrangian matches (indicated by numbers in Fig. 4) were identified.
The matches were derived from trajectory calculations based on the wind fields from the ECMWF reanalysis version 5 (ERA5; Hersbach et al., 2020) and the Lagrangian Analysis Tool (LAGRANTO; Sprenger and Wernli, 2015). ERA5 data have a native temporal resolution of 1 h and horizontal resolution of 31 km. For each research flight of HALO, air mass trajectories were initialized in 1 min resolution along the flight track via a bilinear interpolation of the hourly ERA5 fields. To account for the ERA5 temporal and spatial resolution, 30 trajectories were distributed in a circle with a 30 km radius around HALO. Vertically, trajectories were initialized at all altitudes below HALO with a 5 hPa resolution to consider wind shear, ascent, and descent of air masses (see Wendisch et al., 2024). This is obvious by the distribution of the start/end points in Fig. 4b, where the branches of quasi-Lagrangian matches are diffusing and not restricted to a fixed vertical column. A quasi-Lagrangian match was registered when any of the initialized air masses crossed the flight track of HALO at a later time within 30 km horizontal distance. Details on this approach and statistics on the number of quasi-Lagrangian matches are given by Wendisch et al. (2024). An uncertainty analysis is presented by Kirbus et al. (2024c). Using different reanalysis data, they showed that the input wind field does not significantly change the trajectories. Dropsonde data, including wind speed and direction, were assimilated by ECMWF and, therefore, were considered in the ERA5 data. This can be assumed to significantly improve the reliability of the trajectory calculations and quasi-Lagrangian matches.
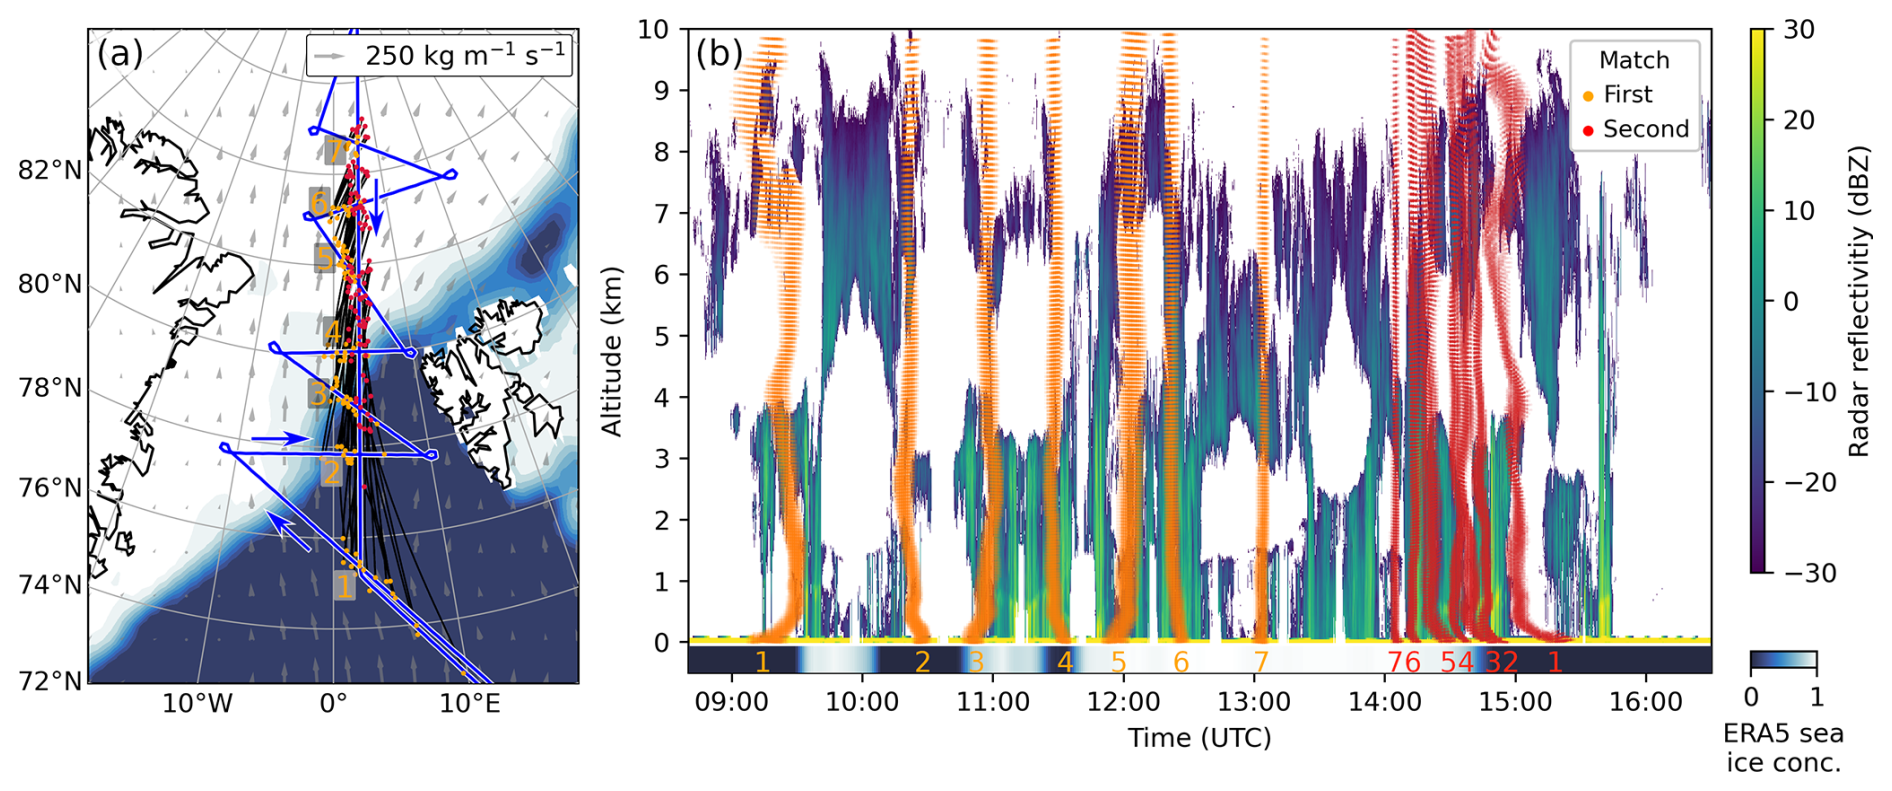
Figure 4Visualization of quasi-Lagrangian matches for the HALO RF 03 on 13 March 2022. The map in (a) shows the flight track of HALO overlaid on ERA5 data of sea ice concentration and integrated water vapor transport (gray arrows). In (b), a vertical cross section of HAMP radar reflectivity is shown. The first sampling locations (start points) of matches are indicated in both panels by orange dots and the second locations (end points) by red dots. For the map in (a) these start/end points represent altitudes close to the surface and are connected by the trajectories. Number labels in both panels indicate the individual branches of start/end points.
3.2 Radiative energy budget measurements
3.2.1 HALO, Polar 5, and Polar 6 – broadband irradiances
On HALO, broadband solar and thermal infrared irradiances were measured with the Broadband AirCrAft RaDiometer Instrumentation (BACARDI; Ehrlich et al., 2023) consisting of CMP22 pyranometers and CGR4 pyrgeometers manufactured by Kipp & Zonen. A similar setup of identical radiometers was used on Polar 5 and Polar 6 (Ehrlich and Wendisch, 2015; Ehrlich et al., 2019). Detailed specifications, data processing and corrections, and the instrument performance of BACARDI on board HALO are documented in Ehrlich et al. (2023). The calibrated and quality-checked broadband irradiances (upward/downward and solar/thermal infrared) from HALO, Polar 5, and Polar 6 are provided in separate data sets (Luebke et al., 2023; Becker et al., 2023).
The radiometer performance on Polar 5 and Polar 6 was evaluated by Ehrlich et al. (2019). Measurements during HALO–(𝒜𝒞)3 were characterized by cold environments (sensor temperatures below −55 °C) and a dominance of large solar zenith angles (SZAs). For these conditions, the calibration uncertainties increase (Su et al., 2008). On the other hand, due to the low incoming solar irradiance in Arctic conditions, the solar leakage effect of the pyrgeometer affecting the downward thermal infrared irradiance is low (Ehrlich et al., 2023). In total, the uncertainties of the irradiances reach values on the order of up to 10 W m−2.
The published BACARDI data have a sampling frequency of 10 Hz and include all corrections described by Ehrlich et al. (2023). On board Polar 5 and Polar 6, the broadband irradiances were recorded at a frequency of 20 Hz. Due to lower ascent and descent rates of Polar 5 and Polar 6, the dynamic thermal offset needed not be corrected for in the data set. Instead, a basic temperature change flag was added to the data set, which can be used to exclude the irradiances where the thermal offset becomes relevant. The flag identifies temperature gradients exceeding 0.5 K min−1 (smoothed with a 1 min rectangular filter). The attitude correction of downward solar irradiance can only be applied for the direct solar radiation, e.g., when no clouds were present above the aircraft. Therefore, the final data include two versions of the downward solar irradiances: an uncorrected one for cloudy conditions and a corrected product to be used in cloud-free conditions. To distinguish between these two scenarios, a cloud flag, derived from the downward solar irradiance and upward-looking camera imagery, is provided in the published data sets. Due to frequent passages through super-cooled clouds by Polar 5 and Polar 6, probable icing is marked by an icing flag as described by Ehrlich et al. (2019). In both data sets, simulated cloud-free downward solar irradiances are included. The radiative transfer simulations were set up as documented in Ehrlich et al. (2023), assuming a bright sea ice surface. The simulations were used for cloud detection, but they are of limited use for calculations of the cloud radiative effects, where changes in the surface albedo need to be considered (Stapf et al., 2020).
3.2.2 HALO and Polar 5 – spectral solar irradiance
Spectrally resolved downward (Polar 5, HALO) and upward (Polar 5 only) solar irradiances were measured using the Spectral Modular Airborne Radiation measurement sysTem (SMART; Wendisch et al., 2001; Wolf et al., 2019). The two systems, one installed on HALO and one on Polar 5, utilize identical types of grating spectrometers and optical inlets. They differ only in the implementation of the horizontal stabilization. The data are published separately for HALO (Röttenbacher et al., 2023) and Polar 5 (Jäkel et al., 2023a).
SMART was radiometrically calibrated before, after, and during the campaign following Wolf et al. (2019). The cosine response of the optical inlets was characterized with laboratory calibrations, especially for the large values of SZA commonly encountered during HALO–(𝒜𝒞)3. This calibration was applied in the data processing, accounting for the amount of direct solar radiation in cloudless conditions. The processed data of the grating spectrometers were merged and interpolated to a common 1 nm resolution in the visible and near-infrared spectral range (wavelength below 1 µm) and to 5 nm resolution in the shortwave infrared spectral range (wavelength above 1 µm). Due to the lower sensitivity and the stronger noise at the edges of the spectrometers, the HALO data are limited to wavelengths between 0.32 and 2.1 µm, and the Polar 5 data from 0.4 to 1.8 µm wavelengths. Polar 5 data are provided with 2 Hz frequency, while HALO measurements required a longer sampling time and are published with 1 Hz temporal resolution.
On HALO, the optical inlet mounted on top of the fuselage was actively stabilized for all flights apart from RF 18, where the stabilization was fixed and aligned with the fuselage. For this flight, the downward irradiance was corrected for the aircraft movement following Bannehr and Schwiesow (1993) and Boers et al. (1998). On Polar 5, all optical inlets were actively stabilized (Wendisch et al., 2001). To minimize the remaining instrumental uncertainties, the Polar 5 data set was filtered for large SZAs (less than 82°) and aircraft pitch and roll angle (±4.5°). HALO data were not filtered because the horizontal stabilization is more accurate, and the amount of flight time in the highest latitudes with low sun was higher. For large SZAs around 80°, as was the case with HALO–(𝒜𝒞)3, the uncertainty of the measured irradiance at flight level is increased compared to observations at smaller SZAs. The known uncertainty components (radiometric calibration, cosine correction, sensor tilt) of SMART were re-evaluated with regard to specific conditions during HALO–(𝒜𝒞)3. The uncertainty of the downward and upward irradiances adds up to 6.5 % and 6.0 %, respectively.
3.3 Remote sensing observations
3.3.1 HALO and Polar 5 – lidar
Polar 5 and HALO carried lidar systems for cloud, aerosol, and water vapor remote sensing. On HALO, backscatter lidar and water vapor differential absorption lidar profiles were recorded using the airborne demonstrator for the WAter vapor Lidar Experiment in Space (WALES; Wirth et al., 2009). The data set is published by Wirth and Groß (2024) in netCDF format and provides time series of profiles of backscatter ratio, particle linear depolarization, and water vapor molecular density measured along the flight path of HALO on 17 d. Backscatter ratio and aerosol depolarization data were derived with 1 s time resolution and 15 m vertical resolution at a wavelength of 532 nm. The backscatter profiles were extinction-corrected using the High Spectral Resolution Lidar (HSRL) method (Esselborn et al., 2008). The water vapor profiles have a time resolution of 12 s and a vertical binning of 15 m. For H2O, the vertical resolution is lower than given by the binning, where the real resolution is determined by an averaging kernel, which is constant over height and has a full width at half maximum (FWHM) of 250 m. All data were regridded to a constant altitude scale over mean sea level, irrespective of the actual flight altitude. The data files include a flag field built from seven different bits that indicate the possible problems with each individual data point. Details on the flag field and how to interpret the problems are described in the netCDF attribute “flag_meanings”. The data are considered of good quality if no flag is set (i.e., if the flag is zero). Note that for a non-zero flag, the data value itself is not replaced by a fill value because it still can be used for some analysis. Thus, potential users have to make sure to filter the data with help from the flags according to their objectives of the data analysis or retrieval.
On Polar 5, the Airborne Mobile Aerosol Lidar (AMALi; Stachlewska et al., 2010) was operated to derive cloud mask and cloud top height, which are published by Mech et al. (2024d). The measured profiles of backscattered intensities at 355 and 532 nm wavelengths were processed similarly to previous campaigns (Ehrlich et al., 2019; Mech et al., 2022a). This processing includes corrections for the background signal, range, incomplete overlap, and drift of the so-called baseline. The corrected backscatter intensities were gridded and used to calculate the volume attenuated backscatter coefficients. The cloud detection only applied the parallel-polarized attenuated backscatter coefficient at 532 nm wavelength. Cloud top height was determined from the backscatter gradient and magnitude and provided with a vertical resolution of 7.5 m. The published data contain the cloud mask and cloud top height at 1 s resolution.
3.3.2 HALO – radar and microwave radiometer
Active and passive microwave remote sensing observations were performed on HALO using the HALO Microwave Package (HAMP; Mech et al., 2014). HAMP combines a 35 GHz cloud and precipitation radar and passive microwave radiometer measuring at 26 frequency channels between 20 and 183 GHz. The data of both components are published in a unified format by Dorff et al. (2024) and include merged time series of brightness temperatures from the radiometers, radar reflectivity factor, and radar linear depolarization ratio. This unification is based on Konow et al. (2019) and synchronizes the measurements from both devices into a collocated temporal 1 Hz resolution applicable for joint analysis. The vertically resolved radar measurements were further projected onto a joint vertical grid of 30 m resolution.
In the unified data set, radar reflectivity factors are offset-calibrated using the method described by Ewald et al. (2019). For the radiometers, imperfect pre-flight calibration can cause an offset in the measured brightness temperatures. Therefore, cloud-free dropsonde measurements of air temperature and humidity were used to post-calibrate following the procedure proposed by Jacob (2020). The atmospheric profiles measured in cloud-free conditions were used as input for forward simulations using the Passive and Active Microwave radiative TRAnsfer tool (PAMTRA; Mech et al., 2020), which were then compared to the observation to determine potential offsets. For both measurement devices, the post-calibrated data were quality-checked (meaning cleaned of outliers and gap-filled). Radar data obtained during turns of HALO were removed due to disturbances related to side lobes. An adherent surface mask distinguishes between three predominant overpassed surface types (land, sea, and sea ice cover), considering the satellite-based AMSR2 sea ice cover (Spreen et al., 2008).
3.3.3 Polar 5 – radar and microwave radiometer
On Polar 5, equivalent radar reflectivities at 94 GHz frequency were measured with a frequency-modulated continuous wave radar, the active component of the Microwave Radar/radiometer for Arctic Clouds (MiRAC-A; Mech et al., 2019). Additionally, MiRAC-A provides brightness temperatures from a passive channel at 89 GHz frequency. Radar reflectivities and brightness temperatures are published in a combined data set with a temporal resolution of 1 Hz by Mech et al. (2024b). MiRAC-A is mounted on Polar 5 with an inclination of 25° backward with respect to the nadir and aircraft flight directions. In post-processing, the radar reflectivities were corrected to nadir and resampled on a 5 m vertical grid. Published brightness temperatures from the 89 GHz channel have not been corrected for the viewing geometry and are still along the inclined observation path. Details on the instruments' resolution, accuracy, and processing are described by Mech et al. (2022a).
During HALO–(𝒜𝒞)3, the Humidity And Temperature PROfiler (HATPRO; Rose et al., 2005) was operated on board Polar 5. HATPRO provides brightness temperatures in 14 channels: 7 vertically polarized at the water vapor absorption line at 22.24 GHz (K-band) and 7 horizontally polarized around the oxygen absorption complex at 60 GHz (V-band). All data are published with a temporal resolution of approximately 1 Hz by Mech et al. (2024c). The data were post-processed identically to previous campaigns such as MOSAiC-ACA (Mech et al., 2022a).
3.3.4 HALO and Polar 5 – solar spectral and polarized imaging
Partly identical, spectral push-broom imagers for the solar spectral range were operated on HALO and Polar 5. The spectrometer of the Munich Aerosol Cloud Scanner (specMACS; Ewald et al., 2016; Weber et al., 2024c) on HALO and the Airborne Imaging Spectrometer for Applications (AISA) Eagle/Hawk system (Ehrlich et al., 2019; Ruiz-Donoso et al., 2020; Klingebiel et al., 2023) on Polar 5 measured two-dimensional (2D) fields of reflected spectral radiances in a spectral range between 400 and 2500 nm. Having a swath with a similar field of view (around 35°) and flying at different altitudes, the two systems provide different details of the observed scenes down to 1 m at cloud top. Data are published separately for the two systems and are split into their single sensors.
On HALO, the spectral cameras of specMACS were operated in a nadir-looking configuration during HALO–(𝒜𝒞)3. The data are published by Weber et al. (2024b) and provide radiance fields sampled with 30 Hz frequency. The processing of the raw data into spectral radiances, including attitude correction and radiometric and spectral calibration, was performed as described by Ewald et al. (2016). Due to technical problems with one of the spectrometers, the published data are limited to the spectral range from 1000 to 2400 nm.
On Polar 5, spectral radiances in the wavelength range from 400 to 993 nm were measured with the AISA Eagle instrument. Data cubes of the 1024 spatial across-track pixels and 504 spectral channels are published by Klingebiel et al. (2024) with the native frame rate of 20 Hz. Data processing and data evaluation were similar to the procedures presented in Ehrlich et al. (2019). Spectral radiances in the shortwave infrared wavelength range above 1000 nm wavelength, as provided by specMACS on HALO, were measured on Polar 5 by the AISA Hawk instrument for 384 across-track pixels and 288 spectral channels. Unfortunately, during HALO–(𝒜𝒞)3, the instrument encountered significant challenges due to heavy condensation of main optical components. Post-processing did not reliably remove these features and renders the collected data unsuitable for publication.
In addition to the spectral imagers, specMACS on HALO includes an additional polarized imaging system consisting of two 2D RGB polarization-resolving cameras with a maximum combined field of view of 91° × 117° measuring with 8 Hz temporal resolution (Weber et al., 2024c). The data are published by Weber et al. (2024a) separately for each camera in the form of MPEG videos combining the RGB images and images of the degree of linear polarization with the temporal resolution reduced by a factor of 10. The videos are useful for visualizing the general atmospheric and surface condition below HALO. Absolute calibrated Stokes vectors rotated into the scattering plane can be computed from the polarization measurements as described by Weber et al. (2024c) and can be made available upon request.
3.3.5 HALO – thermal infrared spectral imaging
On HALO, thermal infrared remote sensing observations were performed by the Video airbornE Longwave Observations within siX channels (VELOX; Schäfer et al., 2022) system, which includes an actively cooled thermal infrared imager. The 2D cloud top and surface brightness temperature (BT) fields were derived from the observations and published by Schäfer et al. (2023).
The data comprise VELOX brightness temperature measurements for four narrowband channels (central wavelengths and half widths at 8.65 ± 0.55 µm (BT2), 10.74 ± 0.39 µm (BT3), 11.66 ± 0.81 µm (BT5), and 12.00 ± 0.50 µm (BT6)) and one broadband channel (7.7 µm to 12.0 µm). The measurements were processed according to Schäfer et al. (2022), including a destriping procedure, an image filtering, and a pixel correction. Although VELOX operates a filter wheel and image sensor with a 100 Hz frame rate (one spectral filter per frame), the subsequent images are slightly shifted due to the aircraft movement. This shift was corrected to allow merging the measurements at different channels. These corrections reduced the image size to 635 × 507 pixels. To have a manageable data amount and file size but remaining sufficient overlap of two subsequent images, the data are provided with a temporal resolution of 1 Hz. For the cold surface and atmosphere prevailing during HALO–(𝒜𝒞)3, the relative uncertainties of the low brightness temperatures are slightly higher compared to the tropical condition reported by Schäfer et al. (2022).
3.3.6 HALO and Polar 5 – thermal infrared radiometer
On HALO and Polar 5, thermal infrared radiances in the nadir direction (field of view of 2.3°) were measured by KT-19 (model KT19.85 II) infrared pyrometers. On HALO, the radiometer is integrated into the VELOX system (Schäfer et al., 2022); however, data are published separately to provide the KT-19 data with the full sampling frequency of 20 Hz (Schäfer et al., 2024). The KT-19 measurements on Polar 5 are implemented in the data set of the broadband radiometer (Becker et al., 2023), which were also sampled with 20 Hz. Data are provided as brightness temperatures corresponding to the spectral range of the radiometer, covering a narrow wavelength band between 9.6 and 11.5 µm. For HALO, a correction for the window transmissivity similar to the data processing of VELOX was applied.
3.3.7 Polar 5 and Polar 6 – fisheye camera
On Polar 5 and Polar 6, digital RGB cameras (Nikon D5) equipped with a downward-looking 180° fisheye lens measured the directional distribution of upward radiance of the entire lower hemisphere every 4–6 s. Data are published for the three spectral bands (red, green, and blue) by Jäkel and Wendisch (2024). A surface type classification based on the Polar 5 camera data is published by Jäkel et al. (2023b), providing the fraction of open water, sea ice, and melt ponds for each image.
The RGB images were recorded in raw data format. The post-processing of the images included the rectification of the images with respect to flight attitude data and the transformation of the raw signal of each sensor pixel into calibrated radiances (Carlsen et al., 2020; Mech et al., 2022a). The final data set is re-binned to an angular-resolved radiance fields with 0.2° resolution. For data quality checks the nadir radiances were compared to the SMART radiance data. Following Carlsen et al. (2020), the measurement uncertainties are estimated at 4.5 %.
3.4 Cloud microphysical in situ observations
To measure the microphysical properties of clouds, an advanced configuration of in situ cloud probes was integrated on the wings and fuselage of the Polar 6 aircraft. The instruments are classified below depending on their operating principles as scattering instruments or optical array probes (OAPs). Additionally, a Nevzorov bulk probe was installed on the nose boom for cloud liquid water content (LWC) and total water content (TWC) measurements. All in situ cloud probes, except for the Back-scatter Cloud Probe with Polarization Detection (BCPD), were deployed during previous aircraft Arctic field campaigns on board Polar 5. The instruments and corresponding data processing used here are identical to those used for the AFLUX and MOSAiC-ACA campaigns and are described in more detail including uncertainties by Moser et al. (2023b) and Mech et al. (2022a).
Data are published individually for the different cloud probes (see below) and in a combined version by Moser et al. (2023a). The combined data make use of the different particle size ranges covered by the individual instruments and provide continuous particle number size distributions from 3–6400 µm and derived total particle number concentration, total cloud water, ice and liquid water content, total effective diameter (Deff), and median diameter.
3.4.1 Polar 6 – scattering cloud probes
Smallest cloud particles were counted and sized by the Cloud Droplet Probe (CDP; Lance et al., 2010) based on the intensity of forward-scattered laser light (658 µm). The measurements were processed according to Moser et al. (2023b) and published by Moser et al. (2023a) with 1 Hz frequency. The data include primary measured particle number size distributions (PNSDs) from 2.8 to 50 µm and derived quantities such as the total cloud particle number concentration (N), the effective diameter (Deff), and the liquid water content (LWC). Similar to Kirschler et al. (2023), the calculations did neglect the presence of ice crystals in the size regime of the CDP, which is a reasonable assumption for Arctic low-level clouds (McFarquhar et al., 2017; Korolev et al., 2017).
The BCPD measured similar microphysical properties to those derived from the CDP but with additional depolarization signal to identify the thermodynamic phase of the cloud particles (Beswick et al., 2014). The PNSDs were obtained in a slightly smaller size range from 2–42 µm. Measured PNSDs and derived microphysical quantities are published by Lucke et al. (2023a) with 1 Hz frequency. The thermodynamic phase of the cloud particles is provided as the number of ice crystals observed within 1 s sampling time. Data processing and an assessment of differences between CDP and BCPD measurements are published by Lucke et al. (2023b). The BCPD was integrated into the fuselage of Polar 6. The proximity to the aircraft skin likely affected its measurements, in the sense that the observed PNSDs are altered with respect to those in the clouds. It is therefore advised to use the PNSDs from the CDP instead. Furthermore, shattering of ice particles on the fuselage artificially increases the measured ice particle concentration. Currently, the BCPD should therefore only be used to assess the cloud phase (i.e., differentiate between pure liquid water clouds, mixed-phase clouds, and entirely glaciated clouds). A detailed discussion of the evaluation procedure is provided by Lucke et al. (2023b).
The polar nephelometer (PN) directly measures the non-normalized volumetric scattering phase function (i.e., angular scattering coefficients, ASCs) for cloud particles with diameters from a few micrometers to 1 mm using a collimated laser with a wavelength of 0.8 µm and a circular array of photodiodes (Gayet et al., 1997). The data are published in 1 Hz temporal resolution by Dupuy et al. (2024) and include the phase function for all 56 scattering angles. Additionally, an extinction coefficient and the asymmetry parameter retrieved from the ASCs are provided to distinguish spherical from non-spherical cloud particles, as well as the dominant cloud thermodynamic phase.
3.4.2 Polar 6 – optical array probes
Optical array probes (OAPs) recording shadow graphs of droplet and ice particles were used to derive PNSDs, N, Deff, and ice water content (IWC) from the 2D images (Baumgardner et al., 2001; Lawson et al., 2006; O'Shea et al., 2021; De La Torre Castro et al., 2023). Three OAPs were installed under the wing of Polar 6, the Cloud Imaging Probe (CIP), the Precipitation Imaging Probe (PIP), and the 2D Stereo Imaging Probe (2D-S). The OAPs differ in pixel quantity and resolution (64 diode array with 15 µm resolution for CIP, 64 diode array with 103 µm resolution for PIP, and 128 diode array with 10 µm resolution for 2D-S), which determine their observable particle size ranges (see Table ). CIP and PIP data are included in the data set published by Moser et al. (2023a). The 2D-S data are published by Dupuy et al. (2024) and are provided separately for the horizontal and vertical viewing direction. Due to the complexity of deriving microphysical properties from OAPs, different solutions are included in the data sets, which can be selected depending on the focus of analysis. For ice crystal size, the diameter for surface equivalent (Deq) and the diameter of a circumscribed circle (Dcc) are provided. As ice crystals may only be partly imaged by the limited sensor width, two solutions – one considering all images (index 0) and one considering only complete ice crystals (index 1) – are analyzed. For the IWC two mass–diameter relationships by Field et al. (2006) and Brown and Francis (1995) were applied, and both results are included in the data set. The effective diameter was computed based on the ratio of the IWC to the ice extinction that is related to the total ice crystal cross section as in Gayet et al. (2002).
3.4.3 Polar 6 – Nevzorov probe
The Nevzorov probe is a constant-temperature, hot-wire instrument designed for the airborne bulk measurements of LWC and TWC (McFarquhar et al., 2017). Both quantities were corrected for the collision efficiency and published with 1 Hz temporal resolution by Lucke et al. (2024). The operation of the Nevzorov probe in mixed-phase clouds is challenging and requires an accurate estimation of the collection efficiencies. Laboratory measurements were performed to estimate the collection efficiencies in super-cooled cloud conditions (Lucke et al., 2022). For HALO–(𝒜𝒞)3, the LWC and TWC were additionally corrected with an iterative approach using the particle phase measurements by the BCPD (Lucke et al., 2023b). Due to a malfunction of the Nevzorov probe data acquisition, data are available only for RF 08 to RF 13.
3.5 Aerosol microphysical and chemical in situ measurements
3.5.1 Polar 6 – particle inlets
To sample aerosol particles and cloud particle residuals (CPRs) using instrumentation inside the cabin of Polar 6, a standard aerosol inlet and a counterflow virtual impactor (CVI) inlet (Ogren et al., 1985) were deployed on board Polar 6. Both inlets were applied in the same way as during ACLOUD (Ehrlich et al., 2019). A set of instruments, listed below, were connected to these inlets.
During HALO–(𝒜𝒞)3, the number of super-cooled droplets exceeded by far the number of ice particles in mixed-phase clouds; i.e., the number of sampled CPRs were dominated by cloud droplet residuals. Due to the CVI operation principle (Mertes et al., 2005), the sampled CPRs are enriched with respect to ambient conditions. The respective enrichment factor (EF) needs to be applied to every instrument sampling CPR and is therefore provided in the CVI data sets (Mertes and Wetzel, 2023). EF is defined by the ratio of the air volume flow in front of and inside the CVI inlet. The inlet sample flow inside the CVI was measured continuously and depends on the number of instruments connected to the CVI. The in-front flow was determined from the aircraft speed relative to the air and the inlet diameter. Since the Polar 6 aircraft speed is rather low, EF values were rather low, ranging between 3 and 6, depending on the sample flow.
Moreover, two different inlet efficiencies must be considered. First, the sampling efficiency accounts for particles that were not counted due to the lower cut-off size of the CVI inlet. For the CVI on Polar 6, the cut-off size is around 10 µm due to the low flight velocity and implies that not all cloud droplets were collected. Second, a fraction of droplets were not sampled due to the substantial offset between droplet motion and aircraft heading. This effect is quantified by the aspiration efficiency for the droplet collection above the lower CVI cut-off size of 10 µm. Both efficiencies can be deduced by the comparison of the CPR and the size-resolved droplet number concentration, where the latter can be derived from the in situ cloud probes aboard Polar 6 (Ehrlich et al., 2019).
The standard aerosol inlet samples approximately isokinetic for the true airspeed reached with Polar 6. Thus, the particle transmission by the inlet can be assumed to be near unity for particles from 20 nm to about 1 µm. For larger particles, the transmission drops to 80 % at 5 µm and 30 % at 10 µm. For the individual instruments, which have different particle size ranges and tubing to the main inlet, specific transmission efficiencies need to be considered. Outside clouds, the CVI was also used as an aerosol and gas inlet. The respective suitability was demonstrated by the excellent agreement of aerosol particle number size distributions measured behind the CVI and the Polar 6 standard aerosol inlet (Ehrlich et al., 2019). For the ambient aerosol particle and trace gas collection, no enrichment exists, and the overall sampling efficiency is 100 %.
3.5.2 Polar 6 – aerosol microphysical in situ observations
A condensation particle counter (CPC, TSI-3010) and an ultra-high-sensitivity aerosol spectrometer (UHSAS) were permanently connected to the CVI inlet to measure particle number concentration and size distribution (PNSD) of CPR (inside clouds) and ambient aerosol particles (outside clouds). Data of both single particle measurement devices are published by Mertes and Wetzel (2023) with a temporal resolution of 1 Hz. For the CPC, the number concentration of particles larger than 10 nm was measured. The UHSAS covers the number size distribution of particles with diameters between 65 nm and 1 µm. All data are provided in ambient concentration at the measurement point. The PNSDs measured by the UHSAS were temporary biased by an electronic problem, causing particles to be falsely classified into two bins (107.9–111.1 and 211.66–217.96 nm), while the total particle number concentration is preserved. A correction scheme was developed to detect such biased PNSDs and to redistribute the surplus of the two affected bins. A flag is included in the published data set to indicate whether a spectrum is unbiased or biased and corrected.
The PNSDs in the mobility diameter range of 10 nm to 800 nm were measured using the Mobility Particle Size Spectrometer (MPSS; Wiedensohler et al., 2012). During HALO–(𝒜𝒞)3, the MPSS was permanently connected to the standard aerosol inlet. Near-isokinetic sampling was established for the majority of the flight time by restricting the total aerosol flow through the sampling line (inner diameter 0.75 in. (1.9 cm)) with the help of a valve. With this, an upper cut-off diameter of about 4 µm was achieved. Each scan of the entire particle size range took approximately 5 min. Data are provided by Tatzelt et al. (2024b) as binwise log-normal particle numbers (). For each of the 40 size bins, the center particle size Dp is given. The start and end of each scan is included in the data set. Each PNSD was integrated over all Dp to obtain the total particle number concentration (Ntotal). A data flag is given to indicate when sampling was under near-isokinetic conditions.
The PNSD of larger aerosol particles in the size range between 0.25 and 40 µm was measured by a Grimm Sky optical particle counter (Sky-OPC) model 1.129 (Heim et al., 2008; Bundke et al., 2015). The data including all 31 size bins of the log-normal PNSD and the total particle concentration are published by Eppers et al. (2023b) with a temporal resolution of 6 s. The Sky-OPC was connected either to the standard aerosol inlet or the CVI, which is indicated in the data set by a flag. The particle number concentrations are pressure-corrected to standard temperature and pressure.
3.5.3 Polar 6 – cloud condensation particles measurements and particle filter sampling
A miniature cloud condensation nuclei (CCN) counter (mCCNC), developed by Roberts and Nenes (2005), was used to measure CCN number concentration (NCCN) at a constant supersaturation (SS) of 0.1 %, according to post-campaign calibration. Data are provided by Tatzelt et al. (2024a) and include NCCN, SS, and activation temperature Tact with a temporal resolution of 1 Hz. The mCCNC was connected to either the standard aerosol inlet or the CVI. In the data set, a flag indicates which inlet was used for each time. Data quality was ensured by taking into account additional monitoring parameters inside the mCCNC that indicate whether the instrument was within its operational window. Only for the Polar 6 research flights RF 08 to RF 13 was data quality found to be sufficient and is published.
The High-volume flow aERosol particle filter sAmpler (HERA; Grawe et al., 2023) was deployed for collecting aerosol particles that can be used in offline laboratory analysis. For example, the samples can be used for deriving the ice-nucleating particle (INP) concentration (e.g., Chen et al., 2018; Hartmann et al., 2019), scanning electron microscopy for particle morphology analysis (e.g., Seifried et al., 2021), or chemical composition analysis of the filtered particles (e.g., Kwiezinski et al., 2021). HERA sampled up to five filters per flight at a volumetric flow rate of 30 L−1. One filter per flight was reserved as a blank, i.e., handled in the same way as the other filters but not exposed to the sample flow, for determination of the measurement background. Typically, filters were sampled during horizontal flight legs at different altitudes and over varying surfaces (sea ice, open ocean, land). The sampling time varied between 2 and 140 min depending on the target area. HERA was connected to the Polar 6 standard aerosol inlet for the vast majority of the filter sampling. On rare occasions, HERA was switched to the CVI inlet to sample cloud particle residuals. The filter samples were removed from HERA after each research flight in a clean laboratory environment and stored at −18 °C until further analysis.
3.5.4 Polar 6 – light absorbing particle measurements
The properties of refractory BC (rBC) particles were measured by a single particle soot photometer (SP2) in an identical setup as used during the ACLOUD campaign (Zanatta et al., 2023). A single wavelength particle soot absorption photometer (PSAP; Bond et al., 1999) was applied to measure the particle absorption coefficient. The refractory black carbon mass and number concentration measured by the SP2 are published by Jurányi and Herber (2024) for a sampling time of 3 s. The absorption coefficient from the PSAP is measured with a sampling time of 10 s and is included in the data set published by Mertes and Wetzel (2023).
The SP2 data were processed on the basis of a calibration with standard material with known BC mass (Schwarz et al., 2006; Moteki and Kondo, 2010). During HALO–(𝒜𝒞)3, the SP2 measured the BC mass of individual BC-containing aerosol particles in the mass-equivalent diameter range of 70 to 675 nm, assuming void-free bulk material density of 1.8 g cm−3. The instrument was permanently connected to the CVI inlet to measure rBC properties of CPR inside clouds and of ambient aerosol particles above below clouds. A calibration before and after the campaign was performed using size-selected fullerene soot particles (Gysel et al., 2011; Laborde et al., 2012). Unfortunately, due to some laser problems of the SP2, no measurements exist during the Polar 6 flight numbers RF 02, RF 03, and RF 08. During the other flights, this issue occurred only at the beginning of the flights. In the published data set a flag is provided that indicates whether the CVI counterflow was switched on or off (i.e., if the instrument sampled ambient aerosols or CPR). The data are not corrected for the CVI enrichment factor.
The PSAP was permanently connected to the CVI inlet to measure the absorption coefficient of CPR (inside clouds) and ambient aerosol particles (outside clouds), which is given in ambient conditions at the measurement point. Data inside and outside of clouds can be distinguished by the flag provided in the CVI data set. The raw data were corrected to account for filter effects (Bond et al., 1999) except for scattering, because the filters were changed, when the transmittance was still high. The PSAP was set for a 10 s integration time, which was not always sufficient, so that also negative values occurred. This means that longer averaging times might sometimes be required to get a meaningful value for the absorption coefficient. By use of mass absorption efficiency, the absorption coefficient can be converted into a black carbon (BC) mass concentration, whereby one should clarify that mineral dust did not significantly contribute to the particle absorption. For the PSAP a mass absorption efficiency of 14.7 m2 g−1 was derived in a previous study (Mertes et al., 2004).
3.5.5 Polar 6 – aerosol chemistry in situ observations
The chemical composition of the aerosol particle and cloud particle residual populations was measured using the single particle laser ablation mass spectrometer ALABAMA (Aircraft-based Laser ABlation Aerosol MAss spectrometer; Brands et al., 2011). Compared to previous campaigns (Ehrlich et al., 2019), the detectable particle size range of the ALABAMA was extended to larger particle diameters by modifications reported by Clemen et al. (2020) and ranges now between 230 and 3000 nm. The processed data are published by Eppers et al. (2023a) and specify the size and chemical composition of individual particles. To measure both aerosol particle and cloud particle residuals, the ALABAMA was mostly operated behind the CVI with the counterflow switched on inside clouds and off outside clouds. For specific flight segments, the ALABAMA was also operated alternately behind the standard aerosol inlet and the CVI to investigate potential differences between the two inlets. Details on this procedure are explained by Ehrlich et al. (2019). The sampling conditions are indicated in the data set by a flag. As an indicator for measurements inside clouds, the inlet position of the switching valve at the ALABAMA and the supply flow data from the CVI were used.
During HALO–(𝒜𝒞)3, a total of about 137 000 mass spectra were detected (132 000 aerosol particles and 5000 cloud residuals). The data processing/evaluation of the single particle mass spectra recorded with the ALABAMA was carried out using the CRISP software package (Concise Retrieval of Information from Single Particles; Klimach, 2012). To quantify the chemical composition of the particle population, the shape of the mass spectra was analyzed and assigned to a cluster (particle type). A fuzzy-c-means algorithm was used for grouping mass spectra with similar signal patterns (Roth et al., 2016). In contrast to Roth et al. (2016), the threshold correlation coefficient above which a mass spectrum was assigned to one of the clusters was reduced to 0.6. Below this threshold, the particle was classified in the “others” cluster. This reduced the need for subsequent manual inspection of the residual cluster. In addition, a “startcluster difference” of 0.9, a “fuzzifier” of 1.4, and a “fuzzy abort” of were used (cf. Roth et al., 2016). The classification initially considers 50 clusters. This was reduced to 37 clusters (particle types) based on manual inspection of similarities in the mass spectrum and in their temporal occurrence. The published data set provides for each particle the detection time, assigned particle types/cluster (37 specific types and “others”), and the vacuum aerodynamic particle diameter.
3.6 Polar 6 – trace gas chemistry
Trace gases carbon monoxide (CO), carbon dioxide (CO2), water vapor (H2O), and ozone (O3) were measured using an ultra-fast CO monitor model AL5002 for CO (Gerbig et al., 1999), a LI-7200 closed CO2/H2O analyzer for CO2 and H2O (Burba et al., 2010), and a dual-beam ozone monitor model 2BTech-205 for O3 (Johnson et al., 2014). All data are published by Bozem et al. (2024) at 1 Hz resolution, except for O3, which was measured at 0.5 Hz resolution.
The instruments were connected to a specific backward facing trace gas inlet using Teflon tubing. Venturi valves mounted on the fuselage in the back of the aircraft maintained a flow of 10–20 slpm within the inlet lines and the instruments sampled from the main inlet lines using a T-type insertion. Using NIST traceable standards with CO and CO2 concentrations at atmospheric levels and H2O concentrations close to zero, every 15–30 min, regular in situ calibrations were performed during the flights to correct for any instrument drift. Details on this calibration procedure are described by Bozem et al. (2019).
In parallel, a water vapor sensor system (WVSS-II) based on a tuneable diode laser (TDL) was operated on board Polar 6. The system was permanently connected to the CVI inlet to measure the cloud water content (CWC) (inside clouds) and the ambient water vapor mixing ratio (outside clouds). Data are published by Mertes and Wetzel (2023) and include CWC and H2O mixing ratio defined as ambient concentrations at the measurement point. The WVSS-II has a lower detection limit of 50 ppmv and was operated at a 1 Hz temporal resolution. During the in-cloud sampling of cloud particles, the liquid and frozen phases from all collected hydrometeors were driven into the gas phase by the CVI inlet (Ogren et al., 1985). Thus, the former condensed water was measured as water vapor behind the CVI, which was then converted into the sampled CWC (Mertes et al., 2001).
All data sets are published in PANGAEA with open access. Only data from BAHAMAS on HALO are published in the HALO database repository for consistency reasons. Tables 4, 5, and 6 list the corresponding data set identifiers. Within PANGAEA, aircraft-separated data set collections of all corresponding data sets were compiled for HALO (Ehrlich et al., 2024a, https://doi.org/10.1594/PANGAEA.968885), Polar 5 (Mech et al., 2024a, https://doi.org/10.1594/PANGAEA.968883), and Polar 6 (Herber et al., 2024, https://doi.org/10.1594/PANGAEA.968884). To provide access to the objective of each research flight, the motivation for the specific flight pattern, and a brief overview of the current weather conditions, flight reports were compiled and published by Ehrlich et al. (2024c). These reports also provide notes on the instrument operators, in-flight images, and quicklooks, when available.
With the exception of some data that are available in ASCII format, all data sets have been converted to and are available in compressed NetCDF4 file format. In general, each data file contains the data for one research flight. The files are identified by aircraft identifier (“HALO”, “P5”, “P6”), instrument short name, date, and research flight number according to Table 1. An exception is the data from the fisheye camera. With several gigabytes per hour, these data are very large and are therefore provided in hourly files.
The data sets available on PANGAEA contain all the information needed to work with the data. If not included within the respective data set for the instruments, the aircraft position and altitude are provided in the aircraft master tracks in Herber et al. (2022a, b) and Ehrlich et al. (2024b).
To facilitate the use of the data, the ac3airborne (Mech et al., 2022c) Python module and a collection of codes are provided within the online Jupyter Book How to ac3airborne (Mech et al., 2022b). Within How to ac3airborne, the usage of the data sets is described with Python code snippets. It also includes an overview of the specific data availability of the individual instruments. Most data sets will be automatically downloaded from PANGAEA based on entries in an intake catalog. A central part of the ac3airborne package is the flight segmentation. For each research flight, start and end time stamp of specific sections are listed to easily extract the data of interest. These flight sections differentiate between take-off, landing, ascents, and descents; specific patterns for in situ probing, high-, mid-, or low-level legs; and patterns for calibration purposes. The usage of the segmentation is described in How to ac3airborne.
Giez et al. (2022)Ehrlich et al. (2024b)Kirbus et al. (2024a)Kirbus et al. (2024b)George et al. (2024)Röttenbacher et al. (2023)Schäfer et al. (2023)Schäfer et al. (2024)Luebke et al. (2023)Dorff et al. (2024)Wirth and Groß (2024)Weber et al. (2024b)Weber et al. (2024a)Table 4Available data sets from measurements on HALO during HALO–(𝒜𝒞)3 collected by Ehrlich et al. (2024a).
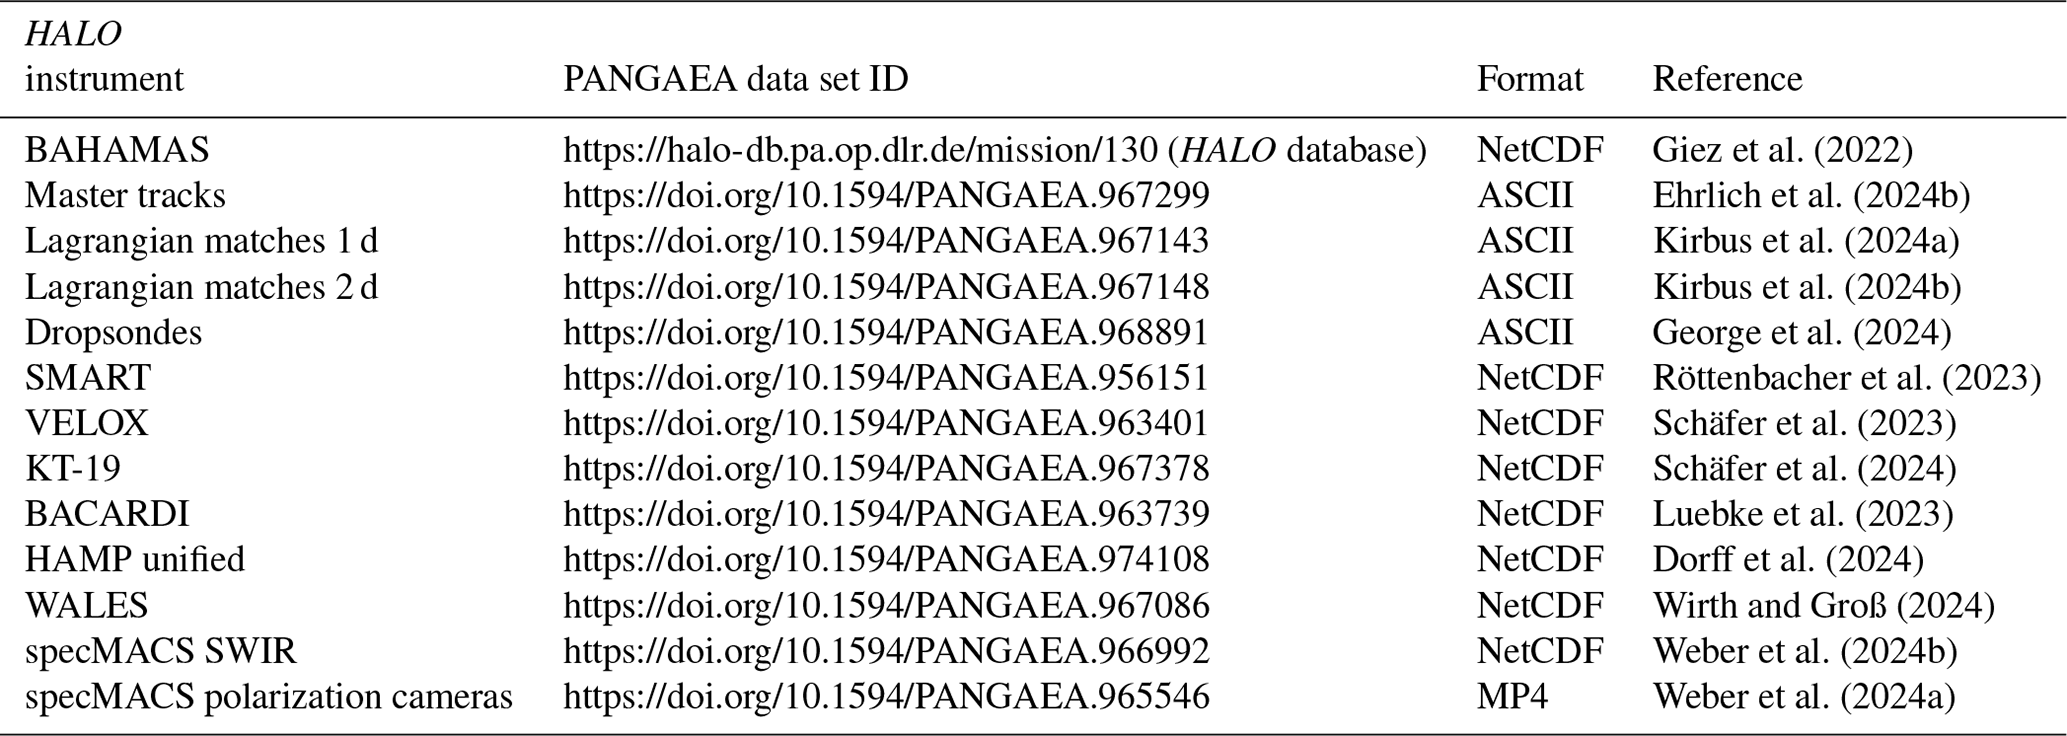
Table 5Available data sets from measurements on Polar 5 during HALO–(𝒜𝒞)3 collected by Mech et al. (2024a).
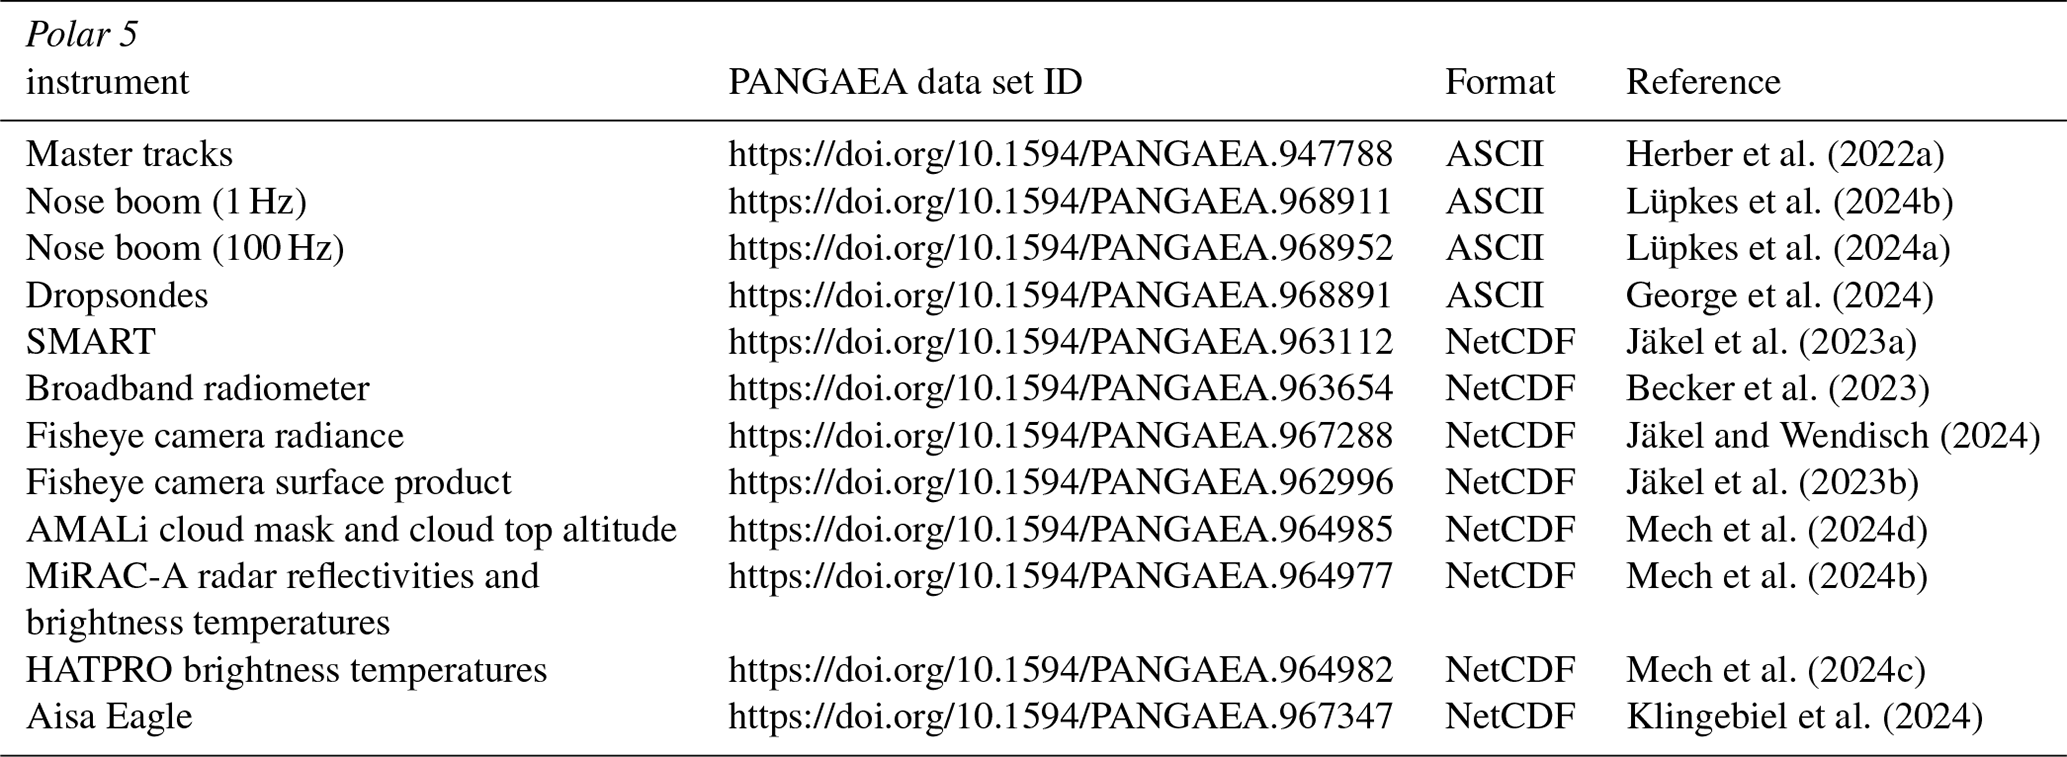
Table 6Available data sets from measurements on Polar 6 during HALO–(𝒜𝒞)3 collected by Herber et al. (2024).
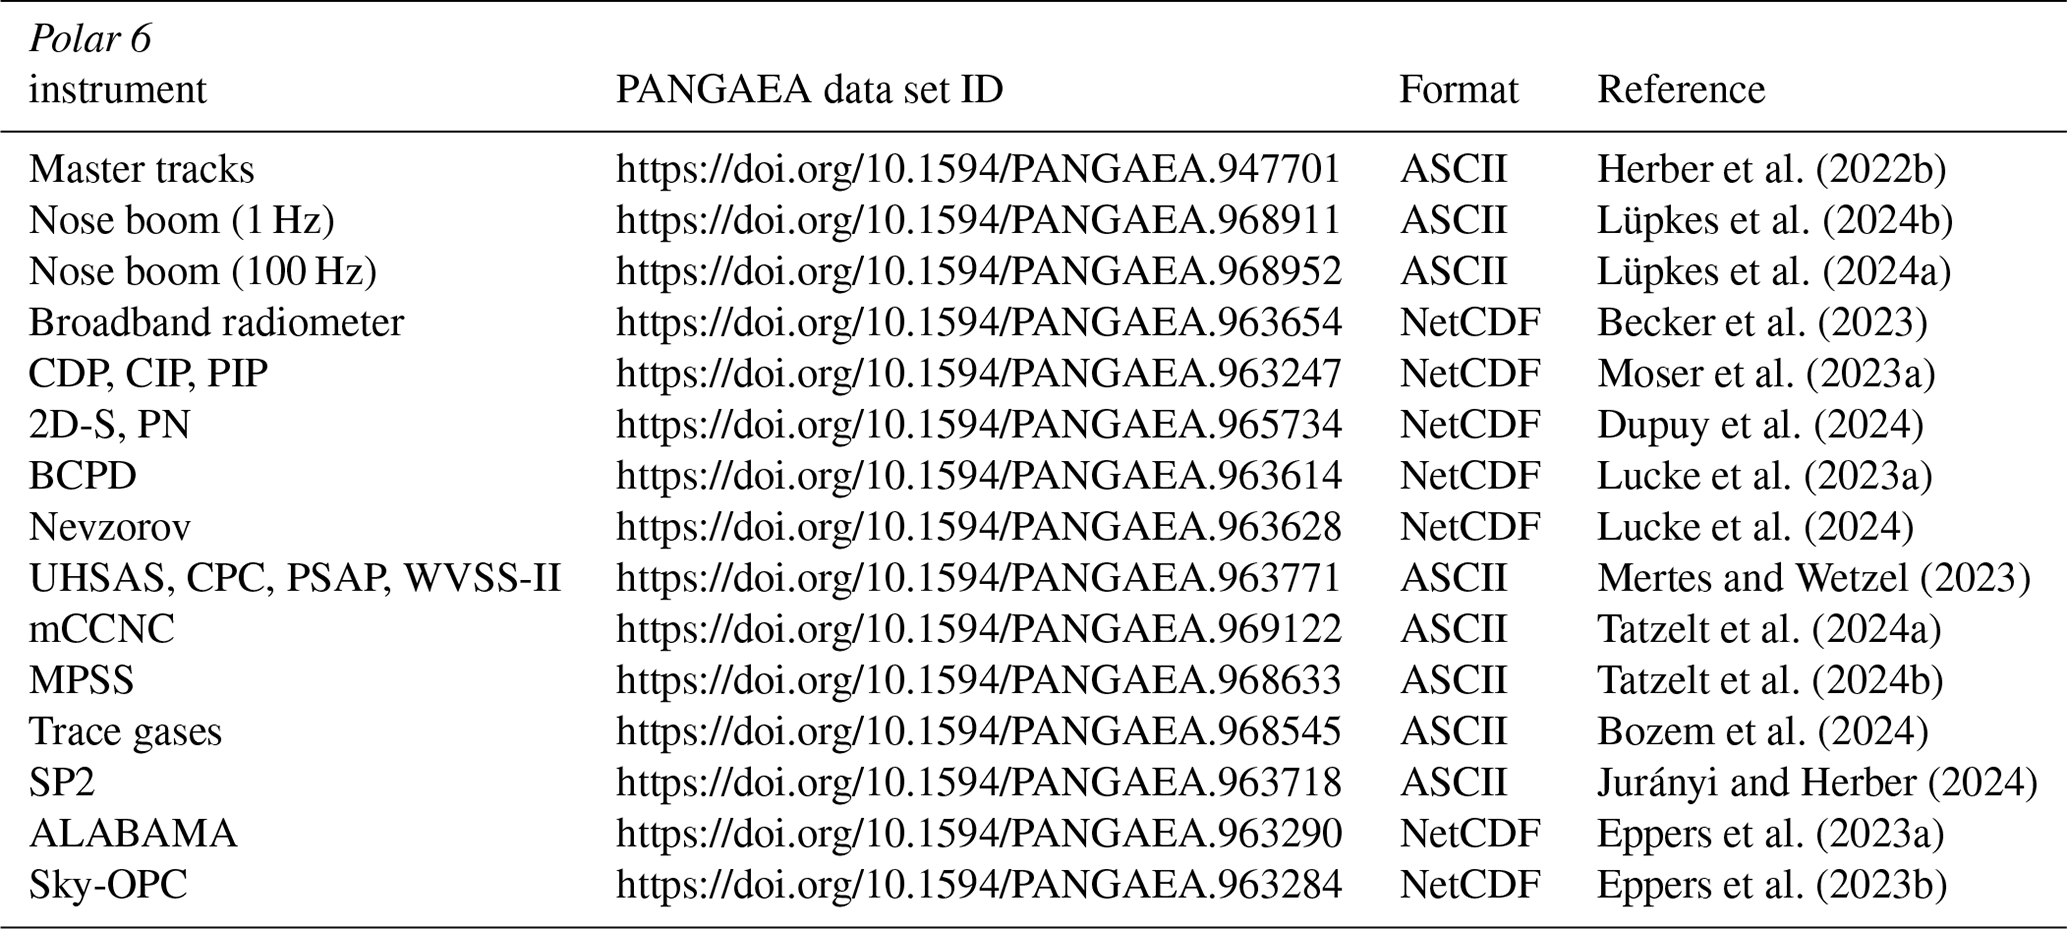
The aircraft measurements of HALO–(𝒜𝒞)3 were partly sampled with similar and/or complementary instrumentation and in different altitudes. The following examples illustrate the added value of combining individual data sets to enhance the potential of data analysis. All data presented here were measured on 1 April 2022 when all three aircraft aimed to characterize a CAO west of Svalbard. A satellite image and the flight tracks are shown in Fig. 5. While almost cloud-free conditions were present over sea ice, roll clouds formed immediately over the open ocean after the cold air mass crossed the sea ice edge. The flight pattern of all three aircraft aimed at characterizing this air mass transformation, particularly the development of the thermodynamic profiles and cloud properties (Kirbus et al., 2024c). While HALO mapped the larger area, Polar 5 and Polar 6 focused on the transition between open ocean and sea ice along the standard leg (Schirmacher et al., 2024). The standard leg was flown six times by Polar 5 and Polar 6, operating in close collocation. For three of these legs, HALO overflights were synchronized with Polar 5. The exact overpass was timed approximately when Polar 5 was in the center of the leg. This coordination of the aircraft allowed us to combine data sets from the different platforms.
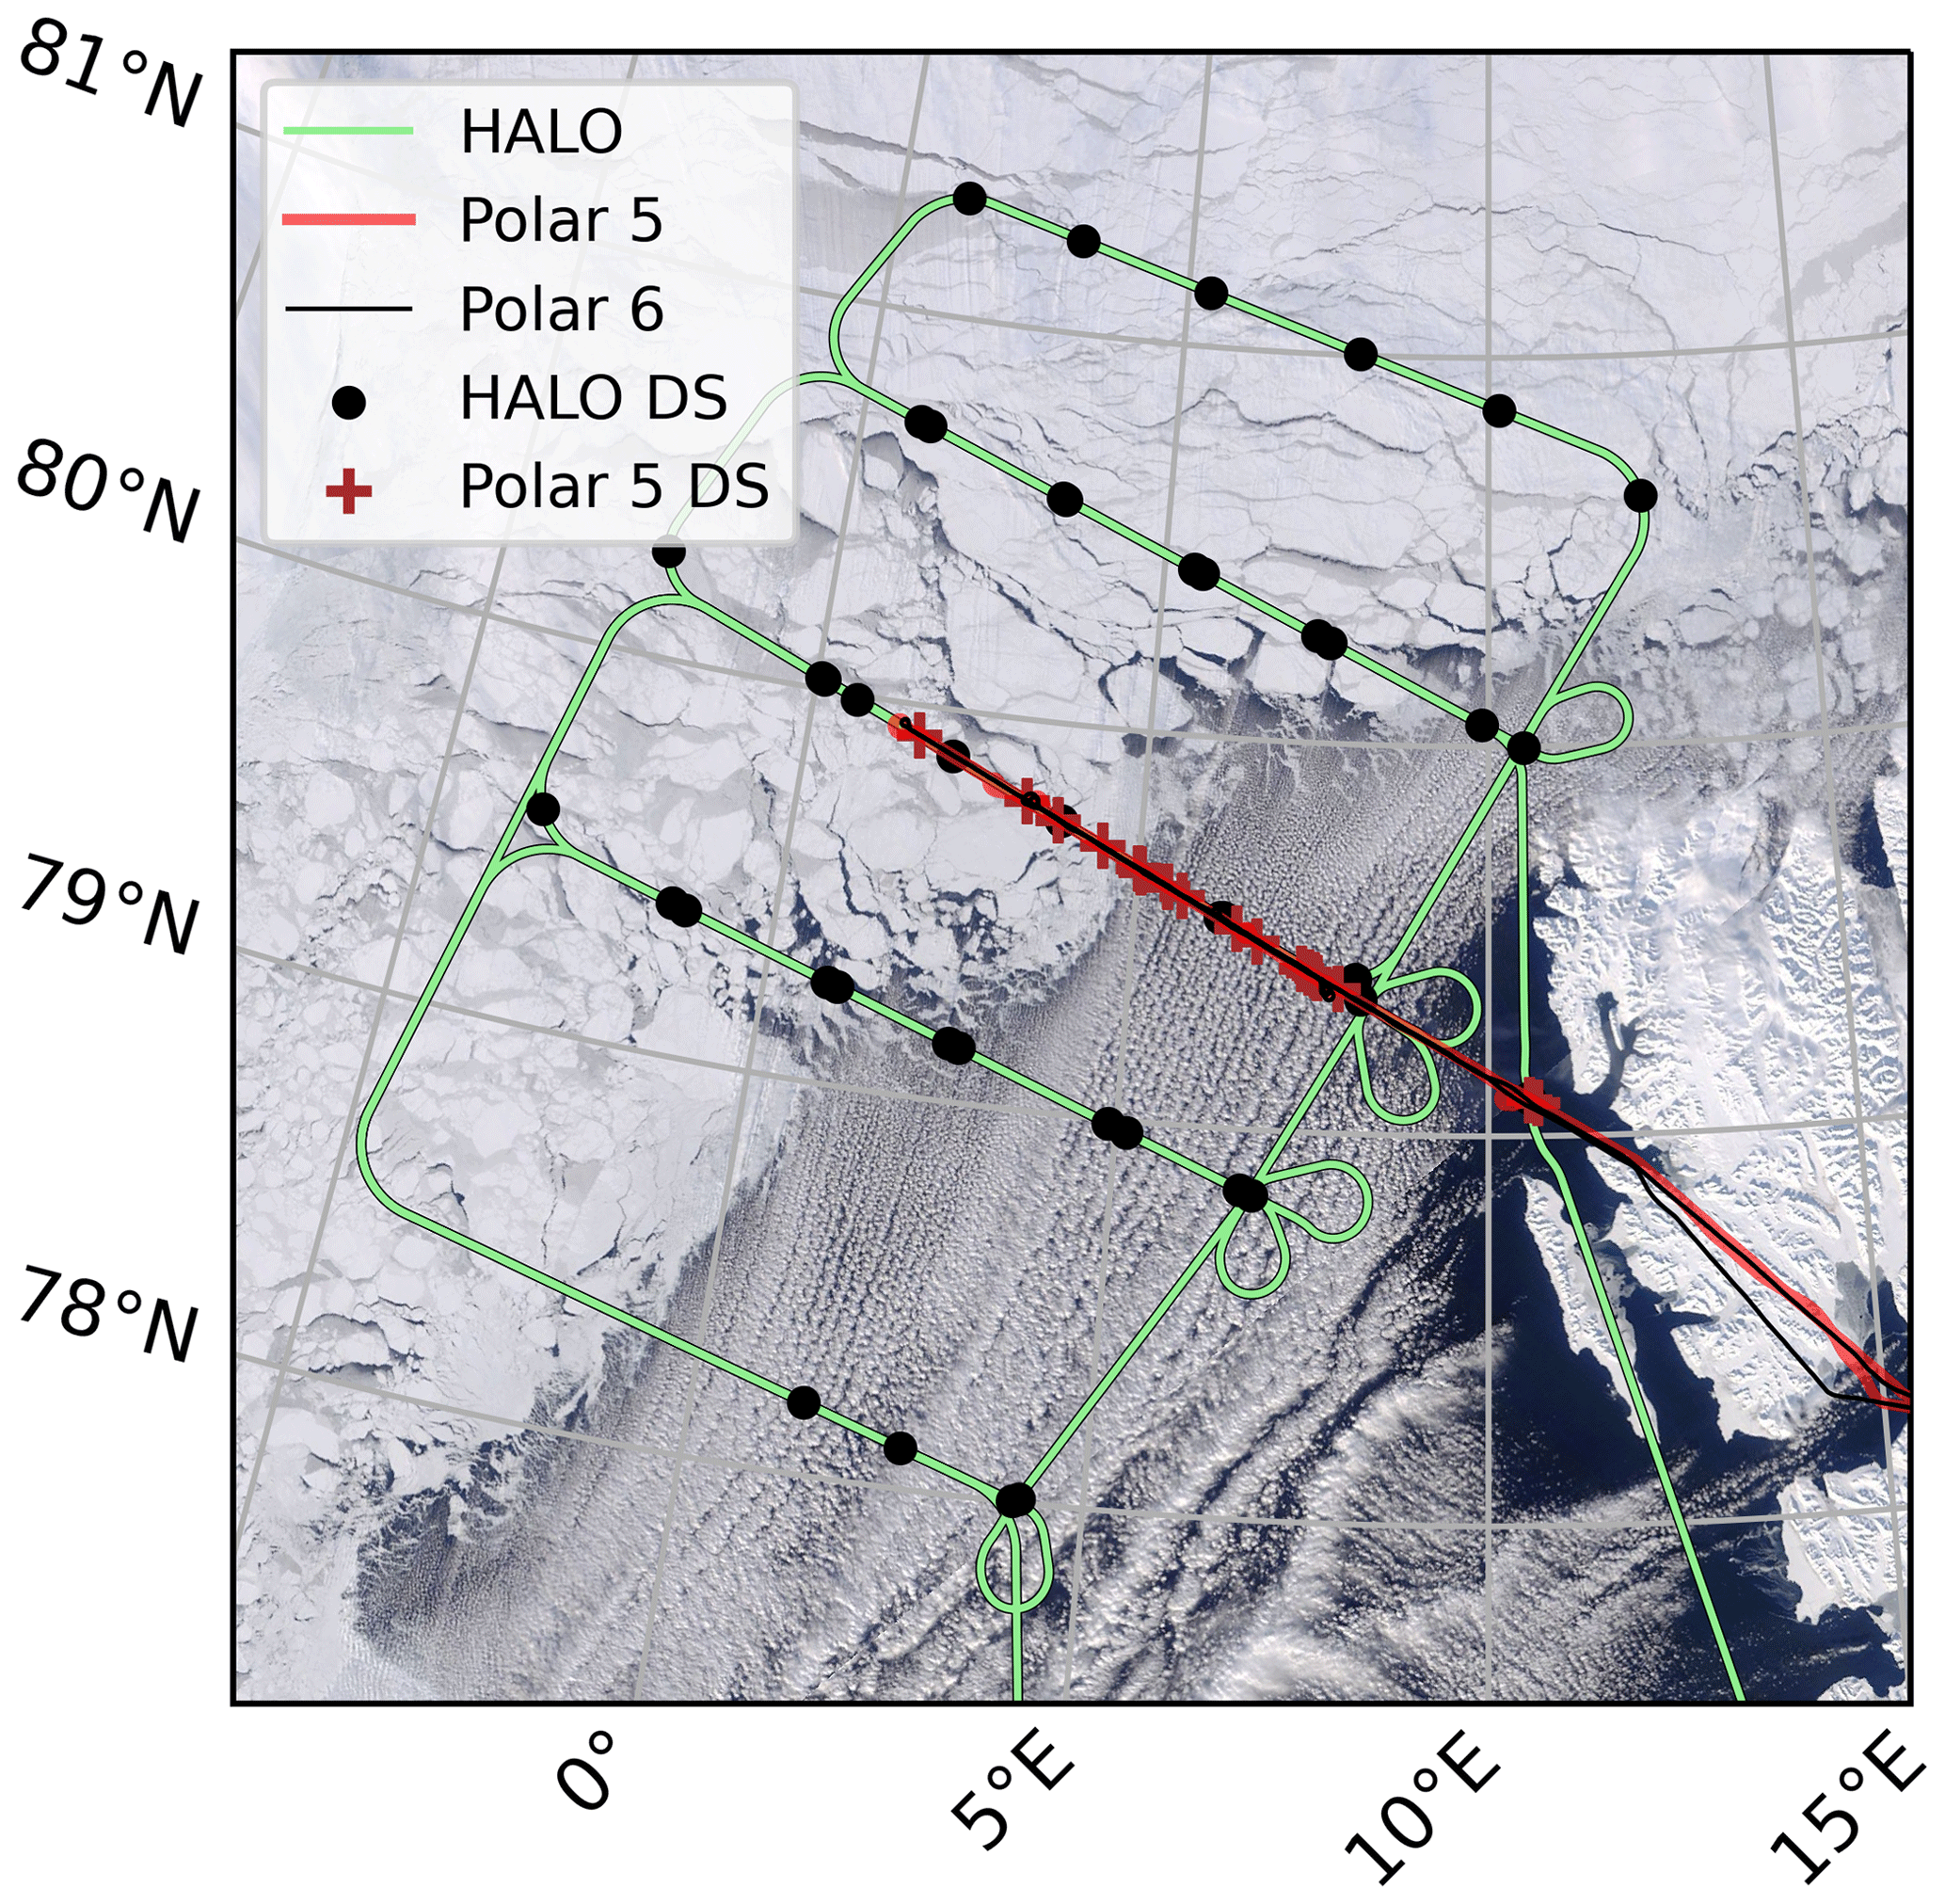
Figure 5Satellite image (MODIS) and flight tracks of HALO, Polar 5, and Polar 6 for a research flight on 1 April 2022. Dots show the locations of dropsonde (DS) releases from HALO and crosses the dropsondes released from Polar 5. Close collocation of all three aircraft was realized along the standard leg.
5.1 Merged dropsonde data
On 1 April 2022, 41 dropsondes were released from HALO and 18 from Polar 5. The locations of the dropsondes covering the transition from sea ice to open ocean are shown in Fig. 5. Due to its extended flight range, the HALO dropsondes are distributed over a larger area, while Polar 5 enhanced the spatial resolution of dropsonde profiles along the standard leg, especially in the MIZ.
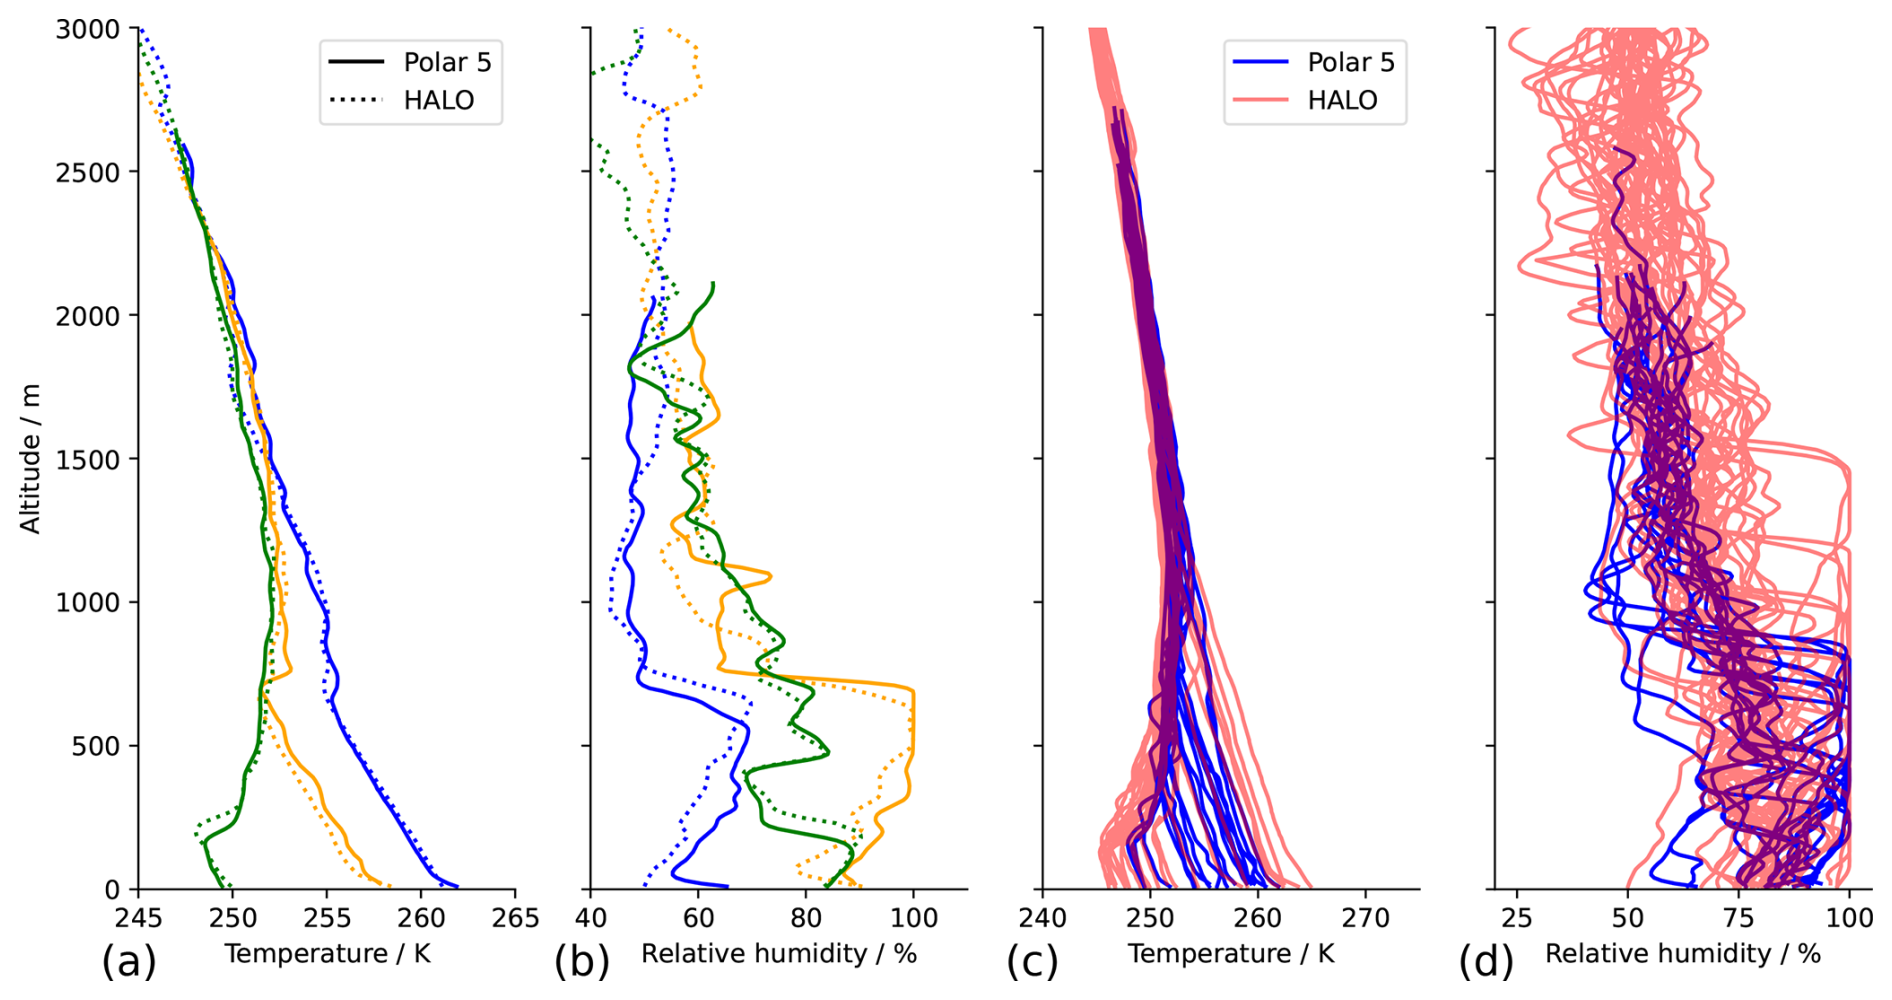
Figure 6Air temperature and relative humidity profiles measured by dropsondes from HALO and Polar 5 on 1 April 2022. Panels (a) and (b) compare three pairs of closely collocated profiles from HALO (dotted) and Polar 5 sondes (solid). Panels (c) and (d) display the merged full data sets from both aircraft.
To merge the dropsonde data from both aircraft into one data set, it is essential that the quality of both data sets is comparable. This was ensured through the data processing and quality controls explained in Sect. 3.1.3. In Fig. 6a the agreement of three HALO dropsondes with the closest Polar 5 dropsondes is analyzed. For each pair of dropsondes, their spatial distance is less than 6 km (at ground), and the time between the releases is between 15 and 45 min. While HALO dropsondes typically sampled the entire troposphere, Polar 5 dropsondes were limited to altitudes below 3 km. However, this is sufficient enough to study transformation processes in the atmospheric boundary layer. The temperature profiles agree within the general uncertainty of the sensors, while the humidity profiles differ slightly, due to the high spatial and temporal variability of the humidity in cloudy conditions.
Assuming steady conditions of the CAO, the air mass transformation on 1 April 2022 is analyzed with an Eulerian approach merging all dropsonde observations. Figure 6c and d present all available soundings obtained during this flight. The spread of the temperature profiles illustrates how the stable surface inversion over sea ice transforms into a well-mixed boundary layer over the open ocean. This transformation occurs over short distances of some 100 km and is undersampled by the HALO dropsondes. The majority of HALO dropsondes were released in larger distances to the sea ice edge either over closed sea ice or open ocean. This results in a bimodal distribution of temperature profiles in the HALO measurements. Adding the Polar 5 observations fills this gap and significantly improves the spatial resolution in the MIZ.
Although the dropsondes were released at different times, Fig. 6 assumes temporally stable conditions. However, comparing dropsonde profiles, which are linked in time by air mass trajectories (cf. quasi-Lagrangian matches discussed in Sect. 3.1.5), allows one to derive vertically resolved air temperature and humidity tendencies and to quantify the air mass transformation (Kirbus et al., 2024c). Merging the HALO and Polar 5 dropsonde data sets significantly increases the number of quasi-Lagrangian matches.
5.2 Combining cloud radar observations from different platforms
Coordinated flights between HALO, Polar 5, and Polar 6 offer the unique opportunity to combine collocated multiple-frequency cloud radar and in situ measurements. The data collected during HALO–(𝒜𝒞)3 can therefore be used to gain a better understanding of the vertical structure of Arctic clouds and investigate microphysical cloud processes. For the 1 April 2022 CAO case, Fig. 7 illustrates the potential of combining effective radar reflectivity Ze observations obtained with the 35 GHz cloud radar on HALO (Fig. 7a) and the 94 GHz cloud radar MiRAC on Polar 5 (Fig. 7b). The data are displayed on the same spatial grid. Due to the faster flight speed of HALO, Fig. 7a covers a shorter time range than Fig. 7b. The exact overpass occurred at 10:22 UTC when both aircraft flew over the cloud-free sea ice (not shown in Fig. 7). Both radars observed similar cloud structures with cloud top altitude increasing with distance to the sea ice edge. High Ze indicates updraft regions with increased formation and growth of ice particles. These updraft regions of the roll clouds are located at almost the same positions.
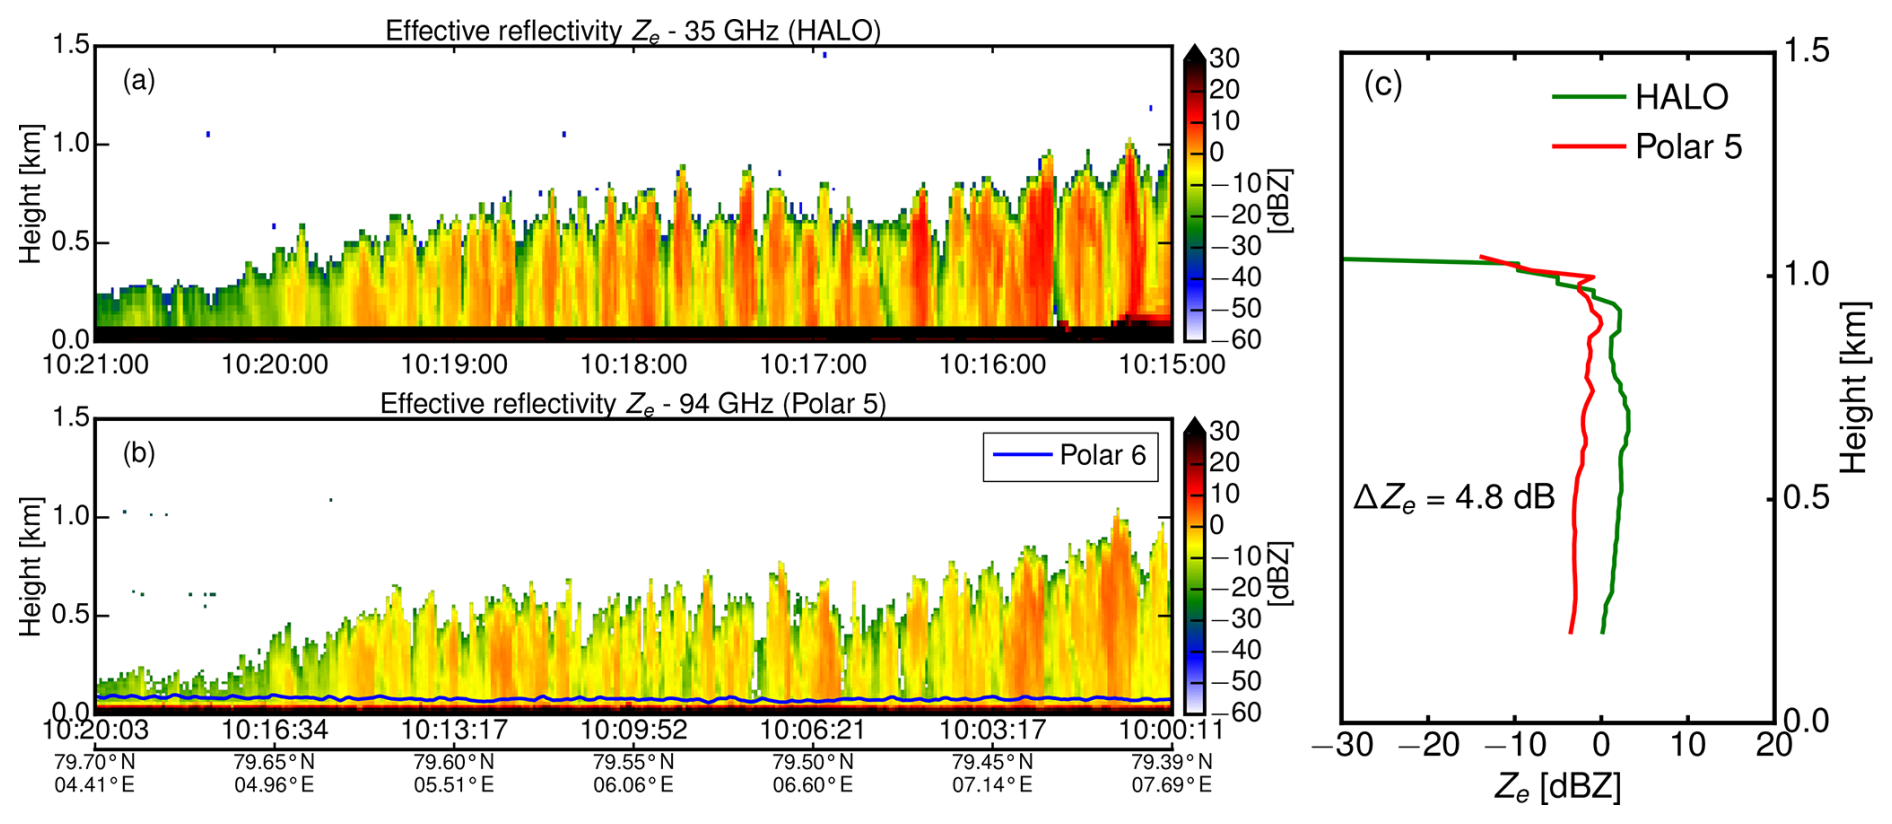
Figure 7Collocated flight between HALO, Polar 5, and Polar 6 on 1 April 2022 to combine observations from (a) the 35 GHz cloud radar on HALO with (b) the 94 GHz cloud radar MIRAC on Polar 5. The mean profiles of dual-wavelength ratio between both radars in (c) are used to interpret in situ measurements from Polar 6 of snow microphysical properties. The blue line in (b) gives the flight altitude of Polar 6 for in situ sampling.
A pixel-by-pixel comparison is only possible for these HALO–(𝒜𝒞)3 cases where a very close collocation of both aircraft was achieved. For the 1 April 2022 case instead, a comparison by means of averaged Ze vertical profiles is done as an alternative and shown in Fig. 7c. Near the cloud top, the Ze values measured at 35 GHz on HALO and 94 GHz on Polar 5 overlap, indicating that the cloud particles are in the Rayleigh scattering regime at both frequencies, corresponding to small particles less than 0.3 mm in diameter. In lower cloud layers, the 35 GHz radar measured higher Ze than the 94 GHz radar, indicating larger, denser particles that are in the Mie scattering regime at 94 GHz but likely still in the Rayleigh regime at 35 GHz (i.e., particles smaller than 0.9 mm). The increase in particle size and density in lower cloud layers indicates particle growth processes such as riming, where liquid droplets freeze onto ice particles. Based on collocated Polar 5 and Polar 6 flight segments during HALO–(𝒜𝒞)3, Maherndl et al. (2024a, b) found riming to occur frequently for over 85 % of the measured ice particles so that riming contributed on average 63 % to the IWC. During the flight segment of the 1 April case analyzed here, Polar 6 flew close to the ground, collecting in situ measurements of the precipitation below clouds. Manual inspection of in situ images indeed reveals indications of riming (not shown). This example demonstrates that, in future studies, dual-wavelength ratios computed for coordinated flight segments have the potential to study ice formation and growth processes depending on the cloud vertical structure.
5.3 Passive remote sensing on different scales and in different spectral ranges
The passive spectral imagers on board HALO (specMACS, VELOX) and Polar 5 (AISA Eagle/Hawk) provide observations across different spectral ranges and resolve clouds and surfaces with different spatial resolutions. Merging these data sets enables the combination of spectral information and the investigation of cloud inhomogeneities on different scales. An example of observations in the MIZ is shown in Fig. 8 for the CAO case observed on 1 April 2022. For two flight sections – one above sea ice (I, with 80 % sea ice cover) and one over open ocean (II, without sea ice) – data measured by all three imagers are combined. The images are collocated by georeferencing each pixel using the geometric calibrations of the optics and aircraft attitude information. For specMACS and AISA Hawk, the image shows spectral radiances at a similar wavelength of about 1200 nm. While specMACS is able to capture surface and cloud structures (bright updraft and darker downdraft regions) with 18 m pixel size (across-track), the lower flight altitude of Polar 5 allows AISA Hawk to resolve finer scales of 5 m pixel size. Even single ice floes can be identified in the cloud-free areas. With help of these different resolutions, 3D radiative effects and the scale dependence of surface and cloud retrieval can be investigated.
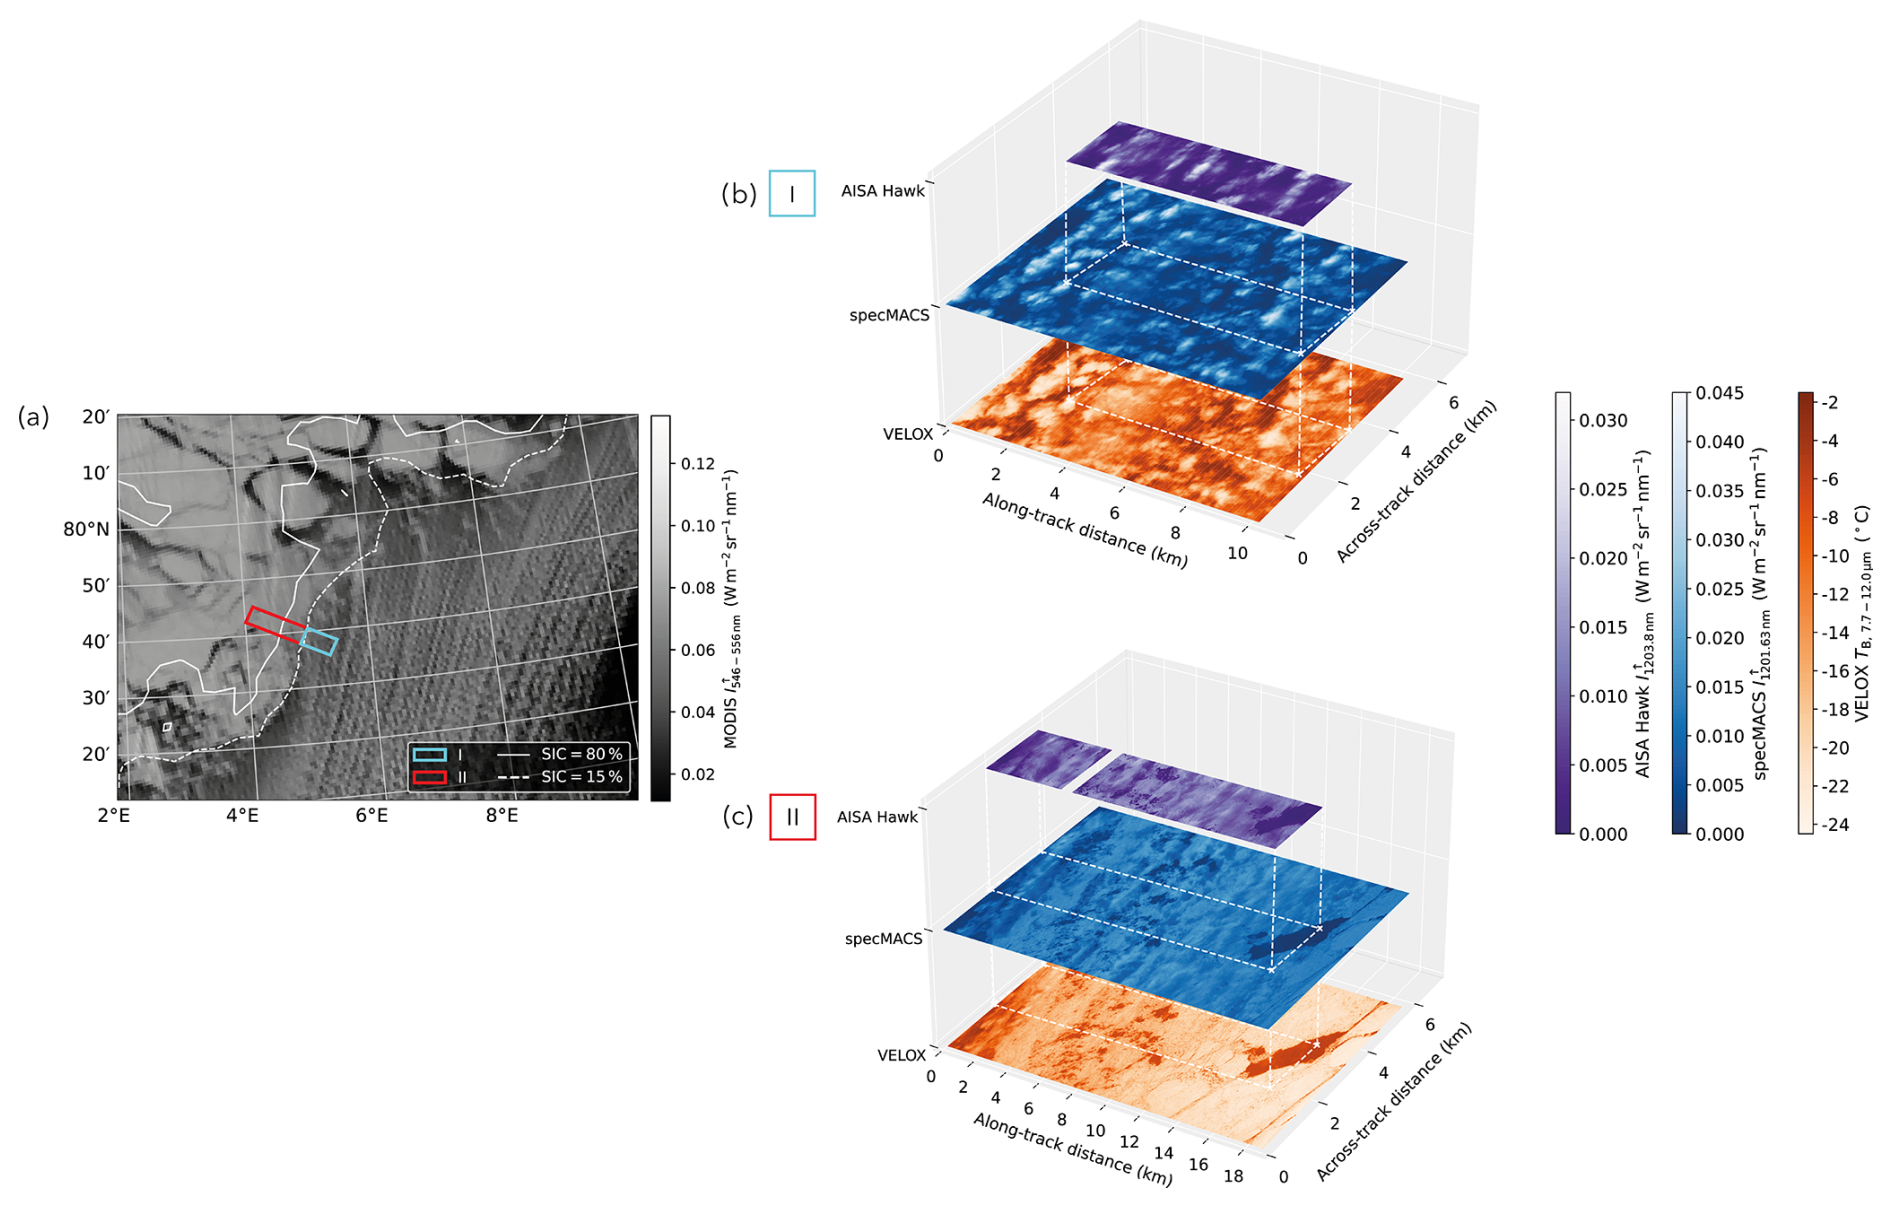
Figure 8Combined data examples from the solar and thermal infrared imagers on board HALO (specMACS and VELOX) and Polar 5 (AISA Hawk). (a) MODIS satellite image indicating the areas of the two example segments I and II. Spectral radiances and brightness temperatures are shown in (b) for segment I and (c) for segment II. For specMACS and AISA Hawk, radiances at 1.2 µm are shown and merged with the brightness temperature of the broadband channel of VELOX (7.7–12 µm).
The two imagers on HALO have almost the same spatial resolution and field of view. Thus, VELOX and specMACS observations can combine radiances in the solar and thermal infrared spectral range. Figure 8 shows the broadband thermal infrared channel of VELOX (7.7–12 µm) and the shortwave infrared channel of specMACS (1.2 µm). Over open water, VELOX brightness temperatures are particularly sensitive to the emission of thin clouds, e.g., the filaments in the downdraft region that often are identified as cloud-free in specMACS. Over sea ice, where the clouds are in their developing stage and thus very low, surface and cloud top temperature are often similar and cannot be distinguished in the VELOX measurements. However, the different spectral absorption of the liquid clouds compared to sea ice makes the clouds detectable in the specMACS image. By combining data from these different spectral ranges, the airborne observations can mimic the most common satellite imaging spectrometers with a superior spatial resolution. Satellite retrieval algorithms can then be applied to the airborne data to quantify the impact of spatial averaging on the satellite products of surface and cloud properties.
5.4 Altitude dependence of the radiant energy budget
The radiant energy budget (REB) in the Arctic depends on various surface, cloud, and thermodynamic properties (Sedlar et al., 2011; Stapf et al., 2021). At the surface, Wendisch et al. (2023b) identified four modes (regimes) of the REB, determined by the surface type (sea ice or open ocean) and the atmospheric state (cloudy or cloud-free conditions). During HALO–(𝒜𝒞)3, the REB, quantified by the net irradiance, was measured on board all three aircraft with a similar set of broadband radiometers. The coordinated combination of the three aircraft provides measurements in different altitude regimes. While Polar 6 sampled the REB close to the surface, the REB above the Arctic boundary layer clouds and close to the tropopause was observed by Polar 5 and HALO, respectively. Combining these data sets allows for an extended statistical analysis of the Arctic REB to higher altitudes.
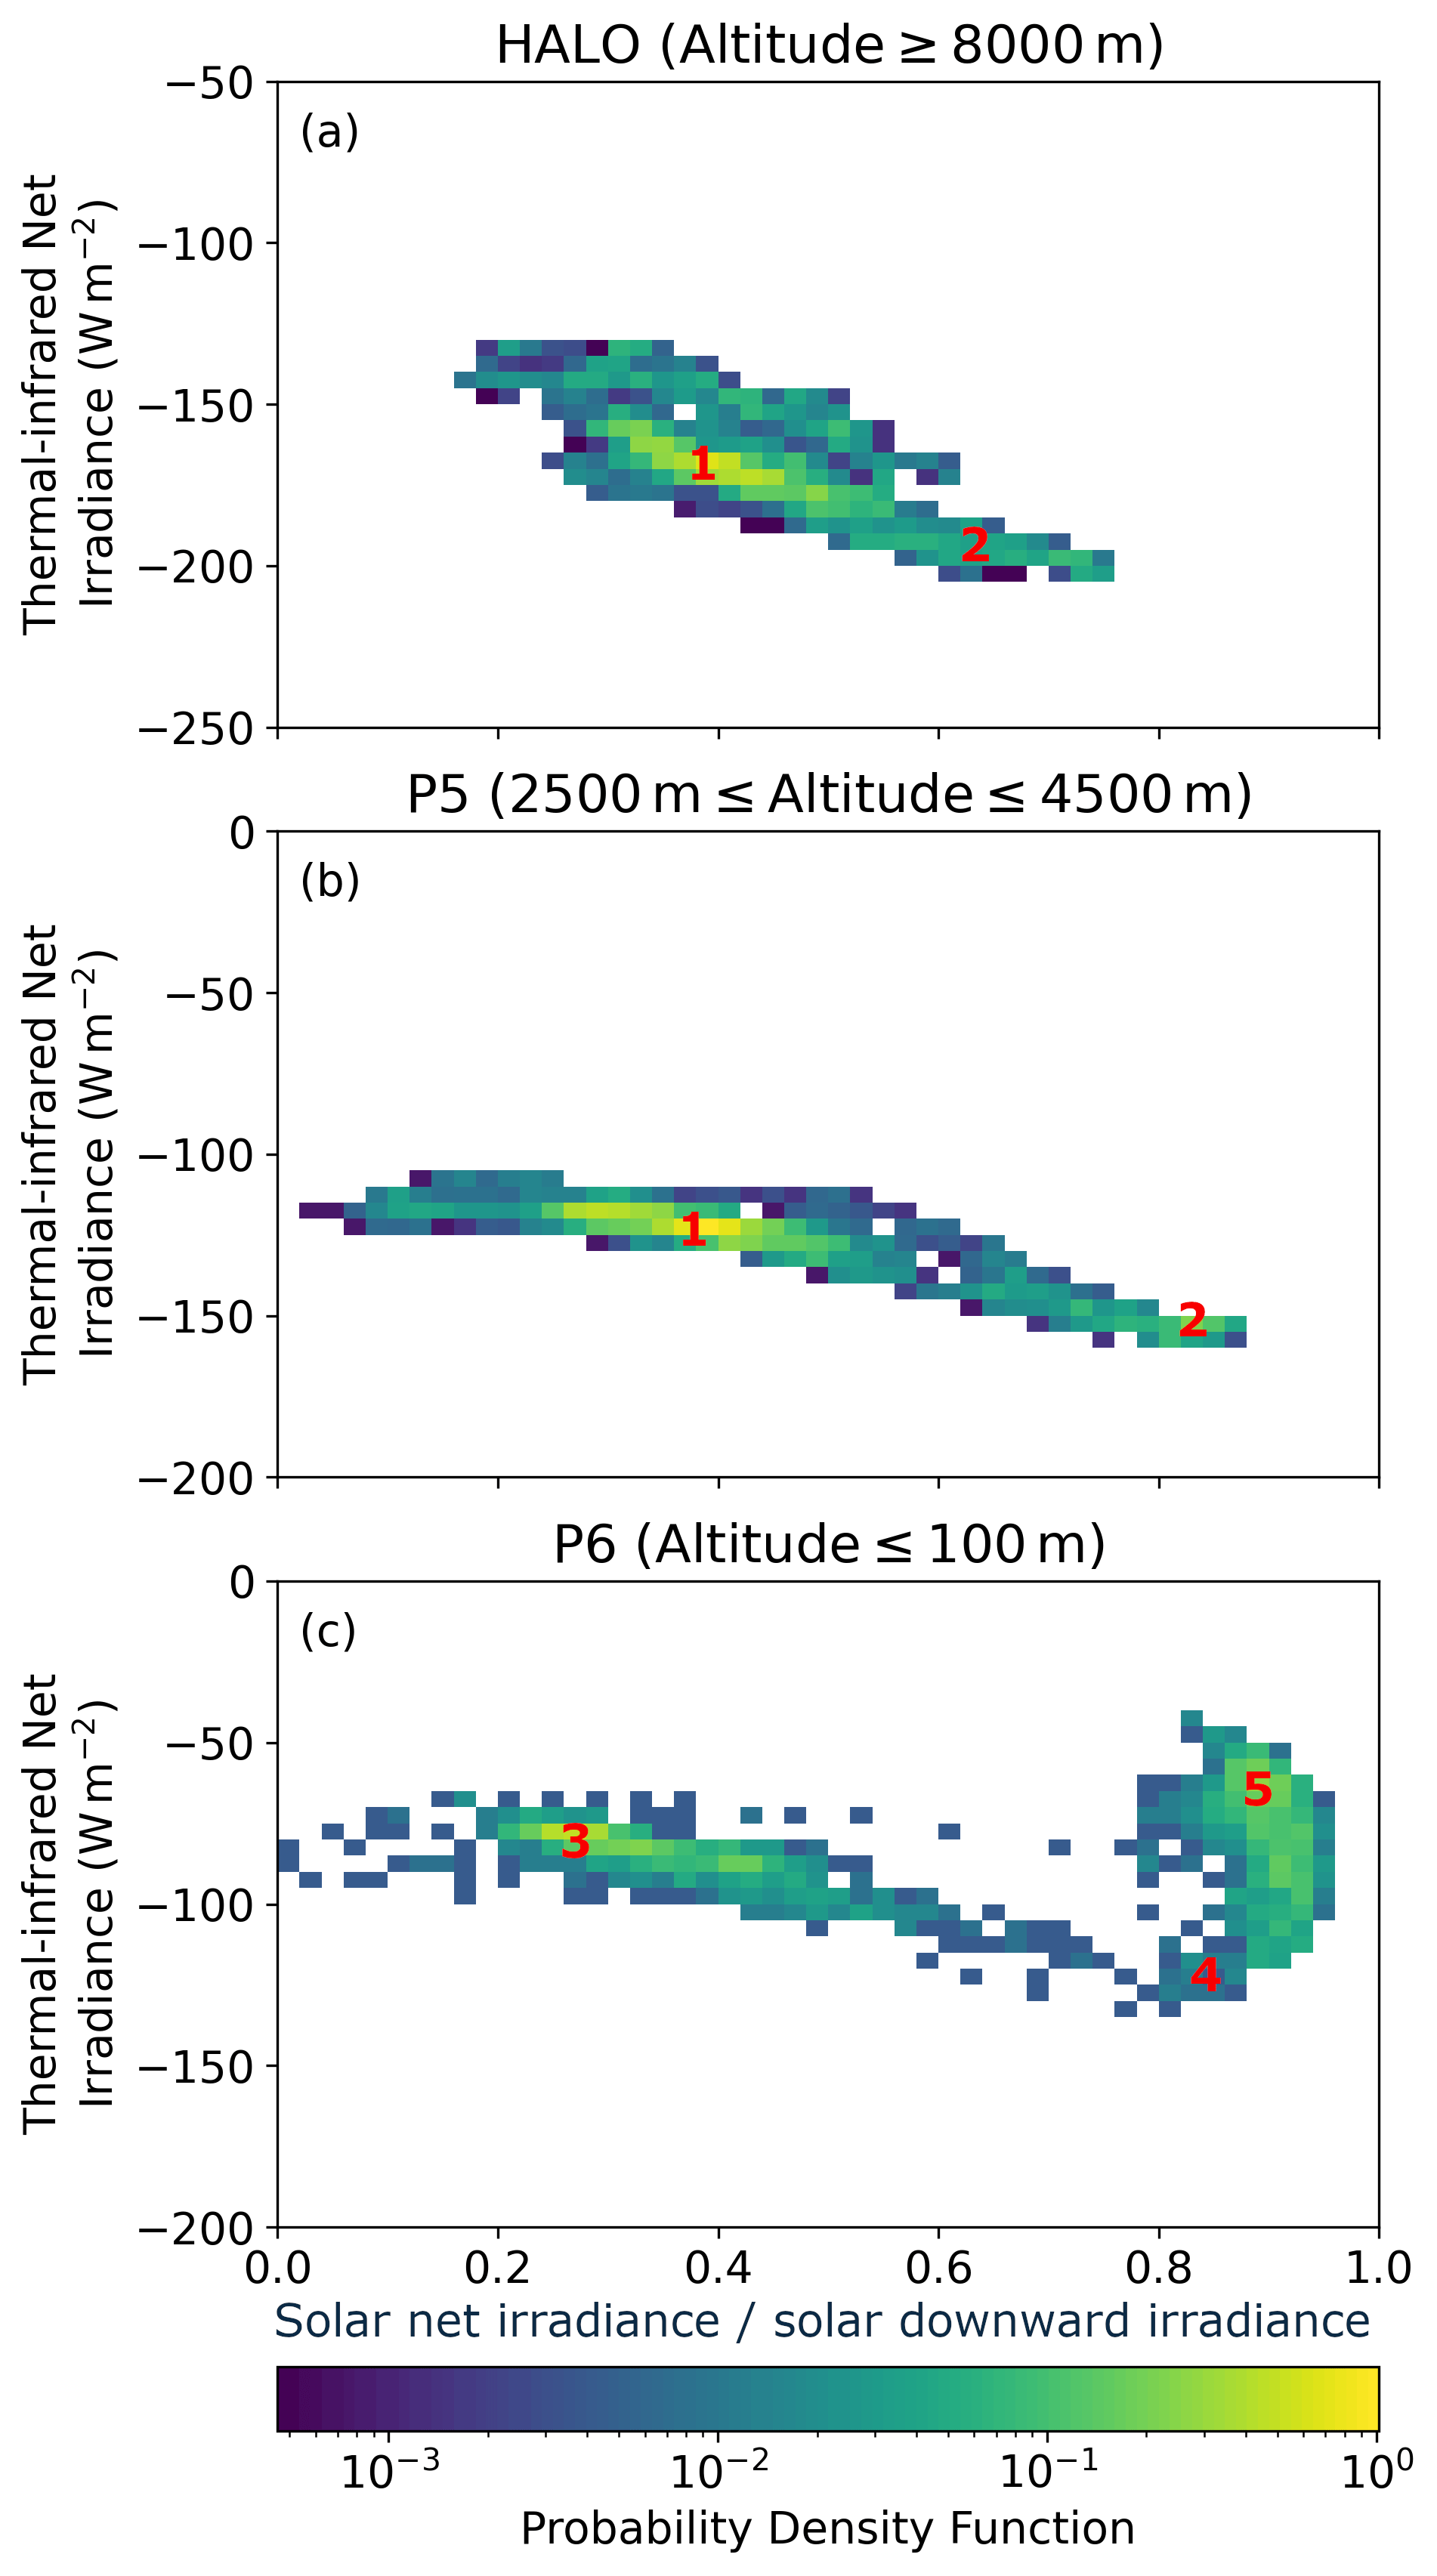
Figure 9Two-dimensional probability density function of the solar (normalized by the solar downward irradiance) and thermal infrared net irradiances observed on 1 April 2022 in different altitude regimes: (a) HALO, (b) Polar 5, and (c) Polar 6 flight altitudes. Mode numbers: 1 – above clouds or sea ice, 2 – above open ocean, 3 – cloud-free over sea ice, 4 – cloud-free over open ocean, 5 – cloudy over open ocean.
For the 1 April 2022 CAO case, Fig. 9 illustrates the altitude dependence of the thermal infrared REB (y axis) and the solar REB normalized by its downward component (x axis). The common mode structure (cloudy and cloud-free, over sea ice and open ocean) is most prominently illustrated in the near-surface REB (modes indicated by 3, 4, and 5; Fig. 9c). Modes 4 and 5 result from the observations in cloud-free and cloudy conditions above Polar 6 when flying over the open ocean. Mode 3 corresponds to cloud-free situations over sea ice (only few clouds were observed over sea ice). For Polar 5 (mid-level regime; Fig. 9b), clouds were not present above the aircraft, leaving a combined mode for weaker emitting cases above sea ice or low clouds (mode 1) and a mode for cloud-free observations above the darker open ocean (mode 2). The REB at high altitudes (Fig. 9a) shows a continuous transition between modes 1 and 2 and less extreme values due to the averaging of the larger field of view. In general, the thermal infrared net irradiance becomes more negative with increasing altitude. This is mostly caused by the reduction of the downward irradiance emitted by the atmosphere above the aircraft, as the effective brightness temperature decreases for higher altitudes. Numerical models often struggle to correctly represent this mode structure due to limitations in the treatment of subgrid processes including clouds and the sea ice albedo (Kretzschmar et al., 2020; Solomon et al., 2023). Consequently, the combined HALO–(𝒜𝒞)3 measurements are valuable for identifying potential misrepresentations of properties affecting the REB.
Each instrument is controlled by code either developed by the institution operating it or by the manufacturer. Therefore, the source is often closed or not even freely available and bundled with the instrument. Below, the publicly available software is listed.
The ac3airborne package and tools developed within the project are written in Python, are open-source, and are publicly available (https://doi.org/10.5281/zenodo.7305585, Mech et al., 2022c). The data from instruments on Polar 5 were processed identically to previous campaigns using a publicly available Python-based package (https://doi.org/10.5281/zenodo.7390347, Mech, 2022). On Polar 6, the SP2 data were analyzed using the WaveMetrics IGOR Pro 7 toolkit (SP2 toolkit 4.115) available at https://doi.org/10.5281/zenodo.3575186 (Gysel-Beer and Corbin, 2019). On HALO, HAMP brightness temperature offsets were corrected with the post-correction code, which is available on GitHub (https://doi.org/10.5281/zenodo.15085734, Walbröl, 2025). The dropsonde raw data from Polar 5 and HALO were post-processed with the Atmospheric Sounding Processing ENvironment (ASPEN Version 4.0.0, https://www.eol.ucar.edu/content/aspen, Martin and Suhr, 2024).
Data availability is summarized in Tables 4 (https://doi.org/10.1594/PANGAEA.968885, Ehrlich et al., 2024a), 5 (https://doi.org/10.1594/PANGAEA.968883, Mech et al., 2024a), and 6 (https://doi.org/10.1594/PANGAEA.968884, Herber et al., 2024) of the main text.
During the HALO–(𝒜𝒞)3 campaign, a comprehensive in situ and remote sensing observational data set was collected, characterizing Arctic air mass transformations during warm-air intrusions (WAIs) with on-ice flow and cold-air outbreaks (CAOs) with off-ice flow. The data set comprises measurements from three research aircraft: HALO, Polar 5, and Polar 6. Each was operated at different altitudes and with different spatial coverage. All data are published in the PANGAEA database by instrument-separated data subsets. This paper provides an overview of these data sets, the campaign-specific instrument operation, data processing, and quality. For detailed information, respective references are provided. To facilitate the quasi-Lagrangian analysis of the airborne data, the locations of quasi-Lagrangian matches were published. As it is important for potential model evaluations, an overview of the meteorological data transferred to the Global Telecommunication System (GTS) and assimilated by the ECMWF services is given in this paper.
It is highlighted how the scientific analysis of the HALO–(𝒜𝒞)3 data benefits from the coordinated operation of three aircraft. For a CAO case, it is shown that the higher spatial resolution of measurements by Polar 5 and Polar 6 in a smaller area close to the marginal sea ice zone (MIZ) complements the less resolved but wider-spread observations of HALO. Merging the dropsonde data provides an almost continuous view on the evolution of cold air masses during a CAO. The radiative energy budget and clouds and surface properties can be resolved on different scales by remote sensing instruments on HALO and Polar 5. Synergistic effects of multifrequency radar remote sensing and multiwavelength passive remote sensing are demonstrated. For example, riming of ice particles is identified within the clouds of the CAO.
A series of ongoing studies have already made use of the HALO–(𝒜𝒞)3 data, concentrating on some of the highlights presented by Wendisch et al. (2024). These studies are collected in the inter-journal special issue of Atmospheric Chemistry and Physics and Atmospheric Measurement Techniques entitled “HALO–(𝒜𝒞)3 – an airborne campaign to study air mass transformations during warm-air intrusions and cold-air outbreaks” (Krämer et al., 2023). However, the data set has a lot of further potential for detailed studies on the evolution of thermodynamic and cloud properties in air mass transformations, the Arctic moisture and radiative energy budget, cloud–aerosol interaction, improvement in satellite remote sensing, mesoscale dynamics in the Arctic, validation of cloud-resolving numerical models, and more. The use of HALO–(𝒜𝒞)3 data is encouraged as a continuation of a series of previous aircraft campaigns with an almost identical instrumental setup. Data from ACLOUD, AFLUX, and MOSAiC-ACA (all data published on PANGAEA; Ehrlich et al., 2019; Mech et al., 2022a) complement the HALO–(𝒜𝒞)3 observations for different seasons and sea ice conditions and allow for statistically solid analyses of atmosphere, cloud, aerosol, trace gas, and sea ice properties. Further data products that are currently in development will be added to PANGAEA in the future and will be linked to the current data set within PANGAEA via the tag “HALO–(𝒜𝒞)3”.
MWe, SC, MMe, AH, MK, CL, SBo, and AE conceived the flight missions. AE designed the structure of the manuscript and merged and harmonized the contributions of the individual instrument groups. MB maintained and provided the infrastructure for quicklooks and data exchange during the campaign and is responsible for the data management of the (𝒜𝒞)3 project. The instrument operation, data processing, and publication, as well as the description provided in the corresponding sections, were organized by the individual groups as follows.
On HALO, AG and CM were responsible for the basic data acquisition system BAHAMAS. MS and SR were responsible for VELOX and KT-19. AL and JR were responsible for BACARDI and SMART. HD was responsible for HAMP radiometer and FE for the calibration of HAMP radar. HD prepared the HAMP unified data set, with contributions from AWa and FE. VP and AWe were responsible for specMACS. MWi was responsible for the WALES lidar. On Polar 5, CL and JH were responsible for the basic meteorological data and nose boom measurements. SBe, EJ, HM, and MK were responsible for broadband radiometer, AISA Eagle/Hawk, SMART, Nikon, and KT-19. MMe, IS, SaS, and NR were responsible for MiRAC-A, HATPRO, and AMALi. On Polar 6, CL and JH were responsible for the basic meteorological data and nose boom measurements. RD, CG, OJ, and GM were responsible for the 2D-S and PN instruments. JM, EDLTC, CV, JL, and MMo were responsible for the BCPD, Nevzorov probe, CDP, CIP, and PIP. SM and BW were in charge for CVI inlet and the CPC, UHSAS, PSAP, and WVSS-II instruments. ZJ and AH were responsible for the SP2 measurements. FS, JScha, and SG were responsible for HERA and the offline INP measurements. GR and CT were responsible for the mCCNC. HCC, OE, JSchn, and PJ were responsible for the ALABAMA and the Sky-OPC. HB was responsible for the trace gas measurements with the support of HCC, OE, JSchn, and PJ.
The dropsonde launches on Polar 5 and HALO were coordinated by GG, MMe, and AL. GG was responsible for post-processing and publishing the data set with support of MK. AS evaluated the assimilation of dropsonde data in GTS and wrote Sect. 3.1.4. BK performed the quasi-Lagrangian analysis by trajectory calculations and contributed to Sect. 3.1.5. The combined analysis of dropsonde measurements in Sect. 5.1 was contributed by MK, GG, and AE. Section 5.2, the analysis to combine cloud radar observations from different platforms, was compiled by FE, MMa, MMe, and NM. The comparison of the imaging spectrometers in Sect. 5.3 was led by SR, MS, and AE. All authors (except HB, MB, CG, OJ, GR, SR, AS, and CT) conducted the field campaign. All authors revised the manuscript.
The contact author has declared that none of the authors has any competing interests.
Publisher's note: Copernicus Publications remains neutral with regard to jurisdictional claims made in the text, published maps, institutional affiliations, or any other geographical representation in this paper. While Copernicus Publications makes every effort to include appropriate place names, the final responsibility lies with the authors.
We gratefully acknowledge the funding by the Deutsche Forschungsgemeinschaft (DFG, German Research Foundation), within the Transregional Collaborative Research Center (TRR 172) “ArctiC Amplification: Climate Relevant Atmospheric and SurfaCe Processes, and Feedback Mechanisms (AC)3”. The authors are grateful to AWI for providing and operating the Polar 5 and Polar 6 aircraft. We thank the crews and the technicians of the three research aircraft for excellent technical and logistical support. The generous funding of the flight hours for the Polar 5 and Polar 6 aircraft by AWI is greatly appreciated. We are further grateful for funding by DFG within the framework of Priority Program SPP 1294 to promote research with HALO. From DFG SPP 1294, HALO funding is acknowledged by Elena De La Torre Castro, Christiane Voigt, Hans-Christian Clemen, and Johannes Schneider.
Johannes Lucke received funding from the European Union's Horizon 2020 research program SENS4ICE; Johanna Mayer, Philipp Joppe, Oliver Eppers, and Manuel Moser acknowledge funding from the Deutsche Forschungsgemeinschaft (DFG) within the Transregional Collaborative Research Center (TRR 301) “The Tropopause Region in a Changing Atmosphere”.
This research has been supported by the Deutsche Forschungsgemeinschaft (grant nos. 268020496, 316646266, 428312742, 442647984, 442648575, and 522359172) and the EU Horizon 2020 (grant no. 82425).
This paper was edited by Graciela Raga and reviewed by two anonymous referees.
Bannehr, L. and Schwiesow, R.: A Technique to Account for the Misalignment of Pyranometers Installed on Aircraft, J. Atmos. Ocean. Tech., 10, 774–777, https://doi.org/10.1175/1520-0426(1993)010<0774:ATTAFT>2.0.CO;2, 1993. a
Baumgardner, D., Jonsson, H., Dawson, W., O'Connor, D., and Newton, R.: The cloud, aerosol and precipitation spectrometer: a new instrument for cloud investigations, Atmos. Res., 59–60, 251–264, https://doi.org/10.1016/s0169-8095(01)00119-3, 2001. a, b, c
Becker, S., Ehrlich, A., and Wendisch, M.: Aircraft measurements of broadband irradiances onboard Polar 5 and Polar 6 during the HALO-(AC)3 campaign in spring 2022, PANGAEA [data set], https://doi.org/10.1594/PANGAEA.963654, 2023. a, b, c, d
Beswick, K., Baumgardner, D., Gallagher, M., Volz-Thomas, A., Nedelec, P., Wang, K.-Y., and Lance, S.: The backscatter cloud probe – a compact low-profile autonomous optical spectrometer, Atmos. Meas. Tech., 7, 1443–1457, https://doi.org/10.5194/amt-7-1443-2014, 2014. a, b
Bierwirth, E., Wendisch, M., Ehrlich, A., Heese, B., Tesche, M., Althausen, D., Schladitz, A., Müller, D., Otto, S., Thomas Trautmann, T. D., Von Hoyningen-Huene, W., and Kahn, R.: Spectral surface albedo over Morocco and its impact on radiative forcing of Saharan dust, Tellus B, 61, 252–269, https://doi.org/10.1111/j.1600-0889.2008.00395.x, 2009. a
Boers, R., Mitchell, R. M., and Krummel, P. B.: Correction of aircraft pyranometer measurements for diffuse radiance and alignment errors, J. Geophys. Res., 103, 16753–16758, https://doi.org/10.1029/98JD01431, 1998. a
Bond, T. C., Anderson, T. L., and Campbell, D.: Calibration and intercomparison of filter-based measurements of visible light absorption by aerosols, Aerosol Sci. Tech., 30, 582–600, https://doi.org/10.1080/027868299304435, 1999. a, b, c
Bozem, H., Hoor, P., Kunkel, D., Köllner, F., Schneider, J., Herber, A., Schulz, H., Leaitch, W. R., Aliabadi, A. A., Willis, M. D., Burkart, J., and Abbatt, J. P. D.: Characterization of transport regimes and the polar dome during Arctic spring and summer using in situ aircraft measurements, Atmos. Chem. Phys., 19, 15049–15071, https://doi.org/10.5194/acp-19-15049-2019, 2019. a
Bozem, H., Eppers, O., and Hoor, P.: Polar 6 trace gas mesurements of CO, CO2, H2O and O3 during HALO-AC3 in Longyearbyen during March and April 2022, PANGAEA [data set], https://doi.org/10.1594/PANGAEA.968545, 2024. a, b
Brands, M., Kamphus, M., Böttger, T., Schneider, J., Drewnick, F., Roth, A., Curtius, J., Voigt, C., Borbon, A., Beekmann, M., Bourdon, A., Perrin, T., and Borrmann, S.: Characterization of a Newly Developed Aircraft–Based Laser Ablation Aerosol Mass Spectrometer (ALABAMA) and First Field Deployment in Urban Pollution Plumes over Paris during MEGAPOLI 2009, Aerosol Sci. Tech., 45, 46–64, https://doi.org/10.1080/02786826.2010.517813, 2011. a
Brown, P. R. A. and Francis, P. N.: Improved Measurements of the Ice Water Content in Cirrus Using a Total-Water Probe, J. Atmos. Ocean. Tech., 12, 410–414, https://doi.org/10.1175/1520-0426(1995)012<0410:IMOTIW>2.0.CO;2, 1995. a
Bundke, U., Berg, M., Houben, N., Ibrahim, A., Fiebig, M., Tettich, F., Klaus, C., Franke, H., and Petzold, A.: The IAGOS-CORE aerosol package: instrument design, operation and performance for continuous measurement aboard in-service aircraft, Tellus B, 67, 28339, https://doi.org/10.3402/tellusb.v67.28339, 2015. a, b
Burba, G. G., McDermitt, D. K., Anderson, D. J., Furtaw, M. D., and Eckles, R.: Novel design of an enclosed CO2/H2O gas analyser for eddy covariance flux measurements, Tellus B, 62, 743–748, https://doi.org/10.1111/j.1600-0889.2010.00468.x, 2010. a, b
Cai, Y., Montague, D. C., Mooiweer-Bryan, W., and Deshler, T.: Performance characteristics of the ultra high sensitivity aerosol spectrometer for particles between 55 and 800 nm: Laboratory and field studies, J. Aerosol Sci., 39, 759–769, https://doi.org/10.1016/j.jaerosci.2008.04.007, 2008. a
Carlsen, T., Birnbaum, G., Ehrlich, A., Helm, V., Jäkel, E., Schäfer, M., and Wendisch, M.: Parameterizing anisotropic reflectance of snow surfaces from airborne digital camera observations in Antarctica, The Cryosphere, 14, 3959–3978, https://doi.org/10.5194/tc-14-3959-2020, 2020. a, b, c
Chellini, G., Gierens, R., Ebell, K., Kiszler, T., Krobot, P., Myagkov, A., Schemann, V., and Kneifel, S.: Low-level mixed-phase clouds at the high Arctic site of Ny-Ålesund: a comprehensive long-term dataset of remote sensing observations, Earth Syst. Sci. Data, 15, 5427–5448, https://doi.org/10.5194/essd-15-5427-2023, 2023. a
Chen, J., Wu, Z., Augustin-Bauditz, S., Grawe, S., Hartmann, M., Pei, X., Liu, Z., Ji, D., and Wex, H.: Ice-nucleating particle concentrations unaffected by urban air pollution in Beijing, China, Atmos. Chem. Phys., 18, 3523–3539, https://doi.org/10.5194/acp-18-3523-2018, 2018. a
Clemen, H.-C., Schneider, J., Klimach, T., Helleis, F., Köllner, F., Hünig, A., Rubach, F., Mertes, S., Wex, H., Stratmann, F., Welti, A., Kohl, R., Frank, F., and Borrmann, S.: Optimizing the detection, ablation, and ion extraction efficiency of a single-particle laser ablation mass spectrometer for application in environments with low aerosol particle concentrations, Atmos. Meas. Tech., 13, 5923–5953, https://doi.org/10.5194/amt-13-5923-2020, 2020. a, b
Dahlke, S., Solbès, A., and Maturilli, M.: Cold Air Outbreaks in Fram Strait: Climatology, Trends, and Observations During an Extreme Season in 2020, J. Geophys. Res.-Atmos., 127, e2021JD035741, https://doi.org/10.1029/2021JD035741, 2022. a, b
De La Torre Castro, E., Jurkat-Witschas, T., Afchine, A., Grewe, V., Hahn, V., Kirschler, S., Krämer, M., Lucke, J., Spelten, N., Wernli, H., Zöger, M., and Voigt, C.: Differences in microphysical properties of cirrus at high and mid-latitudes, Atmos. Chem. Phys., 23, 13167–13189, https://doi.org/10.5194/acp-23-13167-2023, 2023. a
Dorff, H., Aubry, C., Ewald, F., Hirsch, L., Jansen, F., Konow, H., Mech, M., Ori, D., Ringel, M., Walbröl, A., Crewell, S., Ehrlich, A., Wendisch, M., and Ament, F.: Unified Airborne Active and Passive Microwave Measurements over Arctic Sea Ice and Ocean during the HALO-(AC)3 Campaign in Spring 2022 (v2.7), PANGAEA [data set], https://doi.org/10.1594/PANGAEA.974108, 2024. a, b
Dupuy, R., Mioche, G., Gourbeyre, C., and Jourdan, O.: French Airborne Measurement Platform (PMA) cloud particle size distribution and volumic cloud particle scattering properties dataset near Svalbard for the HALO-(AC)3 measurement campaign in 2022, PANGAEA [data set], https://doi.org/10.1594/PANGAEA.965734, 2024. a, b, c
Egerer, U., Gottschalk, M., Siebert, H., Ehrlich, A., and Wendisch, M.: The new BELUGA setup for collocated turbulence and radiation measurements using a tethered balloon: first applications in the cloudy Arctic boundary layer, Atmos. Meas. Tech., 12, 4019–4038, https://doi.org/10.5194/amt-12-4019-2019, 2019. a
Ehrlich, A. and Wendisch, M.: Reconstruction of high-resolution time series from slow-response broadband terrestrial irradiance measurements by deconvolution, Atmos. Meas. Tech., 8, 3671–3684, https://doi.org/10.5194/amt-8-3671-2015, 2015. a, b, c
Ehrlich, A., Wendisch, M., Lüpkes, C., Buschmann, M., Bozem, H., Chechin, D., Clemen, H.-C., Dupuy, R., Eppers, O., Hartmann, J., Herber, A., Jäkel, E., Järvinen, E., Jourdan, O., Kästner, U., Kliesch, L.-L., Köllner, F., Mech, M., Mertes, S., Neuber, R., Ruiz-Donoso, E., Schnaiter, M., Schneider, J., Stapf, J., and Zanatta, M.: A comprehensive in situ and remote sensing data set from the Arctic CLoud Observations Using airborne measurements during polar Day (ACLOUD) campaign, Earth Syst. Sci. Data, 11, 1853–1881, https://doi.org/10.5194/essd-11-1853-2019, 2019. a, b, c, d, e, f, g, h, i, j, k, l, m, n
Ehrlich, A., Zöger, M., Giez, A., Nenakhov, V., Mallaun, C., Maser, R., Röschenthaler, T., Luebke, A. E., Wolf, K., Stevens, B., and Wendisch, M.: A new airborne broadband radiometer system and an efficient method to correct dynamic thermal offsets, Atmos. Meas. Tech., 16, 1563–1581, https://doi.org/10.5194/amt-16-1563-2023, 2023. a, b, c, d, e, f, g
Ehrlich, A., Ament, F., Aubry, C., Crewell, S., Dorff, H., Ewald, F., George, G., Giez, A., Groß, S., Hirsch, L., Jansen, F., Kirbus, B., Klingebiel, M., Konow, H., Luebke, A. E., Mallaun, C., Mayer, B., Mech, M., Nenakhov, V., Ori, D., Pörtge, V., Ringel, M., Rosenburg, S., Röttenbacher, J., Schäfer, M., Volkmer, L., Walbröl, A., Weber, A., Wendisch, M., Wirth, M., Zinner, T., and Zöger, M.: Collection of data sources from the HALO research aircraft for the HALO-(AC)3 field campaign, March/April 2022, PANGAEA [data set], https://doi.org/10.1594/PANGAEA.968885, 2024a. a, b, c, d, e
Ehrlich, A., Crewell, S., Wendisch, M., Giez, A., Zöger, M., Mallaun, C., and Nenakhov, V.: Master tracks of the HALO research aircraft during the HALO-(AC)3 field campaign in 1 Hz temporal resolution, PANGAEA [data set], https://doi.org/10.1594/PANGAEA.967299, 2024b. a, b, c
Ehrlich, A., Wendisch, M., Crewell, S., Lüpkes, C., Mech, M., Klingebiel, M., Ament, F., Borrmann, S., Dorff, H., Ewald, F., George, G., Gorodetskaya, I., Groß, S., Maahn, M., Moser, M., Neggers, R., Ori, D., Pithan, F., Pörtge, V., Röttenbacher, J., Schemann, V., Schneider, J., Voigt, C., and Walbröl, A.: Collection of flight reports from the HALO-(AC)3 campaign, PANGAEA [data set], https://doi.org/10.5281/zenodo.11184578, 2024c. a, b
Eppers, O., Clemen, H.-C., and Schneider, J.: Aircraft-based measurement of particle size and chemical composition for individual aerosol particles during the HALO-(AC)3 campaign 2022, PANGAEA [data set], https://doi.org/10.1594/PANGAEA.963290, 2023a. a, b
Eppers, O., Clemen, H.-C., and Schneider, J.: Airborne in-situ measurement of particle number concentration and size distribution using an optical particle counter during HALO-(AC)3, PANGAEA [data set], https://doi.org/10.1594/PANGAEA.963284, 2023b. a, b
Esselborn, M., Wirth, M., Fix, A., Tesche, M., and Ehret, G.: Airborne high spectral resolution lidar for measuring aerosol extinction and backscatter coefficients, Appl. Optics, 47, 346–358, https://doi.org/10.1364/AO.47.000346, 2008. a
Ewald, F., Kölling, T., Baumgartner, A., Zinner, T., and Mayer, B.: Design and characterization of specMACS, a multipurpose hyperspectral cloud and sky imager, Atmos. Meas. Tech., 9, 2015–2042, https://doi.org/10.5194/amt-9-2015-2016, 2016. a, b, c
Ewald, F., Groß, S., Hagen, M., Hirsch, L., Delanoë, J., and Bauer-Pfundstein, M.: Calibration of a 35 GHz airborne cloud radar: lessons learned and intercomparisons with 94 GHz cloud radars, Atmos. Meas. Tech., 12, 1815–1839, https://doi.org/10.5194/amt-12-1815-2019, 2019. a
Felden, J., Möller, L., Schindler, U., Huber, R., Schumacher, S., Koppe, R., Diepenbroek, M., and Glöckner, F.: PANGAEA – Data Publisher for Earth & Environmental Science, Sci. Data, 10, 347, https://doi.org/10.1038/s41597-023-02269-x, 2023. a
Field, P. R., Heymsfield, A. J., and Bansemer, A.: Shattering and Particle Interarrival Times Measured by Optical Array Probes in Ice Clouds, J. Atmos. Ocean. Tech., 23, 1357–1371, https://doi.org/10.1175/JTECH1922.1, 2006. a
Gayet, J. F., Crépel, O., Fournol, J. F., and Oshchepkov, S.: A new airborne polar Nephelometer for the measurements of optical and microphysical cloud properties. Part I: Theoretical design, Ann. Geophys., 15, 451–459, https://doi.org/10.1007/s00585-997-0451-1, 1997. a, b
Gayet, J.-F., Auriol, F., Minikin, A., Ström, J., Seifert, M., Krejci, R., Petzold, A., Febvre, G., and Schumann, U.: Quantitative measurement of the microphysical and optical properties of cirrus clouds with four different in situ probes: Evidence of small ice crystals, Geophys. Res. Lett., 29, 2230, https://doi.org/10.1029/2001GL014342, 2002. a
Geerts, B., Giangrande, S. E., McFarquhar, G. M., Xue, L., Abel, S. J., Comstock, J. M., Crewell, S., DeMott, P. J., Ebell, K., Field, P., Hill, T. C. J., Hunzinger, A., Jensen, M. P., Johnson, K. L., Juliano, T. W., Kollias, P., Kosovic, B., Lackner, C., Luke, E., Lüpkes, C., Matthews, A. A., Neggers, R., Ovchinnikov, M., Powers, H., Shupe, M. D., Spengler, T., Swanson, B. E., Tjernström, M., Theisen, A. K., Wales, N. A., Wang, Y., Wendisch, M., and Wu, P.: The COMBLE Campaign: A Study of Marine Boundary Layer Clouds in Arctic Cold-Air Outbreaks, B. Am. Meteorol. Soc., 103, E1371–E1389, https://doi.org/10.1175/BAMS-D-21-0044.1, 2022. a
George, G., Stevens, B., Bony, S., Pincus, R., Fairall, C., Schulz, H., Kölling, T., Kalen, Q. T., Klingebiel, M., Konow, H., Lundry, A., Prange, M., and Radtke, J.: JOANNE: Joint dropsonde Observations of the Atmosphere in tropical North atlaNtic meso-scale Environments, Earth Syst. Sci. Data, 13, 5253–5272, https://doi.org/10.5194/essd-13-5253-2021, 2021. a
George, G., Stevens, B., Bony, S., Vogel, R., and Naumann, A. K.: Widespread shallow mesoscale circulations observed in the trades, Nat. Geosci., 16, 584–589, https://doi.org/10.1038/s41561-023-01215-1, 2023. a
George, G., Luebke, A. E., Klingebiel, M., Mech, M., and Ehrlich, A.: Dropsonde measurements from HALO and POLAR 5 during HALO-(AC)3 in 2022, PANGAEA [data set], https://doi.org/10.1594/PANGAEA.968891, 2024. a, b, c
Gerbig, C., Schmitgen, S., Kley, D., Volz-Thomas, A., Dewey, K., and Haaks, D.: An improved fast-response vacuum-UV resonance fluorescence CO instrument, J. Geophys. Res.-Atmos., 104, 1699–1704, https://doi.org/10.1029/1998JD100031, 1999. a, b
Gierens, R., Kneifel, S., Shupe, M. D., Ebell, K., Maturilli, M., and Löhnert, U.: Low-level mixed-phase clouds in a complex Arctic environment, Atmos. Chem. Phys., 20, 3459–3481, https://doi.org/10.5194/acp-20-3459-2020, 2020. a
Giez, A., Zöger, M., Dreiling, V., and Mallaun, C.: Static Source Error Calibration of a Nose Boom Mounted Air Data System on an Atmospheric Research Aircraft Using the Trailing Cone Method., Tech. rep., ISSN 1434-8454, Deutsches Zentrum für Luft- und Raumfahrt, https://elib.dlr.de/145770/ (last access: 24 March 2025), 2020. a
Giez, A., Mallaun, C., Nenakhov, V., and Zöger, M.: Calibration of a Nose Boom Mounted Airflow Sensor on an Atmospheric Research Aircraft by Inflight Maneuvers., Tech. rep., ISSN 1434-8454, Deutsches Zentrum für Luft- und Raumfahrt, https://elib.dlr.de/145969/ (last access: 24 March 2025), 2021. a, b, c
Giez, A., Zöger, M., Mallaun, C., and Nenakhov, V.: BAHAMAS data from HALO-(AC)3 campaign 2022, HALO database [data set], 8793–8806, 8985–8984, 9588, https://doi.org/10.17616/R39Q0T, 2022. a, b
Giez, A., Zöger, M., Mallaun, C., Nenakhov, V., Schimpf, M., Grad, C., Numberger, A., and Raynor, K.: Determination of the Measurement Errors for the HALO Basic Data System BAHAMAS by Means of Error Propagation., Tech. rep., ISSN 1434-8454, Deutsches Zentrum für Luft- und Raumfahrt, https://doi.org/10.57676/5rdc-q708, 2023. a, b
Grawe, S., Jentzsch, C., Schaefer, J., Wex, H., Mertes, S., and Stratmann, F.: Next-generation ice-nucleating particle sampling on board aircraft: characterization of the High-volume flow aERosol particle filter sAmpler (HERA), Atmos. Meas. Tech., 16, 4551–4570, https://doi.org/10.5194/amt-16-4551-2023, 2023. a, b
Gysel, M., Laborde, M., Olfert, J. S., Subramanian, R., and Gröhn, A. J.: Effective density of Aquadag and fullerene soot black carbon reference materials used for SP2 calibration, Atmos. Meas. Tech., 4, 2851–2858, https://doi.org/10.5194/amt-4-2851-2011, 2011. a
Gysel-Beer, M. and Corbin, J. C.: SP2 toolkit 4.115 (Igor7), Zenodo [code], https://doi.org/10.5281/zenodo.3575186, 2019. a
Hartmann, M., Blunier, T., Brügger, S., Schmale, J., Schwikowski, M., Vogel, A., Wex, H., and Stratmann, F.: Variation of Ice Nucleating Particles in the European Arctic Over the Last Centuries, Geophys. Res. Lett., 46, 4007–4016, https://doi.org/10.1029/2019GL082311, 2019. a, b
Heim, M., Mullins, B. J., Umhauer, H., and Kasper, G.: Performance evaluation of three optical particle counters with an efficient “multimodal” calibration method, J. Aerosol Sci., 39, 1019–1031, https://doi.org/10.1016/j.jaerosci.2008.07.006, 2008. a
Herber, A., Mech, M., Klingebiel, M., and Lüpkes, C.: Master tracks in different resolutions during POLAR 5 campaign P5_232_HALO_2022, PANGAEA [data set], https://doi.org/10.1594/PANGAEA.947788, 2022a. a, b, c
Herber, A., Schneider, J., Borrmann, S., Voigt, C., and Moser, M.: Master tracks in different resolutions during POLAR 6 campaign P6_231_HALO_2022, PANGAEA [data set], https://doi.org/10.1594/PANGAEA.947701, 2022b. a, b, c
Herber, A., Borrmann, S., Bozem, H., Clemen, H.-C., De La Torre Castro, E., Dupuy, R., Eppers, O., Gourbeyre, C., Grawe, S., Hartmann, J., Henning, S., Hoor, P., Jourdan, O., Jurányi, Z., Lucke, J., Lüpkes, C., Mayer, J., Mertes, S., Michaelis, J., Mioche, G., Moser, M., Roberts, G. C., Schaefer, J., Schneider, J., Stratmann, F., Tatzelt, C., Tuch, T., Voigt, C., and Wetzel, B.: Collection of data sources from the Polar 6 research aircraft for the HALO-(AC)3 field campaign, March/April 2022, PANGAEA [data set], https://doi.org/10.1594/PANGAEA.968884, 2024. a, b, c, d, e
Hersbach, H., Bell, B., Berrisford, P., Hirahara, S., Horányi, A., Muñoz‐Sabater, J., Nicolas, J., Peubey, C., Radu, R., Schepers, D., Simmons, A., Soci, C., Abdalla, S., Abellan, X., Balsamo, G., Bechtold, P., Biavati, G., Bidlot, J., Bonavita, M., De Chiara, G., Dahlgren, P., Dee, D., Diamantakis, M., Dragani, R., Flemming, J., Forbes, R., Fuentes, M., Geer, A., Haimberger, L., Healy, S., Hogan, R. J., Hólm, E., Janisková, M., Keeley, S., Laloyaux, P., Lopez, P., Lupu, C., Radnoti, G., de Rosnay, P., Rozum, I., Vamborg, F., Villaume, S., and Thépaut, J.: The ERA5 global reanalysis, Q. J. Roy. Meteor. Soc., 146, 1999–2049, https://doi.org/10.1002/qj.3803, 2020. a
Jacob, M.: Characterizing maritime trade-wind convection using the HALO Microwave Package (HAMP), PhD thesis, Universität zu Köln, https://kups.ub.uni-koeln.de/12138/ (last access: 24 March 2025), 2020. a
Jäkel, E. and Wendisch, M.: Radiance fields of clouds and the Arctic surface measured by a digital camera during HALO-(AC)3, PANGAEA [data set], https://doi.org/10.1594/PANGAEA.967288, 2024. a, b
Jäkel, E., Becker, S., Klingebiel, M., Müller, H., Sperzel, T. R., and Wendisch, M.: Aircraft measurements of spectral solar up- and downward irradiances in the Arctic during the HALO-(AC)3 campaign 2022, PANGAEA [data set], https://doi.org/10.1594/PANGAEA.963112, 2023a. a, b
Jäkel, E., Becker, S., Müller, H., and Wendisch, M.: Collocated broadband surface albedo and surface type fractions aircraft observations during HALO-(AC)3 2022, PANGAEA [data set], https://doi.org/10.1594/PANGAEA.962996, 2023b. a, b
Johnson, T., Capel, J., and Ollison, W.: Measurement of microenvironmental ozone concentrations in Durham, North Carolina, using a 2B Technologies 205 Federal Equivalent Method monitor and an interference-free 2B Technologies 211 monitor, J. Air Waste Manage. Assoc., 64, 360–371, https://doi.org/10.1080/10962247.2013.839968, 2014. a, b
Jurányi, Z. and Herber, A.: Aircraft measurements of refractory black carbon in the Arctic during the HALO-(AC)3 campaign 2022, PANGAEA [data set], https://doi.org/10.1594/PANGAEA.963718, 2024. a, b
Kaufmann, S., Voigt, C., Heller, R., Jurkat-Witschas, T., Krämer, M., Rolf, C., Zöger, M., Giez, A., Buchholz, B., Ebert, V., Thornberry, T., and Schumann, U.: Intercomparison of midlatitude tropospheric and lower-stratospheric water vapor measurements and comparison to ECMWF humidity data, Atmos. Chem. Phys., 18, 16729–16745, https://doi.org/10.5194/acp-18-16729-2018, 2018. a
Kirbus, B., Ehrlich, A., Schäfer, M., and Wendisch, M.: Quasi-Lagrangian air mass matches during HALO-(AC)3: Matches occuring on the same day, PANGAEA [data set], https://doi.org/10.1594/PANGAEA.967143, 2024a. a, b
Kirbus, B., Ehrlich, A., Schäfer, M., and Wendisch, M.: Quasi-Lagrangian air mass matches during HALO-(AC)3: Matches occuring over consecutive days, PANGAEA [data set], https://doi.org/10.1594/PANGAEA.967148, 2024b. a, b
Kirbus, B., Schirmacher, I., Klingebiel, M., Schäfer, M., Ehrlich, A., Slättberg, N., Lucke, J., Moser, M., Müller, H., and Wendisch, M.: Thermodynamic and cloud evolution in a cold-air outbreak during HALO-(AC)3: quasi-Lagrangian observations compared to the ERA5 and CARRA reanalyses, Atmos. Chem. Phys., 24, 3883–3904, https://doi.org/10.5194/acp-24-3883-2024, 2024c. a, b, c, d
Kirschler, S., Voigt, C., Anderson, B. E., Chen, G., Crosbie, E. C., Ferrare, R. A., Hahn, V., Hair, J. W., Kaufmann, S., Moore, R. H., Painemal, D., Robinson, C. E., Sanchez, K. J., Scarino, A. J., Shingler, T. J., Shook, M. A., Thornhill, K. L., Winstead, E. L., Ziemba, L. D., and Sorooshian, A.: Overview and statistical analysis of boundary layer clouds and precipitation over the western North Atlantic Ocean, Atmos. Chem. Phys., 23, 10731–10750, https://doi.org/10.5194/acp-23-10731-2023, 2023. a
Klimach, T.: Chemische Zusammensetzung der Aerosole: Design und Datenauswertung eines Einzelpartikel-Laserablationsmassenspektrometers, PhD thesis, Johannes Gutenberg-Universität Mainz, https://doi.org/10.25358/openscience-4386, 2012. a
Klingebiel, M., Ehrlich, A., Ruiz-Donoso, E., Risse, N., Schirmacher, I., Jäkel, E., Schäfer, M., Wolf, K., Mech, M., Moser, M., Voigt, C., and Wendisch, M.: Variability and properties of liquid-dominated clouds over the ice-free and sea-ice-covered Arctic Ocean, Atmos. Chem. Phys., 23, 15289–15304, https://doi.org/10.5194/acp-23-15289-2023, 2023. a
Klingebiel, M., Jäkel, E., Schäfer, M., Ehrlich, A., and Wendisch, M.: Spectral solar cloud top radiance measured by airborne spectral imaging (AISA Eagle) during the HALO-(AC)3 campaign in 2022, PANGAEA [data set], https://doi.org/10.1594/PANGAEA.967347, 2024. a, b
Konow, H., Jacob, M., Ament, F., Crewell, S., Ewald, F., Hagen, M., Hirsch, L., Jansen, F., Mech, M., and Stevens, B.: A unified data set of airborne cloud remote sensing using the HALO Microwave Package (HAMP), Earth Syst. Sci. Data, 11, 921–934, https://doi.org/10.5194/essd-11-921-2019, 2019. a
Konow, H., Ewald, F., George, G., Jacob, M., Klingebiel, M., Kölling, T., Luebke, A. E., Mieslinger, T., Pörtge, V., Radtke, J., Schäfer, M., Schulz, H., Vogel, R., Wirth, M., Bony, S., Crewell, S., Ehrlich, A., Forster, L., Giez, A., Gödde, F., Groß, S., Gutleben, M., Hagen, M., Hirsch, L., Jansen, F., Lang, T., Mayer, B., Mech, M., Prange, M., Schnitt, S., Vial, J., Walbröl, A., Wendisch, M., Wolf, K., Zinner, T., Zöger, M., Ament, F., and Stevens, B.: EUREC4A's HALO, Earth Syst. Sci. Data, 13, 5545–5563, https://doi.org/10.5194/essd-13-5545-2021, 2021. a
Korolev, A., McFarquhar, G., Field, P. R., Franklin, C., Lawson, P., Wang, Z., Williams, E., Abel, S. J., Axisa, D., Borrmann, S., Crosier, J., Fugal, J., Krämer, M., Lohmann, U., Schlenczek, O., Schnaiter, M., and Wendisch, M.: Mixed-Phase Clouds: Progress and Challenges, Meteorol. Monogr., 58, 5.1–5.50, https://doi.org/10.1175/AMSMONOGRAPHS-D-17-0001.1, 2017. a
Korolev, A. V., Strapp, J. W., Isaac, G. A., and Nevzorov, A. N.: The Nevzorov Airborne Hot-Wire LWC–TWC Probe: Principle of Operation and Performance Characteristics, J. Atmos. Ocean. Tech., 15, 1495–1510, https://doi.org/10.1175/1520-0426(1998)015<1495:TNAHWL>2.0.CO;2, 1998. a
Krämer, M., Zieger, P., Wendisch, M., and Crewell, S. (Eds.): HALO-(AC)3 – an airborne campaign to study air mass transformations during warm-air intrusions and cold-air outbreaks, Atmos. Chem. Phys./Atmos. Meas. Tech. inter-journal special issue, https://acp.copernicus.org/articles/special_issue1272.html, 2023. a
Krautstrunk, M. and Giez, A.: The Transition From FALCON to HALO Era Airborne Atmospheric Research, 609–624, Springer Berlin Heidelberg, Berlin, Heidelberg, ISBN 978-3-642-30183-4, https://doi.org/10.1007/978-3-642-30183-4_37, 2012. a, b
Kretzschmar, J., Stapf, J., Klocke, D., Wendisch, M., and Quaas, J.: Employing airborne radiation and cloud microphysics observations to improve cloud representation in ICON at kilometer-scale resolution in the Arctic, Atmos. Chem. Phys., 20, 13145–13165, https://doi.org/10.5194/acp-20-13145-2020, 2020. a, b
Küchler, N., Kneifel, S., Löhnert, U., Kollias, P., Czekala, H., and Rose, T.: A W-band Radar-Radiometer System for Accurate and Continuous Monitoring of Clouds and Precipitation, J. Atmos. Ocean. Tech., 34, 2375–2392, https://doi.org/10.1175/JTECH-D-17-0019.1, 2017. a
Kwiezinski, C., Weller, C., van Pinxteren, D., Brüggemann, M., Mertes, S., Stratmann, F., and Herrmann, H.: Determination of highly polar compounds in atmospheric aerosol particles at ultra-trace levels using ion chromatography Orbitrap mass spectrometry, J. Sep. Sci., 44, 2343–2357, https://doi.org/10.1002/jssc.202001048, 2021. a
Laborde, M., Mertes, P., Zieger, P., Dommen, J., Baltensperger, U., and Gysel, M.: Sensitivity of the Single Particle Soot Photometer to different black carbon types, Atmos. Meas. Tech., 5, 1031–1043, https://doi.org/10.5194/amt-5-1031-2012, 2012. a
Lamorthe, C., sBorbon, A., Schwarzenboeck, A., and Canonici, J.-C.: Des avions au service de la recherche en environnement, La Météorologie, 93, 30–41, https://doi.org/10.4267/2042/59939, 2016. a
Lance, S., Brock, C. A., Rogers, D., and Gordon, J. A.: Water droplet calibration of the Cloud Droplet Probe (CDP) and in-flight performance in liquid, ice and mixed-phase clouds during ARCPAC, Atmos. Meas. Tech., 3, 1683–1706, https://doi.org/10.5194/amt-3-1683-2010, 2010. a, b
Lawson, R. P., O'Connor, D., Zmarzly, P., Weaver, K., Baker, B., Mo, Q., and Jonsson, H.: The 2D-S (Stereo) Probe: Design and Preliminary Tests of a New Airborne, High-Speed, High-Resolution Particle Imaging Probe, J. Atmos. Ocean. Tech., 23, 1462–1477, https://doi.org/10.1175/jtech1927.1, 2006. a, b
Liang, Y., Bi, H., Lei, R., Vihma, T., and Huang, H.: Atmospheric Latent Energy Transport Pathways into the Arctic and Their Connections to Sea Ice Loss during Winter over the Observational Period, J. Climate, 36, 6695–6712, https://doi.org/10.1175/JCLI-D-22-0789.1, 2023. a, b
Lonardi, M., Akansu, E. F., Ehrlich, A., Mazzola, M., Pilz, C., Shupe, M. D., Siebert, H., and Wendisch, M.: Tethered balloon-borne observations of thermal-infrared irradiance and cooling rate profiles in the Arctic atmospheric boundary layer, Atmos. Chem. Phys., 24, 1961–1978, https://doi.org/10.5194/acp-24-1961-2024, 2024. a
Lucke, J., Jurkat-Witschas, T., Heller, R., Hahn, V., Hamman, M., Breitfuss, W., Bora, V. R., Moser, M., and Voigt, C.: Icing wind tunnel measurements of supercooled large droplets using the 12 mm total water content cone of the Nevzorov probe, Atmos. Meas. Tech., 15, 7375–7394, https://doi.org/10.5194/amt-15-7375-2022, 2022. a
Lucke, J., Moser, M., De La Torre Castro, E., Mayer, J., and Voigt, C.: Backscatter Cloud Probe with Polarization Detection, PANGAEA [data set], https://doi.org/10.1594/PANGAEA.963614, 2023a. a, b
Lucke, J. R., Jurkat-Witschas, T., Baumgardner, D., Kalinka, F., Moser, M., De La Torre Castro, E., and Voigt, C.: Characterization of Atmospheric Icing Conditions during the HALO-(AC)3 Campaign with the Nevzorov Probe and the Backscatter Cloud Probe with Polarization Detection, in: SAE Technical Paper Series, SAE International, https://doi.org/10.4271/2023-01-1485, 2023b. a, b, c, d
Lucke, J., Moser, M., De La Torre Castro, E., Mayer, J., and Voigt, C.: Nevzorov LWC and TWC data from the HALO-(AC)3 campaign in March and April 2022, PANGAEA [data set], https://doi.org/10.1594/PANGAEA.963628, 2024. a, b
Luebke, A. E., Ehrlich, A., Röttenbacher, J., Zöger, M., Giez, A., Nenakhov, V., Mallaun, C., and Wendisch, M.: Broadband solar and terrestrial, upward and downward irradiance measured by BACARDI on HALO during the HALO-(AC)3 field campaign in 2022, PANGAEA [data set], https://doi.org/10.1594/PANGAEA.963739, 2023. a, b
Lüpkes, C., Hartmann, J., Michaelis, J., and Herber, A.: High resolution aircraft measurements of wind and temperature of the HALO-AC3 campaign in 2022 (100Hz), https://doi.org/10.1594/PANGAEA.968952, in: Lüpkes, C et al. (2024): Aircraft measurements of wind and temperature during the HALO-AC3 campaign in 2022, PANGAEA [dataset publication series], https://doi.org/10.1594/PANGAEA.968911, 2024a. a, b, c
Lüpkes, C., Hartmann, J., Michaelis, J., and Herber, A.: Aircraft measurements of wind and temperature during the HALO-AC3 campaign in 2022, PANGAEA [dataset publication series], https://doi.org/10.1594/PANGAEA.968911, 2024b. a, b, c
Maherndl, N., Moser, M., Lucke, J., Mech, M., Risse, N., Schirmacher, I., and Maahn, M.: Quantifying riming from airborne data during the HALO-(AC)3 campaign, Atmos. Meas. Tech., 17, 1475–1495, https://doi.org/10.5194/amt-17-1475-2024, 2024a. a
Maherndl, N., Moser, M., Schirmacher, I., Bansemer, A., Lucke, J., Voigt, C., and Maahn, M.: How does riming influence the observed spatial variability of ice water in mixed-phase clouds?, Atmos. Chem. Phys., 24, 13935–13960, https://doi.org/10.5194/acp-24-13935-2024, 2024b. a
Martin, C. and Suhr, I.: NCAR/EOL Atmospheric Sounding Processing ENvironment (ASPEN) software, Version 4.0.0, Earth Observing Laboratory [code], https://www.eol.ucar.edu/content/aspen (last access: 24 March 2025), 2024. a, b
Maturilli, M.: High resolution radiosonde measurements from station Ny-Ålesund (2022-03), PANGAEA, https://doi.org/10.1594/PANGAEA.944406, in: Maturilli, M. (2020): High resolution radiosonde measurements from station Ny-Ålesund (2017-04 et seq). Alfred Wegener Institute – Research Unit Potsdam, PANGAEA [dataset publication series], https://doi.org/10.1594/PANGAEA.914973, 2022a. a
Maturilli, M.: High resolution radiosonde measurements from station Ny-Ålesund (2022-04), PANGAEA, https://doi.org/10.1594/PANGAEA.944409, in: Maturilli, M. (2020): High resolution radiosonde measurements from station Ny-Ålesund (2017-04 et seq). Alfred Wegener Institute – Research Unit Potsdam, PANGAEA [dataset publication series], https://doi.org/10.1594/PANGAEA.914973, 2022b. a
McCusker, G. Y., Vüllers, J., Achtert, P., Field, P., Day, J. J., Forbes, R., Price, R., O'Connor, E., Tjernström, M., Prytherch, J., Neely III, R., and Brooks, I. M.: Evaluating Arctic clouds modelled with the Unified Model and Integrated Forecasting System, Atmos. Chem. Phys., 23, 4819–4847, https://doi.org/10.5194/acp-23-4819-2023, 2023. a
McFarquhar, G. M., Baumgardner, D., Bansemer, A., Abel, S. J., Crosier, J., French, J., Rosenberg, P., Korolev, A., Schwarzoenboeck, A., Leroy, D., Um, J., Wu, W., Heymsfield, A. J., Twohy, C., Detwiler, A., Field, P., Neumann, A., Cotton, R., Axisa, D., and Dong, J.: Processing of Ice Cloud In Situ Data Collected by Bulk Water, Scattering, and Imaging Probes: Fundamentals, Uncertainties, and Efforts toward Consistency, Meteorol. Monogr., 58, 11.1–11.33, https://doi.org/10.1175/amsmonographs-d-16-0007.1, 2017. a, b
Mech, M.: mariomech/mosaic-aca_aflux_data_processing: All instruments included (v0.2), Zenodo [code], https://doi.org/10.5281/zenodo.7390347, 2022. a
Mech, M., Orlandi, E., Crewell, S., Ament, F., Hirsch, L., Hagen, M., Peters, G., and Stevens, B.: HAMP – the microwave package on the High Altitude and LOng range research aircraft (HALO), Atmos. Meas. Tech., 7, 4539–4553, https://doi.org/10.5194/amt-7-4539-2014, 2014. a, b, c
Mech, M., Kliesch, L.-L., Anhäuser, A., Rose, T., Kollias, P., and Crewell, S.: Microwave Radar/radiometer for Arctic Clouds (MiRAC): first insights from the ACLOUD campaign, Atmos. Meas. Tech., 12, 5019–5037, https://doi.org/10.5194/amt-12-5019-2019, 2019. a, b
Mech, M., Maahn, M., Kneifel, S., Ori, D., Orlandi, E., Kollias, P., Schemann, V., and Crewell, S.: PAMTRA 1.0: the Passive and Active Microwave radiative TRAnsfer tool for simulating radiometer and radar measurements of the cloudy atmosphere, Geosci. Model Dev., 13, 4229–4251, https://doi.org/10.5194/gmd-13-4229-2020, 2020. a
Mech, M., Ehrlich, A., Herber, A., Lüpkes, C., Wendisch, M., Becker, S., Boose, Y., Chechin, D., Crewell, S., Dupuy, R., Gourbeyre, C.v Hartmann, J., Jäkel, E., Jourdan, O., Kliesch, L.-L., Klingebiel, M., Kulla, B. S., Mioche, G., Moser, M., Risse, N., Ruiz-Donoso, E., Schäfer, M., Stapf, J., and Voigt, C.: MOSAiC-ACA and AFLUX – Arctic airborne campaigns characterizing the exit area of MOSAiC, Sci. Data, 9, 790, https://doi.org/10.1038/s41597-022-01900-7, 2022a. a, b, c, d, e, f, g, h, i
Mech, M., Marollo, G., Paul, D., Risse, N., and Schirmacher, I.: Introduction — How_to_ac3airborne, ac3airborne [code], https://igmk.github.io/how_to_ac3airborne/intro.html (last access: 24 March 2025), 2022b. a
Mech, M., Risse, N., Marrollo, G., and Paul, D.: ac3airborne, Zenodo [code], https://doi.org/10.5281/zenodo.7305585, 2022c. a, b
Mech, M., Becker, S., Crewell, S., Ehrlich, A., George, G., Hartmann, J., Herber, A., Jäkel, E., Klingebiel, M., Krobot, P., Luebke, A. E., Lüpkes, C., Michaelis, J., Müller, H., Paul, D., Risse, N., Ritter, C., Schäfer, M., Schirmacher, I., Schnitt, S., Schween, J. H., Sperzel, T. R., and Wendisch, M.: Collection of data sources from the Polar 5 research aircraft for the HALO-(AC)3 field campaign, March/April 2022, PANGAEA [data set], https://doi.org/10.1594/PANGAEA.968883, 2024a. a, b, c, d, e
Mech, M., Risse, N., Krobot, P., Paul, D., Schirmacher, I., Schnitt, S., and Crewell, S.: Radar reflectivities at 94 GHz and microwave brightness temperature measurements at 89 GHz during the HALO-(AC)3 Arctic airborne campaign, PANGAEA [data set], https://doi.org/10.1594/PANGAEA.964977, 2024b. a, b
Mech, M., Risse, N., Krobot, P., Schirmacher, I., Schnitt, S., and Crewell, S.: Microwave brightness temperature measurements during the HALO-(AC)3 Arctic airborne campaign in early spring 2022 out of Svalbard, PANGAEA [data set], https://doi.org/10.1594/PANGAEA.964982, 2024c. a, b
Mech, M., Risse, N., Ritter, C., Schirmacher, I., and Schween, J. H.: Cloud mask and cloud top altitude from the AMALi airborne lidar on Polar 5 during HALO-(AC)3 in spring 2022, PANGAEA [data set], https://doi.org/10.1594/PANGAEA.964985, 2024d. a, b
Mertes, S. and Wetzel, B.: Airborne in-situ measurements of aerosol properties of cloud particle residuals/ambient particles and of the cloud water content/water vapor during the HALO-(AC)3 campaign in March and April 2022, PANGAEA [data set], https://doi.org/10.1594/PANGAEA.963771, 2023. a, b, c, d, e
Mertes, S., Schröder, F., and Wiedensohler, A.: The particle detection efficiency curve of the TSI-3010 CPC as a function of the temperature difference between saturator and condenser, Aerosol Sci. Tech., 23, 257–261, https://doi.org/10.1080/02786829508965310, 1995. a
Mertes, S., Schwarzenböck, A., Laj, P., Wobrock, W., Pichon, J. M., Orsi, G., and Heintzenberg, J.: Changes of cloud microphysical properties during the transition from supercooled to mixed-phase conditions during CIME, Atmos. Res., 58, 267–294, https://doi.org/10.1016/S0169-8095(01)00095-3, 2001. a
Mertes, S., Dippel, B., and Schwarzenböck, A.: Quantification of graphitic carbon in atmospheric aerosol particles by Raman spectroscopy and first application for the determination of mass absorption efficiencies, J. Aerosol Sci., 35, 347–361, https://doi.org/10.1016/j.jaerosci.2003.10.002, 2004. a, b
Mertes, S., Lehmann, K., Nowak, A., Massling, A., and Wiedensohler, A.: Link between aerosol hygroscopic growth and droplet activation observed for hill-capped clouds at connected flow conditions during FEBUKO, Atmos. Environ., 39, 4247–4256, https://doi.org/10.1016/j.atmosenv.2005.02.010, 2005. a
Mewes, D. and Jacobi, C.: Heat transport pathways into the Arctic and their connections to surface air temperatures, Atmos. Chem. Phys., 19, 3927–3937, https://doi.org/10.5194/acp-19-3927-2019, 2019. a, b
Moser, M., Lucke, J., De La Torre Castro, E., Mayer, J., and Voigt, C.: DLR in situ cloud measurements during HALO-(AC)3 Arctic airborne campaign, PANGAEA [data set], https://doi.org/10.1594/PANGAEA.963247, 2023a. a, b, c, d
Moser, M., Voigt, C., Jurkat-Witschas, T., Hahn, V., Mioche, G., Jourdan, O., Dupuy, R., Gourbeyre, C., Schwarzenboeck, A., Lucke, J., Boose, Y., Mech, M., Borrmann, S., Ehrlich, A., Herber, A., Lüpkes, C., and Wendisch, M.: Microphysical and thermodynamic phase analyses of Arctic low-level clouds measured above the sea ice and the open ocean in spring and summer, Atmos. Chem. Phys., 23, 7257–7280, https://doi.org/10.5194/acp-23-7257-2023, 2023b. a, b
Moteki, N. and Kondo, Y.: Dependence of Laser-Induced Incandescence on Physical Properties of Black Carbon Aerosols: Measurements and Theoretical Interpretation, Aerosol Sci. Tech., 44, 663–675, https://doi.org/10.1080/02786826.2010.484450, 2010. a
Murray-Watson, R. J., Gryspeerdt, E., and Goren, T.: Investigating the development of clouds within marine cold-air outbreaks, Atmos. Chem. Phys., 23, 9365–9383, https://doi.org/10.5194/acp-23-9365-2023, 2023. a
Neuber, R.: A multi-disciplinary Arctic research facility: From the Koldewey – Rabot – Corbel – Stations to the AWI-IPEV research base on Spitsbergen, Polarforschung, 23, 117–123, 2006. a
Ogren, J. A., Heintzenberg, J., and Charlson, R. J.: In-situ sampling of clouds with a droplet to aerosol converter, Geophys. Res. Lett., 12, 121–124, https://doi.org/10.1029/GL012i003p00121, 1985. a, b
O'Shea, S., Crosier, J., Dorsey, J., Gallagher, L., Schledewitz, W., Bower, K., Schlenczek, O., Borrmann, S., Cotton, R., Westbrook, C., and Ulanowski, Z.: Characterising optical array particle imaging probes: implications for small-ice-crystal observations, Atmos. Meas. Tech., 14, 1917–1939, https://doi.org/10.5194/amt-14-1917-2021, 2021. a
Papritz, L., Hauswirth, D., and Hartmuth, K.: Moisture origin, transport pathways, and driving processes of intense wintertime moisture transport into the Arctic, Weather Clim. Dynam., 3, 1–20, https://doi.org/10.5194/wcd-3-1-2022, 2022. a
Pasquier, J. T., David, R. O., Freitas, G., Gierens, R., Gramlich, Y., Haslett, S., Li, G., Schäfer, B., Siegel, K., Wieder, J., Adachi, K., Belosi, F., Carlsen, T., Decesari, S., Ebell, K., Gilardoni, S., Gysel-Beer, M., Henneberger, J., Inoue, J., Kanji, Z. A., Koike, M., Kondo, Y., Krejci, R., Lohmann, U., Maturilli, M., Mazzolla, M., Modini, R., Mohr, C., Motos, G., Nenes, A., Nicosia, A., Ohata, S., Paglione, M., Park, S., Pileci, R. E., Ramelli, F., Rinaldi, M., Ritter, C., Sato, K., Storelvmo, T., Tobo, Y., Traversi, R., Viola, A., and Zieger, P.: The Ny-Ålesund Aerosol Cloud Experiment (NASCENT): Overview and First Results, B. Am. Meteorol. Soc., 103, E2533–E2558, https://doi.org/10.1175/BAMS-D-21-0034.1, 2022. a
Paulus, F. M., Karalis, M., George, G., Svensson, G., Wendisch, M., and Neggers, R. A. J.: Airborne Measurements of Mesoscale Divergence at High Latitudes during HALO–(AC)3, J. Atmos. Sci., 81, 2051–2067, https://doi.org/10.1175/JAS-D-24-0034.1, 2024. a
Philipona, R., Fröhlich, C., and Betz, C.: Characterization of Pyrgeometers and the Accuracy of Atmospheric Long-Wave Radiation Measurements, Appl. Optics, 34, 1598–1605, https://doi.org/10.1364/AO.34.001598, 1995. a, b
Pilz, C., Lonardi, M., Egerer, U., Siebert, H., Ehrlich, A., Heymsfield, A. J., Schmitt, C. G., Shupe, M. D., Wehner, B., and Wendisch, M.: Profile observations of the Arctic atmospheric boundary layer with the BELUGA tethered balloon during MOSAiC, Sci. Data, 10, 534, https://doi.org/10.1038/s41597-023-02423-5, 2023. a
Pithan, F., Svensson, G., Caballero, R., Chechin, D., Cronin, T. W., Ekman, A. M. L., Neggers, R., Shupe, M. D., Solomon, A., Tjernström, M., and Wendisch, M.: Role of air-mass transformations in exchange between the Arctic and mid-latitudes, Nat. Geosci., 11, 805–812, https://doi.org/10.1038/s41561-018-0234-1, 2018. a
Raif, E. N., Barr, S. L., Tarn, M. D., McQuaid, J. B., Daily, M. I., Abel, S. J., Barrett, P. A., Bower, K. N., Field, P. R., Carslaw, K. S., and Murray, B. J.: High ice-nucleating particle concentrations associated with Arctic haze in springtime cold-air outbreaks, Atmos. Chem. Phys., 24, 14045–14072, https://doi.org/10.5194/acp-24-14045-2024, 2024. a
Rantanen, M., Karpechko, A. Y., Lipponen, A., Nordling, K., Hyvärinen, O., Ruosteenoja, K., Vihma, T., and Laaksonen, A.: The Arctic has warmed nearly four times faster than the globe since 1979, Commun. Earth Environ., 3, 168, https://doi.org/10.1038/s43247-022-00498-3, 2022. a
Roberts, G. C. and Nenes, A.: A Continuous-Flow Streamwise Thermal-Gradient CCN Chamber for Atmospheric Measurements, Aerosol Sci. Tech, 39, 206–221, https://doi.org/10.1080/027868290913988, 2005. a, b
Rose, T., Crewell, S., Löhnert, U., and Simmer, C.: A Network Suitable Microwave Radiometer for Operational Monitoring of the Cloudy Atmosphere, Atmos. Res., 75, 183–200, https://doi.org/10.1016/j.atmosres.2004.12.005, 2005. a, b
Roth, A., Schneider, J., Klimach, T., Mertes, S., van Pinxteren, D., Herrmann, H., and Borrmann, S.: Aerosol properties, source identification, and cloud processing in orographic clouds measured by single particle mass spectrometry on a central European mountain site during HCCT-2010, Atmos. Chem. Phys., 16, 505–524, https://doi.org/10.5194/acp-16-505-2016, 2016. a, b, c
Röttenbacher, J., Ehrlich, A., Schäfer, M., Kirbus, B., Luebke, A. E., and Wendisch, M.: Aircraft measurements of spectral downward solar irradiance over Arctic sea ice and ocean during the HALO-(AC)3 campaign in spring 2022, PANGAEA [data set], https://doi.org/10.1594/PANGAEA.956151, 2023. a, b
Ruiz-Donoso, E., Ehrlich, A., Schäfer, M., Jäkel, E., Schemann, V., Crewell, S., Mech, M., Kulla, B. S., Kliesch, L.-L., Neuber, R., and Wendisch, M.: Small-scale structure of thermodynamic phase in Arctic mixed-phase clouds observed by airborne remote sensing during a cold air outbreak and a warm air advection event, Atmos. Chem. Phys., 20, 5487–5511, https://doi.org/10.5194/acp-20-5487-2020, 2020. a
Schäfer, M., Bierwirth, E., Ehrlich, A., Heyner, F., and Wendisch, M.: Retrieval of cirrus optical thickness and assessment of ice crystal shape from ground-based imaging spectrometry, Atmos. Meas. Tech., 6, 1855–1868, https://doi.org/10.5194/amt-6-1855-2013, 2013. a
Schäfer, M., Wolf, K., Ehrlich, A., Hallbauer, C., Jäkel, E., Jansen, F., Luebke, A. E., Müller, J., Thoböll, J., Röschenthaler, T., Stevens, B., and Wendisch, M.: VELOX – a new thermal infrared imager for airborne remote sensing of cloud and surface properties, Atmos. Meas. Tech., 15, 1491–1509, https://doi.org/10.5194/amt-15-1491-2022, 2022. a, b, c, d, e, f, g
Schäfer, M., Rosenburg, S., Ehrlich, A., Röttenbacher”, J., and Wendisch, M.: Two-dimensional cloud-top and surface brightness temperature with 1 Hz temporal resolution derived at flight altitude from VELOX during the HALO-(AC)3 field campaign, PANGAEA [data set], https://doi.org/10.1594/PANGAEA.963401, 2023. a, b
Schäfer, M., Rosenburg, S., Ehrlich, A., Röttenbacher, J., and Wendisch, M.: One-dimensional cloud-top or surface brightness temperature with 20 Hz temporal resolution derived at flight altitude from VELOX-KT19 during the HALO-(AC)3 field campaign, PANGAEA [data set], https://doi.org/10.1594/PANGAEA.967378, 2024. a, b
Schirmacher, I., Schnitt, S., Klingebiel, M., Maherndl, N., Kirbus, B., Ehrlich, A., Mech, M., and Crewell, S.: Clouds and precipitation in the initial phase of marine cold-air outbreaks as observed by airborne remote sensing, Atmos. Chem. Phys., 24, 12823–12842, https://doi.org/10.5194/acp-24-12823-2024, 2024. a, b
Schwarz, J. P., Gao, R. S., Fahey, D. W., Thomson, D. S., Watts, L. A., Wilson, J. C., Reeves, J. M., Darbeheshti, M., Baumgardner, D. G., Kok, G. L., Chung, S. H., Schulz, M., Hendricks, J., Lauer, A., Kärcher, B., Slowik, J. G., Rosenlof, K. H., Thompson, T. L., Langford, A. O., Loewenstein, M., and Aikin, K. C.: Single-particle measurements of midlatitude black carbon and light-scattering aerosols from the boundary layer to the lower stratosphere, J. Geophys. Res.-Atmos., 111, D16207, https://doi.org/10.1029/2006JD007076, 2006. a
Sedlar, J., Tjernström, M., Mauritsen, T., Shupe, M. D., Brooks, I. M., Persson, P. O. G., Birch, C. E., Leck, C., Sirevaag, A., and Nicolaus, M.: A transitioning Arctic surface energy budget: the impacts of solar zenith angle, surface albedo and cloud radiative forcing, Clim. Dynam., 37, 1643–1660, https://doi.org/10.1007/s00382-010-0937-5, 2011. a
Seifried, T. M., Bieber, P., Kunert, A. T., Schmale, D. G., Whitmore, K., Fröhlich-Nowoisky, J., and Grothe, H.: Ice Nucleation Activity of Alpine Bioaerosol Emitted in Vicinity of a Birch Forest, Atmosphere, 12, 779, https://doi.org/10.3390/atmos12060779, 2021. a
Serreze, M. C., Barrett, A. P., Stroeve, J. C., Kindig, D. N., and Holland, M. M.: The emergence of surface-based Arctic amplification, The Cryosphere, 3, 11–19, https://doi.org/10.5194/tc-3-11-2009, 2009. a
Shupe, M. D., Rex, M., Blomquist, B., Persson, P. O. G., Schmale, J., Uttal, T., Althausen, D., Angot, H., Archer, S., Bariteau, L., Beck, I., Bilberry, J., Bucci, S., Buck, C., Boyer, M., Brasseur, Z., Brooks, I. M., Calmer, R., Cassano, J., Castro, V., Chu, D., Costa, D., Cox, C. J., Creamean, J., Crewell, S., Dahlke, S., Damm, E., de Boer, G., Deckelmann, H., Dethloff, K., Dütsch, M., Ebell, K., Ehrlich, A., Ellis, J., Engelmann, R., Fong, A. A., Frey, M. M., Gallagher, M. R., Ganzeveld, L., Gradinger, R., Graeser, J., Greenamyer, V., Griesche, H., Griffiths, S., Hamilton, J., Heinemann, G., Helmig, D., Herber, A., Heuzé, C., Hofer, J., Houchens, T., Howard, D., Inoue, J., Jacobi, H.-W., Jaiser, R., Jokinen, T., Jourdan, O., Jozef, G., King, W., Kirchgaessner, A., Klingebiel, M., Krassovski, M., Krumpen, T., Lampert, A., Landing, W., Laurila, T., Lawrence, D., Lonardi, M., Loose, B., Lüpkes, C., Maahn, M., Macke, A., Maslowski, W., Marsay, C., Maturilli, M., Mech, M., Morris, S., Moser, M., Nicolaus, M., Ortega, P., Osborn, J., Pätzold, F., Perovich, D. K., Petäjä, T., Pilz, C., Pirazzini, R., Posman, K., Powers, H., Pratt, K. A., Preußer, A., Quéléver, L., Radenz, M., Rabe, B., Rinke, A., Sachs, T., Schulz, A., Siebert, H., Silva, T., Solomon, A., Sommerfeld, A., Spreen, G., Stephens, M., Stohl, A., Svensson, G., Uin, J., Viegas, J., Voigt, C., von der Gathen, P., Wehner, B., Welker, J. M., Wendisch, M., Werner, M., Xie, Z., and Yue, F.: Overview of the MOSAiC expedition: Atmosphere, Elem. Sci. Anth., 10, 00060, https://doi.org/10.1525/elementa.2021.00060, 2022. a
Sodemann, H.: Isotopic links to atmospheric water's sources – ISLAS, European research council, Grant agreement ID: 773245, https://doi.org/10.3030/773245, 2018. a
Solomon, A., Shupe, M. D., Svensson, G., Barton, N. P., Batrak, Y., Bazile, E., Day, J. J., Doyle, J. D., Frank, H. P., Keeley, S., Remes, T., and Tolstykh, M.: The winter central Arctic surface energy budget: A model evaluation using observations from the MOSAiC campaign, Elem. Sci. Anth., 11, 00104, https://doi.org/10.1525/elementa.2022.00104, 2023. a, b
Spreen, G., Kaleschke, L., and Heygster, G.: Sea Ice Remote Sensing Using AMSR-E 89-GHz Channels, J. Geophys. Res.-Oceans, 113, C02S03, https://doi.org/10.1029/2005JC003384, 2008. a, b
Sprenger, M. and Wernli, H.: The LAGRANTO Lagrangian analysis tool – version 2.0, Geosci. Model Dev., 8, 2569–2586, https://doi.org/10.5194/gmd-8-2569-2015, 2015. a
Stachlewska, I. S., Neuber, R., Lampert, A., Ritter, C., and Wehrle, G.: AMALi – the Airborne Mobile Aerosol Lidar for Arctic research, Atmos. Chem. Phys., 10, 2947–2963, https://doi.org/10.5194/acp-10-2947-2010, 2010. a, b
Stapf, J., Ehrlich, A., Jäkel, E., Lüpkes, C., and Wendisch, M.: Reassessment of shortwave surface cloud radiative forcing in the Arctic: consideration of surface-albedo–cloud interactions, Atmos. Chem. Phys., 20, 9895–9914, https://doi.org/10.5194/acp-20-9895-2020, 2020. a
Stapf, J., Ehrlich, A., and Wendisch, M.: Influence of Thermodynamic State Changes on Surface Cloud Radiative Forcing in the Arctic: A Comparison of Two Approaches Using Data From AFLUX and SHEBA, J. Geophys. Res.-Atmos., 126, e2020JD033589, https://doi.org/10.1029/2020JD033589, 2021. a
Stevens, B., Ament, F., Bony, S., Crewell, S., Ewald, F., Gross, S., Hansen, A., Hirsch, L., Jacob, M., Kölling, T., Konow, H., Mayer, B., Wendisch, M., Wirth, M., Wolf, K., Bakan, S., Bauer-Pfundstein, M., Brueck, M., Delanoë, J., Ehrlich, A., Farrell, D., Forde, M., Gödde, F., Grob, H., Hagen, M., Jäkel, E., Jansen, F., Klepp, C., Klingebiel, M., Mech, M., Peters, G., Rapp, M., Wing, A. A., and Zinner, T.: A High-Altitude Long-Range Aircraft Configured as a Cloud Observatory: The NARVAL Expeditions, B. Am. Meteorol. Soc., 100, 1061–1077, https://doi.org/10.1175/BAMS-D-18-0198.1, 2019. a, b
Strong, C., Foster, D., Cherkaev, E., Eisenman, I., and Golden, K. M.: On the Definition of Marginal Ice Zone Width, J. Atmos. Ocean. Tech., 34, 1565–1584, https://doi.org/10.1175/JTECH-D-16-0171.1, 2017. a
Su, W., Dutton, E., Charlock, T. P., and Wiscombe, W.: Performance of Commercial Radiometers in Very Low Temperature and Pressure Environments Typical of Polar Regions and of the Stratosphere: A Laboratory Study, J. Atmos. Ocean. Tech., 25, 558–569, https://doi.org/10.1175/2007JTECHA1005.1, 2008. a
Tatzelt, C., Schaefer, J., Wetzel, B., Grawe, S., Henning, S., Roberts, G. C., Mertes, S., and Stratmann, F.: Airborne in-situ measurements of cloud condensation nuclei during the HALO-AC3 campaign in March/April 2022, PANGAEA [data set], https://doi.org/10.1594/PANGAEA.969122, 2024a. a, b
Tatzelt, C., Schaefer, J., Wetzel, B., Grawe, S., Henning, S., Tuch, T., Mertes, S., and Stratmann, F.: Airborne in-situ measurements of aerosol particle number size distribution during the HALO-AC3 campaign in March/April 2022, PANGAEA [data set], https://doi.org/10.1594/PANGAEA.968633, 2024b. a, b
Tetzlaff, A., Lüpkes, C., and Hartmann, J.: Aircraft-Based Observations of Atmospheric Boundary-Layer Modification over Arctic Leads, Q. J. Roy. Meteoro. Soc., 141, 2839–2856, https://doi.org/10.1002/qj.2568, 2015. a
Tjernström, M., Leck, C., Birch, C. E., Bottenheim, J. W., Brooks, B. J., Brooks, I. M., Bäcklin, L., Chang, R. Y.-W., de Leeuw, G., Di Liberto, L., de la Rosa, S., Granath, E., Graus, M., Hansel, A., Heintzenberg, J., Held, A., Hind, A., Johnston, P., Knulst, J., Martin, M., Matrai, P. A., Mauritsen, T., Müller, M., Norris, S. J., Orellana, M. V., Orsini, D. A., Paatero, J., Persson, P. O. G., Gao, Q., Rauschenberg, C., Ristovski, Z., Sedlar, J., Shupe, M. D., Sierau, B., Sirevaag, A., Sjogren, S., Stetzer, O., Swietlicki, E., Szczodrak, M., Vaattovaara, P., Wahlberg, N., Westberg, M., and Wheeler, C. R.: The Arctic Summer Cloud Ocean Study (ASCOS): overview and experimental design, Atmos. Chem. Phys., 14, 2823–2869, https://doi.org/10.5194/acp-14-2823-2014, 2014. a
Vaisala: Vaisala Radiosonde RD41 datasheet in English, B211706EN-B, https://www.nirb.ca/portal/dms/script/dms_download.php?fileid=340414&applicationid=125718&sessionid=ka7asjkahsplnt1tq4rduoqbl1 (last access: 24 March 2025), 2020. a, b, c
Vance, A. K., Abel, S. J., Cotton, R. J., and Woolley, A. M.: Performance of WVSS-II hygrometers on the FAAM research aircraft, Atmos. Meas. Tech., 8, 1617–1625, https://doi.org/10.5194/amt-8-1617-2015, 2015. a
Vömel, H., Goodstein, M., Tudor, L., Witte, J., Fuchs-Stone, Ž., Sentić, S., Raymond, D., Martinez-Claros, J., Juračić, A., Maithel, V., and Whitaker, J. W.: High-resolution in situ observations of atmospheric thermodynamics using dropsondes during the Organization of Tropical East Pacific Convection (OTREC) field campaign , Earth Syst. Sci. Data, 13, 1107–1117, https://doi.org/10.5194/essd-13-1107-2021, 2021. a
Vüllers, J., Achtert, P., Brooks, I. M., Tjernström, M., Prytherch, J., Burzik, A., and Neely III, R.: Meteorological and cloud conditions during the Arctic Ocean 2018 expedition, Atmos. Chem. Phys., 21, 289–314, https://doi.org/10.5194/acp-21-289-2021, 2021. a, b
Walbröl, A.: AnWalbroel/CSSC_HALO-AC3: CSSC_HALO-AC3 for: The HALO – (AC)3 data set (1.0.0), Zenodo [code], https://doi.org/10.5281/zenodo.15085734, 2025. a
Walbröl, A., Michaelis, J., Becker, S., Dorff, H., Ebell, K., Gorodetskaya, I., Heinold, B., Kirbus, B., Lauer, M., Maherndl, N., Maturilli, M., Mayer, J., Müller, H., Neggers, R. A. J., Paulus, F. M., Röttenbacher, J., Rückert, J. E., Schirmacher, I., Slättberg, N., Ehrlich, A., Wendisch, M., and Crewell, S.: Contrasting extremely warm and long-lasting cold air anomalies in the North Atlantic sector of the Arctic during the HALO-(AC)3 campaign, Atmos. Chem. Phys., 24, 8007–8029, https://doi.org/10.5194/acp-24-8007-2024, 2024. a, b, c
Weber, A., Pörtge, V., Volkmer, L., Zinner, T., and Mayer, B.: Polarization measurements with the hyperspectral and polarized imaging system specMACS during the HALO-(AC)3 field campaign, PANGAEA [data set], https://doi.org/10.1594/PANGAEA.965546, 2024a. a, b
Weber, A., Pörtge, V., Zinner, T., and Mayer, B.: Spectral radiance measurements with the hyperspectral and polarized imaging system specMACS during the HALO-(AC)3 field campaign, PANGAEA [data set], https://doi.org/10.1594/PANGAEA.966992, 2024b. a, b
Weber, A., Kölling, T., Pörtge, V., Baumgartner, A., Rammeloo, C., Zinner, T., and Mayer, B.: Polarization upgrade of specMACS: calibration and characterization of the 2D RGB polarization-resolving cameras, Atmos. Meas. Tech., 17, 1419–1439, https://doi.org/10.5194/amt-17-1419-2024, 2024c. a, b, c, d
Wendisch, M., Müller, D., Schell, D., and Heintzenberg, J.: An airborne spectral albedometer with active horizontal stabilization, J. Atmos. Ocean. Tech., 18, 1856–1866, https://doi.org/10.1175/1520-0426(2001)018<1856:AASAWA>2.0.CO;2, 2001. a, b
Wendisch, M., Macke, A., Ehrlich, A., Lüpkes, C., Mech, M., Chechin, D., Dethloff, K., Velasco, C. B., Bozem, H., Brückner, M., Clemen, H. C., Crewell, S., Donth, T., Dupuy, R., Ebell, K., Egerer, U., Engelmann, R., Engler, C., Eppers, O., Gehrmann, M., Gong, X., Gottschalk, M., Gourbeyre, C., Griesche, H., Hartmann, J., Hartmann, M., Heinold, B., Herber, A., Herrmann, H., Heygster, G., Hoor, P., Jafariserajehlou, S., Jäkel, E., Järvinen, E., Jourdan, O., Kästner, U., Kecorius, S., Knudsen, E. M., Köllner, F., Kretzschmar, J., Lelli, L., Leroy, D., Maturilli, M., Mei, L., Mertes, S., Mioche, G., Neuber, R., Nicolaus, M., Nomokonova, T., Notholt, J., Palm, M., Van Pinxteren, M., Quaas, J., Richter, P., Ruiz-Donoso, E., Schäfer, M., Schmieder, K., Schnaiter, M., Schneider, J., Schwarzenböck, A., Seifert, P., Shupe, M. D., Siebert, H., Spreen, G., Stapf, J., Stratmann, F., Vogl, T., Welti, A., Wex, H., Wiedensohler, A., Zanatta, M., and Zeppenfeld, S.: The Arctic Cloud Puzzle: Using ACLOUD/PASCAL Multiplatform Observations to Unravel the Role of Clouds and Aerosol Particles in Arctic Amplification, B. Am. Meteorol. Soc., 100, 841–871, https://doi.org/10.1175/BAMS-D-18-0072.1, 2019. a
Wendisch, M., Handorf, D., Tegen, I., Neggers, R., and Spreen, G.: Glimpsing the ins and outs of the Arctic atmospheric cauldron, Eos, 102, https://doi.org/10.1029/2021EO155959, 2021. a
Wendisch, M., Brückner, M., Crewell, S., Ehrlich, A., Notholt, J., Lüpkes, C., Macke, A., Burrows, J. P., Rinke, A., Quaas, J., Maturilli, M., Schemann, V., Shupe, M. D., Akansu, E. F., Barrientos-Velasco, C., Bärfuss, K., Blechschmidt, A.-M., Block, K., Bougoudis, I., Bozem, H., Böckmann, C., Bracher, A., Bresson, H., Bretschneider, L., Buschmann, M., Chechin, D. G., Chylik, J., Dahlke, S., Deneke, H., Dethloff, K., Donth, T., Dorn, W., Dupuy, R., Ebell, K., Egerer, U., Engelmann, R., Eppers, O., Gerdes, R., Gierens, R., Gorodetskaya, I. V., Gottschalk, M., Griesche, H., Gryanik, V. M., Handorf, D., Harm-Altstädter, B., Hartmann, J., Hartmann, M., Heinold, B., Herber, A., Herrmann, H., Heygster, G., Höschel, I., Hofmann, Z., Hölemann, J., Hünerbein, A., Jafariserajehlou, S., Jäkel, E., Jacobi, C., Janout, M., Jansen, F., Jourdan, O., Jurányi, Z., Kalesse-Los, H., Kanzow, T., Käthner, R., Kliesch, L. L., Klingebiel, M., Knudsen, E. M., Kovács, T., Körtke, W., Krampe, D., Kretzschmar, J., Kreyling, D., Kulla, B., Kunkel, D., Lampert, A., Lauer, M., Lelli, L., von Lerber, A., Linke, O., Löhnert, U., Lonardi, M., Losa, S. N., Losch, M., Maahn, M., Mech, M., Mei, L., Mertes, S., Metzner, E., Mewes, D., Michaelis, J., Mioche, G., Moser, M., Nakoudi, K., Neggers, R., Neuber, R., Nomokonova, T., Oelker, J., Papakonstantinou-Presvelou, I., Pätzold, F., Pefanis, V., Pohl, C., van Pinxteren, M., Radovan, A., Rhein, M., Rex, M., Richter, A., Risse, N., Ritter, C., Rostosky, P., Rozanov, V. V., Donoso, E. R., Saavedra Garfias, P., Salzmann, M., Schacht, J., Schäfer, M., Schneider, J., Schnierstein, N., Seifert, P., Seo, S., Siebert, H., Soppa, M. A., Spreen, G., Stachlewska, I. S., Stapf, J., Stratmann, F., Tegen, I., Viceto, C., Voigt, C., Vountas, M., Walbröl, A., Walter, M., Wehner, B., Wex, H., Willmes, S., Zanatta, M., and Zeppenfeld, S.: Atmospheric and Surface Processes, and Feedback Mechanisms Determining Arctic Amplification: A Review of First Results and Prospects of the (AC)3 Project, B. Am. Meteorol. Soc., 104, E208–E242, https://doi.org/10.1175/BAMS-D-21-0218.1, 2023a. a
Wendisch, M., Stapf, J., Becker, S., Ehrlich, A., Jäkel, E., Klingebiel, M., Lüpkes, C., Schäfer, M., and Shupe, M. D.: Effects of variable ice–ocean surface properties and air mass transformation on the Arctic radiative energy budget, Atmos. Chem. Phys., 23, 9647–9667, https://doi.org/10.5194/acp-23-9647-2023, 2023b. a
Wendisch, M., Crewell, S., Ehrlich, A., Herber, A., Kirbus, B., Lüpkes, C., Mech, M., Abel, S. J., Akansu, E. F., Ament, F., Aubry, C., Becker, S., Borrmann, S., Bozem, H., Brückner, M., Clemen, H.-C., Dahlke, S., Dekoutsidis, G., Delanoë, J., De La Torre Castro, E., Dorff, H., Dupuy, R., Eppers, O., Ewald, F., George, G., Gorodetskaya, I. V., Grawe, S., Groß, S., Hartmann, J., Henning, S., Hirsch, L., Jäkel, E., Joppe, P., Jourdan, O., Jurányi, Z., Karalis, M., Kellermann, M., Klingebiel, M., Lonardi, M., Lucke, J., Luebke, A. E., Maahn, M., Maherndl, N., Maturilli, M., Mayer, B., Mayer, J., Mertes, S., Michaelis, J., Michalkov, M., Mioche, G., Moser, M., Müller, H., Neggers, R., Ori, D., Paul, D., Paulus, F. M., Pilz, C., Pithan, F., Pöhlker, M., Pörtge, V., Ringel, M., Risse, N., Roberts, G. C., Rosenburg, S., Röttenbacher, J., Rückert, J., Schäfer, M., Schaefer, J., Schemann, V., Schirmacher, I., Schmidt, J., Schmidt, S., Schneider, J., Schnitt, S., Schwarz, A., Siebert, H., Sodemann, H., Sperzel, T., Spreen, G., Stevens, B., Stratmann, F., Svensson, G., Tatzelt, C., Tuch, T., Vihma, T., Voigt, C., Volkmer, L., Walbröl, A., Weber, A., Wehner, B., Wetzel, B., Wirth, M., and Zinner, T.: Overview: quasi-Lagrangian observations of Arctic air mass transformations – introduction and initial results of the HALO–(𝒜𝒞)3 aircraft campaign, Atmos. Chem. Phys., 24, 8865–8892, https://doi.org/10.5194/acp-24-8865-2024, 2024. a, b, c, d, e, f
Wesche, C., Steinhage, D., and Nixdorf, U.: Polar aircraft Polar5 and Polar6 operated by the Alfred Wegener Institute, JLSRF, 2, A87, https://doi.org/10.17815/jlsrf-2-153, 2016. a
Wiedensohler, A., Birmili, W., Nowak, A., Sonntag, A., Weinhold, K., Merkel, M., Wehner, B., Tuch, T., Pfeifer, S., Fiebig, M., Fjäraa, A. M., Asmi, E., Sellegri, K., Depuy, R., Venzac, H., Villani, P., Laj, P., Aalto, P., Ogren, J. A., Swietlicki, E., Williams, P., Roldin, P., Quincey, P., Hüglin, C., Fierz-Schmidhauser, R., Gysel, M., Weingartner, E., Riccobono, F., Santos, S., Grüning, C., Faloon, K., Beddows, D., Harrison, R., Monahan, C., Jennings, S. G., O'Dowd, C. D., Marinoni, A., Horn, H.-G., Keck, L., Jiang, J., Scheckman, J., McMurry, P. H., Deng, Z., Zhao, C. S., Moerman, M., Henzing, B., de Leeuw, G., Löschau, G., and Bastian, S.: Mobility particle size spectrometers: harmonization of technical standards and data structure to facilitate high quality long-term observations of atmospheric particle number size distributions, Atmos. Meas. Tech., 5, 657–685, https://doi.org/10.5194/amt-5-657-2012, 2012. a, b
Wirth, M. and Groß, S.: Aircraft measurements of backscatter ratio, particle depolarization and water vapour molecular density profiles over Arctic sea ice and ocean during the HALO-(AC)3 campaign in spring 2022, PANGAEA [data set], https://doi.org/10.1594/PANGAEA.967086, 2024. a, b
Wirth, M., Fix, A., Mahnke, P., Schwarzer, H., Schrandt, F., and Ehret, G.: The airborne multi-wavelength water vapor differential absorption lidar WALES: system design and performance, Appl. Phys. B, 96, 201, https://doi.org/10.1007/s00340-009-3365-7, 2009. a, b
Wolf, K., Ehrlich, A., Jacob, M., Crewell, S., Wirth, M., and Wendisch, M.: Improvement of airborne retrievals of cloud droplet number concentration of trade wind cumulus using a synergetic approach, Atmos. Meas. Tech., 12, 1635–1658, https://doi.org/10.5194/amt-12-1635-2019, 2019. a, b, c
Zanatta, M., Mertes, S., Jourdan, O., Dupuy, R., Järvinen, E., Schnaiter, M., Eppers, O., Schneider, J., Jurányi, Z., and Herber, A.: Airborne investigation of black carbon interaction with low-level, persistent, mixed-phase clouds in the Arctic summer, Atmos. Chem. Phys., 23, 7955–7973, https://doi.org/10.5194/acp-23-7955-2023, 2023. a, b