the Creative Commons Attribution 4.0 License.
the Creative Commons Attribution 4.0 License.
 | 20 Mar 2025
A 45-year hydrological and planktonic time series in the South Bight of the North Sea
Guillaume Wacquet
Alain Lefebvre
This article presents a 45-year data series (from 1978 to 2023) acquired under the IGA (Impact des Grands Aménagements in French, Impacts of Major Developments in English) program conducted by IFREMER for EDF (Électricité de France, the French multinational electricity utility company). The IGA program was established to monitor the ecological and environmental quality of the coastal area surrounding the Gravelines Nuclear Power Plant (GNPP) located in the South Bight of the North Sea. The main objective of this program is to assess medium- and long-term environmental evolution by providing the means to identify possible changes in local marine habitats. Since 1978, the IGA program has measured key parameters, including temperature, salinity, nutrient concentrations, oxygen levels, chlorophyll-a concentrations, and the abundance of phytoplankton and zooplankton species. These measurements have been taken at different sampling stations around the GNPP, including the Canal d'amenée sampling station, for which hydrological and biological characteristics are considered representative of the broader coastal area of the South Bight of the North Sea. This data paper provides an overview of the main statistical characteristics of the time series (available at https://doi.org/10.17882/102656, Lefebvre et al., 2024), including long-term trends and shift analysis. Despite the importance and length of this dataset, one of the longest available for this region, its application in advancing knowledge of hydrological and biological processes has been surprisingly limited. The aim of this paper is to make this valuable dataset available to the scientific community, stakeholders, and society to help decipher the local and global influences of anthropogenic activities in a world increasingly affected by climate change. Since all the main statistics and patterns are still available thanks to our analysis, users should be able to use these data and combine them with other sources (in situ, satellite, and modeling) in order to dive into deeper analyses and investigate new key scientific challenges and more specific ones.
- Article
(4628 KB) - Full-text XML
-
Supplement
(581 KB) - BibTeX
- EndNote


Understanding the dynamics of marine ecosystems requires long-term time series that allow us to take into account different sources of natural variability (seasonal and interannual) and anthropogenic variability (under local or regional pressures and global warming). However, such long-term series are difficult to obtain, as it is costly to maintain and require measurement protocols that are stabilized throughout their duration to avoid acquisition biases. Long-term planktonic time series, particularly for phytoplankton and zooplankton, are especially relatively scarce and not widely available in the scientific literature.
Phytoplankton form the basis of pelagic food chains and are responsible for approximately 50 % of global primary production (Falkowski et al., 2003), playing a crucial role in capturing carbon dioxide (CO2) and producing oxygen (O2). Under certain favorable conditions of temperature, light, turbulence, and nutrient availability, the growth of various phytoplankton species can be enhanced. Among the species forming massive blooms in the eastern English Channel and South Bight of the North Sea (SBNS), some, like Pseudo-Nitzschia, Dinophysis, and Alexandrium, are known to produce phycotoxins that pose significant health risks to humans when introduced into the food chain, particularly through filter-feeding shellfish. Other species, such as Phaeocystis globosa (Lefebvre and Dezécache, 2020; Karasiewicz and Lefebvre, 2022; Karasiewicz et al., 2018; Lancelot and Rousseau, 1994), can become so abundant that they disrupt ecosystem functioning. Both physicochemical parameters (bottom-up control) and zooplankton populations (top-down control) influence the phenology of phytoplankton species (Banse, 1992; Feng et al., 2014).
Zooplankton form the main aquatic animal compartment in terms of biomass and diversity (Mauchline, 1998). Zooplankton are considered primary consumers, as they are major consumers of phytoplankton (Atkinson, 1996), which makes this organic matter available to predatory animals, particularly fish larvae and juveniles. In the eastern English Channel and SBNS, holoplankton (i.e., species that stay planktonic throughout their life cycle, in contrast to meroplankton) are dominated by copepod species such as the calanoids Temora longicornis, Acartia clausii, and Centropages hamatus and the harpacticoid Euterpina acutifrons (in order of annual phenology and dominance; Brylinski, 2009). Zooplankton communities are generally studied on an ad hoc basis, and long-term zooplankton time series are even rarer in the scientific literature than phytoplankton time series, especially in the eastern English Channel and the French part of the SBNS.
Ecological monitoring of nuclear power plant (NPP) discharges into the sea focuses on studying the medium- to long-term temporal evolution of various marine domains, including the pelagic, benthic, and fishery domains, along with their associated compartments (hydrology, physicochemistry, chemistry, phytoplankton, zooplankton, benthos, and microbiology). This monitoring is conducted on a localized spatial scale, focusing on areas surrounding the power plants and within their zones of influence. The aim is to detect any changes from monitoring specific parameters that are characteristic of each marine compartment. Ecological monitoring of such infrastructure in Gravelines, located in the French coastal part of the Dover Straight, was initiated in 1978, providing the longest-running ecological time series in this part of the English Channel–North Sea continuum. The monitoring strategy and sampling methods (including the sampling locations and frequencies and the nature of the analyses carried out) evolved between 1978 and 1986 as the six production units of the Gravelines power plant came on stream. One of the monitoring stations (named Canal d'amenée) of this network was specifically set up to track the characteristics of seawater entering the cooling turbines and is therefore not influenced by the NPP activity. This monitoring station, crucial for smooth operation of NPPs, has benefited from an improvement of the monitoring protocol by increasing the frequency of the measurements. Particular attention has been paid to plankton monitoring, where certain species (gelatinous zooplankton or harmful algal bloom species (HABs) such as Phaeocystis globosa) are known to cause seasonal disruptions to NPP operations (Masilamoni et al., 2000; Wang et al., 2022, 2023). Initially established to assess the direct and indirect effects of large-scale coastal developments, this monitoring effort now also offers scientists a valuable opportunity to study local plankton dynamics on a multidecadal scale.
The aim of this paper is to present the IGA (Impact des Grands Aménagements in French, Impacts of Major Developments in English) physicochemical, phytoplankton, and zooplankton dataset at the Canal d'amenée sampling point. This includes an overview of the sampling strategy, data collection process (with the associated quality-assurance and quality-control steps), data investigation, and storage. The characteristics of the different datasets and a general interpretation of their variability will be detailed. Based on the limited existing applications and valorizations of the IGA dataset, we will demonstrate its relevance not only for furthering understanding of marine phytoplankton ecology, but also public policy needs, such as assessment of environmental or ecological status as requested by EU directives and regional sea conventions. Additionally, we introduce some numerical tools based on an R package available for the scientific community and developed specifically to rapidly process such data and therefore valorize the findings.
3.1 Sampling point location
The GNPP site is located in the South Bight of the North Sea, near the Dover Strait. This location, coupled with the shallow waters (less than 30 m), results in strong hydrodynamic conditions. The hydrodynamic regime of the southern North Sea is influenced by the semidiurnal tidal circulation and wind action. The range is macrotidal, varying from 3.5 m during neap tides to 5.6 m during spring tides. Tidal currents along the Dunkirk coast run parallel to the coast and are asymmetrical: the flood tide, flowing northeast, is faster and more intense than the ebb tide, which flows southwest. This flood current dominates the entire southern North Sea coastline (Fig. 1), with recorded maximum speeds of approximately 1.5 m s−1. Off Dunkirk, “the flood is present between 3 h before and 3 h after high tide” (SHOM, 1988). The only river flowing into the North Sea along the French coast is the Aa, a river 89 km long with a watershed of 1215 km2 and a discharge rate of 10 . Industrial activities represent the main local pressures on this environment.
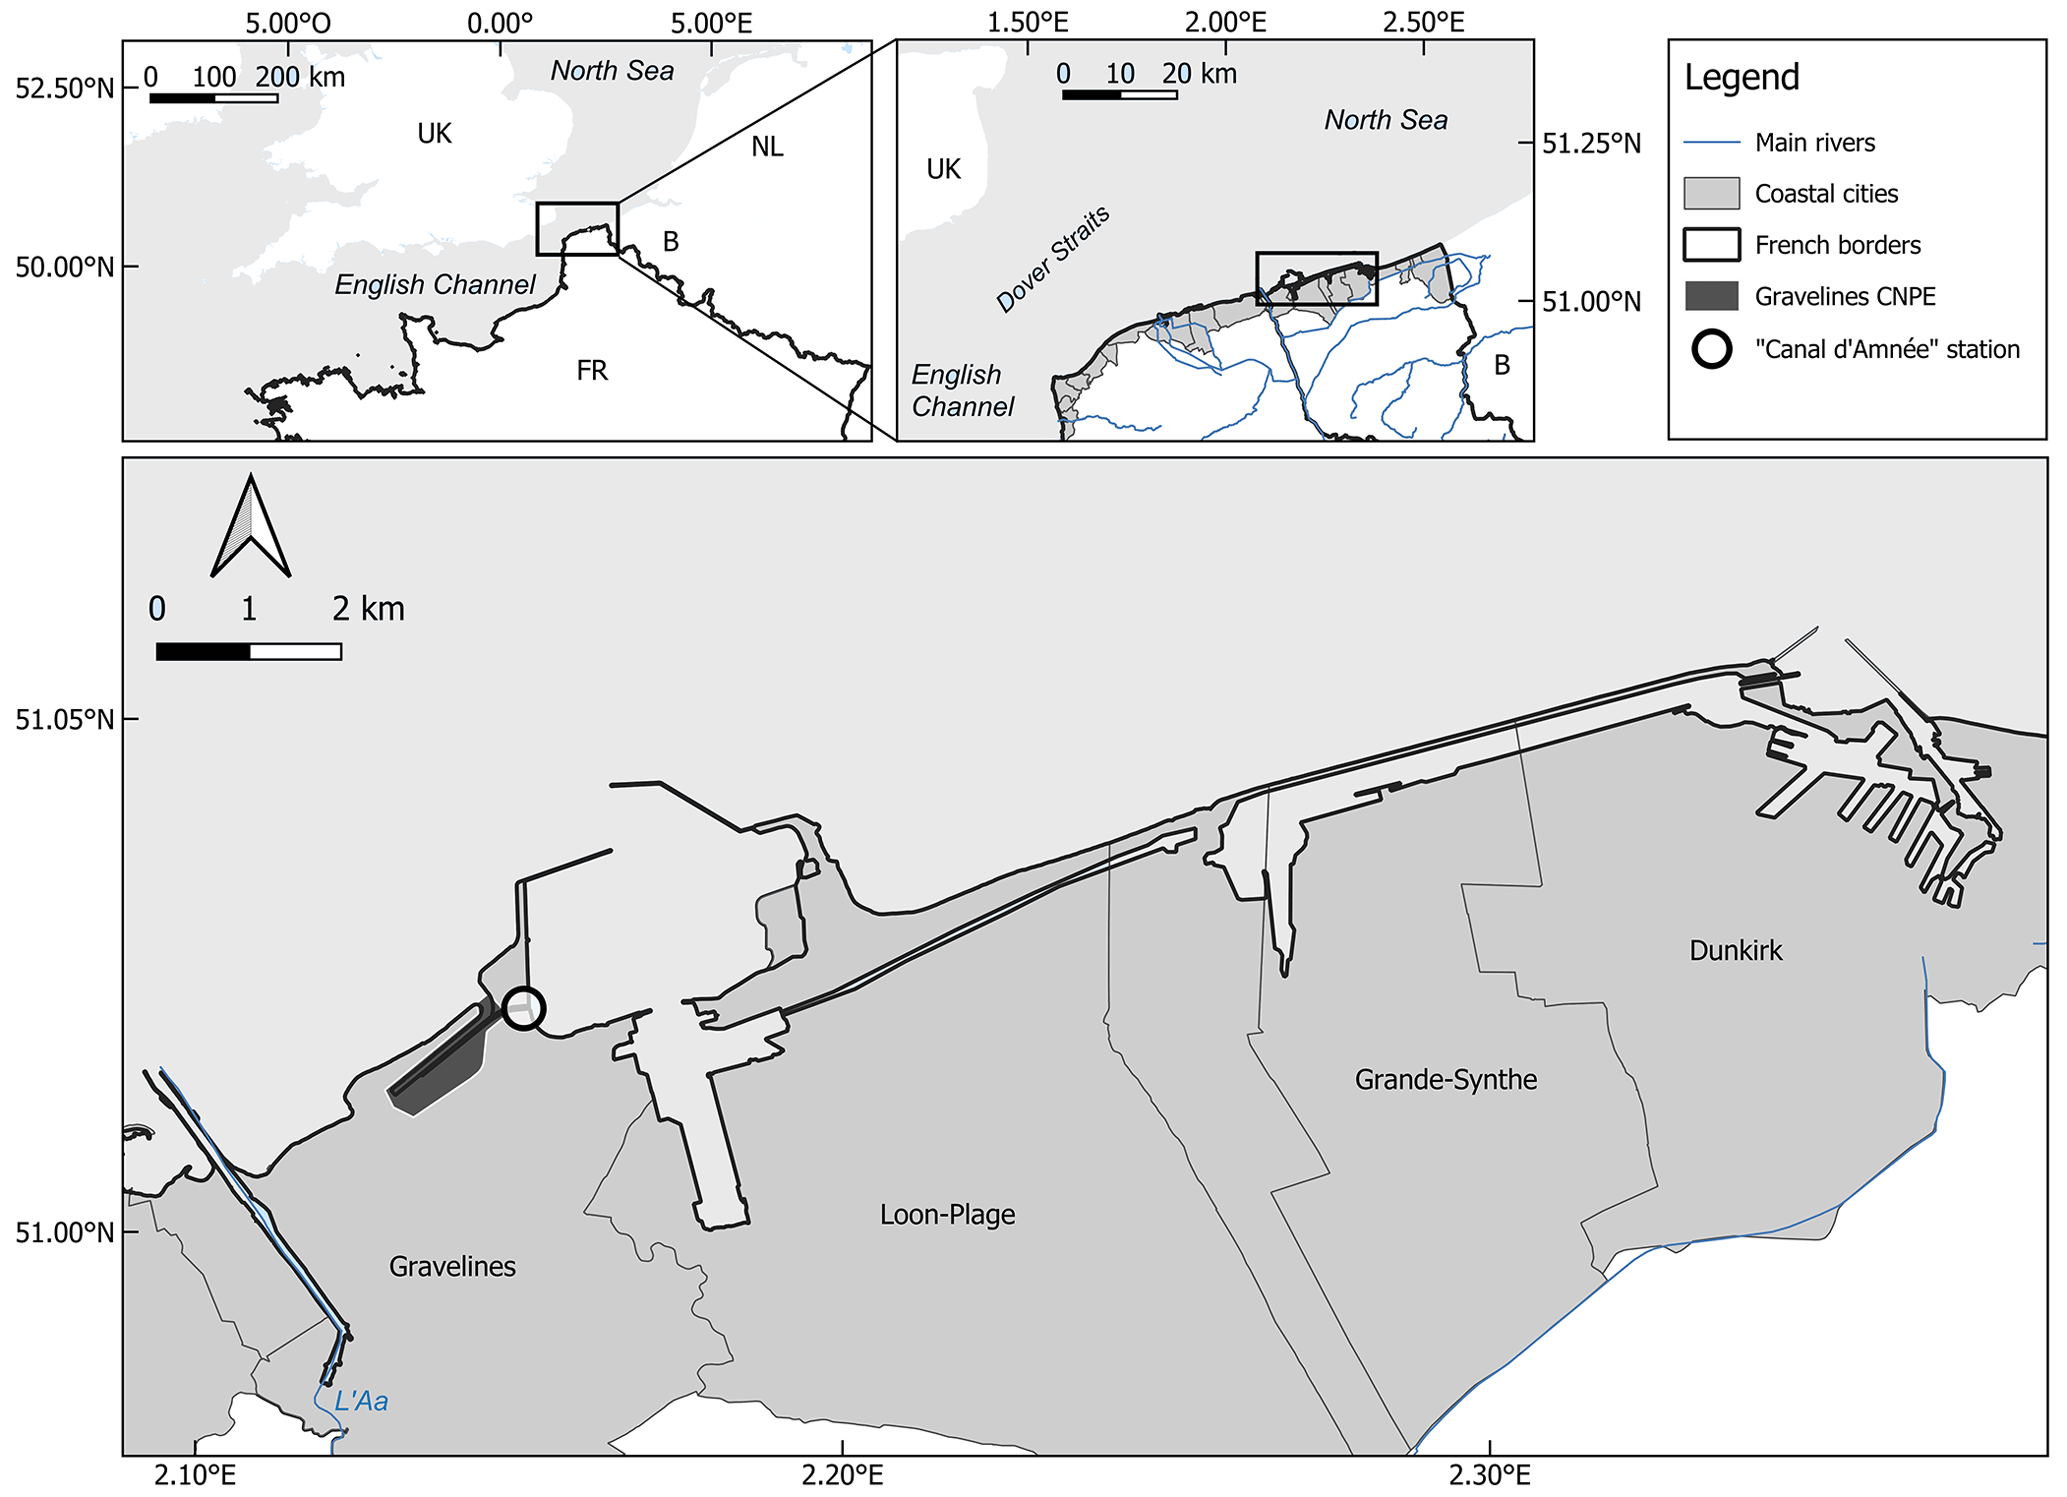
Figure 1Location of the Canal d'amenée sampling station (black circle) in the Gravelines harbor, which is open on the South Bight of the North Sea.
The most comprehensive ecological time series are available from the Canal d'amenée sampling station (x: 2.15003, y: 51.0222), located within the Gravelines harbor at the entrance of the NPP cooling system (Fig. 1). This position allows the station to avoid the direct impacts of the NPP operations, although it remains subject to other anthropogenic influences such as global warming and eutrophication. This is therefore a relevant position for coastal monitoring, completing the monitoring network of the French North Sea coastal ecosystem alongside the SRN Dunkerque 1 station (Lefebvre and Devreker, 2023).
3.2 Hydrological and biological parameter measurements
Water samples were initially collected at a monthly frequency and later at a weekly frequency at the end of the 1980s at the surface of the Canal d'amenée sampling station. Water samples were analyzed for different parameter measurements, though not all parameters were measured at every sampling. The evolution of the monitoring practices and the specific temporal distribution of the samples are detailed by the parameters in the Supplement (Table S1 and Figs. S1–S3).
3.2.1 Temperature, salinity, turbidity, and oxygen concentration
These four variables are measured using a multiparameter probe. Salinity is determined using a conductivity sensor coupled with a temperature sensor (°C) and is expressed as a conductivity ratio (PSU for practical salinity unit). Unlike temperature measurements, which conform with the global frequency strategy (i.e., monthly sampling until 1985 and weekly since), salinity was recorded only twice a year between 1990 and 2006 and has been monitored weekly since 2013.
Since 2019, turbidity has been assessed by nephelometry and expressed in nephelometric turbidity units (NTUs) (USEPA, 1980), but it was measured with a FNU (formazine nephelometric unit, ISO 7027) sensor between 2016 and 2018. Turbidity is quantified by measuring the amount of light scattered at 90° compared to the incident light. Dissolved oxygen concentration has been measured using a luminescence oxygen sensor since 2016 (mg L−1) (NF EN ISO 25814). However, prior to 1987, it was measured using the Winkler method (mL L−1). The complete methods are described in Aminot and Kérouel (2004). Oxygen concentrations have only been measured in the 1970s, in the 1980s, and since 2016.
Except for turbidity, these variables are recognized as essential ocean variables (EOVs) for physics and biochemistry by the Global Ocean Observing System (GOOS) (Muller-Karger et al., 2018).
3.2.2 Nutrients
For nutrient analysis, a 65 mL subsample (for phosphate and dissolved inorganic nitrogen DIN = ammonium + nitrite + nitrate) or a 125 mL subsample (for silicate) of water filtered through a 48 µm mesh is frozen at −25 °C. Nutrient concentrations are subsequently measured in the laboratory using a spectrophotometer with an optical-density (OD)–concentration relationship determined from a calibration curve performed for each series of measurements. The complete methods are detailed in Aminot and Kérouel (2007).
Ammonium () is quantified using the indophenol blue molecular absorption spectrophotometric method (NF T90-015-2; µmol L−1). Nitrite () and nitrate () are measured using the N-naphthyl-ethylenediamine molecular absorption spectrophotometric method (NF ISO 13395; µmol L−1). Phosphate () is determined by the phosphomolybdic blue molecular absorption spectrophotometric method (NF ISO 6878; µmol L−1). Silicate (SiOH) in water is measured using the silico-molybdic blue molecular absorption spectrophotometric method (NF T90-007; µmol L−1).
Nutrient monitoring was suspended in the mid-1990s and 2000s for nitrates and nitrites. Phosphate measurements were more intermittent, conducted only from 1978 to 1986 and then resumed from 2016 to the present at a monthly frequency. The Global Ocean Observing System also classifies nutrients as essential ocean variables for biochemistry.
3.2.3 Chlorophyll a
To measure chlorophyll pigments, an indicator of phytoplankton biomass, 1 L of water is kept cool and protected from light. To determine the specific composition and abundance of phytoplankton, 500 mL of water is fixed with Lugol's solution (2.5 mL L−1 of seawater). Until 2018, chlorophyll-a concentrations were determined using the trichromatic method (SCOR-UNESCO, 1966). From 31 December 2018, the measurement method used has been the monochromatic method (Lorenzen, 1967). Regardless of the method, 1 L water samples are filtered through Whatman GF/C 47 mm glass-fiber filters. The chlorophyll pigments concentrated in these filters are then extracted with 90 % acetone. After centrifugation for 20 min at 6000 rpm, the absorbance of the supernatant is measured spectrophotometrically. The limit of quantification is 0.10 µg L−1.
Chlorophyll-a concentration (a proxy of phytoplankton biomass) is measured according to the global frequency strategy and is recognized as a Biology and Ecosystems EOV by the GOOS.
3.3 Plankton
3.3.1 Phytoplankton
A 10 mL volume of the Lugol-fixed water samples is decanted in a sedimentation tank for at least 12 h, following the method of Utermöhl (1958). Cell counts are then performed using inverted microscopy within a month of sample collection to minimize significant changes in phytoplankton size and abundance. Except for Phaeocystis globosa enumeration, over 200 phytoplankton cells per sample are counted using a 20X Plan Ph1 0.5NA objective, yielding an error margin of 10 %. Therefore, microphytoplankton (cell sizes between 20 and 200 µm) were mainly identified. For P. globosa, only the total number of cells is computed. A minimum of 50 solitary cells are enumerated from several randomly selected fields (10 to 30) using a 40X Plan Ph2 0.75NA objective. The abundance of cells in a colony is determined using a relationship between colony biovolume and cell number, as defined by Rousseau et al. (1990). No counting data for P. globosa are available between 1982 and 1990 for unknown reasons.
Phytoplankton identification is standardized using the WoRMS (2024) database and reaches the species level in many cases (Table 1). However, when identification is challenging or uncertain, a lower taxonomic level is kept. Some species are also grouped into “artificial taxa”, “complex” species, or common higher taxonomic ranks (mainly genus or family) if they are subject to strong identification confusion (this is the case for Pseudo-nitzschia or Chaetoceros, for example). In such cases, “[]” denotes a complex of species, while “+” denotes a complex of species and a common genus. These groupings are considered taxonomic units in order to maintain consistency in the database despite changes in taxonomic names. Freshwater phytoplankton and protozoa, though regularly found in low abundances in samples, are not considered in figures and statistical analyses that only focus on marine species. Phytoplankton species diversity calculations and the Shannon–Wiener index (Eq. 1) are based on all the taxonomic levels:
with H′ the index value and pi the proportion of the entire community made up of species i.
Table 1Number and occurrence of the different taxonomic ranks (highest level of taxonomic identification) encountered in phytoplankton identification.
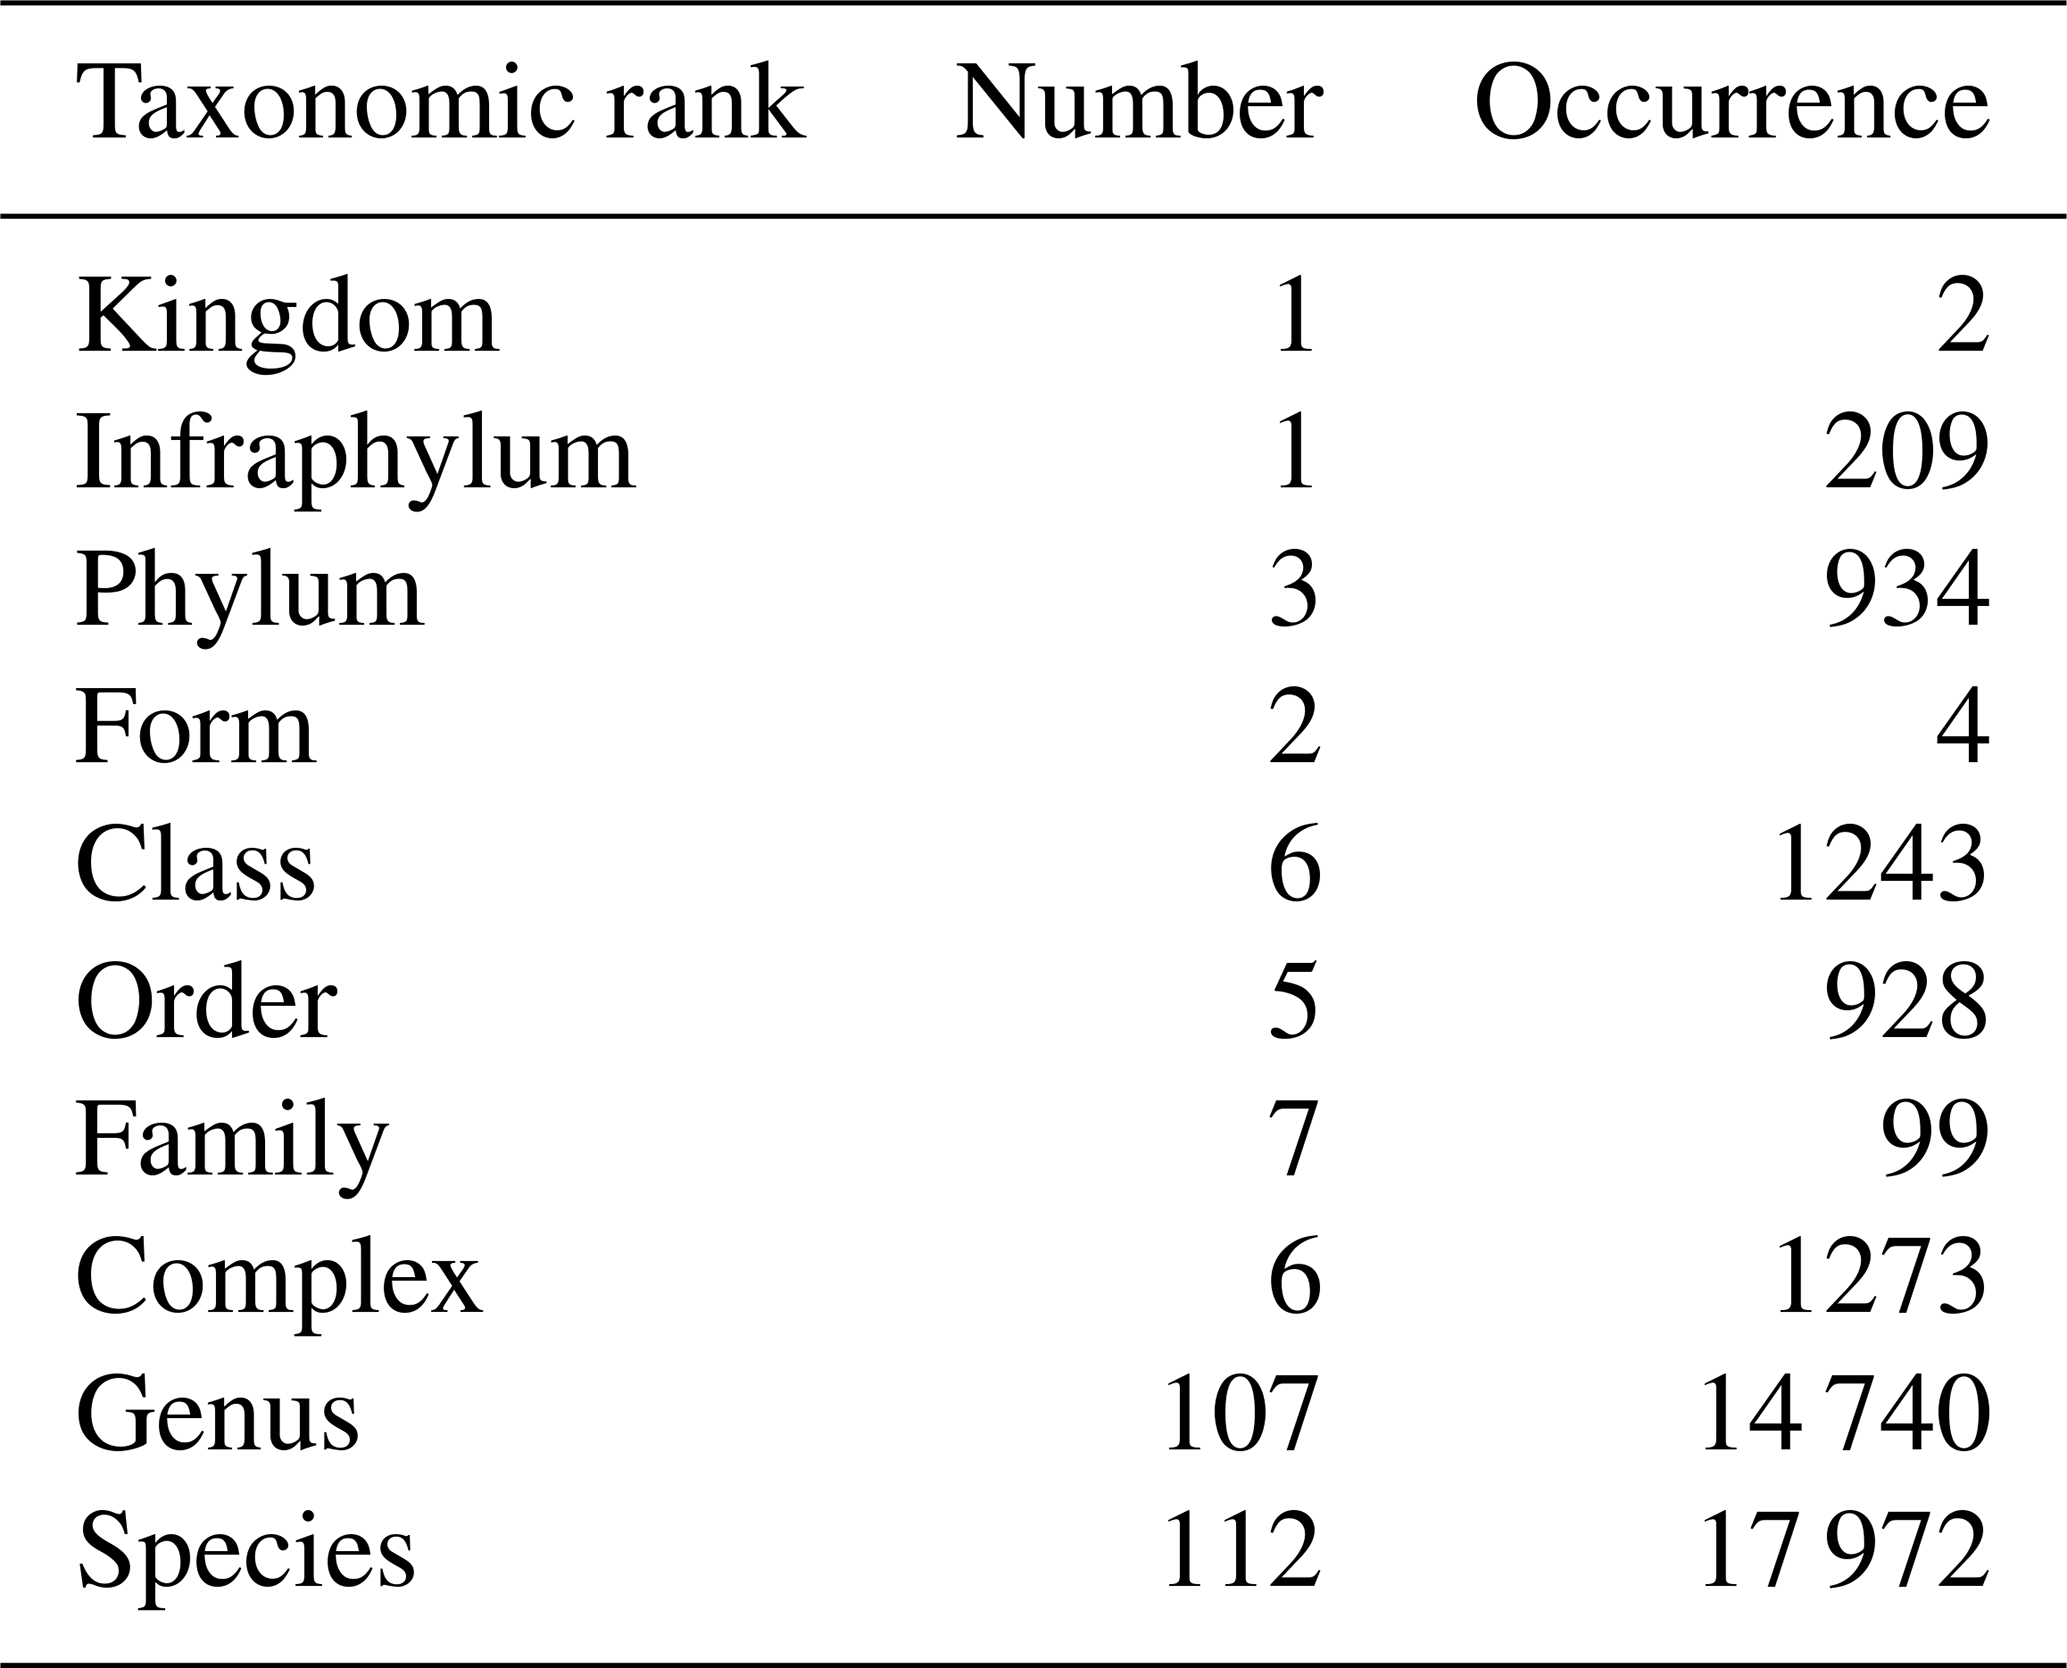
During the period from 1978 to 2023 (excluding 1987, which is a missing year), a total of 1811 phytoplankton samples were collected, representing 237 taxa across various taxonomic ranks, which are mostly species and genera, providing good overall taxonomic accuracy (Table 1). Of these taxa, the Prymnesiophyceae species Phaeocystis globosa is the most abundant, with blooms reaching “more than millions” of cells per liter each year. The six other prevalent taxa are Bacillariophyceae species (i.e., Rhizosolenia delicatula, Chaetoceros, and Pseudo-nitzschia [calliantha + delicatissima + pseudodelicatissima + subcurvata]; Rhizosolenia sp.; Skeletonema costatum; and Leptocylindrus [danicus + curvatus + mediterraneus + aporus + convexus + hargravesii + adriaticus]). The seventh most common taxa are Cryptophyceae, while the first Dinophyceae genus is Gymnodinium, which is ranked in 37th position. However, the relative dominance of these taxa can vary with the seasons and years.
Phytoplankton sampling frequencies conformed to the global frequency strategy, and phytoplankton diversity is recognized as a Biology and Ecosystems EOV by the GOOS.
3.3.2 Zooplankton
Zooplankton sampling at the Canal d'amenée station was conducted monthly using a WP2 net equipped with a flow meter for water volume calculations of each sample. By using a WP2 net, mesozooplankton (0.2–2 cm) and larger planktonic organisms were mainly sampled. The sampling duration was 10 min for gelatinous zooplankton and 3 min for mesozooplankton. Over time, the type of plankton net used has changed. From 1991 to 2007, the standard WP2 net, used since the start of monitoring in 1978, was replaced with a smaller net (0.09 m2 opening, 110 cm high, tapered, and with a 200 µm mesh size) for sampling in the intake channels. The smaller opening and conical shape of this net made it more sensitive to the effects of clogging and backflow, particularly in spring and summer, when algae (Phaeocystis globosa and Coscinodiscus sp.) or Noctiluca proliferate. The WP2 net, with its wider opening and cylindrical–conical shape, prevents backflow into the net and is more effective for capturing zooplankton from a single point. From 2008 onward, the standard WP2 net was reintroduced for sampling. A 2018 analysis of potential biases related to changes in sampling strategies (frequency, net type, and level of identification) indicated that the replacement of the smaller net with a WP2 net did not significantly impact the estimates of the total zooplankton abundance.
Samples are preserved in formalin solution (0.9 % final concentration). They are filtered through a 200 µm mesh at the laboratory, and subsamples are obtained using a Motoda box and identified under a binocular microscope in a Dolfus tank. Identification stops when 100 individuals are counted. The number of individuals counted is then extrapolated to the total sample volume (ind m−3). Zooplankton identification is standardized using the WoRMS (2024) database, achieving species-level identification in many cases (Table 2). However, as for phytoplankton, when identification is challenging or uncertain, a lower taxonomic level is retained. To prevent misinterpretation of scientific names, the AlphaID, which comes from the WoRMS reference website, is also provided. Species richness calculations with the Shannon–Wiener index (Eq. 1) are based on all taxonomic levels (not only species).
Table 2Number and occurrence of the different taxonomic ranks (highest level of taxonomic identification) encountered in zooplankton identification.
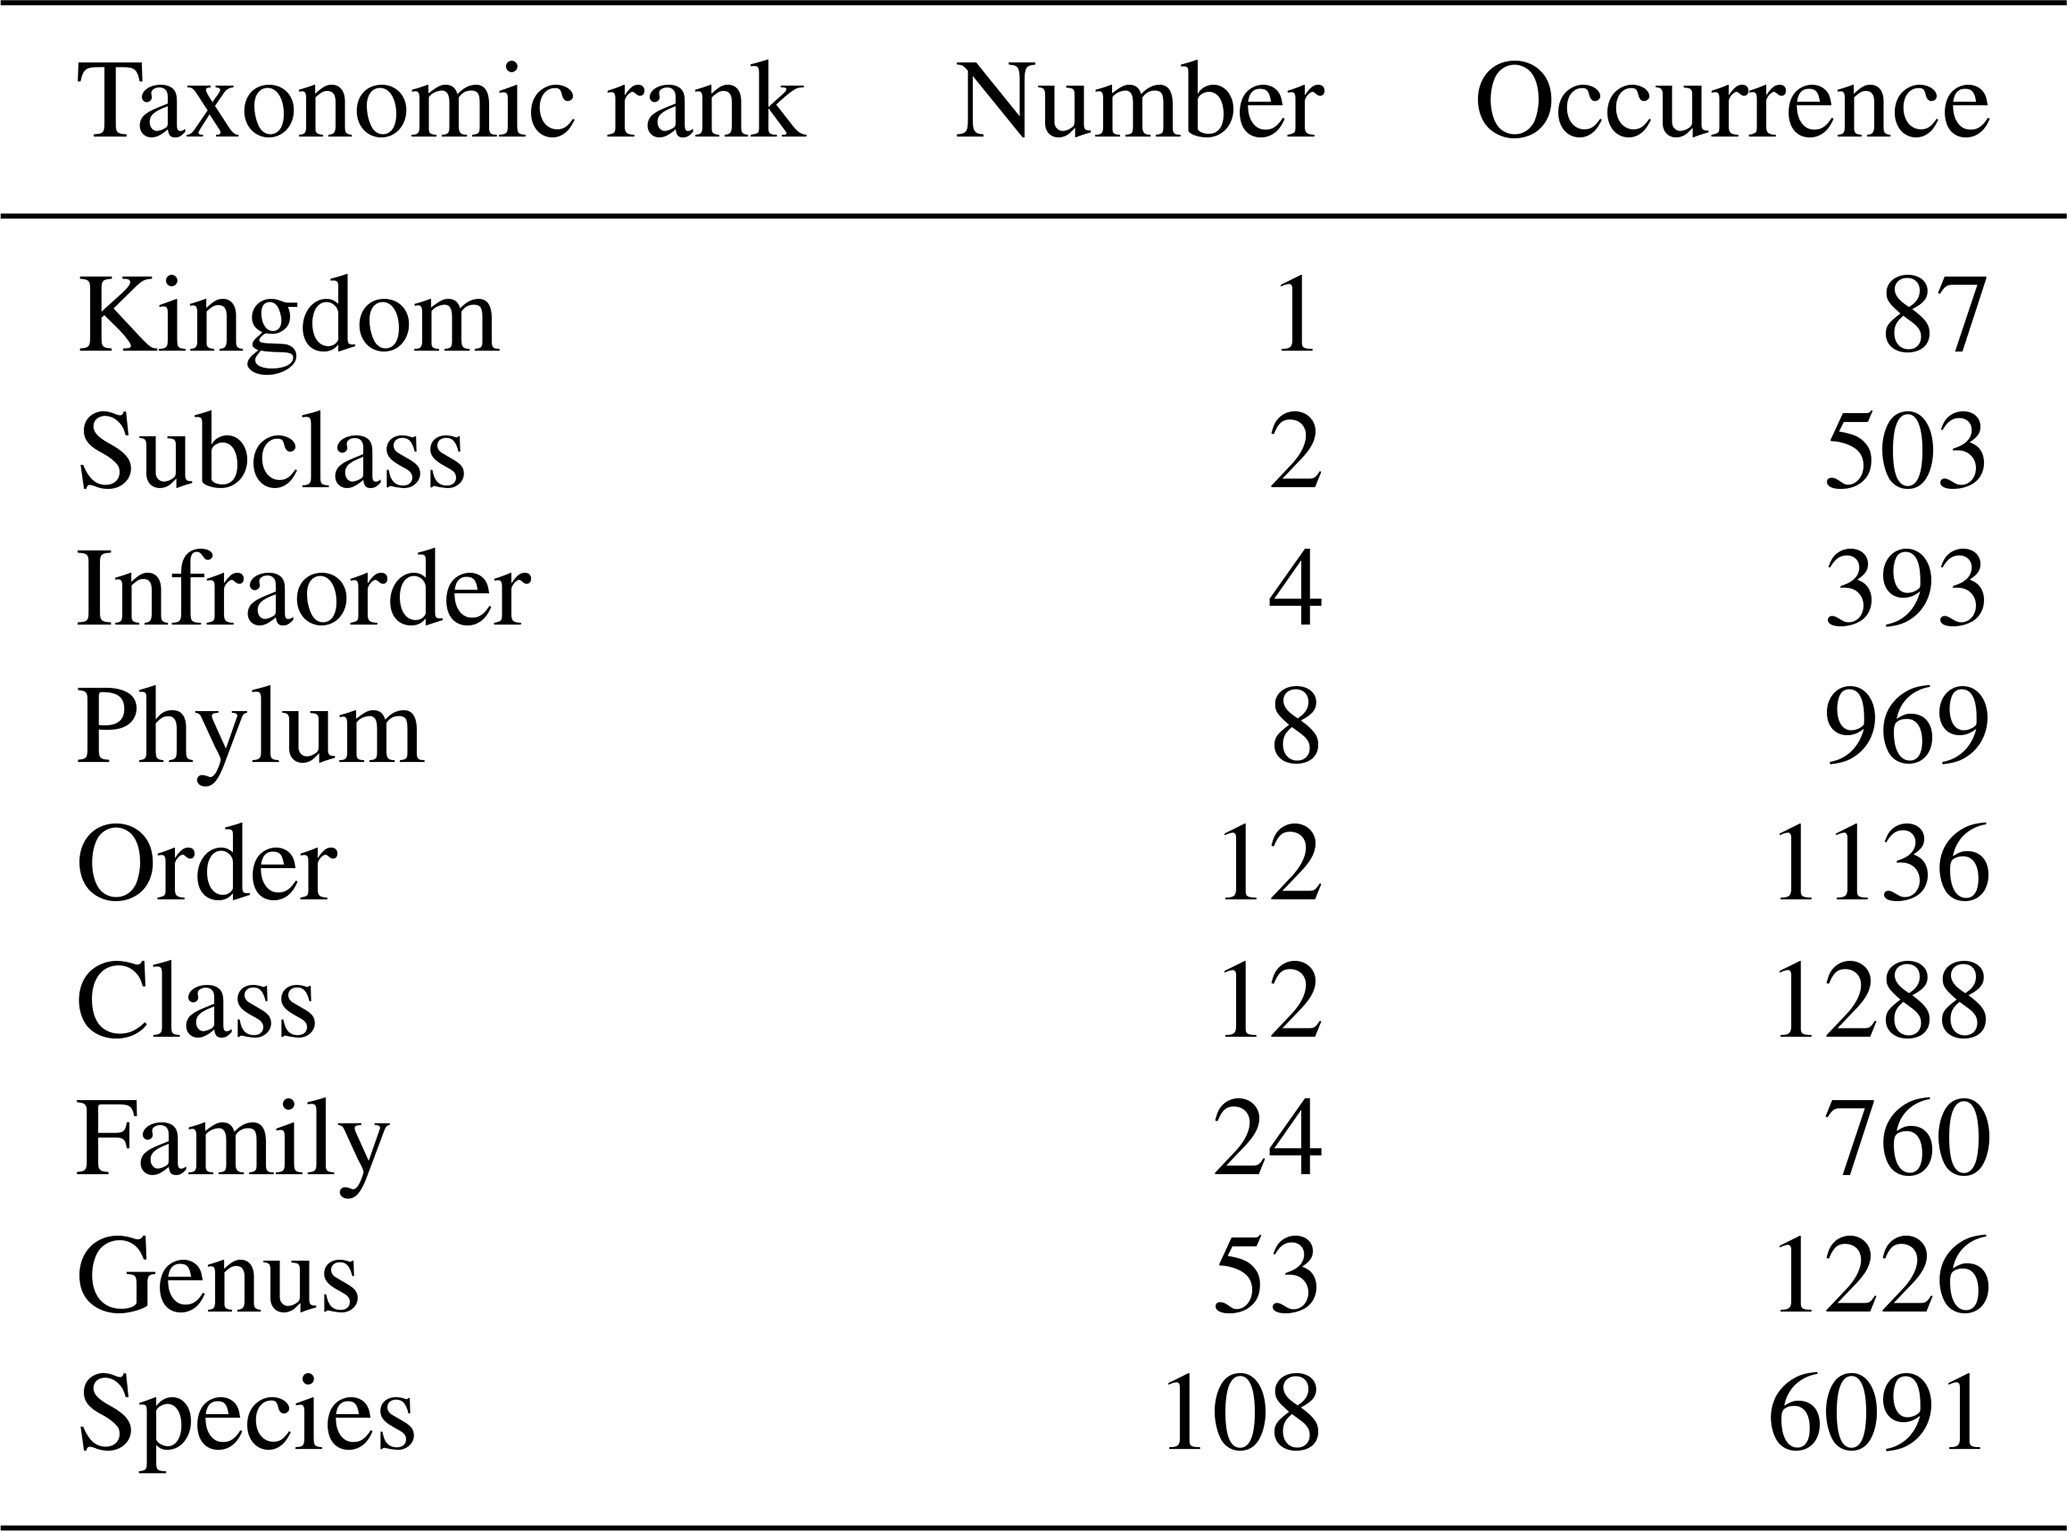
During the 1978–2023 period, 585 zooplankton samples were collected, representing 224 taxa across different taxonomic ranks that are mostly species and genus and providing a high taxonomic accuracy. The most abundant species identified is the calanoid copepod Temora longicornis. Copepods are globally the most abundant zooplankton taxa (Acartia clausi, Euterpina acutifrons, Centropages hamatus, Pseudocalanus elongatus, and Paracalanus parvus). Additionally, the appendicular Oikopleura dioica is frequently observed. However, this relative dominance varies between seasons and years. Zooplankton diversity is identified as a Biology and Ecosystems EOV by the GOOS.
Table 3Statistical summary (minimum, first and third quantiles, mean, median, maximum, and length of the data series) of the main zooplankton and phytoplankton taxonomic groups and physicochemical variables collected within the IGA monitoring program (1978–2023) at the Canal d'amenée station. The “Trend” column indicates whether there is an increasing (orange arrow) monotonic trend, a decreasing (green arrow) monotonic trend, or no significant trend (“na”). The “Trend %unit yr−1” column provides a quantification of significant trends (as a percentage change per year using the Theil–Sen slope method).
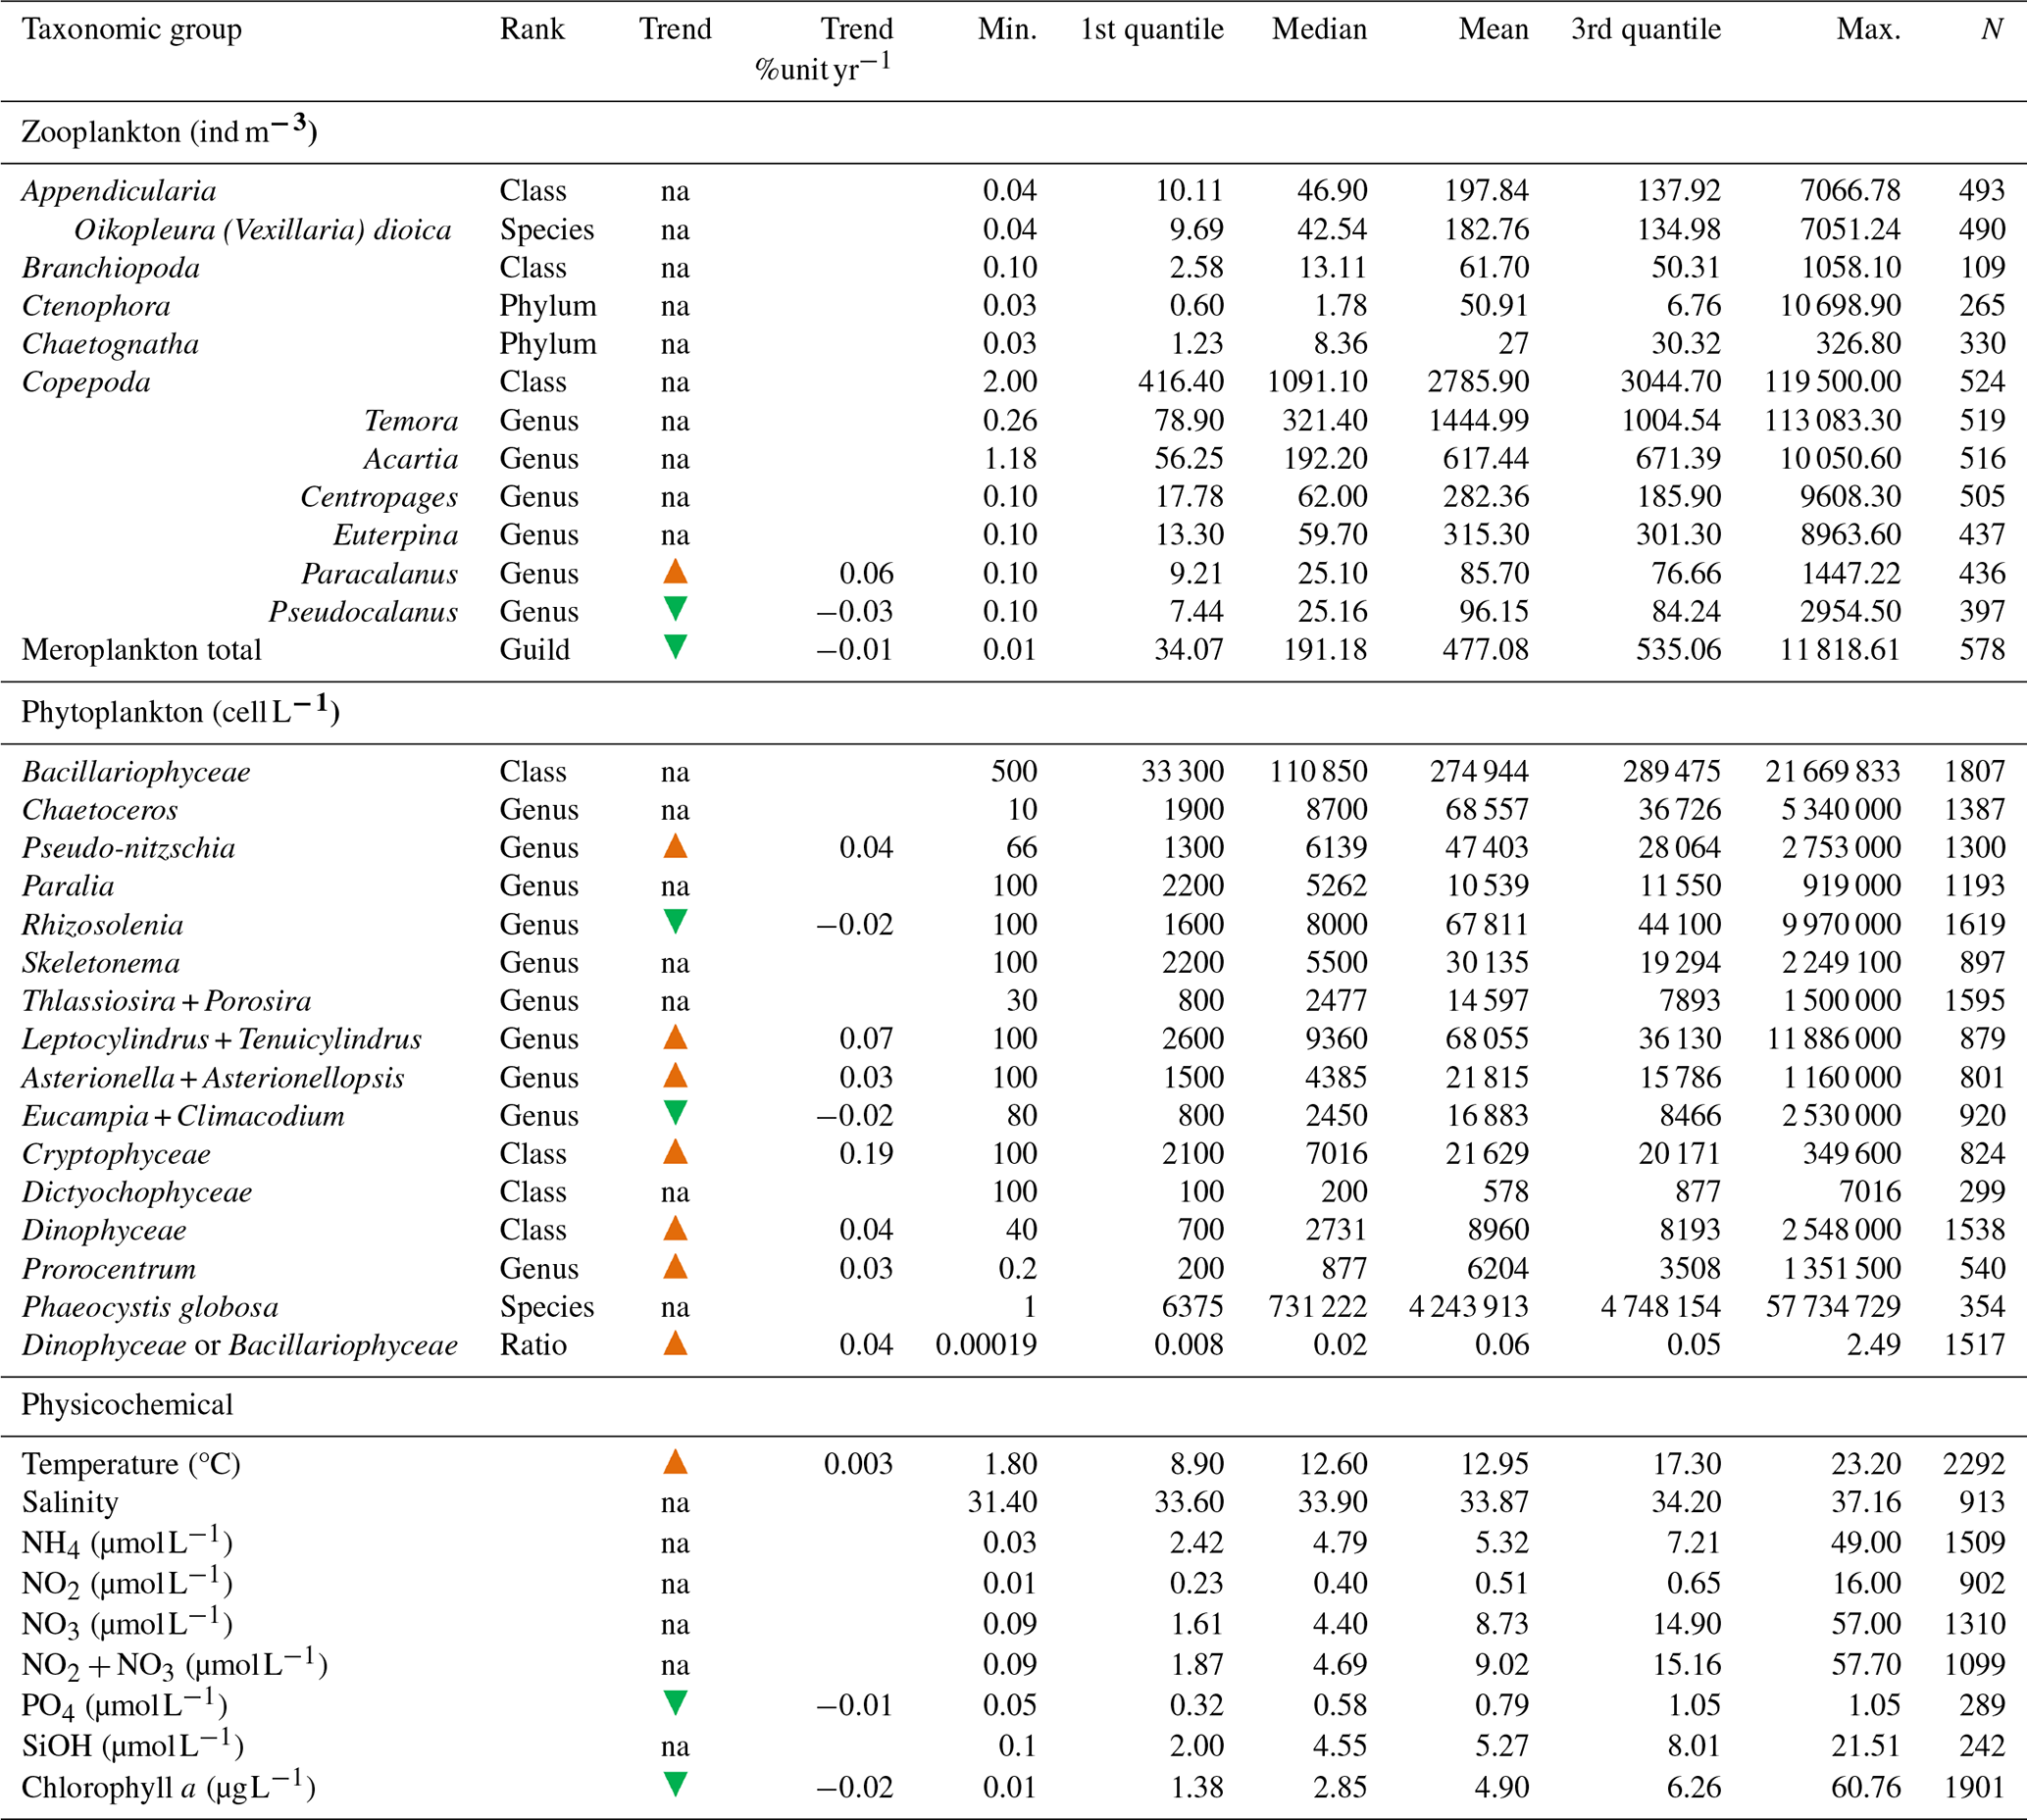
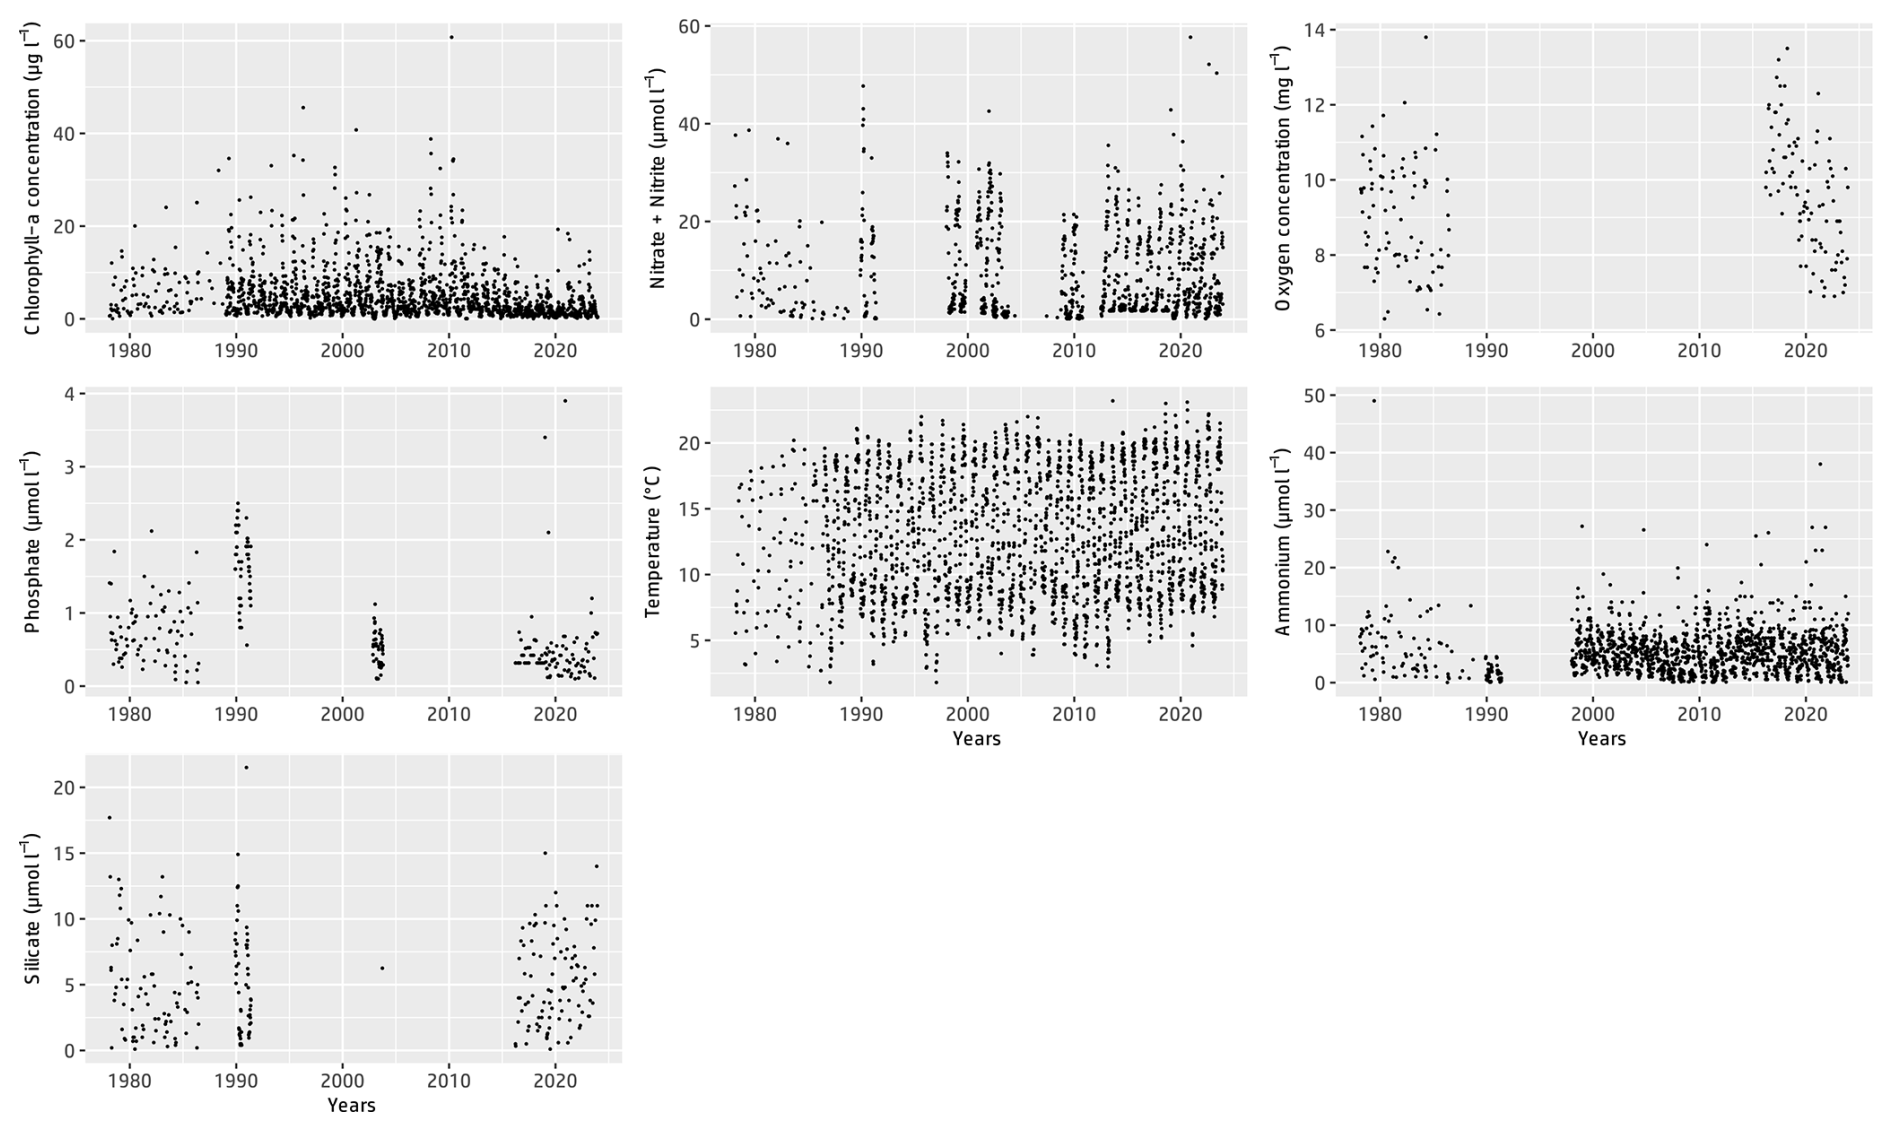
Figure 2Time series of the different physicochemical parameters and chlorophyll-a concentrations measured from 1978 to 2023 as part of the IGA Gravelines monitoring program at the Canal d'amenée sampling station.
3.4 Other parameters
The IGA survey monitor adds parameters, but these were only measured sporadically over a few years, depending on the monitoring strategy. These parameters, including pheopigments, zooplankton biomass, pH, suspended organic matter, nitrogen, and carbon organic concentrations in zooplankton, are scattered across the survey period and have therefore not been included in this article.
To efficiently manage coastal monitoring data, IFREMER has developed the Quadrige2 information system (https://envlit.ifremer.fr/Quadrige-la-base-de-donnees, last access: 12 April 2023), which combines a database with various products and services. Quadrige2 plays a crucial role in two key areas: (1) securely and optimally storing basic monitoring data, including analysis results from all the monitoring networks, in a supervised and scalable manner; and (2) interpreting and enhancing the value of these data. Once the data are stored with an assigned quality level, they become available for a wide range of applications. As a result, this system is the required link for monitoring data between data collection in the field and their availability in multiple formats. Quadrige2 has been approved as the national reference information system for coastal waters by the French Ministry of the Environment and is part of broader national data portals dedicated to ocean data such as ODATIS Pole, which is part of the research e-infrastructure Data Terra (https://www.data-terra.org/, last access: 12 June 2024).
The datasets presented in this article are derived from extractions from the Quadrige2 database. The raw extraction, which includes all the parameters (hydrological, phytoplankton, and zooplankton), is available from SEANOE. The data are provided as a semicolon-delimited .csv file, but they contain non-ASCII characters and a few errors that have accumulated over time. Consequently, a data preprocessing phase was applied to the extraction, including checks for duplicates, outliers, the accuracy of the identified taxa, and the verification and harmonization of the measurement units. This ensured that the dataset was clean and reliable for further analysis.
Some cells in these databases are empty, particularly in the “Hours” column, where the sampling time was not consistently recorded by operators. Additionally, the metadata for the “NO3+NO2” parameter are only filled when the values result from direct sample analyses, not from the addition of NO2 and NO3 results, which was done for database harmonization. Consequently, the final quality-controlled database is divided into three separate semicolon-delimited .csv files, all encoded in UTF-8 with ASCII characters and using a dot as the decimal separator. The first file, containing hydrochemical parameters and chlorophyll-a concentrations, has 19 columns and 12 635 rows. The second file, which holds phytoplankton abundance data, has 20 columns and 37 418 rows. The third file, dedicated to zooplankton abundance data, has 21 columns and 12 453 rows.
The database header columns are in French, as Quadrige2 is a French national database. A French–English translation of these headers is provided in the Supplement, and a detailed description can be found in IFREMER (2017). Physicochemical, phytoplankton, and zooplankton data are available for the 1978–2023 period, because the database was up to date until 2023 at the time of writing. The datasets will be updated annually in SEANOE, maintaining the same DOI to ensure continuity and accessibility.
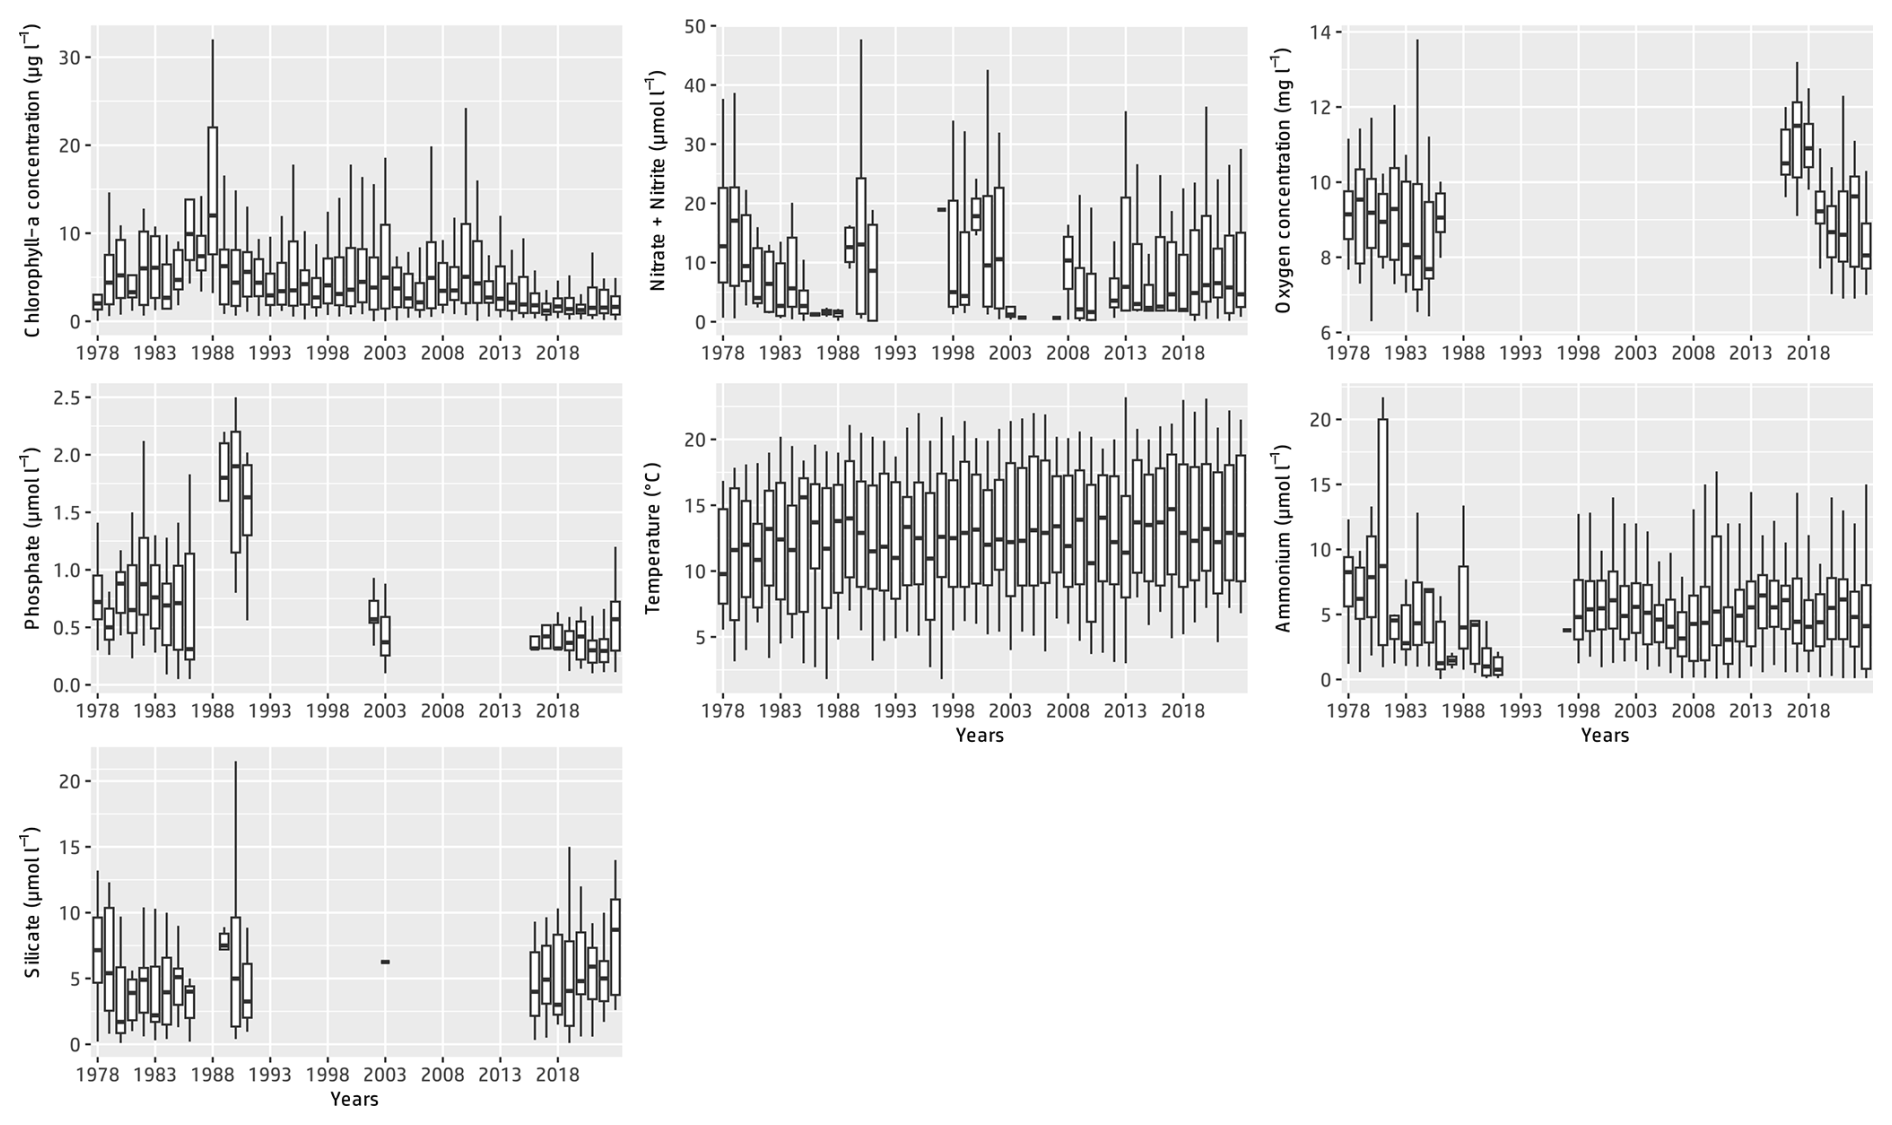
Figure 3Annual box–whisker plots of the main physicochemical parameters at the Canal d'amenée sampling station as part of the IGA Gravelines monitoring program over the period 1978–2023. For improved data visualization, outliers are not represented.
5.1 Data validation
The data are collected in the field and/or laboratory and subsequently entered into the Quadrige2 database via a dedicated user interface. Data control involves verifying and potentially modifying the entered data (including both results and metadata) in order to ensure consistency with the original bench book (or field sheets). After this verification and any necessary corrections, the data follow this validation process:
-
Data validity – this ensures the accuracy and reliability of the data corresponding to the analytical results.
-
Data locking – this secures the data, preventing further modifications, even by the original data entry person.
-
Data distribution – once verified, the data become accessible for extraction and dissemination by all authorized Quadrige2 users.
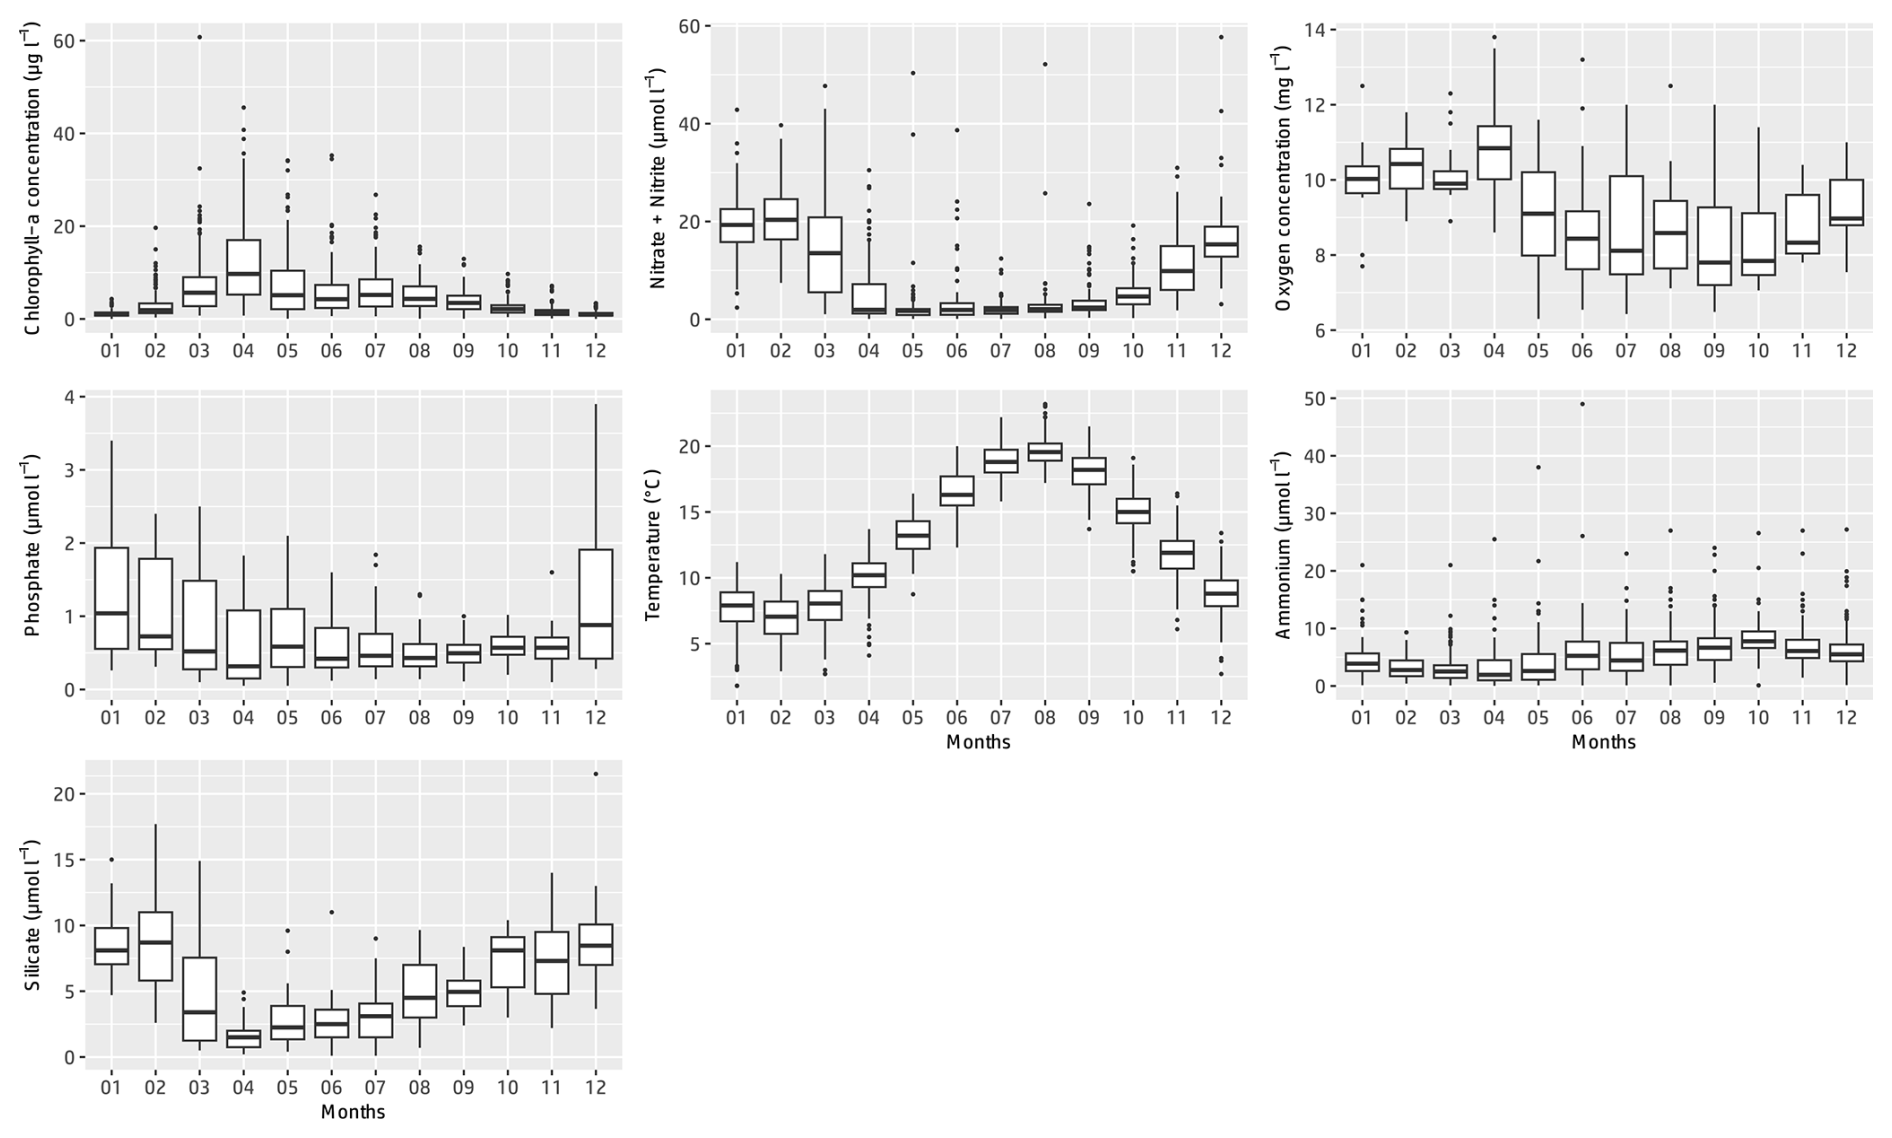
Figure 4Monthly box–whisker plots of the main physicochemical parameters at the Canal d'amenée sampling station as part of the IGA Gravelines monitoring program over the period 1978–2023.
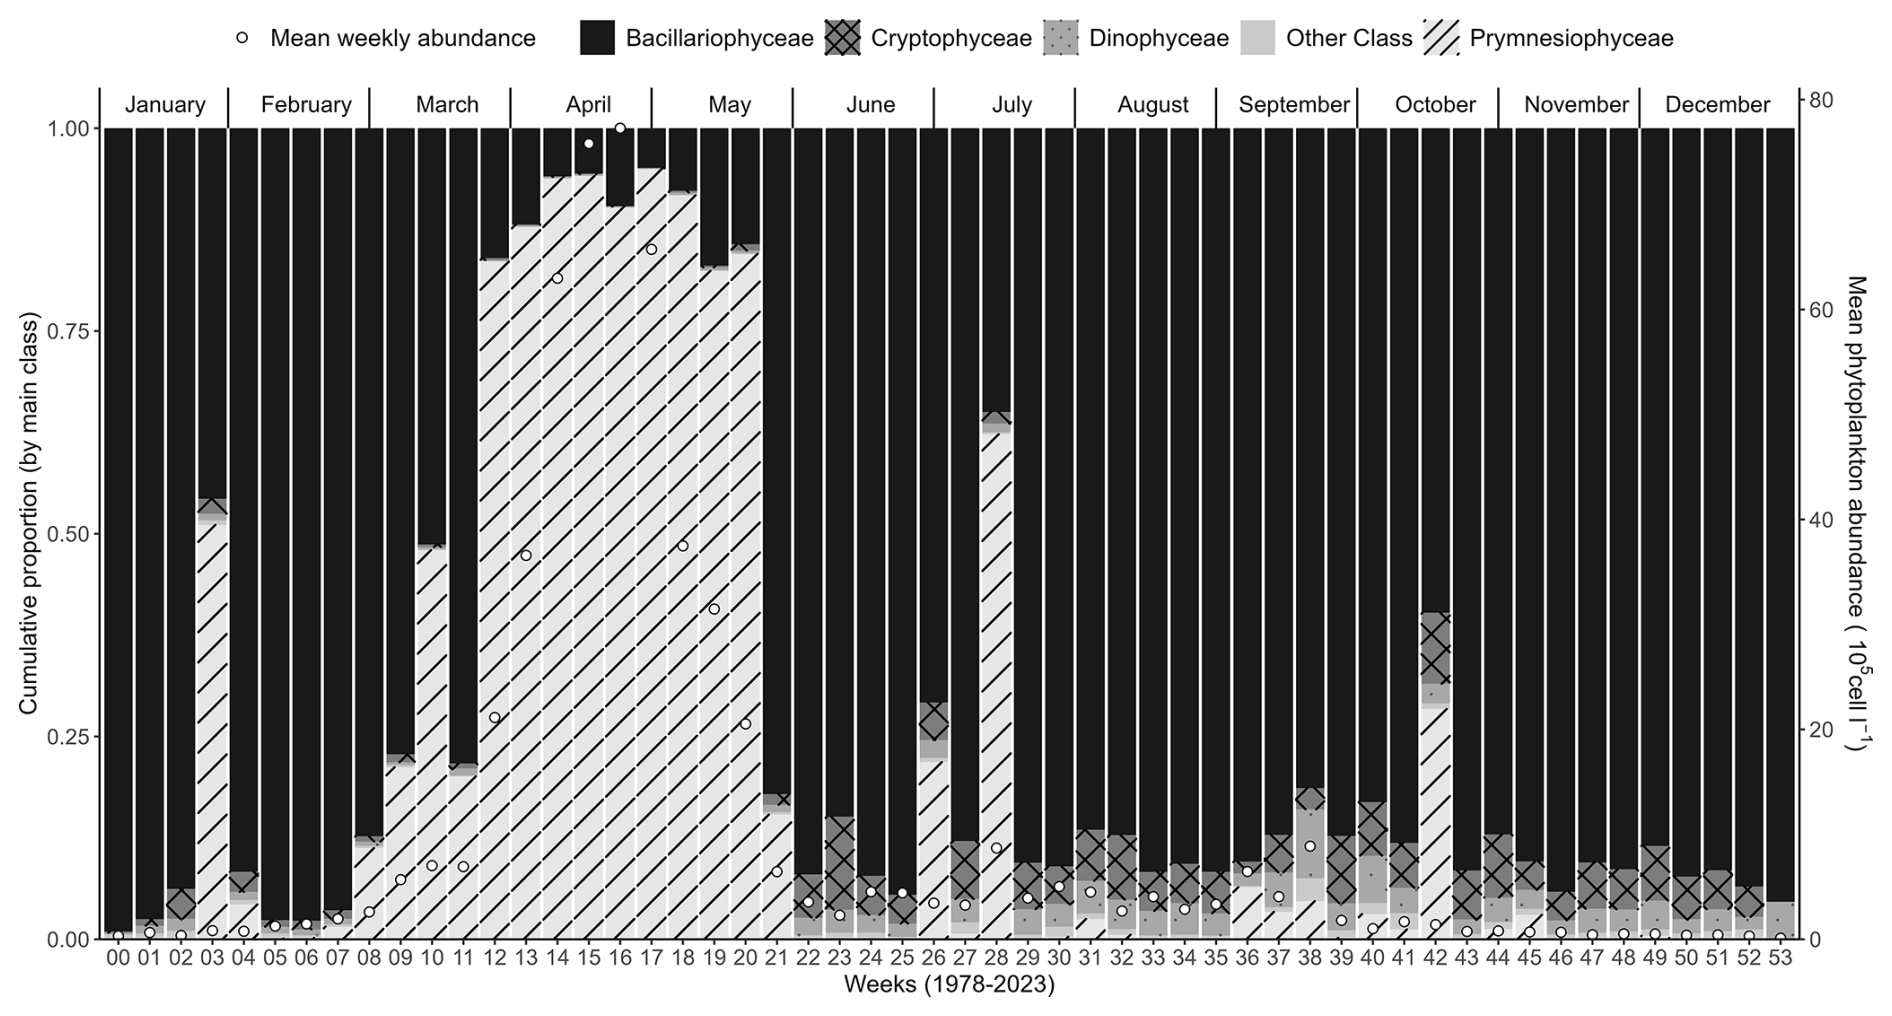
Figure 5Weekly average variability (1978–2023) of the major phytoplankton groups (Prymnesiophyceae, mainly Phaeocystis globosa, Bacillariophyceae, Dinophyceae, Cryptophyceae, and other phytoplankton) at the Canal d'amenée sampling station, as part of the IGA Gravelines monitoring program. The vertical bars illustrate the relative abundances of these groups (%), while the black circles indicate the mean weekly total phytoplankton abundance (105 cells L−1).
5.2 Data qualification
Following the initial round of data verification, the data undergo a qualification procedure that involves the following:
-
Search for data that may be scientifically suspicious or clearly erroneous or aberrant.
-
Correct data where possible, making adjustments to correct any identified issues.
-
Assign a qualification level as follows.
-
Good: the data are scientifically valid and relevant.
-
Doubtful: the data may be inaccurate, and taking them into account may bias the results.
-
False: the data are considered erroneous or problematic and should not be included in the analysis.
-
The level of qualification reflects the level of confidence in the data. It determines the way in which the data are distributed (only data qualified as “good” and “doubtful” are widely distributed) and how they are used in specific data processing. This is determined through a two-step qualification process:
-
“automatic” qualification, which involves identifying obvious and easily detectable errors in the data; and
-
“expert” qualification, which focuses on detecting statistically aberrant data using adapted methods (e.g., time series analysis or statistical tests). Only data qualifying as good or doubtful from the previous step are used for this expert qualification.
The R package TTAinterfaceTrendAnalysis was used to efficiently, homogeneously, and rapidly perform these tests and extract the most relevant statistical metrics (Devreker and Lefebvre, 2014). Temporal trend analysis was performed using the seasonal Mann–Kendall nonparametric test, with p values corrected for autocorrelated data. Since this test is suited for monotonic trend analyses, the cumulative sum method was applied to identify shifts within the time series. Moreover, when a significant trend was detected, the Theil–Sen slope estimator was used to quantify the magnitude of the trend.
Table 3 presents the descriptive statistics for each physicochemical and biological parameter at the Canal d'amenée station. At an interannual scale, temperature is the only hydrological parameter showing a significant upward trend between 1978 and 2023, with an average increase of +0.04 °C yr−1, resulting in a total rise of +1.8 °C during the survey period. Among nutrients, only phosphorus shows a significant decreasing trend, with a rate of −0.01 . Chlorophyll-a concentrations also demonstrate a significant decreasing trend with a clear shift in the time series (Figs. 2 and 3 and Table 3). This shift, detected by the Pettitt test, occurs around 2012, with mean chlorophyll-a concentrations decreasing from 5.85 µg L−1 before 2012 to 2.68 µg L−1 afterwards (and from 8 to 3.7 µg L−1 during the growing season from March to September).
At the inter-seasonal scale, nutrient concentrations (nitrate + nitrite, silicate, and phosphorus) are maximal in winter (Fig. 4). These concentrations decrease in February and March, when concentrations in chlorophyll a (Fig. 4) and phytoplankton abundances (Fig. 5) increase. Chlorophyll-a concentrations reach their maximum from March to July, with the highest average value occurring in April (12 µg L−1) and the maximum value reached in March 2010 at >60 µg L−1. Temperature follows a typical pattern for temperate coastal waters, with February being the coldest month (6.9 °C) and August the warmest (19.6 °C) (Fig. 4). Mean oxygen concentrations are highest in winter (∼10 to 11 mg L−1), when photosynthetic activity and temperature are lowest. These levels decrease in spring, reaching 8 to 9 mg L−1 (Fig. 4).
Interannual variability of phytoplankton communities reveals a significant increase in the abundance of some taxonomic classes, including Dinophyceae and Cryptophyceae. The species Phaeocystis globosa does not show any significant trend when some Bacillariophyceae show significant increasing trends. On an annual scale, phytoplankton communities are typically dominated by either P. globosa or Bacillariophyceae, alternating between the two (with Bacillariophyceae dominance observed in 1993–1997, 2002–2005, and 2013) (Fig. 6). Mean annual abundances tend to be higher during years when P. globosa is dominant (Fig. 6). The Dinophyceae / Bacillariophyceae abundance ratio (an indicator of eutrophication status; Wasmund et al., 2017; Xiao et al., 2018) shows a significant increasing trend, suggesting that Dinophyceae abundances are increasing more rapidly than Bacillariophyceae abundances (Table 3).
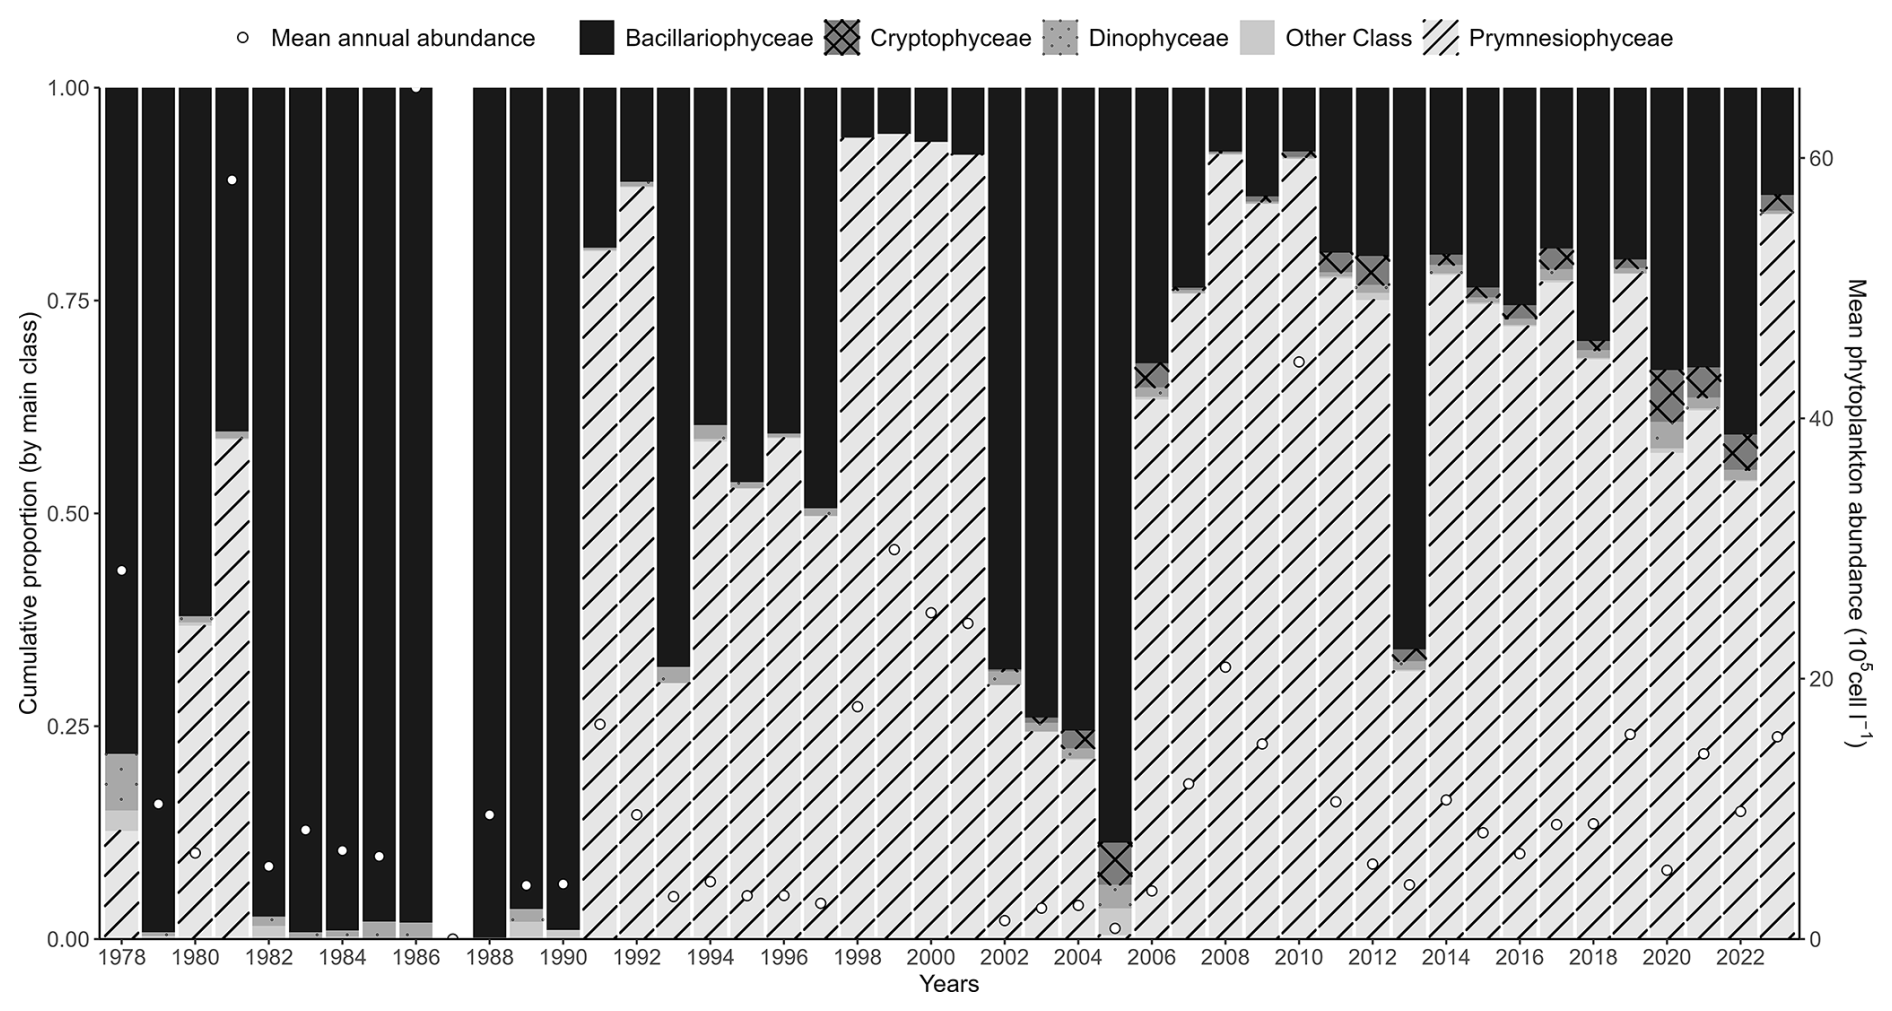
Figure 6Interannual variability of the major phytoplankton groups (Prymnesiophyceae, mainly Phaeocystis globosa, Bacillariophyceae, Dinophyceae, Cryptophyceae, and other phytoplankton) at the Canal d'amenée sampling station, as part of the IGA Gravelines monitoring program. The vertical bars represent the relative abundances of these groups (%), while the black circles indicate the mean annual total phytoplankton abundance (105 cells L−1).
Phytoplankton communities also show a clear seasonal pattern. Abundances are low in early winter and begin to increase with Bacillariophyceae starting in February. From March to May, Phaeocystis globosa is dominant, constituting over 90 % of the total phytoplankton abundance, while Bacillariophyceae remain dominant for the rest of the year. Phaeocystis globosa bloom corresponds to the peak period of phytoplankton abundance and the lowest specific richness (Fig. 7). During the average P. globosa bloom, Bacillariophyceae species such as Chaetoceros or Asterionellopsis are present at the beginning, followed later by Guinardia and Pseudo-nitzschia.
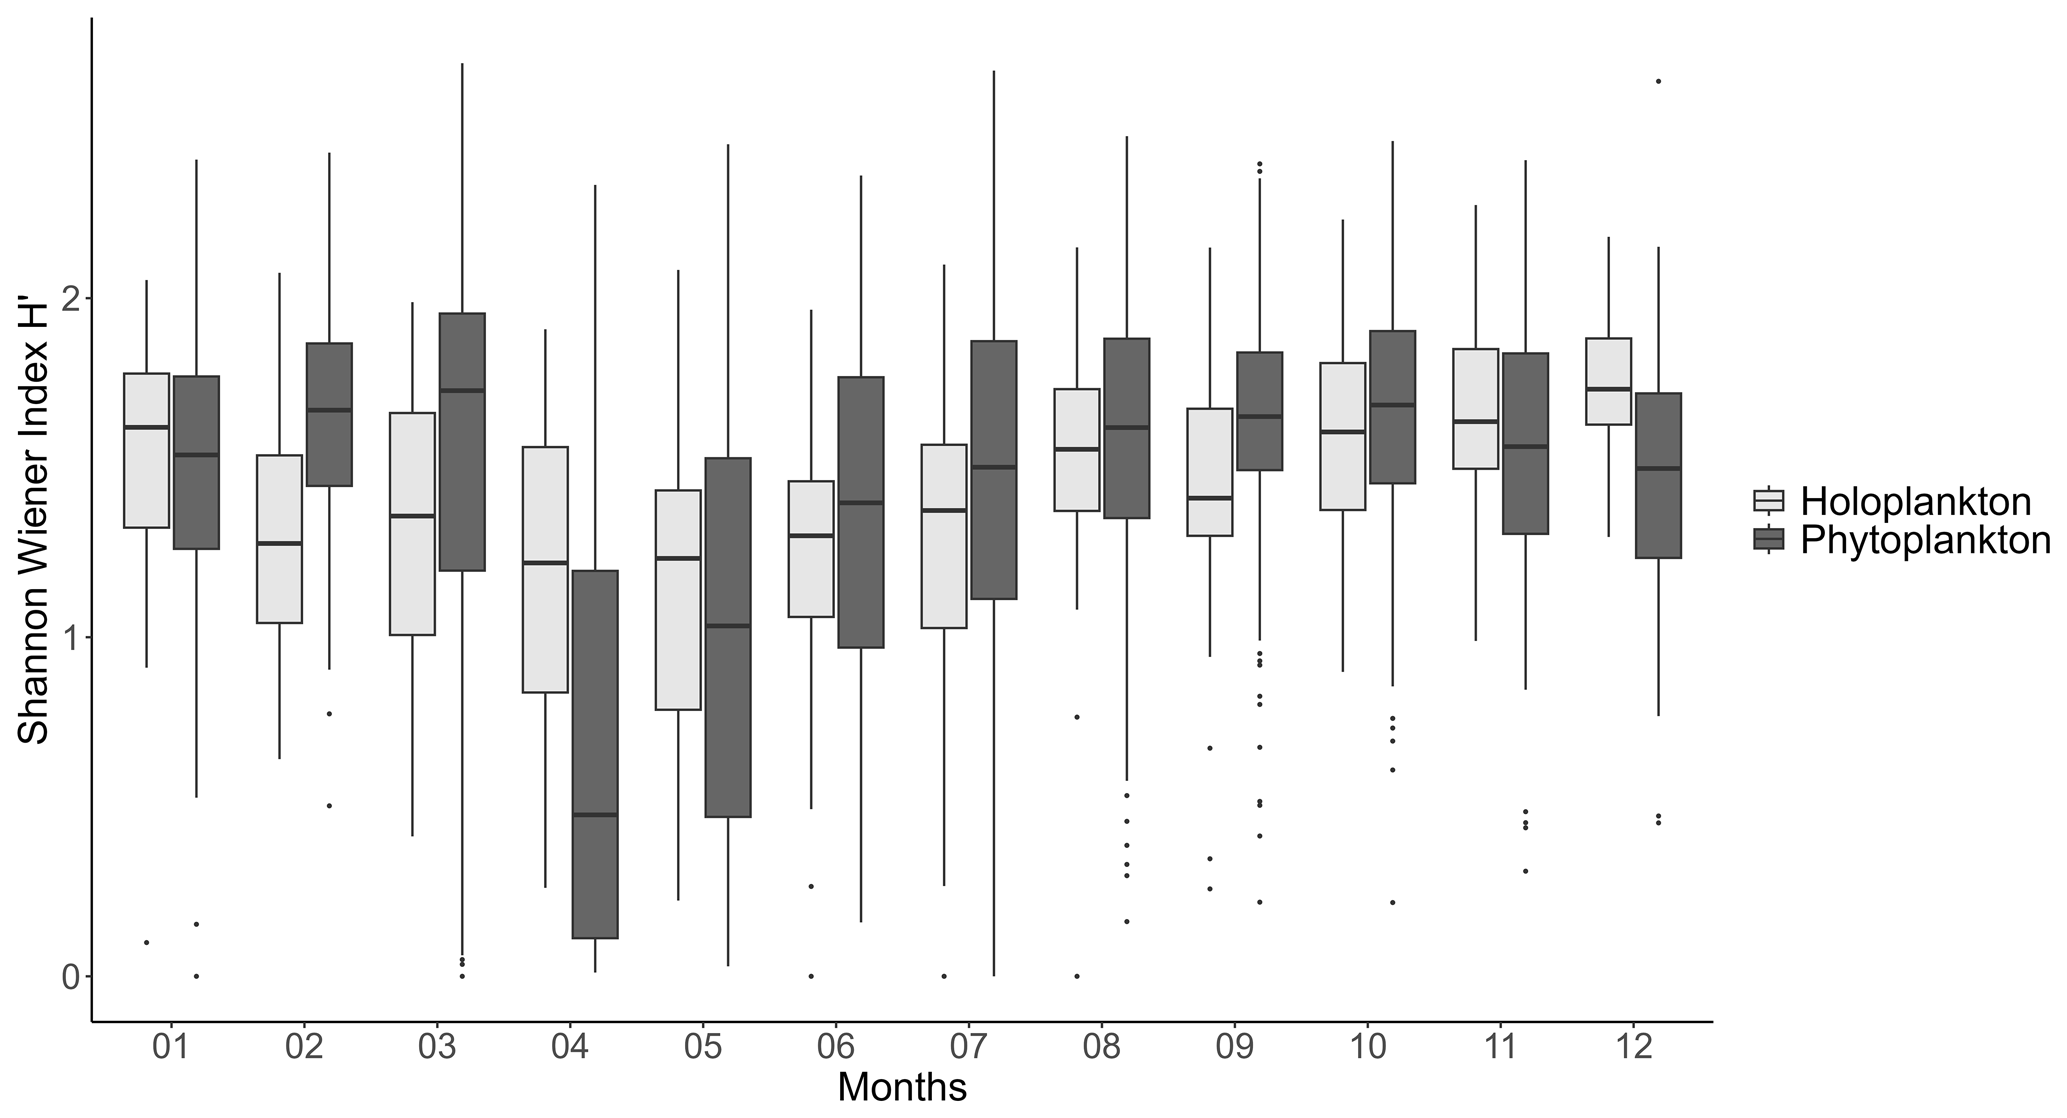
Figure 7Mean seasonal variation (monthly scale, 1978–2023) of the Shannon–Wiener diversity index for both phytoplankton and holo(zoo)plankton at the Canal d'amenée sampling station, as part of the IGA Gravelines monitoring program.
Concerning zooplankton communities, the mean seasonal variability shows dominance of meroplankton in February, while copepods are clearly dominant during the rest of the year (Fig. 8). Zooplankton mean monthly abundance shows a peak value in May of 7200 ind m−3 when the copepod Temora longicornis is the dominant species (Fig. 8), which corresponds to a slight decrease in zooplankton-specific richness (Fig. 7). Copepod succession shows large dominance of calanoids (T. longicornis, Acartia clausii, Centropages, Paracalanus, and Pseudocalanus) from January to July, and harpacticoid relative abundance increases in August to represent 50 % of the zooplankton community in September (Fig. 9).
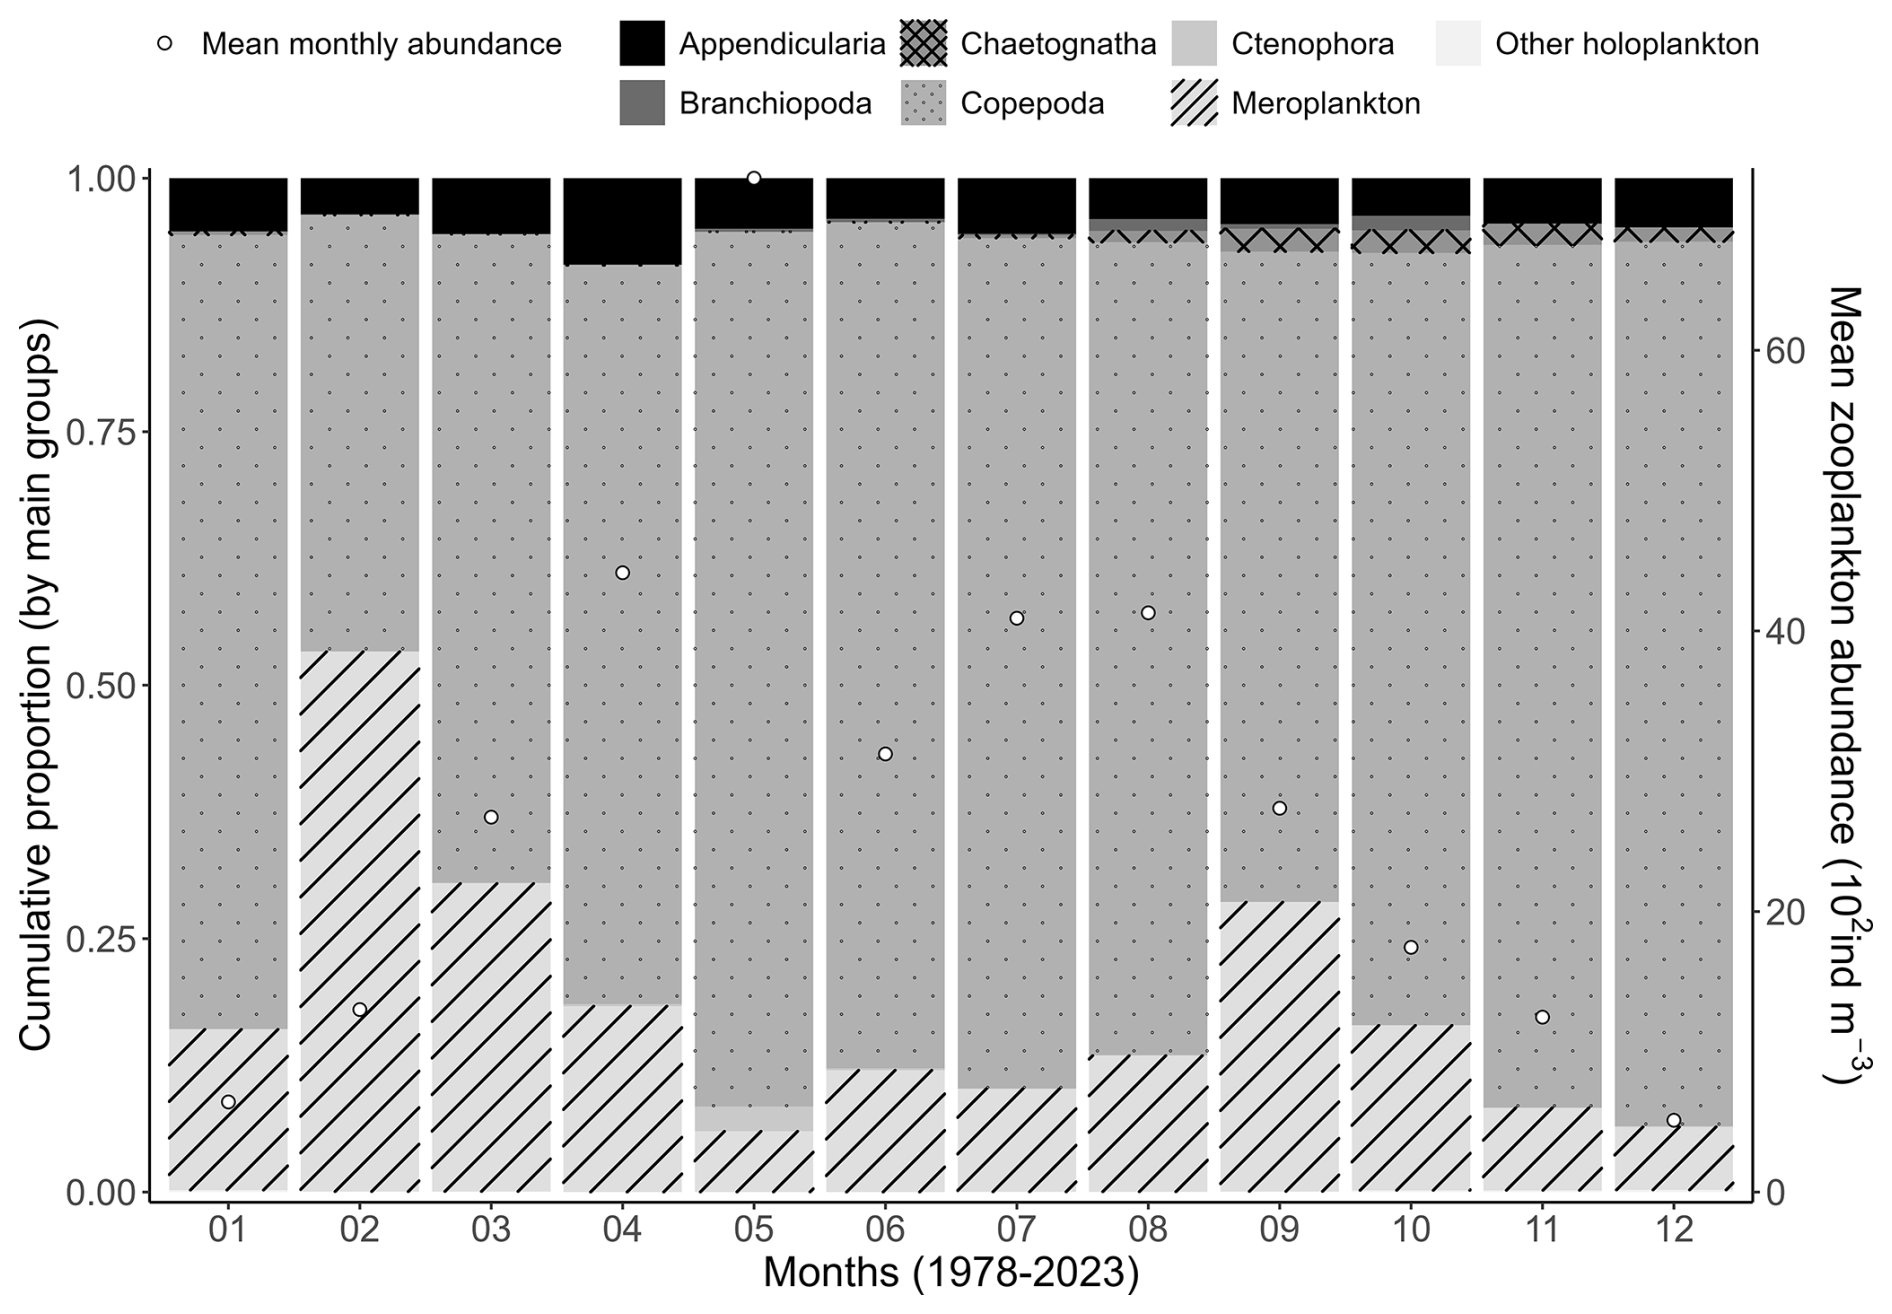
Figure 8Mean seasonal variability (1978–2023) of the major zooplankton groups (Appendicularia, Branchiopoda, Copepoda, Chaetognatha, Ctenophora, meroplankton, and other holoplankton) at the Canal d'amenée sampling station of the IGA Gravelines monitoring program. The vertical bars indicate the relative abundances of these groups (%), while the black circles represent the mean monthly total abundance (102 ind m−3).
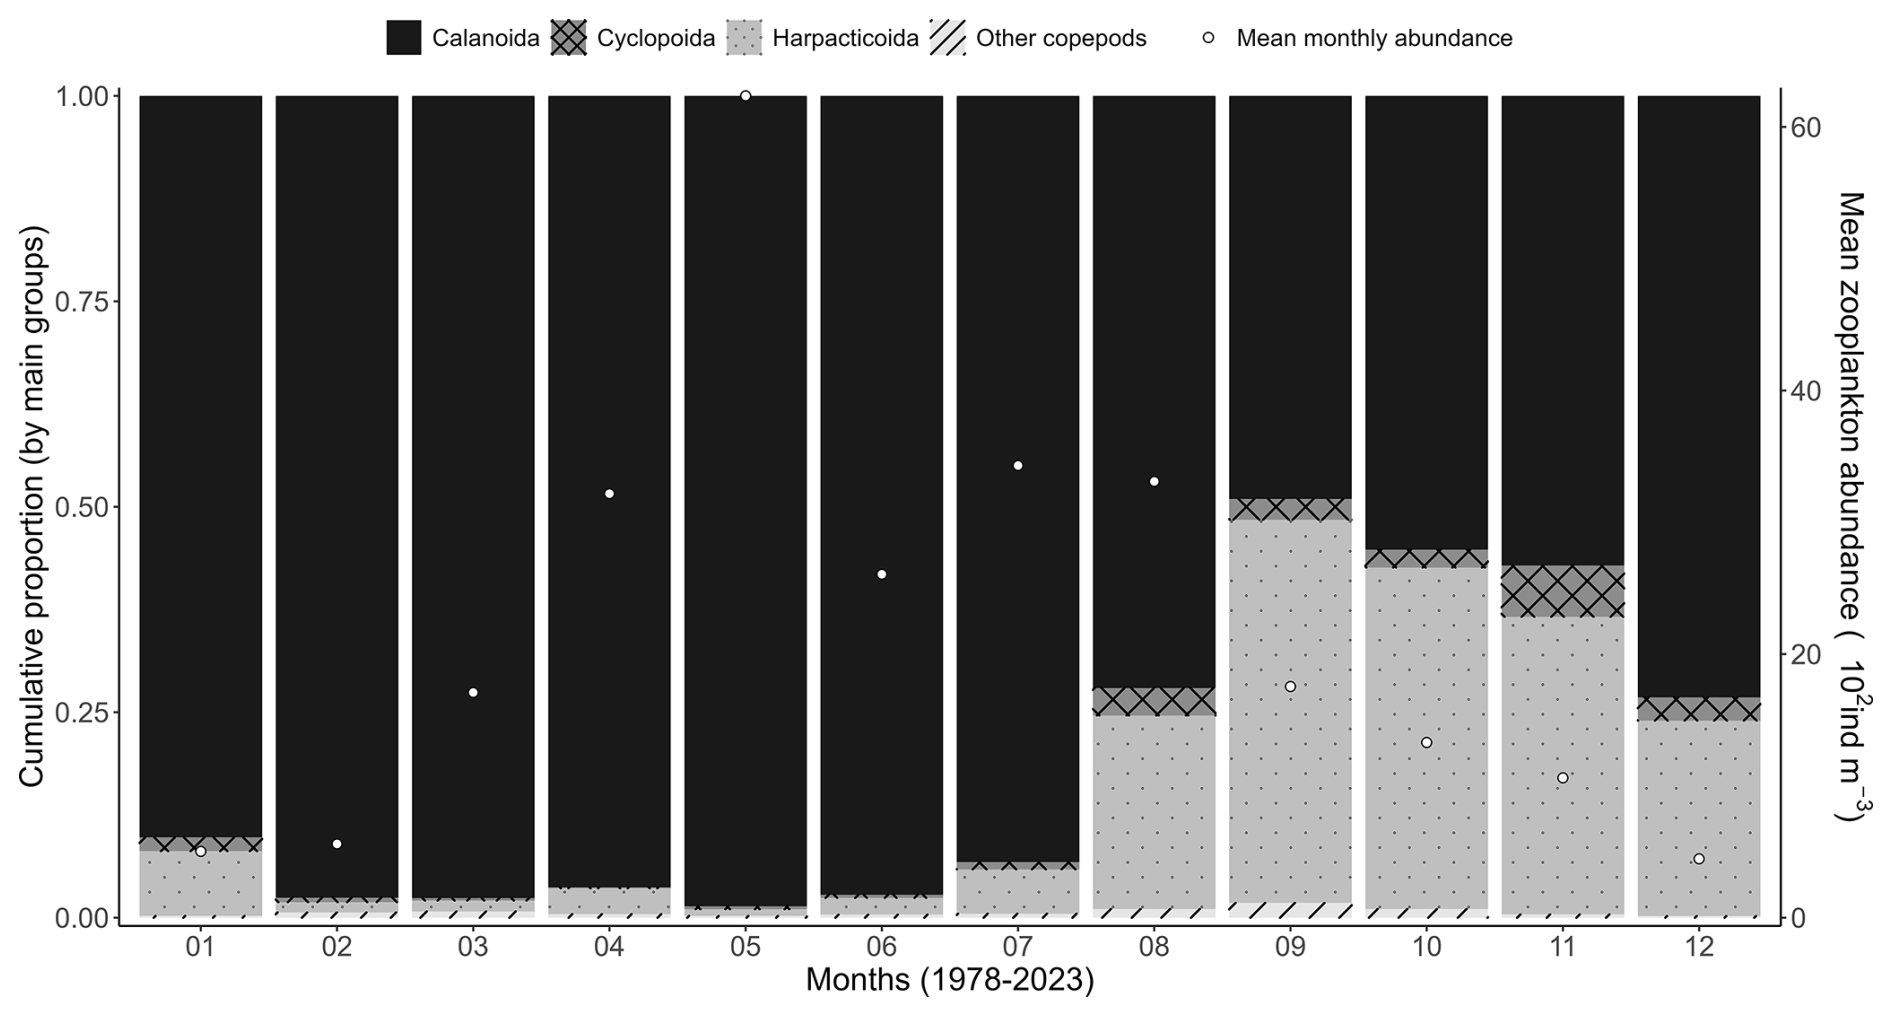
Figure 9Mean monthly variability (1978–2023) of copepod orders (Calanoida, Cyclopoida, and Harpacticoida) at the Canal d'amenée sampling station of the IGA Gravelines monitoring program. The vertical bars illustrate the relative abundances of these groups (%), while the black circles show the mean monthly total abundance (102 ind m−3).
There is no clear interannual trend in overall zooplankton community abundance (Table 3). However, meroplankton abundance shows a significant decreasing trend over time. Among copepods, Paracalanus shows a significant increasing trend, while Pseudocalanus shows a significant decreasing trend. Mean interannual zooplankton abundances demonstrate some variability, with copepod species remaining the dominant group (Fig. 10).
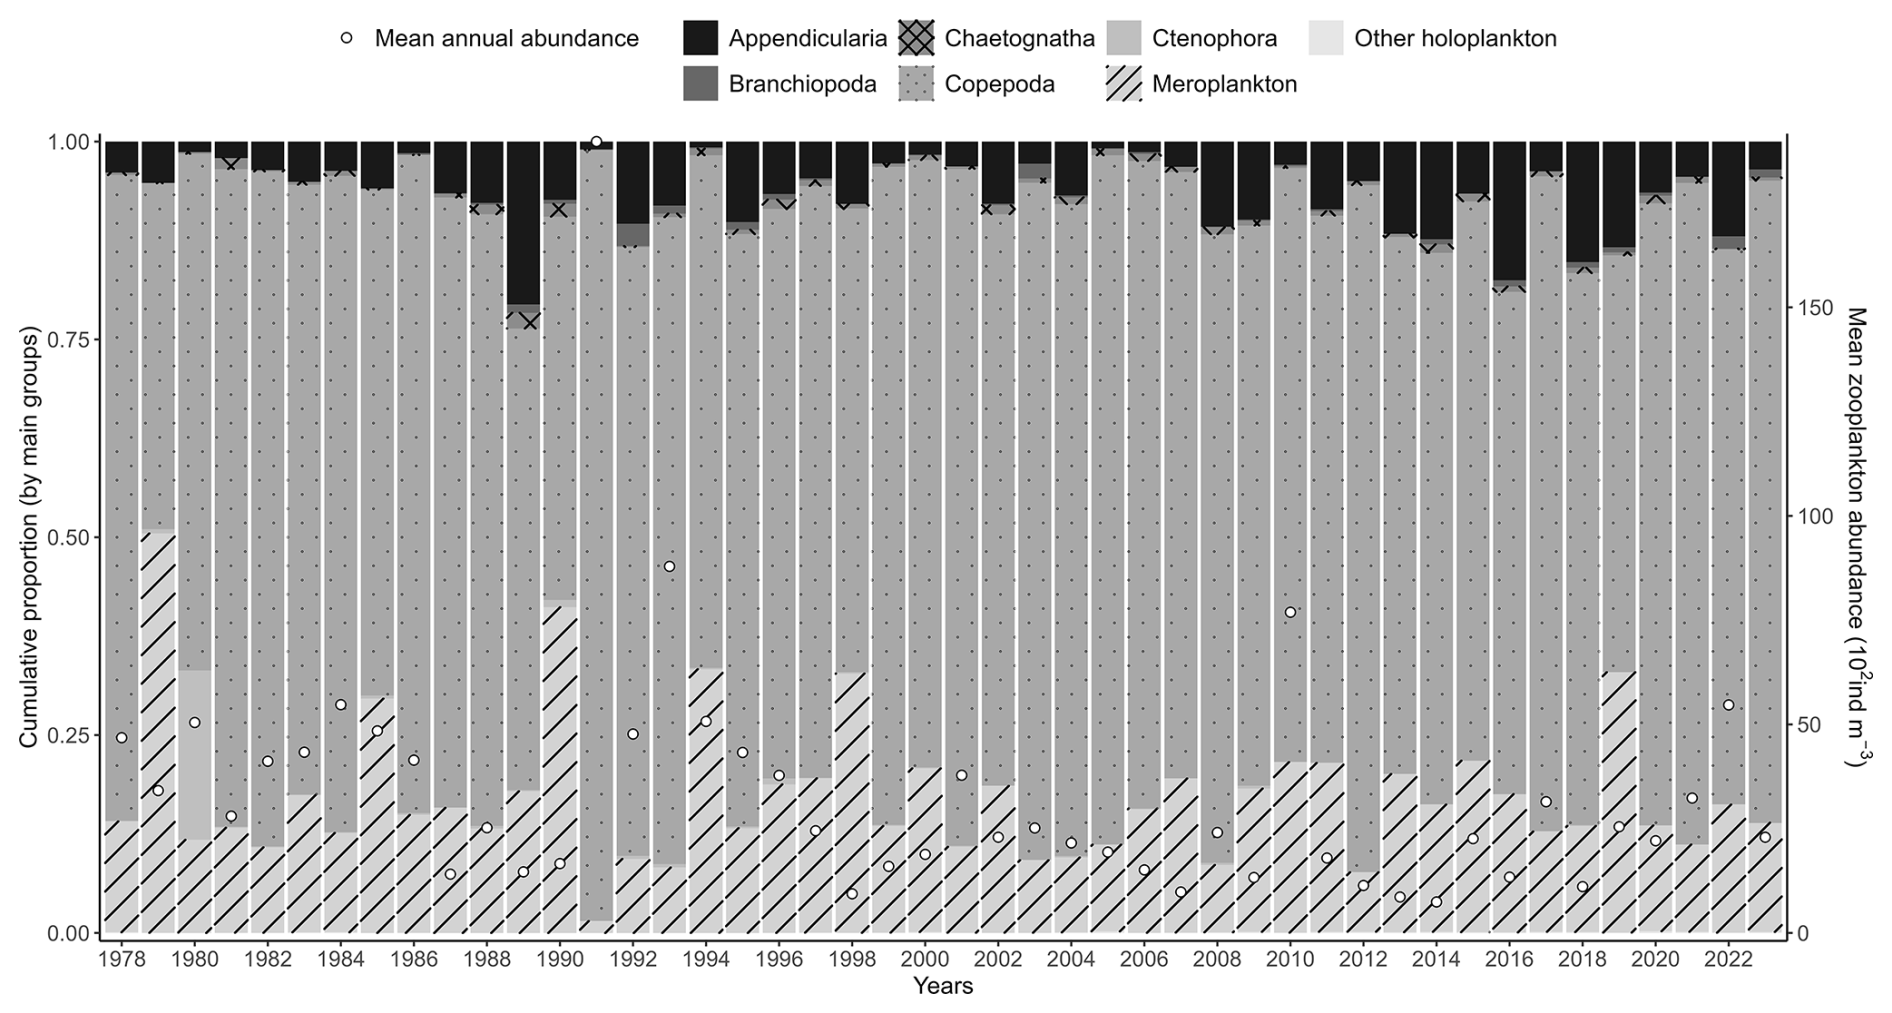
Figure 10Interannual variability of the major zooplankton groups (Appendicularia, Branchiopoda, Copepoda, Chaetognatha, Ctenophora, meroplankton, and other holoplankton) at the Canal d'amenée sampling station of the IGA Gravelines monitoring program. The vertical bars indicate the relative abundances of these groups (%), while the black circles represent the mean annual total abundance (102 ind m−3).
The diversity of both zooplankton and phytoplankton communities follows similar seasonal patterns, with the lowest diversity in April and May during the P. globosa bloom (Fig. 7). However, there is a notable difference in February and March, when phytoplankton diversity increases while zooplankton diversity decreases.
The IGA-HP Gravelines dataset is publicly available at https://doi.org/10.17882/102656 (Lefebvre et al., 2024) (hydrology and plankton monitoring program at the Gravelines coastal station in 2024).
The R package TTAinterfaceTrendAnalysis is available on the CRAN website (Comprehensive R Archive Network – https://cran.r-project.org/package=TTAinterfaceTrendAnalysis/index.html, Devreker and Lefebvre, 2021).
The IGA Gravelines Canal d'amenée data series, which began in 1978, represents the longest physicochemical and planktonic data series in the South Bight of the North Sea. This time series captures the dynamics of phytoplankton, mainly dominated by Bacillariophyceae and Prymnesiophyceae (Phaeocystis globosa) as well as zooplankton species, with a focus on copepods. The dataset reveals temporal successions and multiyear trends in plankton communities, including annual phenology characterized by an initial increase in Bacillariophyceae abundance, followed by the early spring bloom of P. globosa, which coincides with high abundances of the potential harmful alga Pseudo-nitzschia sp.
The Bacillariophyceae and P. globosa bloom is one of the most structuring events in the planktonic community of this region of the eastern English Channel (Schapira et al., 2008; Grattepanche et al., 2011), influencing not only plankton, but also bacteria (Lamy et al., 2006) and benthic communities (Dauvin et al., 2008; Denis and Desroy, 2008; Spilmont et al., 2009). The IGA survey shows that this bloom varies significantly in intensity and relative proportion between years. During this bloom, annual chlorophyll-a concentrations peak, while nutrient levels hardly decrease. This period also sees a significant drop in the annual proportion of copepod species (the most abundant primary consumers in the zooplankton community), showing the impact of this bloom on the entire pelagic ecosystem, as previously described in this region (Lancelot et al., 2005).
The interannual variability in plankton dynamics was concomitant with a significant increasing trend in seawater temperature and a significant decreasing trend in phosphate concentrations. Both of these parameters were already described as drivers of P. globosa blooms (Hernández Fariñas et al., 2015; Karasiewicz et al., 2018). Given the variety of the parameters measured, the frequency of the measurements, and the length of the dataset, this series is exceptionally well suited to studying the dynamics of planktonic communities and the effects of anthropogenic pressures on them.
Indeed, similar long-term data series have proven to be valuable resources for scientific research, leading to a significant number of publications across various topics. For instance, the Point B series from the Laboratoire d'Océanographie de Villefranche (LOV) on the Mediterranean Sea (Romagnan et al., 2015, 2016; Feuilloley et al., 2022), the L4 series from the Plymouth Marine Laboratory in the western English Channel (Harris, 2010; Widdicombe et al., 2010; McEvoy et al., 2023), the SRN series from IFREMER's LER-BL laboratory in the eastern English Channel and North Sea (Lefebvre and Devreker, 2023; Lefebvre et al., 2011), and other extensive pan-European series such as the Continuous Plankton Record survey (Holland et al., 2024) or those reporting to the OSPAR biodiversity working group (Holland et al., 2023) have generated a substantial number of scientific articles addressing a wide range of topics. These include plankton dynamics (Vandromme et al., 2011; John et al., 2001; Lefebvre and Devreker, 2023), climate change (Corona et al., 2024; Kapsenberg et al., 2017; Parravicini et al., 2015), HABs (Karasiewicz et al., 2020; Karasiewicz and Lefebvre, 2022), food webs (Atkinson et al., 2015), and the carbon cycle (González-Benítez et al., 2019). Such extensive, long-term, and multiparameter datasets can also be critical for assessing environmental quality within the frameworks of European directives (such as the Water Framework Directive – WFD – or the Marine Strategy Framework Directive – MSFD) and regional marine policies (such as the OSPAR or Barcelona conventions) (McQuatters-Gollop et al., 2019; Lefebvre and Devreker, 2020).
The IGA Gravelines Canal d'amenée series has been used in various studies, including analyses of long-term temperature fluctuations and their link with the North Atlantic Oscillation (NAO) (Woehrlings et al., 2005). The dataset, covering measurements from 1975 to 1992, has been used to investigate trophic relationships (Le Fevre-Lehoerff et al., 1993) and cycles within the context of climate changes (Le Fevre-Lehoerff et al., 1995), incorporating data on water temperature, salinity, suspended matter, nutrients, chlorophyll a, and zooplankton. Halsband-Lenk and Antajan (2010) showed the utility of this time series for defining regional multi-metric food web indices using temperature, salinity, chlorophyll pigments, and phytoplankton and zooplankton abundance data. The series has also been identified as one of interest by the ICES WGZE (Working Group on Zooplankton Ecology) and has been integrated into NOAA's METABASE (https://www.st.nmfs.noaa.gov/copepod/time-series/fr-30101/, last access: 20 September 2024). Despite the highest scientific value of this dataset, the number of publications focused on plankton and hydrology remains relatively limited compared to other datasets, such as L4 and Point B (Google Scholar results for “plankton” and the station name since 2020: 128 for L4 and 69 for Point B). Publications related to benthic fauna from the IGA Gravelines survey are more numerous.
Moreover, studying plankton dynamics using such data series can provide critical insights into preventing cooling problems at nuclear power plants. High biomass blooms can obstruct cooling systems by either physically blocking the flow or altering water viscosity, leading to reduced efficiency and potential operational issues. Such events have been documented in the literature, including cases involving gelatinous species at Gravelines (Antajan et al., 2014) and HABs globally (Wang et al., 2022). At the GNPP, in addition to issues caused by gelatinous blooms, particularly from Pleurobrachia pileus, blooms of Phaeocystis globosa can also affect cooling systems. Consequently, it is crucial to understand the drivers of P. globosa blooms, including the parameters that influence their intensity and timing. Developing early warning systems to anticipate such blooms and implementing preventive or mitigative measures is thus essential for maintaining operational efficiency and avoiding disruptions.
The data acquired through the IGA program follow findability, accessibility, interoperability, and reusability (FAIR) principles, which define a set of rules to facilitate FAIR principles of data and the associated metadata. This dataset from Gravelines is particularly well suited to collaborative annotation work, which could enhance forecasting capabilities. This process involves identifying and labeling recurring, rare, and extreme events in the time series by experts. Recent advancements in machine learning have introduced several tools to assist with pattern recognition and automatic segmentation of time series data. Techniques include fixed-length window segmentation (Van Hoan et al., 2017), sliding window approaches using autoencoders (Längkvist et al., 2014), expectation–maximization models (Poisson-Caillault and Lefebvre, 2017), hidden Markov models (Dias et al., 2015; Rousseeuw et al., 2015), and multilevel spectral clustering (Grassi et al., 2020). These methods can be used to isolate patterns in the time series, which can then be annotated with relevant event labels based on the expertise of the annotators.
This labeled database could be used as a reference training set by the scientific community, addressing specific needs in artificial intelligence. It would be particularly valuable for developing algorithms, calibrating models, and implementing digital prediction and warning systems. Such advancements could enhance biologists' understanding of marine dynamics, providing new insights into plankton community functioning and environmental state evolution, including potential trends or regime shifts in the context of global environmental change.
The recent decision by EDF (Électricité de France) to provide open access to the IGA Gravelines Canal d'amenée monitoring data offers significant opportunities for scientific advancement. This will facilitate the utilization of the time series in ways similar to other long-term datasets. By detailing the characteristics of the Gravelines Canal d'amenée series, this article provides researchers and managers with the information needed for future scientific investigations and management applications, thereby contributing to a deeper understanding of coastal ecosystems in the English Channel and North Sea.
The supplement related to this article is available online at https://doi.org/10.5194/essd-17-1173-2025-supplement.
DD, GW, and AL wrote the paper. DD created all the figures and tables. GW coordinated the ecological monitoring of the GNPP for the IGA program. AL led the conceptualization and the overall writing of the paper.
The contact author has declared that none of the authors has any competing interests.
Publisher's note: Copernicus Publications remains neutral with regard to jurisdictional claims made in the text, published maps, institutional affiliations, or any other geographical representation in this paper. While Copernicus Publications makes every effort to include appropriate place names, the final responsibility lies with the authors.
The authors wish to express their gratitude to the national managers of the IGA program: Hervé Thillaye Du Boullay, Luc Drévès, and Michel Ropert. They thank the GNPP coordinators Geneviève Le Fèvre-Lehoërff, Alain Lefebvre, Elvire Antajan, and Guillaume Wacquet as well as all the technical teams and subcontractors who have been involved in sampling and analyzing the various compartments followed within the framework of the monitoring program since 1978.
They also extend their thanks to EDF for providing access to the data and for reviewing the article.
The data were collected as part of the IGA monitoring program (grant no. C3499C0490) conducted by IFREMER with financial support from EDF. These data remain the property of EDF and are made accessible to the scientific community for research purposes.
This paper was edited by Salvatore Marullo and reviewed by Michelle Devlin and two anonymous referees.
Aminot, A. and Kérouel, R.: Hydrologie des écosystèmes marins: paramètres et analyses, Ifremer, 336 pp., ISBN 2-84433-133-5, 2004.
Aminot, A. and Kérouel, R.: Dosage automatique des nutriments dans les eaux marines, Ifremer, 187 pp., ISBN-13 978-2-7592-0023-8, 2007.
Antajan, E., Bastian, T., Raud, T., Brylinski, J.-M., Hoffman, S., Breton, G., Cornille, V., Delegrange, A., and Vincent, D.: The invasive ctenophore Mnemiopsis leidyi (A. Agassiz 1865) along the English Channel and the North Sea French coasts: another introduction pathway in northern European waters?, Aquat. Invasions, 9, 167–173, 2014.
Atkinson, A.: Subantarctic copepods in an oceanic, low chlorophyll environment: Ciliate predation, food selectivity and impact on prey populations, Mar. Ecol. Prog. Ser., 130, 85–96, 1996.
Atkinson, A., Harmer, R. A., Widdicombe, C. E., McEvo, A. J., Smyth, T. J., Cummings, D. G., Somerfield, P. J., Maud, J. L., and McConville, K.: Questioning the role of phenology shifts and trophic mismatching in a planktonic food web, Prog. Oceanogr., 137, Part B, 498–512, https://doi.org/10.1016/j.pocean.2015.04.023, 2015.
Banse, K.: Grazing, Temporal Changes of Phytoplankton Concentrations, and the Microbial Loop in the Open Sea, in: Primary Productivity and Biogeochemical Cycles in the Sea, Env. Sci. Res., vol. 43, edited by: Falkowski, P. G., Woodhead, A. D., and Vivirito, K., Springer, Boston, MA, https://doi.org/10.1007/978-1-4899-0762-2_22, 1992.
Brylinski, J.-M.: The pelagic copepods in the Strait of Dover (Eastern English Channel). A commented inventory 120 years after Eugène CANU, Cah. Biol. Mar., 50, 251–260, 2009.
Corona, S., Hirst, A. G., Atkinson, D., Renz, J., Boersma, M., and Atkinson, A.: Long-term shifts in phenology, thermal niche, population size, and their interactions in marine pelagic copepods, Limnol. Oceanogr., 69, 482–497, https://doi.org/10.1002/lno.12499, 2024.
Dauvin, J. C., Desroy, N., Denis, L., and Ruellet, T.: Does the Phaeocystis bloom affect the diel migration of the suprabenthos community?, Mar. Pollut. Bull., 56, 77–87, https://doi.org/10.1016/j.marpolbul.2007.09.041, 2008.
Denis, L. and Desroy, N.: Consequences of spring phytodetritus sedimentation on the benthic compartment along a depth gradient in the Eastern English Channel, Mar. Pollut. Bull., 56, 1844–1854, https://doi.org/10.1016/j.marpolbul.2008.07.019, 2008.
Devreker, D. and Lefebvre, A.: TTAinterfaceTrendAnalysis: An R GUI for routine Temporal Trend Analysis and diagnostics, J. Oceanogr. Res. Data, 6, 1–18, 2014.
Devreker, D. and Lefebvre, A.: TTAinterfaceTrendAnalysis: Temporal Trend Analysis Graphical Interface. R package version 1.5.10, https://cran.r-project.org/package=TTAinterfaceTrendAnalysis/index.html (last access: 23 January 2024), 2021.
Dias, J.-G., Vermunt, J. K., and Ramos, S.: Clustering financial time series: New insights from an extended hidden markov model, Eur. J. Oper. Res., 243, 852–864, 2015.
Falkowski, P. G., Laws, E. A., Barber, R. T., and Murray, J. W.: Phytoplankton and Their Role in Primary, New, and Export Production, in: Ocean Biogeochemistry. Global Change – The IGBP Series (closed), edited by: Fasham, M. J. R., Springer, Berlin, Heidelberg, https://doi.org/10.1007/978-3-642-55844-3_5, 2003.
Feng, J., Stige, L. C., Durant, J. M., Hessen, D. O., Zhu, L., Hjermann, D.Ø., Llope, M., and Stenseth, N. C.: Large-scale season-dependent effects of temperature and zooplankton on phytoplankton in the North Atlantic, Mar. Ecol. Prog. Ser., 502, 25–37, https://doi.org/10.3354/meps10724, 2014.
Feuilloley, G., Fromentin, J.-M., Saraux, C., Irisson, J.-O., Jalabert, L., and Stemmann, L.: Temporal fluctuations in zooplankton size, abundance, and taxonomic composition since 1995 in the North Western Mediterranean Sea, ICES J. Mar. Sci., 79, 882–900, https://doi.org/10.1093/icesjms/fsab190, 2022.
González-Benítez, N., García-Corral, L. S., Morán, X. A. G., Middelburg, J. J., Pizay, M. D., and Gattuso, J. P.: Drivers of Microbial Carbon Fluxes Variability in Two Oligotrophic Mediterranean Coastal Systems, Sci. Rep.-UK, 9, 17669, https://doi.org/10.1038/s41598-019-53650-z, 2019.
Grassi, K., Poisson-Caillault, E., Bigand, A., and Lefebvre, A.: Comparative Study of Clustering Approaches Applied to Spatial or Temporal Pattern Discovery, J. Mar. Sci. Eng., 8, 713, https://doi.org/10.3390/jmse8090713, 2020.
Grattepanche, J.-D., Breton, E., Brylinski, J.-M., Lecuyer, E., and Christaki, U.: Succession of primary producers and micrograzers in a coastal ecosystem dominated by Phaeocystis globosa blooms, J. Plankton Res., 33, 37–50, https://doi.org/10.1093/plankt/fbq097, 2011.
Halsband-Lenk, C. and Antajan, E.: Zooplankton time-series analyses in the English Channel: potential for regional multimetric foodweb indices, in: Proceedings of the Joint ICES/CIESM Workshop to Compare Zooplankton Ecology and Methodologies between the Mediterranean and the North Atlantic (WKZEM), ICES Cooperative Research report 300, edited by: Gislason, A. and Gorsky, G., 29–34, https://www.vliz.be/imisdocs/publications/ocrd/256988.pdf (last access: 11 September 2024), 2010.
Harris, R.: The L4 time-series: the first 20 years, J. Plankton Res., 32, 577–583, https://doi.org/10.1093/plankt/fbq021, 2010.
Hernández Fariñas, T., Bacher, C., Soudant, D., Belin, B., and Barillé, L.: Assessing phytoplankton realized niches using a French national phytoplankton monitoring network, Estuar. Coast. Shelf S., 159, 15–27, https://doi.org/10.1016/j.ecss.2015.03.010, 2015.
Holland, M. M., Louchart, A., Artigas, L. P., Ostle, C., Atkinson, A., Rombouts, I., Graves, C. A., Devlin, M., Heyden, B., Machairopoulou, M., Bresnan, E., Schilder, J., Jakobsen, H. H., Lloyd-Hartley, H., Tett, P., Best, M., Goberville, E., and McQuatters-Gollop, A.: Major declines in NE Atlantic plankton contrast with more stable populations in the rapidly warming North Sea, Sci. Total Environ., 898, 165505, https://doi.org/10.1016/j.scitotenv.2023.165505, 2023.
Holland, M. M., Atkinson, A., Best, M., Bresnan, E., Devlin, M., Goberville, E., Hélaouët, P., Machairopoulou, M., Faith, M., Thompson, M. S. A., and McQuatters-Gollop, A.: Predictors of long-term variability in NE Atlantic plankton communities, Sci. Total Environ., 952, 175793, https://doi.org/10.1016/j.scitotenv.2024.175793, 2024.
Ifremer/ODE/VIGIES: REPHY national coordination & Quadrige administration unit: Manual for using REPHY Data. Information to improve the understanding of REPHY data files available to scientists and the public, Ifremer Report ODE/VIGIES/17-16, https://archimer.ifremer.fr/doc/00409/52017/ (last access: 24 January 2023), 2017.
John, E. H., Batten, S. D., Harris, R. P., and Hays, G. C.: Comparison between zooplankton data collected by the Continuous Plankton Recorder survey in the English Channel and by WP-2 nets at station L4, Plymouth (UK), J. Sea Res., 46, 223–232, https://doi.org/10.1016/S1385-1101(01)00085-5, 2001.
Kapsenberg, L., Alliouane, S., Gazeau, F., Mousseau, L., and Gattuso, J.-P.: Coastal ocean acidification and increasing total alkalinity in the northwestern Mediterranean Sea, Ocean Sci., 13, 411–426, https://doi.org/10.5194/os-13-411-2017, 2017.
Karasiewicz, S. and Lefebvre, A.: Environmental Impact on Harmful Species Pseudo-nitzschia spp. and Phaeocystis globosa Phenology and Niche, J. Mar. Sci. Eng., 10, 174, https://doi.org/10.3390/jmse10020174, 2022.
Karasiewicz, S., Breton, E., Lefebvre, A., Hernández Fariñas, T., and Lefebvre, S.: Realized niche analysis of phytoplankton communities involving HAB: Phaeocystis spp. as a case study, Harmful Algae, 72, 1–13, https://doi.org/10.1016/j.hal.2017.12.005, 2018.
Karasiewicz, S., Chapelle, A., Bacher, C., and Soudant, D.: Harmful algae niche responses to environmental and community variation along the French coast, Harmful Algae, 93, 101785, https://doi.org/10.1016/j.hal.2020.101785, 2020.
Lamy, D., Artigas, L. F., Jauzein, C., Lizon, F., and Cornille, V.: Coastal bacterial viability and production in the eastern English Channel: A case study during a Phaeocystis globosa bloom, J. Sea Res., 56, 227–238, https://doi.org/10.1016/j.seares.2006.04.003, 2006.
Lancelot, C. and Rousseau, V.: Ecology of Phaeocystis: the key role of colony forms, in: The haptophyte algae, edited by: Green, J. C. and Leadbeater, B. S. C., Clarendon Press, Oxford, 229–245, https://doi.org/10.1093/oso/9780198577720.003.0012,1994.
Lancelot, C., Spitz, Y., Gypens, N., Becquevort, S., Rousseau, V., Lacroix, G., and Billen, G.: Modelling diatom and Phaeocystis blooms and nutrient cycles in the Southern Bight of the North Sea: the MIRO model, Mar. Ecol. Prog. Ser., 289, 63–78, https://doi.org/10.3354/meps289063, 2005.
Längkvist, M., Karlsson, L., and Loutfi, A.: A review of unsupervised feature learning and deep learning for time-series modeling, Pattern Recogn. Lett., 42, 11–24, 2014.
Le Fevre-Lehoerff, G., Erard-Le Denn, E., and Arzul, G.: Planktonic ecosystems in the Channel-Trophic relations, Oceanol. Acta, 16, 661–670, 1993.
Le Fevre-Lehoerff, G., Ibanez, F., Poniz, P., and Fromentin, J.-M.: Hydroclimatic relationships with planktonic time series from 1975 to 1992 in the North Sea off Gravelines, France, Mar. Ecol. Prog. Ser., 129, 269–281, 1995.
Lefebvre, A. and Devreker, D.: First Comprehensive Quantitative Multi-Parameter Assessment of the Eutrophication Status from Coastal to Marine French Waters in the English Channel, the Celtic Sea, the Bay of Biscay, and the Mediterranean Sea, J. Mar. Sci. Eng., 8, 561, https://doi.org/10.3390/jmse8080561, 2020.
Lefebvre, A. and Devreker, D.: How to learn more about hydrological conditions and phytoplankton dynamics and diversity in the eastern English Channel and the Southern Bight of the North Sea: the Suivi Régional des Nutriments data set (1992–2021), Earth Syst. Sci. Data, 15, 1077–1092, https://doi.org/10.5194/essd-15-1077-2023, 2023.
Lefebvre, A. and Dezécache, C.: Trajectories of Changes in Phytoplankton Biomass, Phaeocystis globosa and Diatom (incl. Pseudo-nitzschia sp.) Abundances Related to Nutrient Pressures in the Eastern English Channel, Southern North Sea, J. Mar. Sci. Eng., 8, 401, https://doi.org/10.3390/jmse8060401, 2020.
Lefebvre, A., Guiselin, N., Barbet, F., and Artigas, L. F.: Long-term hydrological and phytoplankton monitoring (1992–2007) of three potentially eutrophic systems in the eastern English Channel and the Southern Bight of the North Sea, ICES J. Mar. Sci., 68, 2029–2043, https://doi.org/10.1093/icesjms/fsr149, 2011.
Lefebvre, A., Devreker, D., Antajan, E., Le Fèvre-Lehoërff, G., Thillaye du Boullay, H., Drévès, L., Ropert, M., and Wacquet, G.: IGA-HP Gravelines dataset – Hydrology and Plankton monitoring programme at the Gravelines coastal station, France (southern bight of the North Sea), SEANOE [data set], https://doi.org/10.17882/102656, 2024.
Lorenzen, C. J.: Determination of Chlorophyll and Pheopigments: Spectrophotometric Equations, Limnol. Oceanogr., 12, 343–346, https://doi.org/10.4319/lo.1967.12.2.0343, 1967.
Masilamoni, J. G., Jesudoss, K. S., Nandakumar, K., Satpathy, K. K., Nair, K. V. K., and Azariah, J.: Jellyfish ingress: A threat to the smooth operation of coastal power plants, Curr. Sci. India, 79, 567–569, 2000.
Mauchline, J.: The biology of calanoid copepods, Adv. Mar. Biol., 33, 710 pp., ill., Academic Press, London, ISBN 0-12-026133-2, 1998.
McEvoy, A. J., Atkinson, A., Airs, R. L., Brittain, R., Brown, I., Fileman, E. S., Findlay, H. S., McNeill, C. L., Ostle, C., Smyth, T. J., Somerfield, P. J., Tait, K., Tarran, G. A., Thomas, S., Widdicombe, C. E., Woodward, E. M. S., Beesley, A., Conway, D. V. P., Fishwick, J., Haines, H., Harris, C., Harris, R., Hélaouët, P., Johns, D., Lindeque, P. K., Mesher, T., McQuatters-Gollop, A., Nunes, J., Perry, F., Queiros, A. M., Rees, A., Rühl, S., Sims, D., Torres, R., and Widdicombe, S.: The Western Channel Observatory: a century of physical, chemical and biological data compiled from pelagic and benthic habitats in the western English Channel, Earth Syst. Sci. Data, 15, 5701–5737, https://doi.org/10.5194/essd-15-5701-2023, 2023.
McQuatters-Gollop, A., Atkinson, A., Aubert, A., Bedford, J., Best, M., Bresnan, E., Cook, K., Devlin, M., Gowen, R., Johns, D. G., Machairopoulou, M., McKinney, A., Mellor, A., Ostle, C., Scherer, C., and Tett, P.: Plankton lifeforms as a biodiversity indicator for regional-scale assessment of pelagic habitats for policy, Ecol. Indic., 101, 913–925, https://doi.org/10.1016/j.ecolind.2019.02.010, 2019.
Muller-Karger, F. E., Miloslavich, P., Bax, N. J., Simmons, S., Costello, M. J., Pinto, I. S., Canonico, G., Turner, W., Gill, M., Montes, E., Best, B. D., Pearlman, J., Halpin, P., Dunn, D., Benson, A., Martin, C. S., Weatherdon, L. V., Appeltans, W., Provoost, P., Klein, E., Kelble, C. R., Miller, R. J., Chavez, F. P., Iken, K., Chiba, S., Obura, D., Navarro, L. M., Pereira, H. M., Allain, V., Batten, S., Benedetti-Checchi, L., Duffy, J. E., Kudela, R. M., Rebelo, L.-M., Shin, Y., and Geller, G.: Advancing Marine Biological Observations and Data Requirements of the Complementary Essential Ocean Variables (EOVs) and Essential Biodiversity Variables (EBVs) Frameworks, Front. Mar. Sci., 5, 211, https://doi.org/10.3389/fmars.2018.00211, 2018.
Parravicini, V., Mangialajo, L., Mousseau, L., Peirano, A., Morri, C., Montefalcone, M., Francour, P., Kulbicki, M., and Bianchi, C. N.: Climate change and warm-water species at the north-western boundary of the Mediterranean Sea, Mar. Ecol., 36, 897–909, https://doi.org/10.1111/maec.12277, 2015.
Poisson Caillault, E. and Lefebvre, A.: Towards Chl-a Bloom Understanding by EM-based Unsupervised Event Detection. Proceedings of Oceans 2017, Aberdeen, UK, 19–22 June 2017, 1–5, ISBN 978-1-5090-5279-0, https://doi.org/10.1109/OCEANSE.2017.8084597, 2017.
Romagnan, J.-B., Legendre, L., Guidi, L., Jamet, J.-L., Jamet, D., and Mousseau, L.: Comprehensive Model of Annual Plankton Succession Based on the Whole-Plankton Time Series Approach, PLoS ONE, 10, e0119219, https://doi.org/10.1371/journal.pone.0119219, 2015.
Romagnan, J.-B., Aldamman, L., Gasparini, S., Nival, P., Aubert, A., Jamet, J.-L., and Stemmann, L.: High frequency mesozooplankton monitoring: Can imaging systems and automated sample analysis help us describe and interpret changes in zooplankton community composition and size structure – An example from a coastal site, J. Marine Syst., 162, 18–28, https://doi.org/10.1016/j.jmarsys.2016.03.013, 2016.
Rousseau, V., Mathot, S. and Lancelot, C.: Calculating carbon biomass of Phaeocystis sp. from microscopic observations, Mar. Biol., 107, 305–314, https://doi.org/10.1007/BF01319830, 1990.
Rousseeuw, K., Poisson-Caillault, E., Lefebvre, A., and Hamad, D.: Hybrid hidden Markov model for marine environment monitoring, IEEE J. Sel. Top. Appl., 8, 204–213, https://doi.org/10.1109/JSTARS.2014.2341219, 2015.
Schapira, M., Vincent, D., Gentilhomme, V., and Seuront, L.: Temporal patterns of phytoplankton assemblages, size spectra and diversity during the wane of a Phaeocystis globosa spring bloom in hydrologically contrasted coastal waters, J. Mar. Biol. Assoc. UK, 88, 649–662, https://doi.org/10.1017/S0025315408001306, 2008.
SCOR-UNESCO: Determination of Photosynthetic Pigments, Monographs on Oceanographic Methodology, Vol. 1, 11–18, https://unesdoc.unesco.org/ark:/48223/pf0000071612 (last access: 28 August 2024), 1966.
SHOM: Ondine 85 – Hydrologie discrète et bathythermie réalisées à bord du bâtiment hydrographique l'Espérance par Le Magner, F., Vennel, R., Launo, S., Rapport d'Étude 001/88, Service Hydrographique et Océanographique de la Marine, 537 pp., 1988.
Spilmont, N., Denis, L., Artigas, L. F., Caloin, F., Courcot, L., Créach, A., Desroy, N., Gevaert, F., Hacquebart, P., Hubas, C., Janquin, M.-A., Lemoine, Y., Luczak, C., Migné, A., Rauch, M., and Davoult, D.: Impact of the Phaeocystis globosa spring bloom on the intertidal benthic compartment in the eastern English Channel: A synthesis, Mar. Pollut. Bull., 58, 55–63, https://doi.org/10.1016/j.marpolbul.2008.09.007, 2009.
USEPA: Turbidity: Water Quality Standards, Criteria Summaries: a Compilation of State/Federal Criteria, https://nepis.epa.gov/Exe/ZyPURL.cgi?Dockey=00001NCW.txt (last access: 28 August 2024), 1980.
Utermohl, H.: Zur Vervollkommung der quantitativen Phytoplankton-Methodik, Mitteilung Internationale Vereinigung fuer Theoretische und Angewandte Limnologie, 9, 39 pp., https://doi.org/10.1080/05384680.1958.11904091, 1958.
Van Hoan, M., Huy, D. T., and Mai, L. C.: Pattern Discovery in the Financial Time Series Based on Local Trend, in: Advances in Information and Communication Technology, edited by: Akagi, M., Nguyen, T. T., Vu, D. T., Phung, T. N., and Huynh, V. N., ICTA 2016, Adv. Intell. Syst. Comput., Springer, 538 pp., https://doi.org/10.1007/978-3-319-49073-1_48, 2017.
Vandromme, P., Stemmann, L., Berline, L., Gasparini, S., Mousseau, L., Prejger, F., Passafiume, O., Guarini, J.-M., and Gorsky, G.: Inter-annual fluctuations of zooplankton communities in the Bay of Villefranche-sur-mer from 1995 to 2005 (Northern Ligurian Sea, France), Biogeosciences, 8, 3143–3158, https://doi.org/10.5194/bg-8-3143-2011, 2011.
Wang, X., Jin, Q., Yang, L., Jia, C., Guan, C., Wang, H., and Guo, H.: Aggregation process of two disaster-causing jellyfish species, Nemopilema nomurai and Aurelia coerulea, at the intake area of a nuclear power cooling-water system in Eastern Liaodong Bay, China, Front. Mar. Sci., 9, 1098232, https://doi.org/10.3389/fmars.2022.1098232, 2023.
Wang, Y., Chen, X., Lin, Y., Zhang, S., Chang, L., Tang, X., Xiang, P., and Lin, H.: Potential risk from and prevention of phytoplankton outbreaks in blocking the cooling water system in a nuclear power plant on the Southeast China coast, Front. Mar. Sci., 9, 1034876, https://doi.org/10.3389/fmars.2022.1034876, 2022.
Wasmund, N., Kownacka, J., Göbel, J., Jaanus, A., Johansen, M., Jurgensone, I., Lehtinen, S., and Powilleit, M.: The Diatom/Dinoflagellate Index as an Indicator of Ecosystem Changes in the Baltic Sea 1. Principle and Handling Instruction, Front. Mar. Sci., 4, 22, https://doi.org/10.3389/fmars.2017.00022, 2017.
Widdicombe, C. E., Eloire, D., Harbour, D., Harris, R. P., and Somerfield, P. J.: Long-term phytoplankton community dynamics in the Western English Channel, J. Plankton Res., 32, 643–655, https://doi.org/10.1093/plankt/fbp127, 2010.
Woehrlings, D., Lefebvre, A., Lehoerff, G., and Delesmont, R.: Seasonal and longer term trends in sea temperature along the French North Sea coast, 1975 to 2002, J. Mar. Biol. Assoc. UK, 85, 39–48, https://doi.org/10.1017/S0025315405010805h, 2005.
WoRMS Editorial Board: World Register of Marine Species, https://doi.org/10.14284/170, 2024.
Xiao, W., Liu, X., Irwin, A. J., Edward, A., Laws, Wang, L., Chen, B., Zeng, Y., and Huang, B.: Warming and eutrophication combine to restructure diatoms and dinoflagellates, Water Res., 128, 206–216, https://doi.org/10.1016/j.watres.2017.10.051, 2018.