the Creative Commons Attribution 4.0 License.
the Creative Commons Attribution 4.0 License.
 | 14 Mar 2025
An updated synthesis of ocean total alkalinity and dissolved inorganic carbon measurements from 1993 to 2023: the SNAPO-CO2-v2 dataset
Nicolas Metzl
Jonathan Fin
Claire Lo Monaco
Claude Mignon
Samir Alliouane
Bruno Bombled
Jacqueline Boutin
Yann Bozec
Steeve Comeau
Pascal Conan
Laurent Coppola
Pascale Cuet
Eva Ferreira
Jean-Pierre Gattuso
Frédéric Gazeau
Catherine Goyet
Emilie Grossteffan
Bruno Lansard
Dominique Lefèvre
Nathalie Lefèvre
Coraline Leseurre
Sébastien Petton
Mireille Pujo-Pay
Christophe Rabouille
Gilles Reverdin
Céline Ridame
Peggy Rimmelin-Maury
Jean-François Ternon
Franck Touratier
Aline Tribollet
Thibaut Wagener
Cathy Wimart-Rousseau
Total alkalinity (AT) and dissolved inorganic carbon (CT) in the oceans are important properties to understand the ocean carbon cycle and its link with global change (ocean carbon sinks and sources, ocean acidification) and ultimately to find carbon-based solutions or mitigation procedures (marine carbon removal). We present an extended database (SNAPO-CO2; Metzl et al., 2024c) with 24 700 new additional data for the period 2002 to 2023. The full database now includes more than 67 000 AT and CT observations along with basic ancillary data (time and space location, depth, temperature, and salinity) in various oceanic regions obtained since 1993 mainly in the framework of French research projects. This includes both surface and water columns data acquired in open oceans, coastal zones, rivers, the Mediterranean Sea, and either from time series stations or punctual cruises. Most AT and CT data in this synthesis were measured from discrete samples using the same closed-cell potentiometric titration calibrated with certified reference material, with an overall accuracy of ±4 µmol kg−1 for both AT and CT. The same technique was used on board for underway measurements during cruises conducted in the southern Indian and Southern oceans. The AT and CT data from these cruises are also added to this synthesis. The data are provided in one dataset for the global ocean (https://doi.org/10.17882/102337, Metzl et al., 2024c) that offers a direct use for regional or global purposes, e.g., AT–salinity relationships, long-term CT estimates, constraint and validation of diagnostics CT and AT reconstructed fields, ocean carbon and coupled climate–carbon models simulations, and data derived from Biogeochemical Argo (BGC-Argo) floats. These data can also be used to calculate pH, fugacity of CO2 (fCO2), and other carbon system properties to derive ocean acidification rates or air–sea CO2 fluxes.
- Article
(14250 KB) - Full-text XML
-
Supplement
(2030 KB) - BibTeX
- EndNote


The ocean plays a major role in reducing the impact of climate change by absorbing more than 90 % of the excess heat in the climate system (Cheng et al., 2020, 2024; von Schuckmann et al., 2023; IPCC, 2022) and about 25 % of anthropogenic CO2 (Friedlingstein et al., 2022, 2023). In the last decade, the oceans have experienced a rapid warming, the year 2023 being the hottest since 1955 (Cheng et al., 2024). In the atmosphere the CO2 concentration continues its terrific progressive rise, reaching 419.3 ppm in 2023 (a rate of +2.83 ppm yr−1; Lan et al., 2024). In August 2024, the global atmospheric CO2 concentration was already above 420 ppm. In the next decade the oceans will continue to capture heat and CO2, somehow limiting the climate change, but this oceanic CO2 uptake changes the chemistry of seawater, reducing its buffering capacity (Revelle and Suess, 1957; Jiang et al., 2023). This process, known as ocean acidification, has potential impacts on marine organisms (Fabry et al., 2008; Doney et al., 2009, 2020; Gattuso et al., 2015). With atmospheric CO2 concentrations, surface ocean temperature and ocean heat content, sea level, sea ice, and glaciers, ocean acidification (decrease in pH) is now recognized by the World Meteorological Organization as one of the seven key properties of global climate indicators (WMO/GCOS, 2018). Ocean acidification is specifically referred to in the Sustainable Development Goal 14.3.1 Indicator, coordinated at the Intergovernmental Oceanographic Commission (IOC) of UNESCO. Observing the carbonate system in the open oceans, coastal zones, and marginal seas and understanding how this system changes over time are thus highly relevant not only to quantify the global ocean carbon budget, the anthropogenic CO2 inventories, or ocean acidification rates, but also to understand and simulate the processes that govern the complex CO2 cycle in the ocean (e.g., Goyet et al., 2016, 2019) and to better predict the future evolution of climate and global changes (Eyring et al., 2016; Kwiatkowski et al., 2020; Jiang et al., 2023). As the rate of change in ocean acidification presents large temporal and regional variability, long-term observations are required. Weekly to monthly regular resolution data are needed to better investigate the long-term change in the carbonate system in regions subject to extreme events (e.g., tropical cyclones, marine heat or cold waves, rapid freshening, convection, dust events, river discharges). In this context it is recommended to progress in data synthesis of the ocean carbon observations that would offer new high-quality products for the community (e.g., for GOA-ON, https://www.goa-on.org, last access: 22 January 2025, IOC/SDG 14.1.3, https://oa.iode.org/, last access: 22 January 2025; Tilbrook et al., 2019).
In this work, following the first SNAPO-CO2 synthesis product (Metzl et al., 2024a), we present a new synthesis of more than 67 000 AT and CT data, measured either on the shore or on board research vessels obtained over the 1993–2023 period during various cruises or at time-series stations mainly supported by French projects. Hereafter this new dataset will be cited as SNAPO-CO2-v2. The methods, data assemblage, and quality control were presented in version V1. Here, we describe the new data added and discuss some potential uses of this dataset.
The time series projects and research cruises from which new data were collated are listed in Table 1 with information and references in the Supplement (Tables S1, S3, and S4). The sampling locations of new data are displayed in Fig. 1 (the locations for all data are presented in Fig. S1 in the Supplement). Sampling was performed either from CTD/rosette casts (Niskin bottles) or from the ship's seawater supply (intake at about 5 m depth depending on the ship and swell). Samples collected in 500 mL borosilicate glass bottles were poisoned with 100 to 300 µL of HgCl2 depending on the cruises, closed with greased stoppers (Apiezon®) and held tightly using elastic bands following the SOP protocol (DOE, 1994; Dickson et al., 2007). Some samples were also collected in 500 mL bottles closed with screw caps. After completion of each cruise, most of discrete samples were returned back to the LOCEAN laboratory (Paris, France) and stored in a dark room at 4 °C before analysis, generally within 2–3 months after sampling (sometimes within a week). In this version we added data from samples that were also returned to University of Perpignan or to University of Réunion. In addition to the discrete samples analyzed for various projects conducted mainly in the North Atlantic, tropical Atlantic, Mediterranean Sea, and coastal regions (Table 1), we complemented this second synthesis with AT and CT surface observations obtained in the Indian and Southern oceans during the OISO cruises in 2019–2021 (Leseurre et al., 2022; Metzl et al., 2022; data also available at NCEI–OCADS: https://www.nodc.noaa.gov/ocads/oceans/VOS_Program/OISO.html, last access: 22 January 2025) and MINERVE cruises in 2002–2018 (Laika et al., 2009; Brandon et al., 2022). The AT and CT measurements from the MINERVE cruises were performed either on board R/V Astrolabe or back in the laboratories (at LOCEAN laboratory and at University of Perpignan).
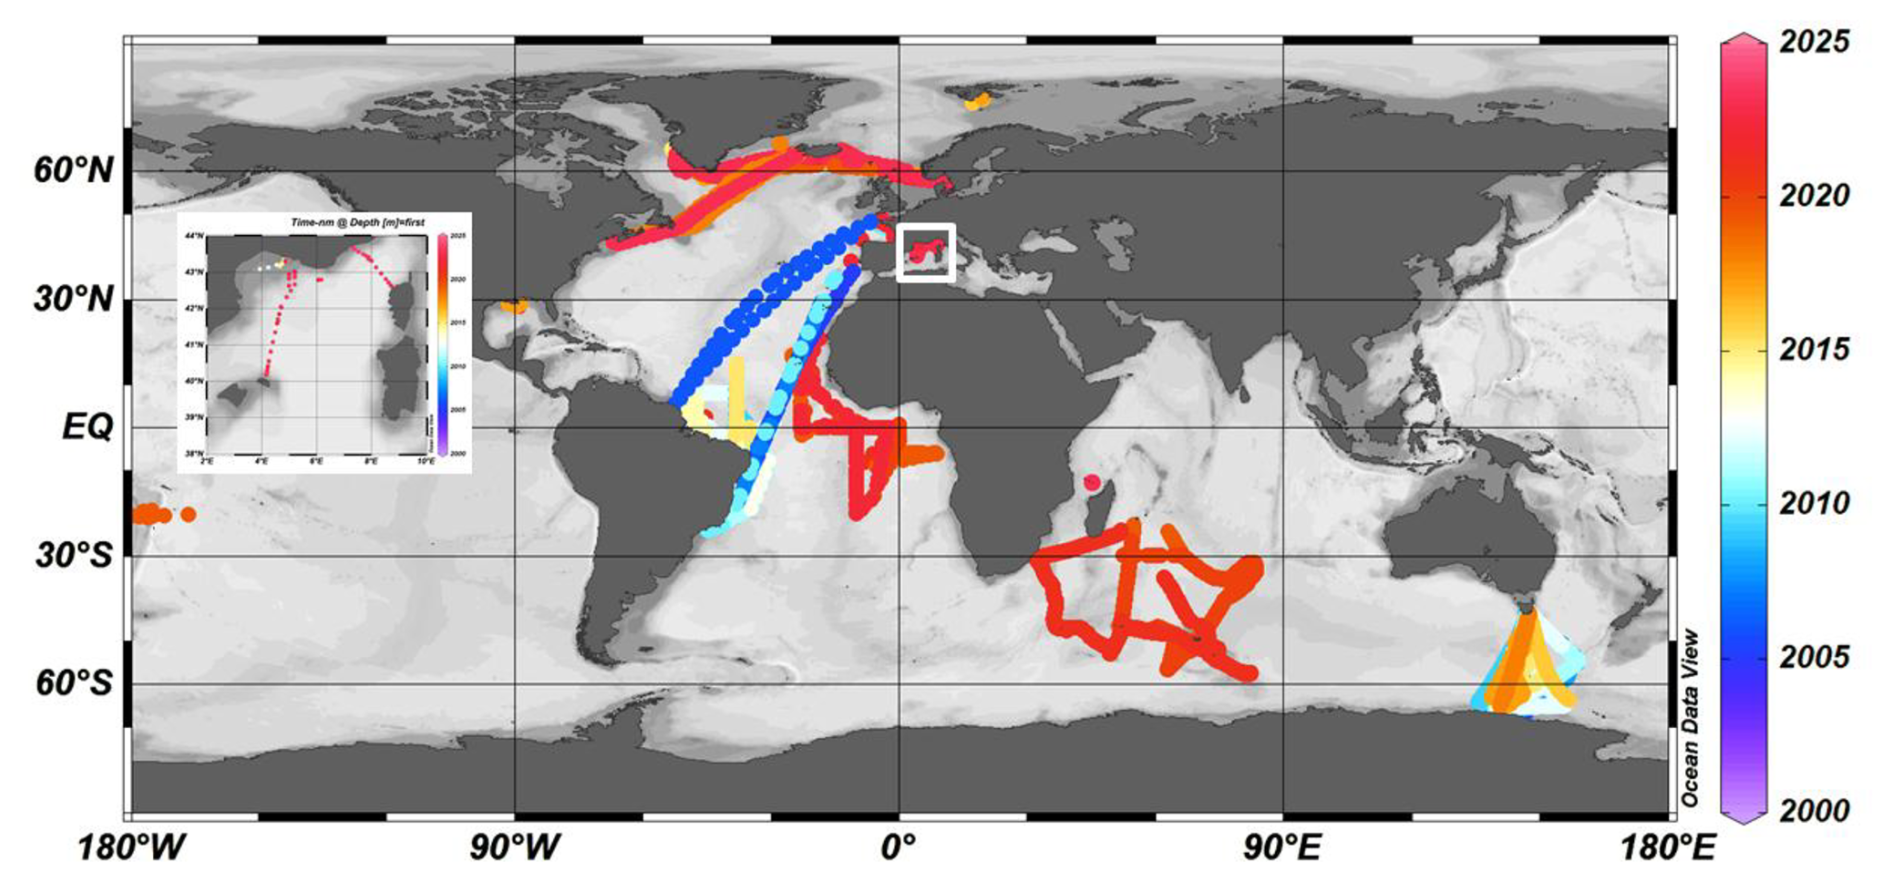
Figure 1Locations of new AT and CT data (2005–2023) in the global ocean and the western Mediterranean Sea (white box, inset) in the SNAPO-CO2-v2 dataset. Color code is for year. Figure produced with ODV (Schlitzer, 2018).
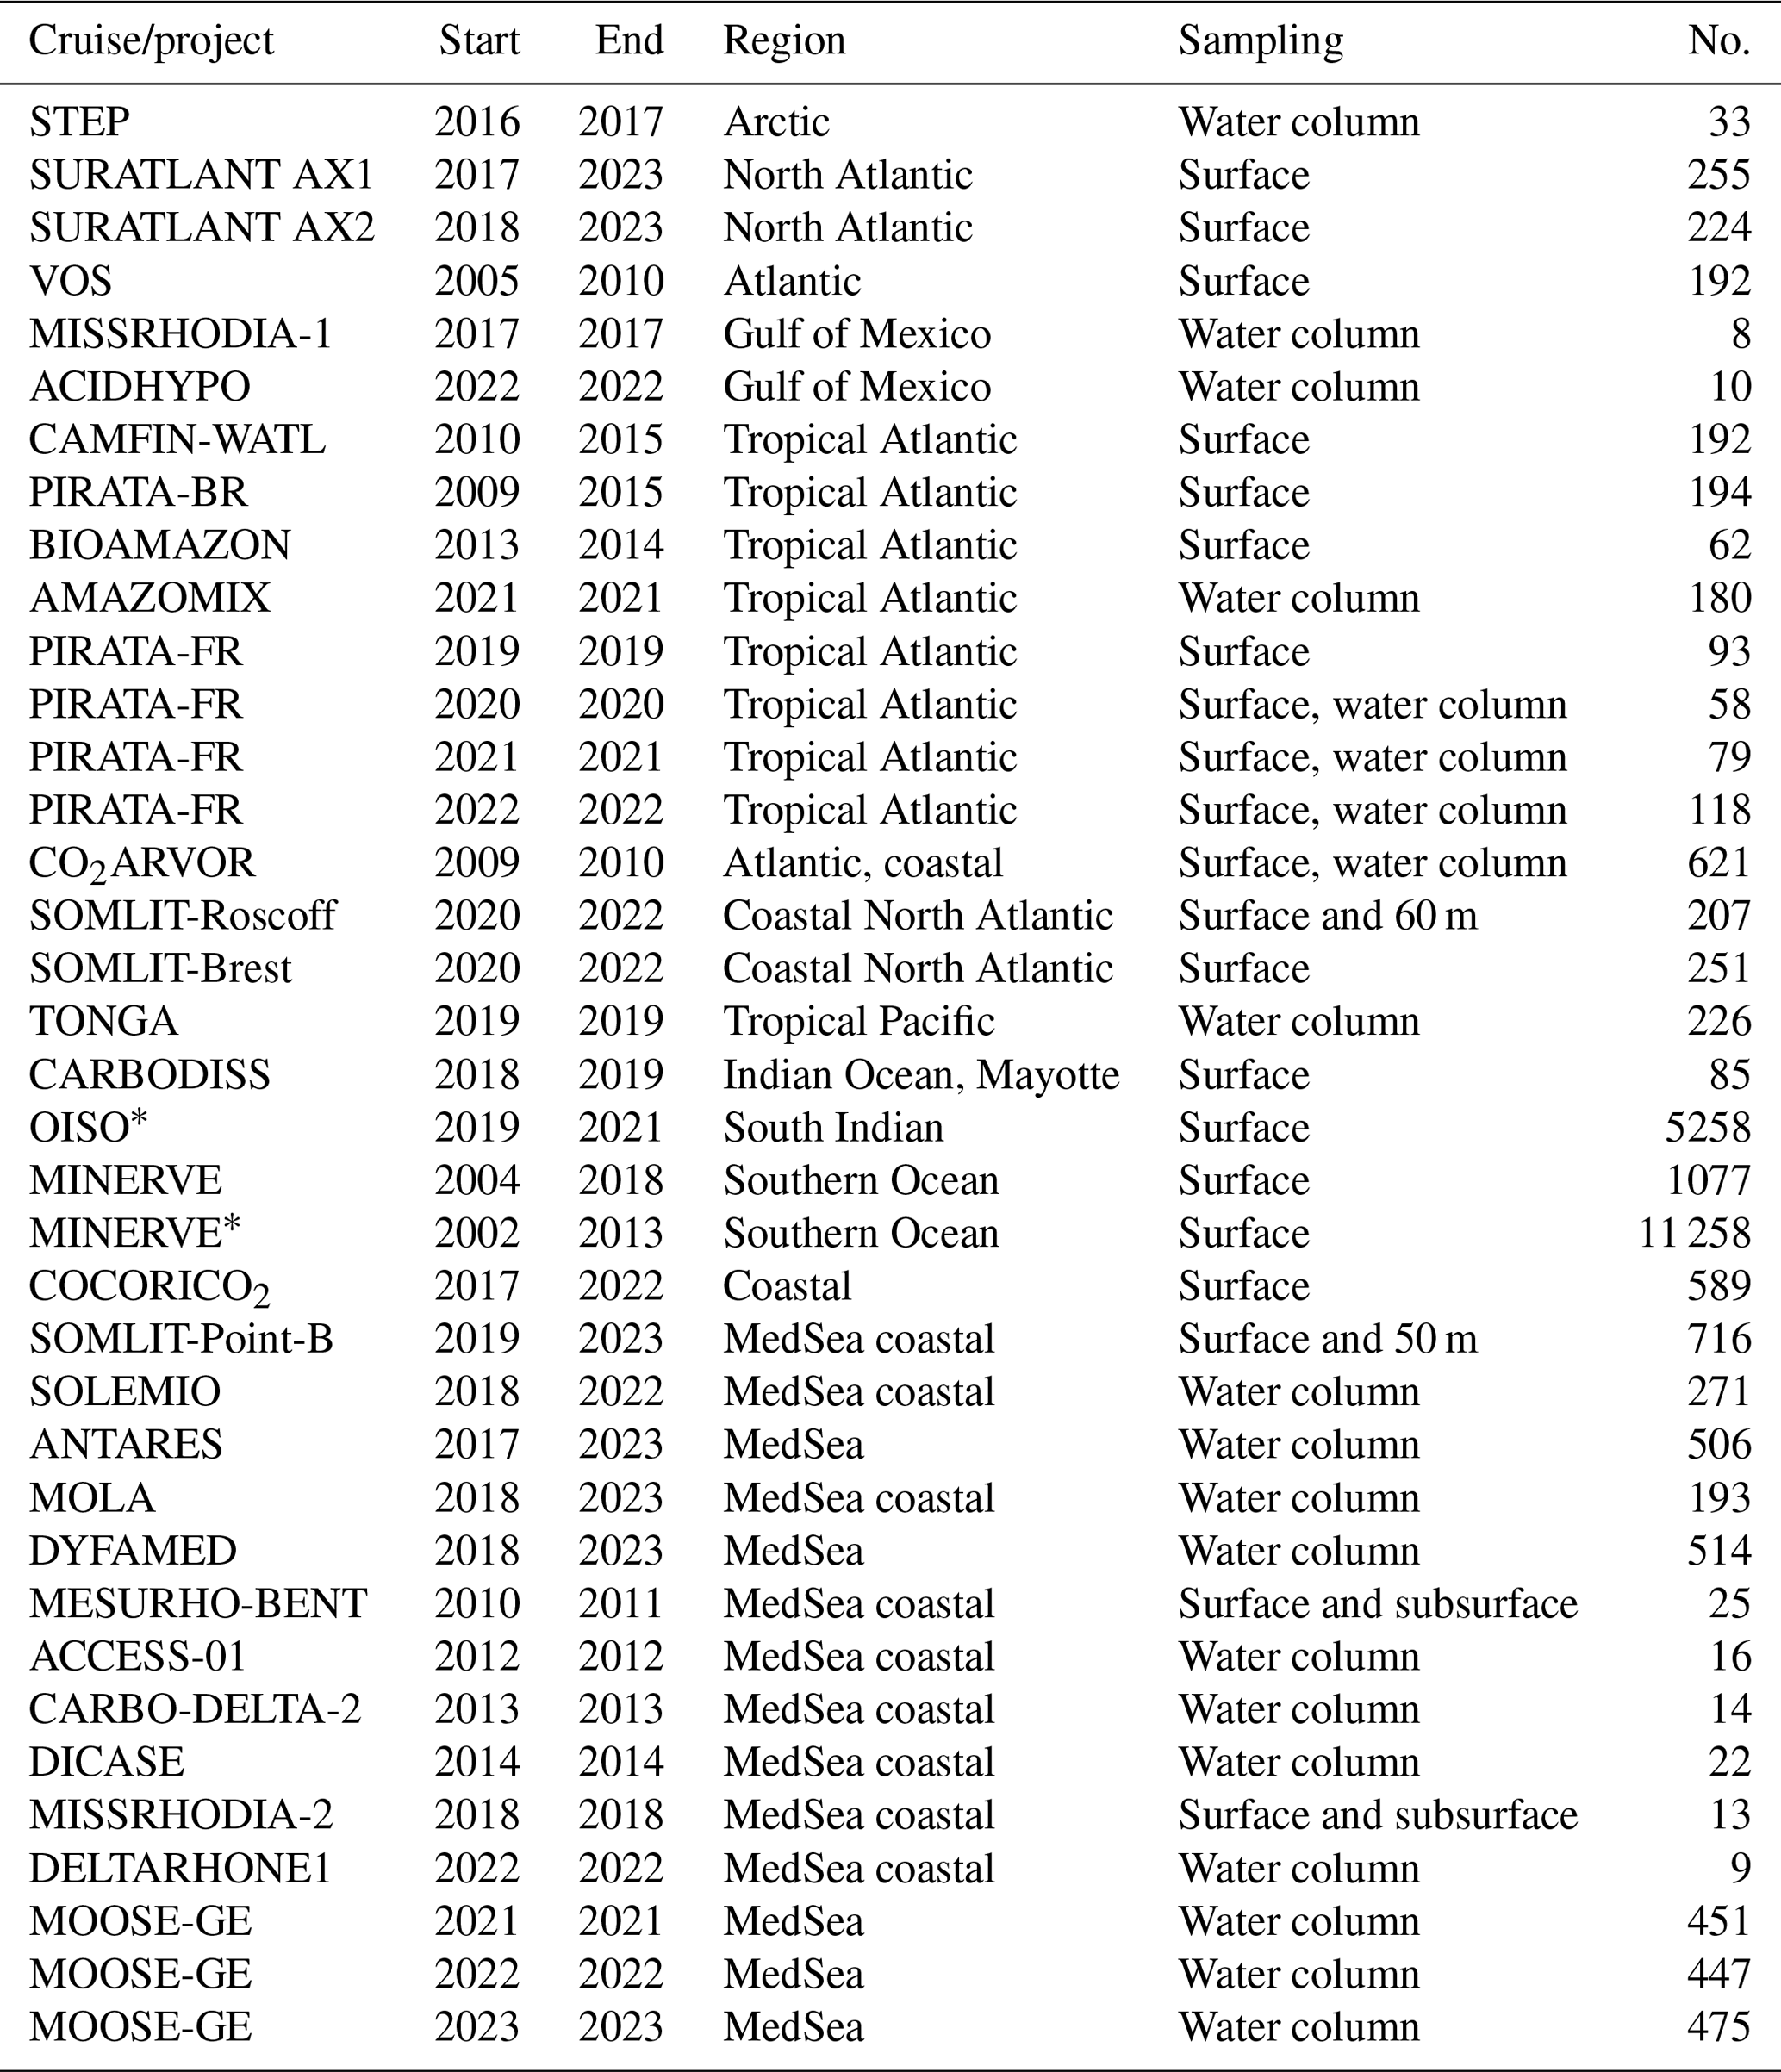
Table 1List of cruises added to the SNAPO-CO2-v2 dataset. This is organized by region from north to south and the Mediterranean Sea (MedSea). See Tables S1, S2, S3, and S4 in the Supplement for a list of laboratories, CRMs used, DOIs, and references of cruises. No. denotes the number of data for each cruise or time series. An asterisk indicates the measurements at sea (surface underway).
3.1 Method and accuracy
Since 2003, the discrete samples returned back to SNAPO-CO2 service facilities (LOCEAN, Paris) have been analyzed simultaneously for AT and CT by potentiometric titration using a closed cell (Edmond, 1970; Goyet et al., 1991). The same technique was used at sea for surface water underway measurements during OISO and MINERVE cruises (indicated by an asterisk in Table 1). In the late 1980s the JGOFS–IOC Advisory Panel on Ocean CO2 recommended the need for standard analysis protocols and for developing certified reference materials (CRMs) for inorganic carbon measurements (Poisson et al., 1990; UNESCO, 1990, 1991). The CRMs were provided to international laboratories by Andrew Dickson (Scripps Institution of Oceanography, San Diego, USA), starting in 1990 for CT and 1996 for AT, respectively. These CRMs were thus always available to us and used to calibrate the measurements (CRM batch numbers used for each cruise are listed in the Supplement, Table S2). The CRM accuracy, as indicated in the certificate for each batch, is around ±0.5 µmol kg−1 for both AT and CT (https://www.nodc.noaa.gov/ocads/oceans/Dickson_CRM/batches.html, last access: 22 January 2025). The concentrations of CRMs we used vary between 2193 and 2426 µmol kg−1 for AT and between 1968 and 2115 µmol kg−1 for CT, corresponding to the range of concentrations observed in open-ocean water. In the Mediterranean Sea the concentrations are higher (AT > 2600 µmol kg−1 and CT > 2300 µmol kg−1), and in the coastal zones or near the Amazon River plume the concentrations were often lower than the CRMs (AT < 1500 µmol kg−1 and CT < 1000 µmol kg−1). Results of analyses performed on 1242 CRM bottles (different batches) in 2013–2024 are presented in Fig. 2. The standard deviations (SDs) of the differences in measurements were on average ±2.69 µmol kg−1 for AT and ±2.88 µmol kg−1 for CT. For unknown reasons, the differences were occasionally up to 10–15 µmol kg−1 (1.2 % of the data; Fig. S2). These few CRM measurements were discarded for data processing. We did not detect any specific signal for CRM analyses (e.g., larger uncertainty depending on the batch number or temporal drifts during analyses; Fig. 2), but for some cruises the accuracy based on CRMs could be better than 3 µmol kg−1 (e.g., < 3 µmol kg−1 for AMAZOMIX cruise using six batches of no. 197 and for MOOSE-GE 2022 using 19 batches of no. 204, or < 1.5 µmol kg−1 for SOMLIT-Point-B in 2022 using six batches of no. 204).
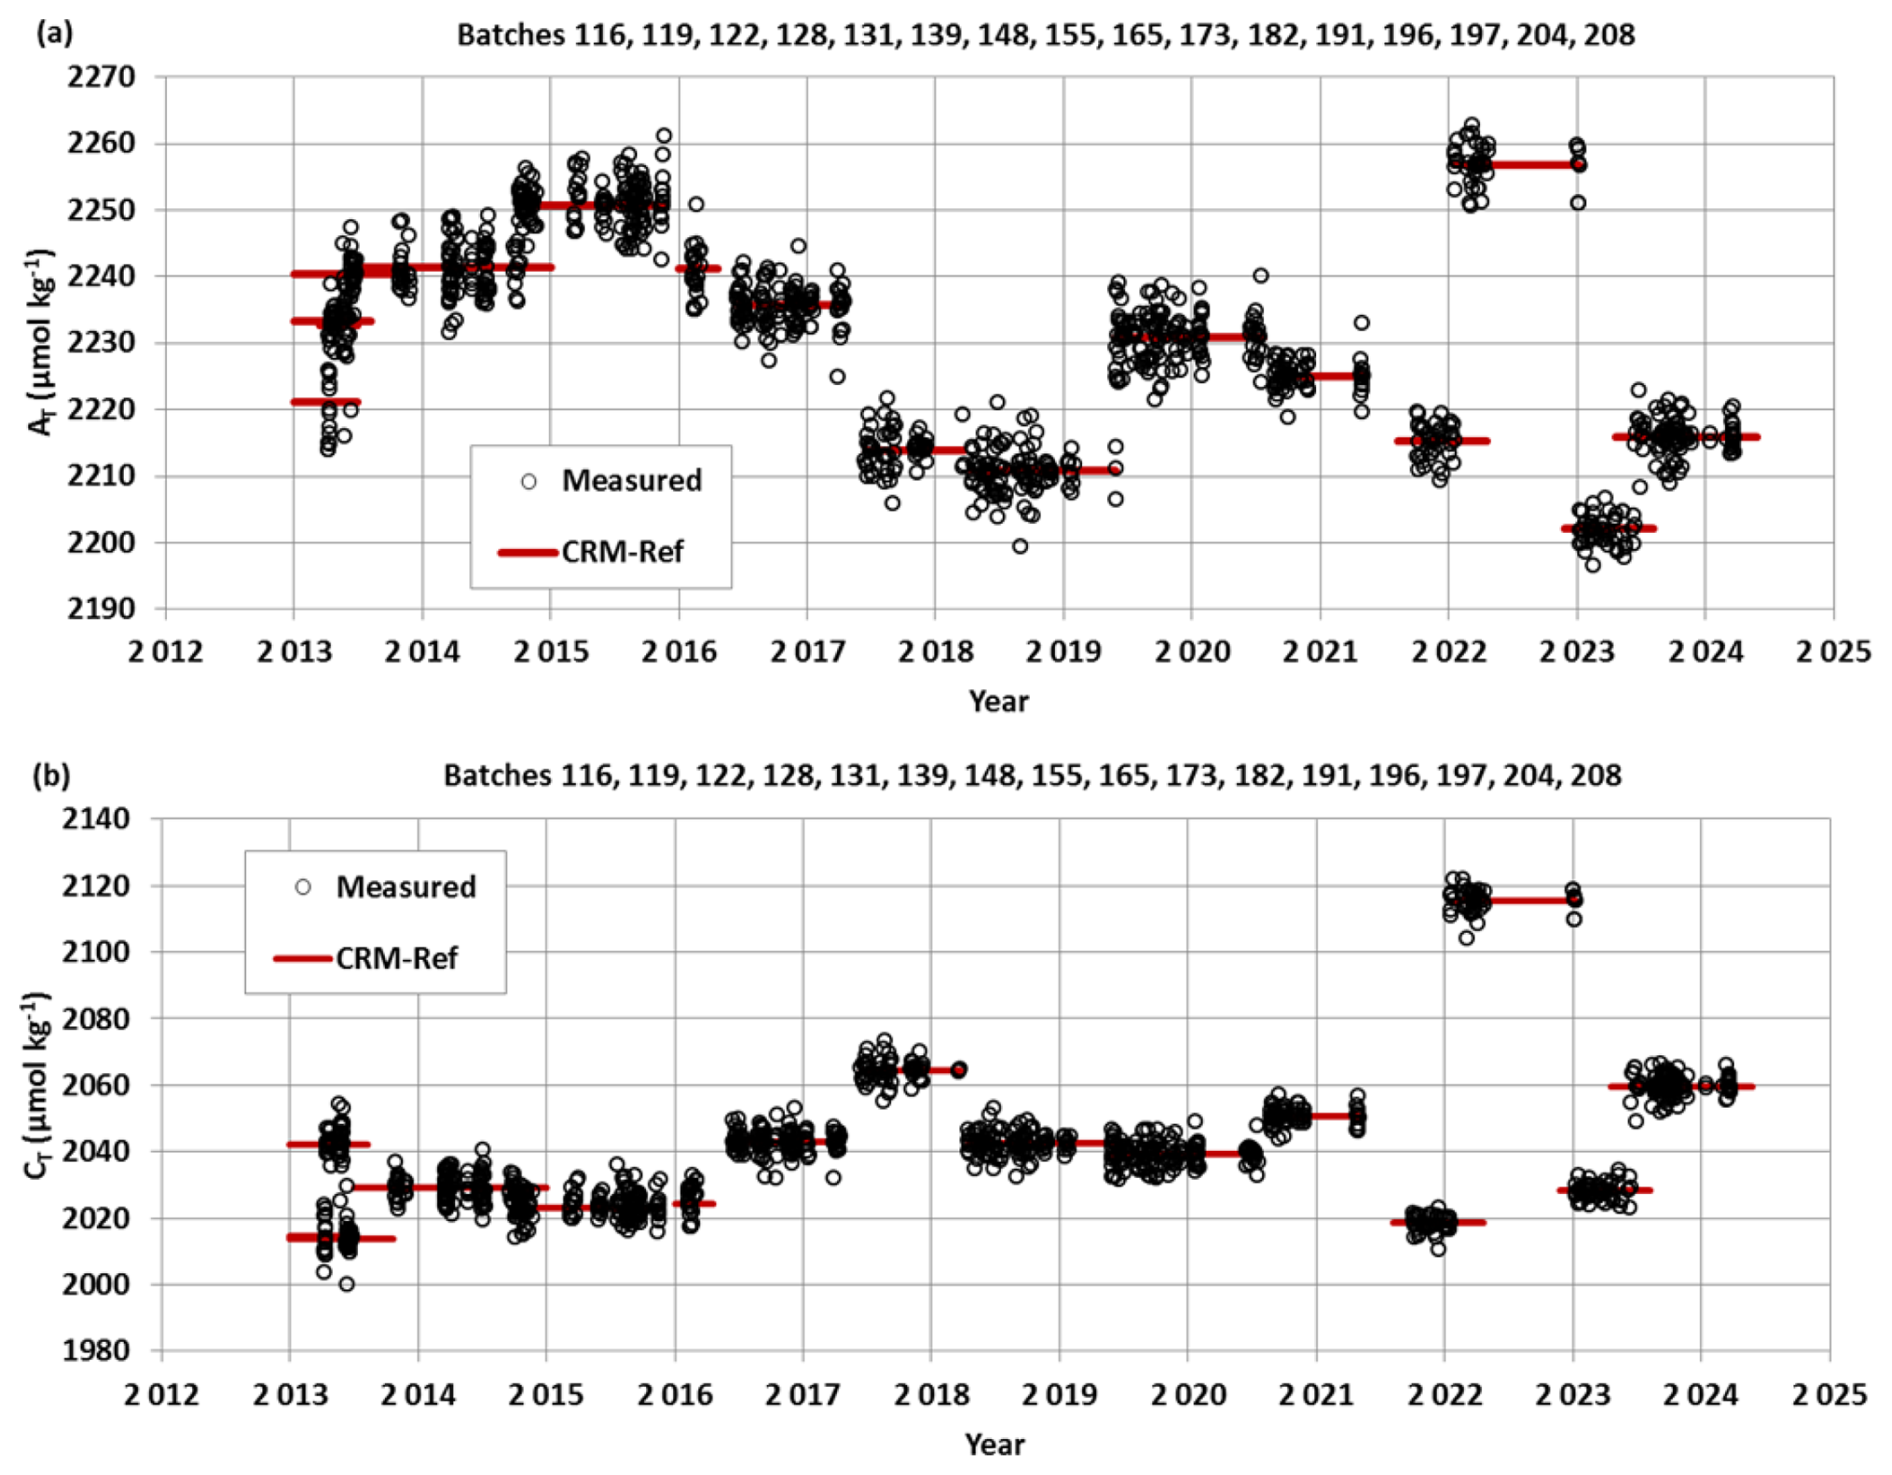
Figure 2AT (a) and CT (b) analyses for different CRM batches measured in 2013–2024. For these 1242 analyses, the mean and standard deviations of the differences with the CRM reference were −0.11 (±2.69) µmol kg−1 for AT and 0.01 (±2.88) µmol kg−1 for CT.
3.2 Repeatability
For some projects, duplicates have been regularly sampled (SOMLIT-Point-B, SOMLIT-Brest) or replicate bottles sampled at selected depths at fixed stations during the cruises (e.g., STEP, CARBODISS). In the first synthesis of the SNAPO-CO2 dataset, we showed the results from several time series (SOMLIT-Point-B, SOMLIT-Brest and BOUSSOLE/DYFAMED). Here we present the results for the new data obtained at SOMLIT-Point-B in the coastal Mediterranean Sea and SOMLIT-Brest in the Bay of Brest (Fig. 3). Results of AT and CT repeatability are synthesized in Table 2. For the OISO cruises conducted in 2019, 2020, and 2021, the repeatability was evaluated from duplicate analyses (within 20 min) of continuous sea surface underway sampling at the same location (when the ship was stopped). Similarly to what was found for the CRM measurements (Fig. S2), differences in duplicates are occasionally higher than 10–15 µmol kg−1 (Fig. 3), but most of the duplicates for all projects are within 0 to 3 µmol kg−1. Compared to previous results (Kapsenberg et al., 2017; Metzl et al., 2024a), there are larger differences between duplicates at SOMLIT-B in 2019–2023 (up to 30 µmol kg−1; Fig. 3), leading to relatively large SDs around 5 and 6 µmol kg−1 for both AT and CT (Table 2). The same was observed for duplicates at SOMLIT-Brest (Table 2). We do not yet have a clear explanation for this large SD, although larger variability was observed in recent years, and the measurements were performed later after the sampling (e.g., more than 6 months for some samples during and after the COVID period). We will see that, given the temporal variability in the properties, this does not lead to suspicious interpretation for the seasonality or the trend analyses of these time series.
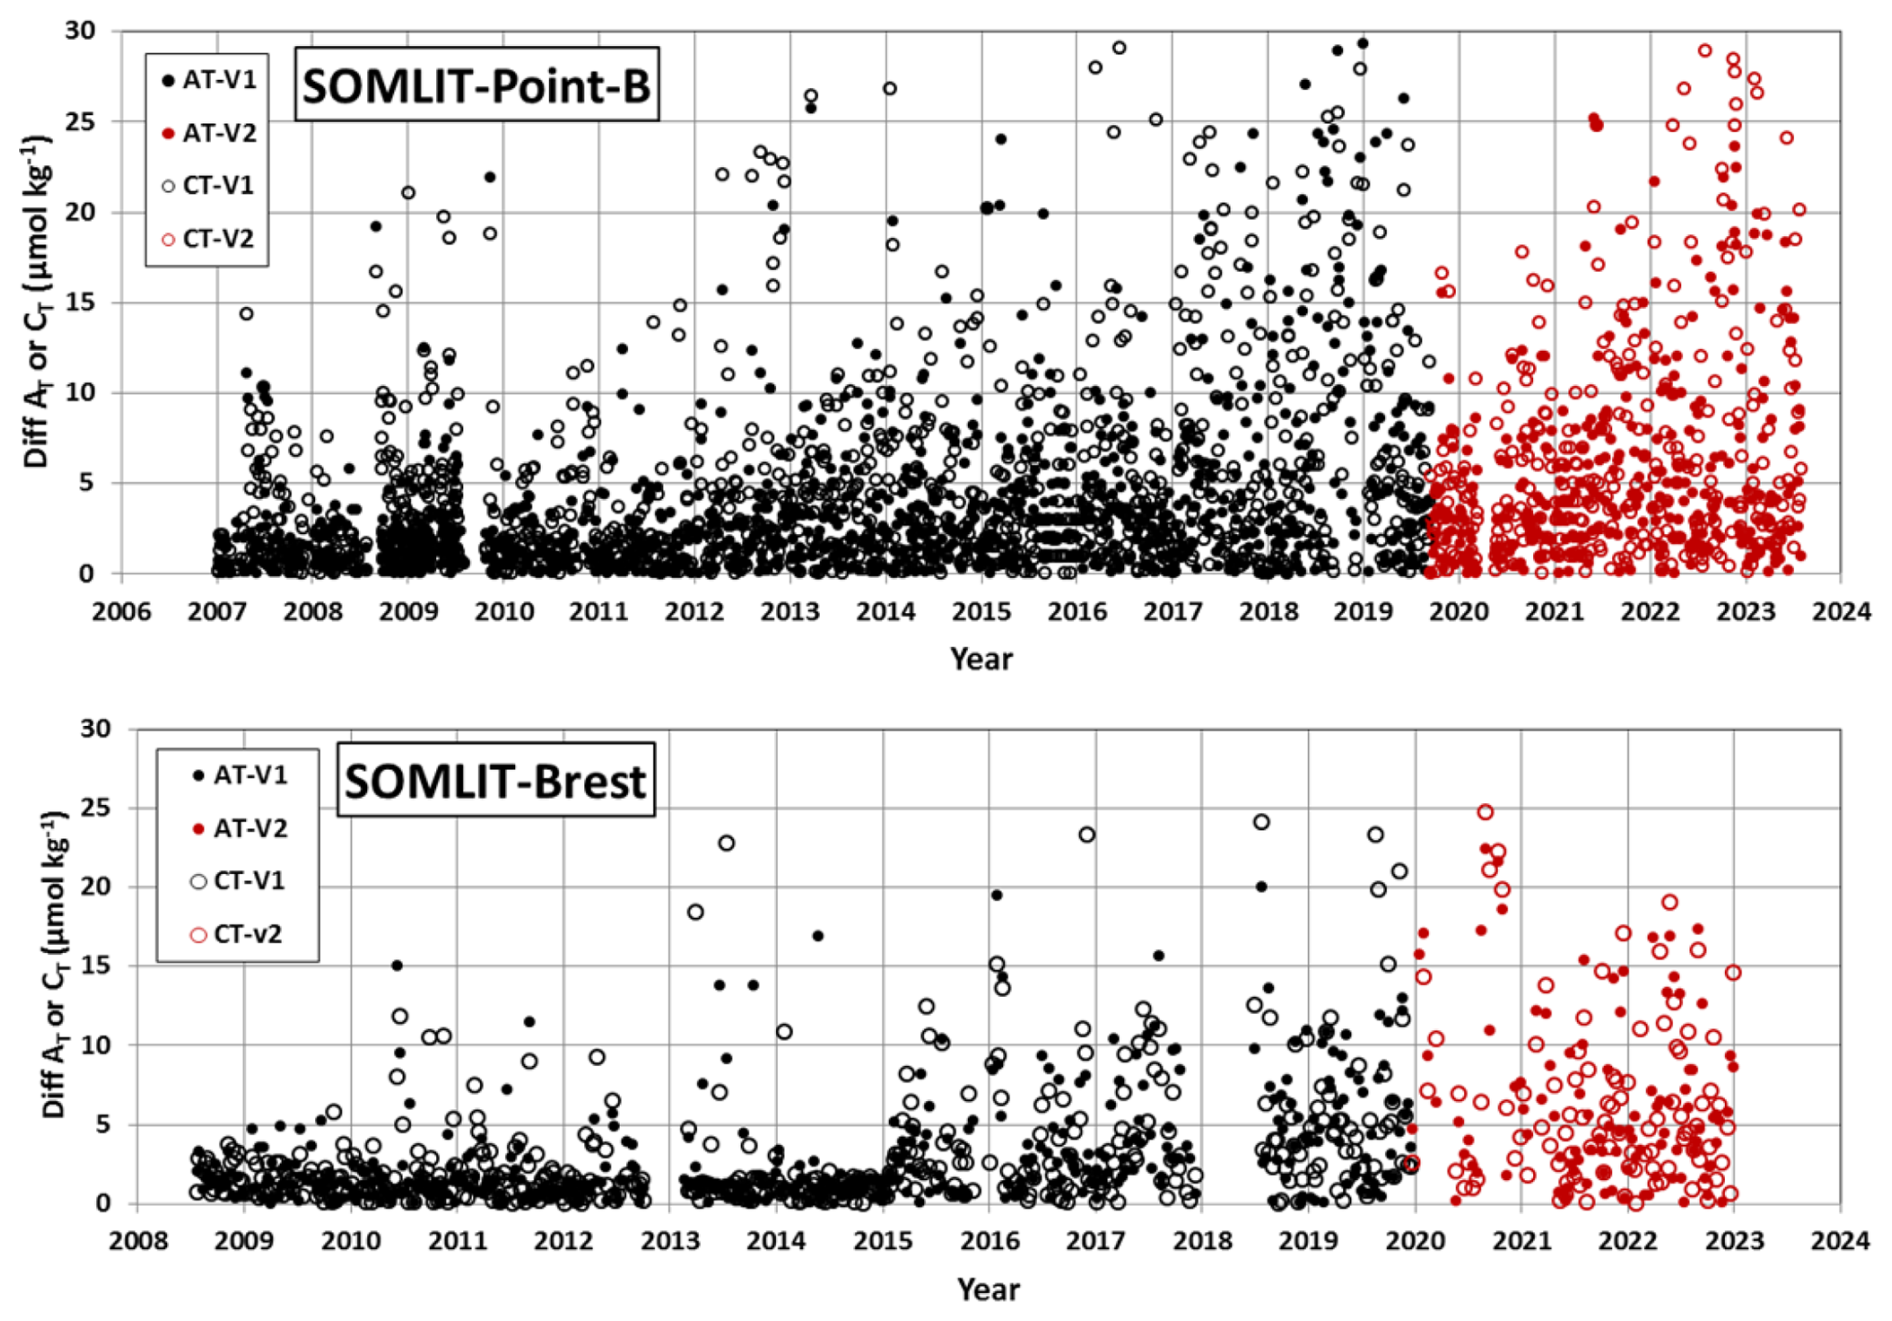
Figure 3Results of duplicate AT and CT analyses from the time series SOMLIT-Point-B in the coastal Mediterranean Sea and SOMLIT-Brest off the coast of Brittany for the data in the SNAPO-CO2-v1 dataset (black) and new data added to SNAPO-CO2-v2 (red). The plots show differences in duplicates for both AT (filled circles) and CT (open circles). Standard deviations of these duplicates are listed in Table 2.
Table 2Repeatability of AT and CT analyses for cruises with duplicate analysis. The results are expressed as the standard deviations (SDs) of the analysis of replicated samples. No. denotes the number of replicates for each time series or cruise. For the OISO cruises, the mean repeatability was obtained from measurements at the same location (when the ship stopped).
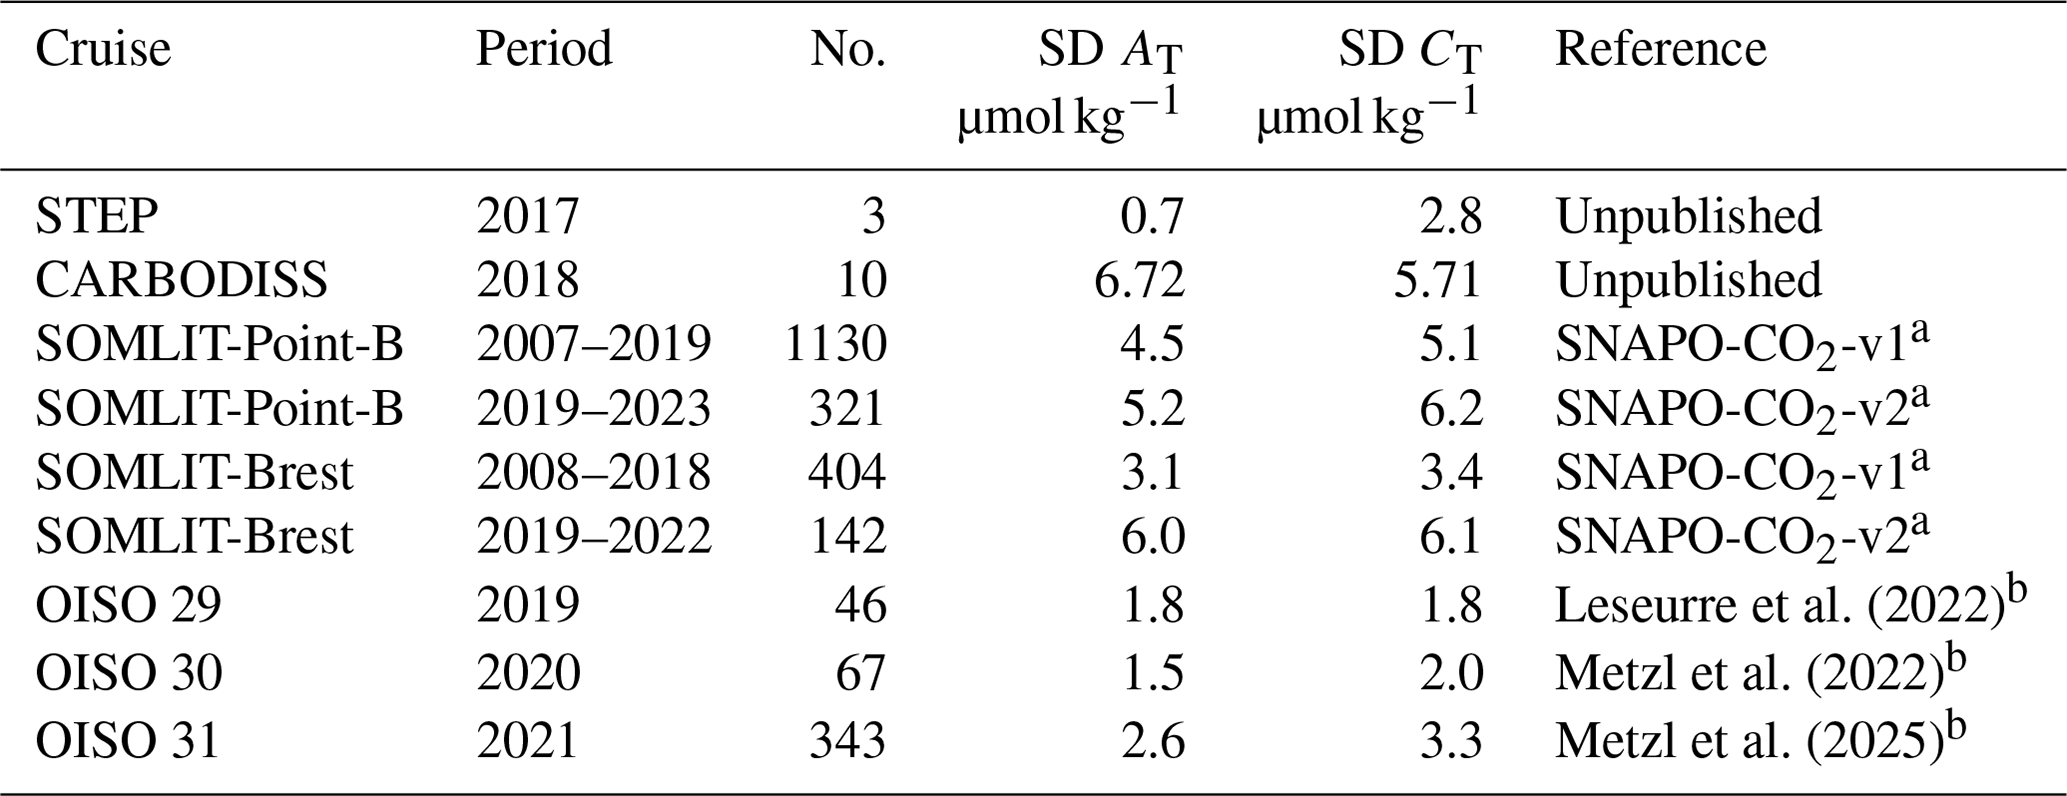
a See Fig. 3 for the results of regular duplicates for time series SOMLIT-Point-B and SOMLIT-Brest. b Metadata and data are available at https://www.nodc.noaa.gov/ocads/oceans/VOS_Program/OISO.html (last access: 22 January 2025).
3.3 Assigned flags for quality control
Identifying all data with an appropriate flag is very convenient for selecting the data (good, questionable, or bad). Here we used four flags for each property (flag 2 for good, 3 for questionable, 4 for bad, and 9 for no data) following the WOCE program and those used in other data products such as SOCAT (Bakker et al., 2016) and GLODAP (Olsen et al., 2016; Lauvset et al., 2024). During the data processing, we first assigned a flag for all AT and CT data based on the standard error in the calculation of AT and CT concentrations (nonlinear regression; Dickson et al. 2007). By default, if the standard deviation on the regression is > 1 µmol kg−1, we assigned flag 3 (questionable), although the data could be acceptable and then used for interpretations. Flag 3 was also assigned when salinity was doubtful or when differences in duplicates were large (e.g., ±20 µmol kg−1). Flag 4 (bad or certainly bad) was assigned when clear anomalies were detected for unknown reasons (e.g., a sample probably not fixed with HgCl2 or analysis performed late during COVID). A secondary quality control was performed by the PIs of each project based on data inspection, duplicates, the AT–salinity relationship, or the mean observations in deep layers where large variability in AT and CT is unlikely to occur from year to year.
An example of quality flag is presented for all data from the MINERVE cruises conducted in 2002–2018 in the Southern Ocean, where clear outliers have been identified (Fig. S3). For the MINERVE cruises in 2002–2018 and a total of 12 335 AT and CT analyses, 24 were identified as bad (flag 4), 978 for AT and 971 for CT were listed as questionable (flag 3), and all others are considered good data (flag 2, i.e., about 92 %). For the MOOSE-GE cruises in 2021, 2022, and 2023 (new data in SNAPO-CO2-v2) and a total of 1373 AT and CT analyses, 2 were identified as bad (flag 4), 38 for AT and 33 for CT were listed as questionable (flag 3), and all others were considered good data (flag 2, i.e., 97 %). This is better than the statistics we evaluated for the SNAPO-CO2-v1 dataset (90 % flag 2 for MOOSE-GE in 2010–2019). A similar control was performed for each project.
3.4 Intercomparisons
Intercomparisons of measurements performed for different cruises or with different techniques help to evaluate the quality of the data and detect potential biases when merging the data in the same region obtained by different laboratories at different periods. This is especially important to interpret long-term trends in AT and CT as well as for pCO2 and pH calculated with AT–CT pairs. The synthesis of various cruises in the same region and periods also offers verification and secondary control of the data.
3.4.1 Comparisons in deep layers
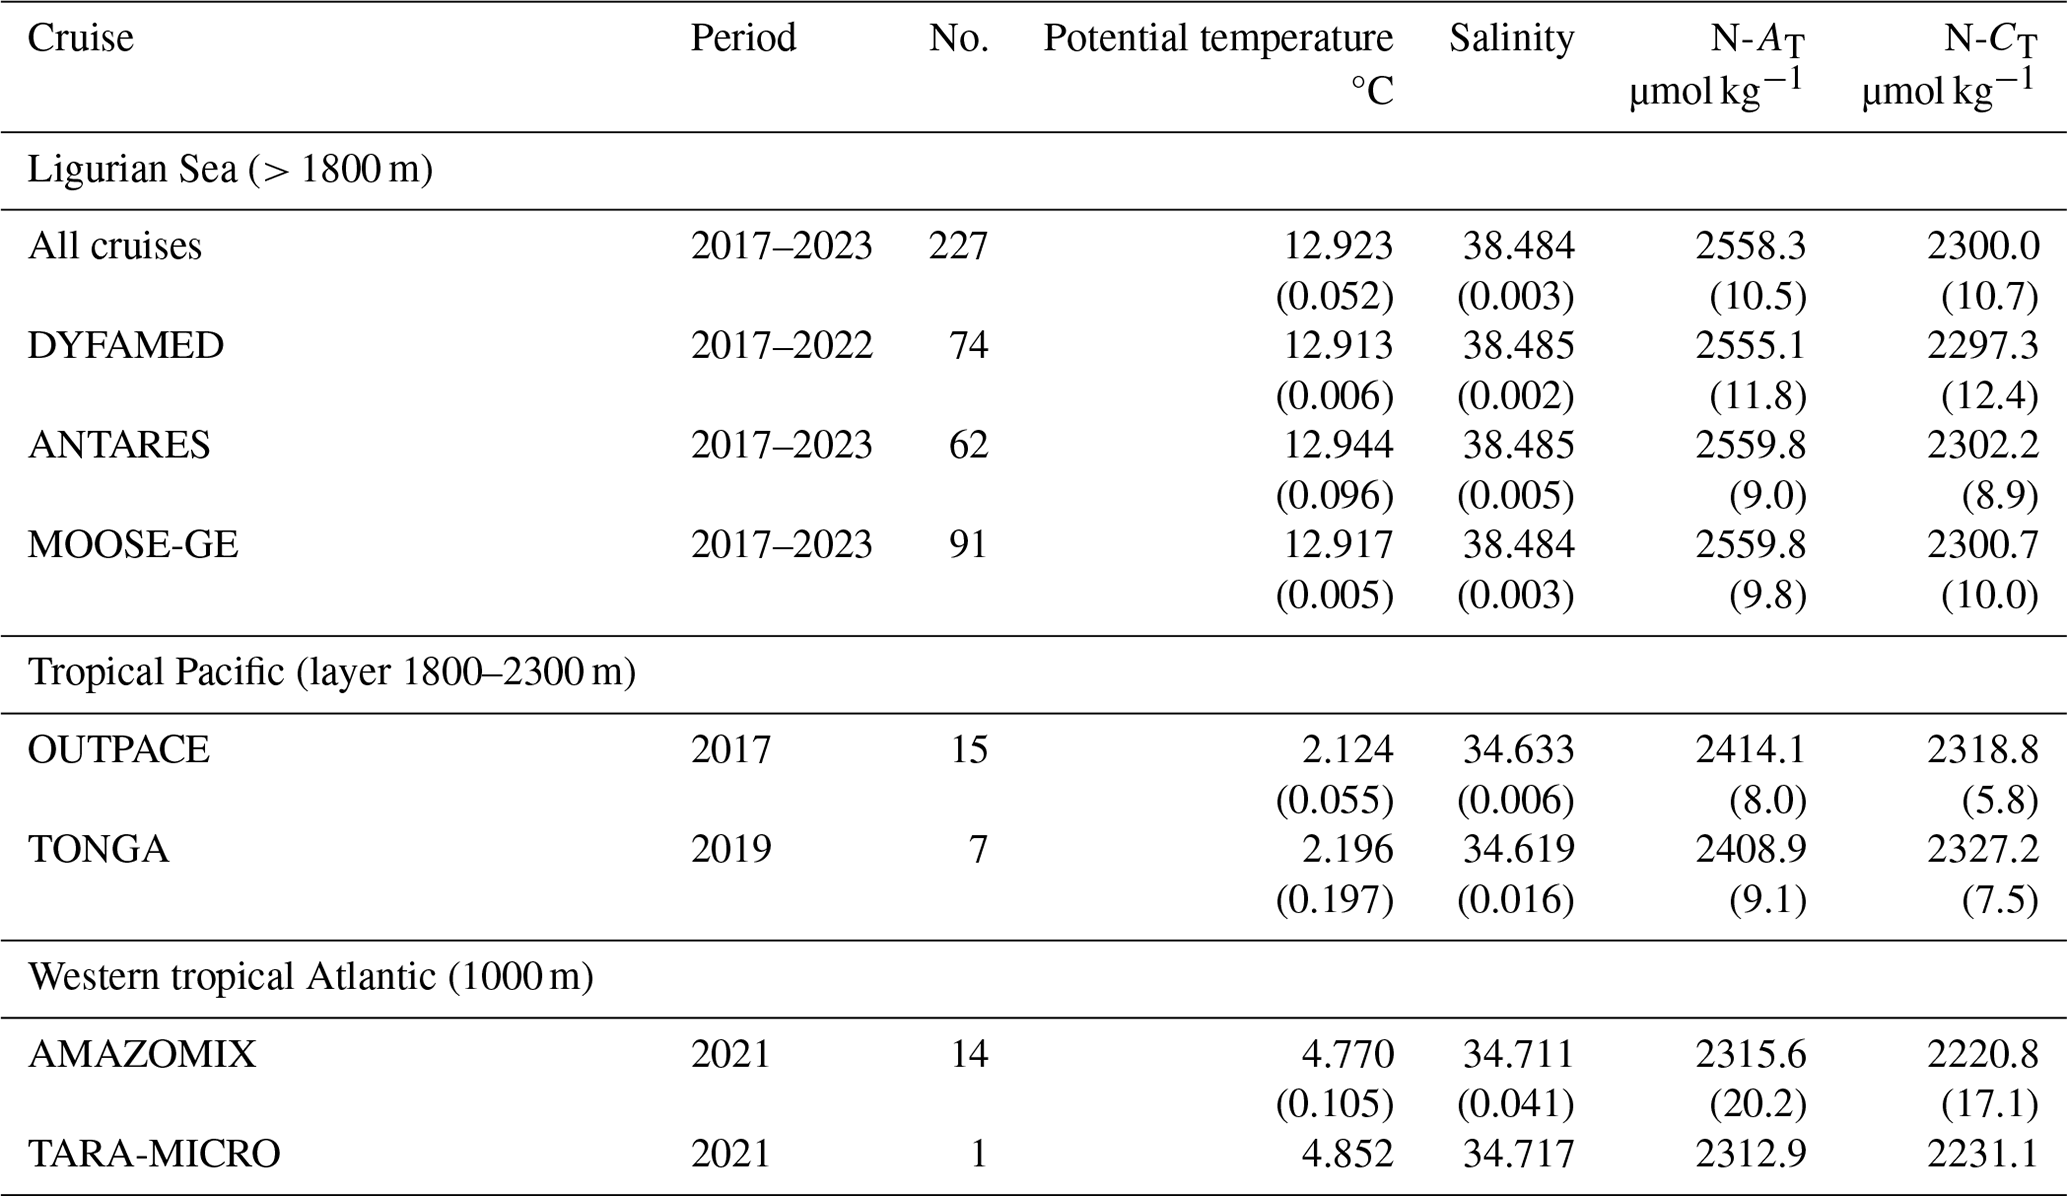
Comparisons of data in the deep layers from different cruises are useful for secondary quality control as one expects low natural variability or anthropogenic signals from season to season and over a few years. Several cruises were conducted in the Mediterranean Sea in 2017–2023 (MOOSE-GE, ANTARES and DYFAMED). The mean values of CT and AT in the deep layers (> 1800 m) for each cruise confirmed the coherence of the data (Table 3). The CT and AT concentrations are also in the range of the mean values evaluated for cruises conducted in 2014 in the Mediterranean Sea (results listed in the SNAPO-CO2-v1 synthesis; Metzl et al., 2024a). In the western tropical Pacific we also observed coherent properties for the TONGA and OUTPACE cruises (Wagener et al., 2018) for data selected at 1800–2300 m layer, corresponding to the CT maximum layer in the Pacific Deep Water (PDW). On the other hand in the western tropical Atlantic near the Amazon River plume, where the spatial variability in the properties is large at the surface (Ternon et al., 2000; Mu et al., 2021; Olivier et al., 2022), the comparison in the water column is less clear (Fig. S4). Nevertheless for the AMAZOMIX and the TARA-Microbiome cruises, both conducted in September 2021, the results at close stations (around 5° N, 50° W) suggest very similar concentrations at 1000 m (Table 3). The comparisons in deep waters enabled us to merge the different datasets for interpretation of the temporal trends and processes driving the CO2 cycle in these regions (e.g., Ulses et al., 2023, and Wimart-Rousseau et al., 2023, for the Mediterranean Sea).
Table 3Mean observations in the deep layers (> 1800 m) of the Ligurian Sea (western Mediterranean Sea for different cruises conducted in 2017–2023), of the tropical Pacific (around 2000 m for cruises in 2017 and 2019), and of the tropical Atlantic (around 1000 m for cruises in 2021). N-AT and N-CT are AT and CT normalized at salinity (S = 38 in the Ligurian Sea; S = 35 for the Pacific and the Atlantic oceans). No. denotes the number of data (with flag 2). Standard deviations are in brackets.
3.4.2 Comparing onboard and onshore results
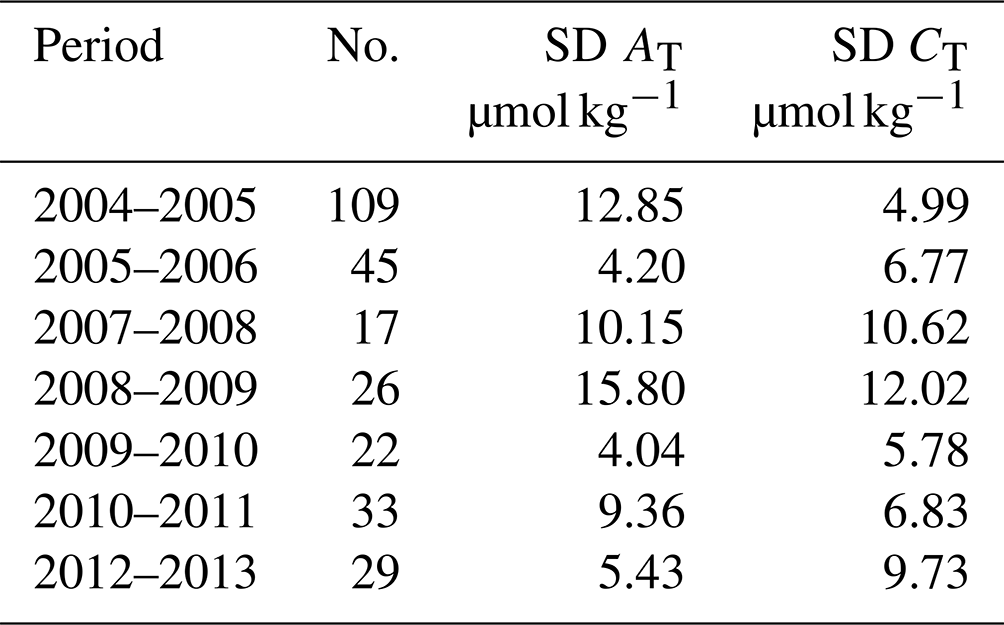
In surface waters where the variability is high, intercomparison is not relevant for secondary quality control. However, during the MINERVE cruises, discrete samples were occasionally performed along with sea surface underway measurements. Thus, we can compare AT and CT measured in the laboratory with those measured on board as described by Laika et al. (2009) for the MINERVE cruises in 2005–2006. It should be noticed that the discrete samples were measured after a long trip (shipping boxes from Hobart, Tasmania, to Paris, France) and thus generally analyzed at least 3 months after the cruises (cruises conducted in October to February, analyses performed in May–June). Given all the uncertainties associated with the sampling, sample storage and transport, analyses and CRMs, the mean differences between discrete and underway data are still reasonable (SDs ranging between 4 and 12 µmol kg−1; Table 4). For unknown reasons the mean difference was high for a cruise in 2008–2009 (SD > 10 µmol kg−1, the “weather goal”; Newton et al., 2015). With this in mind, we believe the MINERVE data (both underway and discrete data) are useful to interpret the change in properties in this region at seasonal or decadal scales (Laika et al., 2009; Brandon et al., 2022).
Table 4Comparison of AT and CT analyzed on board and at SNAPO-CO2 facilities for the MINERVE project. The results are expressed as the standard deviations (SDs) of the differences for each cruise. No. denotes the number of co-located samples.
3.4.3 Comparison based on different techniques
Another example of comparison is presented for samples obtained in the lagoon of the island of Mayotte in the western Indian Ocean and measured using different techniques. In the framework of the CARBODISS project, seawater was sampled in 2018–2023 at several coral reef sites within the northeastern part of the lagoon and measured either at the LOCEAN laboratory or at Réunion University. To remove coral sand particles, the water samples were immediately filtered through Whatman GF/F filters and poisoned with mercuric chloride, following Dickson et al. (2007). In 2021, 2022, and 2023, AT was measured at Réunion University using an automated potentiometric titration (905 Titrando Metrohm titrator with combined pH electrode 6.0253.00) and calculated from the second inflection point of the titration curve. The HCl concentration was checked each day of measurements using a CRM provided by Andrew Dickson, Scripps Institution of Oceanography. The AT precision of ±2 µmol kg−1 was based on triplicate analyses (Lagoutte et al., 2023). In the studied coral reef sites, AT concentrations ranged between 2250 and 2350 µmol kg−1 but with occasionally higher concentrations up to 2450–2500 µmol kg−1. Such high AT has been observed in other coral reef ecosystems (Cyronak et al., 2013, at the Cook Islands; Palacio-Castro et al., 2023, at Middle Keys, Florida). The data obtained in the lagoon of Mayotte on different coral reefs could be compared with underway observations obtained offshore of Mayotte (OISO-11 cruises in 2004 and CLIM-EPARSES cruise in 2019; data available in the SNAPO-CO2-v1 dataset). In the open ocean the AT concentrations ranged between 2250 and 2330 µmol kg−1, close to the results obtained at Mayotte reefs except for samples in November 2021 that were all collected at Cratère station (12.84° S, 45.39° E) (Fig. 4). At this location there was a large diurnal variation in November 2021 with AT increasing from 2322 to 2508 µmol kg−1 (Fig. S5). This is because in 2021 the samples were taken at low tide, allowing for the first time recording of the volcanic signal in this location (CO2 resurgences). In 2018 and 2019 such high AT values were not measured (Fig. S5) as samples were taken at high tides, allowing a certain dilution of volcanic CO2 emissions in the water column. Although the samples were measured with different techniques, the range of AT is coherent for both datasets (Fig. 4). Therefore, we added the AT data measured at Réunion University in 2021–2023 to complete the synthesis for this location (Mayotte).
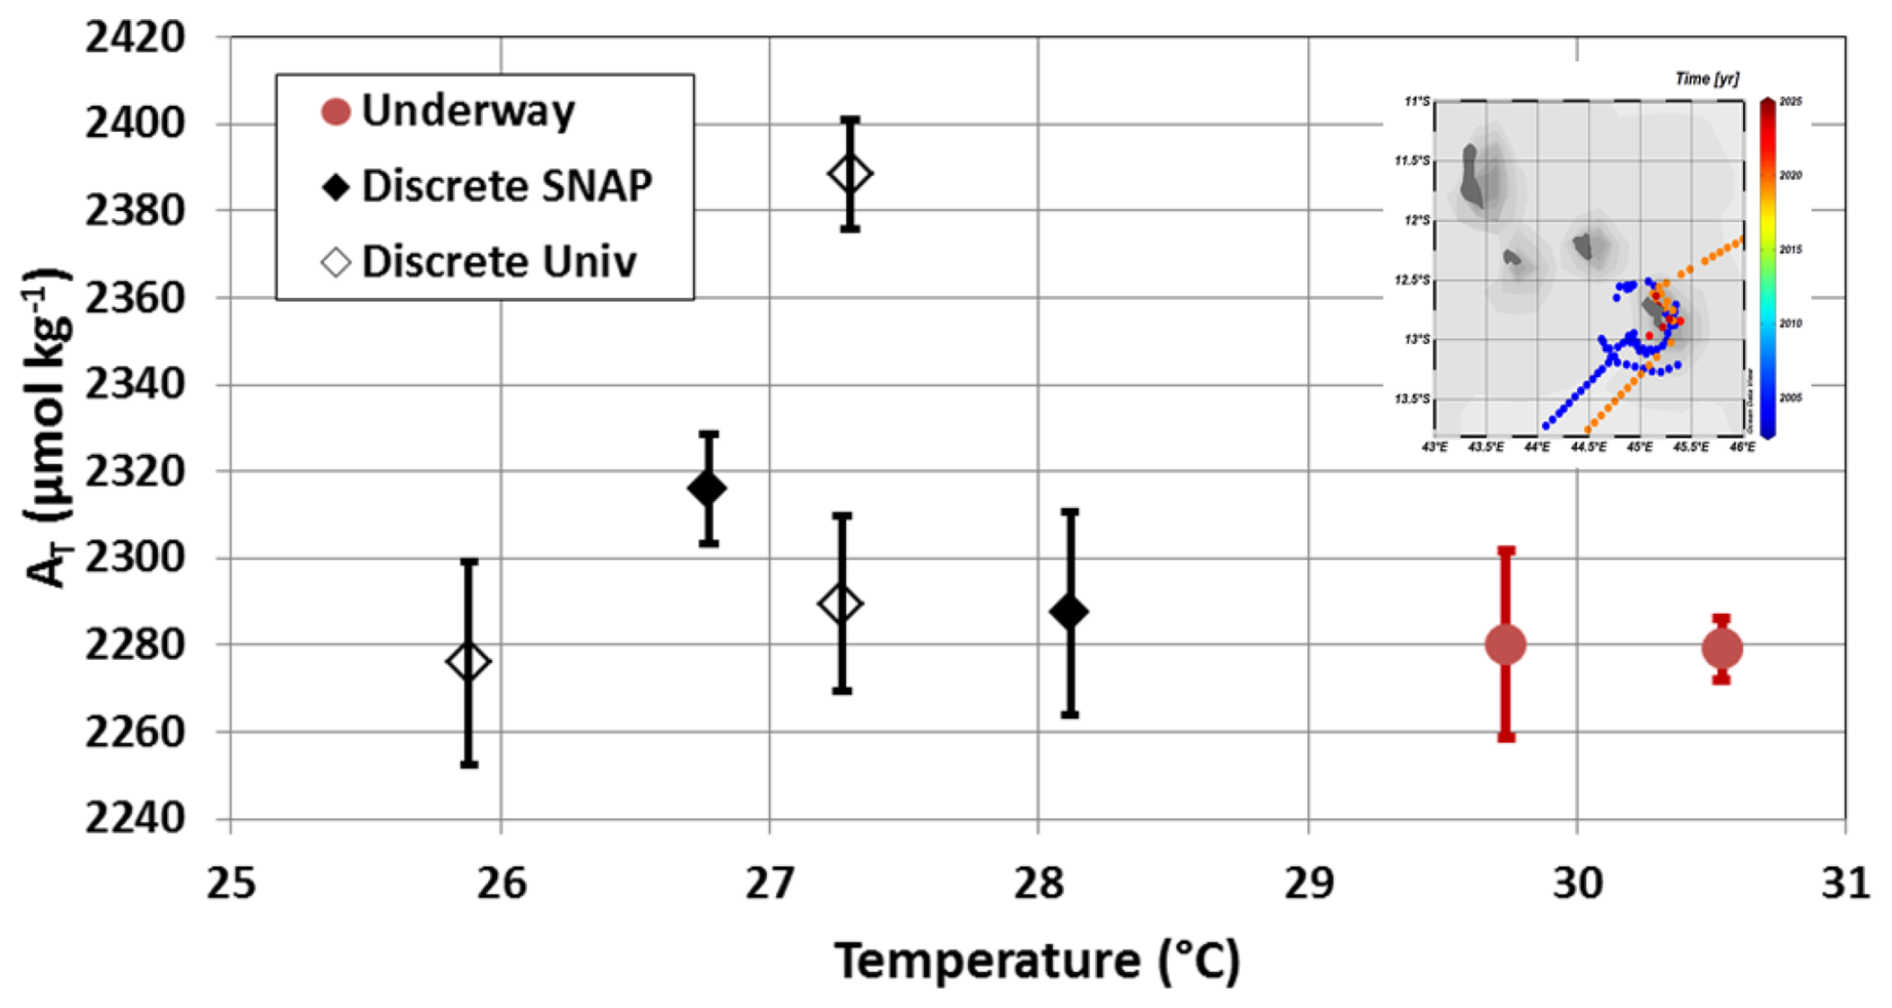
Figure 4Total alkalinity (AT) versus temperature for samples measured around Mayotte and in the coral reef (inset map). Underway AT was measured on board in 2004 and 2019 (red circles), whereas discrete samples at different reef sites within the lagoon of Mayotte in 2018, 2019, 2021, 2022, and 2023 were measured at LOCEAN (black diamonds) or at Réunion University (open diamonds). The figure presents the data averaged for each cruise in this region.
3.4.4 Summary of quality control data
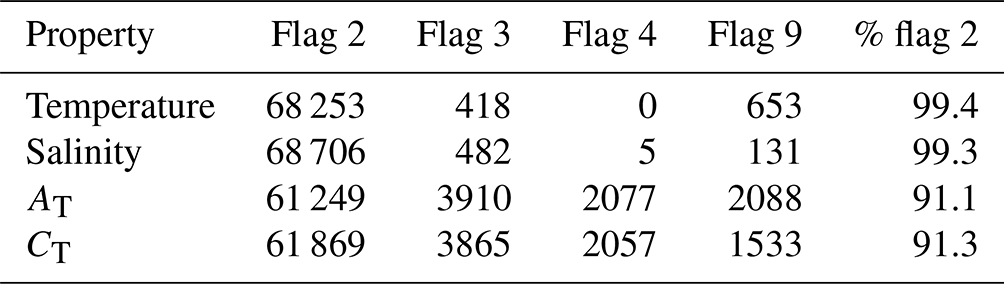
The total number of data in the SNAPO-CO2-v2 dataset for the global ocean is gathered in Table 5 with corresponding flags for each property. Overall, the synthesis includes more than 91 % of good data for both AT and CT. About 6 % are questionable, and 3 % are likely bad. Overall, we believe that all data (with flag 2) in this synthesis have an accuracy better than 4 µmol kg−1 for both AT and CT, the same as for quality-controlled data in GLODAP (Lauvset et al., 2024). The uncertainty ranges between the “climate goal” (2 µmol kg−1) and the “weather goal” (10 µmol kg−1) for ocean acidification studies (Newton et al., 2015; Tilbrook et al., 2019). This accuracy is also relevant to validate or constrain data-based methods that reconstruct AT and CT fields with an error of around 10–15 µmol kg−1 for both properties (Bittig et al., 2018; Broullón et al., 2019, 2020; Fourrier et al., 2020; Gregor and Gruber, 2021; Chau et al., 2024a).
Table 5Number of temperature, salinity, AT, and CT data in the SNAPO-CO2-v2 synthesis identified for flags 2 (good), 3 (questionable), 4 (bad), and 9 (no data). The last column is the percentage of flag 2 (good).
The surface distribution in the global ocean based on the SNAPO-CO2 dataset is presented in Fig. 5 for AT and CT. The AT–salinity and AT–CT relationships are clearly identified and structured at regional scale (Fig. 6). In the open ocean, high AT concentrations (> 2400 µmol kg−1) are identified in the Atlantic subtropics (bands 35–15° N and 25–3° S) (Jiang et al., 2014; Takahashi et al., 2014). The lowest AT and CT concentrations (< 600 µmol kg−1) are observed in the western tropical Atlantic in the Amazon River plume near the mouth (Lefèvre et al., 2017). For CT the concentrations are high (> 2150 µmol kg−1) in the Southern Ocean south of the polar front, associated with the deep mixing in winter and the upwelling of deep water (Metzl et al., 2006; Pardo et al., 2017). The highest CT concentrations (up to 2180–2270 µmol kg−1) are observed in the high latitudes of the Southern Ocean near the Adélie coastal zone (MINERVE and ACE cruises), around the Kerguelen Plateau (OISO-31 cruise) and close to the Antarctic Peninsula (TARA-Microbiome cruise). In the North Atlantic the new data from SURATLANT cruises in 2018–2023 confirm the high CT concentrations (> 2150 µmol kg−1) observed in the subpolar gyre since 2016 due in part to the accumulation of anthropogenic CO2 (Leseurre et al., 2020). Low CT concentrations (< 2000 µmol kg−1) are found in the tropics (10° N–30° S) with lower values (< 1950 µmol kg−1) in the equatorial Atlantic band 10° N to the Equator (e.g., Koffi et al., 2010; Lefèvre et al., 2021). In the Amazon shelf sector CT can reach even lower concentrations (< 1700 µmol kg−1, AMAZOMIX cruise).
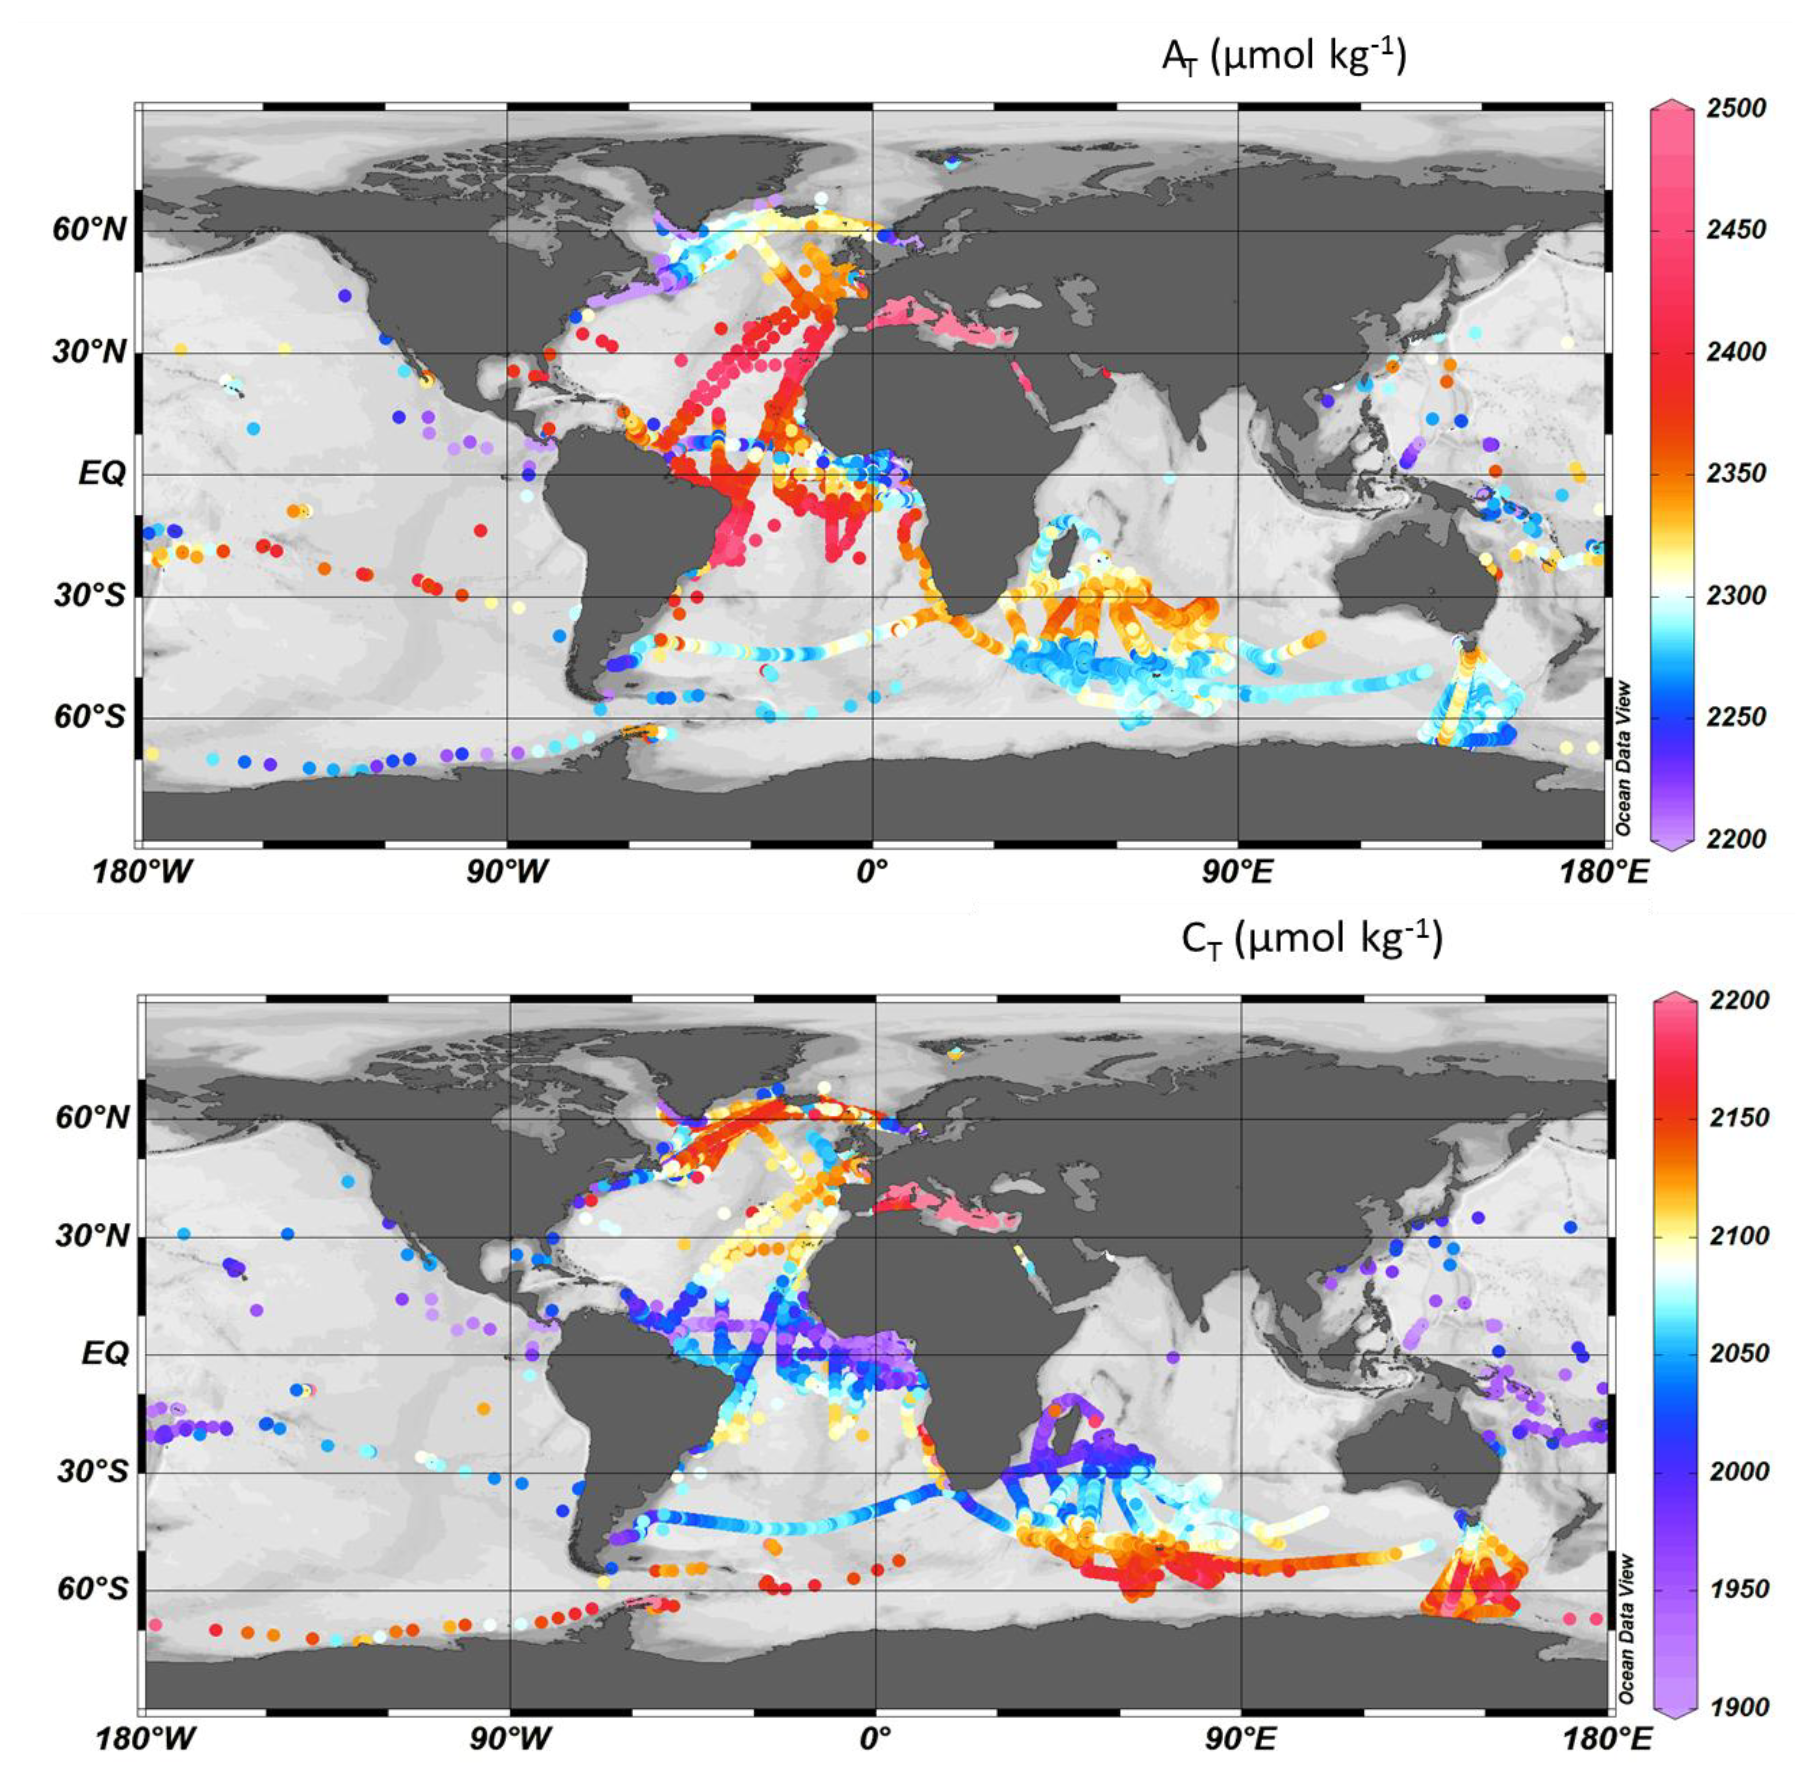
Figure 5Distribution of AT (top) and CT (bottom) concentrations (µmol kg−1) in surface waters (0–10 m) in the SNAPO-CO2-v2 dataset. Only data with flag 2 are presented in these figures. Figures produced with ODV (Schlitzer, 2018).
The regional distributions are described for the Mediterranean Sea and for selected regions in the open ocean and coastal zones, where the data are available for 10 years or more to explore the AT and CT trends. Given the observed seasonal and interannual variability and the fact that the time series were not regular (e.g., at monthly frequency), we cannot use recommended methods to estimate the trends (e.g., based on deseasoned data; Sutton et al., 2022). Here we have selected the locations and seasons where the CT trends can be linearly fitted and compared with no interpolation to fill gaps and discontinuous data (e.g., fewer samples during COVID).
5.1 The Mediterranean Sea
Compared to the open ocean, AT concentrations are much higher in the Mediterranean Sea (Copin-Montégut, 1993; Schneider et al., 2007; Álvarez et al., 2023) with values up to 2600 µmol kg−1. The AT and CT data obtained in 2014–2023 show a clear contrast between the northern and southern regions of the western Mediterranean Sea with higher concentrations in the Ligurian Sea and the Gulf of Lion (Fig. 7). This contrast is associated with the circulation and the frontal system in this region (e.g., Barral et al., 2021). New data in the coastal zones in the Gulf of Lion (ACCESS, DICASE, CARBODELTA, COCORICO2, MESURHOBENT) also have very high AT and CT concentrations (AT > 2600 µmol kg−1; CT > 2350 µmol kg−1). Very low AT and CT concentrations (AT < 2500 µmol kg−1; CT < 2200 µmol kg−1) were also occasionally observed in the coastal zones (COCORICO2 stations; Petton et al., 2024).
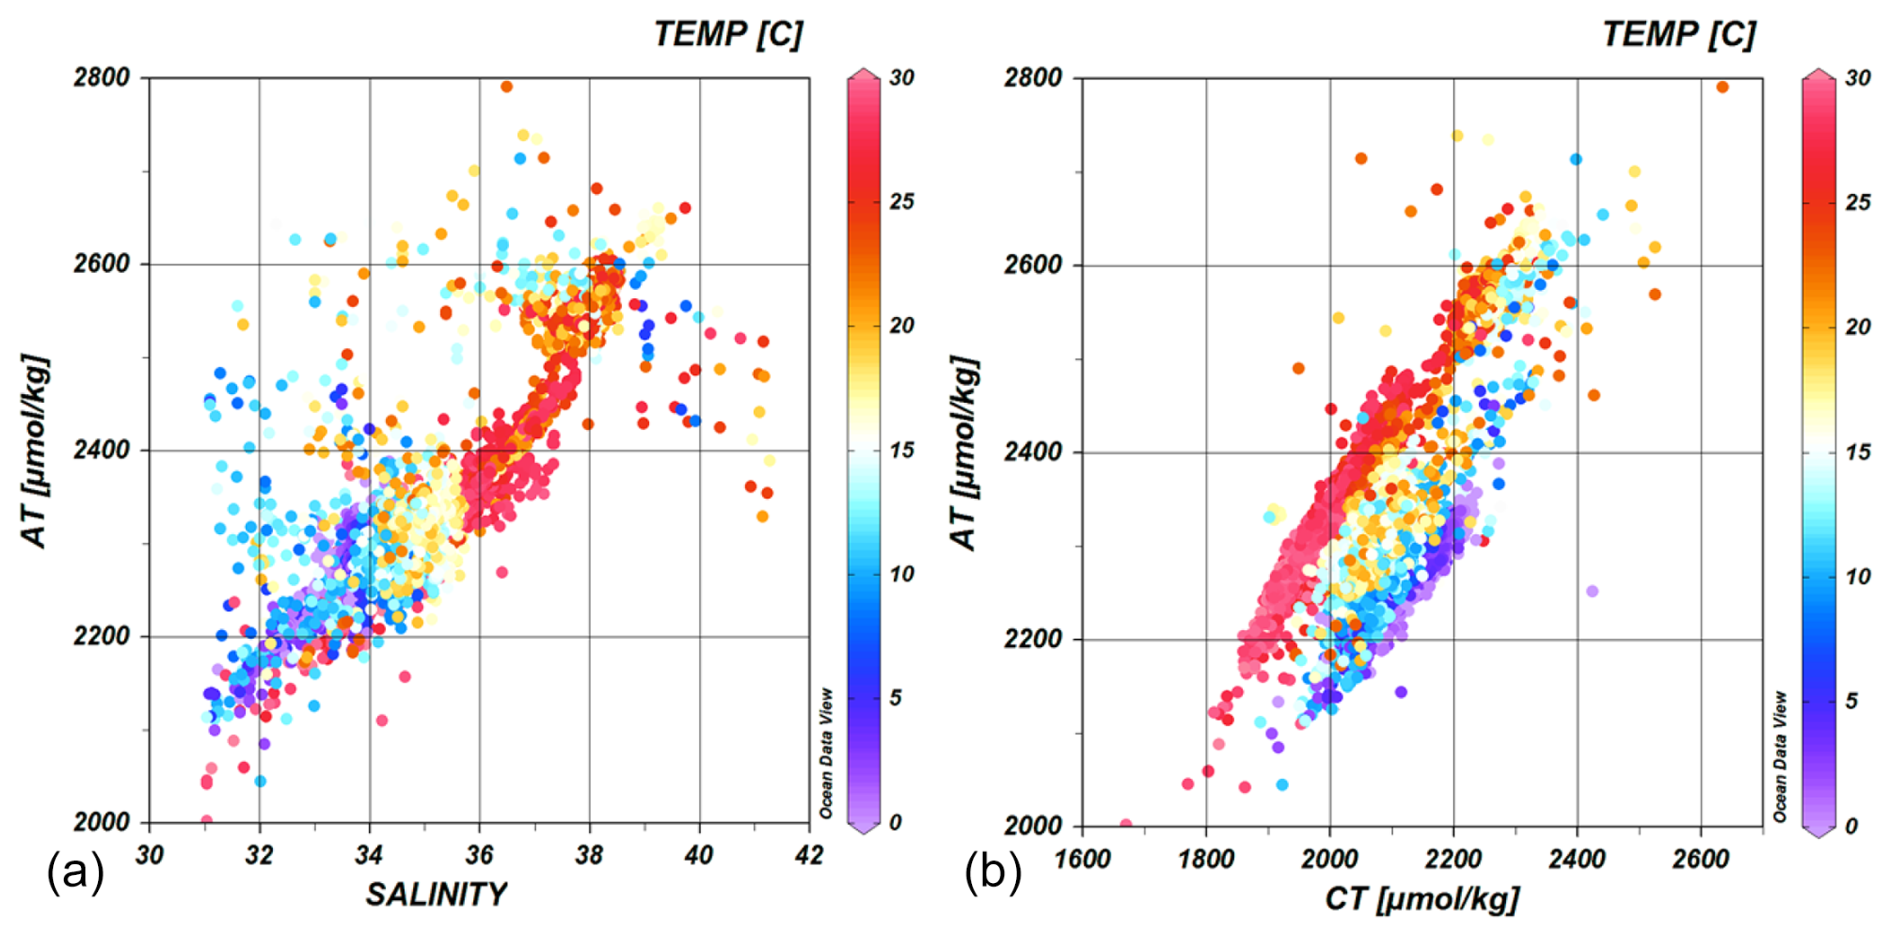
Figure 6Relationships between AT and salinity (a) and AT versus CT (b) for samples in surface waters (0–10 m and salinity > 31). Only data with flag 2 are presented (no. = 48 749). The color scales correspond to the temperature. The data not aligned correspond to coastal zones (e.g., COCORICO2 stations). Figures produced with ODV (Schlitzer, 2018).
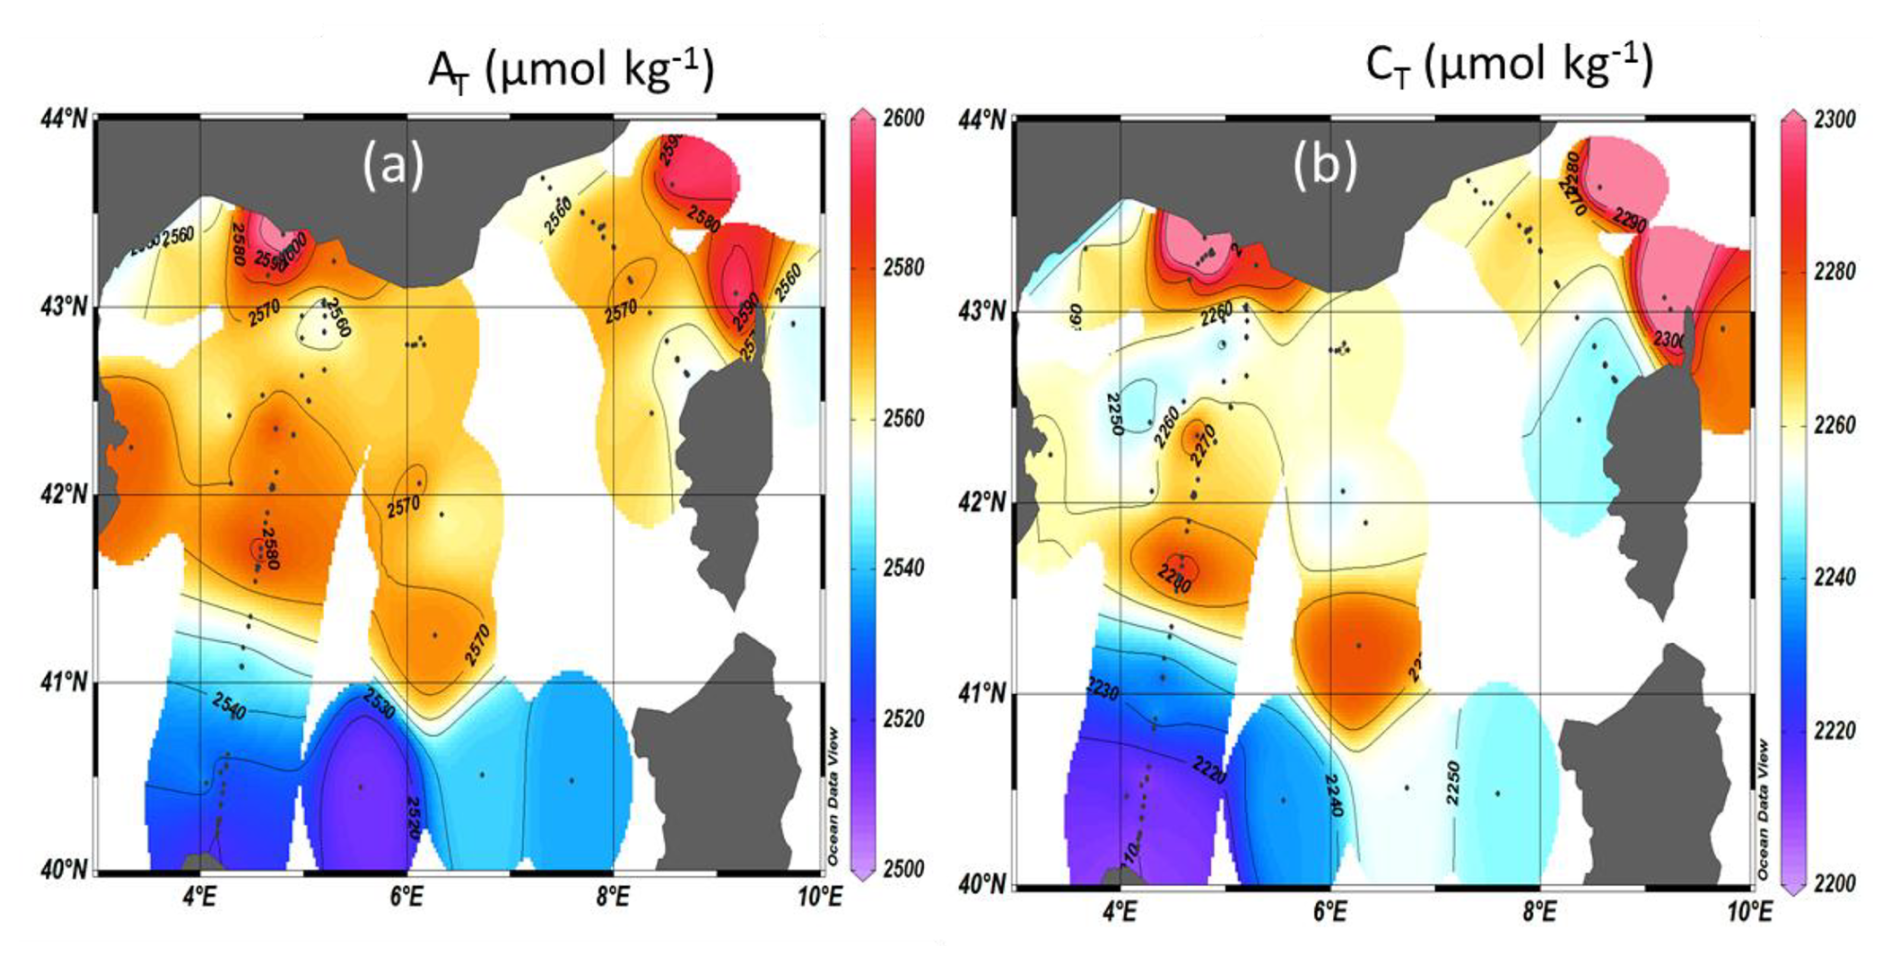
Figure 7Distribution of AT (a) and CT (b) in µmol kg−1 in surface waters of the Mediterranean Sea (0–10 m) from observations over 2014–2023. Figures produced with ODV (Schlitzer, 2018).
In summer 2022 the Mediterranean Sea experienced an exceptional warming (Fig. S6) superposed to the long-term warming in the ocean (Cheng et al., 2024). Such an event would impact the internal ocean processes such as thermodynamic, stratification, and biological processes (Coppola et al., 2023) and the interannual variability and trends in CT, pH, fCO2, and air–sea CO2 fluxes (Yao et al., 2016; Wimart-Rousseau et al., 2023; Chau et al., 2024b). As in 2003, the warming in summer 2022 was associated with the drought event that occurred in Europe and over the Mediterranean Sea (Faranda et al., 2023). In July 2022, the maximum temperature of 28.42 °C was observed at station SOMLIT-Point-B. In the Ligurian Sea the temperature trend has been faster in recent years: +0.173 ± 0.072 °C per decade over 1990–2010 and +0.678 ± 0.143 per decade over 2010–2023 (Fig. S6). With the new data added to the SNAPO-CO2-v2 synthesis (DYFAMED, MOOSE-ANTARES, and MOOSE-GE), we evaluated a temperature trend of +0.84 ± 0.20 °C per decade over 1998–2022, indicating that the discrete sampling captured the property changes at regional scale. Based on the data in the Ligurian Sea, the trends in CT appeared faster in summer (+1.53 ± 0.46 µmol kg−1 yr−1) than in winter (+0.94 ± 0.64 µmol kg−1 yr−1; Table 6). On the other hand, the trends in AT were the same (+0.72 ± 0.36 µmol kg−1 yr−1 in winter and +0.69 ± 0.42 µmol kg−1 yr−1 in summer). The trend in CT on the surface in winter was close to the one derived at 100 m (below the Chl a maximum), 1.10 ± 0.17 µmol kg−1 yr−1 (Fig. 8), whereas for AT the trend was the same at the surface and at depth (+0.76 ± 0.12 µmol kg−1 yr−1). This suggests that the winter CT data recorded the anthropogenic CO2 uptake of around +1 µmol kg−1 yr−1; Fig. S7). Note that, given the observed CT trends, the spatial view presented in Fig. 7b for 2014–2023 would be the same based on CT concentrations normalized to a reference year. As noted by Touratier and Goyet (2009), the CT concentrations in the Mediterranean Sea should increase in parallel with the level of atmospheric anthropogenic CO2. For an atmospheric CO2 rate of +2.16 ppm yr−1 over 1998–2023 (Lan et al., 2024) and at fixed sea surface temperature (17.75 °C), salinity (38.25), and AT (2567 µmol kg−1), the theoretical CT increase would be +1.24 µmol kg−1 yr−1. Interestingly, an anthropogenic flux of −0.3 ± 0.02 molC m−2 yr−1 in the Mediterranean Sea (Bourgeois et al., 2016) would correspond to an increase in CT of 1.07 ± 0.07 µmol kg−1 yr−1 in the top 100 m. This is again close to what is observed in winter or at 100 m (Table 6, Fig. 8). On the other hand the faster CT trend observed in surface waters during summer might be associated with a decrease in biological production and/or changes in circulation/mixing over time that deserve specific investigations, such as an analysis of the oxygen budget in this region (Ulses et al., 2021). It is worth noting that the CT and AT trends in coastal zones of the Mediterranean Sea are the opposite of those observed offshore: for example at station SOLEMIO (Bay of Marseille; Wimart-Rousseau et al., 2020), the CT and AT concentrations decreased over 2016–2022 and thus opposed the anthropogenic CO2 signal, indicating that processes such as riverine inputs, advection, and biology control the carbonate system decadal variability at local scale. This calls for developing dedicated complex biogeochemical models to resolve these processes (Barré et al., 2023, 2024), especially when extreme events occur, such as the very hot summer in 2024 with sea surface temperature (SST) up to 30 °C in the Mediterranean Sea (platform buoy and/or mooring AZUR, EOL, and La Revellata, data available at https://dataselection.coriolis.eu.org/, last access: 11 October 2024). The data obtained in the Mediterranean Sea are important not only to validate biogeochemical models but also to reconstruct the carbonate system from AT and pCO2 data (Chau et al., 2024a) as the global AT–sea surface salinity (SSS) relationships (e.g., Carter et al., 2018) are not suitable for this region.
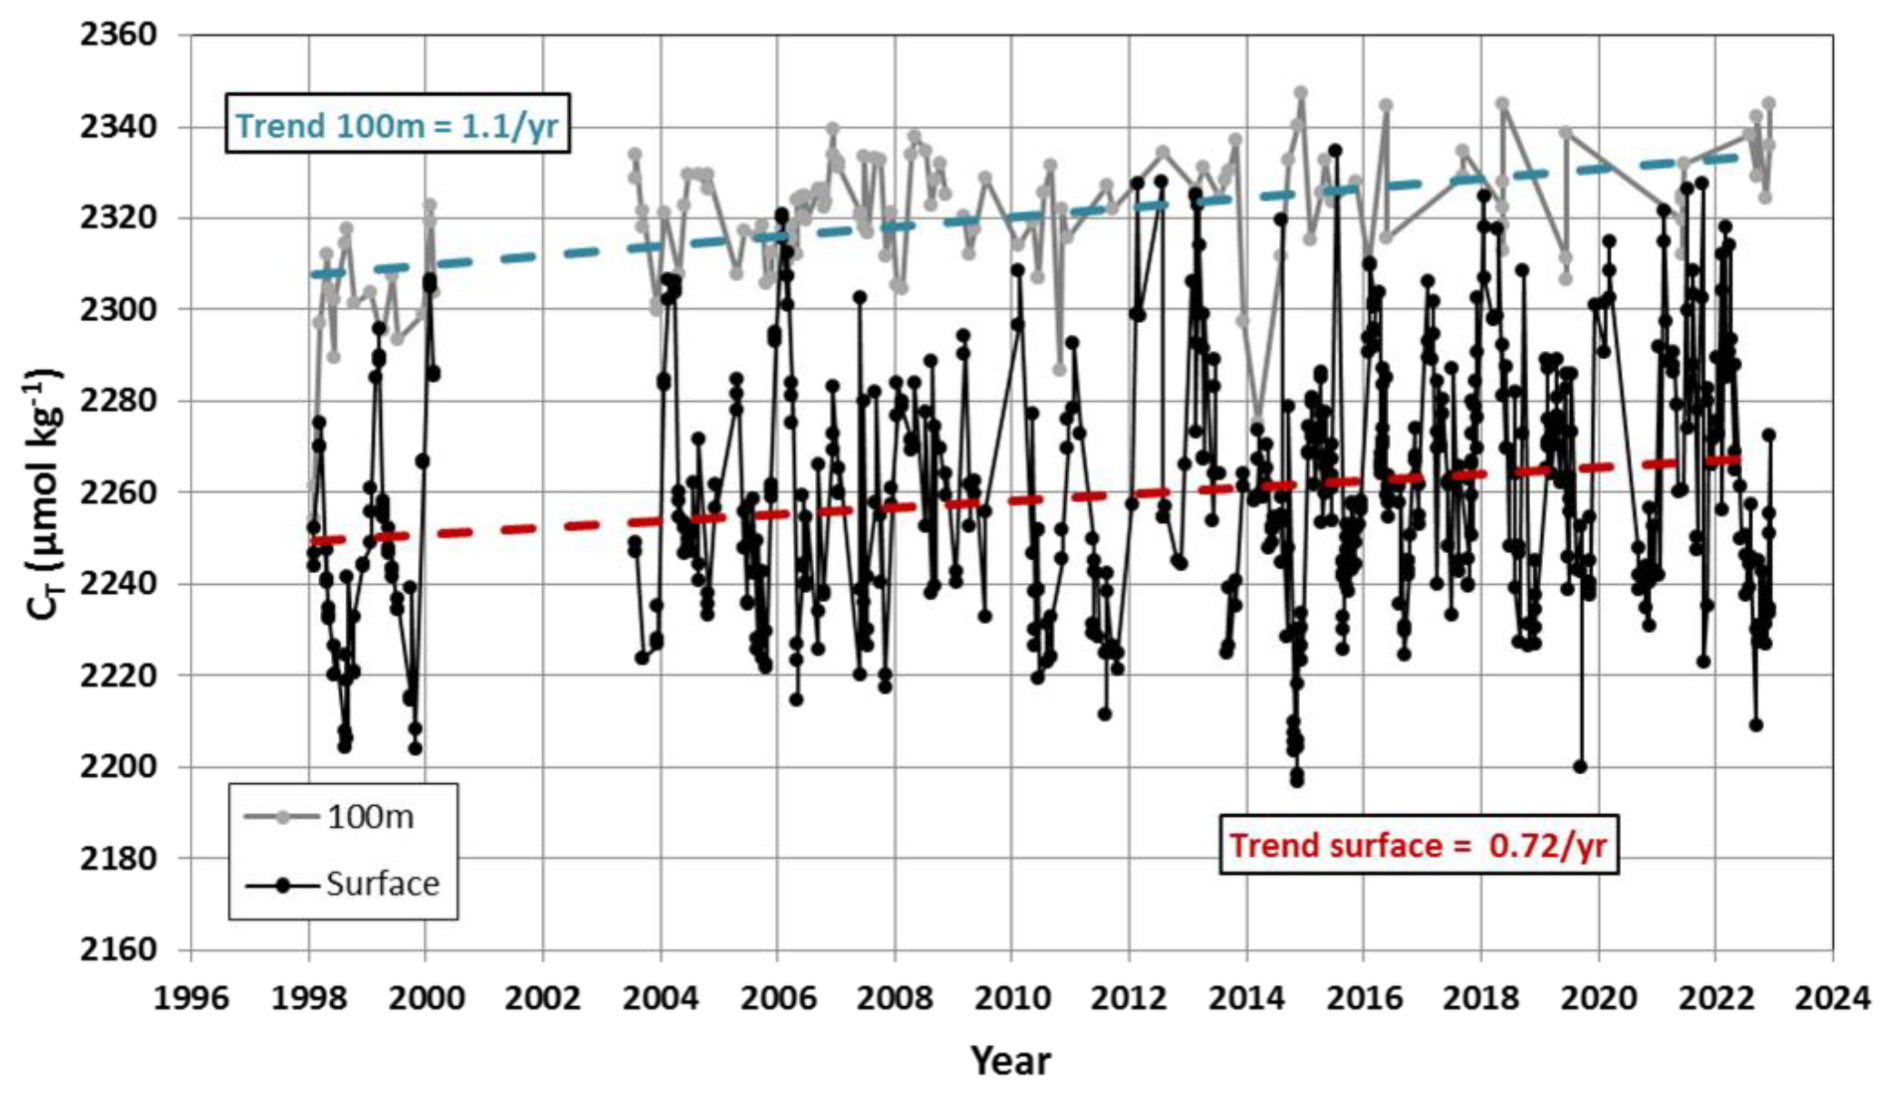
Figure 8Time series of CT concentrations at the surface (black symbols) and at 100 m (grey symbols) in the Ligurian Sea. The trends over 1998–2022 at the surface (red) and at 100 m (blue) are indicated by dashed lines.
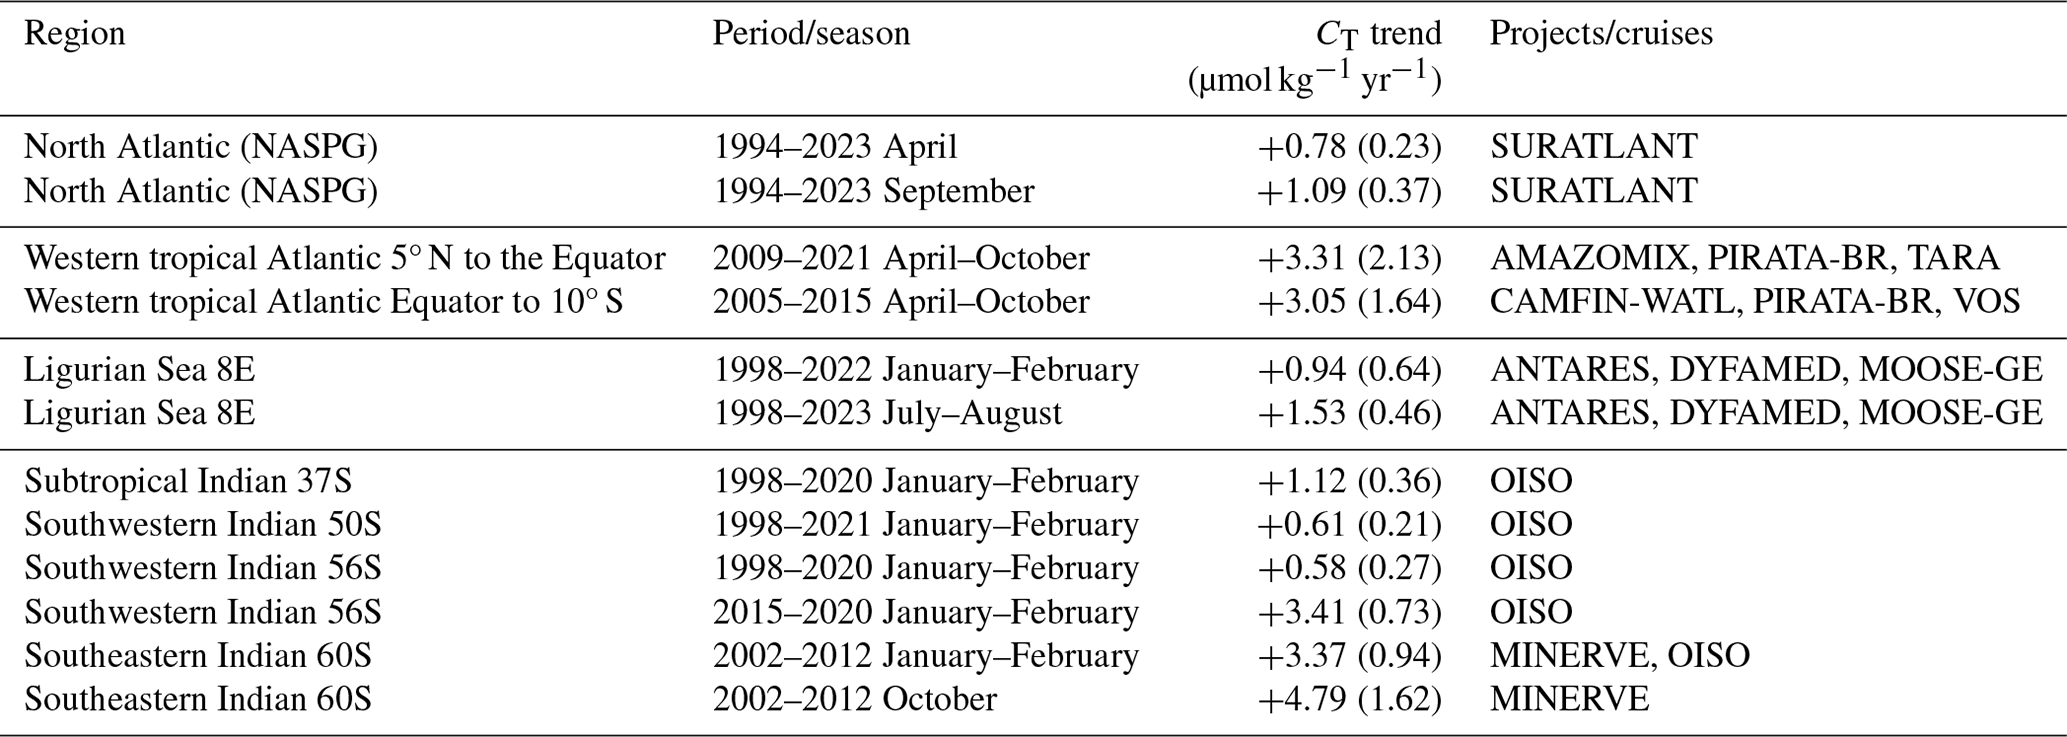
Table 6Trend in CT (µmol kg−1 yr−1) and corresponding standard error in selected regions where data are available for more than 10 years. The projects/cruises for the selection of the data in each domain are indicated.
5.2 The North Atlantic
The North Atlantic Ocean is an important CO2 sink (Takahashi et al., 2009) due to biological activity during summer and heat loss and deep convection during winter. As a result this region contains high concentrations of anthropogenic CO2 (Cant) in the water column (Khatiwala et al., 2013). Decadal variations in the Cant inventories were recently identified at basin scale, probably linked to the change in the overturning circulation (Gruber et al., 2019; Müller et al., 2023; Pérez et al., 2024). This region experienced climate modes such as the North Atlantic Oscillation (NAO) and the Atlantic Multidecadal Variability (AMV) that imprint variability in air–sea CO2 fluxes at interannual to multidecadal scales (e.g., Thomas et al., 2008; Jing et al., 2019; Landschützer et al., 2019) but not always clearly revealed at regional scale (Metzl et al., 2010; Schuster et al., 2013; Pérez et al., 2024). In addition it has been recently shown that extreme events such as the marine heat wave in summer 2023 led to a reduce CO2 uptake in this region (Chau et al., 2024b). Although the annual CO2 fluxes deduced from global ocean biogeochemical models (GOBMs) seem coherent with the data products at basin scale (−0.30 ± 0.07 and −0.24 ± 0.03 PgC yr−1 for the North Atlantic subpolar seasonally stratified, NA-SPSS biome), the pCO2 cycle seasonality is not well simulated (Pérez et al., 2024). Therefore to correct the GOBMs outputs, comparisons with the observed CT and AT cycles are also needed.
In this context regular sampling in the North Atlantic (OVIDE cruises, Mercier et al., 2015, 2024; SURATLANT transects, Reverdin et al., 2018) and time-series stations in the Irminger and Iceland seas (Olafsson et al., 2010; Lange et al., 2024; Yoder et al., 2024) are important to explore the variability in the biogeochemical properties from seasonal (Fig. S8) to decadal scales (Fig. 9). The SURATLANT data added to the SNAPO-CO2-v2 dataset over 2017–2023 offer new observations in the North Atlantic Subpolar Gyre (NASPG in the NA-SPSS biome) and new transects from Norway to Iceland and reaching the coast of Greenland (Fig. 9). In 2010 the winter NAO was negative, moved to a positive state in 2012–2020, and was again very low in 2021. The new SURATLANT data after 2017 confirm the cooling and the freshening in the NASPG since 2009 (Holliday et al., 2020; Leseurre et al., 2020; Siddiqui et al., 2024), whereas the most recent data in 2022 and 2023 suggest a reverse trend (increase in salinity and temperature; Fig. S8). After 2016, large CT anomalies in the NASPG were observed. For example, in April 2019 and 2022, the CT concentrations were low compared to 2016 (Fig. 9) and opposed to the expected anthropogenic CO2 uptake. In September 2023 the CT concentrations were much lower than in 2022 (Fig. 9), probably linked to biological productivity when the NAO index was negative (Fröb et al., 2019), as observed in summer 2023 (NAO < −2 in July 2023). Despite this variability the CT trends are relatively well evaluated (Table 6). As in the Mediterranean Sea the CT trends in the NASPG appeared to be different depending on the season (Fig. 9). The CT increase was faster in September than in April (+1.09 ± 0.37 µmol kg−1 yr−1 and +0.78 ± 0.23 µmol kg−1 yr−1). This is either close to or lower than the theoretical CT increase due to the rise of atmospheric CO2 (+0.91 µmol kg−1 yr−1) and in the range of recent results evaluated for the subpolar mode waters in the Irminger Sea (Cant trend = 0.95 ± 0.17 µmol kg−1 yr−1 for the period 2009–2019; Curbelo-Hernández et al., 2024).
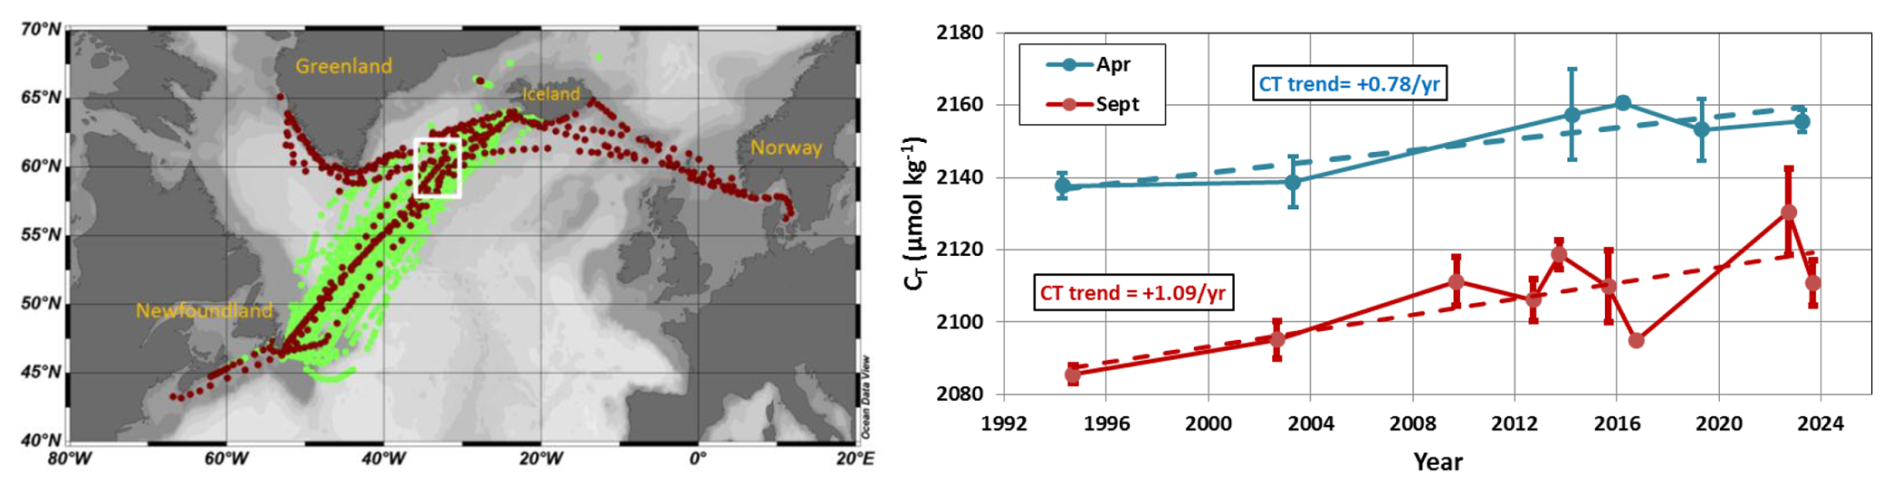
Figure 9On the left are data from SNAPO-CO2-v1 (green) and new data in v2 (brown) from the SURATLANT cruises in 1993–2023 in the North Atlantic. Figure produced with ODV (Schlitzer, 2018). The white box identifies the region of selected data around 60° N for the trend analysis. On the right are time series of average CT concentrations in April (blue) and September (red) in this region. The trends for each season are indicated (see also Table 6).
5.3 The tropical Atlantic
In the tropical Atlantic, previous studies highlighted the large variability of biogeochemistry and the difficulty in detecting long-term trends in CT (e.g., Lefèvre et al., 2021). This is related to the variability of circulation, equatorial upwelling, biological processes (some linked to Saharan dust), and inputs from large rivers (Congo, Amazon, and Orinoco). The new data added to version SNAPO-CO2-v2 (Fig. S9) show the contrasting zonal CT distribution in this region with lower concentrations in low-salinity regions of the North Equatorial Counter Current and Guinea Current (Fig. 5; Oudot et al., 1995; Takahashi et al., 2014; Broullón et al., 2020; Bonou et al., 2022). For exploring the temporal changes, we selected the data in the western region, available for at least 10 years, and separated them into the northern and southern sectors. In both regions the CT trend is close to +3 µmol kg−1 yr−1 (Table 6, Fig. S9), much higher than the excepted anthropogenic signal. In this region where coastal water masses mix with oceanic waters, the interannual variability in CT is large and the changes driven by competitive processes (circulation, biological processes). More observations and dedicated models are needed to separate the anthropogenic and natural variability in this region (Pérez et al., 2024).
5.4 The Southern Ocean
In the Southern Ocean there are a few regular multiannual observations of the carbonate system. Time series of more than 10 years were obtained in the Drake Passage (Munro et al., 2015) and in the southern Indian Ocean (Leseurre et al., 2022; Metzl et al., 2024b). Observations were also obtained for more than 20 years southeast of New Zealand from the Munida Time Series (MTS) in the subtropical and sub-Antarctic frontal zones (Currie et al., 2011; Vance et al., 2024). To complement these datasets we have added the data collected in the southeastern Indian Ocean between Tasmania and Antarctica in the framework of the MINERVE cruises (Fig. 10; Brandon et al., 2022). These cruises were conducted from October to March, offering each year a view of the seasonal changes between late winter and summer from the sub-Antarctic zone to the coastal zone near Antarctica (Adélie Land). In all sectors (here from 45 to 67° S), the CT concentrations were higher in October when the mixed-layer depth (MLD) was deep and were lower during the productive summer season (e.g., Laika et al., 2009; Shadwick et al., 2015). An example is presented at 60° S, 151° E from the data obtained along a reoccupied track in 2011–2012 (Fig. S10). At this location south of the polar front in the POOZ/HNLC area (permanent open ocean zone/high-nutrient low-chlorophyll area ), the CT concentrations were +25 µmol kg−1 higher in October compared to February. The same seasonal amplitude was observed in the western Indian sector of the POOZ (Metzl et al., 2006, 2024b), suggesting that the CT seasonality is relatively homogeneous in this region, corresponding to the Indian SO–SPSS biome (Fay and McKinley, 2014). The difference in the climatological CT between October and January is on average +28.3 ± 9.8 µmol kg−1 in the Indian Ocean POOZ (Takahashi et al., 2014). Given this seasonality and potential change in the seasonal amplitude over time (Gallego et al., 2018; Landschützer et al., 2018; Shadwick et al., 2023), the property trends have to be evaluated for October and January–February separately, here over 2002–2012 in the POOZ (Fig. 10, Table 6). In both seasons, the average CT concentrations reached a minimum in 2008 and increased faster in 2008–2012 (up to +4.8 µmol kg−1 yr−1). Interestingly, such an acceleration of the trend after 2009 was observed for pCO2 at the MTS station (Vance et al., 2024). We note that the CT trend over 2002–2012 was slightly faster in October (Fig. 10), probably linked to deeper MLD, as suggested from the cooling and the salinity increase observed during this season (Fig. S10).
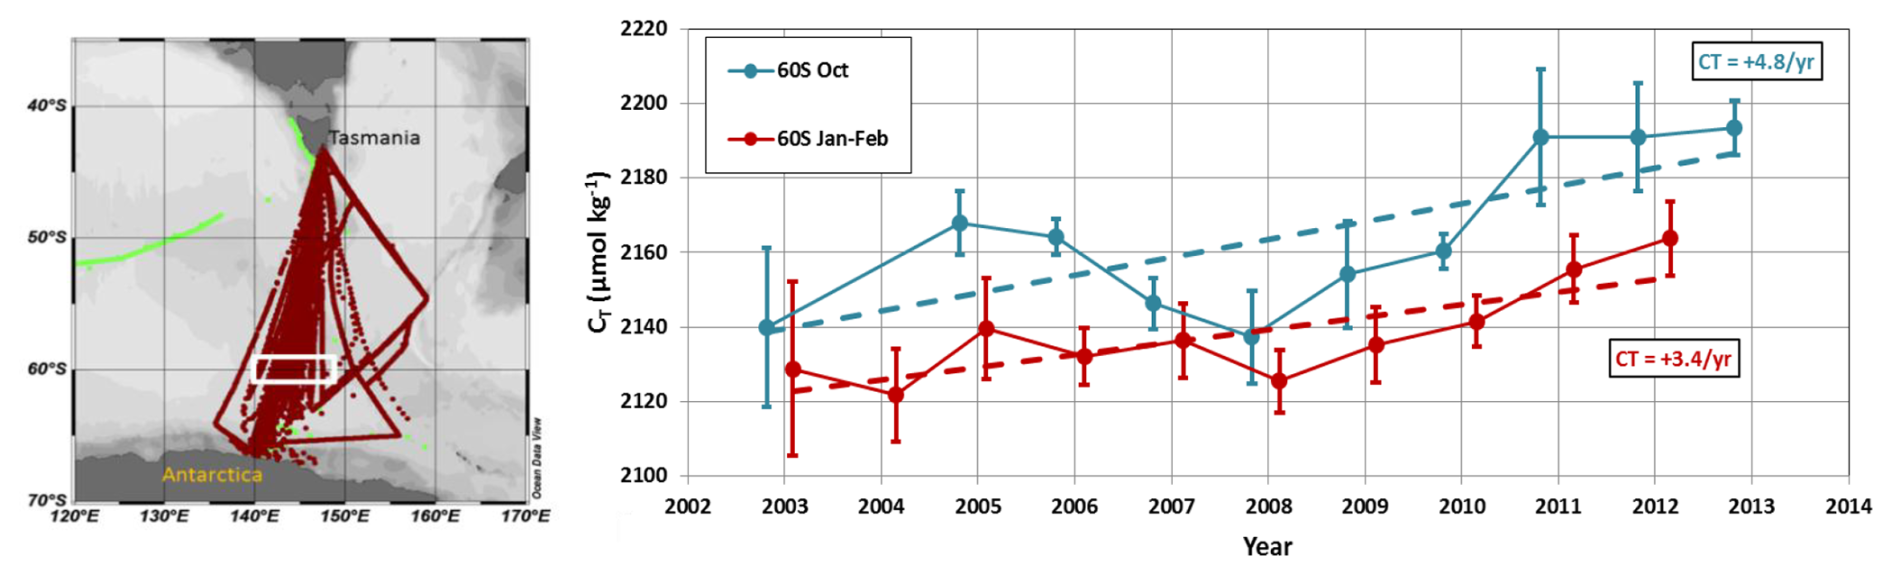
Figure 10On the left are data from the SNAPO-CO2-v1 dataset (green) and new data in version v2 (brown) in the southeastern Indian Ocean. Figure produced with ODV (Schlitzer, 2018). The white box identifies the region of selected data around 60° S for the trend analysis. On the right are time series of average CT concentrations in January–February (red) and October (blue) around 60° S (white box in the map). The trends for each season are indicated (see also Table 6).
In the western Indian sector, the new data in the SNAPO-CO2-v2 dataset from the OISO cruises at high latitudes also recorded a rapid CT trend over 5–8-year periods (e.g., +3.4 µmol kg−1 yr−1 in 2015–2020 at 56° S; Fig. 11, Table 6). Although the interannual variability in CT, between 10 and 20 µmol kg−1, is often recognized (Fig. 11), the evaluation of the trends over more than 20 years indicated a faster trend in the subtropical Indian Ocean (+1.1 µmol kg−1 yr−1) compared to higher latitudes (Indian POOZ, +0.6 µmol kg−1 yr−1); they are close to the expected anthropogenic signal in these regions (+1.1 µmol kg−1 yr−1 in the subtropics and +0.8 µmol kg−1 yr−1 at higher latitudes).
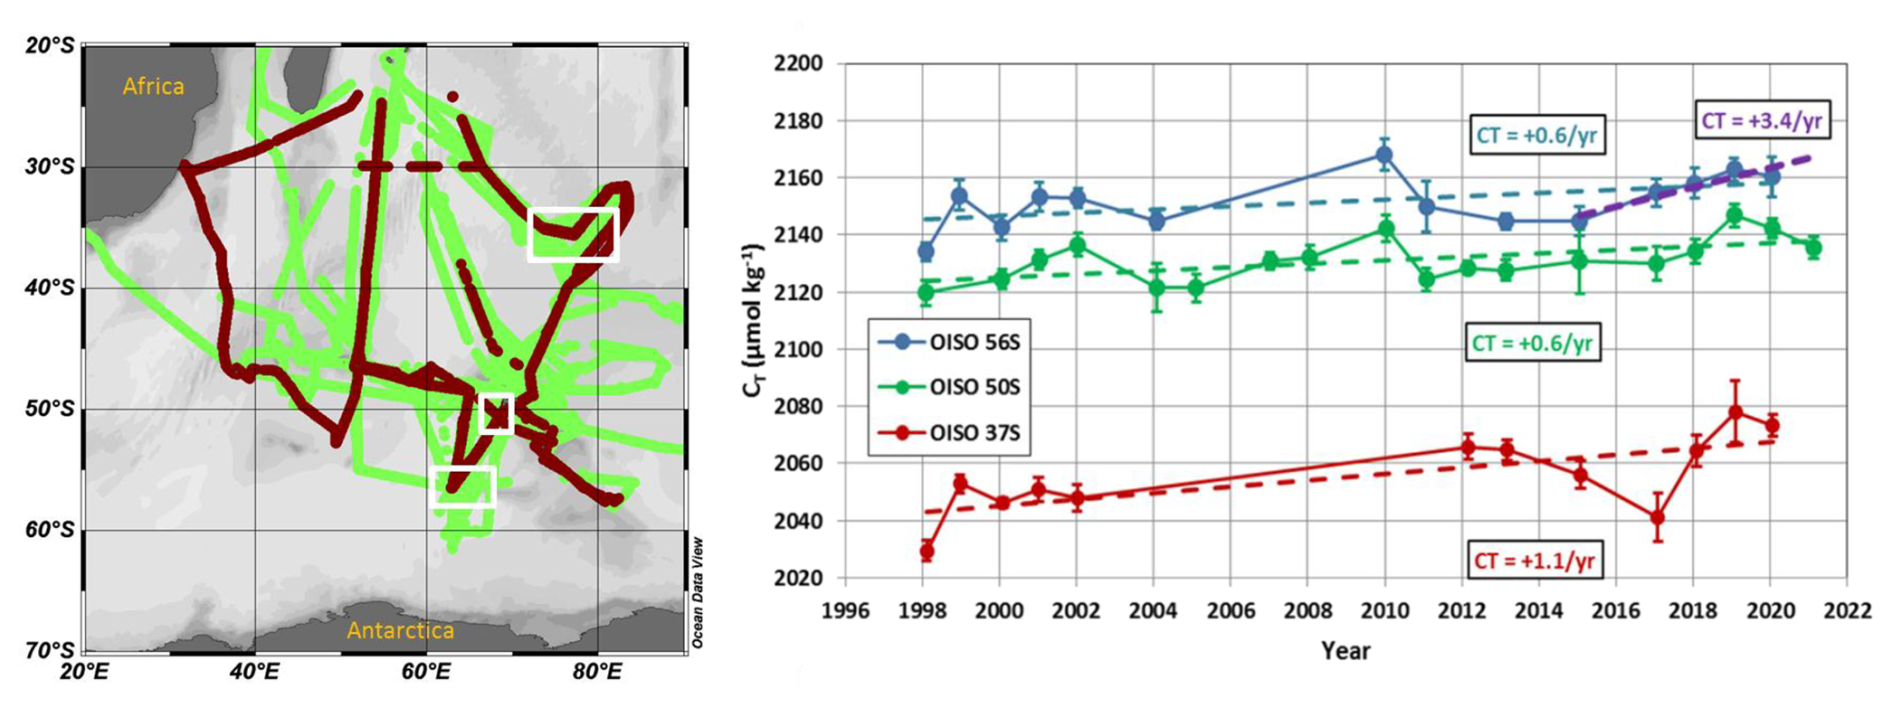
Figure 11On the left are data from the SNAPO-CO2-v1 dataset (green) and new data in version v2 (brown) in the southwestern Indian Ocean (OISO cruises). Figure produced with ODV (Schlitzer, 2018). The white boxes identify the regions of data selected around 37, 50, and 56° S for the trend analysis. On the right are time series of average CT concentrations in January–February at 37° S (red), 50° S (green), and 56° S (blue). The trends for each region are indicated (see also Table 6).
5.5 The coastal zones
Coastal waters experience enhanced ocean acidification due to increasing CO2 uptake, due to accumulation of anthropogenic CO2 (Bourgeois et al., 2016; Laruelle et al., 2018; Roobaert et al., 2024a; Li et al., 2024), and from local anthropogenic inputs through rivers or from air pollution (e.g., Sarma et al., 2015; Sridevi and Sarma, 2021; Wimart-Rousseau et al., 2020). The changes in the CO2 uptake in coastal zones are also linked to biological processes (Mathis et al., 2024) or to circulation and local upwelling (Roobaert et al., 2024b), all controlling large variability in AT and CT in space and time, leading to uncertainties in detecting long-term changes in pCO2 and air–sea CO2 fluxes in heterogeneous coastal waters (Dai et al., 2022; Resplandy et al., 2024). At seasonal scale, large differences between observations and models were also identified, leading to differences in the coastal ocean CO2 sink of up to 60 % (Resplandy et al., 2024). It is thus important to document the seasonal cycles of AT and CT to compare and correct models and thus to better predict future changes in biogeochemical properties in coastal waters and their impact on marine ecosystems. A better understanding of the processes and their retroaction in the coastal regions is also required regarding marine carbon dioxide removal (MCDR) experiments and for their evaluation (e.g., Ho et al., 2023).
In the SNAPO-CO2-v2 dataset, new data have been added to the coastal zones at stations SOMLIT-Brest, SOMLIT-Roscoff, and SOMLIT-Point-B. They extend the period to 2022 or 2023 for temporal analysis. New data from the French coastal zones have been also included from the COCORICO2 project documented in detail by Petton et al. (2024). The observations in coastal zones could be identified in the MARCATS regions (Margins and CATchment Segmentation; Laruelle et al., 2013) (Fig. 12), where little information is available for quantifying the ocean CO2 sink at the decadal scale and for evaluation of the anthropogenic CO2 uptake (Regnier et al., 2013; Dai et al., 2022; Li et al., 2024). To explore the change in the observed properties in the coastal zones and have an idea of the long-term CT trends, we selected the time series with at least 10 years of data (Table 7, Fig. 13). Except at high latitudes (Greenland and Antarctic coastal zones), we observed a warming in coastal zones (Fig. S11). Changes in salinity are also identified (increase or decrease), and results of the trends are presented for salinity-normalized CT at 34, 35, or 38 depending on the region. Although the interannual variability is large in coastal waters, sometimes linked to extreme events (e.g., river discharges), we observed an increase in N-CT at most of the eight selected locations. The exceptions are the coastal zones in the Gulf of Lion near the river Rhône and near Tasmania in October.
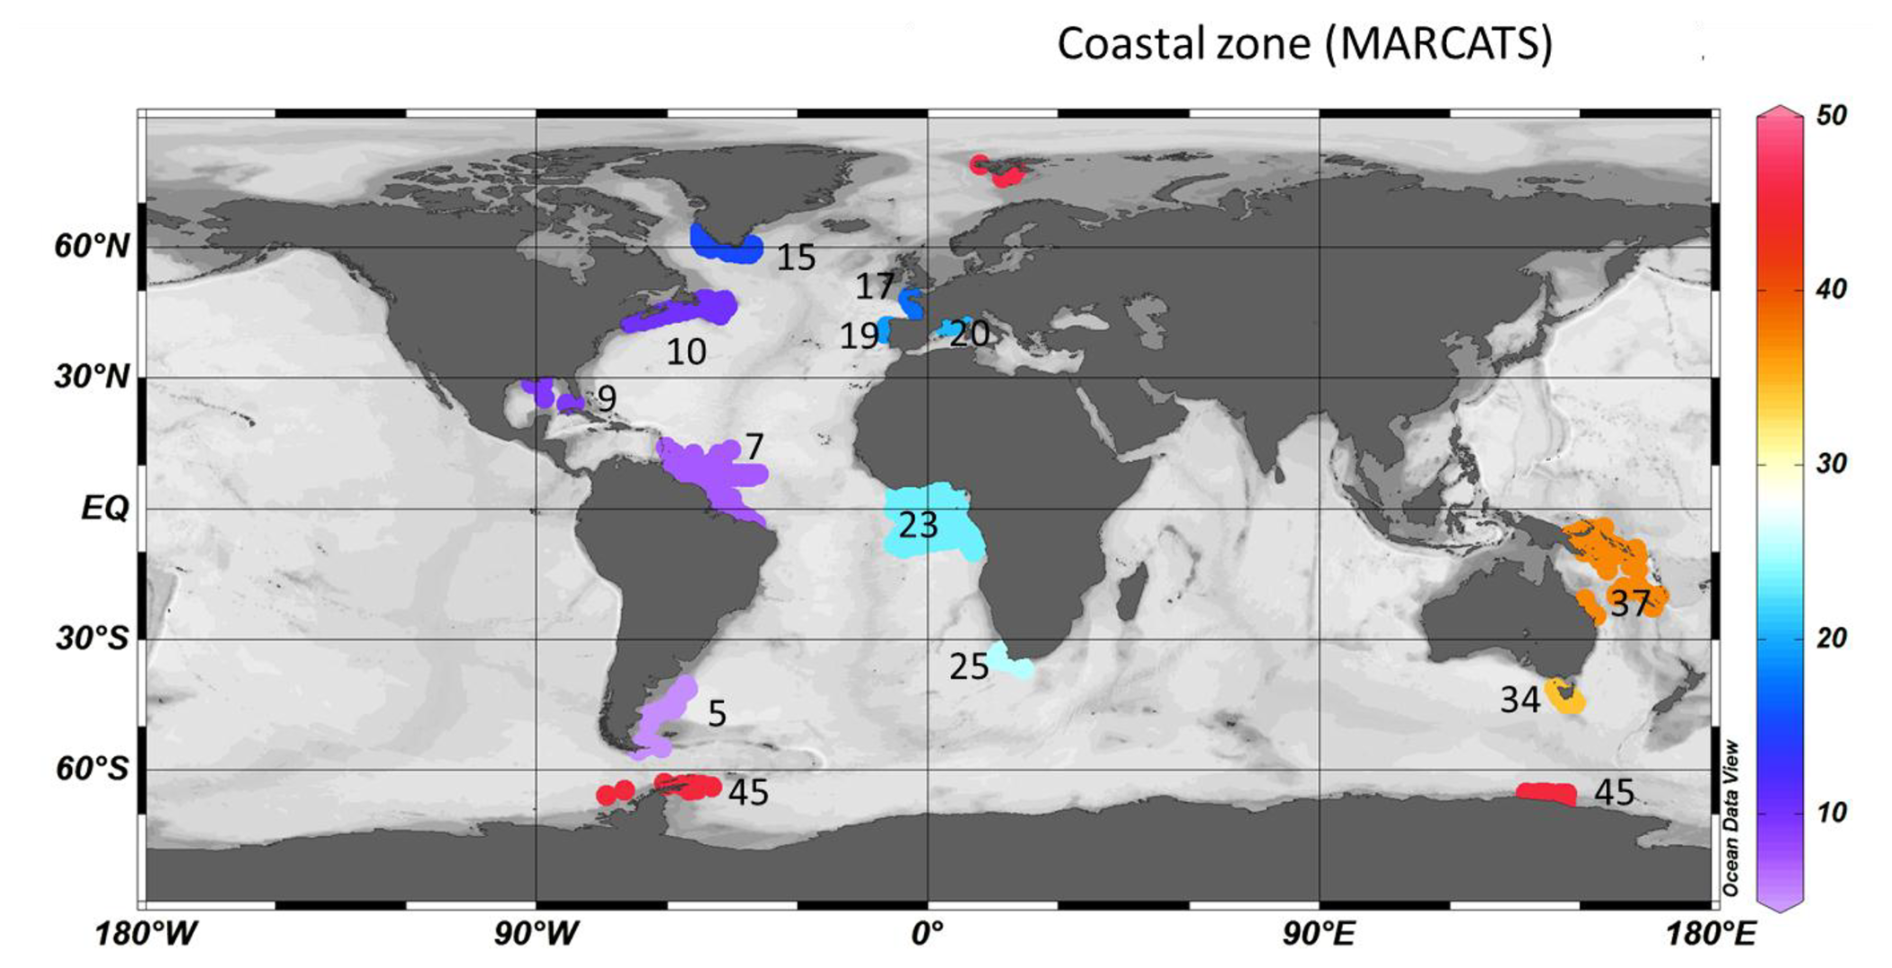
Figure 12Location of AT and CT data available in the coastal zones in the SNAPO-CO2-v2 dataset. Numbers and color code identify the MARCATS region (Laruelle et al., 2013). Figure produced with ODV (Schlitzer, 2018).
Table 7Trends in N-CT (µmol kg−1 yr−1) and corresponding standard errors in selected coastal regions where data are available for 10 years or more. The projects/cruises for selection of the data in each domain are indicated. MARCATS regions nos. are also identified. Salinity values used for CT normalization are indicated.
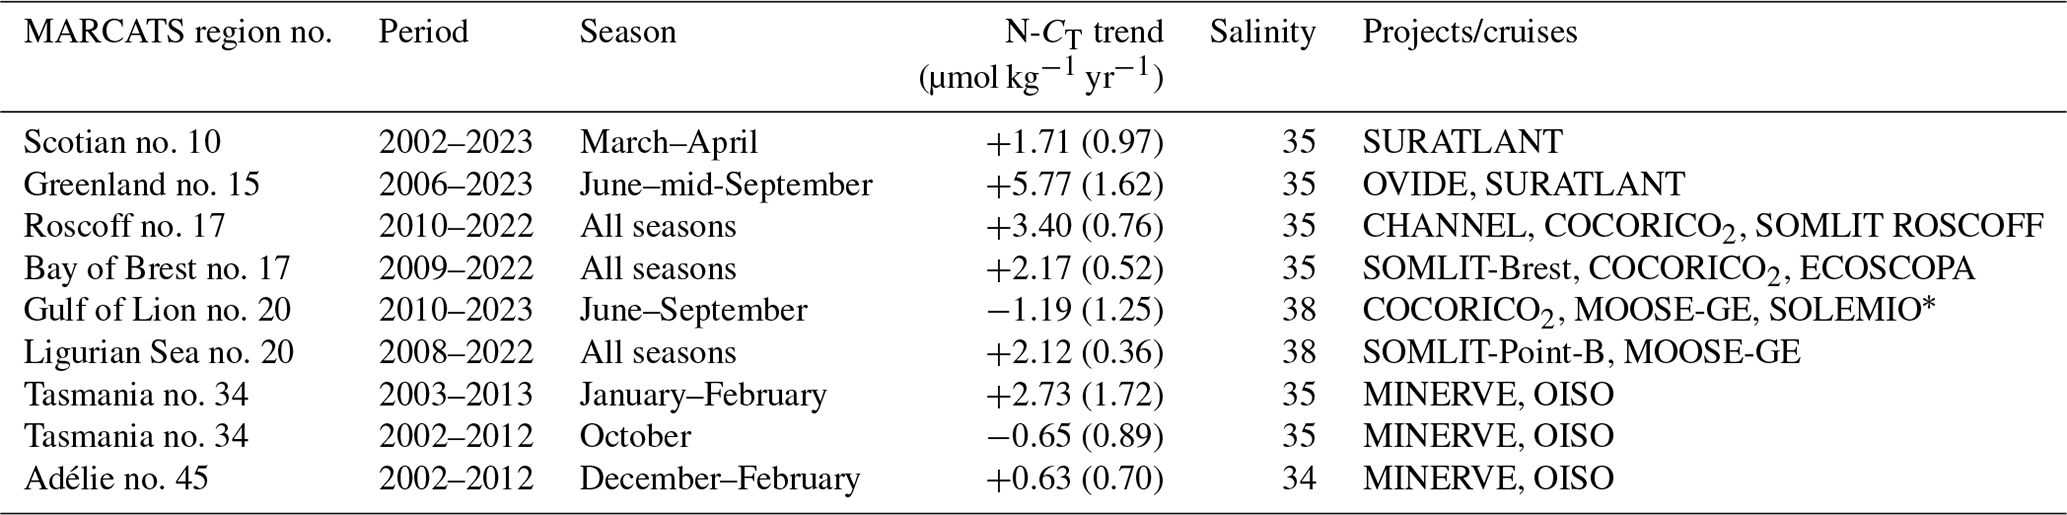
* For LION, some data in summer were also used from punctual cruises: AMOR-BFlux, CARBORHONE, DICASE, LATEX, MESURHOBENT, MISSRHODIA-2, and MOLA.
In the Gulf of Lion, the new data in the coastal zone confirmed the first view at the SOLEMIO station over 2016–2018 (Bay of Marseille; Wimart-Rousseau et al., 2020). In this region the lowest CT was observed in summer 2022 (average CT of 2238.6 ± 21.0 µmol kg−1), much lower than in 2015 (2290.8 ± 44.7 µmol kg−1). Over the continental shelf south of Tasmania (MARCATS no. 34), the trend in N-CT was positive in summer but not significant in October. In October this was associated with an increase in salinity and in AT probably linked to advective processes via the reversal and variability in the Zeehan or the East Australian currents. From our data a warming of +0.06 °C yr−1 was identified for both seasons over 2002–2012, as previously observed south of Tasmania over 1991–2003, impacting the pCO2 trend and air–sea CO2 fluxes in this region (Borges et al., 2008). The difference in the N–CT trends in austral summer and spring calls for new detailed studies with extended data in this region. At high latitudes in Adélie Land (Antarctic coast MARCATS no. 45), the variability in N-CT was large (range from 2150 to 2200 µmol kg−1; Fig. 13), and the trend over 10 years in summer was not significant (Table 7). As opposed to the open zone at 60° S (Fig. 10), the CT concentrations in the coastal zone near Antarctica did not increase, probably linked to competitive processes between anthropogenic uptake, changes in primary production, mixing, or ice melting (Shadwick et al., 2013, 2014). More data are needed to better evaluate the changes in the carbonate system in Antarctic coastal zones where bottom waters are formed and transport anthropogenic CO2 at lower latitudes (Zhang et al., 2023).
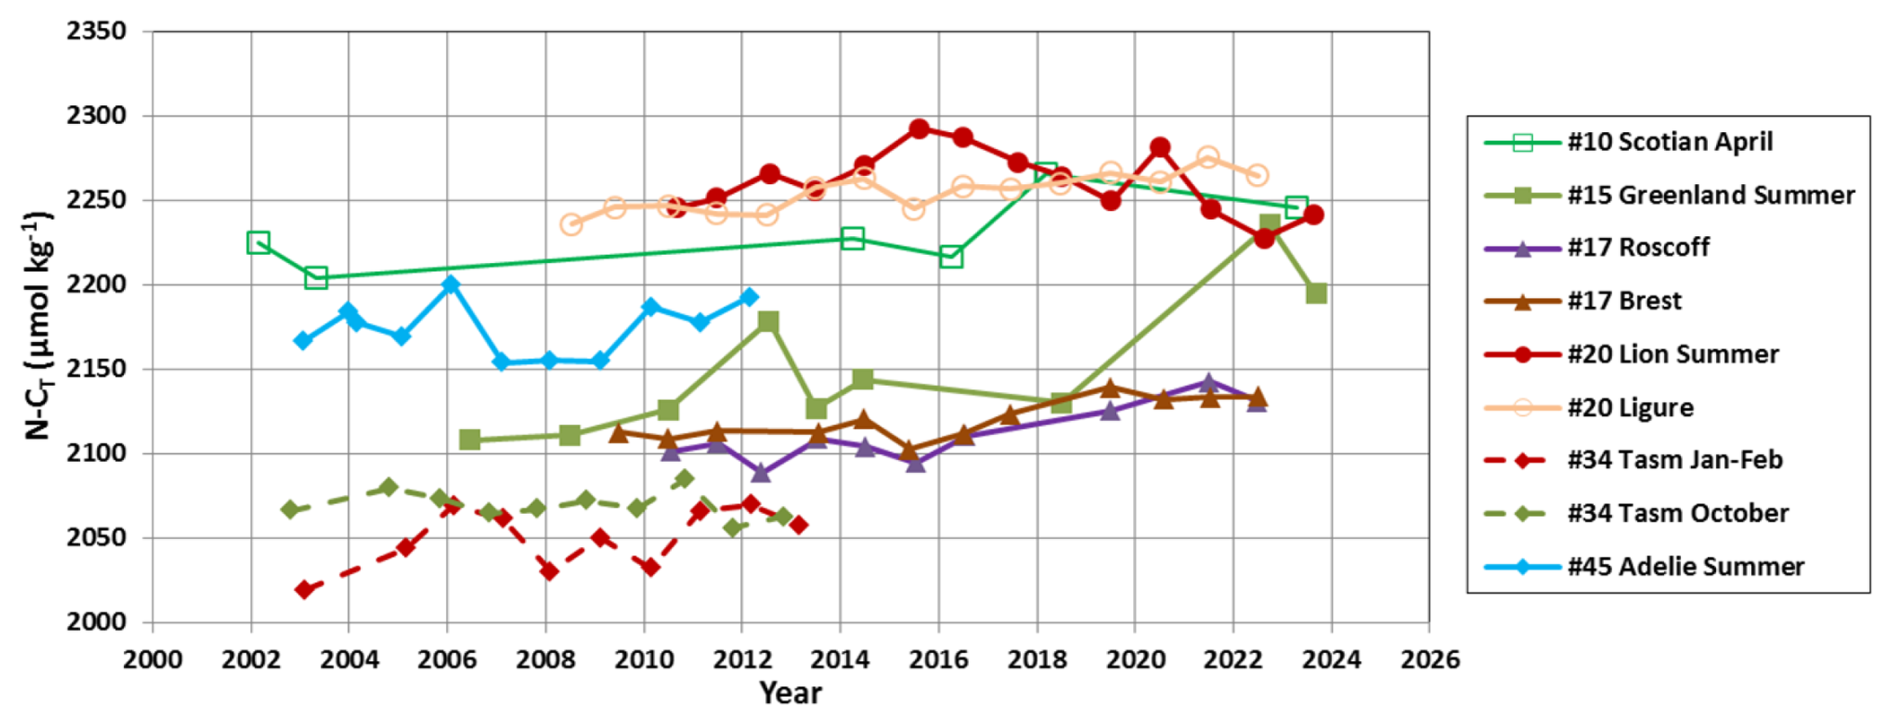
Figure 13Time series of average N-CT concentrations (µmol kg−1) in selected MARCATS regions for different periods when data are available for 10 years or more. The trends and periods for each region are indicated in Table 7.
For the coastal time series SOMLIT where annual trends could be estimated (sampling at monthly resolution), the N-CT increase (+2.1 to 3.4 µmol kg−1 yr−1) is close to or higher than the anthropogenic signal, leading to a decrease in pH ranging between −0.05 and −0.06 TS (total scale) per decade. The new data added to the SNAPO-CO2-v2 dataset (2016–2023) confirm the progressive increase in CT and the acidification in the western Mediterranean Sea and in the northeastern Atlantic coastal zones (Kapsenberg et al., 2017; Gac et al., 2021).
Data presented in this study are available at SEANOE (https://www.seanoe.org, last access: 22 January 2025, https://doi.org/10.17882/102337, Metzl et al., 2024c). See also https://doi.org/10.17882/95414 (Metzl et al., 2024a) for version V1. The dataset is also available at https://explore.webodv.awi.de/ocean/carbon/snapo-co2/ (SNAPO-CO2, 2024).
This work extends on the time and new oceanic regions of the AT and CT data presented in the first SNAPO-CO2 synthesis (Metzl et al., 2024a). It includes now more than 67 000 surface and water column observations in all oceanic basins, in the Mediterranean Sea, in the coastal zones, near coral reefs, and in rivers. The data synthesized in version v2 are based on measurements of AT and CT performed between 1993 and 2023 with an accuracy of ±4 µmol kg−1. Based on a secondary quality control, 91 % of the AT and CT data are considered good (WOCE Flag 2) and 6 % probably good (Flag 3). For the open ocean this synthesis complements the SOCAT, GLODAP, and SPOTS data products (Bakker et al., 2016; Lauvset et al., 2024; Lange et al., 2024). For the coastal sites this also complements the synthesis of coastal time series in the Iberian Peninsula (Padin et al., 2020), on the Canadian Atlantic continental shelf (Gibb et al., 2023), and around North America (Fassbender et al., 2018; Jiang et al., 2021). The SNAPO-CO2 dataset enables one to investigate the seasonal cycles, the interannual variability, and the decadal trends in AT and CT in various oceanic provinces. The same temporal analyses could be investigated for other carbonate system properties such as fCO2 or pH calculated from AT and CT for air–sea CO2 flux estimates or ocean acidification studies (Fig. 14).
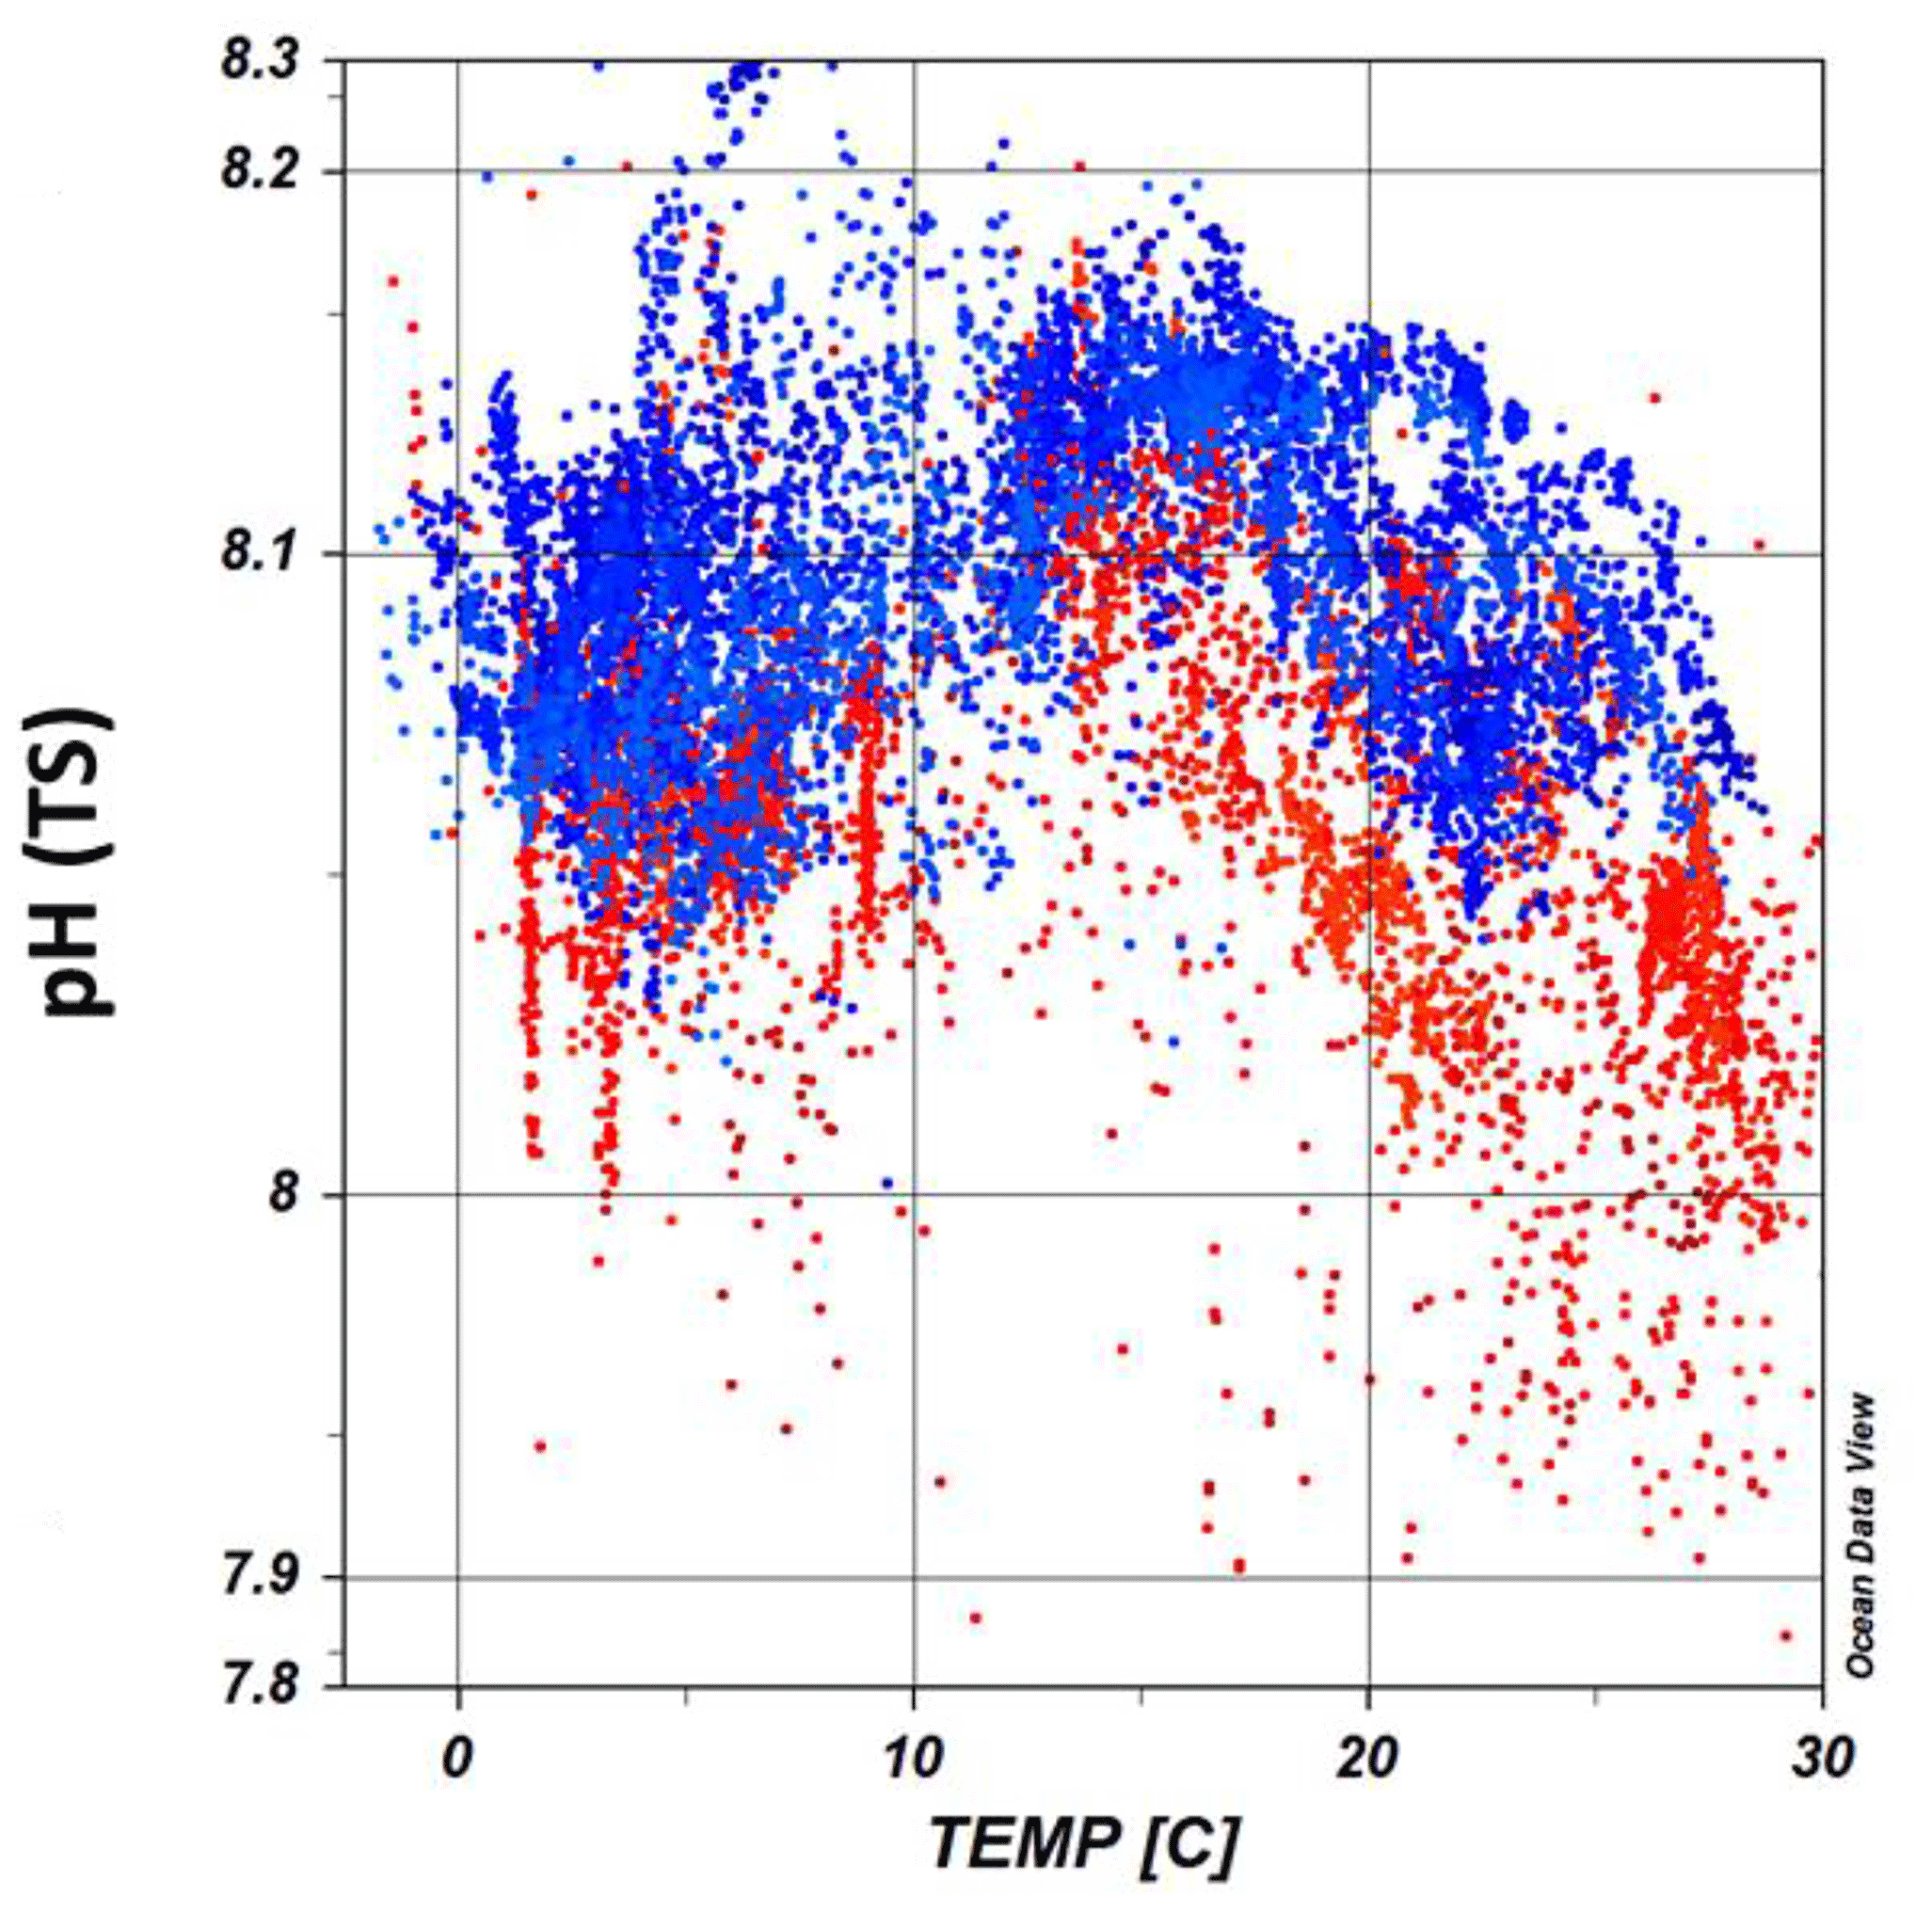
Figure 14An example of observed ocean acidification derived from the SNAPO-CO2-v2 dataset: pH (total scale) calculated with AT and CT data are presented as a function of temperature (°C) for years 1998–2002 (blue symbols) and 2020–2023 (red symbols) and for salinity > 33 (number of data selected with flag 2 = 11 994). In recent years the pH was lower. Figure produced with ODV (Schlitzer, 2018).
In almost all regions the new data in 2021–2023 indicated that the CT concentrations were higher in recent years. In regions where data are available for more than 2 decades, the time series show an increase in sea surface CT (North Atlantic, southern Indian Ocean, and Ligurian Sea) with a rate close to or higher than the changes expected from anthropogenic CO2 uptake. It is also recognized that at seasonal scale the CT trends could be different. However, with the data in hand, the long-term trend in CT cannot be quantified with confidence to compare with the anthropogenic carbon uptake in some regions. This is the case in the eastern tropical Atlantic, subject to high interannual variability (Lefèvre et al., 2021, 2024), although new data have been added over 2005–2022 in this region (Table 1, Fig. S9). When data are available for less than a decade, the increase in CT was observed, but the trend was uncertain due to large interannual variability (e.g., Adélie Land). An exception was identified in the coastal zone in the Gulf of Lion (Mediterranean Sea) where summer data since 2010 present a decrease in CT, most pronounced since 2015 (CT trend = −5.2 ± 1.5 µmol kg−1 yr−1). Such a CT decrease over 10 years was also observed in the Hawaii Ocean Time-series (HOT) over 2010–2020 (Dore et al., 2009, https://hahana.soest.hawaii.edu/hot/hotco2/hotco2.html, last access: 27 August 2024).
Although the AT concentrations present significant interannual variability such as in the NASPG, in the tropical Atlantic or Adélie Land and coastal zones, AT appears relatively constant over time except at some locations. In the open ocean, we observed an increase in AT in the Southern Ocean south of the polar front around 60° S in 2003–2012 not directly linked to salinity. In the coastal zones a decrease in AT was pronounced south of Greenland. On the coast in the Gulf of Lion, as observed for CT, AT decreased (AT trend = µmol kg−1 yr−1). This is opposed to the changes observed in the Ligurian Sea at station SOMLIT-Point-B, where CT and AT increased over 2007–2015 (Kapsenberg et al., 2017), highlighting the contrasting CT and AT trends in the Mediterranean coastal zones where ocean acidification is detected (here over 2008–2022, pH trend of −0.048 ± 0.003 per decade). With continuous warming, reduced stratification, and rapid pH change observed in the Mediterranean Sea, how the marine ecosystems will respond in the future should be addressed (e.g., Howes et al., 2015; Maugendre et al., 2015; Lacoue-Labarthe et al., 2016). The SNAPO-CO2-v2 dataset could also be used to explore and analyze the changes in the carbonate system occurring during extreme events such as marine heat waves, rapid freshening, deep convection, and high-phytoplankton-bloom events.
This dataset could also serve for validating autonomous platforms capable of measuring pH and fCO2 properties (Sarmiento et al., 2023); along with other synthesis products, it provides an additional reference dataset for the development and validation of regional biogeochemical models for simulating air–sea CO2 fluxes. Thanks to the RECCAP2 stories, it has been recognized that ocean biogeochemical models present biases in the seasonal cycle of CT and AT due to inadequate representation of biogeochemical cycles (e.g., Hauck et al., 2023; Rodgers et al., 2023; Sarma et al., 2023; Pérez et al., 2024; Resplandy et al., 2024). The SNAPO-CO2-v2 dataset could be used to guide analyses for regional or global biogeochemical models for AT and CT comparison and validation from seasonal to decadal scales. Our dataset is also essential for training and validating neural networks capable of predicting variables in the carbonate system (e.g., Fourrier et al., 2020; Chau et al., 2024a; Gregor et al., 2024), thereby enhancing observations of marine CO2 at different spatial and temporal scales. Furthermore, we encourage the use of this dataset (or part of it), at sea or prior to going to sea for cruise planning. Indeed, using the approach of Davis and Goyet (2021), which takes into account the multiple constraints (e.g., ship time, number of samples), it is possible to determine the most appropriate sampling strategy (Guglielmi et al., 2022, 2023) to reach the specific scientific objectives of each cruise.
The data presented here are available online on the SEANOE server (https://doi.org/10.17882/102337, Metzl et al., 2024c) in a file identifying version v1 and v2. The sources of the original datasets (DOI) with the associated references are listed in the Supplement (Tables S3, S4). As for version v1 we invite the users to comment on any anomaly that would have not been detected or to suggest potential misqualification of data in the present product (e.g., data probably good albeit assigned with flag 3 are probably wrong). As for SOCAT or GLODAP, we expect to update the SNAPO-CO2 dataset once new observations are obtained and controlled.
The supplement related to this article is available online at https://doi.org/10.5194/essd-17-1075-2025-supplement.
NM prepared the data synthesis, prepared the figures, and wrote the draft of the manuscript with contributions from all authors. JF has measured the discrete samples since 2014, with the help of CM and CLM, and prepared the individual reports for each project. NM and JF prequalified the discrete AT–CT data. CLM and NM are co-investigators of the ongoing OISO project and qualified the underway AT–CT data from OISO cruises. FT and CG were PIs of the MINERVE cruises. All authors have contributed to organizing cruises, sample collection, and/or data qualification and reviewed the manuscript.
At least one of the (co-)authors is a member of the editorial board of Earth System Science Data. The peer-review process was guided by an independent editor, and the authors also have no other competing interests to declare.
Publisher’s note: Copernicus Publications remains neutral with regard to jurisdictional claims made in the text, published maps, institutional affiliations, or any other geographical representation in this paper. While Copernicus Publications makes every effort to include appropriate place names, the final responsibility lies with the authors.
Most of the AT and CT data presented in this study were measured at the SNAPO-CO2 facility (Service National d'Analyse des Paramètres Océaniques du CO2) housed by the LOCEAN laboratory and part of OSU ECCE Terra at Sorbonne University and INSU/CNRS analytical services. The support of INSU/CNRS, of OSU ECCE Terra, and of LOCEAN is gratefully acknowledged as well as the support of different French “Services nationaux d'Observations”, such as OISO/CARAUS, SOMLIT, PIRATA, SSS, and MOOSE. We thank the research infrastructure of ICOS (Integrated Carbon Observation System), France, for funding a large part of the analyses. We thank the IRD (Institut de Recherche pour le Développement) and the French–Brazilian IRD–FAPEMA program for funding observations in the tropical Atlantic. We thank the French Oceanographic Fleet (“Flotte océanographique française”) for financial and logistic support for most cruises listed in this synthesis and for the OISO program (https://campagnes.flotteoceanographique.fr/series/228/, last access: 22 January 2025). We acknowledge the MOOSE program (Mediterranean Ocean Observing System for the Environment, https://campagnes.flotteoceanographique.fr/series/235/fr/, last access: 22 January 2025) coordinated by CNRS-INSU and the research infrastructure of ILICO (CNRS-IFREMER). The CocoriCO2 project was founded by European Maritime and Fisheries Fund (grant no. 344, 2020–2023) and benefited from a subsidy from the Adour-Garonne water agency. We thank the following programs coordinated by A. Tribollet, which have contributed to the acquisition of the data in Mayotte: CARBODISS funded by CNRS-INSU in 2018–2019, Future Maore reefs funded by Next Generation UE-France Relance in 2021–2023, and OA-ME funded by a Belmont Forum International (ANR) in 2020–2026. We thank the program Mermex-MISTRALS CNRS for supporting AMOR-BFlux, CARBORHONE, DICASE, and MESURHOBENT cruises and the program EC2CO-INSU for supporting the MISSRHODIA-2 cruise. The ACCESS project was supported by CNRS MISTRALS and the DELTARHONE1 by EC2CO-INSU. The ACIDHYPO project was founded by CNRS International Emerging Actions; we thank the captain and crew of R/V Savannah from the Skidaway Institute of Oceanography (University of Georgia) for their support and technical assistance during the operations at sea. The AMAZOMIX project was funded by French Oceanographic Fleet, INSU (LEFE), IRD (LMI TAPICOA), CNES (TOSCA MIAMAZ project), and the French–Brazilian international program GUYAMAZON. The OISO program was supported by the French institutes INSU (Institut National des Sciences de l'Univers), IPEV (Institut Polaire Paul-Émile Victor), and OSU Ecce-Terra (at Sorbonne Université) and the French program SOERE/Great-Gases. We also thank the research infrastructure at ILICO (https://www.ir-ilico.fr, last access: 22 January 2025). We warmly thank Alain Poisson, who initiated the MINERVE program and performed many of the measurements on board R/V Astrolabe from 2002 through 2018. We thank all colleagues and students who participated in the cruises and carefully collected the precious seawater samples. We thank Frédéric Merceur (IFREMER) for preparing the page and data availability on SEANOE and Reiner Schlitzer (AWI) for including the SNAPO-CO2 dataset in the ODV portal. We thank the associate editor, Sebastiaan van de Velde, for managing this article and Kim Currie and Toste Tanhua for their suggestions that helped to improve this article.
This research has been supported by the Institut national des sciences de l'Univers (SA/SNAPO-CO2).
This paper was edited by Sebastiaan van de Velde and reviewed by Kim Currie and Toste Tanhua.
Álvarez, M., Catalá, T. S., Civitarese, G., Coppola, L., Hassoun, A. E. R., Ibello, V., Lazzari, P., Lefèvre, D., Macías, D., Santinelli, C., and Ulses, C.: Chapter 11 – Mediterranean Sea general biogeochemistry, edited by: Schroeder, K. and Chiggiato, J., Oceanography of the Mediterranean Sea, Elsevier, 387–451, https://doi.org/10.1016/B978-0-12-823692-5.00004-2, 2023.
Bakker, D. C. E., Pfeil, B., Landa, C. S., Metzl, N., O'Brien, K. M., Olsen, A., Smith, K., Cosca, C., Harasawa, S., Jones, S. D., Nakaoka, S., Nojiri, Y., Schuster, U., Steinhoff, T., Sweeney, C., Takahashi, T., Tilbrook, B., Wada, C., Wanninkhof, R., Alin, S. R., Balestrini, C. F., Barbero, L., Bates, N. R., Bianchi, A. A., Bonou, F., Boutin, J., Bozec, Y., Burger, E. F., Cai, W.-J., Castle, R. D., Chen, L., Chierici, M., Currie, K., Evans, W., Featherstone, C., Feely, R. A., Fransson, A., Goyet, C., Greenwood, N., Gregor, L., Hankin, S., Hardman-Mountford, N. J., Harlay, J., Hauck, J., Hoppema, M., Humphreys, M. P., Hunt, C. W., Huss, B., Ibánhez, J. S. P., Johannessen, T., Keeling, R., Kitidis, V., Körtzinger, A., Kozyr, A., Krasakopoulou, E., Kuwata, A., Landschützer, P., Lauvset, S. K., Lefèvre, N., Lo Monaco, C., Manke, A., Mathis, J. T., Merlivat, L., Millero, F. J., Monteiro, P. M. S., Munro, D. R., Murata, A., Newberger, T., Omar, A. M., Ono, T., Paterson, K., Pearce, D., Pierrot, D., Robbins, L. L., Saito, S., Salisbury, J., Schlitzer, R., Schneider, B., Schweitzer, R., Sieger, R., Skjelvan, I., Sullivan, K. F., Sutherland, S. C., Sutton, A. J., Tadokoro, K., Telszewski, M., Tuma, M., van Heuven, S. M. A. C., Vandemark, D., Ward, B., Watson, A. J., and Xu, S.: A multi-decade record of high-quality fCO2 data in version 3 of the Surface Ocean CO2 Atlas (SOCAT), Earth Syst. Sci. Data, 8, 383–413, https://doi.org/10.5194/essd-8-383-2016, 2016.
Barral, Q.-B., Zakardjian, B., Dumas, F., Garreau, P., Testor, P., and Beuvier, J.: Characterization of fronts in the Western Mediterranean with a special focus on the North Balearic Front, Prog. Oceanogr., 197, 102636, https://doi.org/10.1016/j.pocean.2021.102636, 2021.
Barré, L., Diaz, F., Wagener, T., Van Wambeke, F., Mazoyer, C., Yohia, C., and Pinazo, C.: Implementation and assessment of a model including mixotrophs and the carbonate cycle (Eco3M_MIX-CarbOx v1.0) in a highly dynamic Mediterranean coastal environment (Bay of Marseille, France) – Part 1: Evolution of ecosystem composition under limited light and nutrient conditions, Geosci. Model Dev., 16, 6701–6739, https://doi.org/10.5194/gmd-16-6701-2023, 2023.
Barré, L., Diaz, F., Wagener, T., Mazoyer, C., Yohia, C., and Pinazo, C.: Implementation and assessment of a model including mixotrophs and the carbonate cycle (Eco3M_MIX-CarbOx v1.0) in a highly dynamic Mediterranean coastal environment (Bay of Marseille, France) – Part 2: Towards a better representation of total alkalinity when modeling the carbonate system and air–sea CO2 fluxes, Geosci. Model Dev., 17, 5851–5882, https://doi.org/10.5194/gmd-17-5851-2024, 2024.
Bittig, H. C., Steinhoff, T., Claustre, H., Fiedler, B., Williams, N. L., Sauzède, R., Körtzinger, A., and Gattuso, J.-P.: An Alternative to Static Climatologies: Robust Estimation of Open Ocean CO2 Variables and Nutrient Concentrations From T, S, and O2 Data Using Bayesian Neural Networks. Front. Mar. Sci. 5:328. https://doi.org/10.3389/fmars.2018.00328, 2018
Bonou, F., Medeiros, C., Noriega, C., Araujo, M., Aubains HounsouGbo, A., and Lefèvre, N.: A comparative study of total alkalinity and total inorganic carbon near tropical Atlantic coastal regions, J. Coast Conserv., 26, 31, https://doi.org/10.1007/s11852-022-00872-5, 2022.
Borges, A. V., Tilbrook, B., Metzl, N., Lenton, A., and Delille, B.: Inter-annual variability of the carbon dioxide oceanic sink south of Tasmania, Biogeosciences, 5, 141–155, https://doi.org/10.5194/bg-5-141-2008, 2008.
Bourgeois, T., Orr, J. C., Resplandy, L., Terhaar, J., Ethé, C., Gehlen, M., and Bopp, L.: Coastal-ocean uptake of anthropogenic carbon, Biogeosciences, 13, 4167–4185, https://doi.org/10.5194/bg-13-4167-2016, 2016.
Brandon, M., Goyet, C., Touratier, F., Lefèvre, N., Kestenare, E., and Morrow, R.: Spatial and temporal variability of the physical, carbonate and CO2 properties in the Southern Ocean surface waters during austral summer (2005–2019), Deep-Sea Res. Pt. I, 187, 103836, https://doi.org/10.1016/j.dsr.2022.103836. 2022
Broullón, D., Pérez, F. F., Velo, A., Hoppema, M., Olsen, A., Takahashi, T., Key, R. M., Tanhua, T., González-Dávila, M., Jeansson, E., Kozyr, A., and van Heuven, S. M. A. C.: A global monthly climatology of total alkalinity: a neural network approach, Earth Syst. Sci. Data, 11, 1109–1127, https://doi.org/10.5194/essd-11-1109-2019, 2019.
Broullón, D., Pérez, F. F., Velo, A., Hoppema, M., Olsen, A., Takahashi, T., Key, R. M., Tanhua, T., Santana-Casiano, J. M., and Kozyr, A.: A global monthly climatology of oceanic total dissolved inorganic carbon: a neural network approach, Earth Syst. Sci. Data, 12, 1725–1743, https://doi.org/10.5194/essd-12-1725-2020, 2020.
Carter, B. R., Feely, R. A., Williams, N. L., Dickson, A. G., Fong, M. B., and Takeshita, Y.: Updated methods for global locally interpolated estimation of alkalinity, pH, and nitrate, Limnol. Oceanogr. Meth., 16, 119–131, https://doi.org/10.1002/lom3.10232, 2018.
Chau, T.-T.-T., Gehlen, M., Metzl, N., and Chevallier, F.: CMEMS-LSCE: a global, 0.25°, monthly reconstruction of the surface ocean carbonate system, Earth Syst. Sci. Data, 16, 121–160, https://doi.org/10.5194/essd-16-121-2024, 2024a.
Chau, T.-T.-T., Chevallier, F., and Gehlen, M.: Global analysis of surface ocean CO2 fugacity and air-sea fluxes with low latency, Geophys. Res. Lett., 51, e2023GL106670, https://doi.org/10.1029/2023GL106670, 2024b.
Cheng, L. J., Abraham, J., Zhu, J., Trenberth, K. E., Fasullo, J., Boyer, T., Locarnini, R., Zhang, B., Yu, F. J., Wan, L. Y., Chen, X. R., Song, X. Z., Liu, Y. L., and Mann, M. E.: Record-setting ocean warmth continued in 2019, Adv. Atmos. Sci., 37, 137–142, https://doi.org/10.1007/s00376-020-9283-7, 2020.
Cheng, L., Abraham, J., Trenberth, K. E., Boyer, T., Mann, M. E., Zhu, J., Wang, F., Yu, F., Locarnini, R., Fasullo, J., Zheng, F., Li, Y., Zhang, B., Wan, L., Chen, X., Wang, D., Feng, L., Song, X., Liu, Y., Reseghetti, F., Simoncelli, S., Gouretski, V., Chen, G., Mishonov, A., Reagan, J., von Schuckmann, K., Pan, Y., Tan, Z., Zhu, Y., Wei, W., Li, G., Ren, Q., Cao, L., and Lu, Y.: New Record Ocean Temperatures and Related Climate Indicators in 2023, Adv. Atmos. Sci., 41, 1068–1082, https://doi.org/10.1007/s00376-024-3378-5, 2024.
Copin-Montégut, C.: Alkalinity and carbon budgets in the Mediterranean Sea, Global Biogeochem. Cy., 7, 915–925, 1993.
Coppola, L., Fourrier, M., Pasqueron de Fommervault, O., Poteau, A., Riquier, E. D., and Béguery, L.: Highresolution study of the air-sea CO2 flux and net community oxygen production in the Ligurian Sea by a fleet of gliders, Front. Mar. Sci., 10, 1233845, https://doi.org/10.3389/fmars.2023.1233845, 2023.
Curbelo-Hernández, D., Pérez, F. F., González-Dávila, M., Gladyshev, S. V., González, A. G., González-Santana, D., Velo, A., Sokov, A., and Santana-Casiano, J. M.: Ocean acidification trends and carbonate system dynamics across the North Atlantic subpolar gyre water masses during 2009–2019, Biogeosciences, 21, 5561–5589, https://doi.org/10.5194/bg-21-5561-2024, 2024.
Currie, K. I., Reid, M. R., and Hunter, K. A.: Interannual variability of carbon dioxide draw-down by subantarctic surface water near New Zealand, Biogeochemistry, 104, 23–34, https://doi.org/10.1007/s10533-009-9355-3, 2011.
Cyronak, T., Santos, I. R., Erler, D. V., and Eyre, B. D.: Groundwater and porewater as major sources of alkalinity to a fringing coral reef lagoon (Muri Lagoon, Cook Islands), Biogeosciences, 10, 2467–2480, https://doi.org/10.5194/bg-10-2467-2013, 2013.
Dai, M., Su, J., Zhao, Y., Hofmann, E. E., Cao, Z., Cai, W.-J., Gan, J., Lacroix, F., Laruelle, G. G., Meng, F., Müller, J. D., Regnier, P. A. G., Wang, G., and Wang, Z.: Carbon Fluxes in the Coastal Ocean: Synthesis, Boundary Processes and Future Trends, Annu. Rev. Earth Pl. Sc., 50, 593–626, https://doi.org/10.1146/annurev-earth-032320-090746, 2022.
Davis, D. and Goyet, C.: Balanced Error Sampling with applications to ocean biogeochemical sampling, Collection études, Presses Universitaires de Perpignan, 224 pp., ISBN 978-2-35412-452-6, 2021.
Dickson, A. G., Sabine, C. L., and Christian, J. R.: Guide to best practices for ocean CO2 measurements, North Pacific Marine Science Organization, Sidney, British Columbia, 191 pp., https://doi.org/10.25607/OBP-1342, 2007.
DOE: Handbook of Methods for Analysis of the Various Parameters of the Carbon Dioxide System in Seawater, version 2, edited by: Dickson, A. G. and Goyet, C., ORNL/CDIAC-74, https://doi.org/10.2172/10107773, 1994.
Doney, S. C., Fabry, V. J., Feely, R. A., and Kleypas, J. A., Ocean acidification: The other CO2 problem, Annu. Rev. Mar. Sci., 1, 169–192, 10.1146/annurev.marine.010908.163834, 2009.
Doney, S. C., Busch, D. S., Cooley, S. R., and Kroeker, K. J.: The Impacts of Ocean Acidification on Marine Ecosystems and Reliant Human Communities, Annu. Rev. Environ. Resour., 45, 83–112, https://doi.org/10.1146/annurev-environ-012320-083019. 2020.
Dore, J. E., Lukas, R., Sadler, D. W., Church, M. J., and Karl, D. M.: Physical and biogeochemical modulation of ocean acidification in the central North Pacific, P. Natl. Acad. Sci. USA, 106, 12235–12240, https://doi.org/10.1073/pnas.0906044106, 2009.
Edmond, J. M.: High precision determination of titration alkalinity and total carbon dioxide content of sea water by potentiometric titration, Deep-Sea Res., 17, 737–750, https://doi.org/10.1016/0011-7471(70)90038-0, 1970.
Eyring, V., Righi, M., Lauer, A., Evaldsson, M., Wenzel, S., Jones, C., Anav, A., Andrews, O., Cionni, I., Davin, E. L., Deser, C., Ehbrecht, C., Friedlingstein, P., Gleckler, P., Gottschaldt, K.-D., Hagemann, S., Juckes, M., Kindermann, S., Krasting, J., Kunert, D., Levine, R., Loew, A., Mäkelä, J., Martin, G., Mason, E., Phillips, A. S., Read, S., Rio, C., Roehrig, R., Senftleben, D., Sterl, A., van Ulft, L. H., Walton, J., Wang, S., and Williams, K. D.: ESMValTool (v1.0) – a community diagnostic and performance metrics tool for routine evaluation of Earth system models in CMIP, Geosci. Model Dev., 9, 1747–1802, https://doi.org/10.5194/gmd-9-1747-2016, 2016.
Fabry, V. J., Seibel, B. A., Feely, R. A. and Orr, J. C.: Impacts of ocean acidification on marine fauna and ecosystem processes, ICES J. Mar. Sci., 65, 414–432, https://doi.org/10.1093/icesjms/fsn048, 2008.
Faranda, D., Pascale, S., and Bulut, B.: Persistent anticyclonic conditions and climate change exacerbated the exceptional 2022 European-Mediterranean drought, Environ. Res. Lett., 18, 034030, https://doi.org/10.1088/1748-9326/acbc37, 2023.
Fassbender, A. J., Alin, S. R., Feely, R. A., Sutton, A. J., Newton, J. A., Krembs, C., Bos, J., Keyzers, M., Devol, A., Ruef, W., and Pelletier, G.: Seasonal carbonate chemistry variability in marine surface waters of the US Pacific Northwest, Earth Syst. Sci. Data, 10, 1367–1401, https://doi.org/10.5194/essd-10-1367-2018, 2018.
Fay, A. R. and McKinley, G. A.: Global open-ocean biomes: mean and temporal variability, Earth Syst. Sci. Data, 6, 273–284, https://doi.org/10.5194/essd-6-273-2014, 2014.
Fourrier, M., Coppola, L., Claustre, H., D'Ortenzio, F., Sauzède, R., and Gattuso, J.-P.: A regional neural network approach to estimate water-column nutrient concentrations and carbonate system variables in the Mediterranean Sea: CANYON-MED, Front. Mar. Sci., 7, 620, https://doi.org/10.3389/fmars.2020.00620, 2020.
Friedlingstein, P., O'Sullivan, M., Jones, M. W., Andrew, R. M., Gregor, L., Hauck, J., Le Quéré, C., Luijkx, I. T., Olsen, A., Peters, G. P., Peters, W., Pongratz, J., Schwingshackl, C., Sitch, S., Canadell, J. G., Ciais, P., Jackson, R. B., Alin, S. R., Alkama, R., Arneth, A., Arora, V. K., Bates, N. R., Becker, M., Bellouin, N., Bittig, H. C., Bopp, L., Chevallier, F., Chini, L. P., Cronin, M., Evans, W., Falk, S., Feely, R. A., Gasser, T., Gehlen, M., Gkritzalis, T., Gloege, L., Grassi, G., Gruber, N., Gürses, Ö., Harris, I., Hefner, M., Houghton, R. A., Hurtt, G. C., Iida, Y., Ilyina, T., Jain, A. K., Jersild, A., Kadono, K., Kato, E., Kennedy, D., Klein Goldewijk, K., Knauer, J., Korsbakken, J. I., Landschützer, P., Lefèvre, N., Lindsay, K., Liu, J., Liu, Z., Marland, G., Mayot, N., McGrath, M. J., Metzl, N., Monacci, N. M., Munro, D. R., Nakaoka, S.-I., Niwa, Y., O'Brien, K., Ono, T., Palmer, P. I., Pan, N., Pierrot, D., Pocock, K., Poulter, B., Resplandy, L., Robertson, E., Rödenbeck, C., Rodriguez, C., Rosan, T. M., Schwinger, J., Séférian, R., Shutler, J. D., Skjelvan, I., Steinhoff, T., Sun, Q., Sutton, A. J., Sweeney, C., Takao, S., Tanhua, T., Tans, P. P., Tian, X., Tian, H., Tilbrook, B., Tsujino, H., Tubiello, F., van der Werf, G. R., Walker, A. P., Wanninkhof, R., Whitehead, C., Willstrand Wranne, A., Wright, R., Yuan, W., Yue, C., Yue, X., Zaehle, S., Zeng, J., and Zheng, B.: Global Carbon Budget 2022, Earth Syst. Sci. Data, 14, 4811–4900, https://doi.org/10.5194/essd-14-4811-2022, 2022.
Friedlingstein, P., O'Sullivan, M., Jones, M. W., Andrew, R. M., Bakker, D. C. E., Hauck, J., Landschützer, P., Le Quéré, C., Luijkx, I. T., Peters, G. P., Peters, W., Pongratz, J., Schwingshackl, C., Sitch, S., Canadell, J. G., Ciais, P., Jackson, R. B., Alin, S. R., Anthoni, P., Barbero, L., Bates, N. R., Becker, M., Bellouin, N., Decharme, B., Bopp, L., Brasika, I. B. M., Cadule, P., Chamberlain, M. A., Chandra, N., Chau, T.-T.-T., Chevallier, F., Chini, L. P., Cronin, M., Dou, X., Enyo, K., Evans, W., Falk, S., Feely, R. A., Feng, L., Ford, D. J., Gasser, T., Ghattas, J., Gkritzalis, T., Grassi, G., Gregor, L., Gruber, N., Gürses, Ö., Harris, I., Hefner, M., Heinke, J., Houghton, R. A., Hurtt, G. C., Iida, Y., Ilyina, T., Jacobson, A. R., Jain, A., Jarníková, T., Jersild, A., Jiang, F., Jin, Z., Joos, F., Kato, E., Keeling, R. F., Kennedy, D., Klein Goldewijk, K., Knauer, J., Korsbakken, J. I., Körtzinger, A., Lan, X., Lefèvre, N., Li, H., Liu, J., Liu, Z., Ma, L., Marland, G., Mayot, N., McGuire, P. C., McKinley, G. A., Meyer, G., Morgan, E. J., Munro, D. R., Nakaoka, S.-I., Niwa, Y., O'Brien, K. M., Olsen, A., Omar, A. M., Ono, T., Paulsen, M., Pierrot, D., Pocock, K., Poulter, B., Powis, C. M., Rehder, G., Resplandy, L., Robertson, E., Rödenbeck, C., Rosan, T. M., Schwinger, J., Séférian, R., Smallman, T. L., Smith, S. M., Sospedra-Alfonso, R., Sun, Q., Sutton, A. J., Sweeney, C., Takao, S., Tans, P. P., Tian, H., Tilbrook, B., Tsujino, H., Tubiello, F., van der Werf, G. R., van Ooijen, E., Wanninkhof, R., Watanabe, M., Wimart-Rousseau, C., Yang, D., Yang, X., Yuan, W., Yue, X., Zaehle, S., Zeng, J., and Zheng, B.: Global Carbon Budget 2023, Earth Syst. Sci. Data, 15, 5301–5369, https://doi.org/10.5194/essd-15-5301-2023, 2023.
Fröb, F., Olsen, A., Becker, M., Chafik, L., Johannessen, T., Reverdin, G., and Omar, A.: Wintertime fCO2 variability in the subpolar North Atlantic since 2004, Geophys. Res. Lett., 46, 1580–1590, https://doi.org/10.1029/2018GL080554, 2019.
Gac, J.-P., Marrec, P., Cariou, T., Grosstefan, E., Macé, E., Rimmelin-Maury, P., Vernet, M., and Bozec, Y.: Decadal Dynamics of the CO2 System and Associated Ocean Acidification in Coastal Ecosystems of the North East Atlantic Ocean, Front. Mar. Sci., 8, 688008, https://doi.org/10.3389/fmars.2021.688008, 2021.
Gallego, M. A., Timmermann, A., Friedrich, T., and Zeebe, R. E.: Drivers of future seasonal cycle changes in oceanic pCO2, Biogeosciences, 15, 5315–5327, https://doi.org/10.5194/bg-15-5315-2018, 2018.
Gattuso, J.-P., Magnan, A., Billé, R., Cheung, W. W. L., Howes, E. L., Joos, F., Allemand, D., Bopp, L., Cooley, S., Eakin, M., Hoegh-Guldberg, O., Kelly, R. P., Pörtner, H.-O., Rogers, A. D., Baxter, J. M., Laffoley, D., Osborn, D., Rankovic, A., Rochette, J., Sumaila, U. R., Treyer, S., and Turley, C.: Contrasting futures for ocean and society from different anthropogenic CO2 emissions scenarios, Science, 349, aac4722, https://doi.org/10.1126/science.aac4722, 2015.
Gibb, O., Cyr, F., Azetsu-Scott, K., Chassé, J., Childs, D., Gabriel, C.-E., Galbraith, P. S., Maillet, G., Pepin, P., Punshon, S., and Starr, M.: Spatiotemporal variability in pH and carbonate parameters on the Canadian Atlantic continental shelf between 2014 and 2022, Earth Syst. Sci. Data, 15, 4127–4162, https://doi.org/10.5194/essd-15-4127-2023, 2023.
Goyet, C., Beauverger, C., Brunet, C., and Poisson, A.: Distribution of carbon dioxide partial pressure in surface waters of the Southwest Indian Ocean, Tellus B, 43, 1–11, https://doi.org/10.3402/tellusb.v43i1.15242, 1991.
Goyet, C., Hassoun, A. E. R. Gemayel, E. Touratier, F., Abboud-Abi Saab M. and Guglielmi, V.: Thermodynamic forecasts of the Mediterranean Sea Acidification, Mediterr. Mar. Sci., 17/2, 508–518, https://doi.org/10.12681/mms.1487, 2016.
Goyet C., Benallal, M.A., Bijoux A., Guglielmi, V, Moussa, H., Ribou, A.-C., and Touratier, F.: Ch.39, Evolution of human Impact on Oceans: Tipping points of socio-ecological Coviability, in: Coviability of Social and Ecological Systems: Reconnecting Mankind to the Biosphere in an Era of Global Change, edited by: Barrière, O., Behnassi, M., David, G., Douzal, V., Fargette, M., Libourel, T., Loireau, M., Pascal, L., Prost, C., Ravena-Cañete, V., Seyler, F., and Morand, S., Springer International Publishing AG, https://doi.org/10.1007/978-3-319-78111-2_12, 2019.
Gregor, L. and Gruber, N.: OceanSODA-ETHZ: a global gridded data set of the surface ocean carbonate system for seasonal to decadal studies of ocean acidification, Earth Syst. Sci. Data, 13, 777–808, https://doi.org/10.5194/essd-13-777-2021, 2021.
Gregor, L., Shutler, J., and Gruber, N. : High-resolution variability of the ocean carbon sink, Global Biogeochem. Cy., 38, e2024GB008127, https://doi.org/10.1029/2024GB008127, 2024.
Gruber, N., Clement, D., Carter, B. R., Feely, R. A., van Heuven, S., Hoppema, M., Ishii, M., Key, R. M., Kozyr, A., Lauvset, S. K., Lo Monaco, C., Mathis, J. T., Murata, A., Olsen, A., Perez, F. F., Sabine, C. L., Tanhua, T., and Wanninkhof, R.: The oceanic sink for anthropogenic CO2 from 1994 to 2007, Science, 363, 1193–1199, https://doi.org/10.1126/science.aau5153, 2019.
Guglielmi, V., Touratier, F., and Goyet, C.: Design of sampling strategy measurements of CO2/carbonate properties, J. Oceanogr. Aqua., 6, 1–11, https://doi.org/10.23880/ijoac-16000227, 2022.
Guglielmi, V., Touratier, F., and Goyet, C.: Determination of discrete sampling locations minimizing both the number of samples and the maximum interpolation error: Application to measurements of carbonate chemistry in surface ocean, J. Sea Res., 191, 102336, https://doi.org/10.1016/j.seares.2023.102336, 2023.
Hauck, J., Gregor, L., Nissen, C., Patara, L., Hague, M., Mongwe, P., Bushinsky, S., Doney, S. C., Gruber, N., Le Quéré, C., Manizza, M., Mazloff, M., Monteiro, P. M. S., and Terhaar, J.: The Southern Ocean carbon cycle 1985–2018: Mean, seasonal cycle, trends, and storage, Global Biogeochem. Cy., 37, e2023GB007848, https://doi.org/10.1029/2023GB007848, 2023.
Ho, D. T., Bopp, L., Palter, J. B., Long, M. C., Boyd, P. W., Neukermans, G., and Bach, L. T.: Monitoring, reporting, and verification for ocean alkalinity enhancement, in: Guide to Best Practices in Ocean Alkalinity Enhancement Research, edited by: Oschlies, A., Stevenson, A., Bach, L. T., Fennel, K., Rickaby, R. E. M., Satterfield, T., Webb, R., and Gattuso, J.-P., Copernicus Publications, State Planet, 2-oae2023, 12, https://doi.org/10.5194/sp-2-oae2023-12-2023, 2023.
Holliday, N. P., Bersch, M., Berx, B., Chafik, L., Cunningham, S., Florindo-López, C., Hátún, H., Johns, W., Josey, S. A., Larsen, K. M. H., Mulet, S., Oltmanns, M., Reverdin, G., Rossby, T., Thierry, V., Valdimarsson, H., and Yashayaev, I.: Ocean circulation causes the largest freshening event for 120 years in eastern subpolar North Atlantic, Nat. Commun., 11, 585, https://doi.org/10.1038/s41467-020-14474-y, 2020.
Howes, E., Stemmann, L., Assailly, C., Irisson, J.-O., Dima, M., Bijma, J., and Gattuso, J.-P.: Pteropod time series from the North Western Mediterranean (1967–2003): impacts of pH and climate variability, Mar. Ecol. Prog. Ser., 531, 193–206, https://doi.org/10.3354/meps11322, 2015.
IPCC: Changing Ocean, Marine Ecosystems, and Dependent Communities, in: The Ocean and Cryosphere in a Changing Climate, Cambridge University Press, 447–588, https://doi.org/10.1017/9781009157964.007, 2022.
Jiang, L.-Q., Feely, R. A., Wanninkhof, R., Greeley, D., Barbero, L., Alin, S., Carter, B. R., Pierrot, D., Featherstone, C., Hooper, J., Melrose, C., Monacci, N., Sharp, J. D., Shellito, S., Xu, Y.-Y., Kozyr, A., Byrne, R. H., Cai, W.-J., Cross, J., Johnson, G. C., Hales, B., Langdon, C., Mathis, J., Salisbury, J., and Townsend, D. W.: Coastal Ocean Data Analysis Product in North America (CODAP-NA) – an internally consistent data product for discrete inorganic carbon, oxygen, and nutrients on the North American ocean margins, Earth Syst. Sci. Data, 13, 2777–2799, https://doi.org/10.5194/essd-13-2777-2021, 2021.
Jiang, L., Dunne, J., Carter, B. R., Tjiputra, J. F., Terhaar, J., Sharp, J. D., Olsen, A., Alin, S., Bakker, D. C., Feely, R. A., Gattuso, J., Hogan, P., Ilyina, T., Lange, N., Lauvset, S. K., Lewis, E. R., Lovato, T., Palmieri, J., Santana‐Falcón, Y., Schwinger, J., Séférian, R., Strand, G., Swart, N., Tanhua, T., Tsujino, H., Wanninkhof, R., Watanabe, M., Yamamoto, A., and Ziehn, T.: Global surface ocean acidification indicators from 1750 to 2100, J. Adv. Model. Earth Sy., 15, e2022MS003563, https://doi.org/10.1029/2022MS003563, 2023.
Jiang, Z.-P., Tyrrell, T., Hydes, D. J., Dai, M., and Hartman, S. E.: Variability of alkalinity and the alkalinity-salinity relationship in the tropical and subtropical surface ocean, Global Biogeochem. Cy., 28, 729–742, https://doi.org/10.1002/2013GB004678, 2014.
Jing, Y., Li, Y., Xu, Y., and Fan, G.: Influences of the NAO on the North Atlantic CO2 fluxes in winter and summer on the interannual scale, Adv. Atmos. Sci., 36, 1288–1298, https://doi.org/10.1007/s00376-019-8247-2, 2019.
Kapsenberg, L., Alliouane, S., Gazeau, F., Mousseau, L., and Gattuso, J.-P.: Coastal ocean acidification and increasing total alkalinity in the northwestern Mediterranean Sea, Ocean Sci., 13, 411–426, https://doi.org/10.5194/os-13-411-2017, 2017.
Khatiwala, S., Tanhua, T., Mikaloff Fletcher, S., Gerber, M., Doney, S. C., Graven, H. D., Gruber, N., McKinley, G. A., Murata, A., Ríos, A. F., and Sabine, C. L.: Global ocean storage of anthropogenic carbon, Biogeosciences, 10, 2169–2191, https://doi.org/10.5194/bg-10-2169-2013, 2013.
Koffi, U., Lefèvre, N., Kouadio, G., and Boutin, J.: Surface CO2 parameters and air-sea CO2 fluxes distribution in the eastern equatorial Altantic Ocean, J. Marine Syst., 82, 135–144, https://doi.org/10.1016/j.jmarsys/2010.04.010, 2010.
Kwiatkowski, L., Torres, O., Bopp, L., Aumont, O., Chamberlain, M., Christian, J. R., Dunne, J. P., Gehlen, M., Ilyina, T., John, J. G., Lenton, A., Li, H., Lovenduski, N. S., Orr, J. C., Palmieri, J., Santana-Falcón, Y., Schwinger, J., Séférian, R., Stock, C. A., Tagliabue, A., Takano, Y., Tjiputra, J., Toyama, K., Tsujino, H., Watanabe, M., Yamamoto, A., Yool, A., and Ziehn, T.: Twenty-first century ocean warming, acidification, deoxygenation, and upper-ocean nutrient and primary production decline from CMIP6 model projections, Biogeosciences, 17, 3439–3470, https://doi.org/10.5194/bg-17-3439-2020, 2020.
Lacoue-Labarthe, T., Nunes, P. A. L. D., Ziveri, P., Cinar, M., Gazeau, F., Hall-Spencer, J. M., Hilmi, N., Moschella, P., Safa, A., Sauzade, D., and Turley, C.: Impacts of ocean acidification in a warming Mediterranean Sea: An overview, Reg. Stud. Mar. Sci., 5, 1–11, https://doi.org/10.1016/j.rsma.2015.12.005, 2016.
Lagoutte, E., Tribollet, A., Bureau, S., Cordier, E., Mangion, P., Chauvin, A., Mouquet, P., Bigot, L., Frouin, P., and Cuet, P.: Biogeochemical evidence of flow re-entrainment on the main fringing reef of La Reunion Island, Mar. Chem., 259, 104352, https://doi.org/10.1016/j.marchem.2024.104352, 2023.
Laika, H. E., Goyet, C., Vouve, F., Poisson, A., and Touratier, F.: Interannual properties of the CO2 system in the Southern Ocean south of Australia, Antarctic Sci., 21, 663–680, https://doi.org/10.1017/S0954102009990319, 2009.
Lan, X., Tans, P., and Thoning, K. W.: Trends in globally-averaged CO2 determined from NOAA Global Monitoring Laboratory measurements, Version 2024-08, https://doi.org/10.15138/9N0H-ZH07, 2024.
Landschützer, P., Gruber, N., Bakker, D. C. E., Stemmler, I., and Six, K. D.: Strengthening seasonal marine CO2 variations due to increasing atmospheric CO2, Nat. Clim. Change, 8, 146–150, https://doi.org/10.1038/s41558-017-0057-x, 2018.
Landschützer, P., Ilyina, T., and Lovenduski, N. S.: Detecting regional modes of variability in observation-based surface ocean pCO2, Geophys. Res. Lett., 46, 2670–2679, https://doi.org/10.1029/2018GL081756, 2019
Lange, N., Fiedler, B., Álvarez, M., Benoit-Cattin, A., Benway, H., Buttigieg, P. L., Coppola, L., Currie, K., Flecha, S., Gerlach, D. S., Honda, M., Huertas, I. E., Lauvset, S. K., Muller-Karger, F., Körtzinger, A., O'Brien, K. M., Ólafsdóttir, S. R., Pacheco, F. C., Rueda-Roa, D., Skjelvan, I., Wakita, M., White, A., and Tanhua, T.: Synthesis Product for Ocean Time Series (SPOTS) – a ship-based biogeochemical pilot, Earth Syst. Sci. Data, 16, 1901–1931, https://doi.org/10.5194/essd-16-1901-2024, 2024.
Laruelle, G. G., Dürr, H. H., Lauerwald, R., Hartmann, J., Slomp, C. P., Goossens, N., and Regnier, P. A. G.: Global multi-scale segmentation of continental and coastal waters from the watersheds to the continental margins, Hydrol. Earth Syst. Sci., 17, 2029–2051, https://doi.org/10.5194/hess-17-2029-2013, 2013.
Laruelle, G. G., Cai, W.-J., Hu, X., Gruber, N., Mackenzie, F. T., and Regnier, P.: Continental shelves as a variable but increasing global sink for atmospheric carbon dioxide, Nat. Commun., 9, 454, https://doi.org/10.1038/s41467-017-02738-z, 2018.
Lauvset, S. K., Lange, N., Tanhua, T., Bittig, H. C., Olsen, A., Kozyr, A., Álvarez, M., Azetsu-Scott, K., Brown, P. J., Carter, B. R., Cotrim da Cunha, L., Hoppema, M., Humphreys, M. P., Ishii, M., Jeansson, E., Murata, A., Müller, J. D., Pérez, F. F., Schirnick, C., Steinfeldt, R., Suzuki, T., Ulfsbo, A., Velo, A., Woosley, R. J., and Key, R. M.: The annual update GLODAPv2.2023: the global interior ocean biogeochemical data product, Earth Syst. Sci. Data, 16, 2047–2072, https://doi.org/10.5194/essd-16-2047-2024, 2024.
Lefèvre, N., Flores Montes, M., Gaspar, F. L., Rocha, C., Jiang, S., De Araújo, M. C., and Ibánhez, J. S. P.: Net Heterotrophy in the Amazon Continental Shelf Changes Rapidly to a Sink of CO2 in the Outer Amazon Plume, Front. Mar. Sci., 4, 278, https://doi.org/10.3389/fmars.2017.00278, 2017.
Lefèvre, N., Mejia, C., Khvorostyanov, D., Beaumont, L., and Koffi, U.: Ocean Circulation Drives the Variability of the Carbon System in the Eastern Tropical Atlantic, Oceans, 2, 126–148, https://doi.org/10.3390/oceans2010008, 2021.
Lefèvre, N., Veleda, D., and Beaumont, L.: Trends and drivers of CO2 parameters, from 2006 to 2021, at a time-series station in the Eastern Tropical Atlantic (6° S, 10° W), Front. Mar. Sci. 11, 1299071, https://doi.org/10.3389/fmars.2024.1299071, 2024.
Leseurre, C., Lo Monaco, C., Reverdin, G., Metzl, N., Fin, J., Olafsdottir, S., and Racapé, V.: Ocean carbonate system variability in the North Atlantic Subpolar surface water (1993–2017), Biogeosciences, 17, 2553–2577, https://doi.org/10.5194/bg-17-2553-2020, 2020.
Leseurre, C., Lo Monaco, C., Reverdin, G., Metzl, N., Fin, J., Mignon, C., and Benito, L.: Summer trends and drivers of sea surface fCO2 and pH changes observed in the southern Indian Ocean over the last two decades (1998–2019), Biogeosciences, 19, 2599–2625, https://doi.org/10.5194/bg-19-2599-2022, 2022.
Li, X., Wu, Z., Ouyang, Z., and Cai, W.-J. : The source and accumulation of anthropogenic carbon in the U.S. East Coast, Sci. Adv., 10, eadl3169, https://doi.org/10.1126/sciadv.adl3169, 2024.
Mathis, M., Lacroix, F., Hagemann, S., Nielsen, D. M., Ilyina, T., and Schrum, C.: Enhanced CO2 uptake of the coastal ocean is dominated by biological carbon fixation, Nat. Clim. Chang., 14, 373–379, https://doi.org/10.1038/s41558-024-01956-w, 2024.
Maugendre, L., Gattuso, J.-P., Louis, J., de Kluijver, A., Marro, S., Soetaert, K., and Gazeau, F.: Effect of ocean warming and acidification on a plankton community in the NW Mediterranean Sea, ICES J. Mar. Sci., 72, 1744–1755, https://doi.org/10.1093/icesjms/fsu161, 2015.
Mercier, H., Lherminier, P., Sarafanov, A., Gaillard, F., Daniault, N., Desbruyères, D., Falina, A., Ferron, B., Huck, T., and Thierry, V.: Variability of the meridional overturning circulation at the Greenland-Portugal Ovide section from 1993 to 2010, Prog. Oceanogr., 132, 250–261, https://doi.org/10.1016/j.pocean.2013.11.001, 2015.
Mercier, H., Desbruyères, D., Lherminier, P., Velo, A., Carracedo, L., Fontela, M., and Pérez, F. F.: New insights into the eastern subpolar North Atlantic meridional overturning circulation from OVIDE, Ocean Sci., 20, 779–797, https://doi.org/10.5194/os-20-779-2024, 2024.
Metzl, N., Brunet, C., Jabaud-Jan, A., Poisson, A., and Schauer, B.: Summer and winter air-sea CO2 fluxes in the Southern Ocean, Deep-Sea Res. Pt. I, 53, 1548–1563, https://doi.org/10.1016/j.dsr.2006.07.006, 2006.
Metzl, N., Corbière, A., Reverdin, G., Lenton, A., Takahashi, T., Olsen, A., Johannessen, T., Pierrot, D., Wanninkhof, R., Ólafsdóttir, S. R., Olafsson, J., and Ramonet, M.: Recent acceleration of the sea surface fCO2 growth rate in the North Atlantic subpolar gyre (1993–2008) revealed by winter observations, Global Biogeochem. Cy., 24, GB4004, https://doi.org/10.1029/2009GB003658, 2010.
Metzl, N., Lo Monaco, C., Leseurre, C., Ridame, C., Fin, J., Mignon, C., Gehlen, M., and Chau, T. T. T.: The impact of the South-East Madagascar Bloom on the oceanic CO2 sink, Biogeosciences, 19, 1451–1468, https://doi.org/10.5194/bg-19-1451-2022, 2022.
Metzl, N., Fin, J., Lo Monaco, C., Mignon, C., Alliouane, S., Antoine, D., Bourdin, G., Boutin, J., Bozec, Y., Conan, P., Coppola, L., Diaz, F., Douville, E., Durrieu de Madron, X., Gattuso, J.-P., Gazeau, F., Golbol, M., Lansard, B., Lefèvre, D., Lefèvre, N., Lombard, F., Louanchi, F., Merlivat, L., Olivier, L., Petrenko, A., Petton, S., Pujo-Pay, M., Rabouille, C., Reverdin, G., Ridame, C., Tribollet, A., Vellucci, V., Wagener, T., and Wimart-Rousseau, C.: A synthesis of ocean total alkalinity and dissolved inorganic carbon measurements from 1993 to 2022: the SNAPO-CO2-v1 dataset, Earth Syst. Sci. Data, 16, 89–120, https://doi.org/10.5194/essd-16-89-2024, 2024a.
Metzl, N., Lo Monaco, C., Leseurre, C., Ridame, C., Reverdin, G., Chau, T. T. T., Chevallier, F., and Gehlen, M.: Anthropogenic CO2, air–sea CO2 fluxes, and acidification in the Southern Ocean: results from a time-series analysis at station OISO-KERFIX (51° S–68° E), Ocean Sci., 20, 725–758, https://doi.org/10.5194/os-20-725-2024, 2024b.
Metzl, N., Fin, J., Lo Monaco, C., Mignon, C., Alliouane, S., Bombled, B., Boutin, J., Bozec, Y., Comeau, S., Conan, P., Coppola, L., Cuet, P., Ferreira, E., Gattuso, J.-P., Gazeau, F., Goyet, C., Grossteffan, E., Lansard, B., Lefèvre, D., Lefèvre, N., Leseurre, C., Lombard, F., Petton, S., Pujo-Pay, M., Rabouille, C., Reverdin, G., Ridame, C., Rimmelin-Maury, P., Ternon, J.-F., Touratier, F., Tribollet, A., Wagener, T., and Wimart-Rousseau, C.: An updated synthesis of ocean total alkalinity and dissolved inorganic carbon measurements from 1993 to 2023: the SNAPO-CO2-v2 dataset, SEANOE [data set], https://doi.org/10.17882/102337, 2024c.
Metzl, N., Lo Monaco, C., Barut, G., and Ternon, J.-F.: Contrasting trends of the ocean CO2 sink and pH in the Agulhas current system and the Mozambique Basin, South-Western Indian Ocean (1963–2023), Deep-Sea Res. Pt. II, 220, 105459, https://doi.org/10.1016/j.dsr2.2025.105459, 2025.
Mu, L., Gomes, H. do R., Burns, S. M., Goes, J. I., Coles, V. J., Rezende, C. E., Thompson, F. L., Moura, R. L., Page, B., and Yager, P. L.: Temporal Variability of Air-Sea CO2 flux in the Western Tropical North Atlantic Influenced by the Amazon River Plume, Global Biogeochem. Cy., 35, e2020GB006798, https://doi.org/10.1029/2020GB006798, 2021.
Munro, D. R., Lovenduski, N. S., Takahashi, T., Stephens, B. B., Newberger, T., and Sweeney, C.: Recent evidence for a strengthening CO2 sink in the Southern Ocean from carbonate system measurements in the Drake Passage (2002–2015), Geophys. Res. Lett., 42, 7623–7630, https://doi.org/10.1002/2015GL065194, 2015.
Müller, J. D., Gruber, N., Carter, B., Feely, R., Ishii, M., Lange, N., Lauvset, S. K., Murata, A., Olsen, A., Pérez, F. F., Sabine, C., Tanhua, T., Wanninkhof, R., and Zhu, D.: Decadal trends in the oceanic storage of anthropogenic carbon from 1994 to 2014, AGU Adv., 4, e2023AV000875, https://doi.org/10.1029/2023AV000875, 2023.
Newton, J. A., Feely, R. A., Jewett, E. B., Williamson, P., and Mathis, J.: Global Ocean Acidification Observing Network: Requirements and Governance Plan, 2nd Edn., GOA-ON, https://www.iaea.org/sites/default/files/18/06/goa-on-second-edition-2015.pdf (last access: 22 January 2025), 2015.
Olafsson, J., Olafsdottir, S. R., Benoit-Cattin, A., and Takahashi, T.: The Irminger Sea and the Iceland Sea time series measurements of sea water carbon and nutrient chemistry 1983–2008, Earth Syst. Sci. Data, 2, 99–104, https://doi.org/10.5194/essd-2-99-2010, 2010.
Olivier, L., Boutin, J., Reverdin, G., Lefèvre, N., Landschützer, P., Speich, S., Karstensen, J., Labaste, M., Noisel, C., Ritschel, M., Steinhoff, T., and Wanninkhof, R.: Wintertime process study of the North Brazil Current rings reveals the region as a larger sink for CO2 than expected, Biogeosciences, 19, 2969–2988, https://doi.org/10.5194/bg-19-2969-2022, 2022.
Olsen, A., Key, R. M., van Heuven, S., Lauvset, S. K., Velo, A., Lin, X., Schirnick, C., Kozyr, A., Tanhua, T., Hoppema, M., Jutterström, S., Steinfeldt, R., Jeansson, E., Ishii, M., Pérez, F. F., and Suzuki, T.: The Global Ocean Data Analysis Project version 2 (GLODAPv2) – an internally consistent data product for the world ocean, Earth Syst. Sci. Data, 8, 297–323, https://doi.org/10.5194/essd-8-297-2016, 2016.
Oudot, C., Ternon, J. F., and Lecomte, J.: Measurements of atmospheric and oceanic CO2 in the tropical Atlantic: 10 years after the 1982–1984 FOCAL cruises, Tellus B, 47, 70–85, https://doi.org/10.3402/tellusb.v47i1-2.16032, 1995
Padin, X. A., Velo, A., and Pérez, F. F.: ARIOS: a database for ocean acidification assessment in the Iberian upwelling system (1976–2018), Earth Syst. Sci. Data, 12, 2647–2663, https://doi.org/10.5194/essd-12-2647-2020, 2020.
Palacio-Castro, A. M., Enochs, I. C., Besemer, N., Boyd, A., Jankulak, M., Kolodziej, G., Hirsh, H. K., Webb, A. E., Towle, E. K., Kelble, C., Smith, I., and Manzello, D. P.: Coral reef carbonate chemistry reveals interannual, seasonal, and spatial impacts on ocean acidification off Florida, Global Biogeochem. Cy., 37, e2023GB007789, https://doi.org/10.1029/2023GB007789, 2023.
Pardo, P. C., Tilbrook, B., Langlais, C., Trull, T. W., and Rintoul, S. R.: Carbon uptake and biogeochemical change in the Southern Ocean, south of Tasmania, Biogeosciences, 14, 5217–5237, https://doi.org/10.5194/bg-14-5217-2017, 2017.
Pérez, F. F., Becker, M., Goris, N., Gehlen, M., López-Mozos, M., Tjiputra, J., Olsen, A., Müller, J. D., Huertas, I. E., Chau, T. T. T., Cainzos, V., Velo, A., Benard, G., Hauck, J., Gruber, N., and Wanninkhof, R.: An assessment of CO2 storage and sea-air fluxes for the Atlantic Ocean and Mediterranean Sea between 1985 and 2018, Global Biogeochem. Cy., 38, e2023GB007862, https://doi.org/10.1029/2023GB007862, 2024.
Petton, S., Pernet, F., Le Roy, V., Huber, M., Martin, S., Macé, É., Bozec, Y., Loisel, S., Rimmelin-Maury, P., Grossteffan, É., Repecaud, M., Quemener, L., Retho, M., Manac'h, S., Papin, M., Pineau, P., Lacoue-Labarthe, T., Deborde, J., Costes, L., Polsenaere, P., Rigouin, L., Benhamou, J., Gouriou, L., Lequeux, J., Labourdette, N., Savoye, N., Messiaen, G., Foucault, E., Ouisse, V., Richard, M., Lagarde, F., Voron, F., Kempf, V., Mas, S., Giannecchini, L., Vidussi, F., Mostajir, B., Leredde, Y., Alliouane, S., Gattuso, J.-P., and Gazeau, F.: French coastal network for carbonate system monitoring: the CocoriCO2 dataset, Earth Syst. Sci. Data, 16, 1667–1688, https://doi.org/10.5194/essd-16-1667-2024, 2024.
Poisson, A., Culkin, F., and Ridout, P.: Intercomparison of CO2 measurements, Deep-Sea Res. Pt. A., 37, 1647–1650, https://doi.org/10.1016/0198-0149(90)90067-6, 1990.
Regnier, P., Friedlingstein, P., Ciais, P., Mackenzie, F. T., Gruber, N., Janssens, I. A., Laruelle, G. G., Lauerwald, R., Luyssaert, S., Andersson, A. J., Arndt, S., Arnosti, C., Borges, A. V., Dale, A. W., Gallego Sala, A., Goddéris, Y., Goossens, N., Hartmann, J., Heinze, C., Ilyina, T., Joos, F., LaRowe, D. E., Leifeld, J., Meysman, F. J. R., Munhoven, G., Raymond, P. A., Spahni, R., Suntharalingam P., and Thullner, M.: Anthropogenic perturbation of the carbon fluxes from land to ocean, Nat. Geosci., 6, 597–607, 2013.
Resplandy, L., Hogikyan, A., Müller, J. D., Najjar, R. G., Bange, H. W., Bianchi, D., Weber, T., Cai, W.-J., Doney, S. C., Fennel, K., Gehlen, M., Hauck, J., Lacroix, F., Landschützer, P., Le Quéré, C., Roobaert, A., Schwinger, J., Berthet, S., Bopp, L., Chau, T. T. T., Dai, M., Gruber, N., Ilyina, T., Kock, A., Manizza, M., Lachkar, Z., Laruelle, G. G., Liao, E., Lima, I. D., Nissen, C., Rödenbeck, C., Séférian, R., Toyama, K., Tsujino, H., and Regnier, P.: A synthesis of global coastal ocean greenhouse gas fluxes, Global Biogeochem. Cy., 38, e2023GB007803, https://doi.org/10.1029/2023GB007803, 2024.
Revelle, R. and Suess, H. E.: Carbon dioxide exchange between atmosphere and ocean and the question of an increase of atmospheric CO2 during the past decades, Tellus, 9, 18–27, https://doi.org/10.1111/j.2153-3490.1957.tb01849.x, 1957.
Reverdin, G., Metzl, N., Olafsdottir, S., Racapé, V., Takahashi, T., Benetti, M., Valdimarsson, H., Benoit-Cattin, A., Danielsen, M., Fin, J., Naamar, A., Pierrot, D., Sullivan, K., Bringas, F., and Goni, G.: SURATLANT: a 1993–2017 surface sampling in the central part of the North Atlantic subpolar gyre, Earth Syst. Sci. Data, 10, 1901–1924, https://doi.org/10.5194/essd-10-1901-2018, 2018.
Rodgers, K. B., Schwinger, J., Fassbender, A. J., Landschützer, P., Yamaguchi, R., Frenzel, H., Stein, K., Müller, J. D., Goris, N., Sharma, S., Bushinsky, S., Chau, T. T. T., Gehlen, M., Gallego, M. A., Gloege, L., Gregor, L., Gruber, N., Hauck, J., Iida, Y., Ishii, M., Keppler, L., Kim, J.-E., Schlunegger, S., Tjiputra, J., Toyama, K., Ayar, P. V., and Velo, A.: Seasonal variability of the surface ocean carbon cycle: A synthesis, Global Biogeochem. Cy., 37, e2023GB007798, https://doi.org/10.1029/2023GB007798, 2023
Roobaert, A., Resplandy, L., Laruelle, G. G., Liao, E., and Regnier, P.: Unraveling the physical and biological controls of the global coastal CO2 sink, Global Biogeochem. Cy., 38, e2023GB007799, https://doi.org/10.1029/2023GB007799, 2024a.
Roobaert, A., Regnier, P., Landschützer, P., and Laruelle, G. G.: A novel sea surface pCO2-product for the global coastal ocean resolving trends over 1982–2020, Earth Syst. Sci. Data, 16, 421–441, https://doi.org/10.5194/essd-16-421-2024, 2024b.
Sarma, V. V. S. S., Krishna, M. S., Paul, Y. S., and Murty, V. S. N.: Observed changes in ocean acidity and carbon dioxide exchange in the coastal bay of Bengal – A link to air pollution, Tellus B, 67, 24638, https://doi.org/10.3402/tellusb.v67.24638, 2015.
Sarma, V. V. S. S., Sridevi, B., Metzl, N., Patra, P. K., Lachkar, Z., Chakraborty, K., Goyet, C., Levy, M., Mehari, M., and Chandra, N.: Air-sea fluxes of CO2 in the Indian Ocean between 1985 and 2018: A synthesis based on observation-based surface CO2, hindcast and atmospheric inversion models, Global Biogeochem. Cy., 37, e2023GB007694, https://doi.org/10.1029/2023GB007694, 2023.
Sarmiento, J. L., Johnson, K. S., Arteaga, L. A., Bushinsky, S. M., Cullen, H. M., Gray, A. R., Hotinski, R. M., Maurer, T. L., Mazloff, M. R., Riser, S. C., Russell, J. L., Schofield, O. M., and Talley, L. D.: The Southern Ocean Carbon and Climate Observations and Modeling (SOCCOM) project: A review, Prog. Oceanogr., 2019, 103130, https://doi.org/10.1016/j.pocean.2023.103130, 2023.
Schlitzer, R.: Ocean Data View, Ocean Data View, http://odv.awi.de (last access: 13 March 2019), 2018.
Schneider, A., Wallace, D. W. R., and Körtzinger, A.: Alkalinity of the Mediterranean Sea, Geophys. Res. Lett., 34, L15608, https://doi.org/10.1029/2006GL028842, 2007.
Schuster, U., McKinley, G. A., Bates, N., Chevallier, F., Doney, S. C., Fay, A. R., González-Dávila, M., Gruber, N., Jones, S., Krijnen, J., Landschützer, P., Lefèvre, N., Manizza, M., Mathis, J., Metzl, N., Olsen, A., Rios, A. F., Rödenbeck, C., Santana-Casiano, J. M., Takahashi, T., Wanninkhof, R., and Watson, A. J.: An assessment of the Atlantic and Arctic sea–air CO2 fluxes, 1990–2009, Biogeosciences, 10, 607–627, https://doi.org/10.5194/bg-10-607-2013, 2013.
Shadwick, E., Rintoul, S., Tilbrook, B., Williams, G., Young, N., Fraser, A. D., Marchant, H., Smith, J., and Tamura, T.: Glacier tongue calving reduced dense water formation and enhanced carbon uptake, Geophys. Res. Lett., 40, 904–909, https://doi.org/10.1002/grl.50178, 2013.
Shadwick, E. H., Tilbrook, B., and Williams, G. D.: Carbonate chemistry in the Mertz Polynya (East Antarctica): Biological and physical modification of dense water outflows and the export of anthropogenic CO2, J. Geophys. Res. Oceans, 119, 1–14, https://doi.org/10.1002/2013JC009286, 2014.
Shadwick, E. H., Trull, T. W., Tilbrook, B., Sutton, A. J., Schulz, E., and Sabine, C. L.: Seasonality of biological and physical controls on surface ocean CO2 from hourly observations at the Southern Ocean Time Series site south of Australia, Global Biogeochem. Cy., 29, 223–238, https://doi.org/10.1002/2014GB004906, 2015.
Shadwick, E. H., Wynn-Edwards, C. A., Matear, R. J., Jansen, P., Schulz, E., and Sutton, A. J.: Observed amplification of the seasonal CO2 cycle at the Southern Ocean Time Series, Front. Mar. Sci., 10, 1281854, https://doi.org/10.3389/fmars.2023.1281854, 2023.
Siddiqui, A. H., Haine, T. W. N., Nguyen, A. T., and Buckley, M. W.: Controls on upper ocean salinity variability in the eastern subpolar North Atlantic during 1992–2017, J. Geophys. Rese.-Oceans, 129, e2024JC020887, https://doi.org/10.1029/2024JC020887, 2024.
SNAPO-CO2: ODV collection, https://explore.webodv.awi.de/ocean/carbon/snapo-co2/ (last access: 22 January 2025), 2024.
Sridevi, B. and Sarma, V. V. S. S.: Role of river discharge and warming on ocean acidification and pco2 levels in the Bay of Bengal, Tellus B, 73, 1–20, https://doi.org/10.1080/16000889.2021.1971924, 2021.
Sutton, A. J., Battisti, R., Carter, B., Evans, W., Newton, J., Alin, S., Bates, N. R., Cai, W.-J., Currie, K., Feely, R. A., Sabine, C., Tanhua, T., Tilbrook, B., and Wanninkhof, R.: Advancing best practices for assessing trends of ocean acidification time series. Frontiers in Marine Science, 9: 1045667. https://doi.org/10.3389/fmars.2022.1045667, 2022
Takahashi, T., Sutherland, S. C., Wanninkhof, R., Sweeney, C., Feely, R. A., Chipman, D. W., Hales, B., Friederich, G., Chavez, F., Sabine, C., Watson, A. J., Bakker, D. C., Schuster, U., Metzl, N., Yoshikawa-Inoue, H., Ishii, M., Midorikawa, T., Nojiri, Y., Körtzinger, A., Steinhoff, T., Hoppema, M., Olafsson, J., Arnarson, T. S., Tilbrook, B., Johannessen, T., Olsen, A., Bellerby, R., Wong, C., Delille, B., Bates, N., and de Baar, H. J.: Climatological mean and decadal change in surface ocean pCO2, and net sea air CO2 flux over the global oceans, Deep-Sea Res. Pt. II, 56, 554–577, https://doi.org/10.1016/j.dsr2.2008.12.009, 2009.
Takahashi, T., Sutherland, S. C., Chipman, D. W., Goddard, J. G., Ho, C., Newberger, T., Sweeney, C. and Munro, D. R.: Climatological distributions of pH, pCO2, total CO2, alkalinity, and CaCO3 saturation in the global surface ocean, and temporal changes at selected locations, Mar. Chem., 164, 95–125, https://doi.org/10.1016/j.marchem.2014.06.004, 2014.
Ternon, J.-F., Oudot, C., Dessier, A., and Diverres, D.: A seasonal tropical sink for atmospheric CO2 in the Atlantic ocean: the role of the Amazon River discharge, Mar. Chem., 68, 183–201, https://doi.org/10.1016/S0304-4203(99)00077-8, 2000.
Thomas, H., Prowe, A. E. F., Lima, I. D., Doney, S. C., Wanninkhof, R., Greatbatch, R. J., Schuster, U., and Corbière, A.: Changes in the North Atlantic Oscillation influence CO2 uptake in the North Atlantic over the past 2 decades, Global Biogeochem. Cy., 22, GB4027, https://doi.org/10.1029/2007GB003167, 2008.
Tilbrook, B., Jewett, E. B., DeGrandpre, M. D., Hernandez-Ayon, J. M., Feely, R. A., Gledhill, D. K., Hansson, L., Isensee, K., Kurz, M. L., Newton, J. A., Siedlecki, S. A., Chai, F., Dupont, S., Graco, M., Calvo, E., Greeley, D., Kapsenberg, L., Lebrec, M., Pelejero, C., Schoo, K. L., and Telszewski, M.: An Enhanced Ocean Acidification Observing Network: From People to Technology to Data Synthesis and Information Exchange, Front. Mar Sci., 6, 337, https://doi.org/10.3389/fmars.2019.00337, 2019.
Touratier, F. and Goyet, C.: Decadal evolution of anthropogenic CO2 in the north western Mediterranean Sea from the mid-1990's to the mid-2000's, Deep-Sea Res. Pt. I, 56, 1708–1716, https://doi.org/10.1016/j.dsr.2009.05.015, 2009.
Ulses, C., Estournel, C., Fourrier, M., Coppola, L., Kessouri, F., Lefèvre, D., and Marsaleix, P.: Oxygen budget of the north-western Mediterranean deep- convection region, Biogeosciences, 18, 937–960, https://doi.org/10.5194/bg-18-937-2021, 2021.
Ulses, C., Estournel, C., Marsaleix, P., Soetaert, K., Fourrier, M., Coppola, L., Lefèvre, D., Touratier, F., Goyet, C., Guglielmi, V., Kessouri, F., Testor, P., and Durrieu de Madron, X.: Seasonal dynamics and annual budget of dissolved inorganic carbon in the northwestern Mediterranean deep-convection region, Biogeosciences, 20, 4683–4710, https://doi.org/10.5194/bg-20-4683-2023, 2023.
UNESCO: Intercomparison of total alkalinity and total inorganic carbon determinations in seawater, UNESCO Tech. Pap. Mar. Sci., 59, https://www.jodc.go.jp/jodcweb/info/ioc_doc/UNESCO_tech/090199eb.pdf (last access: 22 December 2023), 1990.
UNESCO: Reference materials for oceanic carbon dioxide measurements, UNESCO Tech. Pap. Mar. Sci., 60, https://www.jodc.go.jp/jodcweb/info/ioc_doc/UNESCO_tech/090200eb.pdf (last access: 22 December 2023), 1991.
Vance, J. M., Currie, K., Suanda, S. H., and Law, C. S.: Drivers of seasonal to decadal mixed layer carbon cycle variability in subantarctic water in the Munida Time Series, Front. Mar. Sci., 11, 1309560, https://doi.org/10.3389/fmars.2024.1309560, 2024.
von Schuckmann, K., Minière, A., Gues, F., Cuesta-Valero, F. J., Kirchengast, G., Adusumilli, S., Straneo, F., Ablain, M., Allan, R. P., Barker, P. M., Beltrami, H., Blazquez, A., Boyer, T., Cheng, L., Church, J., Desbruyeres, D., Dolman, H., Domingues, C. M., García-García, A., Giglio, D., Gilson, J. E., Gorfer, M., Haimberger, L., Hakuba, M. Z., Hendricks, S., Hosoda, S., Johnson, G. C., Killick, R., King, B., Kolodziejczyk, N., Korosov, A., Krinner, G., Kuusela, M., Landerer, F. W., Langer, M., Lavergne, T., Lawrence, I., Li, Y., Lyman, J., Marti, F., Marzeion, B., Mayer, M., MacDougall, A. H., McDougall, T., Monselesan, D. P., Nitzbon, J., Otosaka, I., Peng, J., Purkey, S., Roemmich, D., Sato, K., Sato, K., Savita, A., Schweiger, A., Shepherd, A., Seneviratne, S. I., Simons, L., Slater, D. A., Slater, T., Steiner, A. K., Suga, T., Szekely, T., Thiery, W., Timmermans, M.-L., Vanderkelen, I., Wjiffels, S. E., Wu, T., and Zemp, M.: Heat stored in the Earth system 1960–2020: where does the energy go?, Earth Syst. Sci. Data, 15, 1675–1709, https://doi.org/10.5194/essd-15-1675-2023, 2023.
Wagener, T., Metzl, N., Caffin, M., Fin, J., Helias Nunige, S., Lefevre, D., Lo Monaco, C., Rougier, G., and Moutin, T.: Carbonate system distribution, anthropogenic carbon and acidification in the western tropical South Pacific (OUTPACE 2015 transect), Biogeosciences, 15, 5221–5236, https://doi.org/10.5194/bg-15-5221-2018, 2018.
Wimart-Rousseau, C., Lajaunie-Salla, K., Marrec, P., Wagener, T., Raimbault, P., Lagadec, V., Lafont, M., Garcia, N., Diaz, F., Pinazo, C., Yohia, C., Garcia, F., Xueref-Remy,I., Blanc, P.-E., Armengaud, A., and Lefèvre, D.: Temporal variability of the carbonate system and air-sea CO2 exchanges in a Mediterranean human-impacted coastal site, Estuar. Coast. Shelf S., 236, 106641, https://doi.org/10.1016/j.ecss.2020.106641, 2020.
Wimart-Rousseau, C., Wagener, T., Bosse, A., Raimbault, P., Coppola, L., Fourrier, M., Ulses, C., and Lefèvre, D.: Assessing seasonal and interannual changes in carbonate chemistry across two timeseries sites in the North Western Mediterranean Sea., Front. Mar. Sci., 10, 1281003, https://doi.org/10.3389/fmars.2023.1281003, 2023.
WMO/GCOS: Global Climate Indicators, https://gcos.wmo.int/en/global-climate-indicators (last access: 22 December 2023), 2018.
Yao, M. K., Marcou, O., Goyet, C., Guglielmi, V., Touratier, F., and Savy, J.-P.: Time variability of the north-western Mediterranean Sea pH over 1995–2011, Mar. Environ. Res., 116, 51–60, https://doi.org/10.1016/j.marenvres.2016.02.016, 2016.
Yoder, M. F., Palevsky, H. I., and Fogaren, K. E.: Net community production and inorganic carbon cycling in the central Irminger Sea, J. Geophys. Res.-Oceans, 129, e2024JC021027, https://doi.org/10.1029/2024JC021027, 2024.
Zhang, S., Wu, Y., Cai, W.-J., Cai, W., Feely, R. A., Wang, Z., Tanhua, T., Wang, Y., Liu, C., Li, X., Yang, Q., Ding, M., Xu, Z., Kerr, R., Luo, Y., Cheng, X., Chen, L., and Qi, D.: Transport of anthropogenic carbon from the Antarctic shelf to deep Southern Ocean triggers acidification, Global Biogeochem. Cy., 37, e2023GB007921, https://doi.org/10.1029/2023GB007921, 2023.
- Abstract
- Introduction
- Data collection
- Method, accuracy, repeatability, and quality control
- Global AT and CT distribution based on the SNAPO-CO2-v2 dataset
- Regional AT and CT distributions and trends based on the SNAPO-CO2 dataset
- Data availability
- Summary and suggestions
- Author contributions
- Competing interests
- Disclaimer
- Acknowledgements
- Financial support
- Review statement
- References
- Supplement