the Creative Commons Attribution 4.0 License.
the Creative Commons Attribution 4.0 License.
MASCS 1.0: synchronous atmospheric and oceanic data from a cross-shaped moored array in the northern South China Sea during 2014–2015
Dake Chen
Tongya Liu
Di Tian
Min He
Qi Li
Guofei Wei
Jian Liu
This work presents a cross-shaped moored array dataset (MASCS 1.0) comprising five buoys and four moorings with synchronous atmospheric and oceanic data in the northern South China Sea during 2014–2015. The atmospheric data are observed by two meteorological instruments at the buoys. The oceanic data consist of sea surface waves measured using a wave recorder, temperature, and salinity from the surface to a depth of 400 m and at 10 and 50 m above the ocean bottom using conductivity, temperature, and depth recorders. They also include currents from the surface to a depth of 850 m measured using acoustic Doppler current profilers and measured at 10, 50, and 100 m above the floor using current meters. Additional measurements were taken for sea surface radiation, air visibility, chlorophyll, turbidity, and chromophoric dissolved organic matter at buoy 3 located at the center of the moored array. The data reveal air–sea interactions and oceanic processes in the upper and bottom ocean, especially the transition of the air–sea interface and ocean conditions from summer to winter monsoon and the effects of six tropical cyclones on the moored array. Multiscale processes were also recorded, such as air–sea fluxes, tides, internal waves, and low-frequency flows. The data are valuable and have many potential applications, including analyzing the phenomena and mechanisms of air–sea interactions and ocean dynamics and validating and improving numerical model simulations, data reanalysis, and assimilations. All the data described here are made publicly available at https://doi.org/10.5281/zenodo.14039870 (Zhang et al., 2024a).
- Article
(9478 KB) - Full-text XML
- BibTeX
- EndNote
The South China Sea (SCS) is a semi-enclosed marginal sea with a deep basin, making it the largest marginal sea in the tropics, covering approximately 3.5×10⁶ km2. The SCS is also the largest marginal sea in the western Pacific and is known for its powerful internal tides and abundant internal waves (Alford et al., 2015). Mesoscale eddies in the SCS transport heat and salt from the Kuroshio loop near the Luzon Strait (Yang et al., 2019) and modulate sea surface fields (Tan et al., 2023). The background circulations in the SCS are cyclonic in the upper and deep layers, whereas they are anticyclonic in the middle layer (Cai et al., 2020). The three factors contributing to the generally cyclonic gyre in the upper ocean of the northern SCS (Jilan, 2004; Liu et al., 2008) are (1) quasi-seasonal wind forcing, (2) net water transport into the SCS through the Luzon Strait, and (3) vorticity advection from the Kuroshio. The Kuroshio carrying the northwestern Pacific water intrudes into the SCS through the Luzon Strait (Nan et al., 2015).
Atmospheric forcing significantly influences the SCS, such as monsoons (Chen et al., 2023, 2022), tropical cyclones (TCs) (Guan et al., 2024; Shan et al., 2023), and the world's strongest boreal summer quasi-biweekly oscillation (Qi et al., 2023). Marine heat waves (Wang et al., 2022) and air–sea heat flux variations (Song et al., 2023; Zhang, 2023) are also observed in the northern SCS. This sector features broad continental shelves and steep continental slopes, leading to complex local ocean dynamical processes. For example, breaking internal tides on the continental slope induce along-slope deep-sea bottom currents (Xie et al., 2018), and cross-isobathic motions of the water column or synoptic processes (e.g., TCs) induce continental shelf waves, such as topographic Rossby (Wang et al., 2019) and Kelvin (Li et al., 2024) waves.
Due to the complexity of air–sea interaction and oceanic processes in the SCS, local in situ observations are essential for uncovering their phenomena and mechanisms. From 2014 to 2015, a cross-shaped moored array comprising five buoys and four moorings was deployed in the northern SCS to acquire sea surface meteorological and upper and near-bottom oceanic data. This study lists the details of these observations and the resulting dataset. Some data have already been used in several studies focusing on air–sea heat flux, ocean temperature–salinity, and dynamical responses to TCs (Zhang et al., 2016, 2018; Liu et al., 2020; Zhang, 2023) to investigate the effect of drag coefficients on surface heat flux during typhoons (Liu et al., 2022), the influence of typhoons on preexisting eddies (He et al., 2024), ocean mixing and heat flux by near-inertial waves (Hong et al., 2022; Lu et al., 2024), and sea surface wind patterns (Zhang et al., 2020) and to compare microseism signals generated by typhoons (Lin et al., 2022), the validity of numerical model simulations (Wu et al., 2020; Lim Kam Sian et al., 2020; Lu et al., 2023), and deep-ocean energy variability in the SCS (Quan et al., 2022). However, the full potential of this dataset has yet to be realized.
2.1 Positions of buoys and moorings
The observation array comprised five buoys (B1–B5) and four moorings (M1, M2, M4, and M5) in the northern SCS (Figs. 1 and 2), deployed from June to September 2014 and recovered from September 2014 to March 2015 (Table 1). The water depth at B1 and M1 was approximately 1600 m, whereas the depths at the other stations were greater than 3000 m. TCs significantly influenced the observations (Fig. 1), including Hagibis in June, Rammasun and Matmo in July, Kalmaegi and Fung-wong in September, and Hagupit in December. The information regarding these TCs was obtained from the China Meteorological Administration (https://tcdata.typhoon.org.cn/en/zjljsjj.html, last access: 5 November 2024), which is more accurate for TCs affecting China (Lu et al., 2021; Ying et al., 2014). Although the designs of some buoys and moorings have been shown in previous studies (Zhang et al., 2016; Zhang, 2023), the designs of all the stations are redrawn to give more accurate information on the deployment of the instruments (Figs. 1b and 3).
Table 1 shows the locations of the observation stations and their time ranges. M1, M2, M4, and M5 were deployed during 8–10 June 2014 and successfully recovered during 29–31 March 2015 (Table 1). B1 was deployed on 19 June 2014 and maintained once on 5 September 2014. It lost contact on 15 October and was not recovered by two cruises from 23 March to 4 April 2015. B2 and B4 were deployed on 29 July and 20 June 2014, respectively, and recovered on 30 March 2015. B4 was maintained once on 30 July 2014. B3 was deployed on 11 September 2014. The tether of B3 snapped on 15 September 2014, when typhoon Kalmaegi passed over the observation array (Zhang et al., 2016). B3 then became adrift, initially moving northeastward with circular tracks (Fig. 2a) attributed to the rightward advection and near-inertial surface currents induced by the typhoon. B3 returned to its initial location on 21 September 2014, moved eastward and turned back on 25 September 2014, and followed a southwestward track after that (Fig. 2a). A ship recovered B3 on 17 October 2014, and it was brought back to land on 21 October 2014. The moored part of B3 was recovered on 31 March 2015. B5 was deployed on 26 August 2014 and lost contact on 11 October 2014. The moored part of B5 was recovered on 31 March 2015. The horizontal movement of the buoys was minimal during the observations because they primarily moved in a circular region with a radius shorter than 3 km (Fig. 2b–e). Typhoon Kalmaegi also increased the horizontal circular movement of B1 to approximately 4 km on the northwestern side on 15 September 2014, which was attributed to the northwestward winds on the right side of the typhoon, indicating that the typhoon moved the anchor of B1 northwestward because its tether length was approximately 2 km (nearly half of 4 km) (Figs. 2c and 3a).
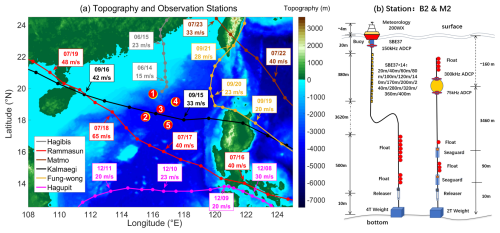
Figure 1(a) Topography (m) map with the positions and deployed locations of the buoys (red dots) and moorings (yellow dots). (b) The designs of buoy 2 (B2) and mooring 2 (M2) are shown as examples; the dot-and-dash line indicates the tether length in the middle water of the buoy, and the dashed lines indicate the depths of the two ADCPs at the top of the mooring. The tracks of the TCs are shown (colored lines), together with their positions every 6 h (dots). The text boxes indicate the dates and the sustained maximum wind speed at 00:00 UTC on each date.
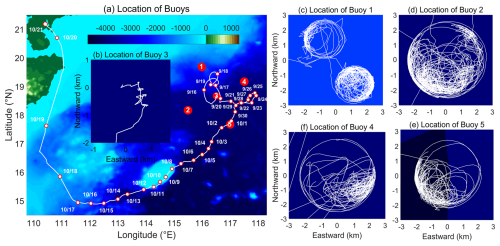
Figure 2(a) Distributions of the buoy locations, with the track of buoy 3 (B3). (b–e) Tracks of buoys 3, 1, 2, 4, and 5 (B3, B1, B2, B4, and B5) with their locations relative to their initial deployed positions in the northward and eastward directions (km). The white lines represent the buoy tracks, and the white hollow dots indicate the positions of B3 every day after 15 September 2014, when its tether snapped and it became adrift.
Table 1Information of the observation station.

* B1 was lost and not recovered, and the end time of B1 represents the latest time when observation data were received. Otherwise, the time range represents the deployment and recovery times for the stations.
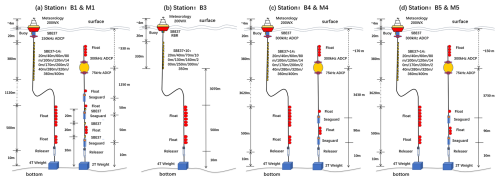
Figure 3Design of stations 1, 3, 4, and 5. Note that all the stations have a buoy and a mooring, except station 3, which only has a buoy. The dot-and-dash lines indicate the tether length in the middle water of the buoy, whereas the dashed lines indicate the depths of the two ADCPs at the top of the mooring.
Table 2Observation data details at each station.
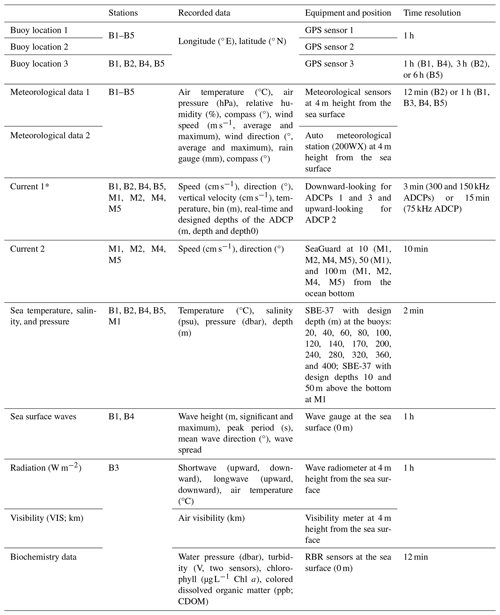
* ADCP 1 was the downward-looking ADCP deployed at the buoy, and ADCPs 2 and 3 were the upward- and downward-looking ADCPs on the mooring. The 300 kHz ADCPs were binned at 4 m, with the first bin at 8 m (B4) or 6.24 m (M1, M2) and the last bin at 124 m (B4) or 122.24 m (M1, M2). The 150 kHz ADCPs were binned at 8 m, with the first bin at 14 m and the last bin at 246 m. The 75 kHz ADCPs were binned in 16 m intervals, with the first bin at 24.7 m and the last bin at 568.7 m. ADCP 1 at B5 was lost during the observations, and no data were recovered.
2.2 Dataset description
The dataset comprises 52 files in netcdf file (.nc) format containing air and ocean observation data and the positions of the buoys during 2014–2015, along with a metadata file in .txt format to briefly introduce the data. The observation instruments were calibrated before deployment. After output from the observation instruments, the observation data are transformed directly into netcdf files, with the units and fill values labeled. No special modification or quality control was applied to keep the original output data unchanged. All the files include Coordinated Universal Time (UTC) and local time, which is 8 h ahead of UTC (UTC+8) since 1 January 0000, 00:00:00. The local time is also called China Standard Time or Beijing Time. The location data are longitude (° E) and latitude (° N), observed by Global Positioning System (GPS) sensors. B1, B2, B4, and B5 had three GPS sensors, and B3 had two. Location-1 data were obtained from the primary GPS sensors on the bodies of the buoys, location-2 data were obtained from the GPS sensors approximately 4 m above the sea surface, and location-3 data were obtained from the low-frequency GPS sensors at the bottoms of the buoys (approximately 0 m). The measurement accuracies of the GPS sensors were <50 m.
The air data include observations approximately 4 m above the sea surface from the meteorological sensors (meteorology data) and the automatic meteorological station (200WX data). Two meteorological stations are deployed on the buoys to provide a backup if the sensors of a meteorological station break down during observation. The 200WX data are similar to the meteorology data but exclude rain gauge data. The wind direction indicates the direction of the incoming wind; for example, 0° indicates wind passing from north to south, and 90° indicates wind passing from east to west. The compass indicates the direction of the meteorological sensors or stations, referring to the attitude of the sensors or stations. For the measurement accuracies of 200WX, the air pressure is ±1 hPa, the air temperature accuracy is ±1.1 °C, the relative humidity is ±5 %, the compass is 1° for static heading and 2° for dynamic heading, and the measurement accuracy of wind differs under dry and wet conditions. Under dry conditions, the wind speed accuracy is 0.5 m s % of the reading for low winds (0–5 m s−1) or a greater value of 1 m s−1 or 10 % for high winds (5–40 m s−1), and the wind direction accuracy is 5° for low winds (2–5 m s−1) and 2° for high winds (>5 m s−1). Under wet conditions, the wind speed accuracy is 2.5 m s−1 and 8°. The measurement accuracy of the meteorological sensors is on the same order as 200WX. For the meteorology data of B3, there was a visibility meter to measure air visibility (km), a Campbell Scientific NR01 four-component net radiometer approximately 4 m above the sea surface with outputs every 1 h, measured upward and downward shortwave and longwave radiation (W m−2), and air temperature observed by the radiometer (°C). The measurement accuracy is ±10 % of the measurement range for air visibility, <2.4 % for shortwave radiation, and <7 % for longwave radiation.
The ocean data include sea surface waves observed by a TRIAXYS™ wave recorder (wave data); the temperature, salinity, and pressure using conductivity, temperature, and depth (CTD) recorders observed by Sea-Bird Scientific 37 recorders (SBE-37 data); currents observed by a Teledyne RD Instruments (TRDI) acoustic Doppler current profiler (ADCP data); currents observed by an Aanderaa Data Instruments SeaGuard recording current meter (SeaGuard data); and biochemistry data observed by multiparameter Richard Brancker Research (RBR) sensors (RBR data). The 75 kHz ADCP was a TRDI Workhorse Long Ranger, the 150 kHz ADCP was a TRDI Workhorse Quartermaster, and the 300 kHz ADCP was a TRDI Workhorse Sentinel. The sea surface wave data include significant wave height (m), maximum wave height (m), mean wave direction (°), peak period (s), and wave spread (Table 2). The observation accuracy is better than 2 % of the measurement range for pressure for the wave height and period and ±1° for the wave direction. Wave recorders were deployed on B1, B4, and B5, but the wave recorder on B5 broke down, resulting in low-quality data. Consequently, only sea surface wave data from B1 and B4 were included in the ocean data.
The SBE-37 data include the temperature (°C), salinity (psu), and pressure (dbar) observed by the SBE-37 CTD sensors. The measurement accuracies of SBE-37 are ±0.002 °C (−5 to 35 °C) or ±0.01 °C (35–45 °C) for temperature, ±0.0003 S m−1 for electrical conductivity, and 1 % for pressure. Serial 1–15 in the SBE data refer to the SBE-37 sensors from the surface to the ocean bottom. All the SBE sensors are deployed on the buoys, except for three SBE-37s on the moorings near the ocean bottom (Figs. 1b and 2). The SBE-37 strings on B1 and B3 were lost during the deployment; therefore, only SBE data at the sea surface at the bottom of the buoy (Temperature1, Salinity1, and Pressure1) were obtained. Two SBEs on B4 broke down during observation, resulting in data from only 13 SBEs. The ADCP data comprise the current speed (cm s−1), the current direction (°), the temperature observed by the ADCP (°C), the depth of the ADCP (m), the designed depth (depth0), and the bin intervals of the ADCP observation (m). The SeaGuard data include the current speed (cm s−1) and direction (°). Unlike wind direction, current direction indicates the direction of the current flow; for example, 0° indicates the current passing from south to north, and 90° indicates the current passing from west to east. In the SeaGuard data, the accuracy is ±1° of the reading for the current speed and ±3° (if the tilt is 0–15°) or ±5° (if the tilt is 15–35°) for the current direction.
Negative bin values refer to downward-looking ADCPs and vice versa. ADCP data on the buoys (ADCP 1) were downward-looking and located at the sea surface (approximately 0 m); their observation range was depth0 + bin. The ADCP data on the moorings comprise upward-looking (ADCP 2) and downward-looking (ADCP 3) observations with range depth + bin because the depths of the ADCPs at the moorings vary during observations. B3 did not have ADCP or SeaGuard observations (Fig. 3 and Table 2), and the ADCP at B5 broke down and no data were obtained. For the bin sizes of the ADCPs, the 300 kHz ADCPs were binned at 4 m, with the first bin at 8 m (B4) or 6.24 m (M1 and M2) and the last bin at 124 m (B4) or 122.24 m (M1 and M2). The 150 kHz ADCPs were binned at 8 m, with the first bin at 14 m and the last bin at 246 m. The 75 kHz ADCPs were binned in 16 m intervals, with the first bin at 24.7 m and the last bin at 568.7 m. The velocity accuracy for the 75 kHz ADCPs is 1 % of the water velocity relative to the ADCP ±0.01 m s−1 (written as 1 % ±0.01 m s−1). The accuracies for the 150 and 300 kHz ADCPs are 1 % ±0.005 m s−1 and 0.5 % ±0.005 m s−1, respectively. The RBR sensors were only deployed at B3 and observed water pressure (dbar), turbidity (V; two sensors), chlorophyll (µg L−1 Chl a), and colored dissolved organic matter (CDOM; ppb). The measurement accuracy of the water pressure was ±0.05 %, ±2 % for turbidity and chlorophyll, and ±0.01 ppb for CDOM.
The data at station 2 (B2 and M2) were longer and more complete than those at the other stations and are shown first to provide examples of the observations at the stations. Subsequently, observations differing from station 2 are also shown, including near-bottom observations at B1, sea surface waves at B1 and B4, and observations at B3 after its rope snapped on 15 September 2014, causing it to become adrift.
3.1 Sea surface air and ocean observation at station 2
The prevailing wind direction was approximately 200° (nearly southerly wind) from late July to mid-August and then shifted primarily in the range of 20–80° (nearly northeasterly wind) after October, with wind direction variations during September (Fig. 4b, d). This finding indicates that the transition occurred from local summer to winter monsoon, with September as the transition month. The average wind speed was less than 10 m s−1 during July and August, often exceeding 10 m s−1 after October (Fig. 4a, c), indicating that the winter monsoon was stronger than the summer monsoon at B2. B2 likely traveled through the eye of typhoon Kalmaegi, with two wind speed peaks accompanied by minimum air pressure (Zhang et al., 2016). Typhoon Kalmaegi and severe tropical storm Fung-wong during September significantly influenced the wind direction at B2, with the wind direction turning counterclockwise near 15 and 21 September, consistent with B2 being on the left side of both TCs.
B2 also recorded a drop in the sea surface air and ocean temperature (Fig. 4g, i) from summer to winter, ranging from approximately 28.5 to 30.5 °C in August, decreasing from approximately 29 to 27 °C in October, and continuing to decrease further. The surface air temperature was slightly lower than the sea surface temperature during the observation period, indicating local sensible heat flux from the ocean to the atmosphere because the water cooled more slowly than the air during fall. Due to their high time resolution (2 min), the observations also captured the diurnal temperature variation attributed to daytime solar radiation heating, nighttime outward longwave radiation cooling, and the deepening of the ocean mixed layer. Typhoon Kalmaegi and tropical storm Fung-wong successively decreased the sea surface air and ocean temperatures during September, with Kalmaegi suddenly decreasing the sea surface temperature by approximately 2.5 °C because B2 was located in the core cooling area on the right side of the typhoon track.
Rain gauge data were measured using a tipping-bucket rain gauge, with a maximum measurement of 255 mm. The bucket empties when full (255 mm), and the measurement starts from 0 mm again. The rain rate can be calculated by dividing the difference in rain gauge values by the time interval. Significant rainfall events were recorded around 2 August and 6, 15, and 21 September. Typhoon Kalmaegi and the severe tropical storm Fung-wong induced strong rainfall around 15 and 21 September. Evaporation also affected the rain gauge values, which decreased slowly over time without precipitation, indicating that the rain gauge data reflected the precipitation and evaporation. Sea surface salinity increased from approximately 33.3 psu near 1 October to approximately 33.8 psu near 10 November (Fig. 4i) due to little rainfall, with salinity primarily controlled by evaporation.
Some similarities and differences existed between the two meteorological observations: the European Centre for Medium-Range Weather Forecasts (ECMWF) Reanalysis v5 data (ERA5, https://www.ecmwf.int/en/forecasts/dataset/ecmwf-reanalysis-v5, last access: 5 November 2024) are used to evaluate their performance. The average and maximum wind speed and direction in the meteorology and 200WX datasets are consistent, and the average wind matched the wind speed from ERA5 well, except that the average wind direction observed by meteorological sensors suddenly turned to approximately 180° and the maximum wind direction varied rapidly between 0 and 360° after 15 November (Fig. 4b, d), indicating some malfunctions of the wind meteorological observation sensor. Air pressure measurements from the meteorological sensors, 200WX station, and ERA5 are consistent before 27 August, with the diurnal air pressure variation observed by the meteorological sensors amplifying and becoming inconsistent with the 200WX observations and ERA5 after 27 August (Fig. 4f), indicating some malfunction of the pressure meteorological observation sensor. The sensitivity of the air temperature measurements by the 200WX was greater than that of the temperature meteorological sensor, with larger-amplitude diurnal variations, whereas their values were a bit larger or different from ERA5 data (Fig. 4g). Relative humidity measured by the meteorological sensor was consistent with ERA5 data and was greater than that measured by the 200WX, ranging from 0 % to 10 % (Fig. 4h). Both meteorological observations showed missing data approximately 5 d near 6 October, which might be due to the malfunction of the instruments or data recording.
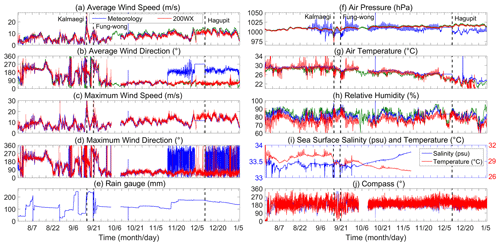
Figure 4Observation at B2: the average and maximum wind speeds (a, b; m s−1) and direction (c, d; °), rain gauge (e; mm), air pressure (f; hPa), air temperature (g; °C), relative humidity (h; %), sea surface salinity (i; psu), sea surface temperature (i; °C), and buoy compass (j; °). The blue and red lines are data observed by the meteorological sensors and the 200WX automatic meteorological station, approximately 4 m above the sea surface. The blue and red lines in panel (i) represent the salinity and temperature observed by the SBE-37 sensor at the buoy bottom (approximately 0 m). The wind directions indicate the direction from which the wind originates. The vertical dashed lines indicate the times when TCs Kalmaegi, Fung-wong, and Hagupit were closest to B2. The green lines are the European Centre for Medium-Range Weather Forecasts (ECMWF) Reanalysis v5 (ERA5) data.
3.2 Current, temperature, and salinity observations at station 2
At station 2, the current observations at the mooring (Fig. 5b–d) were longer than those at the buoy (Fig. 5a) and the temperature and salinity (Fig. 6) observations at the buoy due to the deployment and recovery times. The upward-looking 300 kHz ADCP (Fig. 5b) and the SBE-37 recorder at the bottom of the buoy (Fig. 6) stopped working near 11 November, while the data quality of the downward-looking 75 kHz ADCP at the mooring decreased, especially in 2015, with some missing data at several bins (Fig. 5b). Although the SBE chain was 400 m long, the observation range of the temperature and salinity was primarily shorter than 400 m because the rope swung and tilted during the observations. The deepest observation depth especially decreased to ∼200 m near 21 September under the influence of typhoon-induced near-inertial waves after Kalmaegi. Similarly, the positions of the ADCPs at the moorings also moved vertically due to the tilt of the mooring rope, especially when influenced by intensified currents after Rammasun and Matmo in July and Kalmaegi in September.
ADCPs and SeaGuards captured horizontal currents induced by diurnal and semidiurnal tides as well as vertical variations in temperature and salinity isolines. The upper-ocean background current speed was primarily <20 cm s−1, significantly increasing after TCs Rammasun and Matmo in July, Kalmaegi in September, and Hagupit in December, with the mixed-layer current speed reaching approximately 150 cm s−1 after Kalmaegi (Zhang et al., 2016). Typhoon Kalmaegi immediately strengthened the near-inertial mixed-layer currents and kinetic energy, which then propagated horizontally and vertically with the dispersion of near-inertial waves and regulation by background vorticity (Lu et al., 2023, 2024; Zhang et al., 2016). Near-bottom currents were primarily <10 cm s−1, and near-bottom flow turned from northeastward to southeastward under the influence of typhoon Rammasun.
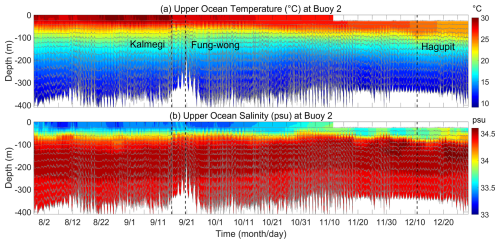
The upper-ocean temperature decreased monotonously from the surface (approximately 0 m) to approximately 400 m, and salinity exhibited a low–high–low vertical structure with a maximum of approximately 34.5 psu from approximately 100 to 250 m. There is long-term upper-ocean cooling and a decrease in salinity from summer to winter (Fig. 6), especially after mid-October. Kalmaegi reduced the sea surface temperature by approximately 1.9 °C at its maximum, with a subsurface cold anomaly of approximately 1.1 °C (Zhang et al., 2016) due to its proximity to the typhoon track, where typhoon-induced mixing and upwelling primarily modulated the upper-ocean temperature (Zhang, 2023; Zhang et al., 2018). Vertical variations in temperature and salinity were also influenced by eddies, fronts, and flows (Liu et al., 2017; Lu et al., 2024), but these are not pursued further here. The downward propagation of warm or freshwater anomalies from the surface and the diurnal cycle of the near-surface mixed layer can also be observed (Fig. 6) and were partly analyzed in Zhang (2023).
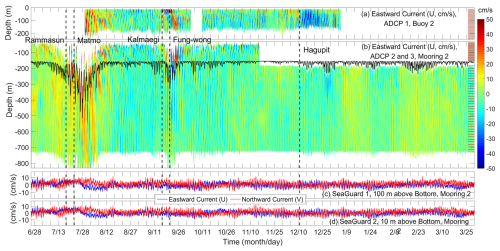
Figure 5(a, b) Eastward currents (m s−1) observed by the downward-looking 150 kHz ADCP at the buoy bottom (a) and the combination of the upward-looking 300 kHz and downward-looking 75 kHz ADCPs at the mooring (b). (c, d) Eastward (U) and northward (V) currents are observed by the SeaGuard current meter at 100 m (c) and 10 m (d) above the ocean bottom. The black solid line in panel (b) represents the vertical positions of ADCPs 2 and 3. The vertical dashed lines represent the times when the TCs were closest to B2. The brown lines in panels (a) and (b) represent the initial depths of the observation bins of the ADCPs.
3.3 Near-bottom observation at mooring 1
The instruments at M1 differed from those at the other moorings; their observations are analyzed and discussed here. Three SBEs were deployed near the ocean bottom to evaluate the homogeneity of the near-bottom layer. The variation in near-bottom pressure observed by the three SBEs at approximately 10, 30, and 50 m above the ocean bottom is tiny (Fig. 7a), indicating minimal swing and tilt of the rope near the bottom of M1. The water pressure at approximately 10 m above the bottom was approximately 1710 dbar, corresponding to a depth of approximately 1690 m and indicating that the water depth of M1 was approximately 1700 m. The temperature varied from 2.5 to 2.7 °C, and the salinity was close to 34.6 psu at the three SBEs (Fig. 7b, c). The temperature, salinity, and currents observed by the three SBEs and SeaGuards were close, indicating a uniform near-bottom layer greater than 100 m (Fig. 7d). However, the current at 100 m above the bottom differed from the other two layers during 19 July to 12 August and during 13 to 20 December, when the near-bottom flow also turned at M1, which was possibly influenced by super-typhoons Rammasun and Hagupit (Fig. 7e).
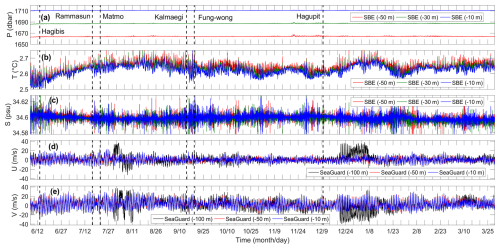
Figure 7(a–c) Pressure (dbar; a), temperature (°C; b), and salinity (psu; c) observed by the SBE-37s at the moorings of approximately 50 (red), 30 (green), and 10 m (blue) above the ocean bottom. (d, e) Eastward current (cm s−1) and northward current observed by the SeaGuard current meter at the moorings of approximately 100 (black), 50 (red), and 10 m (blue) above the ocean bottom. The vertical dashed lines represent the times when the TCs were closest to M1.
3.4 Sea surface waves
The sea surface waves observed at B1 and B4 also merit further explanation. The variations in sea surface waves from the two wave gauges at B1 and B4 are similar (Fig. 8), indicating that the characteristics of the sea surface waves in the observation array were comparable. However, B4 showed more drastic variation in the peak period than B1, with different mean wave directions and wave spreads from 14 to 20 July and near 26 July, indicating the influence of TCs Habibis and Matmo. The observations at B1 were longer than at B4 but with some missing recordings from 1 August to 17 August.
Sea surface winds, e.g., monsoon and TCs, primarily controlled the sea surface waves. During the summer monsoon (before September), the significant wave height was primarily <2 m, the maximum wave height <3 m, the peak period <10 s, and the mean wave direction close to 180° (northward). During the winter monsoon (after October), significant and maximum wave heights increased to >3 and >5 m, respectively, the peak period to >10 s, and the mean wave direction to nearly 90° (westward). The wave spread ranged from 20 to 80 throughout the observation period of the two wave gauges (Fig. 8e). The TCs strongly influenced the local sea surface waves. Significant wave height increased to approximately 5, 10, and 3 m (Fig. 8a), whereas maximum wave height reached approximately 8, 15–18, and 5–6 m (Fig. 8b) owing to the influence of TCs Rammasun, Kalmaegi, and Fung-wong, respectively. The sea surface wave height increased rapidly in 1 d, along with a clockwise rotation of the mean wave direction and an increase in the peak period, and it then returned to background conditions within approximately 3 d, with the mean wave direction rotating counterclockwise and with a decrease in the peak period (Fig. 8).
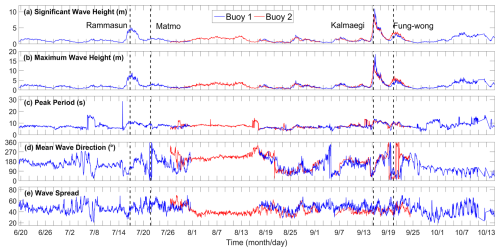
Figure 8Significant wave height (a; m), maximum wave height (b; m), peak period (c; s), mean wave direction (d; °), and wave spread observed by the wave recorders at the bottoms of buoys 1 (blue) and 4 (red). The vertical dashed lines represent the times when the TCs were closest to the moored array.
3.5 Observation at B3
Since the tether of B3 snapped on 15 September 2014, causing the buoy to become adrift (Fig. 2), it is crucial to describe B3 observations in this section, which partly reflects the air–sea conditions in the region of B3 (Figs. 9 and 10).
The average and maximum wind speeds increased to approximately 20 and 25 m s−1, respectively, during Kalmaegi, with the wind direction changing rapidly (Fig. 9a). The average and maximum wind speeds reached approximately 10 m s−1 during Fung-wong, with the wind direction rotating counterclockwise because B3 was on the left side of the TC track (Fig. 9b). In October, the wind direction was primarily close to 0°, consistent with B2 (Fig. 4), indicating that the monsoon controlled the local region from nearly north to south. The rainfall was strong during Kalmaegi (approximately 250 mm) and Fung-wong (approximately 200 mm), accompanied by low air pressure (980 and 1000 hPa). However, there was little rainfall, and the air pressure increased to more than 1100 hPa after 24 September (Fig. 9e, f). The diurnal air pressure variation can also be found in the observation. The sea surface temperature continuously decreased from ∼30 to ∼27.5 and ∼26.5 °C after Kalmaegi and Fung-wong, respectively, and then recovered to ∼29 °C in October (Fig. 10d). Note that the surface air temperature (Fig. 9g) was 1–3 °C colder than the sea surface temperature (Fig. 10d) during the observation, indicating sensible heat flux from the ocean to the air in fall along the track of B3. The relative humidity was 85 % to 100 % during Kalmaegi and Fung-wong (14–25 September) and then continuously decreased to approximately 70 % in October (Fig. 9h), consistent with the fact that the TC-induced cold wake results in reduced rainfall and sea surface humidity (Ma et al., 2020). Air visibility was approximately 10 km when B3 was deployed, decreased to approximately 1 m due to cloud cover and adverse sea surface conditions from typhoon Kalmaegi, and rapidly increased to approximately 16 km on 15 September 2014 due to the passage of the typhoon's eye (Fig. 9i). Clear sky returned near 17 September, while the subsequent tropical cyclone Fung-wong increased air visibility at B3 to approximately 16 km again on 20 September, lasting until 22–23 September.
B3 was the only buoy equipped with a radiometer. The maximum shortwave radiation observed by the upward sensor was approximately 1900 W m−2 near noon (Fig. 10a) when solar radiation was strongest, significantly reduced by cloud cover from the TCs from 13 to 23 September, and moderately reduced by local cloud cover in October. Conversely, the shortwave radiation observed by the downward sensor was much (1 order of magnitude) smaller than the upward shortwave radiation, indicating a minimal reflection of solar radiation. Similarly, the longwave radiation observed by the upward and downward sensors was close to 0 W m−2 and approximately −50 W m−2 (Fig. 10b), respectively, indicating that longwave radiation was primarily from the ocean into the atmosphere, with a minimal contribution from the atmosphere to the ocean. The sea surface temperature (Fig. 10d) decreased from approximately 30 to 27 °C after Kalmaegi, recovering to approximately 29 °C in October. The air temperature observed by the radiometer (Fig. 10c) followed a similar variation pattern to that observed by the meteorological sensors (Fig. 9a) and sea surface temperature (Fig. 10d), with significant diurnal variation. The sea surface salinity (Fig. 10d) increased from approximately 33.5 to 33.7 psu due to typhoon Kalmaegi, despite strong rainfall (Fig. 9e). The variation in sea surface salinity was consistent with the rain gauge data, except for a decrease from 3 to 5 October.
Some recording errors of sea surface temperature and salinity occurred after 5 October (Fig. 10d, e), with a sudden change in the values. The SBE and RBR sensors were deployed 1.3–1.6 m from the surface, with pressures of 1.3–1.6 hPa (Fig. 10f). Chlorophyll observed by the RBR sensor (Fig. 10g) showed diurnal variation, increasing from approximately 2 to 2.5 µg L−1 after Kalmaegi and Fung-wong and then returning to approximately 2 µg L−1. The turbidity observed by the first sensor (Fig. 10h) was more than 0.05 V before 15 September 2014. It then decreased to approximately 0.005 V, making it challenging to determine whether the decrease was attributable to Kalmaegi, which made the sea surface cleaner, or to damage to the turbidity sensor after B3's rope snapped. Conversely, the turbidity observed by the second sensor (Fig. 10i) remained near 4.4569 throughout the observation period of B3 (Fig. 10i). CDOM (Fig. 10j) gradually increased from 1.88 ppb in September to 2.1 ppb by mid-October.
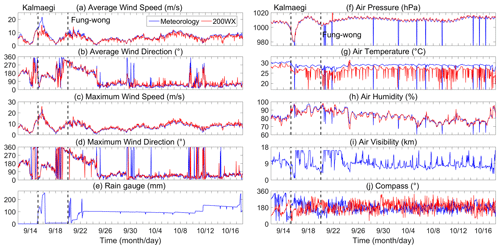
Figure 9Similar to Fig. 4 but for buoy 4. Notably, panel (i) shows the air visibility (km) observed by a visibility meter 4 m above the sea surface. The vertical dashed lines represent the times when the TCs were closest to the moored array.
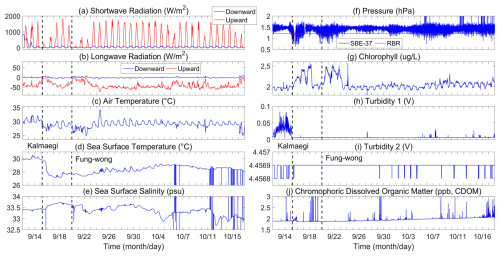
Figure 10Observation at buoy 3. (a–c) Shortwave radiation (a; W m−2) and longwave radiation (b; W m−2) observed by upward (red) and downward (blue) radiation sensors and the air temperature observed by the radiometer (c; °C). (d–f) Sea surface temperature (f; °C), salinity (g; psu), and pressure (h; hPa; blue) observed by SBE-37, with the pressure (h; hPa; red) observed by the RBR sensors. (g–j) Chlorophyll (g; µg L−1), turbidity observed by two sensors (g, h; V), and chromophoric dissolved organic matter (DCOM; j; ppb). The radiometer is 4 m above the sea surface, and the SBE-37 and RBR sensors are at the bottom of buoy 3 (approximately 0 m). The vertical dashed lines represent the times when the TCs were closest to the moored array.
All the data are publicly available from the Zenodo repository at https://doi.org/10.5281/zenodo.14039870 (Zhang et al., 2024a) and the Ocean Data Center of the Southern Marine Science and Engineering Guangdong Laboratory (Zhuhai) at https://doi.org/10.12378/geodb.2024.2.034.V1 (Zhang et al., 2024b). This study provides a detailed dataset description, including a time series of sea surface meteorological elements, sea surface waves, ocean temperature, salinity, and currents collected from a moored array comprising five buoys and four moorings during 2014–2015. The meteorological elements include wind, temperature, pressure, rain gauge, and humidity data. Furthermore, the data from the buoy at the center (B3) include sea surface visibility, radiation (shortwave and longwave), and biochemistry observations (chlorophyll, turbidity, and CDOM).
This study presents an observation dataset from a cross-shaped moored array comprising five buoys (B1–B5) and four moorings (M1, M2, M4, and M5) with synchronous atmospheric and oceanic data in the northern SCS during 2014–2015 (MASCS 1.0). The atmospheric data are observed by two meteorological instruments at the buoys. The oceanic data consist of sea surface waves recorded by a wave recorder and temperature and salinity from the surface to a depth of 400 m and at 10 and 50 m above the ocean bottom using CTD recorders. They also include currents from the surface to a depth of 850 m measured by ADCPs and at 10, 50, and 100 m above the floor measured by current meters. Additional measurements were taken for sea surface radiation, air visibility, chlorophyll, turbidity, and CDOM at B3, which was at the center of the moored array. The whole moored array was deployed in June 2014 and totally recovered at the end of 2015. Although some instruments and buoys broke down or were lost during the observations, resulting in no data recovery or deficiencies, this dataset is valuable for further studies to uncover air–sea interactions and oceanic processes in the northern SCS.
For example, TCs Hagibis in June, Rammasun and Matmo in July, Kalmaegi and Fung-wong in September, and Hagupit in December 2014 traveled over the SCS and influenced the time series of the observations. The TCs increased the sea surface wind speed, enhanced the sea surface wave height and near-surface ocean currents, cooled the sea surface water and air temperature, and induced near-inertial waves and near-bottom currents. The moored array also transitioned from the summer to winter monsoons, with a prevailing nearly southerly wind (approximately 200°) and waves (approximately 180°) with a sea surface significant wave height of <2 m and a peak period of <10 s from late July to mid-August. It then shifted to a nearly northeasterly wind (approximately 20–80°) and easterly waves (approximately 90°), with a sea surface significant wave height of >3 m and a peak period of <10 s after October. Furthermore, ocean data might have recorded multiscale air–sea interactions and ocean processes such as air–sea heat and momentum fluxes, ocean tides, internal waves, seasonal variations in temperature, salinity, and flows as well as background processes such as mesoscale eddies and local circulations.
The data have been used to analyze the air–sea and ocean variations in the moored array (Quan et al., 2022; He et al., 2024), validating ocean (Zhang et al., 2016; Liu et al., 2020; Lu et al., 2023) and air–sea coupled (Wu et al., 2020; Lim Kam Sian et al., 2020; Liu et al., 2024) model simulation, evaluating the parameterization of air–sea surface flux (Zhang et al., 2020; Liu et al., 2024), and investigating the mechanisms and theory of the ocean response to TCs (Hong et al., 2022; Zhang, 2023). The dataset has the potential for further study in these fields and can be used for other fields, such as data reanalysis and assimilations.
HZ created the dataset and wrote the whole manuscript. The whole observation project was designed by DC. The flow of the manuscript was revised by TL, DT, and GW, and the dataset was optimized by MH, QL, and JL.
The contact author has declared that none of the authors has any competing interests.
Publisher's note: Copernicus Publications remains neutral with regard to jurisdictional claims made in the text, published maps, institutional affiliations, or any other geographical representation in this paper. While Copernicus Publications makes every effort to include appropriate place names, the final responsibility lies with the authors.
We thank the crews of the scientific voyages as well as the observation technicians who contributed to the successful deployment and recovery of the moored stations. We also thank the reviewers for their helpful and constructive comments.
This work has been supported by the Key R&D Program of Zhejiang Province (grant no. 2024C03257), the National Key R&D Program of China (grant no. 2023YFF0805300), the Scientific Research Fund of the Second Institute of Oceanography MNR (grant nos. JG2309 and QNYC2401), the Innovation Group Project of the Southern Marine Science and Engineering Guangdong Laboratory (Zhuhai) (grant no. 316323005), the National Natural Science Foundation of China (grant nos. 42227901, 42176015, and 42106008), the National Basic Research Program of China (grant no. 2013CB430300), the Southern Marine Science and Engineering Guangdong Laboratory (Zhuhai) (grant nos. SML2021SP207, SML2021SP102, and SML2022SP401), the MEL Visiting Fellowship (grant no. MELRS2303), the Zhejiang Provincial Natural Science Foundation of China (grant no. LY24D060003), the Global Change and Air-Sea Interaction II Program (grant no. GASI-01-WPAC-STspr), the Open Project of the Fujian Provincial Meteorological Administration (grant no. 2022K02), and the Zhejiang Provincial Natural Science Foundation of China (grant no. 2022J011078). This research was also supported by the Key Laboratory of Polar Atmosphere-ocean-ice System for Weather and Climate, Ministry of Education, as well as the CMA-FDU Joint Laboratory of Marine Meteorology.
This paper was edited by Sabine Schmidt and reviewed by Luca Cocchi and one anonymous referee.
Alford, M. H., Peacock, T., MacKinnon, J. A., Nash, J. D., Buijsman, M. C., Centurioni, L. R., Chao, S. Y., Chang, M. H., Farmer, D. M., Fringer, O. B., Fu, K. H., Gallacher, P. C., Graber, H. C., Helfrich, K. R., Jachec, S. M., Jackson, C. R., Klymak, J. M., Ko, D. S., Jan, S., Johnston, T. M., Legg, S., Lee, I. H., Lien, R. C., Mercier, M. J., Moum, J. N., Musgrave, R., Park, J. H., Pickering, A. I., Pinkel, R., Rainville, L., Ramp, S. R., Rudnick, D. L., Sarkar, S., Scotti, A., Simmons, H. L., St Laurent, L. C., Venayagamoorthy, S. K., Wang, Y. H., Wang, J., Yang, Y. J., Paluszkiewicz, T., and Tang, T. Y.: The formation and fate of internal waves in the South China Sea, Nature, 521, 65–69, https://doi.org/10.1038/nature14399, 2015.
Cai, Z., Gan, J., Liu, Z., Hui, C. R., and Li, J.: Progress on the formation dynamics of the layered circulation in the South China Sea, Prog. Oceanogr., 181, 102246, https://doi.org/10.1016/j.pocean.2019.102246, 2020.
Chen, W., Hu, P., and Huangfu, J.: Multi-scale climate variations and mechanisms of the onset and withdrawal of the South China Sea summer monsoon, Sci. China Earth Sci., 65, 1030–1046, https://doi.org/10.1007/s11430-021-9902-5, 2022.
Chen, W., Zhang, R., Wu, R., Wen, Z., Zhou, L., Wang, L., Hu, P., Ma, T., Piao, J., Song, L., Wang, Z., Li, J., Gong, H., Huangfu, J., and Liu, Y.: Recent Advances in Understanding Multi-scale Climate Variability of the Asian Monsoon, Adv. Atmos. Sci., 40, 1–28, https://doi.org/10.1007/s00376-023-2266-8, 2023.
Guan, S., Jin, F. F., Tian, J., Lin, II, Pun, I. F., Zhao, W., Huthnance, J., Xu, Z., Cai, W., Jing, Z., Zhou, L., Liu, P., Zhang, Y., Zhang, Z., Zhou, C., Yang, Q., Huang, X., Hou, Y., and Song, J.: Ocean internal tides suppress tropical cyclones in the South China Sea, Nat. Commun., 15, 3903, https://doi.org/10.1038/s41467-024-48003-y, 2024.
He, Y., Lin, X., Han, G., Liu, Y., and Zhang, H.: The different dynamic influences of Typhoon Kalmaegi on two pre-existing anticyclonic ocean eddies, Ocean Sci., 20, 621–637, https://doi.org/10.5194/os-20-621-2024, 2024.
Hong, W., Zhou, L., Xie, X., Zhang, H., and Liang, C.: Modified parameterization for near-inertial waves, Acta Oceanol. Sin., 41, 41–53, https://doi.org/10.1007/s13131-022-2012-6, 2022.
Jilan, S.: Overview of the South China Sea circulation and its influence on the coastal physical oceanography outside the Pearl River Estuary, Cont. Shelf Res., 24, 1745–1760, https://doi.org/10.1016/j.csr.2004.06.005, 2004.
Li, J., Zhou, C., Li, M., Zheng, Q., Li, M., and Xie, L.: A case study of continental shelf waves in the northwestern South China Sea induced by winter storms in 2021, Acta Oceanol. Sin., 43, 59–69, https://doi.org/10.1007/s13131-023-2150-5, 2024.
Lim Kam Sian, K. T. C., Dong, C., Liu, H., Wu, R., and Zhang, H.: Effects of Model Coupling on Typhoon Kalmaegi (2014) Simulation in the South China Sea, Atmosphere, 11, 432, https://doi.org/10.3390/atmos11040432, 2020.
Lin, J., Fang, S., Xu, W., Ni, S., Zhang, H., and Yang, T.: Multi-instrument observations of microseisms generated by typhoon Kalmaegi (2014) over the Northwestern Pacific, Earth Planet. Sci. Lett., 594, 117746, https://doi.org/10.1016/j.epsl.2022.117746, 2022.
Liu, F., Zhang, H., Ming, J., Zheng, J., Tian, D., and Chen, D.: Importance of Precipitation on the Upper Ocean Salinity Response to Typhoon Kalmaegi (2014), Water, 12, 614, https://doi.org/10.3390/w12020614, 2020.
Liu, F., Toumi, R., Zhang, H., Chen, D.: Impact of Precipitation on Ocean Responses during Tropical Cyclone, J. Phys. Oceanogr., 54, 895–909, https://doi.org/10.1175/jpo-d-23-0138.1, 2024.
Liu, L., Wang, G., Zhang, Z., and Wang, H.: Effects of drag coefficients on surface heat flux during Typhoon Kalmaegi (2014), Adv. Atmos. Sci., 39, 1501–1518, https://doi.org/10.1007/s00376-022-1285-1, 2022.
Liu, Q., Kaneko, A., and Jilan, S.: Recent Progress in Studies of the South China Sea Circulation, J. Oceanogr., 64, 753–762, https://doi.org/10.1007/s10872-008-0063-8, 2008.
Liu, S.-S., Sun, L., Wu, Q., and Yang, Y.-J.: The responses of cyclonic and anti-cyclonic eddies to typhoon forcing: the vertical temperature-salinity structure changes associated with the horizontal convergence/divergence, J. Geophys. Res.-Oceans, 122, 4974–4989, https://doi.org/10.1002/2017JC012814, 2017.
Lu, X., Yu, H., Ying, M., Zhao, B., Zhang, S., Lin, L., Bai, L., and Wan, R.: Western North Pacific Tropical Cyclone Database Created by the China Meteorological Administration, Adv. Atmos. Sci., 38, 690–699, https://doi.org/10.1007/s00376-020-0211-7, 2021.
Lu, X., Dong, C., Xu, Z., Yang, J., Zhang, H., Wang, D., and Chen, D.: Effects of numerical model's horizontal resolution on the vertical transport of near-inertial energy, Deep-Sea Res. Pt. II, 207, 105223, https://doi.org/10.1016/j.dsr2.2022.105223, 2023.
Lu, X., Dong, C., Zhang, H., Lim Kam Sian, K. T. C., Yang, J., Xu, Z., Li, G., Wang, Q., Cao, Q., You, Z., and Sommeria, J.: Observational Analysis of Vertical Heat Flux Caused by Typhoon-Induced Near-Inertial Waves Under the Modulation of Mesoscale Eddies, J. Geophys. Res.-Oceans, 129, e2024JC021053, https://doi.org/10.1029/2024jc021053, 2024.
Ma, Z., Fei, J., Lin, Y., and Huang, X.: Modulation of Clouds and Rainfall by Tropical Cyclone's Cold Wakes, Geophys. Res. Lett., 47, e2020GL088873, https://doi.org/10.1029/2020gl088873, 2020.
Nan, F., Xue, H., and Yu, F.: Kuroshio intrusion into the South China Sea: A review, Prog. Oceanogr., 137, 314–333, https://doi.org/10.1016/j.pocean.2014.05.012, 2015.
Qi, M., Han, B., Yang, Q., Wu, R., Liu, C., Zhang, G., Zhang, X., Zhou, H., Chen, J., and Chen, D.: Sea Surface Energy Fluxes' Response to the Quasi-Biweekly Oscillation: A Case Study in the South China Sea, Geophys. Res. Lett., 50, e2023GL104288, https://doi.org/10.1029/2023gl104288, 2023.
Quan, Q., Liu, Z., Yang, Y., Cai, Z., Zhang, H., and Liu, X.: Characterization of intraseasonal fluctuations in the abyssal South China Sea: An insight into the energy pathway, Prog. Oceanogr., 206, 102829, https://doi.org/10.1016/j.pocean.2022.102829, 2022.
Shan, K., Chu, P.-S., and Yu, X.: Interdecadal Change of Tropical Cyclone Translation Speed during Peak Season in South China Sea: Observed Evidence, Model Results, and Possible Mechanism, J. Climate, 36, 4531–4541, https://doi.org/10.1175/jcli-d-22-0704.1, 2023.
Song, X., Wang, X., Cai, W., and Xie, X.: Observed Air–Sea Turbulent Heat Flux Anomalies during the Onset of the South China Sea Summer Monsoon in 2021, Mon. Weather Rev., 151, 2443–2464, https://doi.org/10.1175/mwr-d-22-0314.1, 2023.
Tan, K., Xie, L., Bai, P., Zheng, Q., Li, J., Xu, Y., and Li, M.: Modulation Effects of Mesoscale Eddies on Sea Surface Wave Fields in the South China Sea Derived From a Wave Spectrometer Onboard the China-France Ocean Satellite, J. Geophys. Res.-Oceans, 128, e2021JC018088, https://doi.org/10.1029/2021jc018088, 2023.
Wang, Q., Zeng, L., Shu, Y., Li, J., Chen, J., He, Y., Yao, J., Wang, D., and Zhou, W.: Energetic Topographic Rossby Waves in the northern South China Sea, J. Phys. Oceanogr., 49, 2697–2714, https://doi.org/10.1175/JPO-D-18-0247.1, 2019.
Wang, Q., Zhang, B., Zeng, L., He, Y., Wu, Z., and Chen, J.: Properties and Drivers of Marine Heat Waves in the Northern South China Sea, J. Phys. Oceanogr., 52, 917–927, https://doi.org/10.1175/jpo-d-21-0236.1, 2022.
Wu, R., Zhang, H., and Chen, D.: Effect of Typhoon Kalmaegi (2014) on northern South China Sea explored using Muti-platform satellite and buoy observations data, Prog. Oceanogr., 180, 102218, https://doi.org/10.1016/j.pocean.2019.102218, 2020.
Xie, X., Liu, Q., Zhao, Z., Shang, X., Cai, S., Wang, D., and Chen, D.: Deep Sea Currents Driven by Breaking Internal Tides on the Continental Slope, Geophys. Res. Lett., 45, 6160–6166, https://doi.org/10.1029/2018GL078372, 2018.
Yang, Y., Wang, D., Wang, Q., Zeng, L., Xing, T., He, Y., Shu, Y., Chen, J., and Wang, Y.: Eddy-Induced Transport of Saline Kuroshio Water Into the Northern South China Sea, J. Geophys. Res.-Oceans, 124, 6673–6687, https://doi.org/10.1029/2018jc014847, 2019.
Ying, M., Zhang, W., Yu, H., Lu, X., Feng, J., Fan, Y., Zhu, Y., and Chen, D.: An Overview of the China Meteorological Administration Tropical Cyclone Database, J. Atmos. Ocean. Tech., 31, 287–301, https://doi.org/10.1175/jtech-d-12-00119.1, 2014.
Zhang, H.: Modulation of Upper Ocean Vertical Temperature Structure and Heat Content by a Fast-Moving Tropical Cyclone, J. Phys. Oceanogr., 53, 493–508, https://doi.org/10.1175/JPO-D-22-0132.1, 2023.
Zhang, H., Chen, D., Zhou, L., Liu, X., Ding, T., and Zhou, B.: Upper ocean response to typhoon Kalmaegi (2014), J. Geophys. Res.-Oceans, 121, 6520–6535, https://doi.org/10.1002/2016jc012064, 2016.
Zhang, H., Wu, R., Chen, D., Liu, X., He, H., Tang, Y., Ke, D., Shen, Z., Li, J., Xie, J., Tian, D., Ming, J., Liu, F., Zhang, D., and Zhang, W.: Net Modulation of Upper Ocean Thermal Structure by Typhoon Kalmaegi (2014), J. Geophys. Res.-Oceans, 123, 7154–7171, https://doi.org/10.1029/2018JC014119, 2018.
Zhang, H., Liu, X., Wu, R., Chen, D., Zhang, D., Shang, X., Wang, Y., Song, X., Jin, W., Yu, L., Qi, Y., Tian, D., and Zhang, W.: Sea surface current response patterns to tropical cyclones, J. Marine Syst., 208, 103345, https://doi.org/10.1016/j.jmarsys.2020.103345, 2020.
Zhang, H., Chen, D., Tongya, L., Tian, D., He, M., Li, Q., Wei, G., and Liu, J.: MASCS 1.0: Synchronous atmospheric and oceanic data from a cross-shaped moored array in the northern South China Sea during 2014–2015, Zenodo [data set], https://doi.org/10.5281/zenodo.14039870, 2024a.
Zhang, H., Chen, D., Tongya, L., Tian, D., He, M., Li, Q., Wei, G., and Liu, J.: MASCS 1.0: Synchronous atmospheric and oceanic data from a cross-shaped moored array in the northern South China Sea during 2014–2015, Ocean Data Center of the Southern Marine Science and Engineering Guangdong Laboratory (Zhuhai) [data set], https://doi.org/10.12378/geodb.2024.2.034.V1, 2024b.


