the Creative Commons Attribution 4.0 License.
the Creative Commons Attribution 4.0 License.
Near-real-time atmospheric and oceanic science products of Himawari-8 and Himawari-9 geostationary satellites over the South China Sea
Jian Liu
Jingjing Yu
Chuyong Lin
Min He
Haiyan Liu
Wei Wang
The initial release of near-real-time (NRT) atmospheric and oceanic science products from Japanese Himawari-8 and Himawari-9 (H8/9) geostationary (GEO) satellites over the South China Sea (SCS) was unveiled in 2024. The primary objective behind crafting these NRT H8/9 satellite products is to facilitate weather and marine environment monitoring, enhance maritime security, and aid ocean navigation, among other purposes. As part of this investigation, a novel NRT data processing system was devised to generate a variety of regional H8/9 GEO satellite science products within a resolution of 10 min and a gridded resolution of 0.05° × 0.05° from 3 November 2022 to the present. This algorithm system was built upon the preceding Fengyun (FY) geostationary satellite algorithm test bed (FYGAT), which was the prototype of the FY-4 GEO meteorological satellite science product operational processing system. These regional H8/9 GEO satellite science products encompass a range of crucial data such as cloud mask, fraction, height, phase, optical, and microphysical properties; layered precipitable water; and sea surface temperature. We subjected these products to rigorous evaluations against high-quality analogous satellite products and reanalysis data spanning 1 year in 2023. The validations underscore a strong consistency between the H8/9 GEO satellite atmospheric and oceanic science products over the SCS and the referenced products. Nevertheless, slight discrepancies in these satellite science products were identified, primarily stemming from variations in sensor/dataset characteristics, retrieval algorithms, and geometric conditions. These outcomes demonstrate the suitability of the first edition of NRT atmospheric and oceanic science products of H8/9 satellites over the SCS in supporting the intended quantitative applications. This NRT GEO satellite data record is publicly accessible through the File Transfer Protocol (FTP) provided by the Southern Marine Science and Engineering Guangdong Laboratory (Zhuhai) in China. Free access to the dataset is possible via https://doi.org/10.6084/m9.figshare.25015853 (Liu et al., 2024).
- Article
(21095 KB) - Full-text XML
- BibTeX
- EndNote
The South China Sea (SCS) is located to the south of mainland China and in the western Pacific Ocean. It stands as the largest and deepest sea area in China, with an average depth of 1212 m and reaching a maximum depth of 5559 m. Due to its proximity to the Equator, the SCS receives a substantial amount of solar radiation, resulting in high local temperatures and humidity. The regional annual average air temperature ranges from 298.15 to 301.15 K. Even during the coldest months, the average temperatures remain above 293.15 K, while extreme high-temperature events can reach about 306.15 K. The average sea surface temperature (SST) in the SCS is around 299.15 K, and the seasonal variation is not significant. Furthermore, the South China Sea and the western Pacific serve as abundant sources of water vapor, leading to considerable precipitation in the SCS. Typhoon-related rainfall accounts for about one-third of the total rainfall in the region. On average, the SCS experiences over 1300 mm of rainfall annually, with the majority concentrated in the summer half-year (Wang et al., 2011; Wang et al., 2009; Ding and Liu, 2001).
The SCS region experiences a distinct tropical maritime monsoon climate. Beginning in October each year, winter air currents originating from Siberia and the Mongolian Plateau consistently flow toward the SCS (Martin and Howland, 1982). As a result, from November to March of the following year, the SCS region is dominated by the northeast monsoon. Starting in April, the SCS is influenced by tropical and Equatorial ocean air masses, inducing the prevalence of the southwest monsoon from May to September. Additionally, the SCS is often affected by typhoons during the summer and autumn seasons. About 70 % of these typhoons originate from the western Pacific, east of the Philippines, and the vicinity of the Caroline Islands, while the remaining 30 % are generated locally in the sea areas near the Xisha and Zhongsha islands in the SCS (Ding and Liu, 2001; Wang et al., 2020; Niu and Feng, 2021; Jiang et al., 2023).
Due to the lack of ground-based observations over the SCS, satellites, and particularly geostationary (GEO) meteorological satellites, have become the most effective means of observing weather patterns, climate, and environmental changes in oceanic regions. For instance, satellite-based rain rate, SST, outgoing longwave radiation (OLR), and convective clouds, etc. are commonly used to identify the summer monsoon, marine heat wave, rainfall, and convection over the SCS (Liu et al., 2014; Xu et al., 2021; Y. Li et al., 2022; Koseki et al., 2013; Zhou et al., 2024). In recent years, countries across the world, such as China, US, Japan, and Republic of Korea, have made their own remarkable progress in the development of next-generation geostationary meteorological satellites. Enhanced imaging capabilities in spectral, temporal, and spatial resolutions of the next-generation GEO meteorological satellites, such as Fengyun-4A and Fengyun-4B (FY-4) satellites operated by the China Meteorological Administration (CMA) and Himawari-8 and Himawari-9 (H8/9) satellites operated by the Japan Meteorological Agency (JMA), allow for more detailed and accurate observations of cloud formations, atmospheric conditions, and natural disasters like hurricanes and typhoons (Yang et al., 2017; Schmit et al., 2017; Husi et al., 2019; Kim et al., 2021). In addition to the GEO advanced imager, many nations have equipped their geostationary lightning and infrared hyperspectral sounding detection sensors to track and analyze thunderstorms, lightning activities, atmospheric temperature humidity profiles, and even wind fields in real time (Min et al., 2017b; Ma et al., 2021; Y. Li et al., 2022).
Although the JAXA (Japan Aerospace Exploration Agency) official website (available at http://ftp.ptree.jaxa.jp, last access: 27 October 2024) has already offered the free download links for some H8/9 Level-2 (L2) science products, such as cloud phase and optical depth (Husi et al., 2019) from 7 July 2015 to the present with an approximately 2 h lag, the relatively low timeliness and lack of variety of operational satellite science products have seriously affected the data quantitative applications in weather and marine environment monitoring over the SCS. Particularly, time-delayed GEO satellite products cannot be utilized in maritime security and navigation fields, which are of vital importance as they ensure the safety of crew members, transportation of goods, protection of the marine environment, etc. (Soldi et al., 2021). However, as recommended by the JMA, the near-real-time down-sampling full-disk H8/9 Level-1B (L1B) radiance data – including 14 bands with horizontal resolutions of 1 km (visible, VIS) and 4 km (near-infrared, NIR, and infrared, IR, bands) and excluding two VIS bands at 0.47 µm and 0.51 µm – are able to be received using the compact and exclusive geostationary satellite data-receiving antenna from JMA's HimawariCast (Xia et al., 2023; Wang et al., 2019). Therefore, based on the received real-time H8/9 full-disk L1B data, the primary goal of this investigation is to develop several near-real-time (NRT) L2 Atmospheric aNd Oceanic science products over the SCS (abbreviated as NANO_SCS) that are released online. It is the first edition of the NRT H8/9 GEO satellite science products generated by the NANO_SCS system. The next sections will be devoted to the introduction and validation of these NRT H8/9 GEO satellite scientific products. Both the NANO_SCS satellite data processing and management systems are operated by the Southern Marine Science and Engineering Guangdong Laboratory (Zhuhai) of China.
The subsequent sections of this study are meticulously organized as follows. Section 2 briefly introduces the Himawari-8 and Himawari-9 satellites, elucidating the intricate details of the main processing or production flow and shedding light on the remarkable NRT science products specifically tailored for the South China Sea region. Section 3 shows some sample results and verification of key science products in terms of accuracy and reliability. Section 4 elucidates the data download method. Finally, in Sect. 5, we summarize the main conclusions of this study while also outlining our future vision plans for further enhancing and expanding the scope of the NANO_SCS dataset.
2.1 Data
The Himawari-8 and Himawari-9 satellites, which are the new-generation and state-of-the-art GEO meteorological satellites operated by the JMA, were successfully launched on 7 October 2014 and 2 November 2016, respectively. These advanced satellites operate in a highly sophisticated three-axis stabilized mode, ensuring highly precise and stable spatial–temporal observations. It is worth highlighting that on 13 December 2022 at 05:00 UTC, the H9 GEO meteorological satellite seamlessly replaced its predecessor, the H8 GEO satellite, marking a significant milestone in GEO satellite operations (available at https://www.data.jma.go.jp/mscweb/en/index.html, last access: 27 October 2024). This strategic location allows for a comprehensive full-disk observation mode, enabling the satellites to capture detailed imagery of the entire Earth's disk, with a particular focus on the Japanese island and its surrounding areas. The Advanced Himawari Imager (AHI), as a unique and highly advanced optical sensor designed specifically for Earth viewing, has 16 independent Earth-view bands, covering an extensive range of wavelengths, from 0.45 to 13.3 µm. These bands include three visible (VIS) bands, three near-infrared (NIR) bands, and 10 infrared (IR) bands, each serving a specific purpose in capturing and analyzing various aspects of the Earth's atmosphere and surface. The AHI routinely operates in two observation modes: a full-disk observation mode that captures full-disk images within a 10 min time interval and a fast regional scanning mode that allows for swift maneuvering and scanning within a 2.5 min interval. This regional scanning mode is particularly useful for capturing high-resolution imagery of specific regions of interest, enabling detailed analysis and examination of localized weather events. The nominal spatial resolutions of the H8/9-AHI sensor vary depending on the specific band being utilized. For the VIS band at 0.65 µm, the spatial resolution is 0.5 km. The NIR bands have a spatial resolution of 1 km, while the IR bands have a spatial resolution of 2 km (Husi et al., 2019; Bessho et al., 2016; Letu et al., 2020; Min et al., 2019). In this study, we only used the down-sampling H8/9 L1B radiance data mentioned before to produce the NRT dataset. The spatial resolution for the down-sampling VIS band at 0.65 µm was reduced to 1.0 km, while the other bands were down-sampled to 4.0 km. The scope of this investigation covers the South China Sea region – specifically, from 0 to 40° N and 100 to 140° E. The utilization of IR bands with a spatial resolution of 4.0 km limits the related L2 satellite science products to the same resolution. Therefore, based on the products with the spatial resolution of 4.0 km, the final regional L2 atmospheric and oceanic science products are analyzed and projected into a user-friendly gridded resolution of 0.05° × 0.05°.
The NRT GEO satellite retrieval system (or NANO_SCS system) developed in this study also utilizes high-resolution operational numerical weather prediction (NWP) data from the Global Forecast System (GFS) as ancillary data, which have a gridded horizontal resolution of 0.25° × 0.25° and encompass a 41 vertical layers ranging from 0.01 hPa to 1000 hPa within a 3 h time interval. The GFS NWP data can be effortlessly accessed and downloaded from the National Oceanic and Atmospheric Administration (NOAA) website (available at https://nomads.ncep.noaa.gov/pub/data/nccf/com/gfs/prod, last access: 27 October 2024) at four distinct initial forecast times (00:00, 06:00, 12:00, and 18:00 UTC). To ensure optimal efficiency for the operations of subsequent day, only nine continuous pieces of data (ranging from 018, 021, and 024 to 042) generated at a fixed initial forecast time of 06:00 UTC are selectively downloaded within a predefined time period each day (Whitaker et al., 2008).
We collect and use 1 year (2023) of Climate Data Records (CDR) from the latest MODIS (Moderate Resolution Imaging Spectroradiometer) Collection-6.1 Level-2 cloud, land surface temperature (LST), and sea surface temperature (SST) products to validate the NRT H8/9 GEO satellite science products (Platnick et al., 2003, 2017). MODIS, as a key optical sensor aboard NASA's Terra and Aqua polar-orbiting satellites since 1999 and 2002 (respectively), can provide high-resolution (1.0 km) L2 science products about the Earth's surface and atmosphere (available at https://search.earthdata.nasa.gov/search, last access: 27 October 2024). MODIS data are freely available to the public and are widely used by scientists, government agencies, and researchers around the world, who often utilize them to verify the other congeneric satellite products (Min et al., 2020). Furthermore, we also compare the NRT layered precipitable water (LPW) product over the SCS with matched ERA5 reanalysis data (the fifth-generation European Center for Medium Range Weather Forecasts Reanalysis data). Note that ERA5 data assimilate infrared radiances and wind data (through atmospheric motion vectors, AMVs) from the Himawari satellites (Hersbach et al., 2020). The hourly layered specific humidity data for the same year (2023) with a horizontal resolution of 0.25° × 0.25° have been freely downloaded from the ERA5 dataset. These data are employed for the validation of the layered precipitable water product of H8/9 GEO satellite. You can access the data at https://cds.climate.copernicus.eu/cdsapp#!/home (last access: 27 October 2024).
2.2 NRT processing flow and science products
As extensively discussed in the former study by Min et al. (2017b), significant strides were made in the development of the operational prototypes of FY-4 GEO satellite science product algorithms. These remarkable advancements were achieved through the collaborative efforts of the scientists in the FY-4 GEO satellite Algorithm Working Group (AWG) in China, who successfully developed two highly robust Fengyun science product algorithm test beds (or FYGAT) specifically tailored for imagers and sounders. For a comprehensive understanding of the intricate details of FYGAT, interested readers are strongly encouraged to refer to the aforementioned literature by Min et al. (2017b). The FYGAT for the imager is the key module of the NANO_SCS system for rapidly retrieving the first edition of NRT L2 science products of H8/9 GEO satellites.
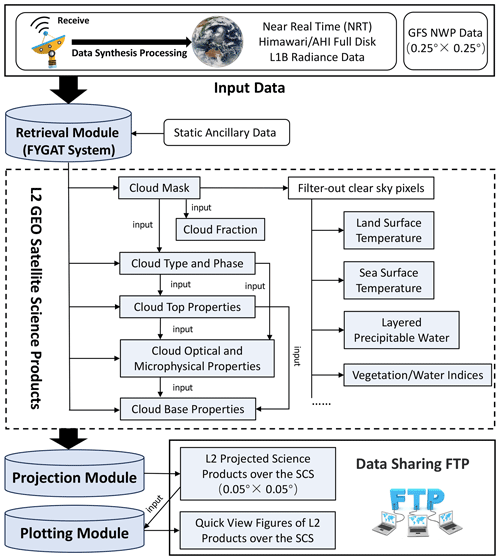
Figure 1 shows the comprehensive NRT processing flowchart of the NANO_SCS system. The dark-gray-shaded cylinder icons in the figure represent the key processing modules of the system, including retrieval, projection, and drawing modules. Following the synthesis of NRT satellite data, the retrieval module initially retrieves the cloud mask product to identify clear- and cloudy-sky pixels within the targeted SCS region. Then, for cloudy-sky pixels, he retrieval module sequentially executes algorithms for retrieving cloud fraction, cloud type/phase, cloud top property, cloud optical and microphysical property, and cloud base property products. However. the accurate retrieval of science products from previous algorithms is crucial for the successful execution of subsequent backend algorithms. For instance, the cloud optical and microphysical property algorithm relies on inputs such as cloud phase and top properties to determine specific ice/water cloud optical and radiative properties lookup tables (LUTs) and atmospheric correction methods above the cloud (Platnick et al., 2017; Walther et al., 2011) used in the retrieval procedure. In stark contrast, other science algorithms for clear-sky pixels can be executed in parallel as they are independent of each other, such as the algorithms for land surface temperature (LST) and sea surface temperature (SST). It is important to note that due to retrieval efficiency and computing resource limitations, the physics-based layered precipitable water (LPW) algorithm (Zhu et al., 2023) is executed only once every half an hour.
Table 1Primary NRT H8/9 GEO satellite atmospheric and oceanic science products and related variables generated by the NANO_SCS system.
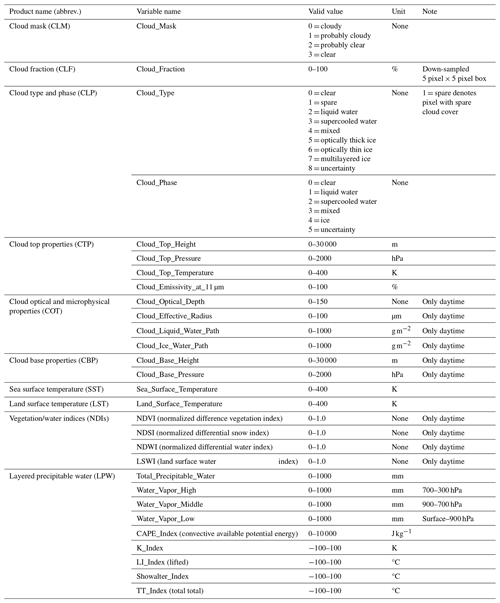
Table 1 provides a list of the main NRT H8/9 GEO satellite atmospheric and oceanic science products in the first edition along with their corresponding variables generated by the NANO_SCS system from 3 November 2022 to the present. It includes the variable name, valid value, and corresponding notes of satellite science products. These products are stored in the Hierarchical Data Format 5 (HDF5) within a 10 min interval. The NRT GEO satellite science product is typically referred to as AHI9_L2_CLM_20230815_0650_4000M_proj.hdf5. In this naming convention, the abbreviation CLM stands for cloud mask (all abbreviations are three characters long), while 20230815_0650 denotes the specific observation time of the satellite data, including year, month, day, hour, and minute. Lastly, 4000M_proj indicates the spatial resolution of 4000 m and projected data. Certain related variables, such as cloud top temperature, pressure, and height, are stored in the same HDF5 GEO satellite science product file – specifically, the CTP (cloud top properties) product file (refer to Table 1).
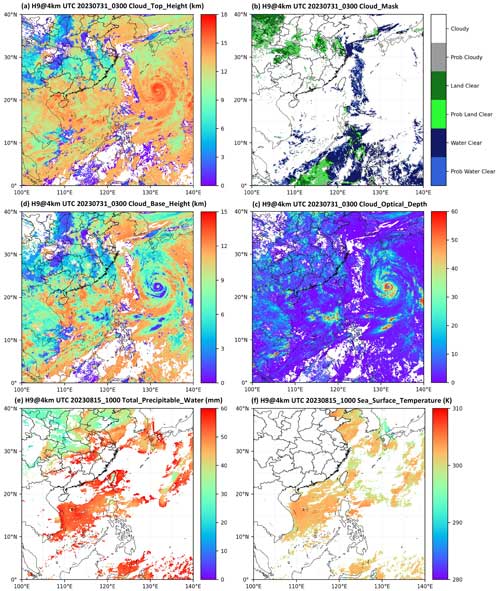
Figure 2H9/AHI GEO satellite cloud top height (a), cloud mask (b), cloud base height (d), and cloud optical depth (c) at 03:00 UTC on 31 July 2023 and atmospheric total precipitable water (e) and sea surface temperature (f) at 10:00 UTC on 15 August 2023 over the NANO_SCS system.
Figure 2 displays the quick-view images of cloud top height, cloud mask, cloud base height, and cloud optical depth at 03:00 UTC on 31 July 2023, as well as atmospheric total precipitable water (from LPW product) and SST retrieved from clear-sky pixels at 10:00 UTC on 15 August 2023 over the SCS. These NRT product images are obtained from the NANO_SCS system. The four cloud product subfigures from 31 July 2023 capture the presence of Typhoon Khanun (international number 2306), which originated in the southwestern waters of Guam on 22 July 2023. It has been observed that the cloud system of Typhoon Khanun can reach maximum cloud top heights exceeding 16 km and minimum cloud base height lower than 1 km. The productions of all the NRT satellite science products and quick-view images of the NANO_SCS system are typically delayed by approximately 17 min from the observation time. Besides, a user-friendly quick-view website (available at http://meteorsatellite.hellosea.org.cn/#/index, last access: 27 October 2024) has been created to provide users with a convenient way to access and monitor the NRT H8/9 satellite data over the SCS.
3.1 Cloud mask and fraction
To differentiate between clear-sky and cloudy pixels in satellite Earth-view image, the cloud mask (CLM) product is first retrieved by the NANO_SCS system (refer to Fig. 1). This serves as a fundamental and primary L2 scientific output of GEO satellite imaging sensors, playing a crucial role in generating high-quality subsequent satellite products. As mentioned in the previous studies (Liang et al., 2023; Wang et al., 2019; Heidinger et al., 2012), we used the new unified cloud mask algorithm (Wang et al., 2019) of early development to retrieve and generate H8/9 CLM product first. Utilizing the 0.64, 1.61, 3.88, 7.3, 11.2, and 12.3 µm channels of H8/9-AHI, the CLM algorithm on this GEO satellite performs 13 distinct cloud/clear-sky tests. These tests are categorized into four groups: solar reflectance (SolRef), infrared (IR), shortwave infrared (SWIR), and spatial uniformity tests (Wang et al., 2019; Xia et al., 2024).
After successfully retrieving the cloud mask product, similar to the MODIS algorithm (Zhao and Girolamo, 2006), cloud fraction (CLF) is calculated in a down-sampled 5 × 5 neighboring pixel box as follows:
where A and B represent the total numbers of cloudy and probably cloudy pixels in the same 5 × 5 neighboring pixel box, respectively. It is worth noting that the cloud fraction product is also projected onto a user-friendly gridded resolution of 0.05° × 0.05°. More descriptions on these two products can be found in Table 1.
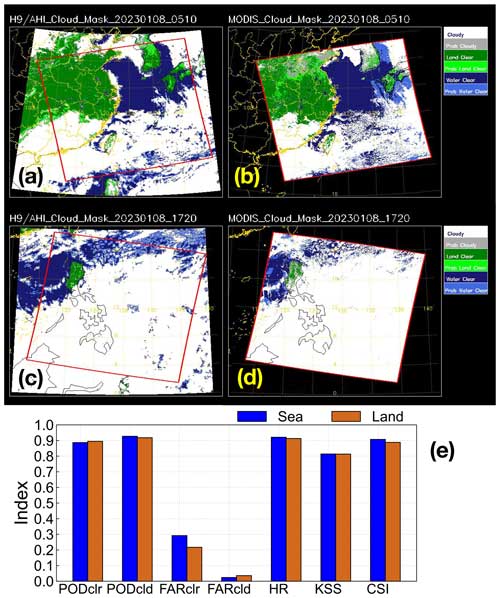
Figure 3Cloud mask comparisons between (a, c) H9/AHI GEO satellite and (b, d) MODIS at 05:10 UTC (a, b) and 17:20 UTC (c, d) on 8 January 2023. (e) POD, FAR, HR, and KSS scores of H9/AHI results for all the matched pixels over land (earthy yellow) and sea (blue) in January, April, July, and October of 2023. In the figure, clr and cld, respectively, signify the clear-sky and cloudy-sky pixels.
A pixel-to-pixel validation was performed on the H8/9 satellite CLM product over the SCS using 1 year of MODIS data from the NANO_SCS system. To quantitatively assess the quality of the GEO satellite CLM product, we employed four significant scores: the probability of detection (POD) or recall rate, the false-alarm ratio (FAR), the hit rate (HR) or accuracy, and Kuiper's skill score (KSS). These metrics were divided into PODcld, PODclr, FARcld, and FARclr, which represent cloudy and clear pixels, respectively. For detailed equations and meanings, please refer to the previous literature (Wang et al., 2019). In Fig. 3a–d, we present two cloud mask comparison samples between the H9/AHI GEO satellite and MODIS at 05:10 and 17:20 UTC on 8 January 2023. It is evident that the CLM results from H9/AHI align well with the latest MODIS official products across both land and sea. Additionally, Fig. 3e displays the POD, FAR, HR, and KSS scores of H9/AHI results for all matched pixels over land and ocean. Notably, both PODcld and HR exceed 0.90, which is consistent with our prior study (Wang et al., 2019), indicating a relatively high-quality CLM product. Moreover, considering that cloud fraction depends on the cloud mask product (refer to Eq. 1), we opted against using similar products for verification in this analysis.
3.2 Cloud type and phase
Cloud type and phase as thermodynamics characteristics signify the state of water vapor and minuscule particles within the cloud. It plays a critical role in weather and climate research as different cloud phases influence the reflection and absorption of solar radiation, consequently impacting Earth's energy balance and climate change (Mülmenstädt et al., 2021). Due to the similarities in detection channels (using 7.3, 8.5, 11.2, and 12.3 µm channels), the cloud type and phase (CLP) retrieval algorithm developed here for H8/9-AHI was based on the corresponding algorithm used for US new-generation Geostationary Operational Environmental Satellites (GOES-R) (Pavolonis et al., 2005, 2010b). The physical foundation of this algorithm is the radiative transfer equation or forward model for a cloudy sky at a specific infrared wavelength λ, which can be expressed as follows (Min et al., 2020):
where Iobs is the observed radiance, Iclr is the clear-sky radiance, and Iac is the above-cloud upwelling atmospheric radiance, respectively. Iclr can be precisely simulated by the coupled fast IR radiative transfer model in the FYGAT system with the input of matched GFS NWP data. ε and Tac, respectively, represent the cloud emissivity and above-cloud transmittance. B and teff are the Planck function and the cloud effective temperature, respectively.
From Eq. (2), a pair of effective cloud emissivity from two different channels can be used to calculate the ratio of effective absorption optical thickness, τabs, of cloud, which is known as the beta ratio (β) and written as follows (Heidinger and Pavolonis, 2009; Parol et al., 1991):
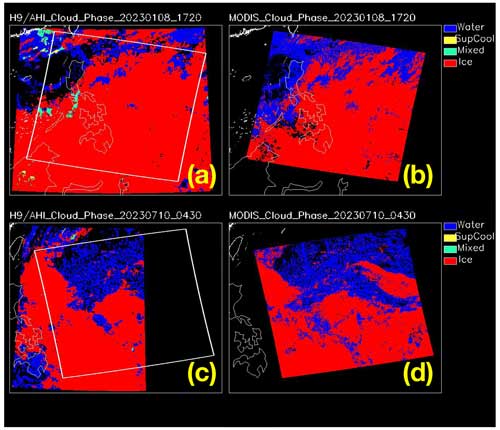
Figure 4Cloud phase comparisons between H9/AHI GEO satellite (a, c) and MODIS (b, d) at 05:10 UTC on 8 January 2023 (a, b) and 04:30 UTC on 10 July 2023 (c, d).
Actually, this parameter represents the ratio of the effective absorption optical depth at two different channels or wavelengths. It can describe βobs by utilizing the computed single-scattering properties of cloud particles along with a given cloud particle size distribution and optical properties. (Parol et al., 1991). βtheory can be expressed as follows:
where ω, g, and αext are the single scattering albedo, asymmetry parameter, and extinction cross section, respectively. Considering the weak impact of multiple scattering, Parol et al. (1991) demonstrated a good approximation of βtheory≈βobs in the range of 8–15 µm. Equation (4) is independent of satellite observed radiance, cloud altitude, or cloud optical thickness. Using the β ratio instead of brightness temperature difference (BTD), it not only considers the contribution of clear-sky conditions to radiation but also provides a method to link observations with theoretical cloud particle distribution and optical properties.
Based on the differences in β ratios (i.e., β [8.5/11.2 µm], β [12.3/11.2 µm], and β [7.3/11.2 µm]) between ice and water clouds, this algorithm effectively identifies cloud type and phase by integrating cloud emissivity, ε, with observed brightness temperature. More details of this algorithm can be found in the previous literature (Pavolonis, 2010a; Pavolonis, 2010b). The six specific cloud types of this CLP product include liquid water (cloud top temperature > 273 K), supercooled water (liquid water clouds with cloud top temperature < 273 K), mixed (which encompass both ice and water clouds), optically thick ice, optically thin ice, and multilayered ice clouds. The cloud phase product can be defined by summarizing the first three types of cloud and ice phase cloud using the last three different ice clouds (see Table 1).
Figure 4 illustrates the cloud phase comparisons between the H9/AHI GEO satellite and MODIS at 05:10 UTC on 8 January 2023 and 04:30 UTC on 10 July 2023. This comparison reveals consistent results between the two products. Notably, in Fig. 4a and c, the new H9/AHI cloud phase product identifies some newly added mixed-phase cloud targets, a feature lacking in the MODIS official cloud phase product (King et al., 1997). However, despite this addition, the distribution pattern of cloud phases remains consistent between the two products as depicted in Fig. 4. The POD and FAR for ice and water clouds (Lai et al., 2019) are 0.94 and 0.17 and 0.68 and 0.14, respectively.
3.3 Cloud top and base properties
Cloud geometry thickness (CGT), including top and base heights (CTP and CBP), enables the profiling of the vertical structure of clouds, which is vital for understanding global weather and climate systems (Viúdez-Mora et al., 2015; Wang et al., 2022). Using the same beta ratio (β) theory discussed in Sect. 3.2; the optimal estimation (OE) method (Rodgers, 2000); and observed brightness temperatures (BTs) at 11.2, 12.3, and 13.3 µm channels, a classical one-dimensional variational (1DVAR) algorithm applies a cost function, ζ (refer to Eq. 5), to estimate the cloud top temperature (CTT), which can be written as follows:
where x, y, xa, M(x), Cova, and Covy, represent the posterior state vectors, the observation vectors (including BT11 µm, BTD11–12 µm, and BTD11–13.3 µm), the a priori state or first-guess vectors (including CTT; cloud emissivity, ε at 11 µm; and β (12/11 µm)), the forward radiative transfer model (based on Eq. 2) in the CLP retrieval algorithm, and the error covariance matrices of the a priori state vector (xa) and the differences between observations and the forward radiative transfer model of M(x), respectively. As a non-linear least-squares fitting problem, the classical Levenberg–Marquardt iteration method is used here to minimize the cost function of ζ, which can be written as follows (Levenberg, 1944):
where K signifies the Jacobi or Kernel matrix. The optimal values of CTT, cloud emissivity, and β (12/11 µm) will be obtained when the iteration converges the satellite observation vectors of y. It is worth noting that the beta ratio (β) plays a specific role in this retrieval algorithm by analytically solving equations in the Jacobi matrix stated in Eq. (6), thereby resulting in a significant enhancement of operational processing efficiency. After obtaining the optimal CTT, the matched GFS-NWP temperature profile is utilized to interpolate the corresponding cloud top height and pressure. For more detailed information on the CTP retrieval algorithm of H8/9-AHI, please refer to the study by Min et al. (2020).
In contrast, the successful retrieval of cloud base properties requires more inputs such as cloud mask, type, top height, and optical and microphysical properties (converted to cloud water path, CWP, in g m−2) as discussed in Sect. 3.1, 3.2, and 3.4. Wang et al. (2024) have recently developed and improved a new CBP retrieval algorithm for GEO H8/9-AHI, which refers to the CLAVR-x cloud base properties algorithm (Clouds from Advanced Very High Resolution Radiometer Extended, NOAA's operational cloud processing system for the AVHRR) (Wang et al., 2024; Noh et al., 2017). This algorithm can only be executed during the daytime (solar zenith angle < 65°) because it relies on cloud top height (CTH) and cloud water path to calculate the two linear fitting coefficients, namely slope (A1) and intercept (A2) (Noh et al., 2017). These two coefficients are determined through piecewise fitting using the CTH, CWP, and cloud base height (CBH) data obtained from the joint CloudSat/CALIPSO (Cloud–Aerosol Lidar and Infrared Pathfinder Satellite Observation) product (Noh et al., 2017). Once the two corresponding fitting coefficients are obtained, the cloud geometric thickness can be calculated as follows:
After that, the CBH can be easily calculated using the formula CBH = CTH − CGT.
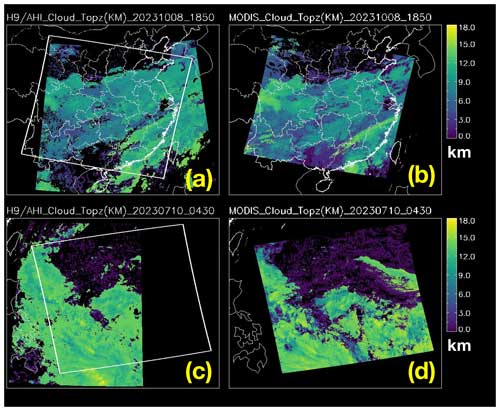
Figure 5Cloud top height comparisons between H9/AHI GEO satellite (a, c) and MODIS (b, d) at 18:50 UTC on 8 October 2023 (a, b) and 04:30 UTC on 10 July 2023 (c, d).
Previous studies have validated the CTH and CBH products obtained through the same algorithms used for the H8 satellite, leveraging joint CloudSat/CALIPSO product (Wang et al., 2024; Wang et al., 2022; Min et al., 2020; Min et al., 2017b). The mean absolute error (MAE) and standard deviation (SD) for GEO satellite CTH are reported as 3.18 and 3.75 km, respectively, with a noticeable increase associated with higher CTH values. Additionally, the MAE and root-mean-square error (RMSE) for CBH, retrieved by the same GEO CLAVR-x algorithm, stand at 1.938 and 2.91 km, as reported in prior studies (Wang et al., 2024; Min et al., 2020). In Fig. 5, CTH comparisons between the H9/AHI GEO satellite and MODIS are presented for 18:50 UTC on 8 October 2023 and 04:30 UTC on 10 July 2023. The figure demonstrates well consistent CTH values and horizontal distributions derived from both H9/AHI and MODIS datasets.
3.4 Cloud optical and microphysical properties
The cloud optical thickness (COT or τcld) and particle effective radius (CER or rcld in µm) (or cloud optical and microphysical properties) primarily characterizes the radiative properties of clouds, highlighting their influence on the equilibrium of Earth's radiation budget (Platnick et al., 2017). These two parameters are commonly used in a general circulation model (GCM) to define cloud parameterization schemes for climate modeling (Chou et al., 1998). The cloud optical and microphysical property algorithm during the daytime (solar zenith angle < 65°) utilizes the reflected solar radiation measured by a non-absorbing channel (0.64 µm) to retrieve the cloud optical thickness (τcld). Additionally, it uses the reflected solar radiation measured by an absorbing channel (2.23 µm) to retrieve cloud particle effective radius (rcld) (Walther et al., 2011). The fundamental physical principle of this algorithm is to leverage the sensitivities of the non-absorbing and absorbing channels to cloud optical thickness (τcld) and cloud particle effective radius (rcld) in the atmospheric radiative transfer process as demonstrated by a previous study (Nakajima and King, 1990).
The water and ice cloud optical and radiative property lookup tables (LUTs) with a modified gamma size distribution for fast retrieval were built based on spherical particle with the scattering properties given by the Mie theory and MODIS Collection-6 severely roughened aggregated column ice crystal (Min et al., 2017a; Platnick et al., 2017; Baum et al., 2007), respectively. By utilizing the similar 1DVAR algorithm discussed in Sect. 3.3, along with water/ice cloud LUTs, observed reflectance at 0.64 and 2.23 µm channels, and additional ancillary data, the optimal cloud optical thickness (τcld) and cloud particle effective radius (rcld) can be iteratively calculated using the OE algorithm (Walther et al., 2011). Contrastingly to Eq. (2), the variables or first-order partial derivative from forward cloud reflectance model in the Jacobi matrix are derived from a formula for solar reflectance observed by satellites, which can be written as follows (Nakajima and King, 1990):
where Robs is the total cloud bidirectional reflectance function at the top of the atmosphere (TOA). As is the albedo at the Lambertian surface of a uniform single-layer cloud. Rcld and Tcld signify the cloud reflectance and downward transmittance (diffuse and direct), respectively. and are the cloud spherical albedo and the transmittance below the cloud, respectively. After retrieving τcld and rcld, ice and liquid cloud water paths (IWP and LWP) are calculated using empirical formulas (Bennartz, 2007; Heymsfield et al., 2007), which are expressed as follows:
where ρ is the density of liquid water (= 1.0 g cm−3).
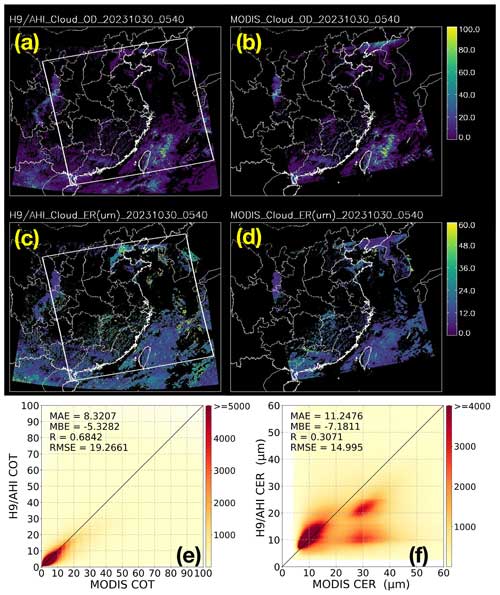
Figure 6Cloud optical depth (a, b) and effective radius (c, d) comparisons between H9/AHI GEO satellite (a, c) and MODIS (b, d) at 05:40 UTC on 30 October 2023. Comparisons of the 1-year (2023) cloud optical depth (e) and effective radius (f) from MODIS and H9/AHI data over the NANO_SCS system. The color bar represents the total number in every bin at an interval of 0.2 of COT or 0.2 µm of CER.
Figure 6 shows the cloud optical depth and effective radius comparisons between the H9/AHI GEO satellite and MODIS (Platnick et al., 2017) at 05:40 UTC on 30 October 2023. We find consistent retrieval results between these two different COT and CER products. Besides, Fig. 6e and f, respectively, show the comparisons of the 1-year COT and CER from MODIS and H9/AHI data over the SCS with the related scores, such as MAE, mean bias error (MBE), R, and RMSE. The differences are likely to be attributed to the different spatial resolutions and retrieval algorithms used between these two satellite products (Letu et al., 2019; Wang et al., 2024). Specifically, in Fig. 6f, the CER comparisons reveal more pronounced discrepancies, primarily due to the different ice cloud particle scattering models used in the two retrieval algorithms (Letu et al., 2019).
3.5 Layered precipitable water and atmospheric instability indices
The atmospheric temperature and humidity profiles provide valuable information about the vertical distribution of water vapor and temperature at various altitudes. This is very crucial for studying cloud formation, precipitation patterns, and intricate processes of the water cycle and accurate numerical weather forecasting and climate modeling (Charlesworth et al., 2023; Zheng et al., 2015; Li et al., 2016; Zhu et al., 2023). In this investigation, the layered precipitable water (LPW) product obtained from H8/9-AHI only provides clear-sky (refer to the flowchart in Fig. 1) temperature and humidity profiles and atmospheric instability indices. The next few satellite products described in Sect. 3.6 and 3.7 are also processed only in clear-sky pixels. The temperature and humidity profiles are integrated into three distinct layers for the output satellite product (high layer from 700 to 300 hPa, middle layer from 900 to 700 hPa, and low layer from the surface to 900 hPa).
This physics-based LPW retrieval algorithm uses BT observations at 6.2, 6.9, 7.3, 8.5, 10.4, 11.2, 12.3, and 13.3 µm channels to retrieve temperature and humidity profiles. Since the temperature and humidity profiles can only be retrieved from clear-sky pixels, we can express the forward IR radiative transfer equation observed by satellite sensor as follows (Li et al., 2012; Li et al., 2000):
where T is the atmospheric transmittance above the pressure, p. Subscript s signifies the surface; . Similarly to the OE method mentioned above, the cost function for retrieving temperature and humidity profiles can be written as follows:
where the new added variable γ is the regularization parameter (or smoothing factor) compared to Eq. (5). The introduction of parameter γ aims to achieve faster convergence and improve solution stability. The iterative 1DVAR algorithm can increase or decrease parameter γ by determining the first-order variation of Eq. (11) (Li et al., 2000). The first guessed temperature and humidity profiles for iterative retrieval are obtained from spatio-temporally matched GFS-NWP data.
After retrieving the optimal temperature and humidity profiles, it calculates five atmospheric instability indices, including LI (lifted index), CAPE (convective available potential energy), TT (total total), KI (K index), and SI (Showalter index). In weather forecasting, these indices can characterize the degree of development of atmospheric instability features and provide the forecaster with a general idea of the convective forcing. For instance, the LI represents the level of atmospheric thermodynamic instability. A positive LI value indicates stability (0 < LI), while a negative LI value suggests varying degrees of instability (−3 < LI < 0 being marginally unstable, −6 < LI < −3 moderately unstable, −9 < LI < −6 very unstable, and LI < −9 extremely unstable) (Fernando et al., 2021). The valid ranges and usages of these five atmospheric instability indices could refer to Table 1 and the study from Li et al. (2012). Note that, considering the specific retrieval efficiency (processing LPW over the SCS region takes approximately 20–25 min) of the H8/9-AHI LPW product, we have set the retrieval frequency for LPW to 30 min.
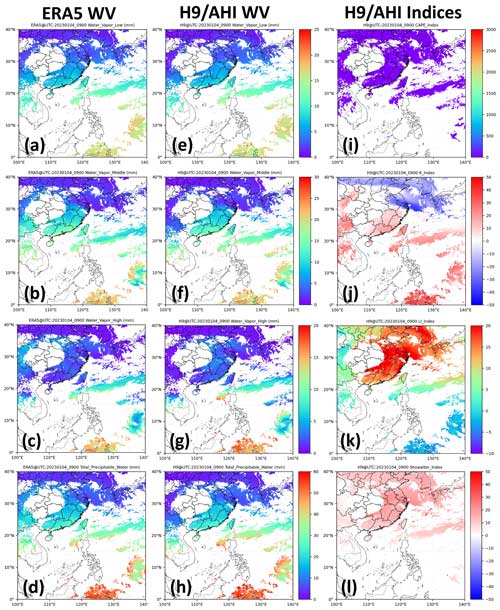
Figure 7ERA5 (left column) and H9/AHI GEO satellite (middle column) atmospheric (a, e) water vapor at low layer (surface–900 hPa), (b, f) water vapor at middle layers (900–700 hPa), (c, g) water vapor at high layers (700–300 hPa), (d, h) total precipitable water, (i) H9/AHI CAPE index, (j) H9/AHI K index, (k) H9/AHI LI index, and (l) H9/AHI Showalter index at 09:00 UTC on 4 January 2023 over the NANO_SCS system.
Figure 7 presents a comparison between the LPW, encompassing total precipitable water and water vapors at low, middle, and high layers, derived from the H9/AHI GEO satellite and ERA5 reanalysis data at 09:00 UTC on 4 January 2023, specifically over the SCS. The right column panel displays associated H9/AHI CAPE, K, LI, and Showalter indices. Except for the water vapors at the high layer (700–300 hPa), the remaining LWP products exhibit negligible differences compared to the ERA5 reanalysis data in Fig. 7.
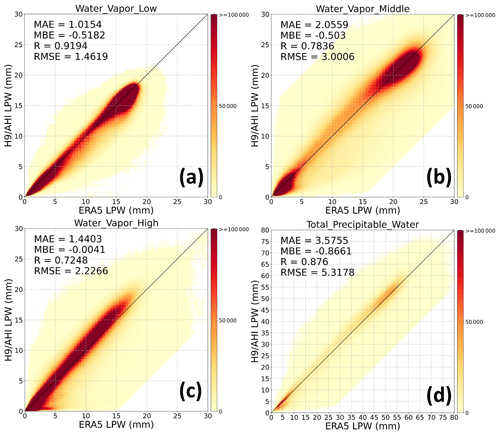
Figure 8Comparisons of the 1-year (2023) layered precipitable water (LPW) values (a, low, b, middle, c, high, and d, total) from ERA5 reanalysis and H9/AHI data over the NANO_SCS system. The color bar represents the total number in every bin at an interval of 0.1 mm.
To further validate the LPW products derived from H9/AHI, we conducted comparisons against ERA5 reanalysis data for LPWs over a 4-month period mentioned above (January, April, July, and October of 2023). Figure 8 depicts the comparison results for total precipitable water and LPWs at three distinct layers. The correlation coefficients (R) for the LPWs at low, middle, and high layers along with total precipitable water, are, respectively, 0.919, 0.784, 0.725, and 0.876. These high correlation coefficients indicate the relatively high quality of this product from the NANO_SCS system.
3.6 Land and sea surface temperatures
Land and sea surface temperatures (LST and SST) are essential variables frequently utilized in the climate research community (Cai et al., 2022; Hong et al., 2022). In this study, we incorporated a classical land surface temperature algorithm (Ulivieri and Cannizzaro, 1985) into the NANO_SCS system, using split-windows channels of H8/9-AHI (11.2 and 12.3 µm). This modified algorithm was also implemented as the operational LST algorithm for the FY-4A GEO satellite (Dong et al., 2023) by the China Meteorological Administration (CMA), which can be easily expressed as follows:
where C, A1–3, and D are the fitting coefficients. θ represents the satellite zenith angle. εs is the surface emissivity. To account for the uncertainties in the LST algorithm caused by water vapor, we conducted regression analysis using MODTRAN V4.2 (Min et al., 2022; Berk et al., 1991; Dong et al., 2023) to derive fitting coefficients for four distinct groups: daytime dry, daytime moist, nighttime dry, and nighttime moist conditions. A threshold of water vapor content of 2.0 g cm−2 was utilized to classify the atmosphere as either dry or moist. This threshold value was obtained from matched GFS-NWP data.
The classic and simplified non-linear sea surface temperature (NLSST) algorithm was used here to retrieve SST of H8/9-AHI (Walton et al., 1998), which is expressed as follows:
where a0–3 are the fitting coefficients. The latest NOAA OISST (optimum interpolation sea surface temperature) is used here to obtain fitting coefficients in Eq. (14) (Huang et al., 2021; Reynolds et al., 2007). This global SST dataset, with a 0.25° × 0.25° horizontal resolution, covers the period from 1981 to the present.
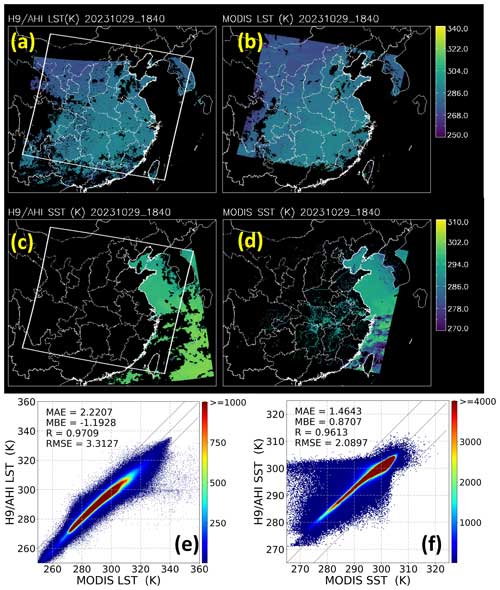
Figure 9LST (a, b) and SST (c, d) comparisons between the 9/AHI GEO satellite (a, c) and MODIS (b, d) at 18:40 UTC on 29 October 2023. Comparisons of the 1-year (2023) LST (e) and SST (f) from MODIS and H9/AHI data over the NANO_SCS system. The color bar represents the total number in every bin at an interval of 0.25 K of LST or SST.
Figure 9 shows the LST and SST comparisons between the H9/AHI GEO satellite and MODIS at 18:40 UTC on 29 October 2023. From this figure, we find consistent results of LST and SST between our results and MODIS official products. Figure 9e and f also show the comparisons of the 1-year LST and SST from MODIS and H9/AHI data over the SCS. The correlation coefficient (R) of these two products is about 0.96.
3.7 Vegetation and water indices
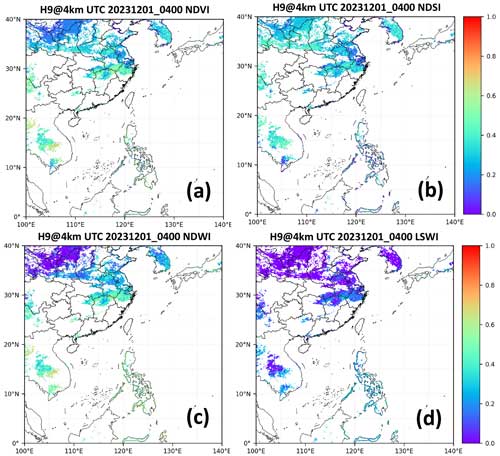
Vegetation and water indices, such as NDVI (normalized difference vegetation index), NDSI (normalized differential snow index), NDWI (normalized differential water index), and LSWI (land surface water index), are commonly utilized for climate change, vegetation growth, urbanization, flood monitoring, etc. (Gu et al., 2007; Hall et al., 1995; Xiao et al., 2006; Zheng et al., 2021). In the NANO_SCS system, these indices are calculated for clear-sky pixels during daytime using H8/9-AHI and are expressed as follows:
where Ref represents the reflectance observed by satellite-visible and near-infrared bands during the daytime. Unfortunately, in this study, the lack of a 0.47 µm channel prevents the computation of the enhanced vegetation index (EVI). Figure 10 shows the clear-sky NDVI, NDSI, NDWI, and LSWI maps from H9/AHI at 04:00 UTC on 1 December 2023 over the SCS, which were generated by the NANO_SCS system.
The Japanese Himawari-8 (H8) and Himawari-9 (H9) geostationary (GEO) satellites are strategically positioned over the South China Sea (SCS), having been launched on 7 October 2014 and 2 November 2016, respectively. It mainly provides cloud mask, fraction, height, phase, optical and microphysical property; layered precipitable water; and sea surface temperature products within a temporal resolution of 10 min and a gridded resolution of 0.05° × 0.05°. Users can freely access sample HDF files and data download instructions in PDF format for the South China Sea datasets at https://doi.org/10.6084/m9.figshare.25015853 (Liu et al., 2024). Besides, for accessing related NRT satellite products, a quick-view website URL (available at http://meteorsatellite.hellosea.org.cn/#/index, last access: 27 October 2024). Data can be downloaded via FTP (File Transfer Protocol) using the address ftp://www.hellosea.org.cn:10021 (last access: 27 October 2024) with the login credentials “smlweix” and password “sml#456@”.
This investigation provides a comprehensive introduction to the key GEO satellite science products generated by the NANO_SCS system and their evaluation. It offers near-real-time atmospheric and oceanic science products of Himawari-8 and Himawari-9 geostationary satellites over the South China Sea from 13 November 2022 to the present. Positioned at 0° latitude and 140.7° E, the H8/9 geostationary satellites mainly cover east Asia, Oceania, and the Indian Ocean. The standard NRT Level-2 satellite science products encompass the region between 0 and 40° N and 100 to 140° E, with a grid resolution of 0.05° × 0.05° and a 10 min interval (except for LPW products, which are retrieved every 30 min). These products are derived from 14 spectral channels with a 4 km horizontal resolution.
The NANO_SCS system provides a range of atmospheric and oceanic products, including cloud mask, fraction, height, phase, optical, and microphysical properties; layered precipitable water; land surface temperature; and sea surface temperature. These near-real-time satellite products were rigorously evaluated against independent datasets, including MODIS satellite-based products and ERA5 reanalysis data. The results highlight strong consistency between NRT H8/9 geostationary satellite atmospheric and oceanic science products and the reference data from similar sensors and ERA5 over the South China Sea.
Future continuation of atmospheric and oceanic science products generated by the NANO_SCS system is also operated and secured by the Southern Marine Science and Engineering Guangdong Laboratory (Zhuhai) in China. Preparations are underway for new products such as atmospheric motion vectors (AMV) and quantitative precipitation estimates (QPEs) in near-real-time production. Besides, the qualities of current GEO satellite products will be further validated and enhanced. The Chinese FY-4C GEO satellite, scheduled for launch in 2025 or 2026, will offer a higher spatial resolution and additional channels, including an IR hyperspectral sounder, to further extend and improve the NANO_SCS-system-based data records for atmospheric and oceanic parameters.
JL and MM contributed to designing the research. MM, JL, and WW implemented the research and wrote the original draft. JL supervised the research. All co-authors revised the paper and contributed to the writing.
The contact author has declared that none of the authors has any competing interests.
Publisher's note: Copernicus Publications remains neutral with regard to jurisdictional claims made in the text, published maps, institutional affiliations, or any other geographical representation in this paper. While Copernicus Publications makes every effort to include appropriate place names, the final responsibility lies with the authors. Regarding the maps used in this paper, please note that Figs. 2, 5–7, and 9–10 contain disputed territories.
The authors would like to thank JMA, US NASA MODIS group, and ECMWF for freely providing Himawari-8, Himawari-9 (available at http://ftp.ptree.jaxa.jp, last access: 27 October 2024), MODIS (available at https://search.earthdata.nasa.gov/search, last access: 27 October 2024), and ERA5 reanalysis (available at https://cds.climate.copernicus.eu/cdsapp#!/home) data. The authors also would like to thank NOAA for freely providing GFS-NWP (available at https://nomads.ncep.noaa.gov/pub/data/nccf/com/gfs/, last access: 27 October 2024) and OISST (available at https://www.ncei.noaa.gov/data/sea-surface-temperature-optimum-interpolation/v2.1/access/avhrr/, last access: 27 October 2024) data and the GOES-R AWG. Furthermore, we also thank Lixin Dong of the China Meteorological Administration National Satellite Meteorological Center, who freely provided the LST algorithm code. Finally, we would also like to thank the editor and anonymous reviewers for their thoughtful suggestions and comments.
This research has been supported by the Southern Marine Science and Engineering Guangdong Laboratory (Zhuhai) (grant nos. SML2021SP102 and SML2022SP401), National Natural Science Foundation of China (grant no. 42175086), Fengyun Meteorological Satellite Innovation Foundation (grant no. FY-APP-ZX-2022.0207), and Innovation Group Project of Southern Marine Science and Engineering Guangdong Laboratory (Zhuhai) (grant no. SML2023SP208).
This paper was edited by Davide Bonaldo and reviewed by Peter Kuma and one anonymous referee.
Baum, B. A., Yang, P., Nasiri, S., Heidinger, A. J., Heymsfield, A., and Li, J.: Bulk scattering properties from the remote sensing of ice clouds. Part III: High resolution spectral models from 100 to 3250 cm−1, J. Appl. Meteorol. Clim., 46, 42–434, https://doi.org/10.1175/JAM2473.1, 2007.
Bennartz, R.: Global assessment of marine boundary layer cloud droplet number concentration from satellite, J. Geophys. Res.-Atmos., 112, D02201, https://doi.org/10.1029/2006JD007547, 2007.
Berk, A., Anderson, G. P., Acharya, P. K., Chetwynd, J. H., Bernstein, L. S., Shettle, E. P., Matthew, M. W., and Adler-Golden, S. M.: MODTRAN4 user's manual, 1999.
Bessho, K., Date, K., Hayashi, M., Ikeda, A., Imai, T., Inoue, H., Kumagai, Y., Miyakawa, T., Murata, H., Ohno, T., Okuyama, A., Oyama, R., Sasaki, Y., Shimazu, Y., Shimoji, K., Sumida, Y., Suzuki, M., Taniguchi, H., Tsuchiyama, H., Uesawa, D., Yokota, H., and Yoshida, R.: An introduction to Himawari-8/9—Japan's new-generation geostationary meteorological satellites, J. Meteorol. Soc. Jpn., 94, 151–183, https://doi.org/10.2151/jmsj.2016-009, 2016.
Cai, W., Ng, B., Wang, G., Santoso, A., Wu, L., and Yang, K.: Increased ENSO sea surface temperature variability under four IPCC emission scenarios, Nat. Clim. Change, 12, 228–231, https://doi.org/10.1038/s41558-022-01282-z, 2022.
Charlesworth, E., Plöger, F., Birner, T., Baikhadzhaev, R., Abalos, M., Abraham, N. L., Akiyoshi, H., Bekki, S., Dennison, F., Jöckel, P., Keeble, J., Kinnison, D., Morgenstern, O., Plummer, D., Rozanov, E., Strode, S., Zeng, G., Egorova, T., and Riese, M.: Stratospheric water vapor affecting atmospheric circulation, Nat. Commun., 14, 3925, https://doi.org/10.1038/s41467-023-39559-2, 2023.
Chou, M.-D., Suarez, M. J., Ho, C.-H., Yan, M. M.-H., and Lee, K.-T.: Parameterizations for cloud overlapping and shortwave single-scattering properties for use in general circulation and cloud ensemble models, J. Climate, 11, 202–214, https://doi.org/10.1175/1520-0442(1998)011<0202:PFCOAS>2.0.CO;2, 1998.
Ding, Y. and Liu, Y.: Onset and the evolution of the Summer Monsoon over the South China Sea during SCSMEX Field Experiment in 1998, J. Meteorol. Soc. Jpn., 79, 255–276, https://doi.org/10.2151/jmsj.79.255, 2001.
Dong, L., Tang, S., Wang, F., Cosh, M., Li, X., and Min, M.: Inversion and validation of FY-4A official land surface temperature product, Remote Sens.-Basel, 15, 2437, https://doi.org/10.3390/rs15092437, 2023.
Fernando, M., Millangoda, M., and Premalal, S.: Analyze and Comparison of the Atmospheric Instability Using K-Index, Lifted Index Total Totals Index Convective Availability Potential Energy (CAPE) and Convective Inhibition (CIN) in Development of Thunderstorms in Sri Lanka During Second Inter-Monsoon, in: Multi-Hazard Early Warning and Disaster Risks, edited by: Amaratunga, D., Haigh, R., and Dias, N., Springer, Cham, https://doi.org/10.1007/978-3-030-73003-1_41, 2021.
Gu, Y., Brown, J. F., Verdin, J. P., and Wardlow, B. D.: A five-year analysis of MODIS NDVI and NDWI for grassland drought assessment over the central Great Plains of the United States, Geophys. Res. Lett., 34, L06407, https://doi.org/10.1029/2006GL029127, 2007.
Hall, D. K., Riggs, G. A., and Salomonson, V. V.: Development of methods for mapping global snow cover using moderate resolution imaging spectroradiometer data, Remote Sens. Environ., 54, 127–140, https://doi.org/10.1016/0034-4257(95)00137-P, 1995.
Heidinger, A. and Pavolonis, M.: Gazing at cirrus clouds for 25 years through a split window, part 1: Methodology, J. Appl. Meteorol. Clim., 48, 1110–1116, https://doi.org/10.1175/2008JAMC1882.1, 2009.
Heidinger, A. K., Evan, A. T., Foster, M. J., and Walther, A.: A naive Bayesian cloud-detection scheme derived from CALIPSO and applied within PATMOS-x, J. Appl. Meteorol. Clim., 51, 1129–1144, https://doi.org/10.1175/JAMC-D-11-02.1, 2012.
Hersbach, H., Bell, B., Berrisford, P., Hirahara, S., Horányi, A., Muñoz‐Sabater, J., Nicolas, J., Peubey, C., Radu, R., Schepers, D., Simmons, A., Soci, C., Abdalla, S., Abellan, X., Balsamo, G., Bechtold, P., Biavati, G., Bidlot, J., Bonavita, M., Chiara, G. D., Dahlgren, P., Dee, D., Diamantakis, M., Dragani, R., Flemming, J., Forbes, R. G., Fuentes, M., Geer, A. J., Haimberger, L., Healy, S. B., Hogan, R. J., Holm, E. V., Janisková, M., Keeley, S. P., Laloyaux, P., Lopez, P., Lupu, C., Radnoti, G., Rosnay, P. D., Rozum, I., Vamborg, F., Villaume, S., and Thepaut, J.: The ERA5 global reanalysis, Q. J. Roy. Meteor. Soc., 146, 1999–2049, https://doi.org/10.1002/qj.3803, 2020.
Heymsfield, A. J., Matrosov, S., and Baum, B.: Ice water path-optical depth relationships for cirrus and deep stratiform ice cloud layers, J. Appl. Meteorol., 42, 1369–1390, https://doi.org/10.1175/1520-0450(2003)042<1369:IWPDRF>2.0.CO;2, 2007.
Hong, F., Zhan, W., Göttsche, F.-M., Liu, Z., Dong, P., Fu, H., Huang, F., and Zhang, X.: A global dataset of spatiotemporally seamless daily mean land surface temperatures: generation, validation, and analysis, Earth Syst. Sci. Data, 14, 3091–3113, https://doi.org/10.5194/essd-14-3091-2022, 2022.
Huang, B., Liu, C., Banzon, V., Freeman, E., Graham, G., Hankins, B., Smith, T., and Zhang, H.-M.: Improvements of the Daily Optimum Interpolation Sea Surface Temperature (DOISST) Version 2.1, J. Climate, 34, 2923–2939, https://doi.org/10.1175/JCLI-D-20-0166.1, 2021.
Husi, L., Nagao, T. M., Nakajima, T. Y., Riedi, J., Ishimoto, H., Baran, A. J., Shang, H., Sekiguchi, M., and Kikuchi, M.: Ice cloud properties from Himawari-8/AHI next-generation geostationary satellite: Capability of the AHI to monitor the DC cloud generation process, IEEE T. Geosci. Remote, 57, 3229–3239, https://doi.org/10.1109/TGRS.2018.2882803, 2019.
Jiang, J., Zhou, T., Qian, Y., Li, C., Song, F., Li, H., Chen, X., Zhang, W., and Chen, Z.: Precipitation regime changes in High Mountain Asia driven by cleaner air, Nature, 623, 544–549, https://doi.org/10.1038/s41586-023-06619-y, 2023.
Kim, D., Gu, M., Oh, T.-H., Kim, E.-K., and Yang, H.-J.: Introduction of the advanced meteorological imager of Geo-Kompsat-2a: In-orbit tests and performance validation, Remote Sens.-Basel, 13, 1303, https://doi.org/10.3390/rs13071303, 2021.
King, M. D., Tsay, S. C., Planick, S. E., Wang, M., and Liou, K. N.: Cloud retrieval algorithms: Optical thickness, effective particle radius, and thermodynamic phase, NASA MODIS Algorithm Theoretical Basis Documents, NASA Goddard Space Flight Center, Greenbelt, 1997.
Koseki, S., Tieh-Yong, K., and Chee-Kiat, T.: Effects of the cold tongue in the South China Sea on the monsoon, diurnal cycle and rainfall in the Maritime Continent, Q. J. Roy. Meteor. Soc., 139, 1566–1582, https://doi.org/10.1002/qj.2052, 2013.
Lai, R., Teng, S., Yi, B., Letu, H., Min, M., Tang, S., and Liu, C.: Comparison of cloud properties from Himawari-8 and FengYun-4A geostationary satellite radiometers with MODIS cloud retrievals, Remote Sens.-Basel, 11, 1703, https://doi.org/10.3390/rs11141703, 2019.
Letu, H., Nagao, T. M., Nakajima, T. Y., Riedi, J., Ishimoto, H., Baran, A. J., Shang, H., Sekiguchi, M., and Kikuchi, M.: Ice cloud properties from Himawari-8/AHI next-generation geostationary satellite: Capability of the AHI to monitor the DC cloud generation process, IEEE T. Geosci. Remote, 57, 3229–3239, https://doi.org/10.1109/tgrs.2018.2882803, 2019.
Letu, H., Yang, K., Nakajima, T. Y., Ishimoto, H., Nagao, T. M., Riedi, J., Baran, A. J., Ma, R., Wang, T., Shang, H., Khatri, P., Chen, L., Shi, C., and Shi, J.: High-resolution retrieval of cloud microphysical properties and surface solar radiation using Himawari-8/AHI next-generation geostationary satellite, Remote Sens. Environ., 239, 111583, https://doi.org/10.1016/j.rse.2019.111583, 2020.
Levenberg, K.: A method for the solution of certain non-linear problems in least squares, Q. Appl. Math., 2, 164–168, https://doi.org/10.1090/qam/10666, 1944.
Li, J., Wolf, W. W., Menzel, W. P., Zhang, W., Huang, H.-L., and Achtor, T. H.: Global soundings of the atmosphere from ATOVS measurements: The algorithm and validation, J. Appl. Meteorol., 39, 1248–1268, https://doi.org/10.1175/1520-0450(2000)039<1248:GSOTAF>2.0.CO;2, 2000.
Li, J., Schmit, T. J., Jin, X., and Martin, G.: GOES-R Advanced Baseline Imager (ABI) Algorithm Theoretical Basis Document For Legacy Atmospheric Moisture Profile, Legacy Atmospheric Temperature Profile, Total Precipitable Water, and Derived Atmospheric Stability Indices, NOAA Goes-R ATBD, 109, NOAA NESDIS Center for Satellite Applications and Research, 2012.
Li, J., Wang, P., Han, H., Li, J., and Zheng, J.: On the assimilation of satellite sounder data in cloudy skies in numerical weather prediction models, J. Meteorol. Res.-PRC, 30, 169–182, https://doi.org/10.1007/s13351-016-5114-2, 2016.
Li, J., Menzel, W. P., Schmit, T. J., and Schmetz, J.: Applications of geostationary hyperspectral infrared sounder observations – progress, challenges, and future perspectives, B. Am. Meteorol. Soc., 103, E2733–E2755, https://doi.org/10.1175/BAMS-D-21-0328.1, 2022.
Li, Y., Ren, G., Wang, Q., Mu, L., and Niu, Q.: Marine heatwaves in the South China Sea: Tempo-spatial pattern and its association with large-scale circulation, Remote Sens.-Basel, 14, 5829, https://doi.org/10.3390/rs14225829, 2022.
Liang, Y., Min, M., Yu, Y., Wang, X., and Xia, P.: Assessing diurnal cycle of cloud covers of Fengyun-4A geostationary satellite based on the manual observation data in China, IEEE T. Geosci. Remote, 61, 1–18, https://doi.org/10.1109/TGRS.2023.3256365, 2023.
Liu, B., Liu, Y., Wu, G., Yan, J., He, J., and Ren, S.: Asian summer monsoon onset barrier and its formation mechanism, Clim. Dynam., 45, 711–726, https://doi.org/10.1007/s00382-014-2296-0, 2014.
Liu, J., Yu, J., Lin, C., He, M., Liu, H., Wang, W., and Min, M.: Near real-time atmospheric and oceanic science products of Himawari-8/9 geostationary satellites over the South China Sea, Figshare [data set], https://doi.org/10.6084/m9.figshare.25015853.v2, 2024.
Ma, Z., Li, J., Han, W., Li, Z., Zeng, Q., Menzel, W. P., Schmit, T. J., Di, D., and Liu, C.-Y.: Four-dimensional wind fields from geostationary hyperspectral infrared sounder radiance measurements with high temporal resolution, Geophys. Res. Lett., 48, e2021GL093794, https://doi.org/10.1029/2021GL093794, 2021.
Martin, D. W. and Howland, M. R.: Rainfall over the Arabian Sea during the onset of the 1979 monsoon, Nature, 300, 628–630, https://doi.org/10.1038/300628a0, 1982.
Min, M., Deng, J., Liu, C., Lu, N., Hu, X., Chen, L., Guo, J., Zhang, P., Lu, Q., and Wang, L.: An investigation of the implications of lunar illumination spectral changes for Day/Night Band based cloud property retrieval due to lunar phase transition, J. Geophys. Res.-Atmos., 122, 9233–9244, https://doi.org/10.1002/2017JD027117, 2017a.
Min, M., Wu, C., Li, C., Liu, H., Xu, N., Wu, X., Chen, L., Wang, F., Sun, F., Qin, D., Wang, X., Li, B., Zheng, Z., Cao, G., and Dong, L.: Developing the science product algorithm testbed for Chinese next-generation geostationary meteorological satellites: Fengyun-4 series, J. Meteorol. Res.-PRC, 31, 708–719, https://doi.org/10.1007/s13351-017-6161-z, 2017b.
Min, M., Bai, C., Guo, J., Sun, F., Liu, C., Wang, F., Xu, H., Tang, S., Li, B., Di, D., Dong, L., and Li, J.: Estimating summertime precipitation from Himawari-8 and global forecast system based on machine learning, IEEE T. Geosci. Remote, 57, 2557–2570, https://doi.org/10.1109/TGRS.2018.2874950, 2019.
Min, M., Li, J., Wang, F., Liu, Z., and Menzel, W. P.: Retrieval of cloud top properties from advanced geostationary satellite imager measurements based on machine learning algorithms, Remote Sens. Environ., 239, 111616, https://doi.org/10.1016/j.rse.2019.111616, 2020.
Min, M., Chen, B., Xu, N., He, X., Wei, X., and Wang, M.: Nonnegligible diurnal and long-term variation characteristics of the calibration biases in Fengyun-4A/AGRI infrared channels based on the oceanic drifter data, IEEE T. Geosci. Remote, 60, 1–15, https://doi.org/10.1109/TGRS.2022.3160450, 2022.
Mülmenstädt, J., Salzmann, M., Kay, J. E., Zelinka, M. D., Ma, P.-L., Nam, C., Kretzschmar, J., Hörnig, S., and Quaas, J.: An underestimated negative cloud feedback from cloud lifetime changes, Nat. Clim. Change, 11, 508–513, https://doi.org/10.1038/s41558-021-01038-1, 2021.
Nakajima, T. and King, M. D.: Determination of the optical thickness and effective particle radius of clouds from reflected solar radiation measurements. Part I: Theory, J. Atmos. Sci., 48, 728–750, https://doi.org/10.1175/1520-0469(1990)047<1878:DOTOTA>2.0.CO;2, 1990.
Niu, Q. and Feng, Y.: Relationships between the typhoon-induced wind and waves in the northern South China Sea, Geophys. Res. Lett., 48, e2020GL091665, https://doi.org/10.1029/2020GL091665, 2021.
Noh, Y.-J., Forsythe, J. M., Miller, S. D., Seaman, C. J., Li, Y., Heidinger, A. K., Lindsey, D. T., Rogers, M. A., and Partain, P. T.: Cloud-base height estimation from VIIRS. Part II: A statistical algorithm based on A-Train satellite data, J. Atmos. Ocean. Tech., 34, 585–598, https://doi.org/10.1175/JTECH-D-16-0110.1, 2017.
Parol, F., Buriez, J. C., Brogniez, G., and Fouquart, Y.: Information content of AVHRR channels 4 and 5 with respect to the effective radius of cirrus cloud particles, J. Appl. Meteorol., 30, 973–984, https://doi.org/10.1175/1520-0450-30.7.973, 1991.
Pavolonis, M.: GOES-R Advanced Baseline Imager (ABI) Algorithm Theoretical Basis Document For Cloud Type and Cloud Phase Version 2.0, NOAA NESDIS Center for Satellite Applications and Research, 2010a.
Pavolonis, M. J.: Advances in extracting cloud composition information from spaceborne infrared radiances-A robust alternative to brightness temperatures. Part I: Theory, J. Appl. Meteorol. Clim., 49, 1992–2012, https://doi.org/10.1175/2010JAMC2433.1, 2010b.
Pavolonis, M. J., Heidinger, A. K., and Uttal, T.: Daytime global cloud typing from AVHRR and VIIRS: Algorithm description, validation, and comparisons, J. Appl. Meteorol., 44, 804–826, https://doi.org/10.1175/JAM2236.1, 2005.
Platnick, S., King, M. D., Ackerman, S. A., Menzel, W. P., Baum, B. A., Riédi, J. C., and Frey, R. A.: The MODIS cloud products: Algorithms and examples from Terra, IEEE T. Geosci. Remote, 41, 459–473, https://doi.org/10.1109/TGRS.2002.808301, 2003.
Platnick, S., Meyer, K. G., King, M. D., Wind, G., Amarasinghe, N., Marchant, B., Arnold, G. T., Zhang, Z., Hubanks, P. A., Holz, R. E., Yang, P., Ridgway, W. L., and Riedi, J.: The MODIS cloud optical and microphysical products: Collection 6 updates and examples from Terra and Aqua, IEEE T. Geosci. Remote, 55, 502–525, https://doi.org/10.1109/TGRS.2016.2610522, 2017.
Reynolds, R., Smith, T. M., Liu, C., Chelton, D., Casey, K., and Schlax, M.: Daily high-resolution-blended analyses for sea surface temperature, J. Climate, 20, 5473–5496, https://doi.org/10.1175/2007JCLI1824.1, 2007.
Rodgers, C. D.: Inverse methods for atmospheric sounding: Theory and practice, World Scientific, Singapore, https://doi.org/10.1142/3171, 2000.
Schmit, T. J., Griffith, P., Gunshor, M. M., Daniels, J. M., Goodman, S. J., and Lebair, W. J.: A closer look at the ABI on the GOES-R Series, B. Am. Meteorol. Soc., 98, 681–698, https://doi.org/10.1175/BAMS-D-15-00230.1, 2017.
Soldi, G., Gaglione, D., Forti, N., Simone, A. D., Daffinà, F. C., Bottini, G., Quattrociocchi, D., Millefiori, L. M., Braca, P., Carniel, S., Willett, P., Iodice, A., Riccio, D., and Farina, A.: Space-based global maritime surveillance. Part I: Satellite technologies, IEEE Aero. El. Sys. Mag., 36, 8–28, https://doi.org/10.1109/MAES.2021.3070862, 2021.
Ulivieri, C. and Cannizzaro, G.: Land surface temperature retrievals from satellite measurements, Acta Astronaut., 12, 985–997, https://doi.org/10.1016/0094-5765(85)90026-8, 1985.
Viúdez-Mora, A., M., C.-S., Calbó, J., and González, J. A.: Modeling atmospheric longwave radiation at the surface during overcast skies: The role of cloud base height, J. Geophys. Res.-Atmos., 120, 199–214, https://doi.org/10.1002/2014JD022310, 2015.
Walther, A., Straka, W., and Heidinger, A. K.: GOES-R Advanced Baseline Imager (ABI) algorithm theoretical basis document for daytime cloud optical and microphysical properties (DCOMP), NOAA NESDIS Center for Satellite Applications and Research, 2011.
Walton, C. C., Pichel, W. G., Sapper, J. F., and May, D. A.: The development and operational application of nonlinear algorithms for the measurement of sea surface temperatures with the NOAA polar-orbiting environmental satellites, J. Geophys. Res.-Atmos., 103, 27999–28012, https://doi.org/10.1029/98JC02370, 1998.
Wang, B., Huang, F., Wu, Z., Yang, J., Fu, X., and Kikuchi, K.: Multi-scale climate variability of the South China Sea monsoon: A review, Dynam. Atmos. Oceans, 47, 15–37, https://doi.org/10.1016/j.dynatmoce.2008.09.004, 2009.
Wang, F., Min, M., Xu, N., Liu, C., Wang, Z., and Zhu, L.: Effects of linear calibration errors at low temperature end of thermal infrared band: Lesson from failures in cloud top property retrieval of FengYun-4A geostationary satellite, IEEE T. Geosci. Remote, 60, 5001511, https://doi.org/10.1109/TGRS.2022.3140348, 2022.
Wang, G., Xie, S.-P., Qu, T., and Huang, R. X.: Deep South China Sea circulation, Geophys. Res. Lett., 38, L05601, https://doi.org/10.1029/2010GL046626, 2011.
Wang, M., Min, M., Li, J., Lin, H., Liang, Y., Chen, B., Yao, Z., Xu, N., and Zhang, M.: Technical note: Applicability of physics-based and machine-learning-based algorithms of geostationary satellite in retrieving the diurnal cycle of cloud base height, EGUsphere [preprint], https://doi.org/10.5194/egusphere-2024-1516, 2024.
Wang, X., Min, M., Wang, F., Guo, J., Li, B., and Tang, S.: Intercomparisons of cloud mask product among Fengyun-4A, Himawari-8 and MODIS, IEEE T. Geosci. Remote, 57, 8827–8839, https://doi.org/10.1109/TGRS.2019.2923247, 2019.
Wang, X., Liu, Q.-Y., Sui, D., and Wang, D.: The imprint of the ENSO activities on the South China Sea wave climate, Ocean Dynam., 70, 1315–1323, https://doi.org/10.1007/s10236-020-01400-5, 2020.
Whitaker, J. S., Hamill, T. M., Wei, X., Song, Y., and Toth, Z.: Ensemble data assimilation with the NCEP global forecast system, Mon. Weather Rev., 136, 463–482, https://doi.org/10.1175/2007MWR2018.1, 2008.
Xia, P., Min, M., Yu, Y., Wang, Y., and Zhang, L.: Developing a near real-time cloud cover retrieval algorithm using geostationary satellite observations for photovoltaic plants, Remote Sens.-Basel, 15, 1141, https://doi.org/10.3390/rs15041141, 2023.
Xia, P., Zhang, L., Min, M., Li, J., Wang, Y., Yu, Y., and Jia, S.: Accurate nowcasting of cloud cover at solar photovoltaic plants using geostationary satellite images, Nat. Commun., 15, 1–10, https://doi.org/10.1038/s41467-023-44666-1, 2024.
Xiao, X., Boles, S., Frolking, S., Li, C., Babu, J. Y., Salas, W., and Moore, B.: Mapping paddy rice agriculture in South and Southeast Asia using multi-temporal MODIS images, Remote Sens. Environ., 100, 95–113, https://doi.org/10.1016/j.rse.2005.10.004, 2006.
Xu, W., Rutledge, S. A., and Chudler, K.: Diurnal cycle of coastal convection in the South China Sea region and modulation by the BSISO, J. Climate, 34, 4297–4314, https://doi.org/10.1175/JCLI-D-20-0308.1, 2021.
Yang, J., Zhang, Z., Wei, C., Lu, F., and Guo, Q.: Introducing the new generation of Chinese geostationary weather satellites, FengYun-4, B. Am. Meteorol. Soc., 98, 1637–1658, https://doi.org/10.1175/BAMS-D-16-0065.1, 2017.
Zhao, G. and Girolamo, L. D.: Cloud fraction errors for trade wind cumuli from EOS-Terra instruments, Geophys. Res. Lett., 33, L20802, https://doi.org/10.1029/2006GL027088, 2006.
Zheng, J., Li, J., Schmit, T. J., Li, J., and Liu, Z.: The impact of AIRS atmospheric temperature and moisture profiles on hurricane forecasts: Ike (2008) and Irene (2011), Adv. Atmos. Sci., 32, 319–335, 2015.
Zheng, Y., Tang, L., and Wang, H.: An improved approach for monitoring urban built-up areas by combining NPP-VIIRS nighttime light, NDVI, NDWI, and NDBI, J. Clean. Prod., 328, 129488, https://doi.org/10.1016/j.jclepro.2021.129488, 2021.
Zhou, R., Pan, X., Xiaohu, Z., Na, X., and Min, M.: Research progress and prospects of atmospheric motion vector based on meteorological satelliteimages, Reviews of Geophysics and Planetary Physics, 55, 184–194, https://doi.org/10.19975/j.dqyxx.2022-077, 2024 (in Chinese).
Zhu, L., Zhou, R., Di, D., Bai, W., and Liu, Z.: Retrieval of atmospheric water vapor content in the rnvironment from AHI/H8 using both physical and random forest methods—A case study for typhoon Maria (201808), Remote Sens.-Basel, 15, 498, https://doi.org/10.3390/rs15020498, 2023.


