the Creative Commons Attribution 4.0 License.
the Creative Commons Attribution 4.0 License.
 | 19 Sep 2024
Version 1 NOAA-20/OMPS Nadir Mapper total column SO2 product: continuation of NASA long-term global data record
Nickolay A. Krotkov
Joanna Joiner
Vitali Fioletov
Chris McLinden
Debora Griffin
Peter J. T. Leonard
Simon Carn
Colin Seftor
Alexander Vasilkov
For nearly 2 decades, the Ozone Monitoring Instrument (OMI) aboard the NASA Aura spacecraft (launched in 2004) and the Ozone Mapping and Profiler Suite (OMPS) aboard the NASA/NOAA Suomi National Polar-orbiting Partnership (SNPP) satellite (launched in 2011) have been providing global monitoring of SO2 column densities from both anthropogenic and volcanic activities. Here, we describe the version-1 NOAA-20 (N20)/OMPS SO2 product (https://doi.org/10.5067/OMPS/OMPS_N20_NMSO2_PCA_L2_Step1.1, Li et al., 2023), aimed at extending the long-term climate data record. To achieve this goal, we apply a principal component analysis (PCA) retrieval technique, also used for the OMI and SNPP/OMPS SO2 products, to N20/OMPS. For volcanic SO2 retrievals, the algorithm is identical between N20 and SNPP/OMPS and produces consistent retrievals for eruptions such as Kilauea in 2018 and Raikoke in 2019. For anthropogenic SO2 retrievals, the algorithm has been customized for N20/OMPS, considering its greater spatial resolution and reduced signal-to-noise ratio as compared with SNPP/OMPS. Over background areas, N20/OMPS SO2 slant column densities (SCDs) show relatively small biases, comparable retrieval noise with SNPP/OMPS (after aggregation to the same spatial resolution), and remarkable stability with essentially no drift during 2018–2023. Over major anthropogenic source areas, the two OMPS retrievals are generally well-correlated, but N20/OMPS SO2 is biased low, especially for India and the Middle East, where the differences reach ∼ 20 % on average. The reasons for these differences are not fully understood but are partly due to algorithmic differences. Better agreement (typical differences of ∼ 10 %–15 %) is found over degassing volcanoes. SO2 emissions (https://doi.org/10.5067/MEASURES/SO2/DATA406, Fioletov et al., 2022) from large point sources, inferred from N20/OMPS retrievals, agree well with those based on OMI, SNPP/OMPS, and the TROPOspheric Monitoring Instrument (TROPOMI), with correlation coefficients >0.98 and overall differences <10 %. The ratios between the estimated emissions and their uncertainties offer insights into the ability of different satellite instruments to detect and quantify SO2 sources. While TROPOMI has the highest ratios of all four sensors, the ratios from N20/OMPS are slightly greater than OMI and substantially greater than SNPP/OMPS. Overall, our results suggest that the version-1 N20/OMPS SO2 product will successfully continue the long-term OMI and SNPP/OMPS SO2 data records. Efforts currently underway will further enhance the consistency of retrievals between different instruments, facilitating the development of multi-decade, coherent global SO2 datasets across multiple satellites.
- Article
(4828 KB) - Full-text XML
-
Supplement
(4404 KB) - BibTeX
- EndNote


Sulfur dioxide (SO2) is emitted from both anthropogenic (e.g., burning of sulfur-containing fuels, oil and gas exploitation, and metal smelting) and volcanic activities. The adverse impacts of SO2 and its secondary product in the atmosphere, sulfate aerosols, have been well-documented, including their effects on air quality (e.g., Wang et al., 2016), visibility (e.g., Hand and Malm, 2007), human health (e.g., Orellano et al., 2021, and references therein), and ecosystems (e.g., Fedkin et al., 2019; Likens et al., 1996). By scattering solar radiation (e.g., Chuang et al., 1997) and acting as cloud condensation nuclei (e.g., Haywood and Boucher, 2000), sulfate aerosols also influence Earth's radiation budget and the climate. Explosive volcanic eruptions inject sizable amounts of SO2 and other species (e.g., water vapor, halogens, or CO2) into the stratosphere, leading to significant perturbations of stratospheric aerosols (e.g., Vernier et al., 2011) and consequently substantial impacts on the global climate (e.g., Aubry et al., 2021; McGraw et al., 2024; Robock, 2000, Stenchikov, 2016; Timmreck, 2012) as well as stratospheric ozone (e.g., Evan et al., 2023; Solomon et al., 1996; Zhu et al., 2018). To better understand the influence of volcanic SO2 on the Earth system, it is imperative to develop and maintain global monitoring capabilities from satellites, given that volcanic eruptions often happen with little warning in remote areas. In addition, large and varying changes in anthropogenic SO2 emissions have occurred across different regions in recent decades (e.g., Krotkov et al., 2016), amid various factors such as economic development, energy structure, and environmental policies. Long-term global SO2 datasets are also valuable for the detection and attribution of these changes, offering insights into, for example, the efficacy of pollution control measures.
Polar-orbiting satellites equipped with spectrometers that measure back-scattered solar radiation in the ultraviolet (UV) have been a major asset for global SO2 monitoring. Heritage instruments such as the Total Ozone Mapping Spectrometer (TOMS) take measurements at a small number of wavelengths and can only detect relatively large amounts of SO2 (e.g., Krueger, 1983; Fisher et al., 2019) but provide a record of SO2 from major eruptions dating back to the late 1970s (Carn, 2022). First launched in the 1990s, UV–VIS spectrometers (e.g., GOME, the Global Ozone Monitoring Experiment) take measurements at hundreds of wavelengths, allowing detection of SO2 signals from degassing volcanoes and large anthropogenic sources (Eisinger and Burrows, 1998). More recent instruments with two-dimensional detectors such as the Ozone Monitoring Instrument (OMI, Levelt et al., 2018) and the TROPOspheric Monitoring Instrument (TROPOMI, Veefkind et al., 2012) are capable of daily global observations at greater spatial resolution, enhancing sensitivity to smaller SO2 emission sources (e.g., Krotkov et al., 2006; Theys et al., 2015; Yang et al., 2007).
Along with advances in instrumentation, progress in retrieval techniques has led to continued improvements in satellite data products. Data-driven methods, e.g., the principal component analysis (PCA)-based algorithm (Li et al., 2013) and the COvariance Based Retrieval Algorithm (COBRA, Theys et al., 2021), have proven useful for SO2 retrievals. Both the PCA and COBRA SO2 algorithms inherently account for various interferences as well as instrumental factors. As a result, they can produce SO2 retrievals with reduced noise and biases as compared with other methods such as differential optical absorption spectroscopy (DOAS), band residual difference, and linear fit. The data-driven retrieval technique is also relatively insensitive to drift in instrument calibration, thus helping to maintain the stability of the long-term data record. For example, NASA's latest standard OMI SO2 product based on the PCA algorithm shows little change in the mean SO2 over background areas during the 15-year period between 2004 and 2019 (Li et al., 2020). The PCA SO2 algorithm has also been implemented with the Ozone Mapping and Profiler Suite (OMPS) Nadir Mapper (NM) aboard the NASA/NOAA Suomi National Polar-orbiting Partnership (SNPP) spacecraft. Despite the relatively coarse spatial (50 × 50 km2 at nadir) and spectral (∼ 1 nm vs. ∼ 0.6 nm) resolutions of SNPP/OMPS as compared with OMI, the PCA-based retrievals are largely consistent between the two instruments for both anthropogenic (Zhang et al., 2017) and volcanic (Li et al., 2017b) SO2.
Comparisons between PCA satellite SO2 retrievals and limited ground-based measurements using multi-axis differential optical absorption spectroscopy (MAX-DOAS) and Brewer instruments generally show modest correlation but substantial scatter for individual data points (e.g., Ialongo et al., 2015; Jin et al., 2016; Tian et al., 2018; Wang et al., 2017), suggesting that the noise remains relatively large for satellite retrievals. Ground-based measurements also point to a negative bias in PCA-based satellite SO2 data that can be attributed to differences in air mass factor calculations (e.g., a priori profiles) and relatively coarse satellite pixels, although a more recent study suggests that the bias in the monthly mean OMI and SNPP/OMPS PCA SO2 is quite small compared with MAX-DOAS measurements over northern China (C. Wang et al., 2022). Comparisons of different satellite SO2 datasets also reveal overall good agreement between the PCA retrieval algorithm and other retrieval techniques. For example, OMI PCA SO2 retrievals over polluted areas have been found to agree well with OMI DOAS retrievals (Theys et al., 2015). Similarly, there is also good consistency between TROPOMI and SNPP/OMPS PCA SO2 retrievals and TROPOMI COBRA retrievals (Theys et al., 2021). For relatively large volcanic eruptions, it has been found that the estimates of the SO2 mass tend to agree to within ∼ 10 % between SNPP/OMPS PCA and TROPOMI DOAS retrievals (e.g., Carn et al., 2022).
An important application enabled by this progress in satellite instruments and retrieval techniques is to use satellite data to infer SO2 emissions from large point sources (Fioletov et al., 2015). These top-down estimates, compiled in a publicly available catalogue (Fioletov et al., 2016), offer independent constraints on annual emissions from both anthropogenic sources (Li et al., 2017a; Liu et al., 2018; McLinden et al., 2021; Zhang et al., 2019) and degassing volcanoes (Carn et al., 2017) and have helped to uncover emission sources that were previously missing from bottom-up inventories (McLinden et al., 2016). The most recent SO2 emission catalogue (version 2, Fioletov et al., 2023) has been updated to include inputs from multiple satellite instruments, including OMI, SNPP/OMPS, and TROPOMI.
With OMI approaching the end of its mission by 2026 and SNPP/OMPS already in its second decade of operation, data products from newer instruments are needed to continue the long-term SO2 climate data record. The inclusion of TROPOMI in the emission catalogue is a necessary first step, but the existing TROPOMI SO2 products (Theys et al., 2017, 2021) are not fully consistent with NASA's OMI/OMPS products due to differences in algorithms and ancillary datasets. In addition, the follow-on instruments for TROPOMI are planned for morning orbits (Fig. 1) that may pose additional challenges from a data continuity perspective. Like TROPOMI, the U.S. Joint Polar Satellite System 1 (JPSS-1), also known as N20/OMPS, was also launched in 2017 and has a similar spatial resolution to OMI. The four OMPS instruments planned for the JPSS program (including the two already launched on NOAA-20 and NOAA-21) can potentially extend global SO2 monitoring capabilities from the afternoon orbits into the 2040s (Fig. 1). Our goal here is to produce a continuity NOAA-20 (N20)/OMPS SO2 product that bridges SNPP/OMPS with the follow-on JPSS/OMPS sensors. To this end, we have implemented the PCA-based SO2 algorithm with N20/OMPS. In this paper, we describe our version-1 N20/OMPS SO2 product that has been publicly released (Li et al., 2023). The rest of the paper is organized as follows: Sect. 2 briefly introduces the PCA SO2 retrieval algorithm and specific implementation details for N20/OMPS. In Sect. 3, we assess the quality of N20/OMPS SO2 retrievals and compare them with SNPP retrievals. This is followed by a data availability statement in Sect. 4 and conclusions in Sect. 5.
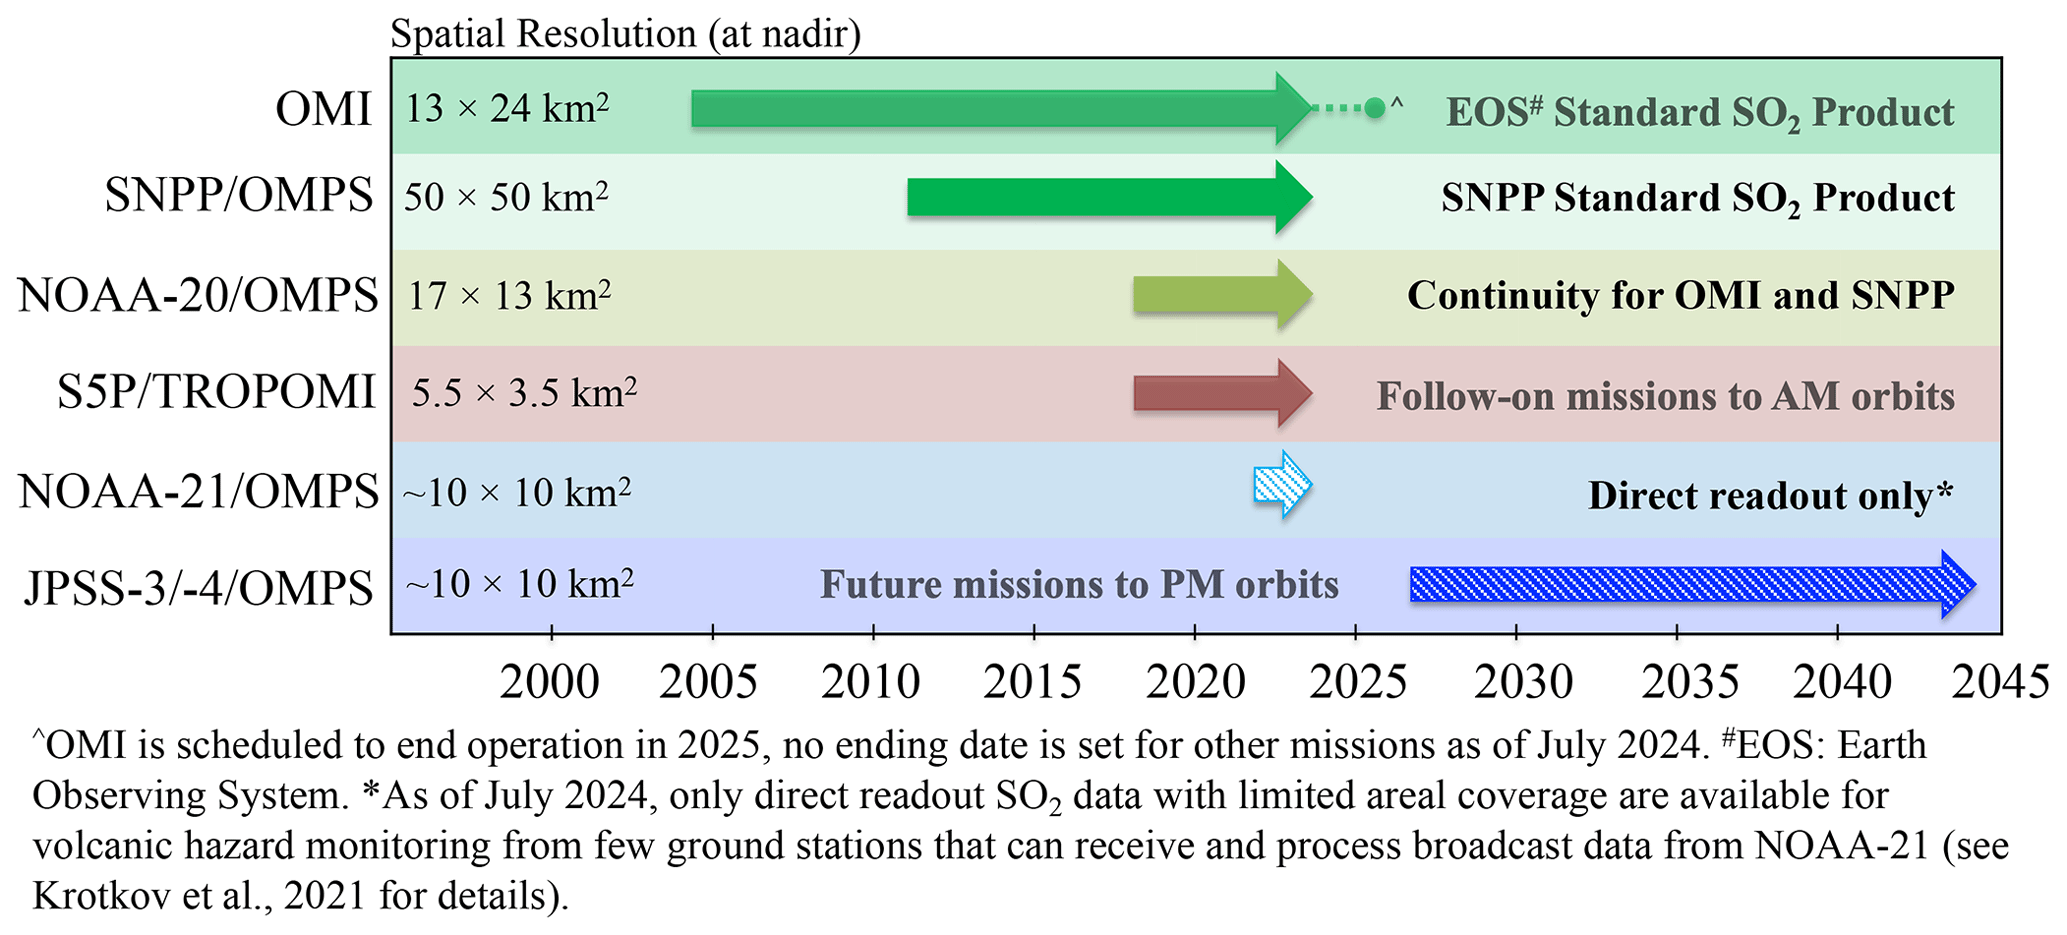
Figure 1Current and planned UV instruments for global monitoring of SO2 from the afternoon Sun-synchronous orbits.
2.1 N20/OMPS Nadir Mapper
The N20 spacecraft is the first of four satellites planned for the NASA/NOAA JPSS program and flies in a Sun-synchronous, ascending orbit with a local Equator-crossing time of approximately 13:30 LT. Flying in the same orbit plane as SNPP, N20 initially operated ahead of SNPP by a half-orbit (∼ 50 min) and currently leads SNPP by a quarter-orbit (∼ 25 min), after the launch of NOAA-21. The N20/OMPS instrument suite is comprised of two nadir-viewing spectrometers (the Nadir Profiler – NP – and the Nadir Mapper – NM), whereas its predecessor, SNPP/OMPS, also contains a limb-viewing spectrometer (the Limb Profiler, LP). The N20/OMPS NM sensor measures earthshine radiances and solar irradiance in the wavelength range of 300–420 nm at a spectral resolution of ∼ 1 nm. With a 110° field of view (FOV), it covers a cross-track swath of ∼ 2800 km and provides nearly daily global coverage. The configurable two-dimensional charge-coupled-device (CCD) detector of the N20/OMPS NM contains 340 pixels in the spectral dimension and 720 pixels in the spatial (cross-track) dimension (L. Wang et al., 2022). At the beginning of the mission, the pixels in the spatial dimension were aggregated to 104 macro-pixels (cross-track positions or CCD rows). This configuration, together with a 2.5 s integration time along the flight direction, provides a spatial resolution of 17 km (along-track) × 17 km (across-track) at nadir. Starting from orbit 6419 on 13 February 2019, the spatial pixels have been aggregated to 140 macro-pixels, providing a finer spatial resolution of 13 km across-track at nadir. As compared with its counterpart on SNPP, the N20/OMPS NM has a spatial resolution that is ∼ 10 times greater, but its signal-to-noise ratio is lower by a factor of approximately 3–4. The enhanced spatial resolution allows N20/OMPS to detect smaller SO2 sources but also leads to larger retrieval noise, as shown in the following sections of the paper.
2.2 PCA-based SO2 retrieval algorithm
Detailed descriptions of our PCA-based SO2 retrieval algorithm and its implementation with OMI and SNPP/OMPS have been given elsewhere (Li et al., 2013, 2017b, 2020). Here we provide a brief overview of the algorithm (Sect. 2.2.1) and the modifications that are specific to implementation with N20/OMPS (Sect. 2.2.2).
2.2.1 Algorithm overview
Our PCA SO2 retrieval algorithm utilizes satellite-measured, Sun-normalized earthshine radiances at the top of the atmosphere (TOA) in the spectral range of ∼ 310–340 nm. By applying a PCA technique to the radiance spectra, we extract spectral features (principal components, or PCs) and rank them based on the spectral variance they each explain. In the absence of large SO2 signals (e.g., from volcanic eruptions), the leading PCs (that explain the most spectral variance) are often associated with geophysical processes (e.g., ozone absorption, rotational Raman scattering) or instrument measurement details (e.g., wavelength shift, dark current) other than SO2 absorption in the atmosphere. We then fit the first nv non-SO2 PCs (vi), along with the absorption cross sections of SO2 (), to the measured TOA radiances (I) to simultaneously estimate the coefficients of the PCs (ωi) and the SO2 slant column density (SCD).
The number of PCs (nv) included in Eq. (1) is usually set at 20–30, depending on the number of wavelengths in the fitting window, but can be smaller if potential SO2 features are identified in the leading PCs due to unscreened SO2 signals in the radiance spectra (see Li et al., 2013, for details). The SO2 SCD is then converted to vertical column density (VCD, ) using an air mass factor (AMF):
The AMF is calculated using radiative transfer (RT) code that accounts for factors such as the Sun–target–satellite geometry, surface albedo and surface pressure, cloud fraction and cloud pressure, ozone amount and profile, temperature profile, and a priori profile of SO2. Alternatively, we can also fit the radiance spectra using the PCs and the total column Jacobians of SO2 () that are determined from RT calculations and that represent the sensitivity of TOA radiances at different wavelengths to a perturbation in the SO2 VCD. This allows us to obtain VCDs in a single step. In our retrievals, VLIDORT (Spurr, 2008), a vector RT code, is used for AMF and Jacobian calculations.
For implementation with OMI and SNPP/OMPS, we process data from each cross-track position (or row) of the two-dimensional detector separately, effectively treating each as an individual spectrometer. To minimize the impact of orbit-to-orbit changes in the measured radiances (e.g., in dark current), we also process each orbit separately. As a result, the input data (for each row of a given orbit) to the PCA algorithm typically include ∼ 1600 radiance spectra (or pixels) sampled along the flight track of OMI (∼ 400 spectra for SNPP/OMPS). They are subject to three successive processing steps:
-
Step (1). Initial data screening: the spectra are first screened to exclude pixels with large solar zenith angles (SZA >75°) or those potentially affected by the South Atlantic Anomaly (SAA). They are then examined for potential large volcanic SO2 signals by computing the residuals (i.e., the differences between the measured and calculated TOA radiances) of two wavelength pairs (313/314 and 314/315 nm), using O3 column amounts from the total O3 product (Bhartia, 2005) and the simple Lambertian equivalent reflectivity (SLER, Ahmad et al., 2004) derived at longer wavelengths (342, 354, and 367 nm). The radiance calculations assume zero SO2, and the wavelength pairs are chosen to detect the spectral contrast between wavelengths near (313 and 315 nm) and off (314 nm) the SO2 absorption peaks. Spectra that have relatively large residuals at 313 and 315 nm as compared with 314 nm are considered to potentially contain large SO2 signals (e.g., from a volcanic plume) and are excluded from the PCA, although SO2 retrievals are still conducted for those pixels (see Li et al., 2020, for details).
-
Step (2). PCA and additional SO2 screening: after filtering large volcanic SO2 signals, we attempt to remove any residual SO2 signals in the remaining radiance spectra, using two procedures. In the first procedure, a PCA is conducted on the spectra and the resulting leading PCs are used to fit the spectra, essentially reconstructing the spectra using those PCs. We flag pixels as potentially SO2-contaminated if they have residuals that are spectrally correlated with the SO2 cross sections (see Li et al., 2020). This helps to filter out relatively small SO2 signals, as compared with the volcanic SO2 screening in Step (1). In the second procedure, we conduct a PCA on the remaining spectra and use the PCs and SO2 cross sections (or Jacobians) to obtain first-guess SO2 retrievals (Eq. 1). Pixels with relatively large negative (<−2σ from the mean, where σ is the standard deviation) or positive (>1.5σ from the mean) first-guess SO2 are excluded from additional PCAs. We divide the pixels from the row into three subgroups (subsectors) based on their latitudes and solar zenith angles: a tropical subsector with , where SZAmin is the minimum of the row, and two extratropical subsectors to the north and south. For each subsector, we repeat the second procedure twice to derive the final PCs and SO2 SCDs. The use of subsectors reduces biases in retrievals (Li et al., 2013), as will be discussed further in Sect. 3.1.
-
Step (3). Jacobian calculations and final SO2 VCD estimates: using the final PCs from Step (2) and Jacobians calculated employing a lookup-table approach, we conduct spectral fitting to obtain final estimates of SO2 VCDs for all pixels that have SZA ≤75°, including those flagged for SO2 during Steps (1) and (2). The Jacobian calculations are separate for anthropogenic and volcanic SO2 retrievals. For anthropogenic SO2 retrievals, the Jacobians are calculated once for each pixel using cloud fraction and cloud pressure from the rotational Raman scattering cloud product (Joiner and Vasilkov, 2006; Vasilkov et al., 2014) and a priori SO2 profiles based on a climatology from multiyear global model simulations (see Li et al., 2020, for details). For explosive volcanic eruptions, the SO2 Jacobians strongly depend on the SO2 amounts, and absorption signals at shorter wavelengths may become saturated. To account for these factors, we use an iterative procedure to estimate volcanic SO2 Jacobians based on the retrieved SO2 VCDs from the previous iteration and optimize the fitting window by dropping potentially saturated wavelengths (see Li et al., 2017b, for details). As the volcanic SO2 plume heights are often unknown immediately following eruptions, in our volcanic SO2 retrievals we also produce four estimates of the SO2 VCD for each pixel, assuming four different a priori profiles. These SO2 profiles centered at altitudes of 3, 8, 13, and 18 km, respectively, are chosen to represent typical plume heights from volcano degassing (3 km: lower troposphere, TRL), moderate eruptions (8 km: middle troposphere, TRM), or explosive eruptions (13 km: upper troposphere, TRU; 18 km: lower stratosphere, STL).
2.2.2 Implementation with N20/OMPS
While our N20/OMPS SO2 algorithm shares the same general design with our OMI and SNPP/OMPS algorithms, some implementation details differ. Here, we summarize the algorithm modifications that are specific to the current version of the N20/OMPS SO2 algorithm.
With volcanic SO2 screening, for N20/OMPS, instead of the residual-based scheme (see Sect. 2.2.1), we have implemented a new scheme based on spectral fitting using reference PCs from a presumably SO2-free orbit over the remote Pacific. For orbits with 104 rows (see Sect. 2.1), the reference PCs are derived on a row-by-row basis from orbit 4506 on 1 October 2018, whereas for orbits with 140 rows the reference PCs are from orbit 17460 on 1 April 2021. Both are days without major volcanic eruptions, and the leading modes of the reference PCs are likely free of SO2 features. We conduct spectral fits using the reference PCs and an SO2 Jacobian spectrum assuming an 18 km plume height to obtain an initial SO2 VCD estimate for each pixel. Pixels with initial SO2 >2 DU (Dobson units, 1 DU = 2.69 × 10¹⁶ molecules per square centimeter) are flagged for potential volcanic influence. Compared with the residual-based volcanic SO2 screening scheme implemented with OMI and SNPP/OMPS (Sect. 2.2.1), this new scheme is more sensitive and flags more pixels (see Fig. S1 in the Supplement). The selection of data sources for reference PCs (e.g., from a different day) is expected to affect the initial SO2 estimates and consequently the final estimates of SO2. However, test retrievals using different reference PCs suggest that the resulting differences in the final SO2 SCDs are well within the typical retrieval noise for N20/OMPS, especially outside of areas affected by the SAA (see Fig. S2 in the Supplement).
Except for the scheme for initial volcanic SO2 screening, the algorithm for volcanic SO2 retrievals as implemented with N20/OMPS is identical to that for SNPP/OMPS. The N20/OMPS anthropogenic SO2 algorithm, on the other hand, has several changes. These include the following:
-
Algorithm settings for SCD retrievals: for N20/OMPS SO2 SCD retrievals, pixels within each row are grouped into five subsectors, instead of three as for OMI and SNPP/OMPS (see Sect. 2.2.1). Additionally, in step (2) of the N20 algorithm, pixels with first-guess SO2 that falls within ±1.5σ from the mean are considered SO2-free and retained for additional PCA. This is different from the OMI and SNPP/OMPS algorithms, which retain pixels with first-guess SO2 between (mean − 2σ) and (mean + 1.5σ). The change in the threshold was made to mitigate potential positive biases in SO2 SCDs (see Fig. S3 in the Supplement), although this may have led to an overall negative bias for N20/OMPS SO2 SCDs as compared with SNPP (see Sect. 3). Additionally, for OMI and SNPP/OMPS, an iterative process is used to examine fitting residuals for SCD retrievals over areas affected by the SAA and to exclude wavelengths that have large residuals in a second step of SCD fitting. This process helps to reduce SCD noise over the SAA areas but has not yet been implemented with N20/OMPS.
-
AMF/Jacobians: as the N20/OMPS Raman cloud product is still under development, it is presently unavailable for the calculation of anthropogenic SO2 AMF/Jacobians. In the current version of the N20/OMPS anthropogenic SO2 algorithm, a fixed AMF (0.36) is used to convert all SCDs to SO2 VCDs, regardless of the observation conditions for different pixels. This AMF corresponds to a simplified scenario under cloud-free conditions with fixed surface albedo (0.05) and pressure (1013.25 hPa), solar (30°) and viewing (0°) zenith angles, and typical mid-latitude temperature and O3 profiles (total column O3 = 325 DU). It is also assumed that SO2 is mostly in the planetary boundary layer (PBL), or the lowest ∼ 1 km of the atmosphere. The same AMF was used for SO2 VCDs, referred to as PBL SO2, in the early versions of the OMI SO2 product (Krotkov et al., 2006). Following this convention, we use “ColumnAmountSO2_PBL” as the data field name for SO2 VCDs derived using this fixed AMF in the version-1 N20/OMPS SO2 product (see Sect. 2.3 for a description). We plan to produce a refined anthropogenic N20/OMPS SO2 VCD dataset using the same Jacobian calculation method as for OMI and SNPP/OMPS (see Sect. 2.2.1), once the Raman cloud product becomes available.
-
Algorithmic refinement for pixels in the transition zones between different subsectors: it has been previously noted that there are relatively large gradients in OMI SO2 SCD uncertainties (and, to a lesser extent, in SCDs) near the boundaries between different subsectors, as different sets of PCs are used in spectral fitting for those subsectors (see Fig. 2 and Li et al., 2020). To reduce this gradient, we have refined N20/OMPS SCD retrievals for pixels within the transition zone, defined here as the 50 pixels located immediately across the boundary between the two subsectors (with 25 on either side). For each transition zone pixel, we conduct multiple spectral fits using different sets of PCs from all the subsectors. We then select the fit that has the smallest root mean square (rms) of the fitting residuals for the final SO2 SCD.
2.3 Description of the version-1 N20/OMPS SO2 product
A detailed description of the current version of our PCA-based N20/OMPS SO2 product (product name OMPS_N20_NMSO2_PCA_L2_Step1), including its file format in netCDF4 and data fields, is given in the readme product file available at https://disc.gsfc.nasa.gov/datasets/OMPS_N20_NMSO2_PCA_L2_Step1_1/summary (last access: 13 May 2024) (Li et al., 2023). A summary of the data fields that are of interest to most data users is given in the Supplement.
2.4 Multi-satellite SO2 emission catalogue
Our previous version-2 global catalogue of large SO2 emission sources is based on OMI, SNPP/OMPS, and TROPOMI data, covers the period of 2005–2021, and includes a total of 759 continuously emitting point sources releasing about 10 to more than 4000 kt yr−1 of SO2 (Fioletov et al., 2023). Here, we use N20/OMPS SO2 data to estimate annual emissions for these sources and then use the N20 emission estimates, in addition to those from the other three satellite sensors, to produce an updated (2005–2023) unified emission catalogue. For N20/OMPS emission estimates, we apply the same algorithm as for the other satellite sensors, including the same site-specific AMFs. For each source, we first estimate a local retrieval bias based on the average upwind SO2 that is subsequently subtracted from SO2 retrievals. To estimate emissions, the total average SO2 mass near the source is calculated using a fitting algorithm, and then emissions are derived as the ratio of the total mass to the lifetime, assumed to be constant at 6 h. In addition to the assumed lifetime, the algorithm uses a prescribed constant parameter (ω) that represents the average plume width across the wind direction. The values of the prescribed parameter are ω=20, 25, and 15 km for OMI, SNPP/OMPS, and TROPOMI, respectively. The parameter ω=20 km is chosen for N20/OMPS as it has similar pixel sizes to OMI. As in Fioletov et al. (2023), the OMI- and OMPS-based emission estimates presented here have been increased by +10 % to match the values to the earlier version of the catalogue (Fioletov et al., 2016). Similarly, for TROPOMI, a +22 % correction is applied to account for differences in temperatures for the SO2 absorption cross sections used in the retrievals.
In this section, we evaluate our version-1 N20/OMPS SO2 product. Given the similarities between the N20 and SNPP/OMPS NM sensors, we focus on the comparisons between the two OMPS SO2 products. Section 3.1–3.3 are dedicated to analyses of SO2 SCDs and planetary boundary layer (PBL) SO2; we first assess the quality and stability of N20/OMPS SO2 SCDs (Sect. 3.1) and then compare the spatial distribution (Sect. 3.2) and long-term time series (Sect. 3.3) of N20 PBL SO2 retrievals with those from SNPP. In Sect. 3.4, we present the results using N20/OMPS SO2 SCD data for emission estimates and compare N20-based emission estimates with other instruments. In Sect. 3.5, we compare N20 volcanic SO2 retrievals with SNPP/OMPS and TROPOMI for selected eruptions.
3.1 Quality and long-term stability of N20/OMPS SO2 slant column densities
In Fig. 2, we compare the statistics of N20 and SNPP/OMPS SO2 SCDs over the eastern Pacific on 1 April 2019. For such a day without major volcanic eruptions, the actual loading and variability of SO2 are presumed to be quite small over remote background areas, and the mean and standard deviation of the retrieved SO2 SCDs can be used to assess the biases and noise in the retrievals. As shown in Fig. 2a, both mean SNPP and N20/OMPS SO2 SCDs are within ±0.05 DU, indicating relatively small biases for both retrievals, although N20/OMPS SCDs are in general smaller than those from SNPP/OMPS, especially at middle (30–50° N) to high (70–80° N) latitudes in the Northern Hemisphere. The offset in the mean SO2 is likely due to different algorithm settings, especially the threshold for pixels that are assumed to contain SO2 and excluded from PCA. For N20/OMPS, we also generate experimental retrievals without grouping the pixels into different subsectors (see Sect. 2.2.2). The mean SO2 SCDs (see Fig. S4 in the Supplement) from this experiment have greater latitudinal variations and larger overall biases. This is consistent with our previous observation that the use of subsectors helps to reduce retrieval biases (Li et al., 2013). As for the standard deviation of SCDs (Fig. 2b), both N20 and SNPP/OMPS show dependence on latitude, which is likely due to a generally smaller signal-to-noise ratio (SNR) in the measurements at lower radiance values associated with larger SZAs. Apart from the latitude band of 70–80° N, the N20/OMPS SCD standard deviation is ∼ 0.35–0.65 DU at its native resolution, or approximately 2–4 times greater than that of SNPP/OMPS. Recall that the size of each SNPP/OMPS pixel is ∼ 10 times larger than N20/OMPS, due to the longer integration time along-track (7.5 s vs. 2.5 s) and the aggregation of more pixels into fewer rows (macro-pixels) across-track (36 rows vs. 140 rows in this example). This indicates that the SCD retrieval noise from the two OMPS instruments approximately scales according to , where N is the number of aggregated pixels, suggesting that the greater noise in N20/OMPS SO2 SCDs is largely driven by larger random noise in the radiances. Indeed, if we average the N20/OMPS SO2 SCDs to the same resolution as SNPP/OMPS, the standard deviation of binned SCDs (blue triangles, Fig. 2b) is now comparable with that of SNPP/OMPS at most latitudes. The one notable exception is at 70–80° N, indicating additional SCD retrieval errors at larger SZAs for N20/OMPS. Note that, for this analysis, the mean of SZAs for 70–80° N is similar between the two OMPS instruments. For the analyses in Sect. 3.2–3.3, pixels with SZA >65° are excluded.
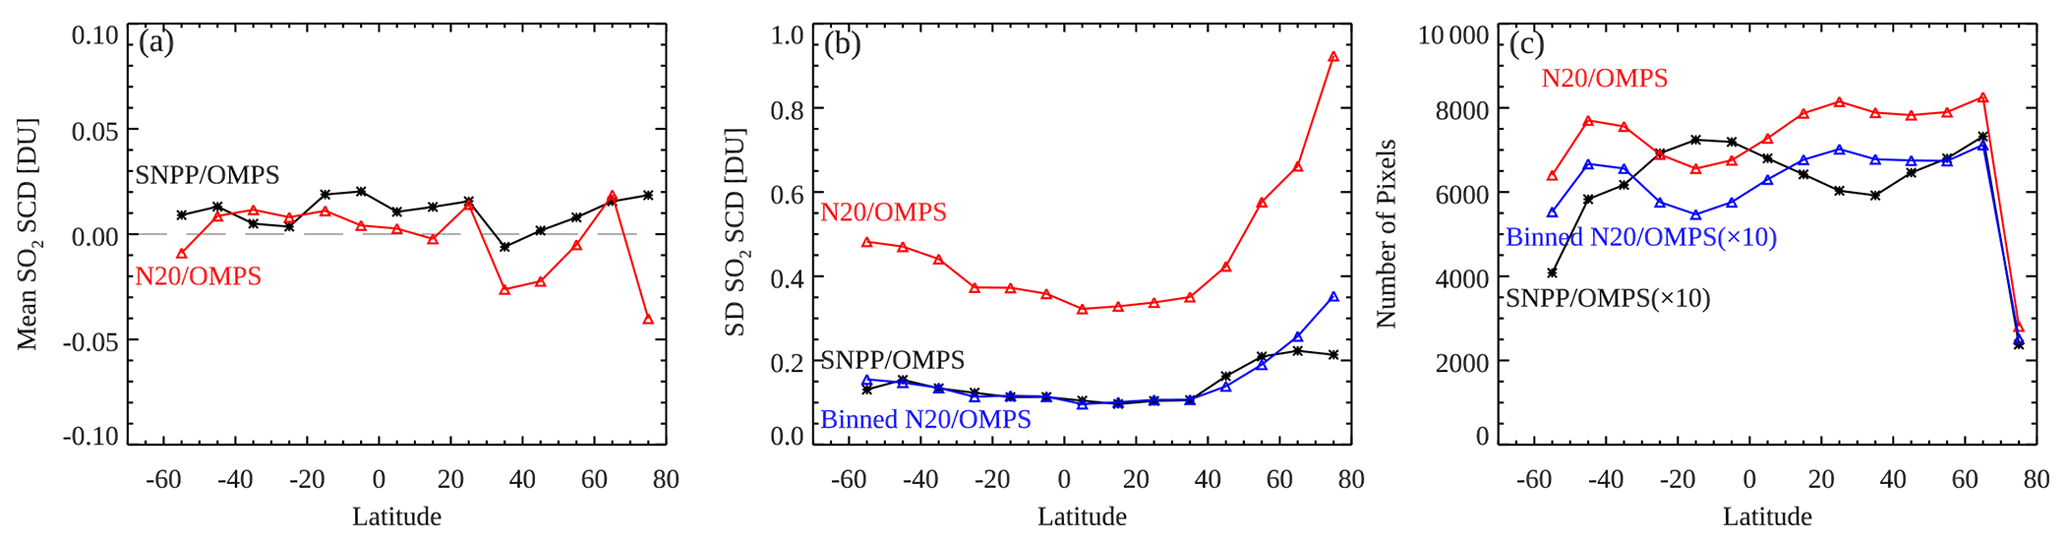
Figure 2Comparisons of the (a) mean, (b) standard deviation, and (c) number of pixels for SO2 SCD retrievals for 10° latitude bands over the remote Pacific (130–150° W) on 1 April 2019 between SNPP/OMPS (black asterisks), N20/OMPS at its native resolution (red triangles), and N20/OMPS binned to the same resolution as SNPP/OMPS (blue triangles, for standard deviation and pixel number only). The results are given in Dobson units (DU). All pixels that have solar zenith angles <70° are included in the analysis. Only latitude bands with at least 500 native N20/OMPS pixels from the day are shown. On this day, N20 was operating at half-orbit (∼ 50 min) ahead of SNPP, and the number of SNPP and binned N20/OMPS pixels is different but comparable for all the latitudes. The smaller number of pixels at high latitudes is due to the limit on the solar zenith angle.
For long-term monitoring, it is important to minimize the drift over time that can introduce spurious trends into the dataset. To evaluate the stability of OMPS SO2 retrievals, we examine the daily mean and standard deviation of SO2 SCDs over the equatorial Pacific, after screening out days affected by large volcanic eruptions. As can be seen from Fig. 3a, both N20 and SNPP/OMPS retrievals are quite stable, showing no statistically significant trends in the mean SO2 SCDs from the beginning of the missions through 2023. The change in the SNPP/OMPS SCD standard deviation is also very small at 0.0002 DU yr−1 (Fig. 3b). One may notice a jump in the standard deviation for the N20/OMPS SCDs (red, Fig. 3b) in early 2019 due to the change in the instrument's spatial resolution (Sect. 2.1), but the trend is again quite small at −0.00023 DU yr−1 once N20/OMPS SCDs are binned to the same resolution as SNPP/OMPS. The changes for both OMPS instruments are much smaller than those of a previous study on OMI SO2 retrievals by Li et al. (2020), who reported trends of 0.00023 and 0.0015 DU yr−1 in the mean and standard deviation of OMI SCDs, respectively, over the equatorial Pacific during 2004–2019.
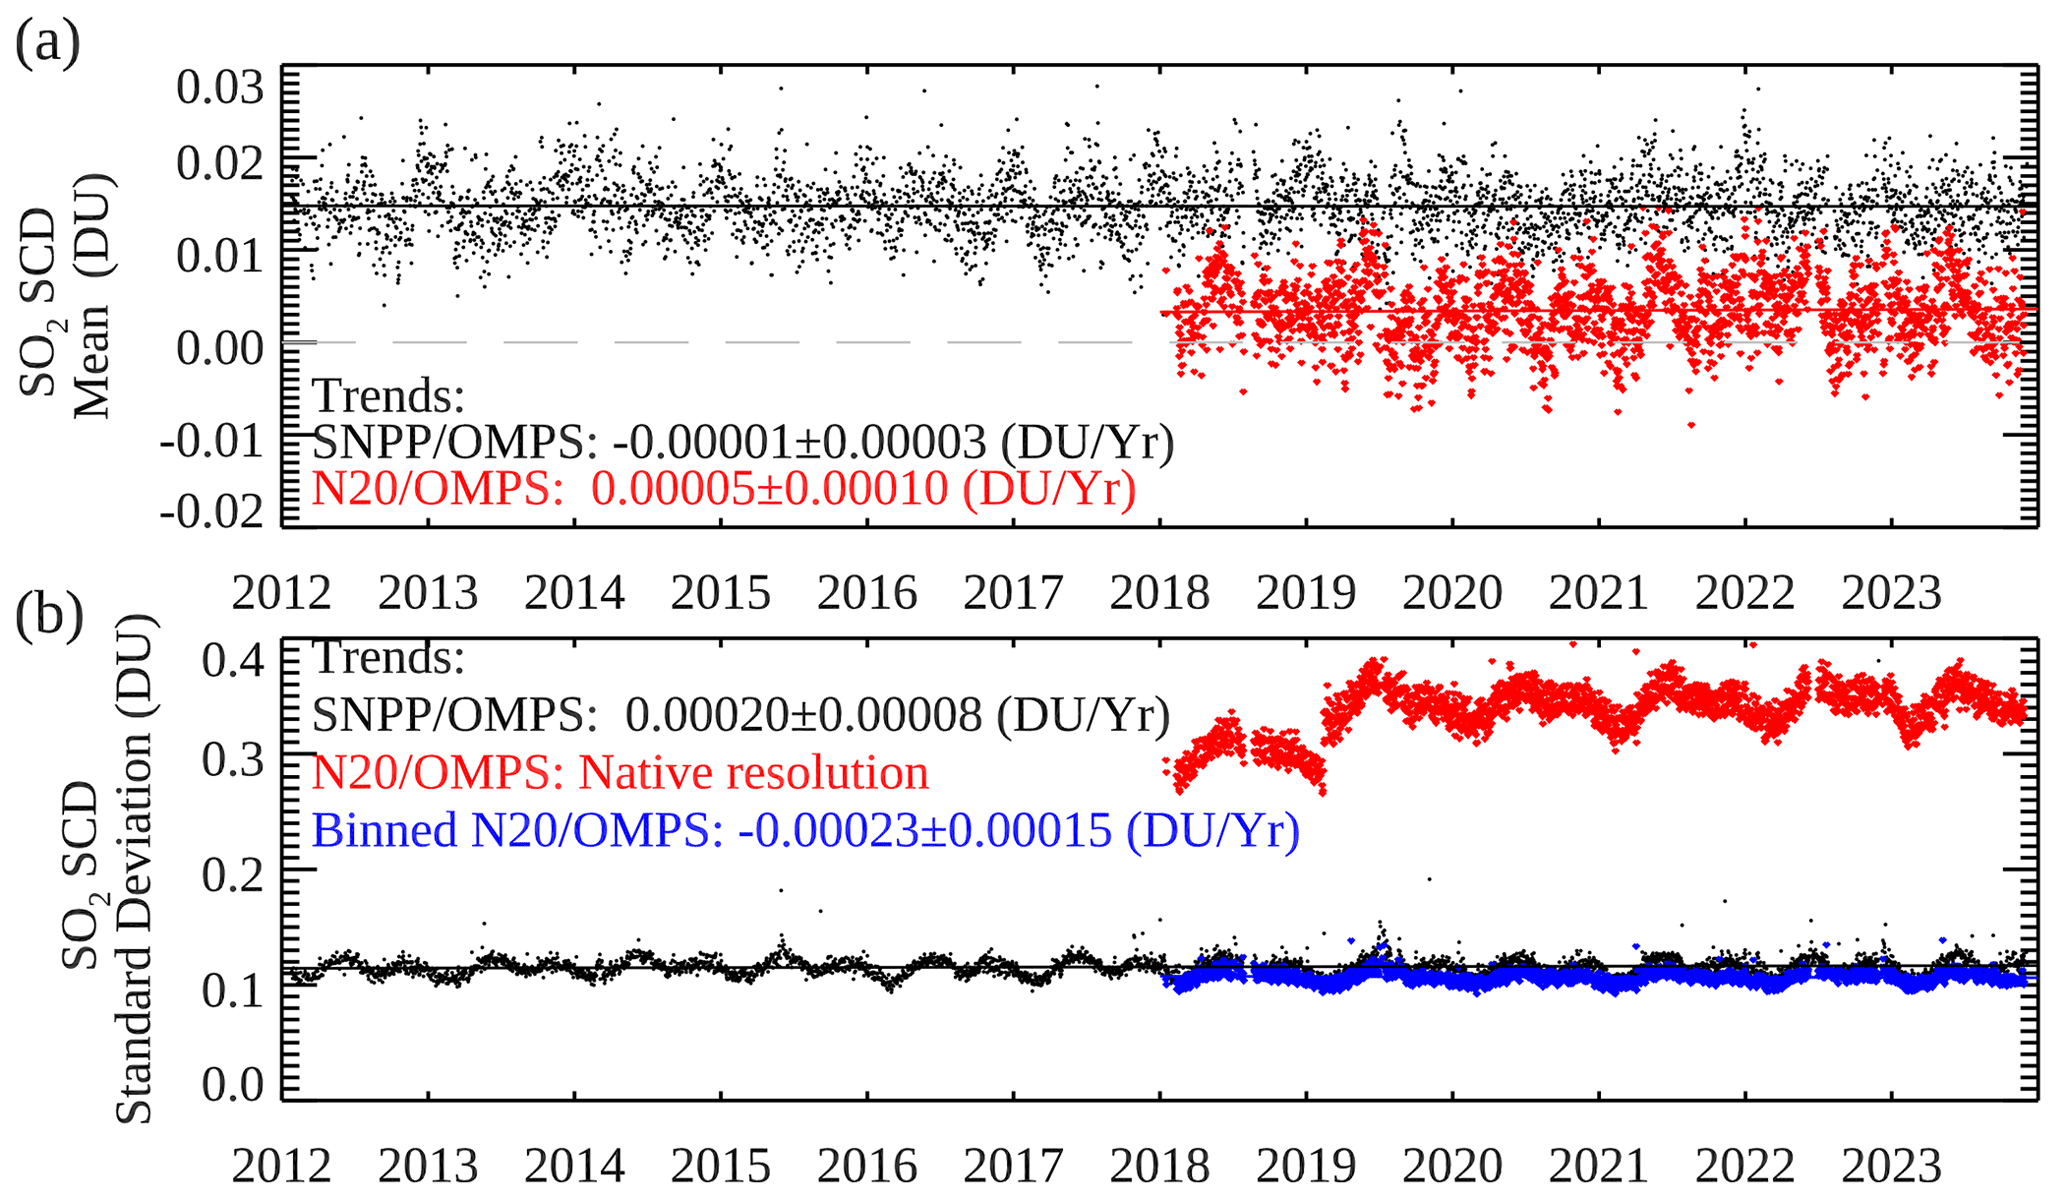
Figure 3Time series of the daily (a) mean and (b) standard deviation of SO2 SCDs over the equatorial Pacific (20° S–20° N, 130–150° W) from N20 and SNPP/OMPS from the beginning of the data records to 2023. In panel (b), results at the native N20/OMPS resolution (red) and those aggregated to the SNPP/OMPS resolution (blue) are given to account for the change in instrument resolution in February 2019. Days affected by volcanic plumes are excluded, as are days with fewer than 500 pixels within the domain. For N20/OMPS retrievals at native resolution, the first and last two rows are excluded due to the relatively large retrieval noise. The estimated trends from linear regression are provided along with their 95 % confidence intervals, except for the standard deviation at the N20/OMPS native resolution.
3.2 Spatial distribution of PBL SO2
Figure 4 presents the spatial distribution of PBL SO2 VCDs from N20 and SNPP/OMPS and their differences for March to May 2021. The period has been selected due to its lack of major volcanic eruptions to facilitate comparisons for anthropogenic sources and degassing volcanoes. It is worth mentioning that the analysis here reflects the differences in SCDs between the two OMPS products, as the same fixed AMF (0.36; see Sect. 2.2.2) is applied everywhere. Overall, the spatial distribution of PBL SO2 VCDs is quite similar between the two OMPS products, with both showing relatively small values over oceanic areas and hotspots over major anthropogenic sources (e.g., Norilsk in Russia, South Africa, northeastern India, and the Persian Gulf) as well as degassing volcanoes (e.g., Kilauea in Hawaii, Nyiragongo in Congo, and Krakatau in Indonesia). More analyses of the long-term PBL SO2 time series over selected source areas, as marked in Fig. 4a and b, are given in Sect. 3.3. There are also noticeable differences (Fig. 4c). Over the SAA-affected areas, N20/OMPS PBL SO2 VCDs have larger noise that is partly due to the algorithmic difference in SCD fitting for the region (see Sect. 2.2.2). For most other areas at the middle and low latitudes, N20/OMPS VCDs are smaller, particularly over the dust belt from the Sahara to northwestern China and Mongolia. As discussed in Sect. 2.2.2, at least some of these negative biases in N20/OMPS retrievals (as compared with SNPP) can be attributed to the algorithm settings in SCD fitting, i.e., the threshold (based on first-guess SO2 estimates) used to filter out potentially SO2-contaminated pixels. Over most of the areas, the negative bias is relatively small. For example, only ∼ 1 % of the grid cells over the dust belt (defined here as the domain of 20–50° N, 0–110° E) have VCD differences that exceed −0.2 DU (i.e., −0.072 DU in the SCD difference). Despite their relatively small magnitude, the biases in N20/OMPS retrievals can still lead to substantial differences in the regional PBL SO2 time series (see Sect. 3.3 for details), but they can be mitigated well in the top-down emission estimates (Sect. 3.4). Over high latitudes near the coastal areas of Greenland, Antarctica, and the Arctic, N20/OMPS PBL SO2 VCDs also have relatively large positive and negative biases (Fig. 4c). This is consistent with the results shown in Fig. 2 and points to potential algorithm issues for scenes with low SNRs, although the exact reason is unknown as of the writing of this paper. The differences are also larger over mountainous areas (e.g., the Andes in South America), possibly indicating retrieval biases related to terrain height or surface features that are more pronounced in high-resolution data and that cannot be completely averaged out.
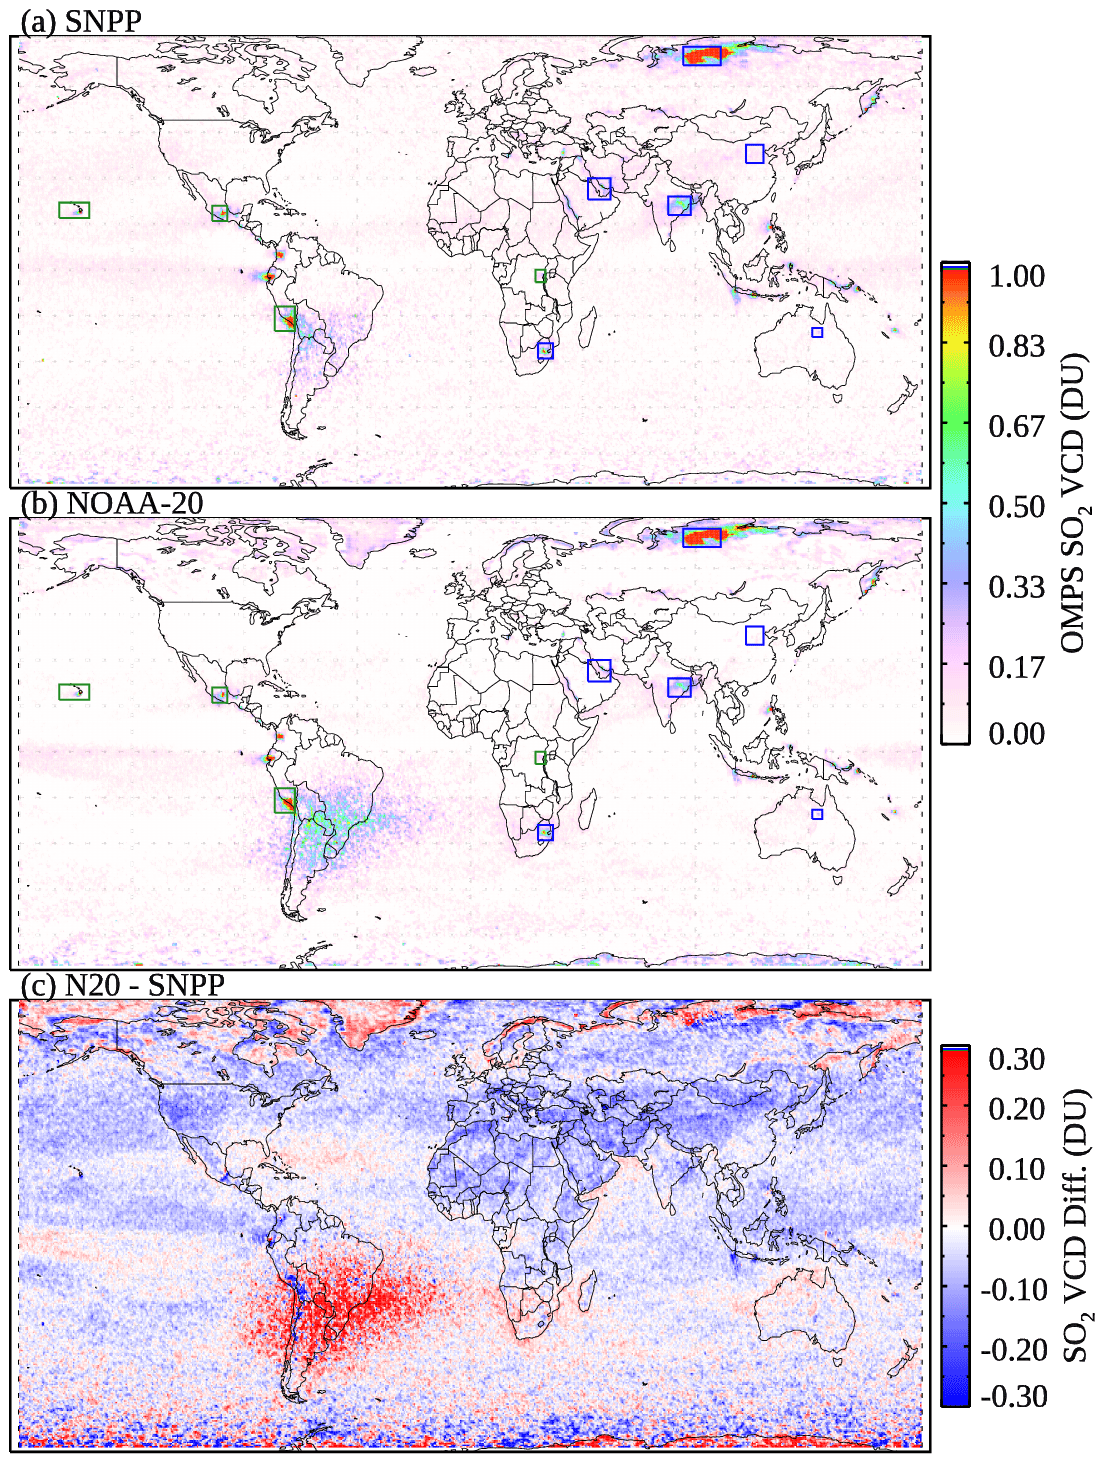
Figure 4Mean PBL SO2 VCDs for March to May 2021 retrieved from (a) SNPP/OMPS and (b) N20/OMPS using a fixed AMF (0.36) and (c) their differences. Both retrievals are gridded to 0.5° × 0.5° horizontal resolution, and N20/OMPS data are binned to the same spatial resolution as SNPP before gridding to ensure consistent sampling. For both SNPP and the binned N20 datasets, pixels with SZA >65° or those from the extreme off-nadir rows (first two and last two) are excluded. There is no data screening based on cloudiness. The blue rectangular boxes in panels (a) and (b) mark the domains of selected anthropogenic SO2 source areas, whereas the green boxes mark selected degassing volcanoes.
The scatterplot (Fig. 5a) between the two gridded datasets over the entire global domain (excluding the SAA region) indicates that the N20 and SNPP/OMPS PBL SO2 VCDs are moderately correlated. Most (∼ 81.8 %) of the grid cells have near-zero values (within ±0.1 DU) from both retrievals. This is as expected since SO2 loading outside of source areas is quite small in the absence of large volcanic plumes. About 19.6 % of the grid cells have absolute VCD differences >0.1 DU, likely reflecting the differences between the two retrievals, especially over background areas and at high latitudes, although the absolute differences exceed 0.2 DU for only ∼ 2.7 % of them. For grid cells with SNPP/OMPS PBL SO2 VCDs >1 DU, 234 (out of 248) have N20 and SNPP/OMPS VCDs agreeing to within ±30 %. This is also demonstrated by the scatterplot in Fig. 5b that focuses on the selected source areas (as marked by the boxes in Fig. 4a and b). For these areas, N20 and SNPP/OMPS PBL SO2 VCDs are strongly correlated (r=0.98) and have a small overall bias (slope = 1.03), suggesting overall good consistency between the two instruments for relatively strong SO2 signals.
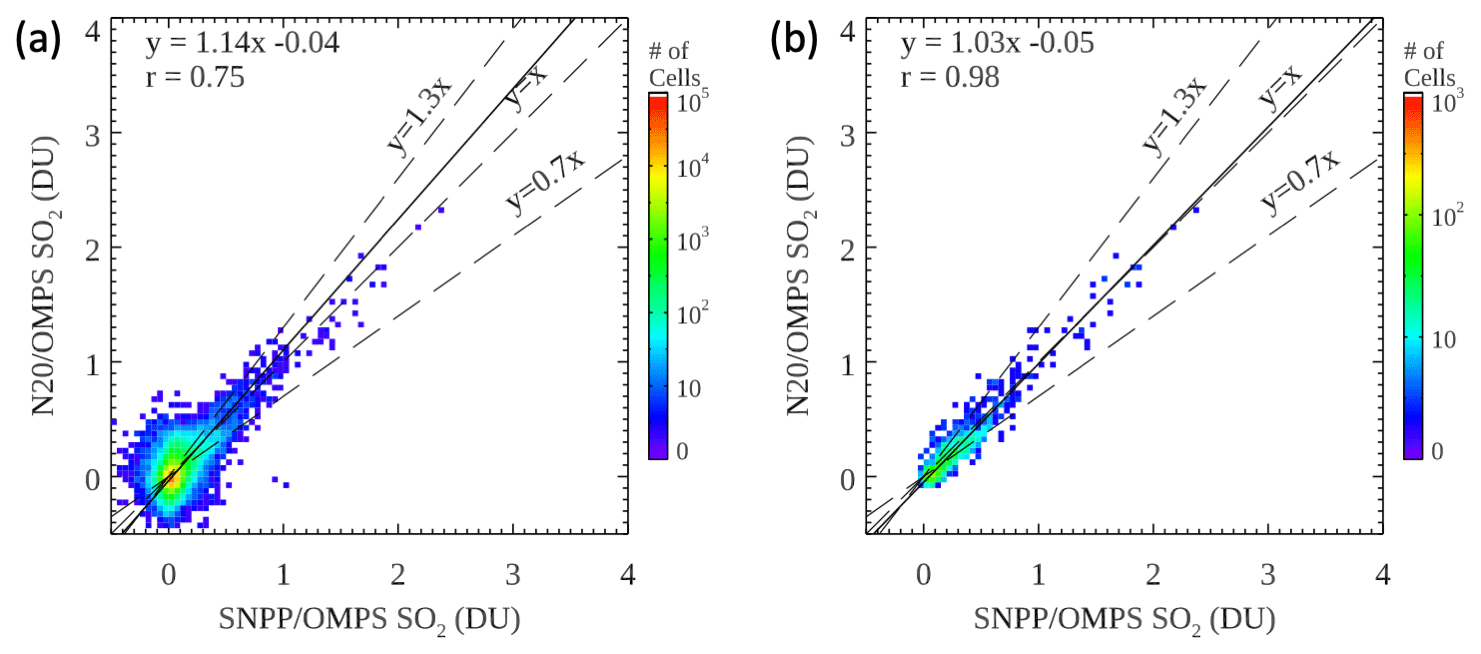
Figure 5(a) The density map of gridded PBL SO2 VCDs from N20/OMPS vs. SNPP/OMPS for the same period and same domain (excluding SAA-affected areas) as in Fig. 4. Colors represent the number of 0.5° × 0.5° grid cells. The solid black line marks the best-fit line through all grid cells from a linear regression analysis. The dashed lines represent scenarios where N20 SO2 is 30 % higher than (y=1.3x), equal to (y=x), and 30 % lower than (y=0.7x) SNPP. The correlation coefficient (r=0.75) between N20 and SNPP/OMPS VCDs for all grid cells is also given. (b) Same as (a) but only for selected source areas as marked by the rectangular boxes in Fig. 4a and b.
3.3 Long-term time series of PBL SO2
To evaluate the consistency between N20 and SNPP/OMPS PBL SO2 VCDs over extended periods, we also compare the time series of monthly mean SO2 mass (in kiloton, 103 metric tonnes) over selected major source areas (see Fig. 4a and b for the domains of anthropogenic and volcanic sources, respectively). For a given area, we first generate daily gridded N20 and SNPP/OMPS PBL SO2 VCDs at 0.5° × 0.5° resolution following the same procedure and data-filtering criteria as described for Fig. 4. For each day when over 90 % of the domain is covered by the gridded data, we calculate the total SO2 mass by summing the mass from all grid cells that have non-negative gridded SO2 VCDs. The monthly mean SO2 mass is then calculated by averaging the daily data.
In addition, we attempt to correct for the monthly and latitude-dependent biases in N20/OMPS PBL SO2. We first produce monthly gridded N20 and SNPP/OMPS PBL SO2 VCDs from the daily gridded data. For each month of the year, we use the monthly gridded data to estimate the latitude-dependent biases in three steps: (1) filtering out areas that have relatively large SO2 (monthly SNPP/OMPS PBL VCDs >0.5 DU) or those affected by the SAA, (2) calculating the mean N20 − SNPP differences within 3° latitude bands for the same month of each year during 2018–2023, and (3) taking the median of the monthly mean biases from the 6-year period for each latitude band. The estimated biases are then used to produce bias-corrected N20 PBL SO2 time series (blue lines in Figs. 6 and 7). We choose to use SNPP/OMPS as the reference to bias-correct N20/OMPS due to its longer and more established record, the generally good consistency between SNPP/OMPS and OMI SO2 data (e.g., Li et al., 2017b; Zhang et al., 2017), and ongoing calibration work that will lead to updates of the N20/OMPS level-1 data.
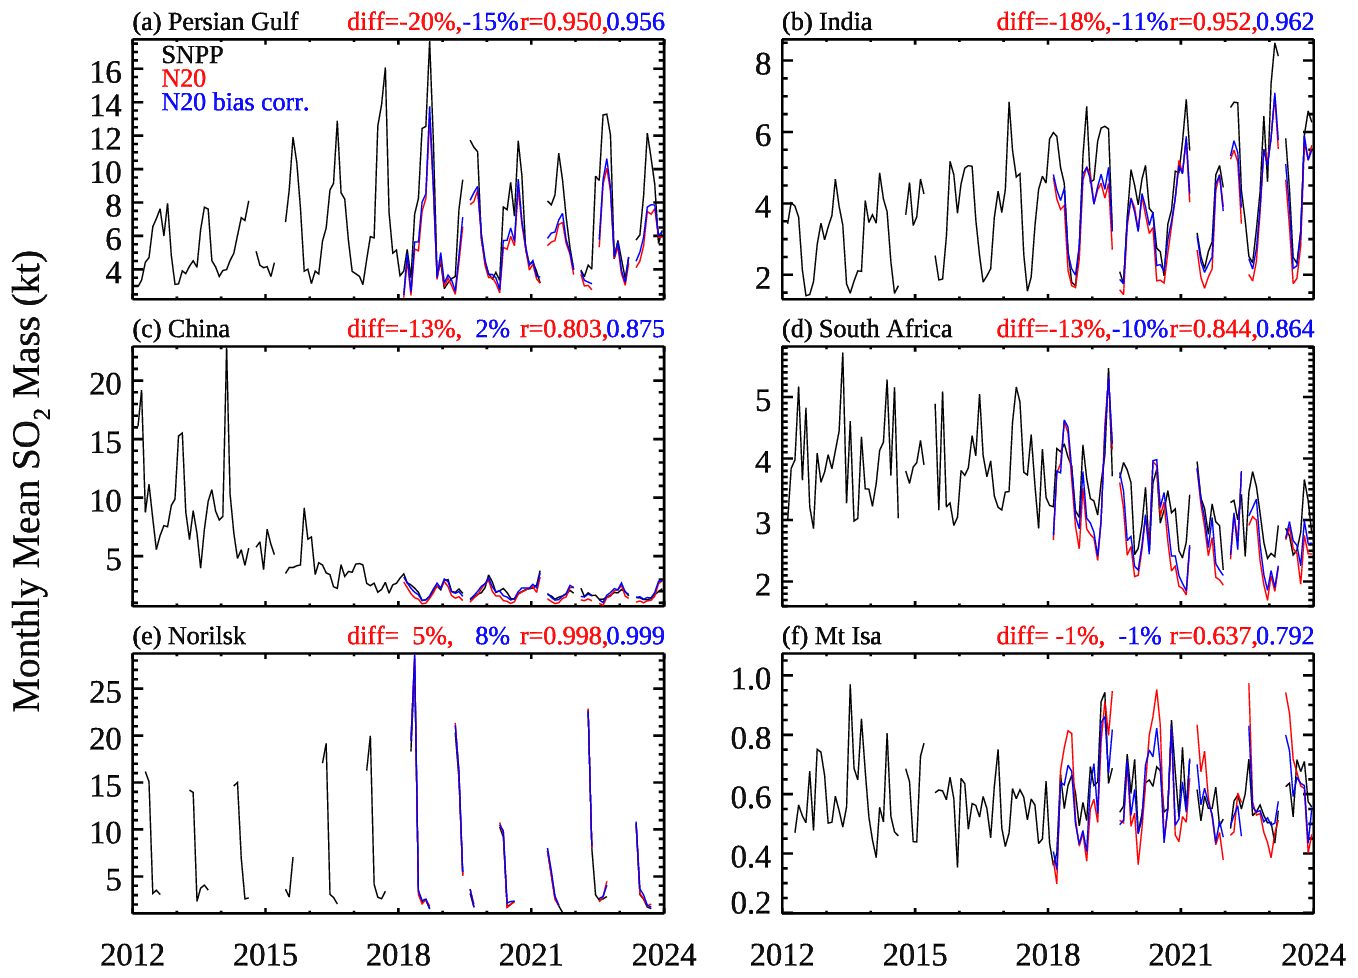
Figure 6Time series of monthly mean SO2 mass (in kiloton, 103 t) based on SNPP/OMPS (black), N20/OMPS (red), and bias-corrected N20/OMPS (blue) PBL SO2 VCDs over the major anthropogenic source areas as marked in Fig. 4a. For a given area, only months with at least 10 d of data are shown. Months influenced by large volcanic SO2 plumes (September 2014, April to May 2015, July 2019, April 2021, January 2022, and April 2023) are also excluded. The average percentage differences and correlation coefficients between N20 and SNPP/OMPS time series (red) and those between the bias-corrected N20 and SNPP/OMPS time series (blue) are given at the top of each panel. Note that the large seasonal change over Norilsk is likely due to snow or ice that is currently unaccounted for in retrievals. See Fig. S5 in the Supplement for the same plot but for the period of 2018–2023.
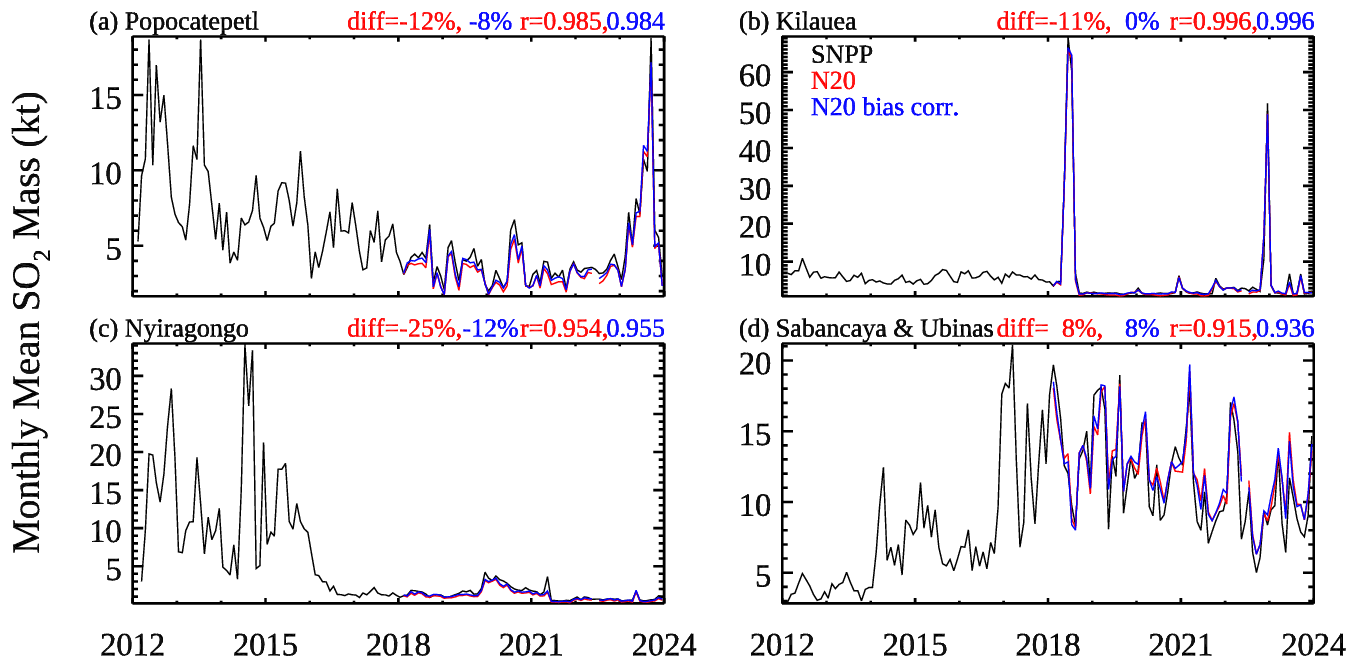
Figure 7Same as Fig. 6 but for degassing volcanoes (as marked in Fig. 4b) and all months during 2012–2023 (i.e., no exclusion of months affected by large volcanic eruptions). See Fig. S6 in the Supplement for the same plot but for the period of 2018–2023.
For anthropogenic source areas, the N20 and SNPP/OMPS PBL SO2 time series are mostly well-correlated (Fig. 6). The lowest correlation coefficient (r=0.64) is found over Mount Isa in Australia, where the SO2 mass is typically below 1 kt (Fig. 6e). For all other areas, the correlation coefficient exceeds 0.8. The 12-year SNPP/OMPS data record reveals some significant regional trends in SO2 pollution. For instance, SO2 over India gradually increases over time; there is a temporary dip in 2020 that is probably related to the COVID-19 pandemic (e.g., Biswas and Ayantika, 2021) and followed by increases afterwards. Meanwhile, SO2 over China has decreased substantially since 2014, likely due to emission control measures (Li et al., 2017a). Qualitatively, these long-term regional changes are also confirmed by the N20/OMPS time series. On average, the N20/OMPS SO2 mass over the Persian Gulf, India, China, and South Africa is smaller than SNPP/OMPS by −20 %, −18 %, −13 %, and −13 %, respectively. In comparison, the differences are much smaller over Norilsk and Mount Isa, at 5 % and −1 %, respectively. The monthly latitudinal bias correction improves the correlation between the N20 and SNPP/OMPS time series for all the regions (Fig. 6), but the remaining differences between the two are still substantial over the Persian Gulf (−15 %), India (−11 %), and South Africa (−10 %), indicating marginal improvements for these areas. The differences between N20 and SNPP/OMPS are little changed over Norilsk (8 %) and Mount Isa (−1 %) after the bias correction. The results here suggest that the simple latitude-dependent correction as outlined above is insufficient to significantly improve the agreement between the two datasets everywhere.
As for degassing volcanoes, the PBL SO2 time series in Fig. 7 show a strong correlation between the two OMPS products. The correlation coefficient exceeds 0.9 for all cases and could be attributed to the large variations in the volcanic SO2 emissions and the generally consistent retrievals. Before the bias correction, the average relative differences between N20 and SNPP/OMPS during 2018–2023 were −12 %, −11 %, −25 %, and 8 % for Popocatepetl, Kilauea, Nyiragongo, Sabancaya, and Ubinas, respectively. The large relative difference over Nyiragongo is probably caused by the small SO2 loading since late 2021, whereas the positive bias over Sabancaya and Ubinas could be due to the greater impact of SAA on N20/OMPS retrievals. After the bias correction, the average relative differences are −8 %, 0 %, −12 %, and 8 % for the four areas. It should be pointed out that, for degassing volcanoes, the PBL SO2 retrievals likely overestimate SO2, as the fixed AMF used in these retrievals represents a scenario with SO2 predominantly in the boundary layer, while SO2 plumes from the volcanoes are typically at higher altitudes. In Sect. 3.5, we compare N20 and SNPP/OMPS volcanic SO2 retrievals that use more representative a priori SO2 profiles and Jacobians calculated for individual pixels (see Sect. 2.2.1).
3.4 SO2 emission estimates for large point sources
To assess the ability of N20/OMPS to detect and quantify SO2 point sources, we apply a top-down emission estimation algorithm (Fioletov et al., 2015, 2016, 2023) to N20/OMPS retrievals to derive annual emissions from 759 large point sources that are included in the version-2 satellite-based SO2 emission catalogue (Fioletov et al., 2023). As evidenced by Fig. 8, there is a strong correlation between emissions estimated using N20/OMPS and those using OMI (Fig. 8a), SNPP/OMPS (Fig. 8b), and TROPOMI (Fig. 8c), with correlation coefficients >0.98 in all cases. The overall biases are also quite small, with agreement within ∼ 10 % for all sensors: the estimated total annual emissions for all the sources, averaged over the period of 2018–2023, are 44.7, 47.0, 49.1, and 45.7 Mt yr−1 (Megaton, 106 t) for N20/OMPS, OMI, SNPP/OMPS, and TROPOMI, respectively. Note that the top-down emission algorithm relies on relative enhancement in SO2 signals over a relatively small domain (see Sect. 2.4). This may explain the overall small differences in the estimated emissions between N20 and SNPP/OMPS (∼ 10 %), despite the substantial differences in their PBL SO2 column density time series as discussed in Sect. 3.3.
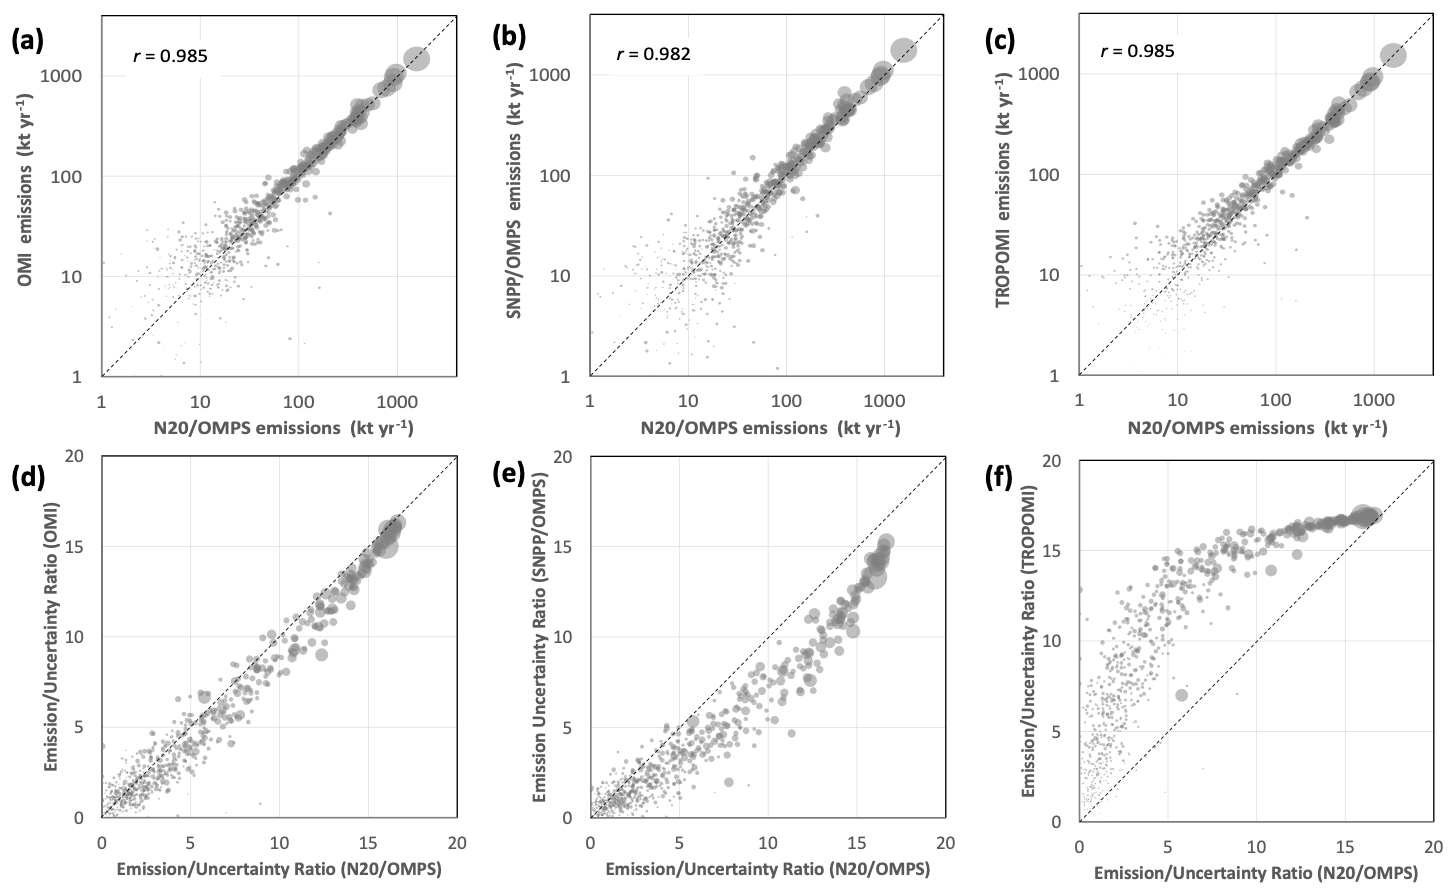
Figure 8(a–c) Scatterplots comparing the annual emissions of SO2 (kt yr−1) averaged over 2018–2023 for large point sources (in the version-2 emission catalogue) based on SO2 retrievals from (a) OMI vs. N20/OMPS, (b) SNPP/OMPS vs. N20/OMPS, and (c) TROPOMI vs. N20/OMPS. (d–f) Scatterplots of the ratios between the estimated emissions and their uncertainties based on retrievals from (d) OMI vs. N20/OMPS, (e) SNPP/OMPS vs. N20/OMPS, and (f) TROPOMI vs. N20/OMPS. The dashed lines are 1:1 lines. Each bubble represents a point source, and the bubble area is proportional to the annual SO2 emissions from the source.
One may find the agreement between TROPOMI and OMI- or OMPS-based emissions to be surprisingly good, given their substantial differences in spatial resolution, signal-to-noise ratio, and retrieval algorithms including AMF calculations. For TROPOMI, the SO2 data used in emission estimates are based on the COBRA algorithm, which is conceptually similar to the PCA algorithm. Previous comparisons (Theys et al., 2021) indicate largely consistent SO2 SCDs between TROPOMI COBRA and OMPS PCA retrievals. The local bias corrections in the emission estimates further reduce the differences between instruments or algorithms. While differences exist in AMF calculations, for emission estimates, the same set of location-specific AMFs is applied to SCDs, thus eliminating the AMF as a source of differences.
Figure 8d, e, and f compare the ratios between the estimated emissions and their associated uncertainties for different instruments. The uncertainties in the estimated emissions depend on the number of available retrievals and their noise. For the largest sources, all four sensors can capture the enhancement in SO2 well, and the ratios are quite similar between the different instruments. For smaller sources, TROPOMI has the best overall sensitivity and the greatest ratios (Fig. 8f) owing to its fine spatial resolution and large number of retrievals. The ratios for N20/OMPS are overall comparable with those for OMI (Fig. 8d), with the former having slightly larger ratios for most sources. N20/OMPS provides more retrievals than OMI, but its advantage in sample size is likely partially offset by the relatively large retrieval noise. As for the comparison between N20 and SNPP/OMPS (Fig. 8e), N20/OMPS has greater ratios for most of the sources. The results here imply that, given two similarly designed instruments, the one with the higher spatial resolution but larger noise will likely offer a stronger capability for point source detection and quantification.
Figure 9 presents the time series of regional SO2 emissions during 2005–2023, based on emission estimates from the four individual satellite sensors. Over the period of 2018–2023, N20/OMPS shows similar changes in SO2 emissions to the other instruments. For example, the emissions from Europe and the US are relatively steady after significant declines in the 2000s and 2010s. Emissions from China have continued to decrease, although at a much lower rate than between 2014 and 2017. Emissions from India and the Middle East saw a drop around 2020 and have since recovered. The N20-based or OMPS-based emissions also generally agree with the other instruments for most of the regions, although relatively large differences are found for India and the Middle East, especially during 2018–2020, when the N20-based or OMPS-based emissions are ∼ 10 %–15 % smaller than the weighted average. SNPP-based or OMPS-based emissions for these two regions, by contrast, appear to be biased high. It is possible that the relatively large differences in PBL SO2 between the two OMPS instruments (see Sect. 3.3) may have been caused by the negative biases in N20/OMPS retrievals and the positive biases in SNPP/OMPS retrievals.
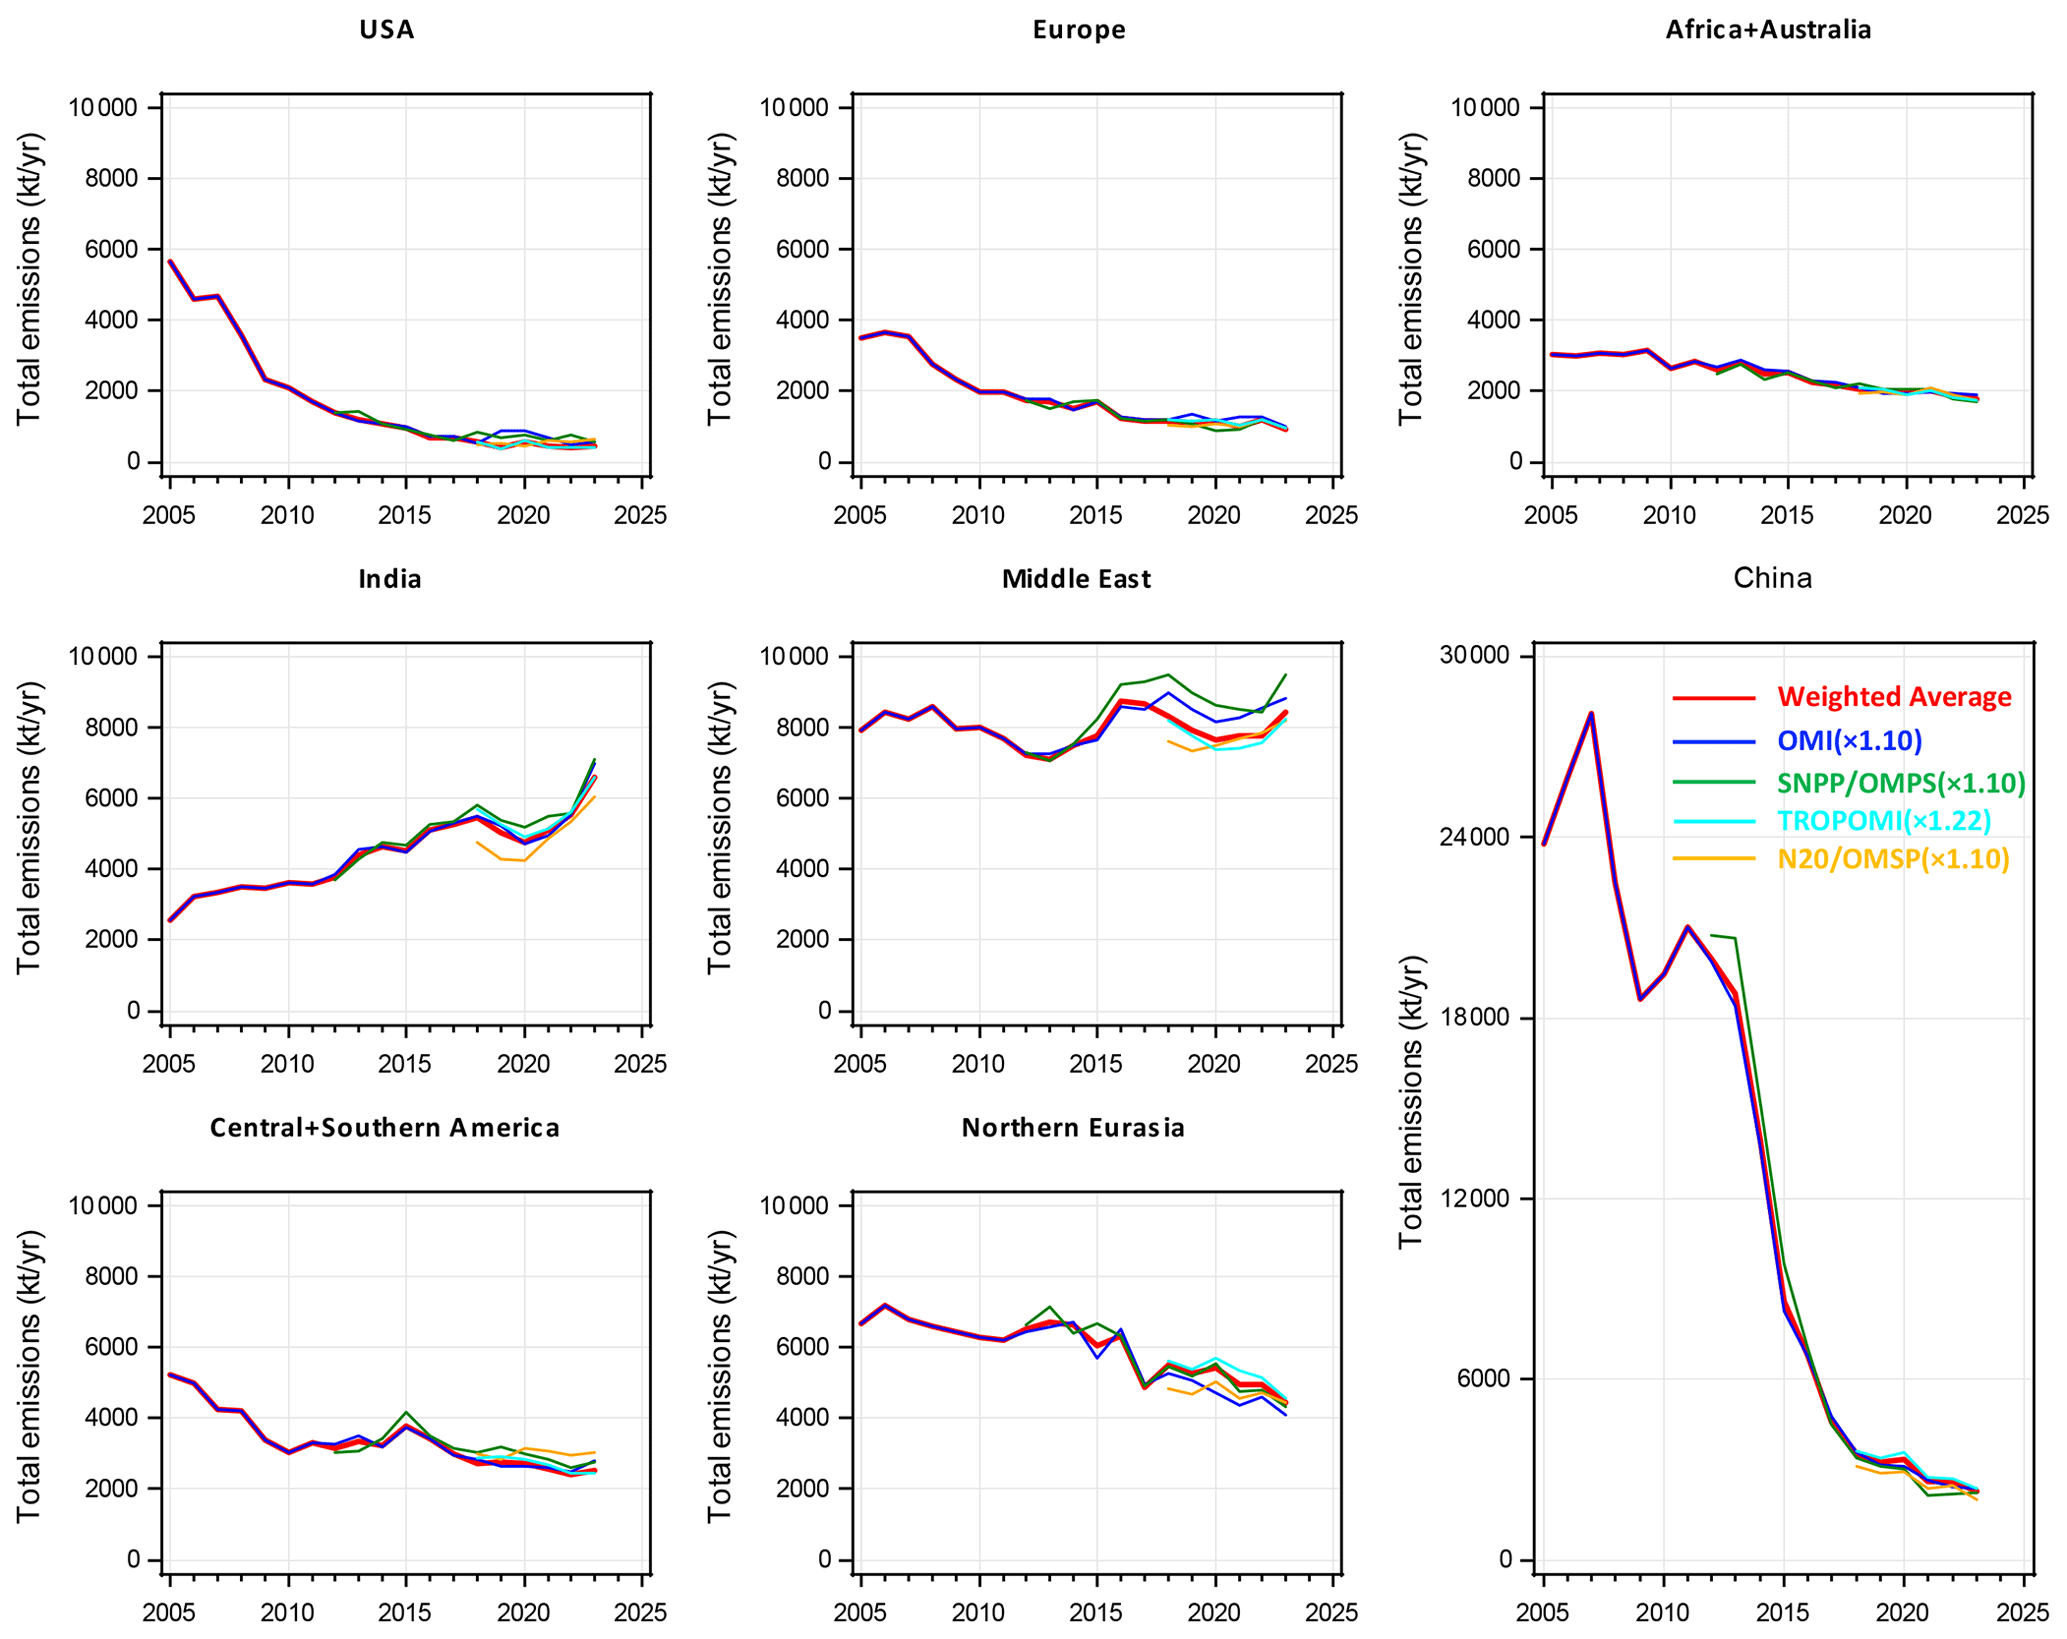
Figure 9Annual emissions for different regions during 2005–2023 from the point sources that are included in the version-2 satellite-based SO2 emission catalogue. Colors represent emission estimates using different satellite sensors, as well as their weighted average. For individual satellite datasets, the scaling factors have been applied to match an earlier version of the catalogue or to account for differences in SO2 cross sections in retrievals (see Sect. 2.4 and Fioletov et al., 2023, for details).
Using the emissions derived separately from individual satellites, we obtain the unified emission estimates for the catalogue by calculating a weighted average of the emission estimates from the four satellite instruments using an inverse-variance-weighting method (see Fig. S7 in the Supplement for the relative contributions of individual satellite instruments to the weighted average as a function of the emission strength). The weighted averages are also shown in Fig. 9 (the red lines). In the version-2 catalogue, OMI, SNPP/OMPS, and TROPOMI data contribute 7 %, 5 %, and 88 % to the average for small (<30 kt yr−1) sources and 33 %, 20 %, and 47 % for large (>300 kt yr−1) sources. The addition of N20/OMPS changes the contributions of individual instruments to 6 %, 4 %, 10 %, and 80 % for small sources and 23 %, 15 %, 26 %, and 35 % for large sources (for OMI, SNPP/OMPS, N20/OMPS, and TROPOMI, respectively). Thus, the weighting coefficients for N20/OMPS are nearly twice those for SMPP/OMPS. Again, this suggests that the superior spatial resolution of N20/OMPS is beneficial for emission estimates and yields substantially lower uncertainties in emissions than SNPP/OMPS, despite an overall similar retrieval noise between the two when binned to the same spatial resolution (see Fig. 2b).
Overall, these emission estimates demonstrate that N20/OMPS has the potential to augment and further extend the long-term satellite-based SO2 emission catalogue.
3.5 Comparisons of volcanic SO2 retrievals between SNPP and N20
In this section, we compare volcanic SO2 VCDs between N20 and SNPP/OMPS for two eruptions that are quite different in terms of their strength and SO2 emissions.
The first case for comparison is the fissure eruption of Kilauea that started on 3 May 2018 and lasted for a few months. SO2 released from this eruption remained low in the troposphere (Tang et al., 2020), and we compare N20 and SNPP/OMPS TRL SO2 retrievals that assume an a priori profile centered at an altitude of 3 km (see Sect. 2.3). Given that the same algorithm is used for N20 and SNPP/OMPS volcanic SO2 retrievals (Sect. 2.2.2), one would expect generally consistent results between the two. Indeed, as shown in Fig. 10c, the estimates of SO2 mass over the domain around the volcano, calculated daily from N20 and SNPP/OMPS retrievals for the period of May–July 2018, are correlated well with r>0.9. The overall bias between the two datasets is also relatively small (slope = 1.05, intercept = 0.09 from a linear regression analysis). On the other hand, the differences between N20 and SNPP/OMPS mass estimates can exceed 10 kt at times. This is likely due to the very different pixel sizes of the two instruments (see Fig. 10a and b for an example) that in some cases may lead to sampling biases for a relatively small domain. Additional comparisons between N20/OMPS and TROPOMI (Fig. 10d) also show good agreement, despite the differences in algorithms and instrument characteristics. There are no TRL SO2 (3 km profile) retrievals available from the operational TROPOMI product (Theys et al., 2017), and part of the low bias for N20 (slope = 0.87) could be attributed to the differences in the assumed plume center height.
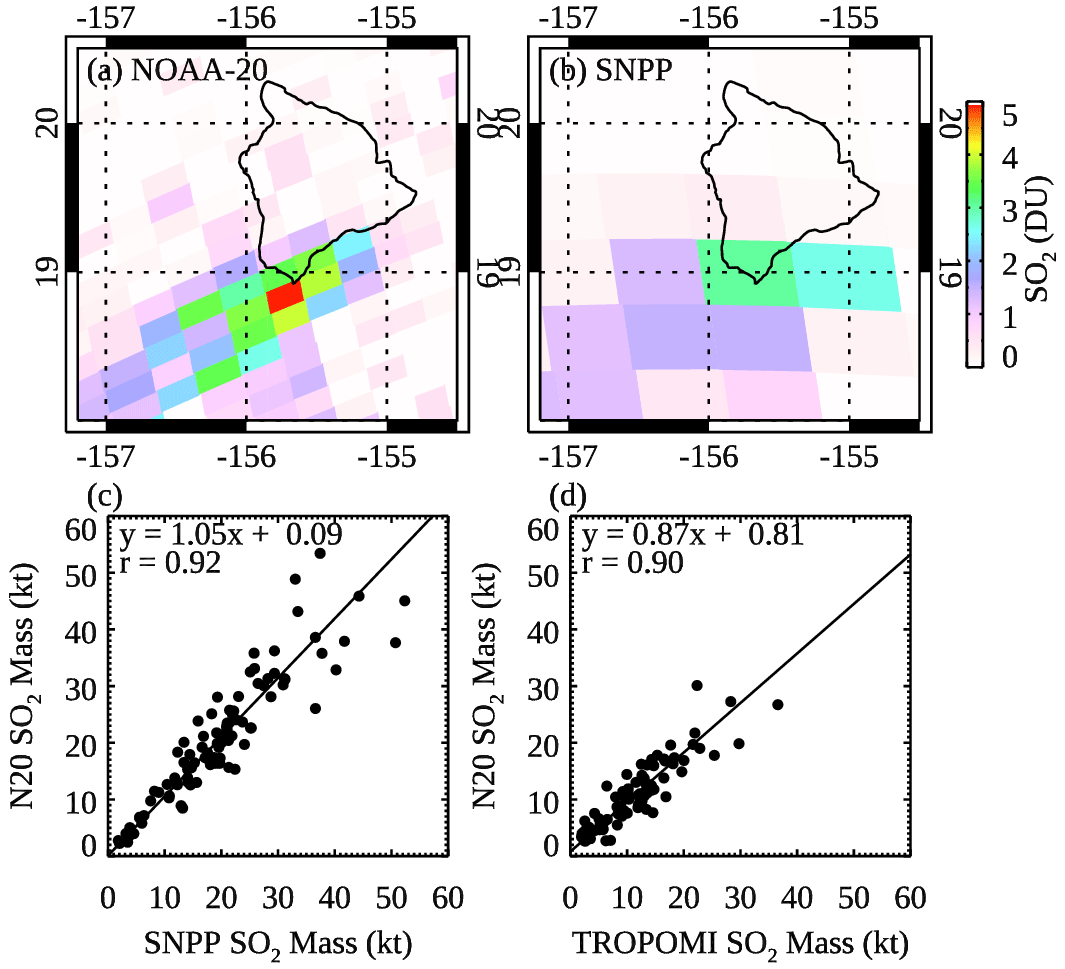
Figure 10Volcanic SO2 VCDs around Kilauea in Hawaii on 8 May 2018 retrieved from (a) N20/OMPS and (b) SNPP/OMPS, assuming an a priori profile with a center mass altitude of 3 km (lower troposphere or TRL). (c) The scatterplot of N20 vs. SNPP daily SO2 mass near Kilauea during May to June 2018. (d) Same as (c) but for N20 (8 km profile) vs. TROPOMI (7 km profile). The best-fit line from a regression analysis between the two daily SO2 mass datasets, along with its slope and intercept, is also given in panels (c) and (d). For the calculation of daily SO2 mass, volcanic SO2 VCDs are first gridded to 0.5° × 0.5° resolution using all pixels with SZA <70° for both instruments. The daily mass within the domain (as in Fig. 10a and b) is then calculated by taking the sum of SO2 mass from all grid cells that have gridded SO2 VCDs >0.1 DU. Changing the threshold to 0.2 DU yields a similar correlation coefficient (r=0.92) and slope (1.04) for panel (c).
The other case for comparison is the Raikoke eruption on 21 June 2019. The explosive eruption injected sizable amounts of SO2, ash, and sulfate aerosols into the lower stratosphere. The SO2 plume, soon dispersed over much of the Northern Hemisphere, could be observed from satellite instruments several weeks after the eruption (Gorkavyi et al., 2021). Here, we estimate the SO2 mass within the Raikoke plume for each day after the eruption until the end of July 2019, using STL (the assumed center altitude of the plume being 18 km) SO2 VCDs from N20 and SNPP/OMPS and SO2 VCDs from TROPOMI that assume a plume height of 15 km (Theys et al., 2017). The SO2 mass estimates from the two OMPS products (Fig. 11) are correlated well (r=0.98) and agree to better than ±15 % for all days except for 21–22 June 2019 and 28–31 July 2019. Immediately following the eruption, high SO2 concentrations in the dense volcanic plume can saturate the SO2 absorption signals at shorter wavelengths, resulting in low biases in SO2 retrieved from UV instruments (see Li et al., 2017b, for more details). Moreover, the effects of the light-absorbing volcanic ash are not explicitly accounted for in the current OMPS volcanic SO2 algorithm and may cause additional low biases in SO2 retrievals. These two factors likely have different impacts on retrievals from N20 and SNPP/OMPS, thus leading to relatively large differences between the two instruments at the beginning of the time series (Fig. 11). As for 28–31 July 2019, with the significant drop in SO2 VCDs due to plume dispersion and chemical loss, mass estimates are likely more strongly influenced by areas outside of the actual plume. The relatively large differences between N20 and SNPP/OMPS may point to slightly larger background noise in N20/OMPS retrievals, especially at higher latitudes. The SO2 mass from TROPOMI is correlated well with N20 (r=0.99), and the differences with N20 are better than ±15 % until 7 July 2024. After that, the TROPOMI-based SO2 mass is ∼ 20 %–40 % higher, possibly reflecting both the greater sensitivity of TROPOMI (as the plume dissipated) and algorithmic differences including the assumed plume height.
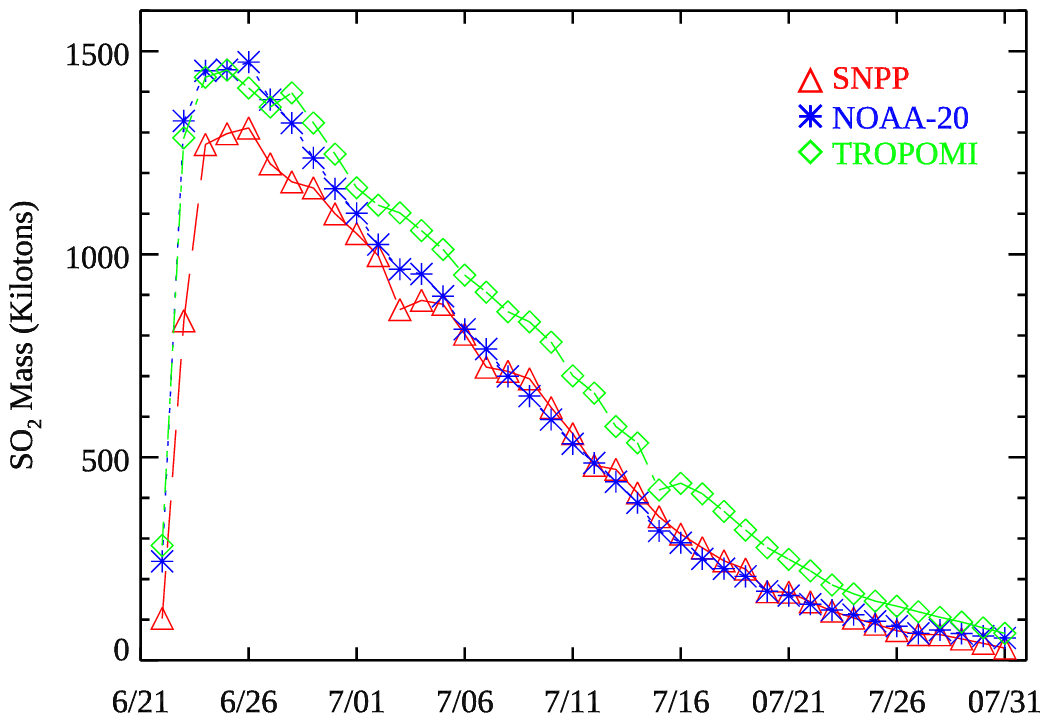
Figure 11The N20, SNPP, and TROPOMI time series of daily SO2 mass within the Raikoke volcanic plume after the eruption in June 2019, based on STL (18 km profile) volcanic SO2 retrievals (15 km profile for TROPOMI). The SO2 VCDs from all instruments are first gridded to 0.5° × 0.5° resolution using the same process as for the Kilauea case study. To minimize the impact of other SO2 emission sources, we only count grid cells located north of 20° N that have VCDs >0.2 DU in the estimates of the daily Raikoke SO2 mass.
The version-1 N20/OMPS PCA SO2 product is available at NASA's Goddard Earth Sciences Data and Information Services Center (GES DISC) at https://disc.gsfc.nasa.gov/datasets/OMPS_N20_NMSO2_PCA_L2_Step1_1/summary (last access: 13 May 2024). The DOI identifier is https://doi.org/10.5067/OMPS/OMPS_N20_NMSO2_PCA_L2_Step1.1 (last access: 13 May 2024, Li et al., 2023).
The version-2 SO2 emission catalogue based on OMI, TROPOMI, SNPP, and N20 data is available at GES DISC at https://disc.gsfc.nasa.gov/datasets/MSAQSO2L4_2/summary (last access: 13 May 2024). The DOI identifier is https://doi.org/10.5067/MEASURES/SO2/DATA406 (last access: 13 May 2024, Fioletov et al., 2022).
The version-2 TROPOMI SO2 data are available from Copernicus and the NASA GES DISC at https://doi.org/10.5270/S5P-74eidii (Copernicus Sentinel data processed by the ESA and the German Aerospace Center (DLR), 2020).
In this paper, we introduce our newly released version-1 N20/OMPS SO2 product. Generated with our PCA-based retrieval algorithm that is also used for NASA standard OMI and SNPP/OMPS SO2 datasets, the N20/OMPS SO2 product aims to extend NASA's long-term global SO2 data record into the JPSS era. The N20/OMPS SO2 retrieval algorithm shares many similarities with the OMI and SNPP/OMPS algorithms. This is especially the case for volcanic SO2 retrievals, and comparisons for the 2018 Kilauea eruption and 2019 Raikoke eruption demonstrate good consistency between N20 and SNPP/OMPS. On the other hand, several modifications have been made for anthropogenic (or PBL) SO2 retrievals, considering the instrumental characteristics of the N20/OMPS Nadir Mapper (i.e., a greater spatial resolution but a reduced signal-to-noise ratio for N20 vs. SNPP/OMPS) and the availability of other input datasets (e.g., the Raman cloud product).
Statistical analyses of SO2 SCDs confirm that N20/OMPS, like its predecessor SNPP/OMPS, can produce good-quality retrievals suitable for long-term global monitoring of large anthropogenic sources and degassing volcanoes. In the absence of significant volcanic plumes, both N20 and SNPP/OMPS retrievals show generally small biases, with mean SCDs within ±0.05 DU over the remote Pacific. At its native resolution, the standard deviation of N20/OMPS SO2 SCDs over the same areas is ∼ 0.35–0.6 DU and 2–4 times larger than SNPP/OMPS. Once aggregated to the SNPP/OMPS resolution, the N20/OMPS SCDs have a comparable standard deviation, except at high latitudes (70–80° N). This suggests that the greater noise in N20/OMPS SO2 retrievals is largely driven by reduced SNRs in measurements at higher spatial resolutions. Retrievals at large solar zenith angles are probably subject to additional errors. Both N20 and SNPP/OMPS SO2 SCDs demonstrate remarkable stability over the entirety of their missions thus far. There are no significant changes in the mean SCDs over the equatorial Pacific and very small trends in the standard deviation of SCDs (0.0002 DU yr−1 for SNPP/OMPS and −0.00023 DU yr−1 for N20/OMPS at SNPP resolution).
Comparisons of N20 and SNPP/OMPS PBL SO2 VCDs, calculated using SCDs and a fixed AMF of 0.36, show a similar spatial distribution between the two retrievals, with both revealing SO2 signals over major polluted areas such as India, the Middle East, and South Africa as well as degassing volcanoes. The N20/OMPS PBL SO2 VCD is slightly lower over most areas compared with SNPP/OMPS, outside of high latitudes and SAA-affected areas. The causes of these differences are not fully understood at this point but are at least partially attributable to algorithmic differences for SCDs, including algorithm settings (e.g., the threshold for filtering out SO2-laden pixels) and a noise reduction scheme for SAA areas that is implemented for SNPP but not yet for N20/OMPS. Even though the overall negative biases in N20/OMPS retrievals are quite small, they lead to substantial differences in the long-term PBL SO2 time series between the two OMPS datasets. Over selected anthropogenic source areas, the N20 and SNPP/OMPS time series are correlated well (r>0.8 for all but one area), but the SO2 mass based on N20/OMPS is on average ∼ 20 % smaller over the Middle East and India. Closer correlation (r>0.9) and better agreement (typical differences of ∼ 10 %–15 %) are found for selected degassing volcanoes, implying that sources with strong SO2 signals are less susceptible to the algorithmic differences.
Despite the negative biases in N20/OMPS retrievals compared with SNPP/OMPS, top-down SO2 emission estimates for large point sources (included in the version-2 emission catalogue) show very good agreement between N20/OMPS and other instruments, including OMI, SNPP/OMPS, and TROPOMI (r>0.98, differences in total emissions <10 %). To assess the sensitivity of each instrument to SO2 sources, we also compute the ratios between the estimated emissions and their uncertainties. As expected, TROPOMI has the highest ratios owing to its high spatial resolution and relatively small retrieval noise; the ratios for N20/OMPS are slightly larger than OMI and greater than SNPP/OMPS for most sources, suggesting that, of the two OMPS instruments, N20/OMPS is better suited for continuing the long-term emission catalogue started with OMI. It is also interesting that, for the Middle East and India, emission estimates from N20/OMPS are smaller than those from OMI and TROPOMI, whereas the emissions based on SNPP/OMPS are greater. This suggests that the relatively large differences in the PBL SO2 over these two regions could reflect the combined effects of the negative and positive retrieval biases from N20 and SNPP/OMPS, respectively.
In summary, through extensive evaluation of the version-1 N20/OMPS SO2 product and the version-2 emission catalogue, we have demonstrated that the N20/OMPS Nadir Mapper can further extend the long-term NASA SO2 climate data records from OMI and SNPP/OMPS. Efforts are currently underway to implement several updates for the next version (v2) of the N20/OMPS SO2 product. These include refinements in SCD retrievals (e.g., improved treatment for SAA areas) using an updated Level-1B (L1B) product, the use of a new N20/OMPS Raman cloud product and model-based a priori profiles for AMF/Jacobian calculations, and the addition of box AMFs to the level-2 output files. These efforts, along with the recent advances in machine learning techniques for reducing retrieval noise and biases (e.g., Joiner et al., 2023; Li et al., 2022), will further enhance the consistency in the SO2 retrievals from different instruments and facilitate the development of multi-decade, coherent global SO2 datasets across multiple satellite missions.
The supplement related to this article is available online at: https://doi.org/10.5194/essd-16-4291-2024-supplement.
CL designed and implemented the retrieval algorithm, performed the tests, and prepared the manuscript. NAK, SC, JJ, and AV made suggestions on the design of the retrieval algorithm. PJTL assisted in the production code for the retrieval algorithm and the public release of the emission catalogue. VF, CM, and DG generated emission estimates for the catalogue. JJ first proposed the PCA-based trace gas retrieval technique. CS provided the L1B and total O3 input data for the SO2 retrieval algorithm. All the authors commented on the manuscript.
The contact author has declared that none of the authors has any competing interests.
Publisher's note: Copernicus Publications remains neutral with regard to jurisdictional claims made in the text, published maps, institutional affiliations, or any other geographical representation in this paper. While Copernicus Publications makes every effort to include appropriate place names, the final responsibility lies with the authors.
We are grateful for the NASA Suomi National Polar-Orbiting Partnership (NPP) and Joint Polar Satellite System (JPSS) satellite standard products and the Earth System Data Records program for funding of the SNPP and N20/OMPS SO2 product development and analysis (grant no. 80NSSC22K0158). The satellite-based SO2 emission catalogue is partially supported by the NASA Making Earth System Data Records for Use in Research Environments (MEaSUREs) program. We also thank the NASA Ozone Processing Team (OPT) for the L1B and total O3 data from SNPP and N20/OMPS. We acknowledge the ESA and the TROPOMI SO2 team, including Nicolas Theys (BIRA-IASB), Pascal Hedelt (DLR), Fabian Romahn (DLR), and Thomas Wagner (MPIC), for the use of the TROPOMI SO2 product.
This research has been supported by the National Aeronautics and Space Administration (grant no. 80NSSC22K0158).
This paper was edited by Jing Wei and reviewed by two anonymous referees.
Ahmad, Z., Bhartia, P. K., and Krotkov, N.: Spectral properties of backscattered UV radiation in cloudy atmospheres, J. Geophys. Res., 109, D01201, https://doi.org/10.1029/2003JD003395, 2004.
Aubry, T. J., Staunton-Sykes, J., Marshall, L. R., Haywood, J., Abraham, N. L., and Schmidt, A.: Climate change modulates the stratospheric volcanic sulfate aerosol lifecycle and radiative forcing from tropical eruptions, Nat. Commun., 12, 4708, https://doi.org/10.1038/s41467-021-24943-7, 2021.
Bhartia, P. K.: OMI/Aura Ozone (O3) Total Column 1-Orbit L2 Swath 13x24 km V003, Greenbelt, MD, USA, Goddard Earth Sciences Data and Information Services Center (GES DISC) [data set], https://doi.org/10.5067/Aura/OMI/DATA2024, 2005.
Biswas, M. S. and Ayantika, D. C.: Impact of COVID-19 Control Measures on Trace Gases (NO2, HCHO and SO2) and Aerosols over India during Pre-monsoon of 2020, Aerosol Air Qual. Res. 21, 200306, https://doi.org/10.4209/aaqr.2020.06.0306, 2021.
Carn, S.: Multi-Satellite Volcanic Sulfur Dioxide L4 Long-Term Global Database V4, Greenbelt, MD, USA, Goddard Earth Science Data and Information Services Center (GES DISC) [data set], https://doi.org/10.5067/MEASURES/SO2/DATA405, 2022.
Carn, S. A., Fioletov, V. E., McLinden, C. A., Li, C., and Krotkov, N. A.: A decade of global volcanic SO2 emissions measured from space, Sci. Rep., 7, 44095, https://doi.org/10.1038/srep44095, 2017.
Carn, S. A., Krotkov, N. A., Fisher, B. L., and Li, C.: Out of the blue: Volcanic SO2 emissions during the 2021–2022 Hunga Tonga-Hunga Ha'apai eruptions, Front. Earth Sci., 10, 976962, https://doi.org/10.3389/feart.2022.976962, 2022.
Chuang, C. C., Penner, J. E., Taylor, K. E., Grossman, A. S., and Walton, J. J.: An assessment of the radiative effects of anthropogenic sulfate, J. Geophys. Res., 102, 3761–3778, https://doi.org/10.1029/96JD03087, 1997.
Copernicus Sentinel data processed by ESA and German Aerospace Center (DLR): Sentinel-5P TROPOMI Sulphur Dioxide SO2 1-Orbit L2 5.5km x 3.5km, Greenbelt, MD, USA, Goddard Earth Sciences Data and Information Services Center (GES DISC) [data set], https://doi.org/10.5270/S5P-74eidii, 2020.
Eisinger, M. and Burrows, J. P.: Tropospheric sulfur dioxide observed by the ERS-2 GOME instrument, Geophys. Res. Lett., 25, 4177–4180, https://doi.org/10.1029/1998GL900128, 1998.
Evan, S., Brioude, J., Rosenlof, K. H., Gao, R.-S., Portmann, R. W., Zhu, Y., Volkamer, R., Lee, C. F., Metzger, J.-M., Lamy, K., Walter, P., Alvarez, S. L., Flynn, J. H., Asher, E., Todt, M., Davis, 70 S. M., Thornberry, T., Vömel, H., Wienhold, F. G., Stauffer, R. M., Millán, L., Santee, M. L., Froidevaux, L., and Read, W. G.: Rapid ozone depletion after humidification of the stratosphere by the Hunga Tonga Eruption, Science, 382, eadg2551, https://doi.org/10.1126/science.adg2551, 2023.
Fedkin, N., Li, C., Dickerson, R. R., Canty, T., and Krotkov, N. A.: Linking improvements in sulfur dioxide emissions to decreasing sulfate wet deposition by combining satellite and surface observations with trajectory analysis, Atmos. Environ., 199, 210–223, https://doi.org/10.1016/j.atmosenv.2018.11.039, 2019.
Fioletov, V., McLinden, C., Krotkov, N. A., and Li, C.: Lifetimes and emissions of SO2 from point sources estimated from OMI, Geophys. Res. Lett., 42, 1969–1976, https://doi.org/10.1002/2015GL063148, 2015.
Fioletov, V. E., McLinden, C. A., Krotkov, N., Li, C., Joiner, J., Theys, N., Carn, S., and Moran, M. D.: A global catalogue of large SO2 sources and emissions derived from the Ozone Monitoring Instrument, Atmos. Chem. Phys., 16, 11497–11519, https://doi.org/10.5194/acp-16-11497-2016, 2016.
Fioletov, V., McLinden, C. A., Griffin, D., Abboud, I., Krotkov, N., Leonard, P. J. T., Li, C., Joiner, J., Theys, N., and Carn, S.: Multi-Satellite Air Quality Sulfur Dioxide (SO2) Database Long-Term L4 Global V2, Edited by Peter Leonard, Greenbelt, MD, USA, Goddard Earth Science Data and Information Services Center (GES DISC) [data set], https://doi.org/10.5067/MEASURES/SO2/DATA406, 2022.
Fioletov, V. E., McLinden, C. A., Griffin, D., Abboud, I., Krotkov, N., Leonard, P. J. T., Li, C., Joiner, J., Theys, N., and Carn, S.: Version 2 of the global catalogue of large anthropogenic and volcanic SO2 sources and emissions derived from satellite measurements, Earth Syst. Sci. Data, 15, 75–93, https://doi.org/10.5194/essd-15-75-2023, 2023.
Fisher, B. L., Krotkov, N. A., Bhartia, P. K., Li, C., Carn, S. A., Hughes, E., and Leonard, P. J. T.: A new discrete wavelength backscattered ultraviolet algorithm for consistent volcanic SO2 retrievals from multiple satellite missions, Atmos. Meas. Tech., 12, 5137–5153, https://doi.org/10.5194/amt-12-5137-2019, 2019.
Gorkavyi, N., Krotkov, N., Li, C., Lait, L., Colarco, P., Carn, S., DeLand, M., Newman, P., Schoeberl, M., Taha, G., Torres, O., Vasilkov, A., and Joiner, J.: Tracking aerosols and SO2 clouds from the Raikoke eruption: 3D view from satellite observations, Atmos. Meas. Tech., 14, 7545–7563, https://doi.org/10.5194/amt-14-7545-2021, 2021.
Hand, J. L. and Malm, W. C.: Review of aerosol mass scattering efficiencies from ground-based measurements since 1990, J. Geophys. Res., 112, D16203, https://doi.org/10.1029/2007JD008484, 2007.
Haywood, J. and Boucher, O.: Estimates of the direct and indirect radiative forcing due to tropospheric aerosols: A review, Rev. Geophys., 38, 513–543, https://doi.org/10.1029/1999RG000078, 2000.
Ialongo, I., Hakkarainen, J., Kivi, R., Anttila, P., Krotkov, N. A., Yang, K., Li, C., Tukiainen, S., Hassinen, S., and Tamminen, J.: Comparison of operational satellite SO2 products with ground-based observations in northern Finland during the Icelandic Holuhraun fissure eruption, Atmos. Meas. Tech., 8, 2279–2289, https://doi.org/10.5194/amt-8-2279-2015, 2015.
Jin, J., Ma, J., Lin, W., Zhao, H., Shaiganfar, R., Beirle, S., and Wagner, T.: MAX-DOAS measurements and satellite validation of tropospheric NO2 and SO2 vertical column densities at a rural site of North China, Atmos. Environ., 133, 12–25, https://doi.org/10.1016/j.atmosenv.2016.03.031, 2016.
Joiner, J. and Vasilkov, A. P.: First results from the OMI rotational-Raman scattering cloud pressure algorithm, IEEE Trans. Geophys. Remote Sens., 44, 1272–1282, 2006.
Joiner, J., Marchenko, S., Fasnacht, Z., Lamsal, L., Li, C., Vasilkov, A., and Krotkov, N.: Use of machine learning and principal component analysis to retrieve nitrogen dioxide (NO2) with hyperspectral imagers and reduce noise in spectral fitting, Atmos. Meas. Tech., 16, 481–500, https://doi.org/10.5194/amt-16-481-2023, 2023.
Krotkov, N. A., Cam, S. A., Krueger, A. J., Bhartia, P. K., and Yang, K.: Band residual difference algorithm for retrieval of SO2 from the Aura Ozone Monitoring Instrument (OMI), IEEE Trans. Geosci. Remote Sens., 44, 1259–1266, https://doi.org/10.1109/TGRS.2005.861932, 2006.
Krotkov, N. A., McLinden, C. A., Li, C., Lamsal, L. N., Celarier, E. A., Marchenko, S. V., Swartz, W. H., Bucsela, E. J., Joiner, J., Duncan, B. N., Boersma, K. F., Veefkind, J. P., Levelt, P. F., Fioletov, V. E., Dickerson, R. R., He, H., Lu, Z., and Streets, D. G.: Aura OMI observations of regional SO2 and NO2 pollution changes from 2005 to 2015, Atmos. Chem. Phys., 16, 4605–4629, https://doi.org/10.5194/acp-16-4605-2016, 2016.
Krotkov, N. A., Realmuto, V., Li, C., Seftor, C., Li, J., Brentzel, K., Stuefer, M., Cable, J., Dierking, C., Delamere, J., Schneider, D., Tamminen, J., Hassinen, S., Ryyppö, T., Murray, J., Carn, S., Osiensky, J., Eckstein, N., Layne, G., and Kirkendall, J.: Day-night monitoring of volcanic SO2 and ash clouds for aviation avoidance at northern polar latitudes, Remote Sens., 13, 4003, https://doi.org/10.3390/rs13194003, 2021.
Krueger, A. J.: Sighting of El Chichón sulfur dioxide clouds with the Nimbus 7 Total Ozone Mapping Spectrometer, Science, 220, 1377–1378, 1983.
Levelt, P. F., Joiner, J., Tamminen, J., Veefkind, J. P., Bhartia, P. K., Stein Zweers, D. C., Duncan, B. N., Streets, D. G., Eskes, H., van der A, R., McLinden, C., Fioletov, V., Carn, S., de Laat, J., DeLand, M., Marchenko, S., McPeters, R., Ziemke, J., Fu, D., Liu, X., Pickering, K., Apituley, A., González Abad, G., Arola, A., Boersma, F., Chan Miller, C., Chance, K., de Graaf, M., Hakkarainen, J., Hassinen, S., Ialongo, I., Kleipool, Q., Krotkov, N., Li, C., Lamsal, L., Newman, P., Nowlan, C., Suleiman, R., Tilstra, L. G., Torres, O., Wang, H., and Wargan, K.: The Ozone Monitoring Instrument: overview of 14 years in space, Atmos. Chem. Phys., 18, 5699–5745, https://doi.org/10.5194/acp-18-5699-2018, 2018.
Li, C., Joiner, J., Krotkov, N. A., and Bhartia, P. K.: A fast and sensitive new satellite SO2 retrieval algorithm based on principal component analysis: application to the ozone monitoring instrument, Geophys. Res. Lett., 40, 6314–6318, https://doi.org/10.1002/2013GL058134, 2013.
Li, C., McLinden, C., Fioletov, V., Krotkov, N., Carn, S., Joiner, J., Streets, D., He, H., Ren, X., Li, Z., and Dickerson, R. R.: India is overtaking China as the world's largest emitter of anthropogenic sulfur dioxide, Sci. Rep., 7, 14304, https://doi.org/10.1038/s41598-017-14639-8, 2017a.
Li, C., Krotkov, N. A., Carn, S., Zhang, Y., Spurr, R. J. D., and Joiner, J.: New-generation NASA Aura Ozone Monitoring Instrument (OMI) volcanic SO2 dataset: algorithm description, initial results, and continuation with the Suomi-NPP Ozone Mapping and Profiler Suite (OMPS), Atmos. Meas. Tech., 10, 445–458, https://doi.org/10.5194/amt-10-445-2017, 2017b.
Li, C., Krotkov, N. A., Leonard, P. J. T., Carn, S., Joiner, J., Spurr, R. J. D., and Vasilkov, A.: Version 2 Ozone Monitoring Instrument SO2 product (OMSO2 V2): new anthropogenic SO2 vertical column density dataset, Atmos. Meas. Tech., 13, 6175–6191, https://doi.org/10.5194/amt-13-6175-2020, 2020.
Li, C., Joiner, J., Liu, F., Krotkov, N. A., Fioletov, V., and McLinden, C.: A new machine-learning-based analysis for improving satellite-retrieved atmospheric composition data: OMI SO2 as an example, Atmos. Meas. Tech., 15, 5497–5514, https://doi.org/10.5194/amt-15-5497-2022, 2022.
Li, C., Krotkov, N. A., and Leonard, P.: OMPS-N20 NM PCA SO2 Step 1 Total Column 1-Orbit L2 Swath 17x13km, Greenbelt, MD, USA, Goddard Earth Sciences Data and Information Services Center (GES DISC) [data set], https://doi.org/10.5067/OMPS/OMPS_N20_NMSO2_PCA_L2_Step1.1, 2023.
Likens, G. E., Driscoll, C. T., and Buso, D. C.: Long-term effects of acid rain: Response and recovery of a forest ecosystem, Science, 272, 244–246, 1996.
Liu, F., Choi, S., Li, C., Fioletov, V. E., McLinden, C. A., Joiner, J., Krotkov, N. A., Bian, H., Janssens-Maenhout, G., Darmenov, A. S., and da Silva, A. M.: A new global anthropogenic SO2 emission inventory for the last decade: a mosaic of satellite-derived and bottom-up emissions, Atmos. Chem. Phys., 18, 16571–16586, https://doi.org/10.5194/acp-18-16571-2018, 2018.
McGraw, Z., DallaSanta, K., Polvani, L., Tsigaridis, K., Orbe, C., and Bauer, S. E.: Severe global cooling after volcanic super-eruptions? The answer hinges on unknown aerosol size, J. Climate, 37, 1449–1464, https://doi.org/10.1175/JCLI-D-23-0116.1, 2024.
McLinden, C. Fioletov, V., Shephard, M., Krotkov, N., Li, C., Martin, R. V., Moran, M. D., and Joiner, J.: Space-based detection of missing sulfur dioxide sources of global air pollution, Nat. Geosci., 9, 496–500, https://doi.org/10.1038/NGEO2724, 2016.
McLinden, C. A., Adams, C. L. F., Fioletov, V., Griffin, D., Makar, P. A., Zhao, X., Kovachik, A., Dickson, N., Brown, C., Krotkov, N., Li, C., Theys, N., Hedelt, P., and Loyola, D. G.: Inconsistencies in sulfur dioxide emissions from the Canadian oil sands and potential implications, Environ. Res. Lett., 16, 014012, https://doi.org/10.1088/1748-9326/abcbbb, 2021.
Orellano, P., Reynoso, J., and Quaranta, N.: Short-term exposure to sulphur dioxide (SO2) and all-cause and respiratory mortality: A systematic review and meta-analysis, Environ. Int., 150, 106434, https://doi.org/10.1016/j.envint.2021.106434, 2021.
Robock, A.: Volcanic eruptions and climate, Revs. Geophys., 38, 191–219, https://doi.org/10.1029/1998RG000054, 2000.
Solomon, S., Portmann, R. W., Garcia, R. R., Thomason, L. W., Poole, L. R., and McCormick, M. P.: The role of aerosol variations in anthropogenic ozone depletion at northern midlatitudes, J. Geophys. Res., 101, 6713–6727, https://doi.org/10.1029/95JD03353, 1996.
Spurr, R.: LIDORT and VLIDORT: Linearized Pseudo-Spherical Scalar and Vector Discrete Ordinate Radiative Transfer Models for use in Remote Sensing Retrieval Problems, in: Light Scattering Reviews, vol. 3, edited by: Kokhanovsky, A., Springer, Berlin Heidelberg, https://doi.org/10.1007/978-3-540-48546-9, 2008.
Stenchikov, G.: The role of volcanic activity in climate and global change, in: Climate change, observed impact on planet Earth, 2nd edn., edited by: Letcher, T. M., Elsevier, Boston, MA, 419–447 https://doi.org/10.1016/b978-0-444-63524-2.00026-9, 2016.
Tang, Y., Tong, D. Q., Yang, K., Lee, P., Baker, B., Crawford, A., Luke, W., Stein, A., Campbell, P. C, Ring, A., Flynn, J., Wang, Y., McQueen, J., Pan, L., Huang, J., and Stajner, I.: Air quality impacts of the 2018 Mt. Kilauea Volcano eruption in Hawaii: A regional chemical transport model study with satellite-constrained emissions, Atmos. Environ., 237, 117648, https://doi.org/10.1016/j.atmosenv.2020.117648, 2020.
Theys, N., De Smedt, I., van Gent, J., Danckaert, T., Wang, T., Hendrick, F., Stavrakou, T., Bauduin, S., Clarisse, L., Li, C., Krotkov, N., Yu, H., Brenot, H., and Van Roozendael, M.: Sulfur dioxide vertical column DOAS retrievals from the Ozone Monitoring Instrument: Global observations and comparison to ground-based and satellite data, J. Geophys. Res., 120, 2470–2491, https://doi.org/10.1002/2014JD022657, 2015.
Theys, N., De Smedt, I., Yu, H., Danckaert, T., van Gent, J., Hörmann, C., Wagner, T., Hedelt, P., Bauer, H., Romahn, F., Pedergnana, M., Loyola, D., and Van Roozendael, M.: Sulfur dioxide retrievals from TROPOMI onboard Sentinel-5 Precursor: algorithm theoretical basis, Atmos. Meas. Tech., 10, 119–153, https://doi.org/10.5194/amt-10-119-2017, 2017.
Theys, N., Fioletov, V., Li, C., De Smedt, I., Lerot, C., McLinden, C., Krotkov, N., Griffin, D., Clarisse, L., Hedelt, P., Loyola, D., Wagner, T., Kumar, V., Innes, A., Ribas, R., Hendrick, F., Vlietinck, J., Brenot, H., and Van Roozendael, M.: A sulfur dioxide Covariance-Based Retrieval Algorithm (COBRA): application to TROPOMI reveals new emission sources, Atmos. Chem. Phys., 21, 16727–16744, https://doi.org/10.5194/acp-21-16727-2021, 2021.
Tian, X., Xie, P., Xu, J., Li, A., Wang, Y., Qin, M., and Hu, Z.: Long-term observations of tropospheric NO2, SO2 and HCHO by MAX-DOAS in Yangtze River Delta area, China, J. Environ. Sci., 71, 207–221, https://doi.org/10.1016/j.jes.2018.03.006, 2018.
Timmreck, C.: Modeling the climatic effects of large explosive volcanic eruptions, WIREs Clim. Change, 3, 545–564, https://doi.org/10.1002/wcc.192, 2012.
Vasilkov, A., Joiner, J., and Seftor, C.: First results from a rotational Raman scattering cloud algorithm applied to the Suomi National Polar-orbiting Partnership (NPP) Ozone Mapping and Profiler Suite (OMPS) Nadir Mapper, Atmos. Meas. Tech., 7, 2897–2906, https://doi.org/10.5194/amt-7-2897-2014, 2014.
Veefkind, J. P., Aben, I., McMullan, K., Förster, H., de Vries, J., Otter, G., Claas, J., Eskes, H. J., de Haan, J. F., Kleipool, Q., van Weele, M., Hasekamp, O., Hoogeveen, R., Landgraf, J., Snel, R., Tol, P., Ingmann, P., Voors, R., Kruizinga, B., Vink, R., Visser, H., and Levelt, P. F.: TROPOMI on the ESA Sentinel-5 Precursor: A GMES mission for global observations of the atmospheric composition for climate, air quality and ozone layer applications, Remote Sens. Environ., 120, 70–83, https://doi.org/10.1016/j.rse.2011.09.027, 2012.
Vernier, J. P., Thomason, L. W., Pommereau, J. P., Bourassa, A., Pelon, J., Garnier, A., Hauchecorne, A., Blanot, L., Trepte, C., Degenstein, D., and Vargas, F.: Major influence of tropical volcanic eruptions on the stratospheric aerosol layer during the last decade, Geophys. Res. Lett., 38, L12807, https://doi.org/10.1029/2011GL047563, 2011.
Wang, C., Wang, T., Wang, P., and Wang, W.: Assessment of the performance of TROPOMI NO2 and SO2 data products in the North China Plain: Comparison, correction and application, Remote Sens., 14, 214, https://doi.org/10.3390/rs14010214, 2022.
Wang, G., Zhang, R., Gomez, M. E., Yang, L., Levy Zamora, M., Hu, M., Lin, Y., Peng, J., Guo, S., Meng, J., Li, J., Cheng, C., Hu, T., Ren, Y., Wang, Y., Gao, J., Cao, J., An, Z., Zhou, W., Li, G., Wang, J., Tian, P., Marrero-Ortiz, W., Secrest, J., Du, Z., Zheng, J., Shang, D., Zeng, L., Shao, M., Wang, W., Huang, Y., Wang, Y., Zhu, Y., Li, Y., Hu, J., Pan, B., Cai, L., Cheng, Y., Ji, Y., Zhang, F., Rosenfeld, D., Liss, P. S., Duce, R. A., Kolb, C. E., and Molina, M. J.: Persistent sulfate formation from London Fog to Chinese haze, P. Natl. Acad. Sci. USA, 113, 13630–13635, https://doi.org/10.1073/pnas.1616540113, 2016.
Wang, L., Pan, C., Yan, B., Beck, T., Chen, J., Zhou, L., Kalluri, S., and Goldberg, M.: Geolocation assessment and pptimization for OMPS Nadir Mapper: Methodology, Remote Sens., 14, 3040, https://doi.org/10.3390/rs14133040, 2022.
Wang, Y., Beirle, S., Lampel, J., Koukouli, M., De Smedt, I., Theys, N., Li, A., Wu, D., Xie, P., Liu, C., Van Roozendael, M., Stavrakou, T., Müller, J.-F., and Wagner, T.: Validation of OMI, GOME-2A and GOME-2B tropospheric NO2, SO2 and HCHO products using MAX-DOAS observations from 2011 to 2014 in Wuxi, China: investigation of the effects of priori profiles and aerosols on the satellite products, Atmos. Chem. Phys., 17, 5007–5033, https://doi.org/10.5194/acp-17-5007-2017, 2017.
Yang, K., Krotkov, N. A., Krueger, A. J., Carn, S. A., Bhartia, P. K., and Levelt, P. F.: Retrieval of large volcanic SO2 columns from the Aura Ozone Monitoring Instrument: Comparison and limitations, J. Geophys. Res., 112, D24S43, https://doi.org/10.1029/2007JD008825, 2007.
Zhang, Y., Li, C., Krotkov, N. A., Joiner, J., Fioletov, V., and McLinden, C.: Continuation of long-term global SO2 pollution monitoring from OMI to OMPS, Atmos. Meas. Tech., 10, 1495–1509, https://doi.org/10.5194/amt-10-1495-2017, 2017.
Zhang, Y., Gautam, R., Zavala-Araiza, D., Jacob, D. J., Zhang, R., Zhu, L., Sheng, J., and Scarpelli, T.: Satellite-observed changes in Mexico's offshore gas flaring activity linked to oil/gas regulations, Geophys. Res. Lett., 3, 1879–1888, https://doi.org/10.1029/2018gl081145, 2019.
Zhu, Y., Toon, O. B., Kinnison, D., Harvey, V. L., Mills, M. J., Bardeen, C. G., Pitts, M., Bègue, N., Renard, J. B., Berthet, G., and Jégou, F.: Stratospheric aerosols, polar stratospheric clouds, and polar ozone depletion after the Mount Calbuco eruption in 2015, J. Geophys. Res., 123, 12308–12331, https://doi.org/10.1029/2018JD028974, 2018.