the Creative Commons Attribution 4.0 License.
the Creative Commons Attribution 4.0 License.
An update of data compilation on the biological response to ocean acidification and overview of the OA-ICC data portal
Patrick Brockmann
Carolina Galdino
Uwe Schindler
Frédéric Gazeau
The number of studies investigating the effects of ocean acidification on marine organisms and communities increases every year. Results are not easily comparable since the carbonate chemistry and ancillary data are not always reported in similar units and scales and are not calculated using similar sets of constants. To facilitate data comparison, a data compilation hosted by the PANGAEA Data Publisher was initiated in 2008 and is updated on a regular basis (https://doi.org/10.1594/PANGAEA.962556; Ocean Acidification International Coordination Centre (OA-ICC), 2023). By November 2023, a total of 1501 datasets (over 25 million data points) from 1554 papers had been archived. To easily filter and access relevant biological response data from this compilation, a user-friendly portal (https://oa-icc.ipsl.fr, last access: 9 November 2023) was launched in 2018. Here, we present an update of this data compilation since its second description by Yang et al. (2016) and provide an overview of the OA-ICC portal for ocean acidification biological response data, launched in 2018. Most of the study sites from which data have been archived are in the North Atlantic Ocean, North Pacific Ocean, South Pacific Ocean, and Mediterranean Sea, while polar oceans are still relatively poorly represented. Mollusca and Cnidaria are still the best-represented taxonomic groups. The biological processes most reported in the datasets are growth and morphology. Other variables that can potentially be affected by ocean acidification and are often reported include calcification/dissolution, primary production/photosynthesis, and biomass/abundance. The majority of the compiled datasets have considered ocean acidification as a single stressor, but their relative contribution has decreased from 68 % before 2015 to 57 % today, showing a clear tendency towards more data archived from multifactorial studies.
- Article
(2489 KB) - Full-text XML
-
Supplement
(476 KB) - BibTeX
- EndNote
Ocean acidification refers to the change in seawater chemistry, such as an increase in the partial pressure of carbon dioxide (pCO2) and dissolved inorganic carbon as well as a decrease in pH and the saturation state of seawater with respect to calcium carbonate arising from the uptake of excess anthropogenic CO2 by the ocean (Orr et al., 2005; Feely et al., 2004; Gattuso et al., 2014). These changes will impact marine organisms and communities and will alter marine ecosystems in ways that are still under active investigation (Kroeker et al., 2013; Doney et al., 2020).
The number of papers addressing biological responses to ocean acidification grew exponentially from 2004 to 2022 (25 and 465 papers per year, respectively) (Gattuso and Hansson, 2011; Ocean Acidification International Coordination Centre (OA-ICC) bibliographic database, http://www.tinyurl.com/oaicc-biblio, last access: 9 November 2023). However, results are not always easily comparable since data are either not publicly available or archived in different data repositories in varying formats. Furthermore, carbonate chemistry and ancillary data are not always reported in similar units and scales and are not calculated using similar sets of constants. In response to this problem, a data compilation hosted by PANGAEA Data Publisher for Earth & Environmental Science (Felden et al., 2023) was initiated by the European Network of Excellence for Ocean Ecosystems Analysis (EUR-OCEANS) and the first large-scale European Project on Ocean Acidification (EPOCA) in 2008 (Nisumaa et al., 2010) and has been maintained within the framework of the International Atomic Energy Agency (IAEA) project OA-ICC in collaboration with Xiamen University and the Laboratoire d'Océanographie de Villefranche (LOV), France, since 2013. The goal of this data compilation is to ensure the archiving and streamlining of data on the biological response to ocean acidification (and other environmental drivers) from published articles, as well as to provide easy access to the data for all users. To easily filter and access relevant biological response data from this compilation, a user-friendly portal (https://oa-icc.ipsl.fr, last access: 9 November 2023) was launched in 2018. Between April 2012 and November 2023, datasets in the OA-ICC data compilation were viewed by users 12 684 times and downloaded 5466 times. We report here on the updates of this data compilation since its second description by Yang et al. (2016) and provide an overview of the OA-ICC portal for ocean acidification biological response data that was created a few years ago.
The compilation process described in Nisumaa et al. (2010) and Yang et al. (2016) was followed to maintain consistency. In brief, published papers focused on the biological response to ocean acidification are identified by searching the OA-ICC news stream (http://news-oceanacidification-icc.org/, last access: 9 November 2023) or through the OA-ICC bibliographic database for older papers. Data are extracted directly from tables or figures in these papers or downloaded from other data repositories, such as the Biological and Chemical Oceanography Data Management Office (BCO-DMO; https://www.bco-dmo.org/, last access: 26 April 2023), the British Oceanographic Data Centre (BODC; https://www.bodc.ac.uk/, last access: 5 May 2023), and the Australian Antarctic Data Centre (AADC; https://data.aad.gov.au/, last access: 18 May 2023). Data not readily available in the papers or other data repositories are requested from the authors by email. Data are not archived without the approval of the authors. Authors are also asked to fill in a quick survey (https://goo.gl/forms/qoBzcBkApTF9UJus2, last access: 9 November 2023) in order to help the data curator choose the proper keywords to be used in the data portal (see Sect. 3). Data from papers that report fewer than two carbonate chemistry parameters are not included in the compilation. As part of the effort, the carbonate system variables are recalculated in a consistent way (see Nisumaa et al., 2010). Authors are always contacted to quality-check their datasets before archiving. Each dataset has a citable DOI and is publicly available on PANGAEA.
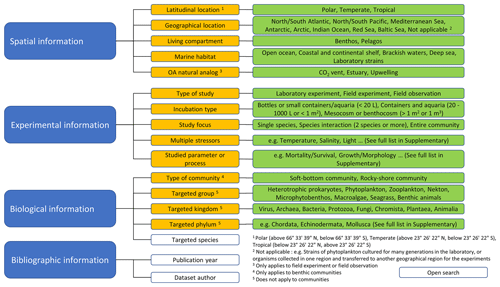
In order to facilitate data selection in the database and therefore allow users to filter the compiled information based on their research needs, there was a strong need to improve the way datasets are categorized. Building on community input that was received during the 2016 International Symposium on Ocean in a High-CO2 World in Hobart, Australia, and the SOLAS-IMBeR Ocean Acidification working group (https://imber.info/science/regional-programmes-working-groups/ocean-acidification-sioa/, last access: 9 November 2023), a set of keywords was established in collaboration with experts in the field and added to the datasets included in the compilation. The keywords were designed to ensure that users are able to search and extract the datasets of interest, ultimately facilitating data comparison and synthesis. The list of categories and their associated keywords is shown in Fig. 1.
The data portal was launched in 2018 and has been updated on a monthly basis since then. The data portal allows users to filter datasets according to their research interests and provides a page presenting the user instructions. Briefly, users have the possibility of filtering datasets based on keywords grouped into three categories: spatial information, experimental information, and/or biological information. In the “Filter datasets” tab, users have access to bar plots showing the number of datasets tagged with each keyword and in each category. All keywords can be clicked in order to filter the datasets. Furthermore, users can directly select the species of interest using the option “Targeted species” by clicking on their names in the popup menu or entering the species name(s) in the search window. Finally, users can also filter the datasets by publication year and/or dataset author by selecting the years or author names from the popup menu or entering year/author name in the search window.
The number of selected results displays close to the “Selection” tab. Once selection has been finalized, matching datasets can be downloaded from this page as a single compressed file on the user's local drive. The included data files can be opened using a text editor or any spreadsheet program such as Excel or OpenOffice.
A list of papers included or not included in this database is provided in the “Included/not included papers” tab, showing the full citations of these papers as well as clickable DOIs (when available) and the DOIs of the corresponding datasets on PANGAEA (when archived). The process to generate this list is as follows: (1) a file shared with the OA-ICC bibliographic database team indicates if data from new papers were archived or not; (2) corresponding DOI and keywords are added to the bibliographic database (OAICCdb for papers from which data were archived – only for these papers is a unique DOI/PANGAEA number allocated, OAICCnoanswer when data could not be retrieved, OAICCincomplete when fewer than two parameters of the carbonate chemistry are provided, and OAICCdatalost when data were lost); and (3) an extraction of the bibliographic dataset following the selection of these keywords and an update of the publication list on the OA-ICC data portal are performed on a quarterly basis.
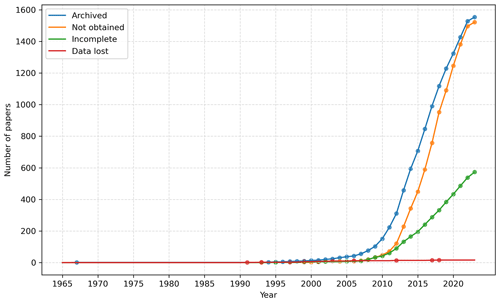
Figure 2Cumulative number of papers for which data have been included in the compilation (Archived), papers for which data could not be obtained (Not obtained), papers which reported fewer than two carbonate system parameters (Incomplete), and papers for which the data have been lost (Data lost). The x axis corresponds to the publication year.
Until now (2008–2023), 3665 relevant papers have been identified. A total of 1501 datasets (over 25 million data points) were archived from 1554 of these papers. Data from companion papers can be combined into a single dataset (e.g. https://doi.org/10.1594/PANGAEA.942466, Gazeau et al., 2021), which explains the discrepancy between the number of papers and datasets. Data of the remaining 2111 papers could not be added to the compilation for the following reasons: (1) fewer than two carbonate system parameters were measured in 573 papers, preventing the calculation of the carbonate chemistry; (2) data from 1522 papers could not be obtained from the authors; and (3) data from 16 papers were lost by the authors (Fig. 2).
The earliest data included in the compilation were published in 1967 (Traganza, 1967). No data from the papers published during the period 1968–1993 could be archived because data were lost or could not be obtained from the authors. Data from 41 papers published between 1994 and 2006 were archived. The quantity of data archived for a given year follows the increase in the publication rate of biological response papers, with data from 13 papers being archived for 2007 to 147 papers for 2013. On average, during the period 2014–2022, data from 118 papers were archived each year. Data from 1015 papers (68 % of the total number included in the compilation) have been archived since the last update presented in Yang et al. (2016).
In order to produce the figures presented in the following sections, keywords describing the geographical location, study focus, targeted phylum, studied parameter or process, and multiple stressors were extracted from datasets for further analyses. Information on the country/region of affiliation of the first author was retrieved from the companion OA-ICC bibliographic database. Finally, the pair of carbonate system variables that was used for computations with the seacarb package is identified by Carbonate System Computation (CSC) flags (Table 1 in Nisumaa et al., 2010). These flags were used to investigate the percentage of datasets considering a certain pair of the carbonate system variables. All Python notebooks that were used to create the different figures of this article are publicly available (https://doi.org/10.5281/zenodo.8366844, Brockmann, 2023).
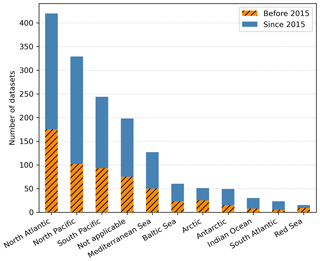
Figure 3Geographical coverage of datasets included in the OA-ICC data compilation compared to those archived prior to 2015.
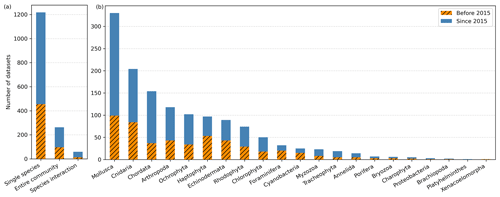
Figure 4(a) Study focus and (b) taxonomic coverage of datasets included in the OA-ICC data compilation compared to those archived prior to 2015.
4.1 Geographical coverage
In the OA-ICC data compilation, the location of study sites indicates where the studied organisms were collected or the location of the natural communities investigated. If the geographical region was not clearly indicated in the paper or organism (or organisms) is no longer considered representative of the study area, e.g. strains of phytoplankton cultured for many generations in the lab or organisms collected in one region and transferred to another geographical region for the experiments, datasets are categorized as Not applicable, which comprises 198 datasets (13 % of the total number of datasets; Fig. 3). The best-covered geographical areas are the North Atlantic Ocean, North Pacific Ocean, South Pacific Ocean, and Mediterranean Sea (420, 329, 244, and 127 datasets, respectively). The Baltic Sea, Arctic Ocean, Antarctic Ocean, Indian Ocean, South Atlantic Ocean, and Red Sea collectively represent only 15 % of the datasets. Although more data of studies performed in the Antarctic (34 datasets) and the Arctic (26 datasets) have been archived since 2015, polar oceans are still relatively poorly represented in the data compilation considering their strong vulnerability to ocean acidification (Orr et al., 2005; Steinacher et al., 2009).
4.2 Taxonomic coverage
Most of the studies from which datasets were archived investigated the impact of ocean acidification on single species (1218 datasets), while relatively few considered entire communities (262) and species interaction (59; Fig. 4a). Mollusca (330 datasets, 22 % of total datasets) and Cnidaria (204, 14 %) are the best-represented taxonomic groups (Fig. 4b). A total of 117 datasets on Chordata have been archived since 2015, increasing the relative number from 7 % to 10 %. Arthropoda (118), Ochrophyta (102), and Haptophyta (97) are also well represented, followed by Echinodermata (89), Rhodophyta (74), and Chlorophyta (50). The number of datasets concerning Foraminifera, Cyanobacteria, Myzozoa, Tracheophyta, Annelida, Porifera, Bryozoa, Charophyta, Proteobacteria, Brachiopoda, Platyhelminthes, and Xenacoelomorpha is relatively low (1–32 datasets).
4.3 Biological processes
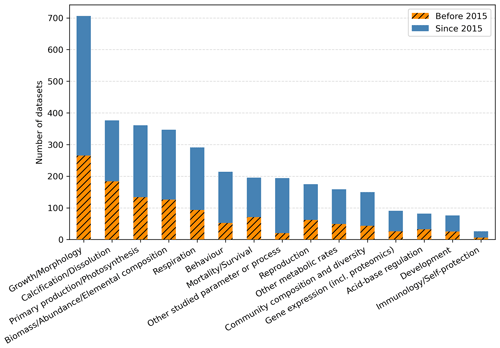
The biological processes most reported in the datasets were growth and morphology (706 datasets, 47 % of total datasets; Fig. 5). Other variables that can potentially be affected by ocean acidification and are often reported include calcification/dissolution (376, 25 %), primary production/photosynthesis (361, 24 %), biomass/abundance/elemental composition (347, 23 %), respiration (291, 19 %), behaviour (214, 14 %), mortality/survival (195, 13 %), reproduction (175, 12 %), and community composition and diversity (150, 10 %). The data compilation also comprises datasets reporting on biological variables categorized as other metabolic rates and other studied parameters or processes (159 and 194 datasets, respectively). The first category comprises processes such as nitrogen fixation, ammonia excretion, and enzyme activities, while the second comprises variables/processes such as mechanical properties, bleaching, and isotopic fractionation (see the detailed description of keywords in the Supplement). Some datasets have also reported on variables such as gene expression (including proteomics), acid–base regulation, development, and immunology/self-protection (26–91 datasets). Calcification/dissolution is less represented today (25 %) than it was before 2015 (33 %), indicating that the initial imbalance (of considerably more datasets on calcification than on other processes) has further improved.
4.4 Multiple factors
The majority of the compiled datasets have considered ocean acidification as a single stressor, but their relative contribution has decreased from 68 % before 2015 (Yang et al., 2016) to 57 % today, showing a clear tendency towards more data archived from multifactorial studies. The other main factors studied in addition to ocean acidification are temperature (370 datasets, 25 %), light (99 datasets, 6 %), and macro-nutrients (62 datasets, 4 %; Fig. 6). Relatively few studies for which data were archived have reported on multi-stressor studies, including oxygen, inorganic toxins, salinity, micro-nutrients, and organic toxins (9–39 datasets). There are 111 datasets that have also reported on the combined effect of changes in carbonate chemistry with other factors, such as food supply, water flow, calcium ion concentration, and presence/absence of the predator cue.
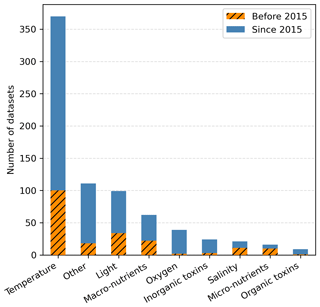
Figure 6Datasets of papers that have manipulated the carbonate chemistry as well as other variables.
4.5 Countries/regions of first-author affiliation
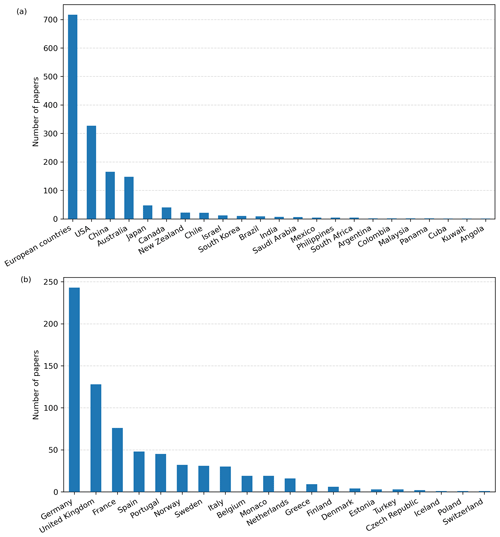
Based on first-author affiliation, a total of 47 countries/regions contributed to the papers from which data were archived. The largest number of papers originates from European countries (717 papers, 46 %; Fig. 7a). Within Europe, most of the papers were published by German and UK scientists (243 and 128 papers, respectively; Fig. 7b). USA (327 papers, 21 %), China (165 papers, 11 %), and Australia (147 papers, 9 %) also significantly contribute to the data compilation. During 2011–2023, the total number of papers originating from South American countries increased from 1 (Panama) to 41 (Chile, Brazil, Mexico, Argentina, Colombia, Panama, and Cuba). Data from papers published by scientists from southeast Asia (Malaysia and Philippines) and Africa (South Africa and Angola) were added after the update in Yang et al. (2016).
There are still data from many papers which could not be obtained from the authors. From these missing papers, 82 % are from European countries, USA, Australia, and China (477, 341, 219, and 212 papers, respectively).
4.6 Measured carbonate chemistry variables
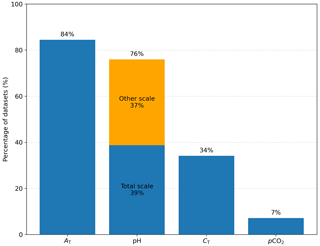
Total alkalinity (AT) is the carbonate chemistry variable that is still the most measured (84 % of the datasets; Fig. 8). Other variables measured include pH (76 %), dissolved inorganic carbon (CT; 34 %), and the partial pressure of carbon dioxide (pCO2; 7 %). Out of the 76 % of datasets that measured pH, 39 % reported pH on the total scale and 37 % reported pH on the National Bureau of Standards (NBS) scale, seawater scale (SWS), or free scale. There is a clear tendency towards more datasets with pH reported on the total scale since 2015 since the ratio of total scale to other scale increased from 0.75 pre-2015 (Yang et al., 2016) to 1.0 today. The pH on the total scale is generally lower than on the NBS/NIST scale and higher than on the SWS scale (Dickson, 2010), which makes the direct comparison of experimental results difficult. In our compilation, all other scales are converted to the total scale as recommended in the Guide to Best Practices in Ocean Acidification Research and Data Reporting (Dickson, 2010).
Access to data presented in this paper is possible at https://doi.org/10.1594/PANGAEA.962556 (Ocean Acidification International Coordination Centre (OA-ICC), 2023). The OA-ICC database extracted from the OA-ICC web portal described previously is originally available from the PANGAEA portal (https://www.pangaea.de/?q=Project:OA-ICC, last access: 9 November 2023) and accessible using Elasticsearch requests such as the following: http://ws.pangaea.de/es/dataportal-oa-icc/pansimple/_search?size=20, last access: 9 November 2023, which makes a simple request to fetch the first 20 datasets' metadata. Metadata harvesting can also be achieved using the Open Archives Initiative Protocol for Metadata Harvesting (OAI-PMH) with a request such as http://ws.pangaea.de/oai/provider?verb=GetRecord&metadataPrefix=pan_md&identifier=oai:pangaea.de:doi:10.1594/PANGAEA.903033 (last access: 9 November 2023).
The compilation of data related to the biological response of marine organisms and communities to ocean acidification (and other drivers) launched in 2008 and pursued during the EPOCA European Project (2008–2012) has continued uninterrupted since then thanks to direct and in-kind contributions from several IAEA member states. The amount of data archived in our database has grown substantially in the last 15 years in keeping with the increase in the number of studies conducted in this field of research. However, while 53 % of the relevant papers could be included in the compilation until 2015, this proportion has dropped significantly in the last 8 years, reaching 42 % until 2023. As mentioned previously, our strategy, when relevant data are not directly available in the published manuscripts (or in the Supplement), is to request datasets from the corresponding authors. Although data curation is a fairly fast process (dataset requests are sent to the authors a few weeks to a few months after publication), it is unfortunately common to have troubles contacting corresponding authors who have changed institutions. This is, most of the time, not unsolvable as finding the email addresses of co-authors is possible but significantly adds to the time and effort required to archive data because receiving data usually requires sending one or more reminders and having several email exchanges with the author to obtain all relevant data and metadata. Adding the contact email of a permanent researcher in the published paper could definitely help optimize the process. Our response rate, although low, is not far from what is typically found in any research field (28 %–56 %; Tedersoo et al., 2021). On very few occasions, authors declined to share their data due to ethical/legal issues or out of concern for misuse. The majority of the time, datasets cannot be collected due to a lack of response from the authors after three reminders. A growing number of journals now request publishing datasets upon acceptance of manuscripts, and we hope this will increase data availability in the coming years.
The compiled database highlights the increase in studies not only focusing on ocean acidification but also including other relevant environmental drivers. Since, to the best of our knowledge, no efforts at the international level have been made to compile all relevant data on the marine biological response to some of the most studied environmental drivers, i.e. ocean warming and deoxygenation (e.g. Alter et al., 2024; Sampaio et al., 2021), a desirable evolution of our database in the coming years would be to include these studies and corresponding datasets in the same way we have been collecting data on ocean acidification since 2008.
Since the last description of the OA-ICC database (Yang et al., 2016), the geographical coverage of compiled datasets did not significantly change, with a clear under-representation of the Southern Hemisphere and polar regions still present. The last International Symposium on the Ocean in a High-CO2 World organized in Lima (Peru) in 2022 demonstrated growing activity in southern countries, especially from South America, in this field of research that will undoubtedly help fill this gap in the coming years. Conducting research in polar regions is obviously more difficult in such harsh and remote environments and requires strong international cooperation, extended planning horizons, sizable budgets, and long-term investment (Figuerola et al., 2021). However, as the rate at which seawater is acidifying and warming is much higher in these regions than anywhere in the global ocean, there is a strong need to substantially increase our research efforts in these threatened environments.
All Python notebooks that gather the web scraping, metadata harvesting, and the processing codes used to create the different figures of this article are publicly available. Those notebooks are embedded in a Jupyter binder container that allows anyone to run and inspect the different scripts. They are published on the Zenodo repository with the following DOI: https://doi.org/10.5281/zenodo.8366844 (Brockmann, 2023).
The supplement related to this article is available online at: https://doi.org/10.5194/essd-16-3771-2024-supplement.
FG is the OA-ICC focal point for data management. YY is the data curator for the OA-ICC data compilation. PB maintained and updated the OA-ICC data portal. CG maintained the OA-ICC bibliographic database. US provided the usage statistics of this data compilation. All authors contributed to the paper.
At least one of the (co-)authors is a member of the editorial board of Earth System Science Data. The peer-review process was guided by an independent editor, and the authors also have no other competing interests to declare.
Publisher's note: Copernicus Publications remains neutral with regard to jurisdictional claims made in the text, published maps, institutional affiliations, or any other geographical representation in this paper. While Copernicus Publications makes every effort to include appropriate place names, the final responsibility lies with the authors.
This effort was initiated by Jean-Pierre Gattuso, Laboratoire d'océanographie de Villefranche (CNRS/SU), France, as part of the EU projects EUR-OCEANS and EPOCA. We would like to thank previous or current contributors to the data compilation – namely, Olga Anghelici, Frank Graba, Ashley Bantelman, Trevor Eakes, Marine Lebrec, Lina Hansson (funding through OA-ICC), Anne-Marin Nisumaa (funding through EPOCA and OA-ICC), and Nassim Taalba (funding through EUR-OCEANS). Thank you to the members of the SOLAS-IMBeR Ocean Acidification working group (SIOA) for fruitful discussions. We are grateful to all the authors for the provision of data and to the staff of PANGAEA for the considerable help and support. The International Atomic Energy Agency is grateful to the Government of the Principality of Monaco for the support provided to its IAEA Marine Environment Laboratories.
This work has been funded through the Peaceful Uses Initiatives (PUI) programme as part of the project Ocean Acidification International Coordination Centre (OA-ICC) phase III by the United States, which is implemented at the IAEA Marine Environment Laboratories in Monaco. This study has also been supported by the National Natural Science Foundation of China (grant no. 42188102).
This paper was edited by François G. Schmitt and reviewed by two anonymous referees.
Alter, K., Jacquemont, J., Claudet, J., Lattuca, M. E., Barrantes, M. E., Marras, S., Manríquez, P. H., González, C. P., Fernández, D. A., and Peck, M. A.: Hidden impacts of ocean warming and acidification on biological responses of marine animals revealed through meta-analysis, Nat. Commun., 15, 2885, https://doi.org/10.1038/s41467-024-47064-3, 2024.
Brockmann, P.: PBrockmann/PANGAEA_Scraping: 20231110, Zenodo [code], https://doi.org/10.5281/zenodo.8366844, 2023.
Dickson, A. G.: The carbon dioxide system in seawater: equilibrium chemistry and measurements, in: Guide to best practices for ocean acidification research and data reporting, edited by: Riebesell, U., Fabry, V. J., Hansson, L., and Gattuso, J.-P., Publications Office of the European Union, Luxembourg, 17–40, 2010.
Doney, S. C., Busch, D. S., Cooley, S. R., and Kroeker, K. J.: The Impacts of Ocean Acidification on Marine Ecosystems and Reliant Human Communities, Annu. Rev. Env. Resour., 45, 83–112, https://doi.org/10.1146/annurev-environ-012320-083019, 2020.
Feely, R. A., Sabine, C. L., Lee, K., Berelson, W., Kleypas, J., Fabry, V. J., and Millero, F. J.: Impact of Anthropogenic CO2 on the CaCO3 System in the Oceans, Science, 305, 362–366, https://doi.org/10.1126/science.1097329, 2004.
Felden, J., Moeller, L., Schindler, U., Huber, R., Schumacher, S., Koppe, R., Diepenbroek, M., and Gloeckner, F. O.: PANGAEA-Data Publisher for Earth & Environmental Science, Sci. Data, 10, 347, https://doi.org/10.1038/s41597-023-02269-x, 2023.
Figuerola, B., Valiente, N., Barbosa, A., Brasier, M. J., Colominas-Ciuró, R., Convey, P., Liggett, D., Fernández-Martínez, M. A., Gonzalez, S., Griffiths, H. J., Jawak, S. D., Merican, F., Noll, D., Prudencio, J., Quaglio, F., and Pertierra, L. R.: Shifting Perspectives in Polar Research: Global Lessons on the Barriers and Drivers for Securing Academic Careers in Natural Sciences, Front. Ecol. Evol., 9, 777009, https://doi.org/10.3389/fevo.2021.777009, 2021.
Gattuso, J.-P. and Hansson, L.: Ocean acidification: background and history, in: Ocean acidification, edited by: Gattuso, J.-P. and Hansson, L., Oxford University Press, Oxford, https://doi.org/10.1093/oso/9780199591091.003.0006, 1–27, 2011.
Gattuso, J.-P., Brewer, P. G., Hoegh-Guldberg, O., Kleypas, J. A., Pörtner, H.-O., and Schmidt, D. N.: Ocean acidification, in: Climate Change 2014: Impacts, Adaptation, and Vulnerability, Part A: Global and Sectoral Aspects, Contribution of Working Group II to the Fifth Assessment Report of the Intergovernmental Panel of Climate Change, edited by: Field C. B., Barros V. R., Dokken D. J., Mach K. J., Mastrandrea M. D., Bilir T. E., Chatterjee M., Ebi K. L., Estrada Y. O., Genova R. C., Girma B., Kissel E. S., Levy A. N., MacCracken S., Mastrandrea P. R., and White L. L., Cambridge University Press, Cambridge, United Kingdom and New York, NY, USA, 129–131, https://doi.org/10.1017/CBO9781107415379, 2014.
Gazeau, F., Van Wambeke, F., Marañón, E., Pérez-Lorenzo, M., Alliouane, S., Stolpe, C., Blasco, T., Leblond, N., Zäncker, B., Engel, A., Marie, B., Dinasquet, J., and Guieu, C.: Impact of dust addition on the metabolism of Mediterranean plankton communities and carbon export under present and future conditions of pH and temperature, PANGAEA [data set], https://doi.org/10.1594/PANGAEA.942466, 2021.
Kroeker, K. J., Kordas, R. L., Crim, R., Hendriks, I. E., Ramajo, L., Singh, G. S., Duarte, C. M., and Gattuso, J.-P.: Impacts of ocean acidification on marine organisms: quantifying sensitivities and interaction with warming, Glob. Change Biol., 19, 1884–1896, https://doi.org/10.1111/gcb.12179, 2013.
Nisumaa, A.-M., Pesant, S., Bellerby, R. G. J., Delille, B., Middelburg, J. J., Orr, J. C., Riebesell, U., Tyrrell, T., Wolf-Gladrow, D., and Gattuso, J.-P.: EPOCA/EUR-OCEANS data compilation on the biological and biogeochemical responses to ocean acidification, Earth Syst. Sci. Data, 2, 167–175, https://doi.org/10.5194/essd-2-167-2010, 2010.
Ocean Acidification International Coordination Centre (OA-ICC): Data compilation on the biological response to ocean acidification: 2008-2023, PANGAEA [data set], https://doi.org/10.1594/PANGAEA.962556, 2023.
Orr, J. C., Fabry, V. J., Aumont, O., Bopp, L., Doney, S. C., Feely, R. A., Gnanadesikan, A., Gruber, N., Ishida, A., Joos, F., Key, R. M., Lindsay, K., Maier-Reimer, E., Matear, R., Monfray, P., Mouchet, A., Najjar, R. G., Plattner, G.-K., Rodgers, K. B., Sabine, C. L., Sarmiento, J. L., Schlitzer, R., Slater, R. D., Totterdell, I. J., Weirig, M.-F., Yamanaka, Y., and Yool, A.: Anthropogenic ocean acidification over the twenty-first century and its impact on calcifying organisms, Nature, 437, 681–686, https://doi.org/10.1038/nature04095, 2005.
Sampaio, E., Santos, C., Rosa, I. C., Ferreira, V., Pörtner, H.-O., Duarte, C. M., Levin, L. A., and Rosa, R.: Impacts of hypoxic events surpass those of future ocean warming and acidification, Nat. Ecol. Evol., 5, 311–321, https://doi.org/10.1038/s41559-020-01370-3, 2021.
Steinacher, M., Joos, F., Frölicher, T. L., Plattner, G.-K., and Doney, S. C.: Imminent ocean acidification in the Arctic projected with the NCAR global coupled carbon cycle-climate model, Biogeosciences, 6, 515–533, https://doi.org/10.5194/bg-6-515-2009, 2009.
Tedersoo, L., Küngas, R., Oras, E., Köster, K., Eenmaa, H., Leijen, Ä., Pedaste, M., Raju, M., Astapova, A., Lukner, H., Kogermann, K., and Sepp, T.: Data sharing practices and data availability upon request differ across scientific disciplines, Sci. Data, 8, 192, https://doi.org/10.1038/s41597-021-00981-0, 2021.
Traganza, E. D.: Dynamics of the carbon dioxide system on the Great Bahama Bank, B. Mar. Sci., 17, 348–366, 1967.
Yang, Y., Hansson, L., and Gattuso, J.-P.: Data compilation on the biological response to ocean acidification: an update, Earth Syst. Sci. Data, 8, 79–87, https://doi.org/10.5194/essd-8-79-2016, 2016.


