the Creative Commons Attribution 4.0 License.
the Creative Commons Attribution 4.0 License.
 | 02 Jul 2024
Special Observing Period (SOP) data for the Year of Polar Prediction site Model Intercomparison Project (YOPPsiteMIP)
Taneil Uttal
Elena Akish
Robert Crawford
Laura Huang
Jonathan Day
Johanna Tjernström
Øystein Godøy
Lara Ferrighi
Leslie M. Hartten
Jareth Holt
Christopher J. Cox
Ewan O'Connor
Roberta Pirazzini
Marion Maturilli
Giri Prakash
James Mather
Kimberly Strong
Pierre Fogal
Vasily Kustov
Gunilla Svensson
Michael Gallagher
Brian Vasel
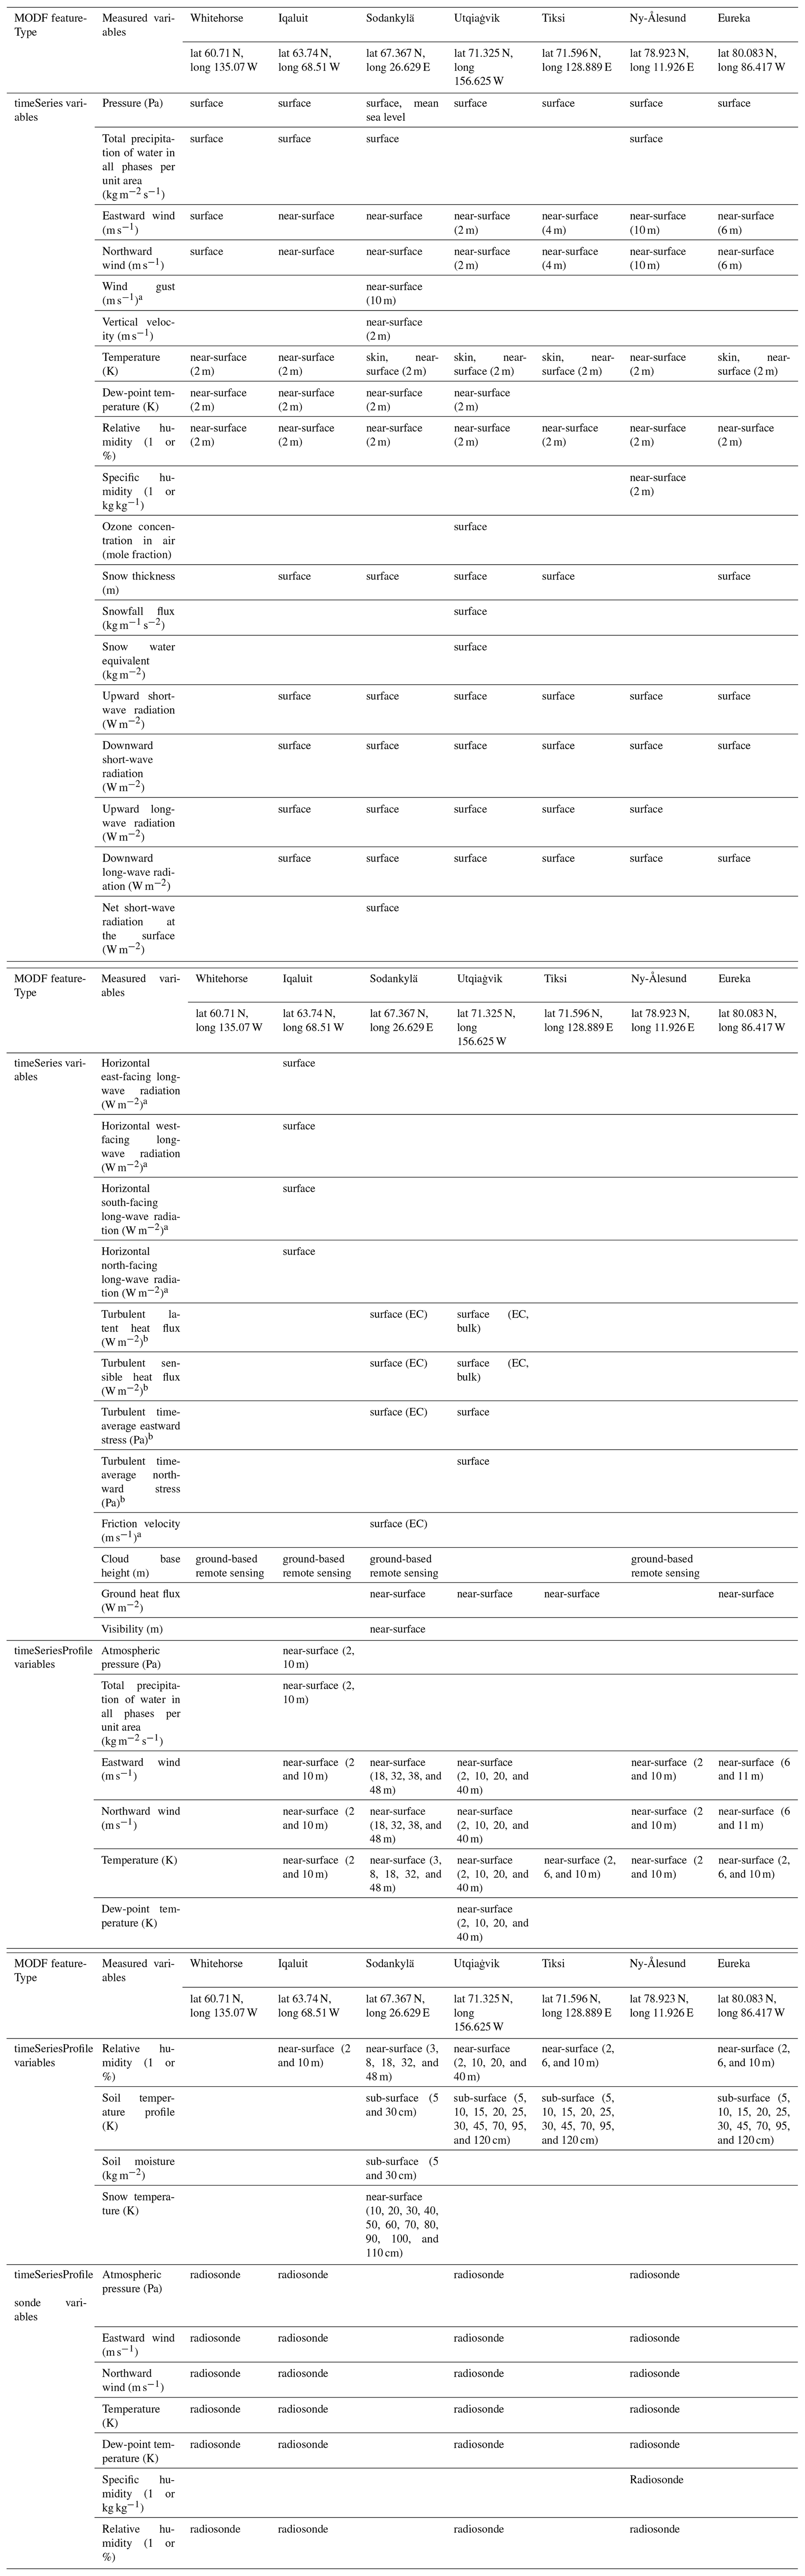
The rapid changes occurring in the polar regions require an improved understanding of the processes that are driving these changes. At the same time, increased human activities such as marine navigation, resource exploitation, aviation, commercial fishing, and tourism require reliable and relevant weather information. One of the primary goals of the World Meteorological Organization's Year of Polar Prediction (YOPP) project is to improve the accuracy of numerical weather prediction (NWP) at high latitudes. During YOPP, two Canadian “supersites” were commissioned and equipped with new ground-based instruments for enhanced meteorological and system process observations. Additional pre-existing supersites in Canada, the United States, Norway, Finland, and Russia also provided data from ongoing long-term observing programs. These supersites collected a wealth of observations that are well suited to address YOPP objectives. In order to increase data useability and station interoperability, novel Merged Observatory Data Files (MODFs) were created for the seven supersites over two Special Observing Periods (February to March 2018 and July to September 2018). All observations collected at the supersites were compiled into this standardized NetCDF MODF format, simplifying the process of conducting pan-Arctic NWP verification and process evaluation studies. This paper describes the seven Arctic YOPP supersites, their instrumentation, data collection and processing methods, the novel MODF format, and examples of the observations contained therein. MODFs comprise the observational contribution to the model intercomparison effort, termed YOPP site Model Intercomparison Project (YOPPsiteMIP). All YOPPsiteMIP MODFs are publicly accessible via the YOPP Data Portal (Whitehorse: https://doi.org/10.21343/a33e-j150, Huang et al., 2023a; Iqaluit: https://doi.org/10.21343/yrnf-ck57, Huang et al., 2023b; Sodankylä: https://doi.org/10.21343/m16p-pq17, O'Connor, 2023; Utqiaġvik: https://doi.org/10.21343/a2dx-nq55, Akish and Morris, 2023c; Tiksi: https://doi.org/10.21343/5bwn-w881, Akish and Morris, 2023b; Ny-Ålesund: https://doi.org/10.21343/y89m-6393, Holt, 2023; and Eureka: https://doi.org/10.21343/r85j-tc61, Akish and Morris, 2023a), which is hosted by MET Norway, with corresponding output from NWP models.
- Article
(6350 KB) - Full-text XML
- BibTeX
- EndNote


In the Arctic, there is a recognized lack of process-level information supplementing meteorological observations to characterize the atmosphere and the cryosphere for operational forecasting (Cassano et al., 2011; Illingworth et al., 2015; Lawrence et al., 2019). As the climate continues to change, information on weather and climate is becoming more critical for ensuring the health and safety of local communities. Unfortunately, climate models do a poor job of capturing key features of the Arctic climate, such as the Arctic amplification factor, likely as a result of inaccurate representation of key physical processes, as shown by Rantanen et al. (2022). Similarly, the accuracy of weather forecasts in the polar regions is also lower than in mid-latitudes (Jung et al., 2016), partly due to the scattered and limited availability of observing networks (Lawrence et al., 2019). Advances in polar weather forecast prediction are expected to improve weather forecasts and climate predictions elsewhere (Jung et al., 2016; Day et al., 2019), but understanding the causes of poor model performance in the Arctic is limited by the availability of observatory data. Data from observatories, where sometimes hundreds of parameters are measured, are needed for detailed investigations into the cause of model error, such as boundary-layer processes and turbulent exchanges (e.g., Day et al., 2023).
To address the need to improve numerical weather prediction (NWP) performance in the polar regions, the World Meteorological Organization (WMO) launched the international Polar Prediction Project with its flagship activity, the Year of Polar Prediction (YOPP). During YOPP's core phase, from mid-2017 to mid-2019, several intensive observing periods were conducted with close coordination between the international network of polar observatories and weather forecast centres. The aim was to produce highly concentrated sets of observed and modelled data for supporting forecast evaluation and process studies (Koltzow et al., 2019; Goessling et al., 2016; Jung et al., 2016).
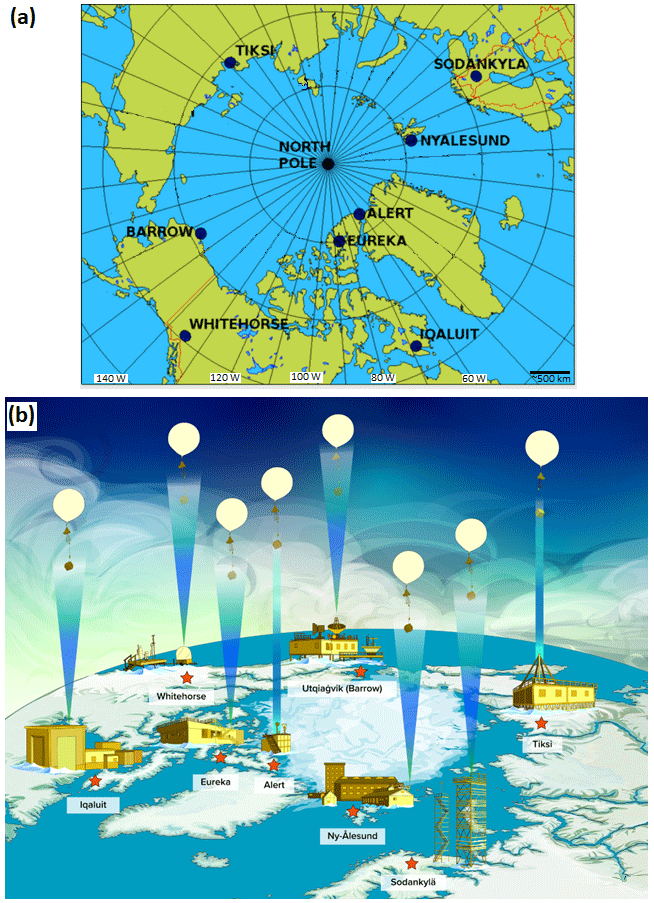
Figure 1(a) Locations of the MODFysm YOPP supersites (Antarctic sites not shown). (b) Infographic depicting iconic building(s) at each site. The infographic is roughly centred around the North Pole (centre). All locations shown have generated a MODFysm, with the exception of Alert (in progress).
One of the flagship activities of YOPP was the YOPP site Model Intercomparison Project (YOPPsiteMIP), an initiative to assess the performance of NWP systems at the process level by comparing with observatory data (Day et al., 2023). To achieve this, a dataset of weather forecasts was produced by various NWP centres for “supersite” locations. In the Arctic, the dataset covers two Special Observing Periods (SOPs), SOP1 (1 February–31 March 2018) and SOP2 (1 July–30 September 2018). During this period, the number of routine observations (e.g., radiosonde launches and buoy deployments) was enhanced in the Arctic (doubled in the case of radiosondes), field campaigns were conducted, and enhanced observations were taken from the designated YOPP supersite observatories. In general, the suite of several additional instruments that enables an enhanced measurement program, including remote sensing, radiation, and other meteorological sensors, is what distinguishes a supersite from a typical weather site. This paper documents the efforts to compile the supersite (hereafter referred to as “sites”) data collected during this period as part of the YOPPsiteMIP. These sites (Fig. 1) are distributed over a diverse range of geographical locations, capturing some of the diversity in the terrestrial high-latitude climate zones.
Prior to YOPP, data collection, processing, geophysical variable reporting cadences, and file output type and format were not standardized across the sites, which are operated by different international agencies and consortiums. This lack of interoperability made performing multi-site comparisons, evaluations, and process studies difficult and time-consuming, deterring potential users of the data (Wohner et al., 2022). In order to address this problem, the concept of standardized Merged Observatory Data Files (MODFs) was developed as part of the YOPPsiteMIP (Uttal et al., 2023). This concept is based on combining measurements from multiple international research observatories' instruments into a single NetCDF file that complies with established data management standards. Prior to MODFs, there generally existed no standardized procedures for coordinated data management at these research sites, such as those that have been developed for operational datasets. Thus, the data from these sites' separate instruments were scattered between separate files with different authors, formats, metadata, post-processing techniques, physical archive locations, and requirements for usage. As such, they could not be amalgamated to provide a pan-Arctic observational dataset.
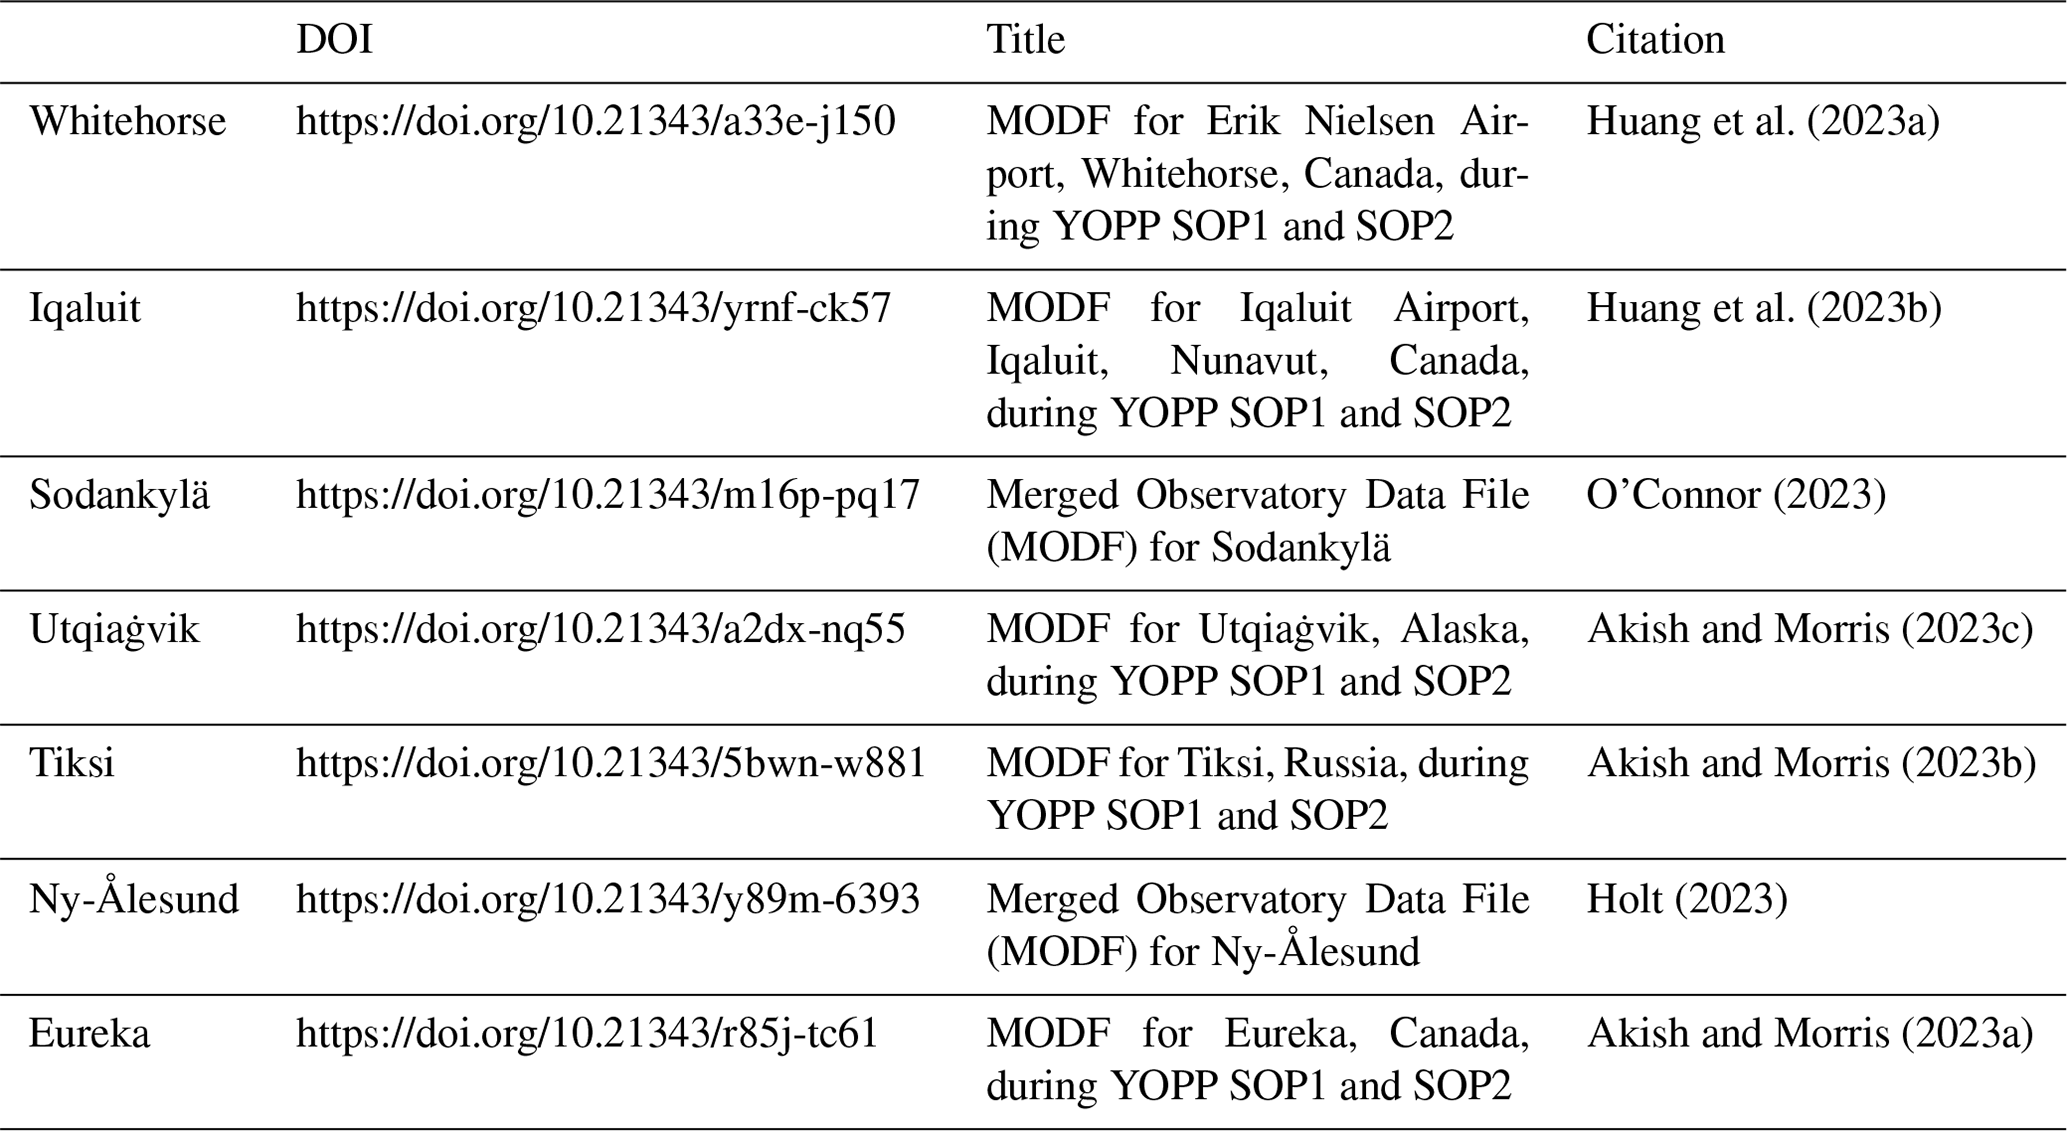
Table 1List of facility coordinates for locations where MODFysm measurements were collected at each site. The measured variables that are observed at each site are listed (refer to Table 3). In some cases, the same variable is measured at multiple locations for a single site; these observations and their corresponding coordinates are embedded within the MODF. All refers to the entire list of the measured variables in Table 3, whereas All radiation refers to all radiation-related measured variables.
MODF files bring together observations from different Earth system components in a standardized NetCDF file format to enable the utilization of research-grade, process-level observations for model evaluation and parameterization development. At the same time, MODFs are compatible with and mirror Merged Model Data Files (MMDFs) that are produced by each NWP centre participating in YOPP (Day et al., 2023). Each geophysical variable observed at a site is matched to its corresponding NWP model geophysical variable using a standardized data format, cadence, and file structure. Uttal et al. (2023) provide a generalized overview for the content and data structure of MODFs, i.e., a single NetCDF data file containing measurements from multiple sources, and a series of tools to facilitate their creation. Table 1 provides information regarding the on-site facility location where measurements were collected and their coordinates for reference. For some sites (e.g., Sodankylä), certain geophysical variables are measured at multiple locations; these are all reported in the MODF with their corresponding measurement coordinates embedded within the file so as to distinguish each measurement. Final DOIs for the MODFyms are listed in Table 2.
The MODF's standardized file structure directly aligns with the NWP's MMDFs. Thus, MODFs easily facilitate observation–model comparisons at any/all of the seven sites (Gallagher and Tjernström, 2024). The purpose of the present work is to describe the construction and contents of MODFs for seven of the YOPP-designated Arctic sites during SOP1 and SOP2 (hereafter MODFysm): Whitehorse, Canada (60.71° N, 135.07° W; 682 m a.s.l.); Iqaluit, Canada (63.74° N, 68.51° W; 11 m a.s.l.); Sodankylä, Finland (67.367° N, 26.629° E; 179 m a.s.l.); Utqiaġvik (Barrow), Alaska (71.325° N, 156.625° W; 8 m a.s.l.); Tiksi, Russia (71.596° N, 128.889° E; 30 m a.s.l.); Ny-Ålesund, Norway (78.923° N, 11.926° E; 15 m a.s.l.); and Eureka, Canada (80.083° N, 86.417° W; 89 m a.s.l.). Methods used to organize a site's dataset and develop MODFs are provided. Each site's instrumentation and data processing are also described in this work to provide users with additional context and information about the source of the geophysical variables contained in the MODF. MODFs' counterpart, MMDFs, are described in Uttal et al. (2023).
Creating a standardized dataset such as MODF that contains observations from different meteorological and research agencies' sites is an extremely complex, non-trivial task. For the sake of brevity and to reduce redundancy, this paper references site- or instrument-specific publications in order to fully describe all of the aspects of the MODF dataset, including instrumentation, quality control (QC), and processing techniques. In the case where non-trivial aspects of the MODF data arise, the data's origin, reference publications (e.g., dataset DOIs), and site contacts have been provided. Section 2 describes the data processing chain conducted at each site, including information about the site's local topography, climate, and instrumentation, in order to provide site-specific context to aid the interpretation of model–observation comparisons. Section 3 describes the instrumentation and calculated variables. Section 4 describes the standardized MODF dataset file format, QC, and post-processing, which in some cases differed slightly from site to site. Section 5 describes the MODF data structure, attributes, and example figures that illustrate the available dataset. Data availability is provided in Sect. 6, code availability is provided in Sect. 7, and concluding remarks are provided in Sect. 8.
Table 3List of the geophysical variables currently included in each site's MODF. Note that this table only includes variables that are currently in the existing MODFysm and does not indicate the complete list of variables that are observed at each site. Superscript a denotes a variable not included in the H–K table (Hartten and Khalsa, 2022) and superscript b denotes a calculated variable. The level and type(s) of additional processing for the heat fluxes are also provided, where EC stands for eddy covariance and bulk for bulk method.
a A variable not included in the H–K table. b A calculated variable (not a direct observation).
Site descriptions are provided to properly contextualize and interpret the observations contained within the MODF. Fig. 1 shows a map of the distribution of the sites. While all sites are also designated surface synoptic observation (SYNOP) stations, the meteorological data provided in the MODFs are significantly more detailed and include additional geophysical variables and thus are not the same as the SYNOP data. Table 3 lists the geophysical variables observed at each site that are stored in the standardized MODF format, their measurement location(s), and other attributes; the MODF featureType corresponds to the type of geophysical variable being observed at each site (they are split up into broad categories). Note that all radiation sensor footprints are ∼0.2 m in diameter and have a dome of ∼5 cm in diameter.
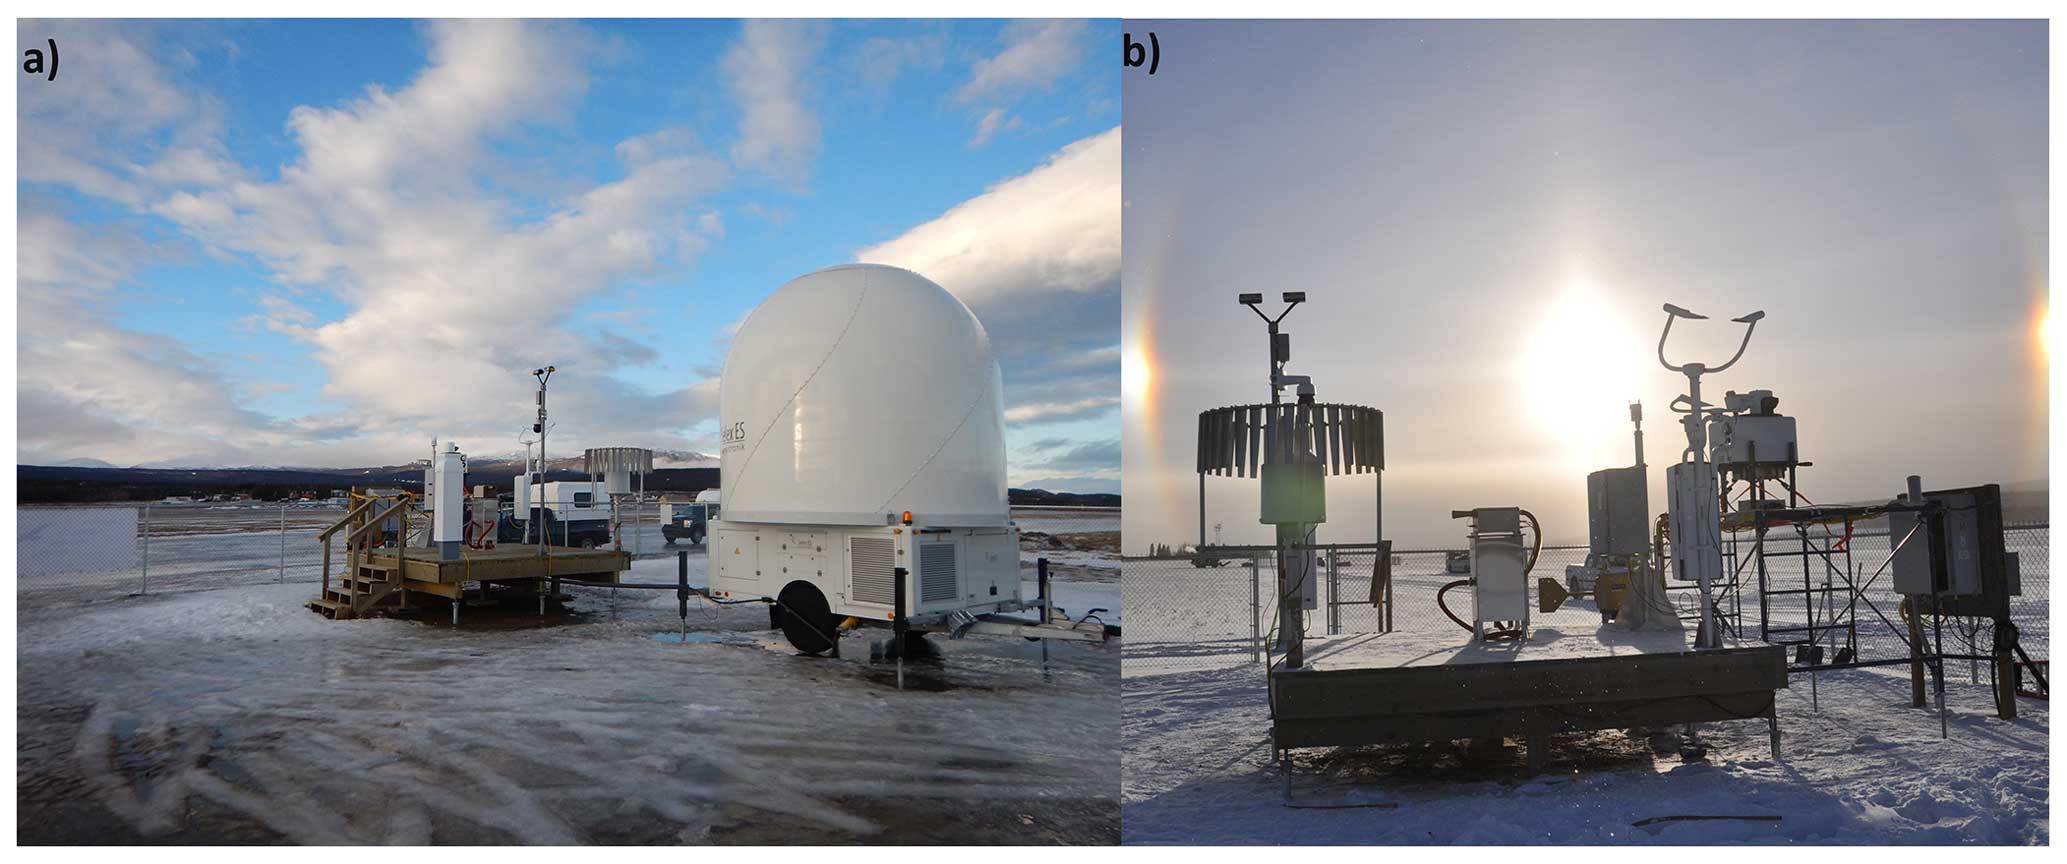
Figure 2The Whitehorse site and the surrounding airfield in early spring 2018 with an X-band radar (white dome) in the foreground (a) and the main instrument platform, including a Pluvio2, Parsivel, FS11P, WXT520, and CL51 ceilometer (from left to right), with a sundog in the background (b). Photos adapted from Fig. 5 in Mariani et al. (2022).
2.1 Whitehorse, Canada
The Whitehorse site (Fig. 2) was commissioned as part of the Canadian Arctic Weather Science (CAWS) project (Mariani et al., 2018; Joe et al., 2020). CAWS was initiated to evaluate upper-air-observing technologies that can complement and improve polar forecasts and perform satellite calibration/validation over Arctic terrain and to provide recommendations to optimize the Canadian Arctic observing network. The site's instruments (Fig. 2 and Table A1) are installed on an elevated platform, all within a few metres of each other. The site is located at the Erik Nielsen Whitehorse International Airport, which is situated on a plateau ∼50 m above the rest of the city. The city is located in a valley between the Yukon Ranges to its west (∼1.6 km a.s.l.) and east (∼1.4 km a.s.l.); this complex mountainous terrain strongly influences the weather systems that reach Whitehorse, which mostly originate from the eastern Pacific or over Alaska.
Whitehorse experiences cold to temperate average monthly temperatures ranging from −15 to 14 °C (annual mean of −2 °C) and average monthly precipitation ranging from 7 to 38 mm (annual total of ∼500 mm). Since the city is in the rain shadow of the Coast Mountains, precipitation totals are relatively low year-round. The primary surface wind direction follows the valley (NNW). The soil type at and around the site is a mixture of grained alluvial and colluvial slopes and, as part of the Boreal Cordillera ecozone, the surface type is primarily boreal forest, including complex plateaus, mountains, valleys, and Cordilleran vegetation. With a population greater than 26 000 inhabitants, Whitehorse is the primary gateway for air traffic for all of the Yukon, parts of Alaska, and the western Canadian Arctic. During the YOPP SOPs, radiosondes were launched four times daily.
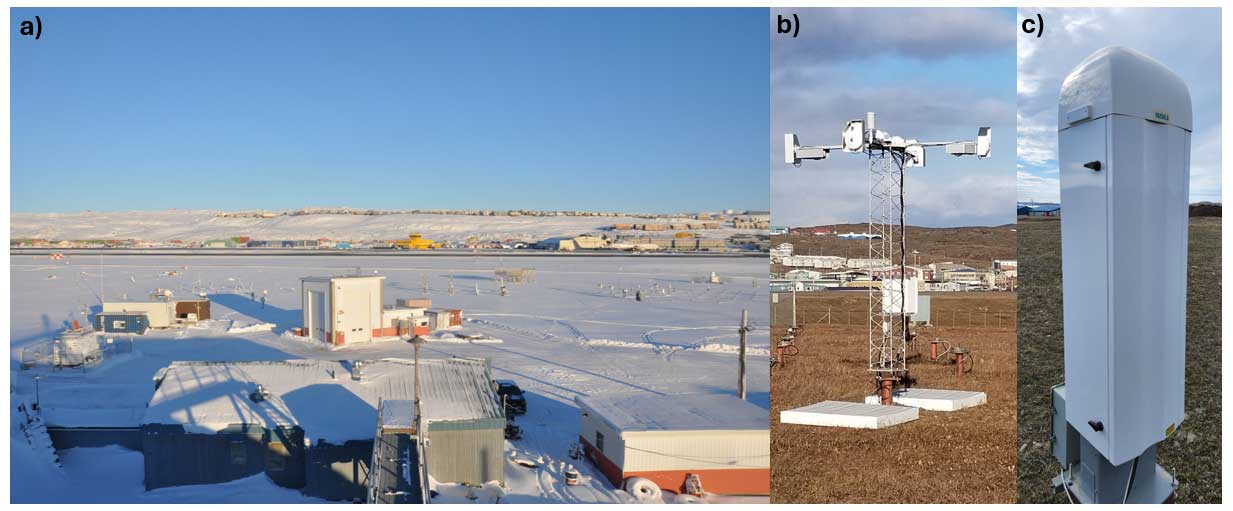
Figure 3The Iqaluit site surroundings taken in winter 2018 with the Iqaluit airport in the background (a), the radiation flux sensor suite during the summer, consisting of several CMP10Ls, CGR4Ls, and SR50As (b), as well as the CL51 ceilometer during the summer (c). Photos adapted from Fig. 2 in Mariani et al. (2022).
2.2 Iqaluit, Canada
Like Whitehorse, the Iqaluit site (Fig. 3) was commissioned as part of the CAWS project (Mariani et al., 2022). The site is located ∼200 m from the airport runway, and all instruments (Fig. 3 and Table A2) are co-located within no more than 140 m of each other on flat terrain. The city itself is located along the coast in a valley that runs from the NW to SE direction; thus, the primary direction of surface winds, which are frequently severe (>15 m s−1), follows this direction. The surrounding region is a relatively flat Arctic tundra, except for nearby hills (∼300 m a.s.l.) approximately 2 km to the NE of the site.
Iqaluit experiences an extreme range of average monthly temperatures ranging from −28 to 8 °C (annual mean of −9 °C) and average monthly precipitation ranging from 18 to 70 mm (annual total of ∼460 mm). The soil type at and around the site is cryosolic, and the surface type is ∼70 % tundra and ∼30 % ocean within a 10 km radius of the site. Most storm tracks that reach Iqaluit originate over the western Canadian Arctic or the prairies; these storms can produce strong easterly winds, which frequently cause blowing snow that severely reduces visibility during non-summer months. Given the site's proximity to Frobisher Bay (<600 m), the site is influenced by sea surface conditions during onshore flow (NW). Co-located instrument evaluation studies were conducted for several remote sensing and upper-air observations (Mariani et al., 2020, 2021), including preliminary model verification studies during the YOPP SOPs and beyond. Iqaluit has over 8000 inhabitants and is the primary gateway for air and sea traffic for the central and eastern Canadian Arctic. During the YOPP SOPs, radiosondes were launched four times daily.
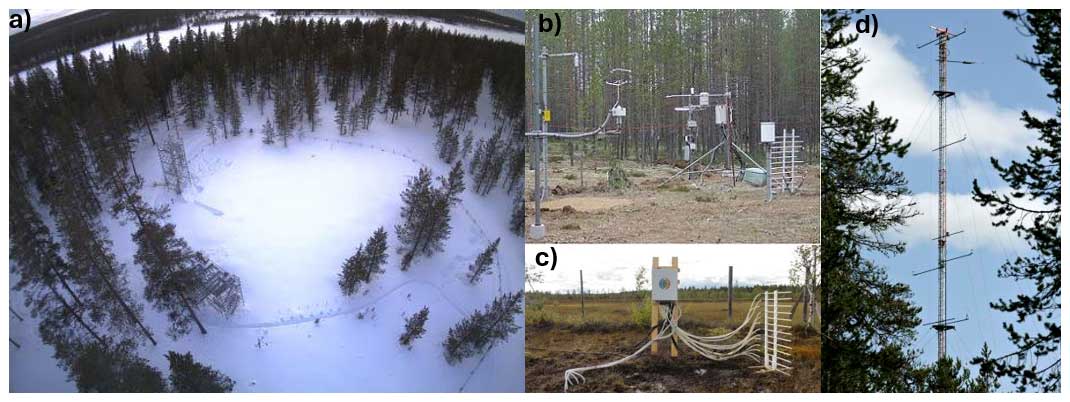
Figure 4The Sodankylä site surroundings during the winter at the Intensive Observation Area (IOA) in the boreal forest (a); snow, soil, and meteorological measurements in the MET measurement field (b); multi-level snow and soil measurements at the Peatland site, SUO (c); and meteorological tower with meteorological and radiation sensors (d). Photos from FMI (http://litdb.fmi.fi, last access: 13 May 2024).
2.3 Sodankylä, Finland
The Sodankylä site (Fig. 4) is managed by the Arctic Space Centre of the Finnish Meteorological Institute (FMI-ARC). It is located in the Scandinavian taiga, which consists of a mix of spruces, pines, and birches. The instruments (Fig. 4 and Table A3) at the Sodankylä site are distributed over seven main observational sites, each of them including several installations (48, 24, 20, or 16 m towers; automatic weather stations, AWS; and structures supporting snow and soil measurements) that cover an area of approximately 1.5 km2. The environment of the observational sites varies between dense forest, sparse forest, forest openings, and wetland, each of these environments having its own particular surface characteristics.
Sodankylä experiences monthly temperatures ranging from −11 to 15 °C (annual mean of 1 °C) and average monthly precipitation ranging from 35 to 85 mm (annual total of ∼660 mm). The site is a calibration/validation site for numerous satellite products, such as snow water equivalent and snow extent (Luojus et al., 2021) and soil freeze–thaw (Cohen et al., 2021; Rautiainen et al., 2016). The spatial distribution of the observational sites reflects the need to measure the spatial variability in observed parameters over different spatial scales and satellite footprints (Hannula et al., 2016). During the YOPP SOPs, radiosondes were launched four times daily.
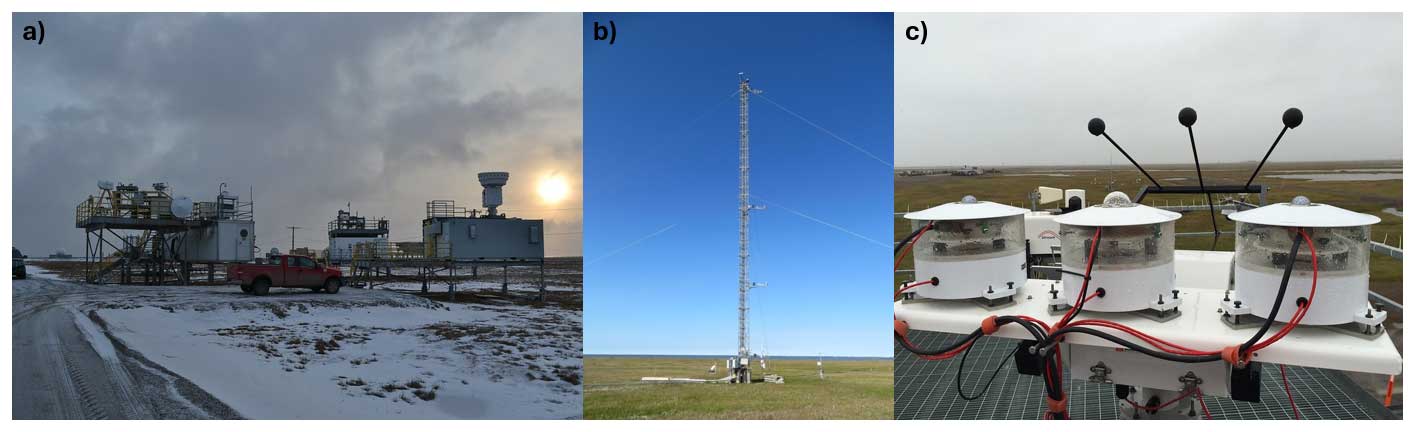
Figure 5The Utqiaġvik site surroundings during the winter, including the main observation stations and their rooftop instrument suites (a), the meteorological tower with radiation flux sensors deployed in the summer (b), and the SKYRAD downward long-wave radiation sensor deployed on the roof in the spring (c). Photos from ARM (http://www.arm.gov, last access: 13 May 2024).
2.4 Utqiaġvik (formerly Barrow), USA
The Utqiaġvik site (Fig. 5) consists of observatories located ∼3 km southeast from the coastline where the Beaufort and Chukchi seas meet. The site is situated over tundra interspersed with thermokarst lakes having a coverage of up to 40 % area (Sellmann et al., 1975). There are two primary observatories located outside of Utqiaġvik (formerly Barrow), Alaska: The Atmospheric Radiation Measurement (ARM) North Slope of Alaska (NSA) observatory operated by the Department of Energy (DOE) and the Barrow Atmospheric Baseline Observatory facility operated by the National Oceanic and Atmospheric Administration (NOAA) Global Monitoring Laboratory (GML). These observatories are equipped with a suite of meteorological instruments (Fig. 5 and Table A4) located 8 km east of the town of Utqiaġvik. This is likely beyond the influence of a local heat island in town (Hinkel and Nelson, 2007) and disturbance to snow cover by human activity (Stone et al., 2002). The site includes several towers and space for guest instruments.
Utqiaġvik experiences monthly temperatures ranging from −26 to 9 °C (annual mean of −10 °C) and average monthly precipitation ranging from 35 to 85 mm (annual total of ∼770 mm). The climate in Utqiaġvik and much of the Alaska North Slope is regulated by seasonal sea-ice cover and the dominance of easterlies that circulate around the Beaufort High. This atmospheric pattern is punctuated by episodes of southerly advection of air masses from the north Pacific, which frequently arrive from the direction of the Bering Strait and influence the timing of seasonal transitions of terrestrial snow cover and sea-ice coverage in both autumn and spring (Cox et al., 2017). The GML Barrow Atmospheric Baseline Observatory recently built a newly furnished on-site laboratory that was completed in 2020. The site's previous facility was constructed in 1972 (https://gml.noaa.gov/obop/brw/history/index.html, last access: 13 May 2024) and was deconstructed in 2021. The ARM NSA observatory was established in 1997 (Verlinde et al., 2016). Together, the GML and ARM observatories provide an extensive set of long-term measurements at this coastal location. Measurements include properties of aerosols, clouds, precipitation, trace gases, atmospheric state, and surface energy balance. Unlike the other YOPP sites, radiosondes were launched three times daily during the SOPs.
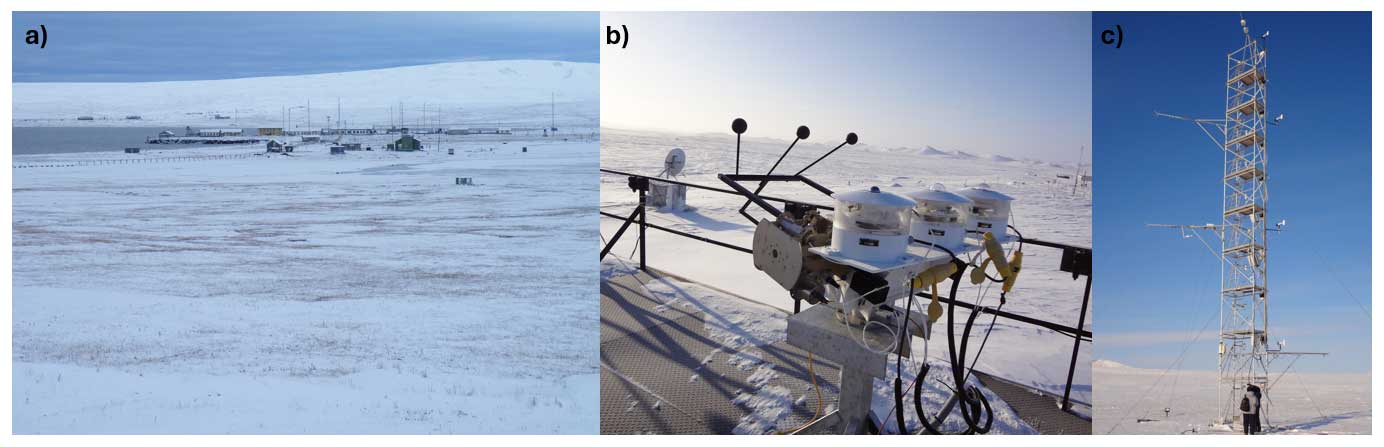
Figure 6The Tiksi site surroundings, shot from afar in the winter (a), the SKYRAD downward long-wave radiation sensor deployed on the roof of the Tiksi observation building (b), and the meteorological tower equipped with radiation flux sensors (c). Photos by Taneil Uttal (NOAA).
2.5 Tiksi, Russia
The Tiksi observatory (Fig. 6) is 7 km away from the town of Tiksi, Russia, in the Sakha Republic of northern Siberia and is staffed by personnel that commute from the town. Tiksi hosts a 20 m flux tower, a clean air facility, a weather station, the US Climate Reference Network (CRN) platform, and a Baseline Surface Radiation Network (BSRN) platform, among other instruments (Fig. 6 and Table A5) (Ohmura et al., 1998; Driemel et al., 2018). It is a coastal site, with facilities built in a high-latitude tundra regime, comprising several different types of tundra land classifications, including shrub (most predominant), lichen, wet/dry fen, grassy, bog, water, bare, and meadow (Mikola et al., 2018). Meteorologically, Tiksi is located in a boundary region between Atlantic and Pacific air masses. The resulting variability in atmospheric conditions with air masses originating from various source regions in Russia, northern America, Europe, and central Asia requires careful attention and interpretation of in situ measurements. Tiksi is also influenced by its location at the mouth of the Lena River, the second-largest river draining into the Arctic Ocean and the only major Russian river underlain by permafrost, which has impacts on the processes and evolution of surface fluxes. Tiksi is also situated on the coast of the Laptev Sea, which is historically a region of large sea-ice production.
Tiksi experiences monthly temperatures ranging from −29 to 11 °C (annual mean of −10 °C) and average monthly precipitation ranging from 15 to 65 mm (annual total of ∼510 mm). The original Tiksi science station was established in 1932 and at its peak had 60–80 staff and families that lived on site with a school and grocery store comprising an independent community. In collaboration with the Russian Federal Service for Hydrometeorology and Environmental Monitoring (Roshydromet), a partnership was established with NOAA and the FMI in 2005 to collect climate-grade meteorological, surface energy budget, greenhouse gas, and aerosol data (Uttal et al., 2013). Radiosonde data were incorporated into the Integrated Global Radiosonde Archive (IGRA) and are available through NOAA's National Centers for Environmental Information (NCEI) portal (Durre et al., 2018). Unlike the other YOPP sites, radiosondes had two daily launches during the SOPs.
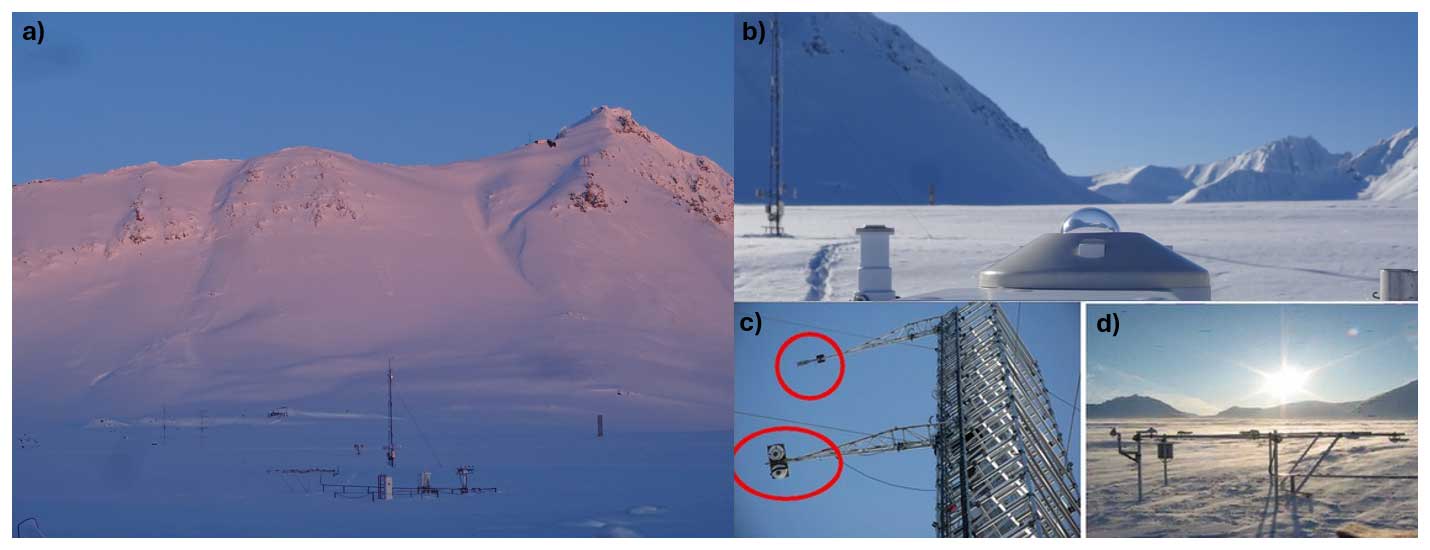
Figure 7The Ny-Ålesund site surroundings shot in the winter with the meteorological sensors and radiation tower in the foreground (a), CMP22 downward short-wave radiation sensor at the site (b), meteorological tower with the radiation flux sensors circled (c), and several surface meteorological and albedo-measuring sensors at the BSRN station (d). Photos in panels (c)–(d) are adapted from Fig. 1 in Becherini et al. (2021).
2.6 Ny-Ålesund, Norway
At Ny-Ålesund Research Station (Fig. 7) in Svalbard, Norway, multi-disciplinary observations are operated by several institutions from different countries. The Norwegian Meteorological Institute (a.k.a. MET Norway; http://www.met.no, last access: 13 May 2024) operates the standard meteorological surface and synoptic observations (Fig. 7 and Table A6) reported to the WMO (Maturilli et al., 2013). The settlement at 78.9° N, 11.9° E is situated on the south coast of the Kongsfjord, which opens at the west coast of Svalbard towards the Fram Strait. The fjord stretches in southeast–northwest direction from the large glacier plateau to the open ocean and is surrounded by glaciated mountains with altitudes up to 1 km. This geographical setting impacts the local wind field in the lowermost kilometre, resulting in a mainly southeastern wind direction at Ny-Ålesund, which is temporarily replaced by a northwesterly wind direction when large-scale synoptic wind is also coming from the appropriate direction. Only in calm conditions with wind speed <2 m s−1 do katabatic winds from the glaciers south of Ny-Ålesund prevail.
Ny-Ålesund experiences monthly temperatures ranging from −8 to 9 °C (annual mean of −6 °C) and average monthly precipitation ranging from 17 to 46 mm (annual total of ∼590 mm). Ny-Ålesund may be located in the high Arctic, but due to its location in a coastal environment affected by the West Spitsbergen Current, the local climate is quite maritime and relatively warm. During the summer months, air temperatures are above freezing, the otherwise snow-covered landscape exhibits tundra ground, and the active layer soil surface is permafrost. An overview of the climate conditions and changes in Svalbard is given by the Norwegian Centre for Climate Services (NCCS, 2018), while the specific atmospheric and radiation conditions in Ny-Ålesund are described by Maturilli et al. (2019). For the YOPP SOPs, the radiosonde launch frequency was increased from daily to 6-hourly. Radiosonde launches, four times daily, are contributed by the Alfred Wegener Institute (AWI) and carried out by the German–French AWIPEV research base that AWI jointly operates with the French Polar Institute Paul-Émile Victor (IPEV). The radiosondes and weekly ozone sondes are launched from a balloon platform about 200 m west of the MET Norway weather mast. Atmospheric trace gases and cloud condensation nuclei are observed at the Zeppelin Observatory at about 474 m a.s.l. on Zeppelin Mountain south of Ny-Ålesund operated by the Norwegian Polar Institute (NPI), Norwegian Institute for Air Research (NILU), Stockholm University, Japanese National Institute of Polar Research (NIPR), and others. The full complement of atmospheric measurements at Ny-Ålesund highlights the interwoven research community that contributes to making Ny-Ålesund an observational site. More information on the Ny-Ålesund Research Station is available at https://nyalesundresearch.no (last access: 13 May 2024).
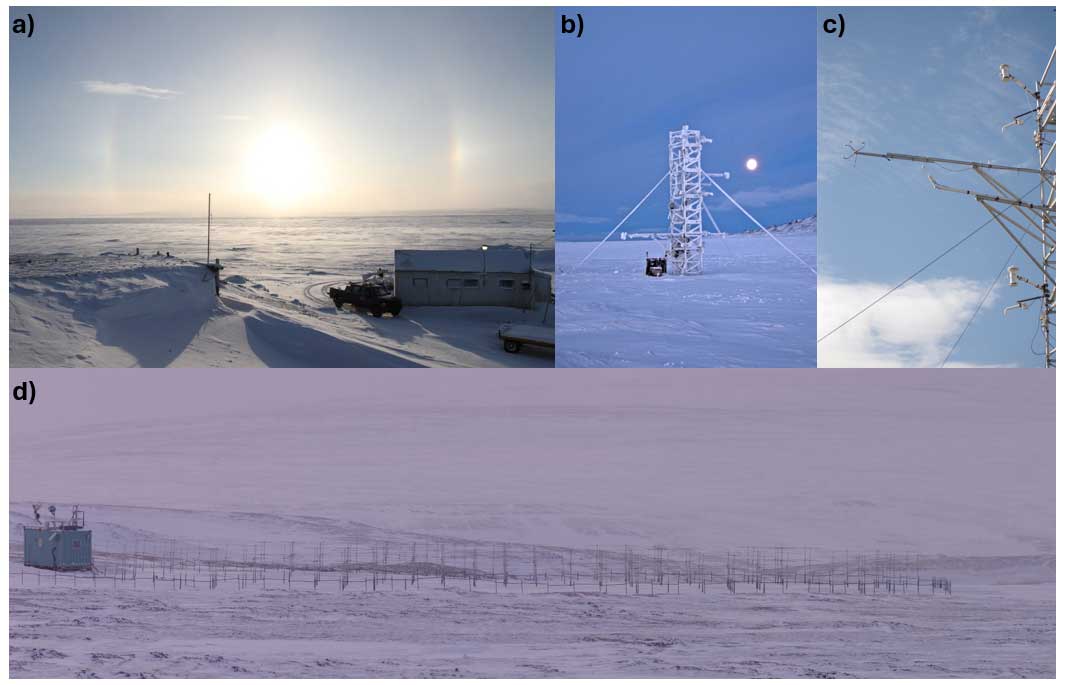
Figure 8The Eureka site surroundings in the winter, facing south from the Eureka weather station (EWS), looking over the frozen fjord with a sundog in the background (a); the meteorological tower at the Surface and Atmospheric Flux Irradiance Extension (SAFIRE) (b), with radiation flux (e.g., PSP) and meteorological sensors deployed (c); and the SAFIRE site surroundings shot from afar (d).
2.7 Eureka, Canada
The Canadian Network for the Detection of Atmospheric Change (CANDAC) runs the Polar Environment Atmospheric Research Laboratory (PEARL) (Fig. 8) near the Environment and Climate Change Canada (ECCC) Eureka Weather Station (EWS) in Nunavut, Canada. PEARL has three facilities: the Ridge Laboratory (RL), the Zero Altitude PEARL Auxiliary Laboratory (0PAL), and the Surface and Atmospheric Flux Irradiance Extension (SAFIRE). PEARL collects a wide variety of measurements across all three facilities (Fig. 8 and Table A7). The observations used from the Eureka station for the MODFysm (Akish and Morris, 2023a) were primarily measured at the 0PAL and SAFIRE on-site facilities. The 0PAL lab is situated at approximately 10 m a.s.l. elevation to capture measurements in the lowermost atmosphere. The SAFIRE facility is located about 5 km from the EWS, and it is located away from any structures. At SAFIRE, there is a former BSRN station, a flux tower, and additional remote sensing instrumentation. Additional details about the site, including its instrumentation, dataset validation, and uncertainties, can be found in Fogal et al. (2013) and at https://www.pearl-candac.ca/website/index.php/facilities (last access: 13 May 2024). Only a subset of the available measurements collected has been included in the MODFysm (Akish and Morris, 2023a) due to time constraints and processing resources. Ellesmere Island, where Eureka is situated, is characterized by complex topography that generates mesoscale atmospheric circulations, such as down-sloping winds (e.g., Persson and Stone, 2007). The local summertime atmosphere is also likely regulated by nearby ice conditions (Persson and Stone, 2007; Tremblay et al., 2019), which vary between the northern side of the island, where multiyear pack ice persists (e.g., Alert), and other coastal areas, which are generally adjacent to seasonal ice cover (e.g., Eureka). However, the general dryness of the atmosphere over Ellesmere is likely a regional anomaly related to location relative to dominant pressure patterns over the Beaufort Sea and near the pole rather than being local (Cox et al., 2012).
Eureka has a minimum monthly average temperature of −37.4 °C in February, a maximum of 6.1 °C in July, and a yearly average of −19 °C. Average monthly precipitation ranges from 9 to 53 mm (annual total of ∼285 mm). Details of Eureka's climatology are described in Lesins et al. (2010) and water vapour climatology in Weaver et al. (2017). For the period from 1954 to 2007, the monthly average dry-bulb air temperature minimum occurs in February at approximately −37 °C, with the maximum in July at approximately 5 °C. ECCC also publishes climate normals for Eureka at https://climate.weather.gc.ca/climate_normals/results_1981_2010_e.html?stnID=1750&autofwd=1 (last access: 13 May 2024). Eureka is generally colder and drier than Utqiaġvik (Cox et al., 2012). The soils are mostly marine deposits, and the topography, apart from the stony ridges, is driven mostly by ground ice (Pollard and Bell, 1998; Pollard et al., 2015). Cloud cover over Eureka is anomalous relative to other Arctic observatories, with its generally higher cloud bases, a smaller proportion of supercooled liquid, and a seasonal cycle offset from the typical pattern observed elsewhere (Shupe, 2011; Shupe et al., 2011). Eureka increased their two daily radiosonde launches to four daily launches during the SOPs.
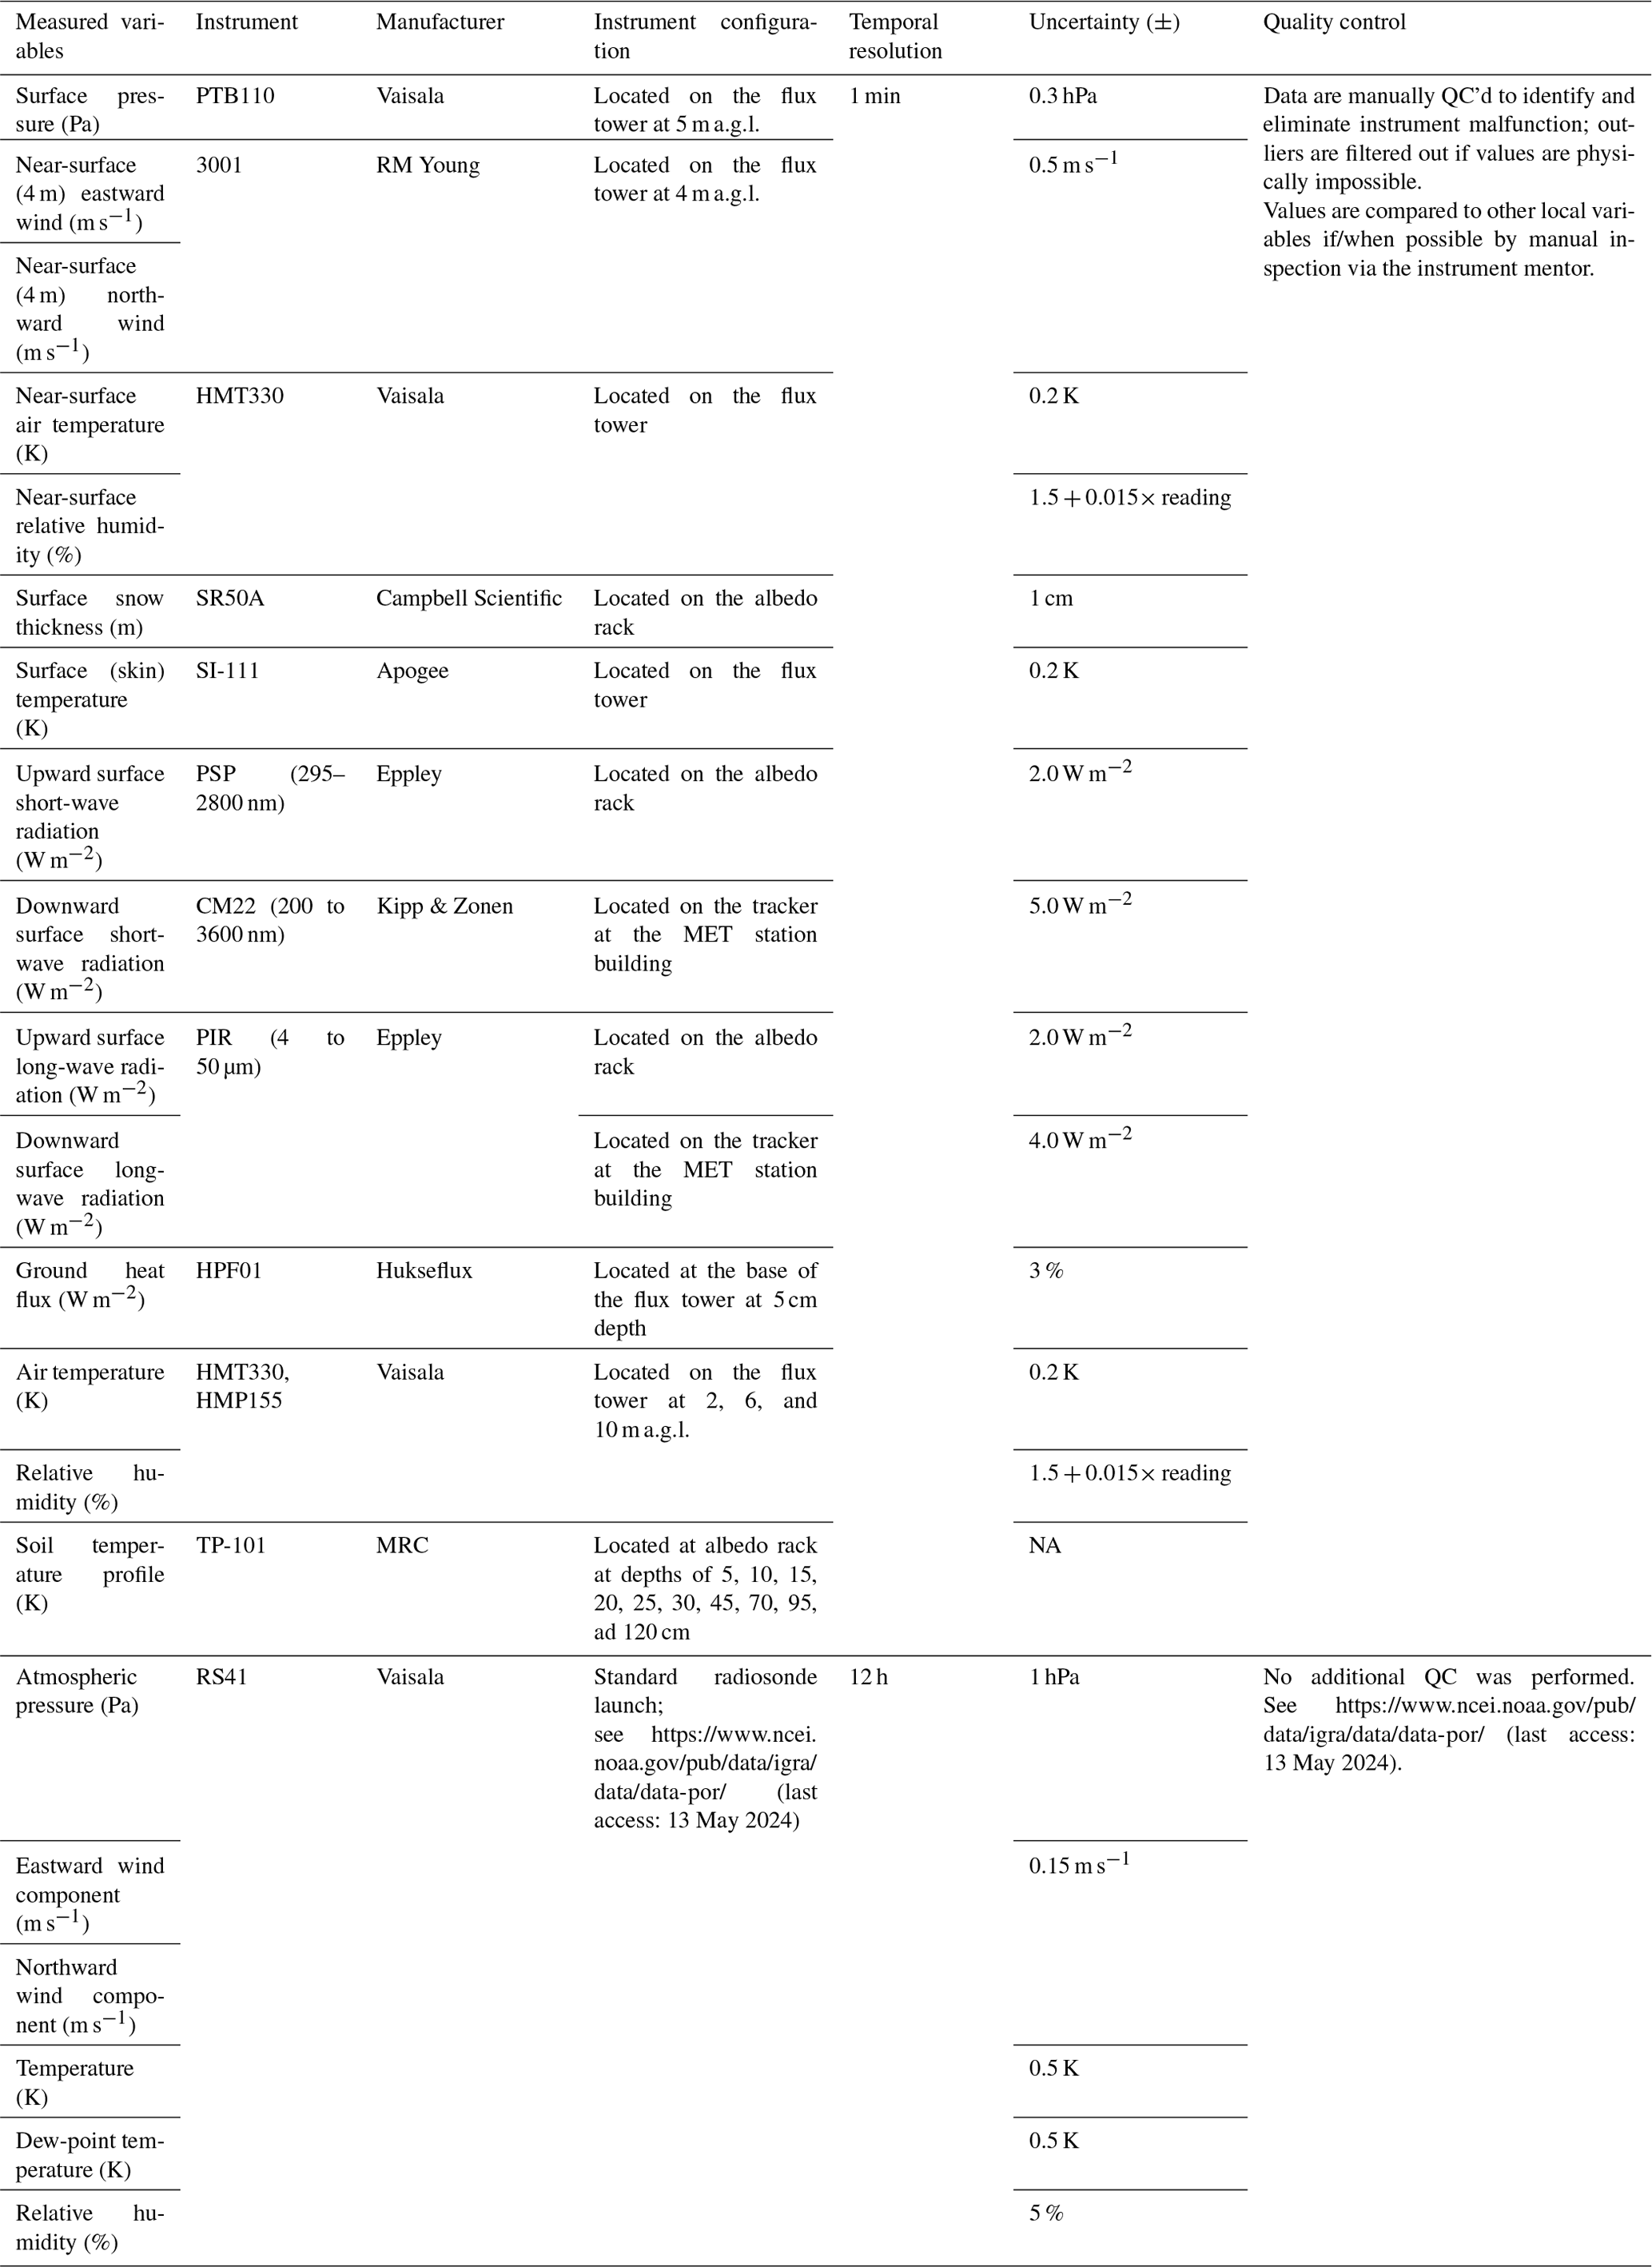
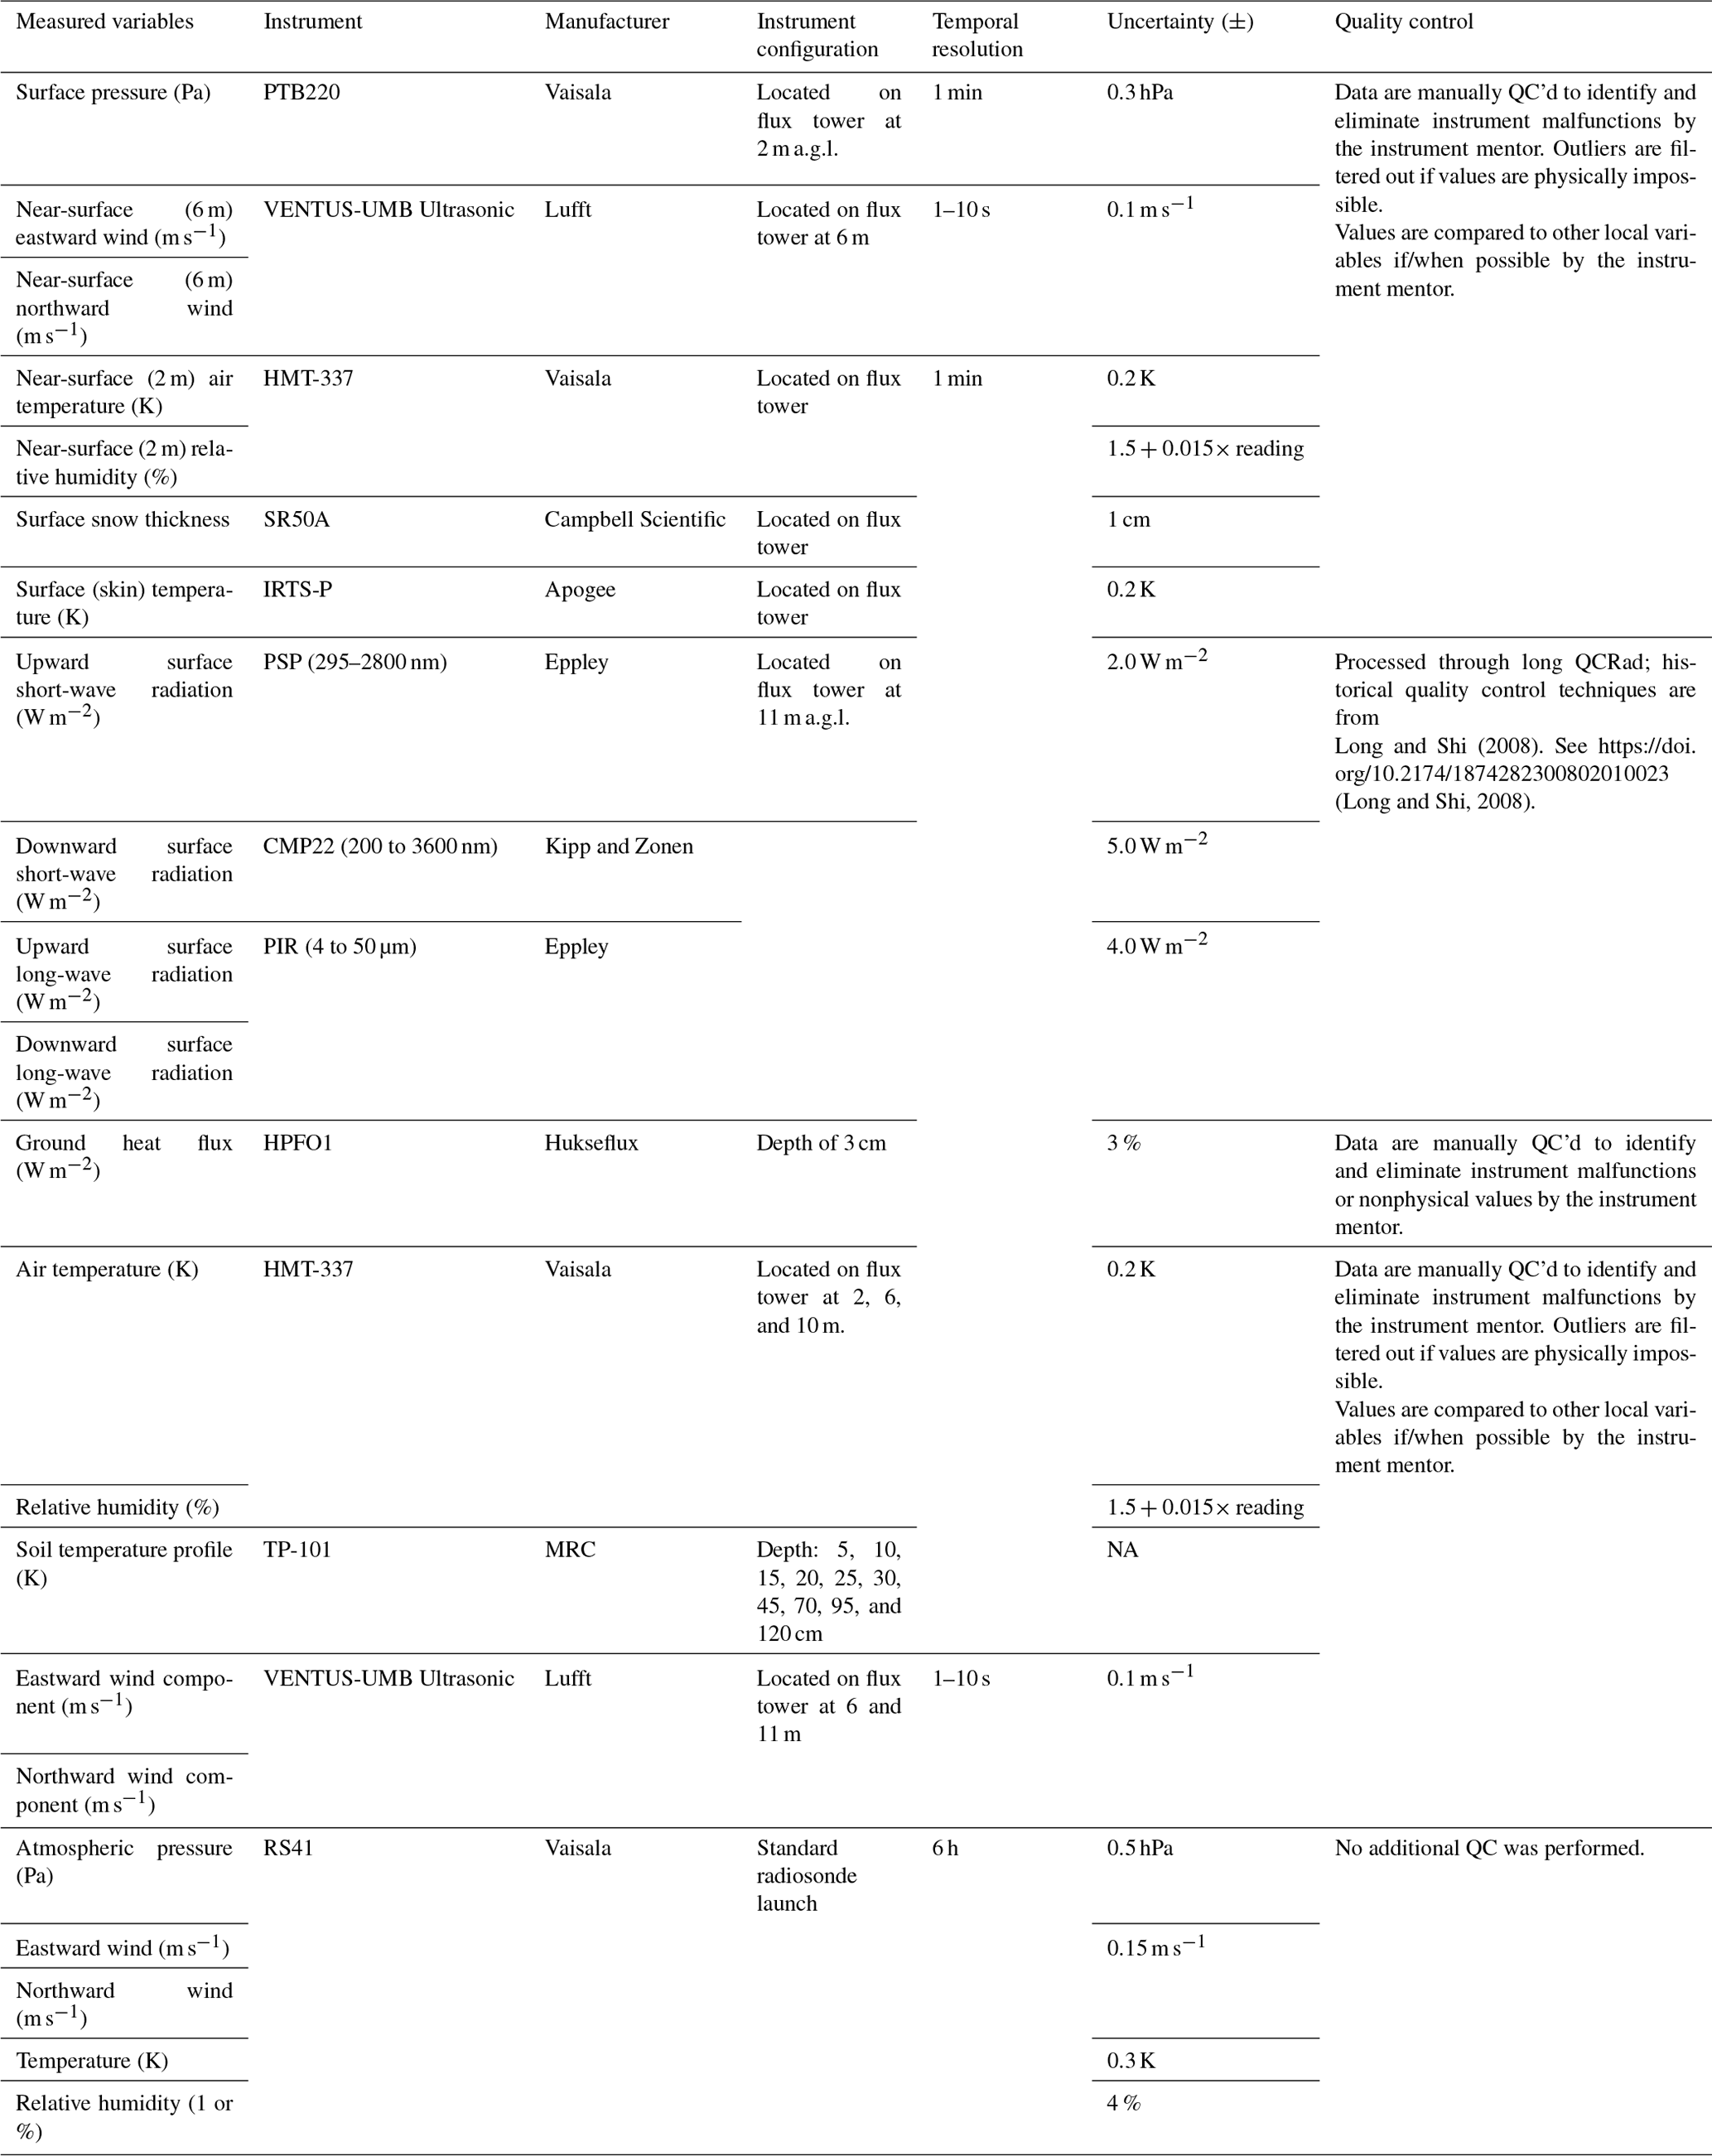
Standard surface meteorological observations (winds, temperature, pressure, humidity, and precipitation) were conducted by instruments of similar design, operation, and accuracy at the different sites. The MODF files have an attribute, instrument, which specifies the exact instrument model used for each variable at each site. For each site, the full list of measured variables, instrument model and manufacturer, temporal resolution, measurement uncertainty, and operating configuration is provided in Tables A1–A7 (note that the information in these tables is also documented in the attributes of the MODFs themselves). The uncertainties provided in these tables originate from the manufacturer and often depend on the meteorological conditions (e.g., relative humidity observations are less accurate during very low temperatures); as such, the largest reported uncertainty was provided for each geophysical variable to provide a conservative error estimate.
For all sites, Vaisala RS92 or RS41 radiosondes were used to collect vertical profile observations from the surface up to the stratosphere. For Iqaluit and Whitehorse, however, the radiosonde manufacturer changed during SOP2 from Vaisala (RS92) to GRAW on 12 September 2018 (no impact on the data quality is anticipated). The radiation flux, cloud base height, and snowfall flux observations are the only derived variables that were explicitly calculated in the MODF (as opposed to the direct observations described previously). The heat flux observations were processed using the eddy correlation and bulk method (see, for instance, Baldocchi, 2014). Additional processing and QC methods for these observations are discussed in Sect. 4. Cloud base height observations were output by the Vaisala CL51 ceilometer at most sites (where available) using a proprietary algorithm to determine the lowest cloud base height; the uncertainty of this algorithm is not reported but the ceilometer has a reported distance accuracy of ±10 m from the manufacturer. ARM technical reports, instrument validation/evaluation, and QC measures are linked and available within the Utqiaġvik (Barrow) MODFysm (Akish and Morris, 2023c).
For all observations, instantaneous time is reported at the instruments' raw sampling cadence in UTC. The typical temporal cadence for most observations is around 1 min. No temporal interpolation or averaging was performed on the data. The only exception to this is for turbulent fluxes (the only calculated variable), where some averaging (1 to 30 min, depending on the variable) is implicit in the calculation of fluxes. Heights are reported as above ground level (a.g.l.), with the exception of the soil thermistor string, which reports depths below the surface in units of centimetres. For more information on the instrumentation used or further details on the instrument accuracy, precision, and co-located validation studies for certain instruments, refer to the site-specific references listed in Sect. 2 and/or the WMO Guide to Instruments and Methods of Observation (WMO, 2021).
Guidelines for creating MODFs were published as a table in both human-readable (PDF file) and machine-readable (JSON files) formats by Hartten and Khalsa (2022). This “H–K table” adopts the standards and conventions commonly used in Earth sciences, including NetCDF encoding with Climate and Forecast (CF) conventions and following CMIP6 naming, as agreed upon by the YOPP community (Uttal et al., 2023). This H–K standard facilitates the creation of MODFs using current requirements and the creator's software of choice, with the MODF toolkits providing tools to assist the user in creating MODFs (Sect. 6). For the present work, we used H–K table version 1.3 to guide the criteria for the generation and standardization of naming conventions, units, and global/variable attribute metadata. Observational datasets were collated and formatted for each of the seven sites into a set of NetCDF files in accordance with the table's criteria. The native variable name is saved as an attribute in the MODFs and as previously discussed, no resampling was performed to harmonize different time-stepping (the instrument's instantaneous raw sampling frequency is reported, usually about minutely). The acceptance of data into the MODFysm was generally determined by the variable list described in the table. The processing script is openly available and described in Sect. 6.
Radiosonde (timeSeriesProfileSonde variables) data in the MODF were binned into 5 m intervals (10 m for Iqaluit and Whitehorse) of geopotential height, and all measurements within each bin were averaged. The raw data feed from the radiosonde observations was obtained at ∼2 s resolution. In the case of 5 m intervals, this most often results in zero, one, or two measurements in each bin: 8 %, 82 %, and 9 %, respectively, in SOP1 and 6 %, 80 %, and 13 % in SOP2. In both SOP1 and SOP2, at least 99.9 % of the measurements have two or fewer measurements, but a given bin can have up to 14 measurements. The number of measurements per bin has been included in the dataset to filter for these situations, as have the actual time and height of each measurement (though also averaged within each bin). For surface precipitation observations, no corrections for solid precipitation under catchment were performed (the dataset is raw in the MODF); where appropriate, users are recommended to process under-catchment corrections via Kochendorfer et al. (2020).
A summary of the instruments, their configuration, the processing, and the QC applied for each site's observations is provided in Tables A1–A7. Unless otherwise specified in these tables, the observations collected by each instrument are processed by the instrument manufacturers' proprietary software (standard data output for that instrument) prior to any additional QC that is performed. In some cases, no additional QC was performed, and the data should be treated as is. In other cases, additional checks (manual comparisons to co-located instruments) and/or QC was applied to remove outliers and erroneous observations, as described under Quality control in Tables A1–A7. An indication of whether the dataset was corrected for certain effects (e.g., shelter heating effect) is also provided in the tables, where applicable.
The present phase of the MODF concept is to use standardized data organization, metadata, and interoperability. While data quality assurance and measurement operation procedures remain in the purview of the contributing stations, considerable effort was undertaken to ensure MODF production followed a transparent, consistent, and standardized data processing chain. This includes efforts to standardize post-processing and filtering techniques (e.g., QC methods) as much as possible for the same geophysical variable across the different sites. This consistent processing chain is another unique feature of the MODF dataset as it enforces a level of consistency across vastly different observation sites that normally follow their agencies' own data production procedures and methods. As discussed in more detail in the subsections below, there are some cases where site-specific data processing could not be avoided; data should be used cautiously and with due consideration of each site's processing techniques and QC methods for the MODFysm.
4.1 Whitehorse and Iqaluit, Canada
All geophysical variables observed at the Iqaluit and Whitehorse sites were processed in the same manner and included in the MODFysm (Huang et al., 2023a, b). For most geophysical variables, limited QC was performed on the raw dataset with the intention to remove only obvious outliers. Details regarding the QC performed are provided in Tables A1–A2. A very small number (<5 %) of observations were flagged by the QC algorithm. Note that the correction for solid precipitation under catchment is less relevant for the WXT520 instrument than it is for traditional precipitation rain gauge instruments (e.g., the Pluvio2). The radiation flux observations should be treated with caution since they typically require additional QC processing prior to analysis; no additional QC was performed on these observations to account for potential frost or snow deposition on the sensors, for instance. No additional QC was performed on the cloud base height data, which was processed by the Vaisala software. Vaisala also processed the raw data feed from the radiosonde observations, which were obtained at 2 s resolution; no additional QC was performed. When no data were available (due to the instrument being down, loss of power at the site, or it being flagged by the QC algorithm), a missing value (−9999.0) was reported in the MODFysm (Huang et al., 2023a, b) and is notated via the missing_value attribute associated with each variable. Mariani et al. (2020, 2021) provide instrument validation studies and more detailed information on the QC processing routines for the remote sensing and upper-air observations.
4.2 Sodankylä, Finland
The Sodankylä observations included in the MODFysm (O'Connor, 2023) are automatically uploaded every day to the FMI open-access website https://litdb.fmi.fi/ (last access: 13 May 2024), where the data are organized on the basis of platforms and stations. Before being uploaded to the web page, the data undergo an automatic quality check to remove outliers, as described in Table A3. In several cases, multiple different instruments were co-located and deployed at the site to observe the same variable; as such, there are multiple sources of observations (instruments) to choose from.
In the current MODFysm version (O'Connor, 2023), no further quality check was applied to the data, implying that errors from several sources are occasionally included. These sources of error may include snow/frost deposition on radiation and temperature sensors or absorption of solar radiation by unsheltered temperature sensors. In a future version of the MODFysm, a deeper quality check will be applied to some of the variables included in the current MODFysm (O'Connor, 2023). This quality check is based on the comparison among the same variables measured at different sites; on visual inspection; and, in the case of global radiation, on the comparison with radiative transfer model calculations. This processing will enable the identification of the short-wave data affected by the shadows cast by the vegetation, of errors caused by frost formation on the domes of pyranometers, and of the error in unshaded thermometers caused by the absorption of solar radiation.
4.3 Utqiaġvik (formerly Barrow), USA; Tiksi, Russia; and Eureka, Canada
The Utqiaġvik/Barrow data within the MODFysm (Akish and Morris, 2023c) originated from both DOE/ARM and NOAA GML datasets, with GML proving datasets for ozone, snow thickness, skin temperature, and soil temperature profile. Value-added products were generated and disseminated to the users using the ARM Data Discovery interface. Both the ARM and GML datasets were ingested into a single MODFysm, with variable attribution detailing how each variable and dataset was QC'd, processed, and accessed, as described in Tables A4–A5 and A7. The surface ozone data were collected in 1 min intervals and were manually QC'd and submitted to NCEI. The measurements collected by the ARM facility were processed, QC-analyzed, and archived at the ARM Data Center archive. The long-term Eureka and Tiksi datasets (flux tower and radiation) are hosted by the NOAA Physical Sciences Laboratory (PSL) in collaboration with ECCC (Eureka site only) and Roshydromet (Tiksi site only).
For the three sites, the radiation measurements were QC'd and processed following Long and Shi (2008) and an improved correction of the infrared loss in diffuse short-wave measurements was included (Younkin and Long, 2003). Turbulent heat fluxes were processed and QC'd via eddy correlation corrections, including the stability correction, Webb–Pearman correction, frequency correction, sensor separation correction, filtering correction, line-averaging correction, and volume-averaging correction (Cook et al., 2008; Fuehrer and Friehe, 2002). Bulk corrections were also employed and utilized ARM data from the radiation, ground, meteorology, and tower.
Radiosonde data were ingested and processed by NOAA's NCEI and were processed through IGRA, following their standards (Durre et al., 2018), and are available through NOAA's NCEI portal. The IGRA 2 quality assessment (QA) system, which is based largely on the QA procedures in the IGRA 1 system, processed the sonde data (Durre et al., 2006, 2008). Like the IGRA 1 system, it consists of a deliberate sequence of specialized algorithms, each of which makes a binary decision on the quality of a value, level, or sounding; the data item either passes the check and remains available or is identified as erroneous and thus set to missing. For all observations, a second level of manual QC was performed whereby data were reviewed by instrument mentors and visually assessed by the site scientist/data quality office. This included removing nonphysical values and outliers after confirming that they were either biased, incorrect, or collected during site maintenance periods. If data were not available for any of the collected measurements across any of the variables due to the instrument being down, loss of power at the site, or it being flagged by the QC algorithm, a missing value (−9999) was reported in the MODFysm (Akish and Morris, 2023b).
4.4 Ny-Ålesund, Norway
The meteorological measurements used for the MODFysm (Holt, 2023) are taken from the AWIPEV weather mast (Driemel et al., 2018; Maturilli, 2020b). Except for precipitation, all other data used in the MODFysm for Ny-Ålesund originated from the datasets by Maturilli (Maturilli, 2020a, b, c, 2022). The precipitation data reported in the MODFysm are the direct instrument output, and no quality checks were applied; as such, these data should be treated with caution (Holt, 2023). The Ny-Ålesund observations included in the MODFysm are a subset of those regularly uploaded to the PANGAEA data repository (http://www.pangaea.de, last access: 13 May 2024). Before being uploaded, all data undergo an automatic quality check (described in Table A6). Following this, additional manual/visual inspection was performed as for Utqiaġvik, Tiksi, and Eureka. Surface radiation data were validated and underwent all quality checks of BSRN before archiving (Maturilli, 2020a).
The data inside a MODF are comprised of all the observations listed in Table 3 for a given observation site. The data themselves follow the same standardized format and structure for all observations and sites and are stored in a single NetCDF file using CF conventions. NetCDF file formatting was chosen to best accommodate the high level of metadata detail required for merging such large quantities of individual measurements together, particularly given the need to be as transparent as possible when reporting instrument-specific details for each observation. NWP model output was stored in MMDFs, matching the MODF format to facilitate model–observation comparisons. Local maps showing the synoptic region around each site are provided in Fig. 9, with native spatial grids of the forecast models that participated in YOPPsiteMIP overlaid. This provides visual context of where the site and the nearest NWP grid points exist in and around each site.
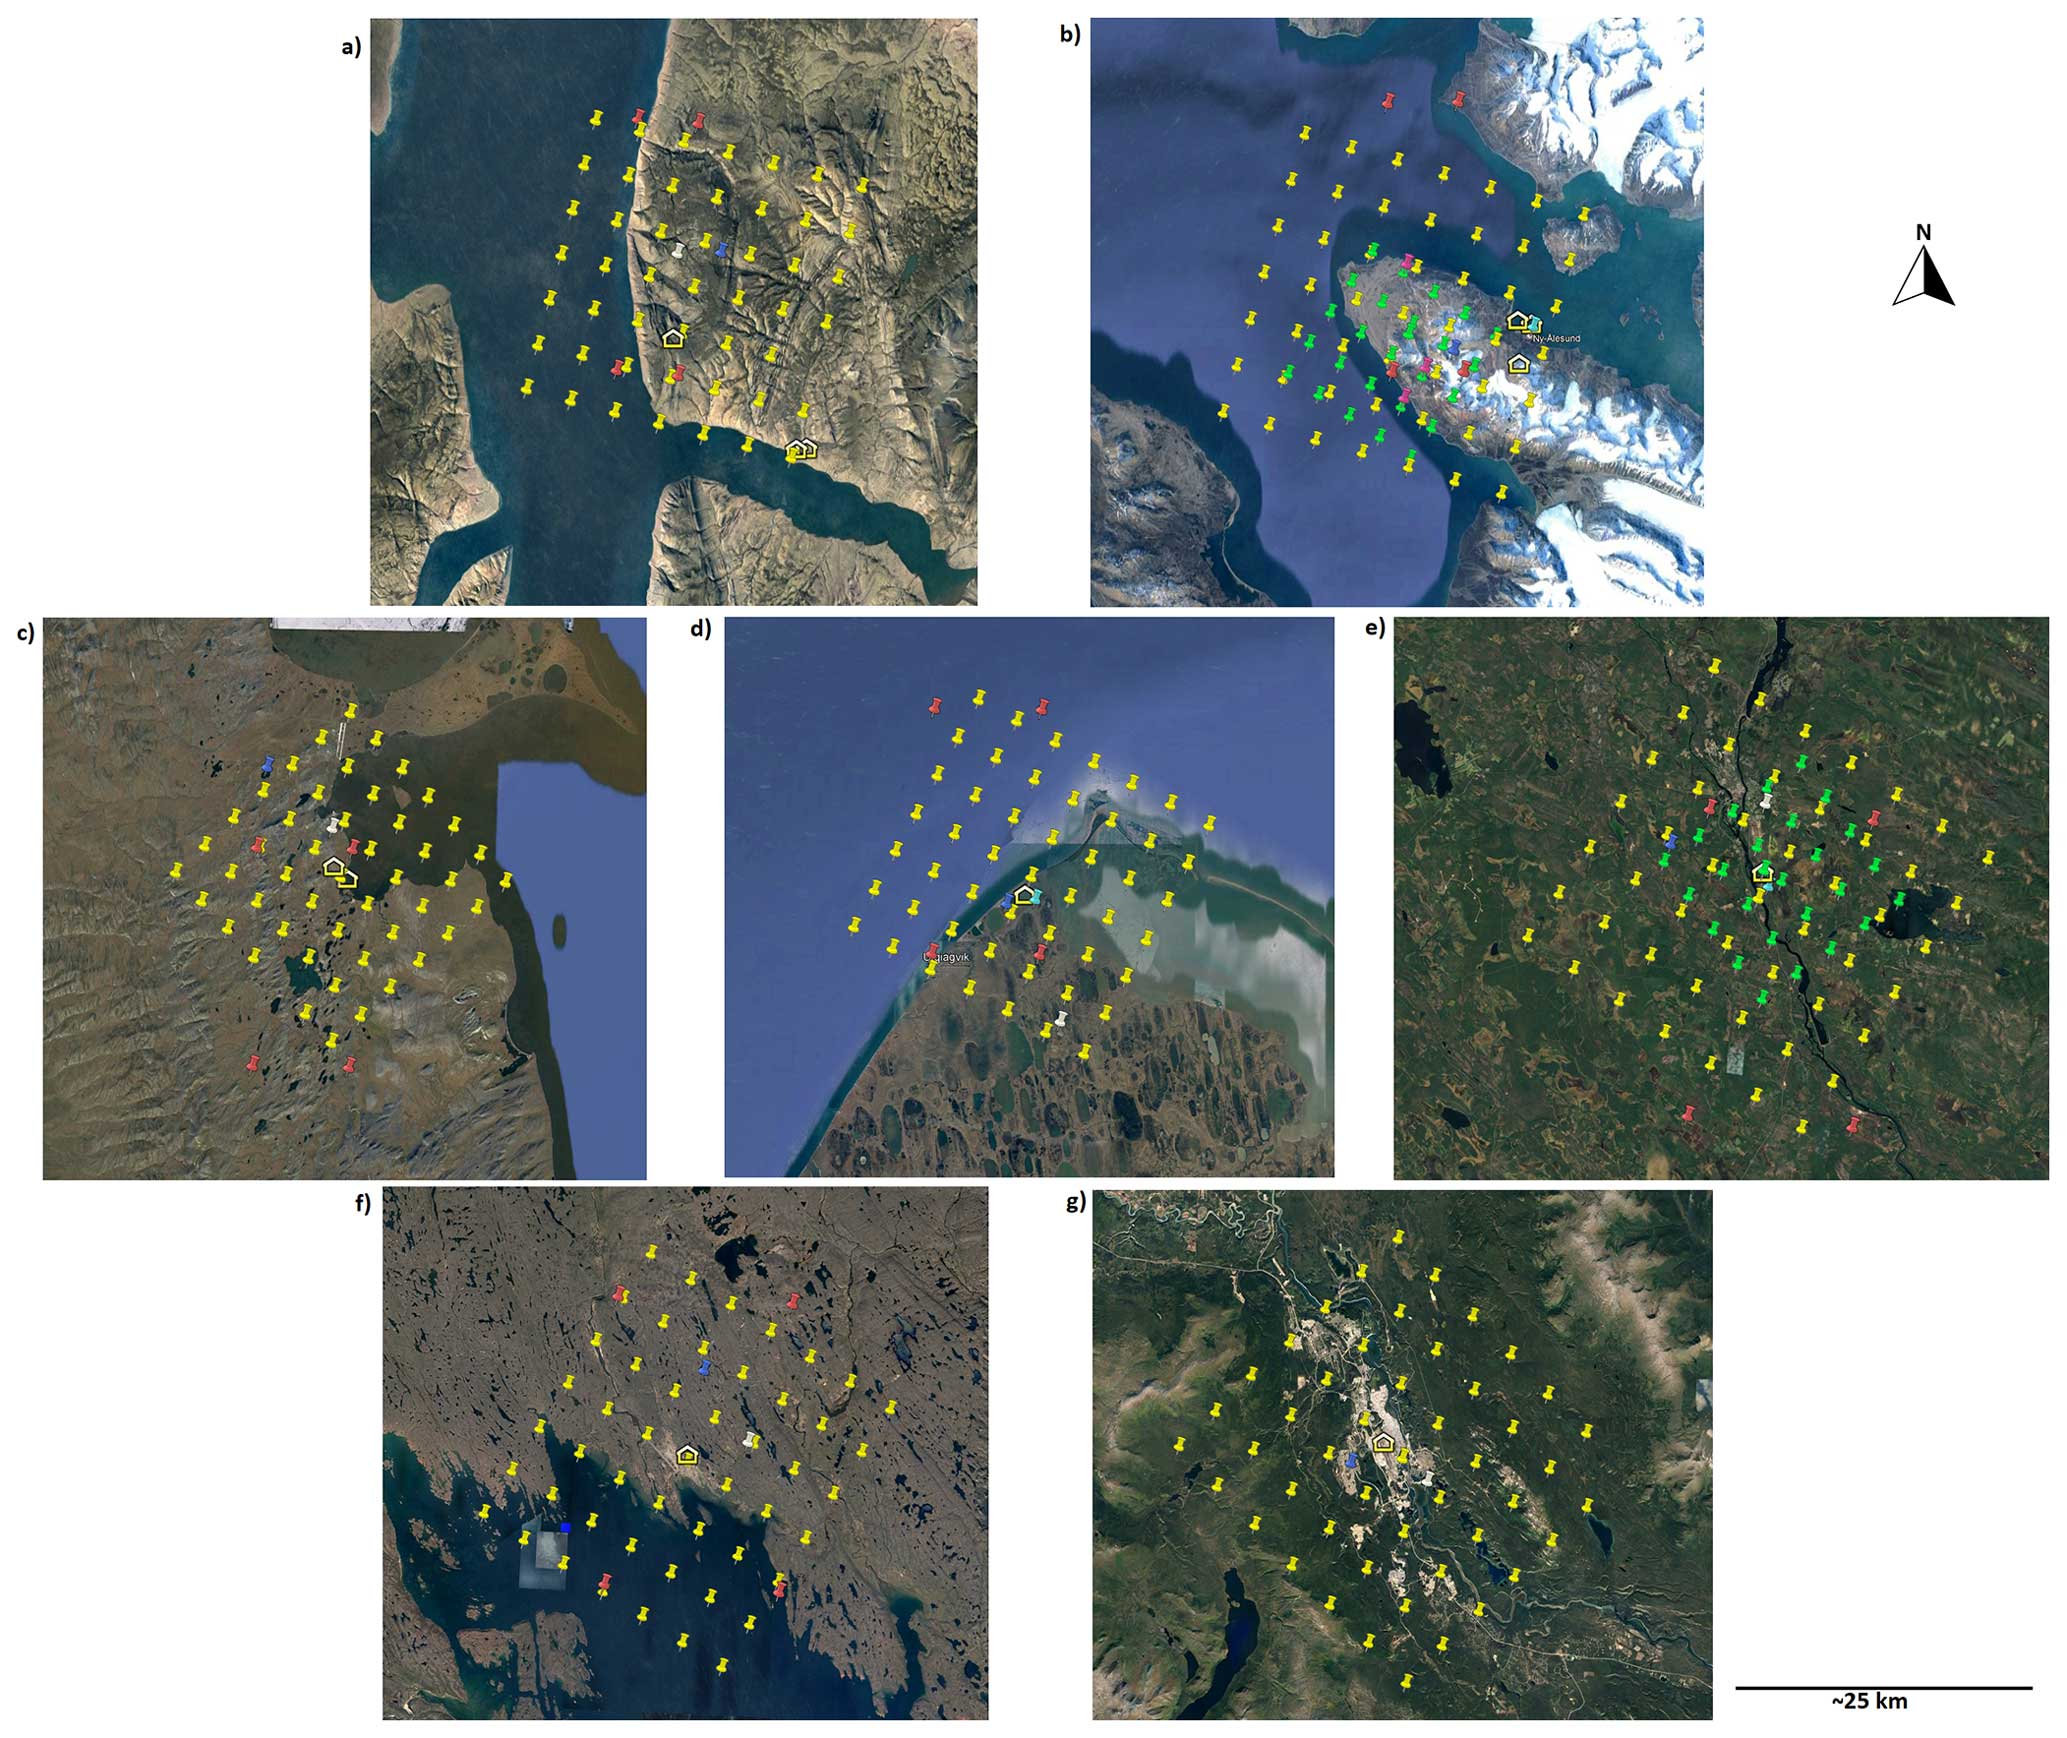
Figure 9Model grid points at and around each site: (a) Eureka, (b) Ny-Ålesund, (c) Tiksi, (d) Utqiaġvik, (e) Sodankylä, (f) Iqaluit, and (g) Whitehorse, displayed through the Google Earth web platform. Image by Landsat/Copernicus; Image © 2023 Maxar Technologies. Sites are organized from the highest latitude (Eureka) to the lowest (Whitehorse). Yellow building icons represent the location of the facility on site which contains all co-located instruments. Similarly, icons for the AROME-Arctic model grid pins are indicated in green, ARPEGE pins are in white, DWD-ICON pins are in light blue, ECCC-CAPS pins are in yellow, ECMWF-IFS pins are in dark blue, and SL-AV pins are in red. All images are north-aligned nadir view.
All MODFysm measurements provided in the data files maintained their native time cadence (typically on the order of minutely), with no averaging being undertaken, and details of the collection and processing techniques can be found in the variable attributes within the files. Each DOI in Table 2 contains four (e.g., Whitehorse) or six (e.g., Utqiaġvik) files, depending on whether the site had timeSeriesProfile observations on a tower/mast. The filename convention for each MODF is as follows: site name, “obs”, MODF_featureType, start_date, and then end_ date.nc.
Guidelines for creating inventories of variable and attribute information (metadata) necessary for the MODF file attributes were published in spreadsheet format by Morris and Akish (2022). This “M–A template” uses variable content criteria from the H–K table to generate a metadata matrix of attribute and variable information for each of the measurements contained within the MODFs. The template has individual tabs for each of the corresponding CF metadata featureTypes (i.e., timeSeries and timeSeriesProfile) of the MODF NetCDF files as well as one tab for the global attributes of the MODFs. The CF conventions can be found here: https://cfconventions.org/cf-conventions/cf-conventions.html (last access: 13 May 2024). The attributes within the template are mandatory when applicable, and serve as a guideline for MODF creators. The M–A template is machine-readable and can be ingested into MODF software to create the final output.
The file content is well illustrated in Table 3; other details of the MODFysm format and structure are outlined in Uttal et al. (2023). MODFs can contain featureTypes such as timeSeries and timeSeriesProfile, which refer to time series having one and two data dimensions, respectively. In cases where data subcategories exist, featureType modifications can be depicted in the file name; for example, timeSeriesProfileSonde exist for the MODFysm. Currently, more than one featureType can be used within an individual MODF file, but all subscribe to the same formatting structure and nomenclature. To generate a MODF, creators should first visit the H–K table to determine the variables that are to be included in their MODF, and then they should utilize the M–A template to fill in the needed attribute and variable information requested by existing MODF software. Once the M–A template has been completed, users can then ingest the template into their MODF software to create the final MODF outputs. For the MODFysm, individual toolkits were developed by MODF makers for each YOPP site. Python code was developed for Whitehorse, Iqaluit, and Ny-Ålesund and MATLAB code for Utqiaġvik, Tiksi, Eureka, and Sodankylä (see Sect. 7). After the generation of the MODFysm outputs, the files were run through an MODF checker that identifies the various inconsistencies or issues with the files before their upload to the MET Norway data portal. The MODFysm checker developed for the YOPPsiteMIP files is part of a larger toolkit being designed to continue the creation of MODFs.
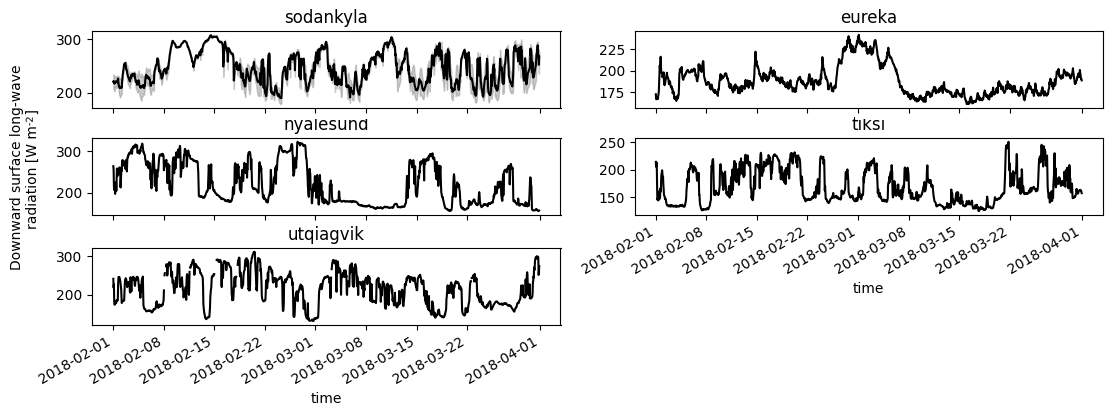
Figure 10Observations (30 min) of downward surface long-wave radiation (rlds) conducted during SOP1 at each site. Rlds observations from Whitehorse and Iqaluit were not available during SOP1. Sodankylä conducts multiple observations of rlds; the mean (black line) and minimum and maximum spreads in observed rlds (grey-shaded area) are shown.
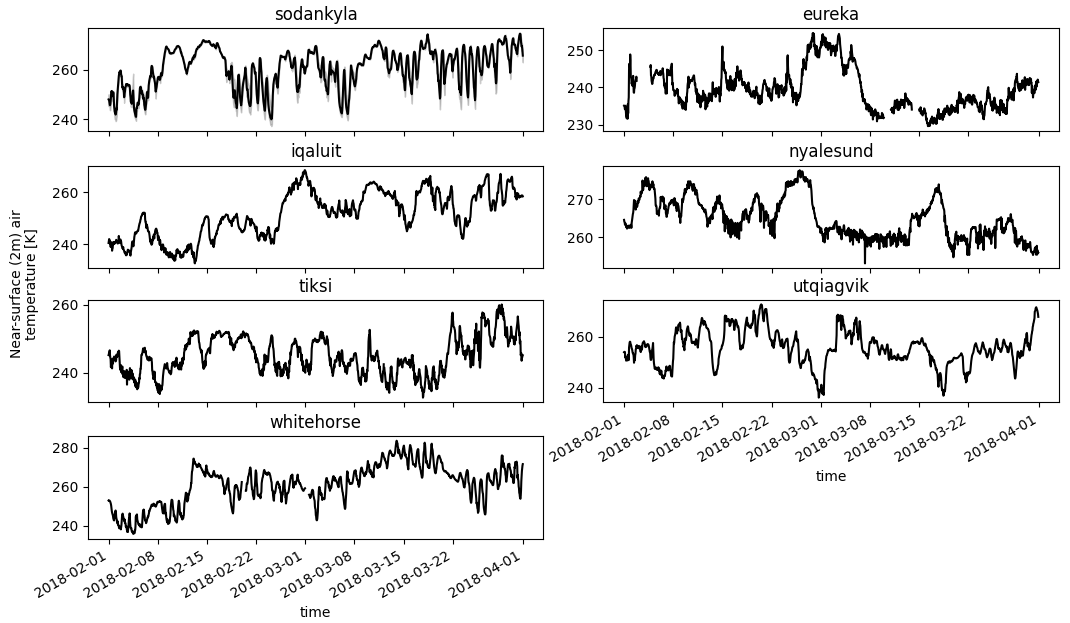
Figure 11Similar to Fig. 10, except for observations of near-surface (2 m) air temperature (tas) conducted at each site during SOP1.
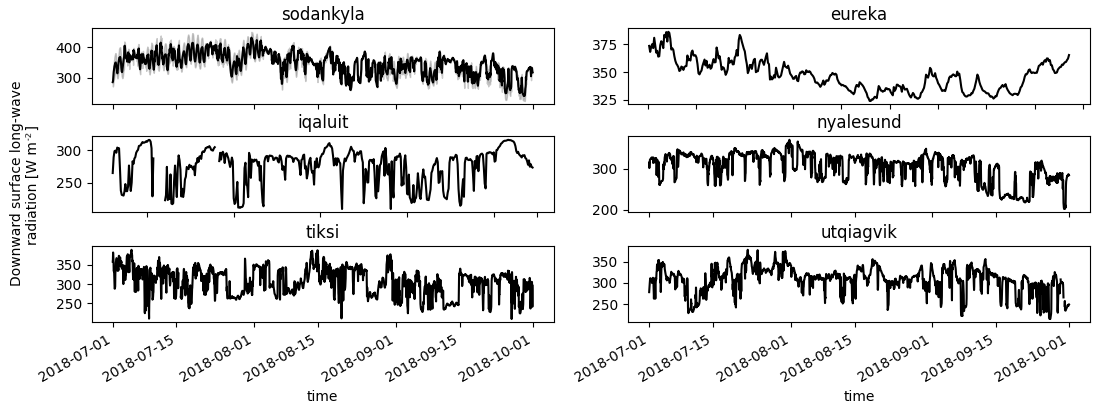
Figure 12Similar to Fig. 10, except for observations of downward surface long-wave radiation (rlds) conducted during SOP2 at each site. Observations from Whitehorse were not available during SOP2.
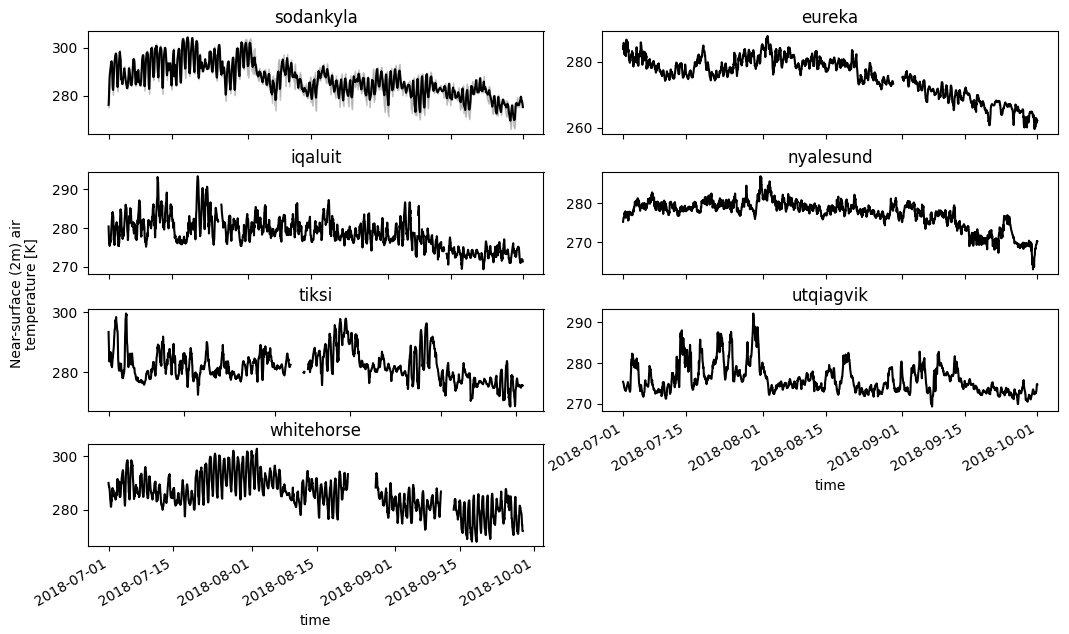
Figure 13Similar to Fig. 10, except for observations of near-surface (2 m) air temperature (tas) conducted at each site during SOP2.
As an example of the uniformity of the observations (in terms of data format, post-processing, temporal cadence, etc.) contained within each site's MODFysm and their data coverage during the two YOPP SOPs, Figs. 10 and 11 provide the surface downwelling long-wave radiation and near-surface temperature observations from each site's MODFysm during SOP1, respectively, and Figs. 12 and 13 show the same, except for SOP2. The MET Norway data portal and MODF maker toolkit (Sects. 6 and 7) also provides plotting tools that work with any MODF or MMDF and can produce similar figures automatically. Periods of interest can be quickly identified by users and analyzed for further investigation and/or comparison with their corresponding MMDFs. MODFs significantly simplify the process of analyzing observations from multiple sites and multiple instruments, as analyses and figures can be produced for each site using a single code that works for any observed geophysical variable and (if desired) their corresponding NWP model output in the MMDF. In contrast, without MODFs, a user would have to contact each meteorological agency individually, find each site's data repository, obtain data access privileges, find the files they need from multiple instruments, reprocess and reformat multiple uniquely formatted datasets and file types, then develop several different codes (e.g., readers) specific to each instrument's dataset to ingest the multi-variate datasets and plot them.
The MODFysm at Sodankylä is unique in that its measurements are collected across a series of sub-sites in the area; therefore, it is important to describe here the possible methods for extracting the data for specific locations or for co-located measurements. The Sodankylä station comprises at least 25 distinct locations, the precise number of which is given by the dimension site_id inside the MODF data file. Each distinct location is given a unique index key in the variable subsite_name, with these indices also identifying the lat, lon, and soil_type for each location. The corresponding FMI names for each location are identified in the attribute flag_meanings for the variable subsite_name via their indices – for example, the index value of 16 pointing to IOA003_spot_8, which is one of the automatic weather stations located in the Intensive Observations Area (IOA). There may be multiple locations providing the same measurement. However, not all locations provide the same set of measurements, and to keep the MODF compact, each measurement variable has the location dimension truncated to include only locations which measure that variable; i.e., the location dimension for the measurement variables is nsubsites_X, where X is the number of locations making the particular measurement. This set of locations is accessed through the indices given in the attribute subsite_name for the measurement variable, which corresponds to the key given in the subsite_name variable; i.e., a subsite_name attribute of “1, 3, 10” means that these measurements were made at the locations identified by their indices, from which their locations (latitudes and longitudes) and soil_type can also be determined.
This method permits diverse options of collecting measurements for particular uses. All measurements, for example, at one location can be obtained by identifying the appropriate subsite_name index inside the MODF data file, iterating through the subsite_name attribute of each variable to see if it contains the selected index, and, if so, selecting the column or slice of data for the data that match the location of the index (i.e., if subsite_name = 10 and the subsite_name attribute for a timeSeries variable is “1, 3, 10”, the measurement timeSeries for the requested location is in the third column, the next variable may have a subsite_name attribute of “1, 3, 5, 6, 10”, and the measurement timeSeries for the requested location is in the fifth column). The user could also select a specific area of interest and identify all measurements made within this region as follows: select the indices for the locations within a specified latitude and longitude range, then iterate through the subsite_name attribute of each variable to see if it contains the selected indices and return the columns or slices that match them.
Note that each site conducts additional observations not listed in Table 3 that will be included in upcoming updates to the MODFysm, with the intent to eventually incorporate all observations into the MODFysm for each site. This process of developing and appending to MODFs can be extended to other sites and/or research programs that wish to create MODFs of their observations. Given the standardized nature of the MODFs, reading and analyzing datasets from any of the YOPP sites is simplified. Quick-look plotting tools have been developed via the MET Norway YOPP Data Portal and the MODF maker toolkit (Sects. 6 and 7), which enable near-instantaneous plotting of the observations contained within the MODFysm.
The MODFysm for each site are available via the MET Norway YOPP Data Portal (https://yopp.met.no/, last access: 13 May 2024), where they are indexed through FAIR-compliant discovery metadata and can be directly accessed at https://thredds.met.no/thredds/catalog/alertness/YOPP_supersite/obs/catalog.html (last access: 13 May 2024) (Whitehorse: https://doi.org/10.21343/a33e-j150, Huang et al., 2023a; Iqaluit: https://doi.org/10.21343/yrnf-ck57, Huang et al., 2023b; Sodankylä: https://doi.org/10.21343/m16p-pq17, O'Connor, 2023; Utqiaġvik: https://doi.org/10.21343/a2dx-nq55, Akish and Morris, 2023c; Tiksi: https://doi.org/10.21343/5bwn-w881, Akish and Morris, 2023b; Ny-Ålesund: https://doi.org/10.21343/y89m-6393, Holt, 2023; and Eureka: https://doi.org/10.21343/r85j-tc61, Akish and Morris, 2023a).
Proper data citation ensures appropriate credits to authors of both input data sources and merged MODFysm datasets. Data from each station have been assigned a DOI. The variable attributes of the merged data products contain information about the source data streams and their DOIs to more clearly establish data provenance in a traceable manner. When using data from the MODFyms, it is expected that the user references the MODFysm DOI and any subsidiary variable DOIs when available. Assigning citations for merged data streams such as the MODFysm is a challenging and still evolving concept. For example, the US DOE ARM Program uses a combination of DOI and citation structure for continuous data streams, as outlined in Prakash et al. (2016). They recommend that when registering DOIs for derived and higher-order data, source DOIs in the metadata of the newly created DOI should be added and linked when possible.
The source code used to produce the MODFysm for each site (and MODFs in general) are available via GitLab at https://gitlab.com/mdf-makers/mdf-toolkit (Gallagher et al., 2021). This MODF toolkit is openly available for anyone interested in developing their own MODF file or generating quick-look plots of the data contents inside the MODFs. The toolkit is regularly updated as the MODF community grows and new geophysical variables and/or functions are added. Additional site-specific Python and MATLAB codes that were used to prepare the observation data files for MODF ingestion are available upon request (e.g., contact the site principle investigator).
The enhanced ground-based observations conducted at both poles during the YOPP fill significant and identified gaps in our current meteorological observation capabilities for the polar regions. YOPPsiteMIP MODFs (MODFysm) have been published for seven of the YOPP Arctic sites whereby all geophysical variables are stored in an identical, standardized format in a single NetCDF file, following CF conventions. This fulfils a key objective of the program to perform single- or multi-variate model–observation comparisons. These MODFs archive data in a manner as similar as possible to corresponding MMDFs (see Uttal et al., 2023) that contain high-resolution forecast variables from a single NWP model at and around a site (Fig. 9). Thus, combined, MODFs and MMDFs greatly simplify the integration of these complex datasets, enabling further scientific study, as demonstrated in the recent publications using the latest MODFysm and MMDFysm (Day et al., 2023).
Standardized geophysical variable nomenclature, cadences, metadata, basic QC, and file structure were employed to create these files. MODFs provide the first standardized files for archiving all the different ground-based site observations, containing a multitude of geophysical variables observed by (at times) different instruments. This amalgamation of different sites' observations into a standardized, user-friendly MODF format enables the easier analysis of the MODF dataset, inter-site comparisons, and detailed NWP model validation, evaluation, intercomparisons, and process-based diagnostic studies that are currently underway (e.g., Figs. 10–13). The further adoption, creation, and use of MODFs outside of YOPP is encouraged; a suite of tools and documentation is openly available via GitLab (Sect. 7) for other site managers, researchers, and users to develop and create their own site-specific MODFs outside of YOPP or to analyze an observation site's dataset.
The YOPP MODFysm discussed here provides novel access to datasets of enhanced meteorological observations collected at several sites across the Arctic. The MODF concept is not limited for use in polar regions and could be exported elsewhere. Seven YOPP-designated sites in the Arctic developed and published MODFysm covering both SOP periods (February–March 2018 and July–September 2018), including Iqaluit, Whitehorse, and Eureka in Canada; Utqiaġvik in the United States; Tiksi in Russia; Sodankylä in Finland; and Ny-Ålesund in Norway. Additional geophysical variables observed at each of these seven sites will be included in a future update of their MODFysm, with the goal of having almost all of a site's observations available. Observations at most of these sites continue today beyond YOPP and are available for subsequent analyses, in some cases using updated MODFs generated in near real time. MODFysm for the other YOPP sites, including ship-based platforms and sites in the Antarctic, will be made available in the future to complete the YOPP dataset. The MODFysm described here directly ties to process-oriented verification studies aiming to improve NWP predictions at the poles by contributing and enabling NWP intercomparisons.
Table A1List of the instruments that contributed to the Whitehorse MODF, including details about the instrument manufacturer, measured variables, configuration, temporal resolution, measurement uncertainty, and quality control applied. Unless otherwise stated in the instrument configuration column, all instruments were deployed at 2 m a.g.l. The MODF featureType timeSeries variables are listed first, with timeSeriesProfile and timeSeriesProfileSonde variables listed last.
Table A2Same as Table A1, except for the Iqaluit MODF.
* A variable that is not included in the H–K table.
Table A5Same as Table A1, except for the Tiksi MODF.
NA: not available.
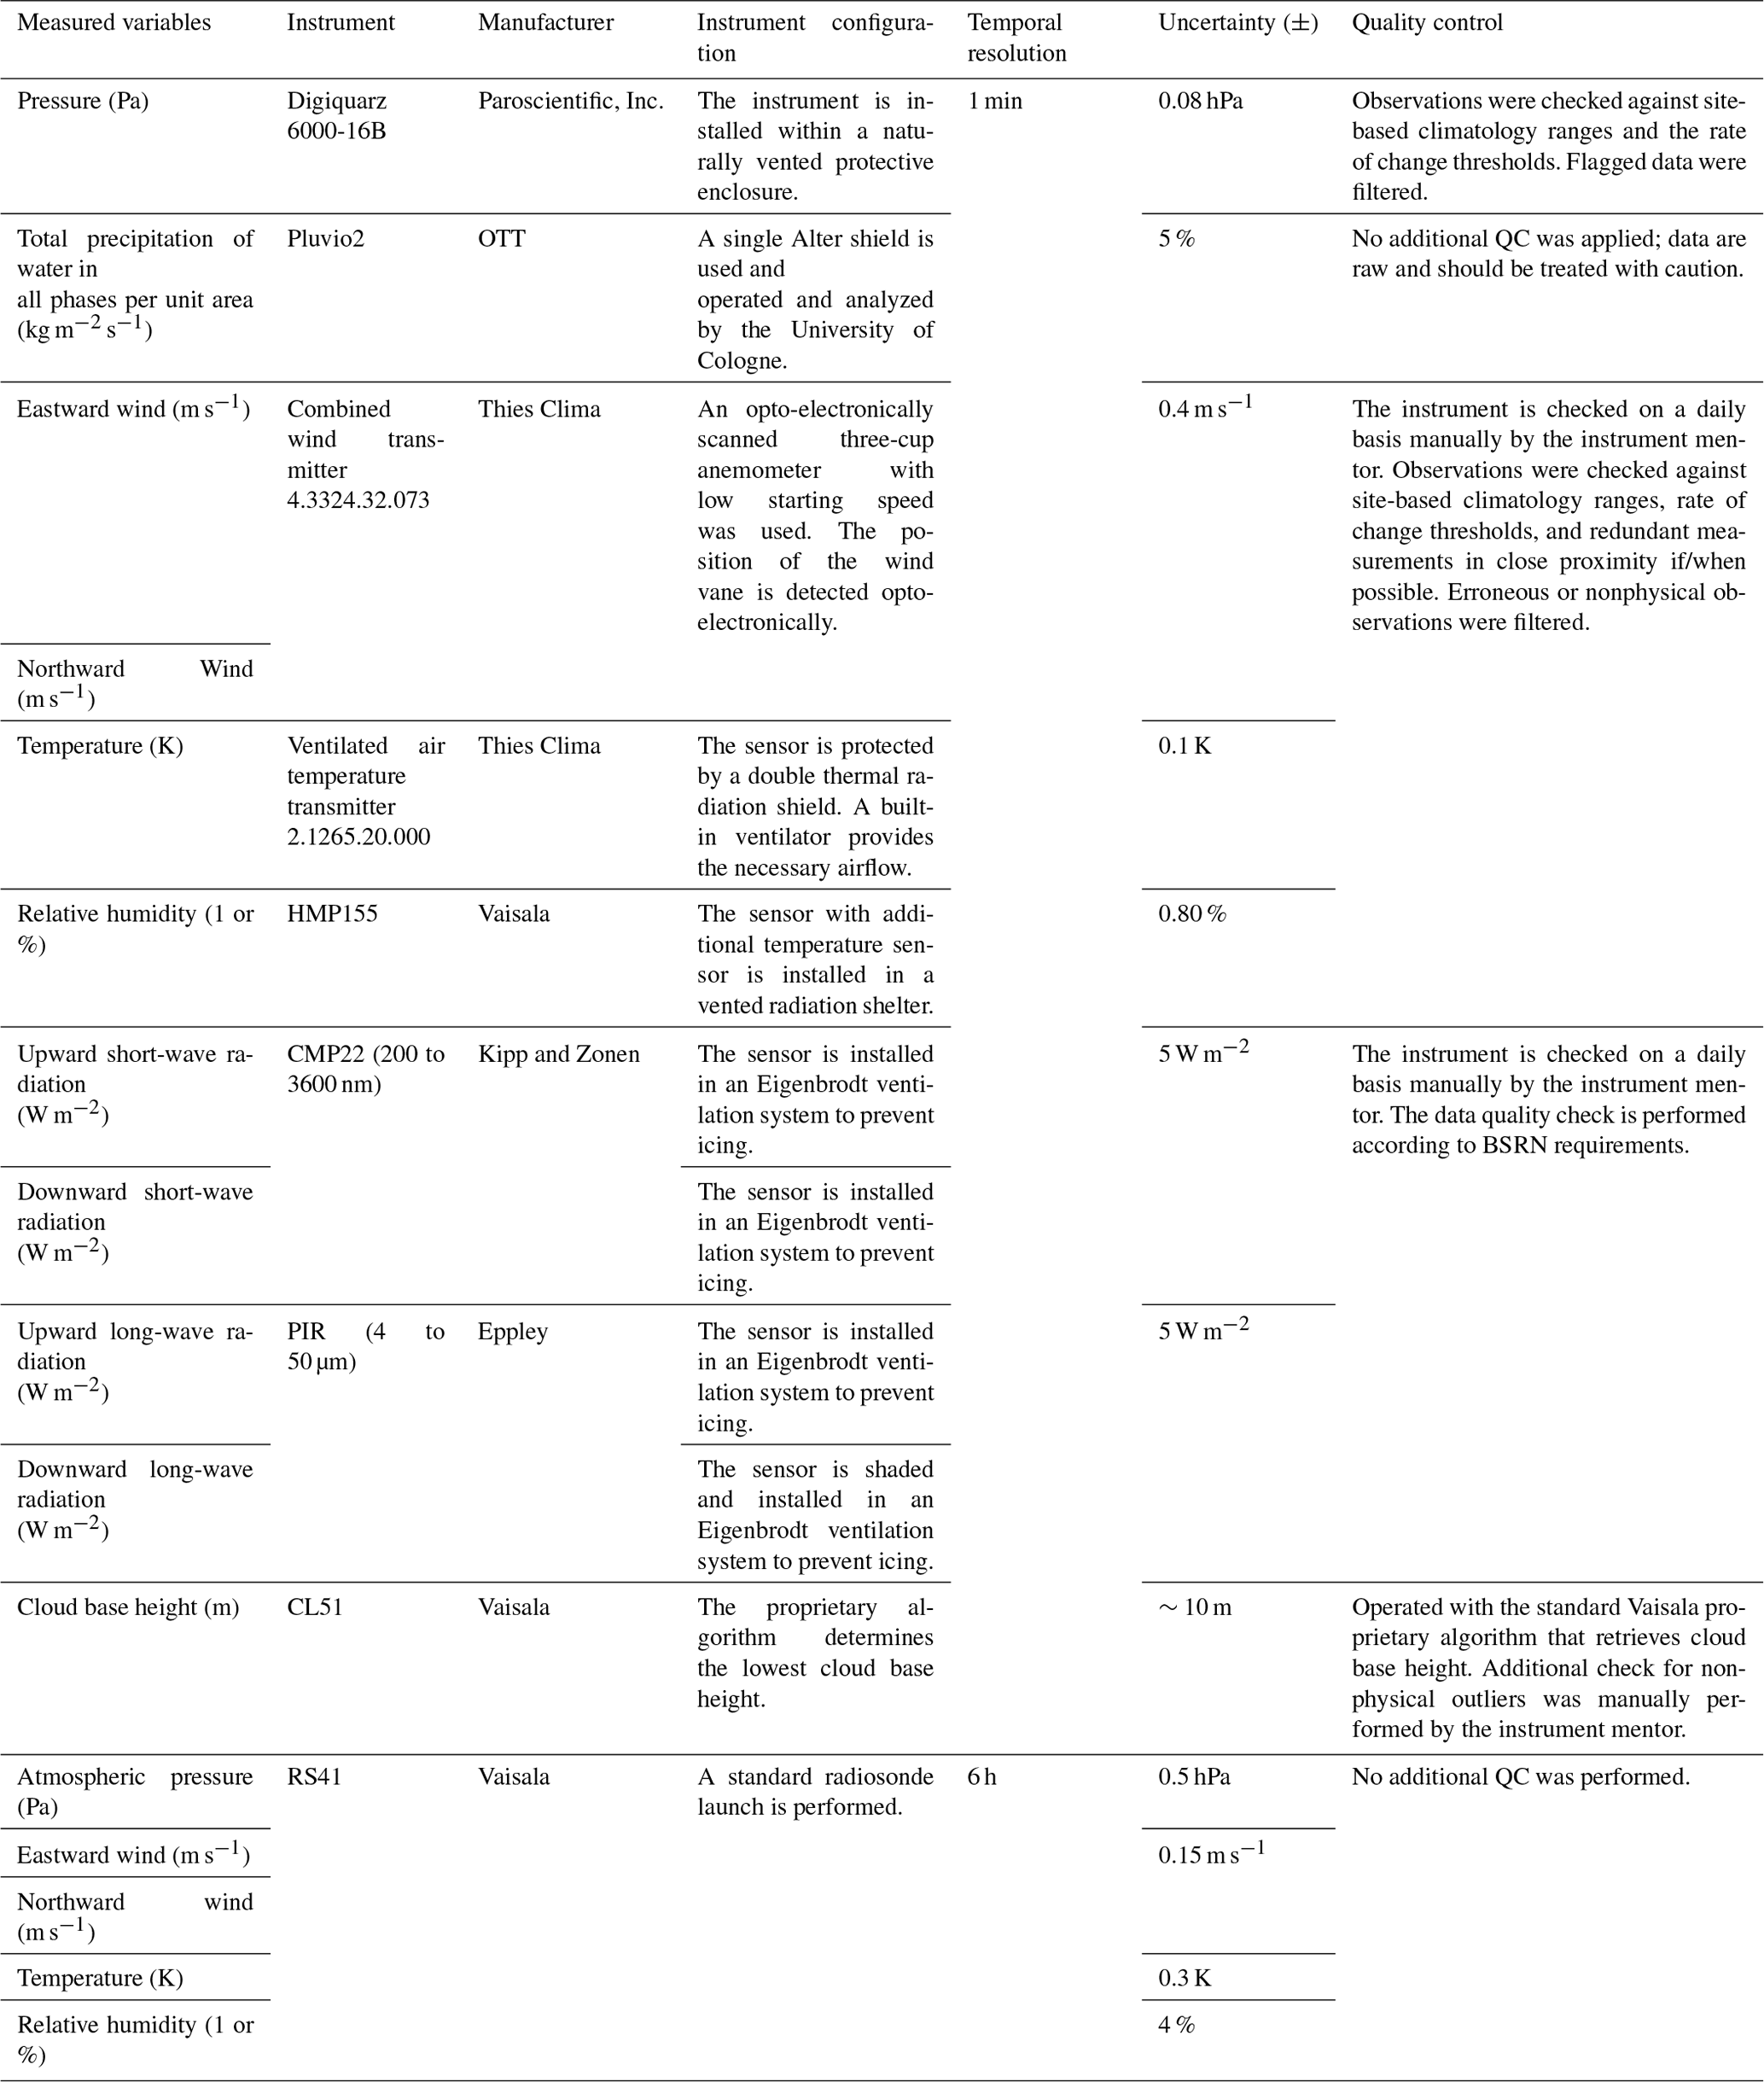
Table A7Same as Table A1, except for the Eureka MODF.
NA: not available.
SMM, ZM, and TU wrote the first draft of the paper. SMM and ZM conducted scientific analyses and created tables and figures with JD and JT. All authors managed data archiving, creation of the MODFysm, and publication to the MET Norway YOPP Data Portal. All authors contributed to the writing and the editing of the paper.
The contact author has declared that none of the authors has any competing interests.
Use of specific instrument manufacturers/models and suppliers mentioned in the paper and/or used at the sites is not a commercial endorsement of their products.
Publisher's note: Copernicus Publications remains neutral with regard to jurisdictional claims made in the text, published maps, institutional affiliations, or any other geographical representation in this paper. While Copernicus Publications makes every effort to include appropriate place names, the final responsibility lies with the authors.
This is a contribution to the Year of Polar Prediction (YOPP), a flagship activity of the Polar Prediction Project (PPP) initiated by the World Weather Research Programme (WWRP) of the World Meteorological Organization (WMO). We acknowledge the WMO WWRP for its role in coordinating this international research activity. This study was supported by NOAA's Global Ocean Monitoring and Observing Program through the Arctic Research Program (FundRef at https://doi.org/10.13039/100018302, NOAA, 2021). Special thanks to the station technicians and operators at the sites for deploying instruments, maintenance, and technical services. Thank you to the radiosonde operators in particular for providing extra daily sonde launches during the two SOP periods. Thank you to Jenn Glaser for her contract work in creating the station graphic in Fig. 1 and to Kyrie Newby and Kalvin Jesse for creating the Google Earth images in Fig. 9. Portions of the MODFysm data were obtained from the Atmospheric Radiation Measurement (ARM) user facility, a US Department of Energy (DOE) Office of Science user facility managed by the biological and environmental research program. Thank you to MET Norway for hosting the YOPP Data Portal. All data products are produced by their respective institutions and are available via the YOPP Data Portal (https://yopp.met.no, last access: 13 May 2024) and directly at https://thredds.met.no/thredds/catalog/alertness/YOPP_supersite/obs/catalog.html (last access: 13 May 2024).
Jonathan Day was supported by the INTERACT III project funded by the European Union (grant agreement no. 871120). Elena Akish and Leslie M. Hartten were supported in part by NOAA cooperative agreements (grant nos. NA17OAR4320101 and NA22OAR4320151).
This paper was edited by Baptiste Vandecrux and reviewed by two anonymous referees.
Akish, E. and Morris, S.: MODF for Eureka, Canada, during YOPP SOP1 and SOP2, Norwegian Meteorological Institute [data set], https://doi.org/10.21343/R85J-TC61, 2023a.
Akish, E. and Morris, S.: MODF for Tiksi, Russia, during YOPP SOP1 and SOP2, Norwegian Meteorological Institute [data set], https://doi.org/10.21343/5BWN-W881, 2023b.
Akish, E. and Morris, S.: MODF for Utqiagvik, Alaska, during YOPP SOP1 and SOP2, Norwegian Meteorological Institute [data set], https://doi.org/10.21343/A2DX-NQ55, 2023c.
ARM Data Discovery: sondewnpn data product, ARM Data Discovery [data set], https://doi.org/10.5439/1595321, last access: 13 May 2024.
Baldocchi, D.: Measuring fluxes of trace gases and energy between ecosystems and the atmosphere – the state and future of the eddy covariance method, Global Change Biol., 20, 3600–3609, https://doi.org/10.1111/gcb.12649, 2014.
Becherini, F., Vitale, V., Lupi, A., Stone, R. S., Salvatori, R.,Salzano, R., di Carlo, P., Viola, A. P., and Mazzola, M.: Surface albedo and spring snow melt variations at Ny-Ålesund, Svalbard, B. Atmos. Sci. Technol., 2, 14, https://doi.org/10.1007/s42865-021-00043-8, 2021.
Cassano, J. J., Higgins, M. E., and Seefeldt, M. W.: Performance of the Weather Research and Forecasting Model for Month-Long Pan-Arctic Simulations, Mon. Weather Rev., 139, 3469–3488, https://doi.org/10.1175/mwr-d-10-05065.1, 2011.
Cohen, J., Rautiainen, K., Lemmetyinen, J., Smolander, T., Vehvilainen, J., and Pulliainen, J.: Sentinel-1 based soil freeze/thaw estimation in boreal forest environments, Remote Sens. Environ., 254, 112267, https://doi.org/10.1016/j.rse.2020.112267, 2021.
Cook, B. I., Bonan, G. B., Levis, S., Bonan, G. B., Levis, S., and Epstein, H. E.: The thermoinsulation effect of snow cover within a climate model, Clim. Dynam., 31, 107–124, https://doi.org/10.1007/s00382-007-0341-y, 2008.
Cox, C. J., Walden, V. P., and Rowe, P. M.: A Comparison of the atmospheric conditions at Eureka, Canada, and Barrow, Alaska (2006–2008), J. Geophys. Res., 117, D12204, https://doi.org/10.1029/2011JD017164, 2012.
Cox, C. J., Stone, R. S., Douglas, D. C., Stanitski, D. M., Divoky, G. J., Dutton, E. S., Sweeney, C., George, J. C., and Longenecker, D. U.: Drivers and Environmental Responses to the Changing Annual Snow Cycle of Northern Alaska, B, Am, Meteorol, Soc,, 98, 2559–2577, https://doi.org/10.1175/BAMS-D-16-0201.1, 2017.
Day, J. J., Sandu, I., Magnusson, L., Rodwell, M. J., Lawrence, H., Bormann, N., and Jung, T.: Increased Arctic influence on the midlatitude flow during Scandinavian Blocking episodes, Q. J. Roy. Meteor. Soc., 725, 3846–3862, https://doi.org/10.1002/qj.3673, 2019.
Day, J., Svensson, G., Casati, B., Uttal, T., Khalsa, S.-J., Bazile, E., Akish, E., Azouz, N., Ferrighi, L., Frank, H., Gallagher, M., Godøy, Ø., Hartten, L., Huang, L. X., Holt, J., Di Stefano, M., Suomi, I., Mariani, Z., Morris, S., O'Connor, E., Pirazzini, R., Remes, T., Fadeev, R., Solomon, A., Tjernström, J., and Tolstykh, M.: The YOPP site Model Intercomparison Project (YOPPsiteMIP) phase 1: project overview and Arctic winter forecast evaluation, EGUsphere [preprint], https://doi.org/10.5194/egusphere-2023-1951, 2023.
Driemel, A., Augustine, J., Behrens, K., Colle, S., Cox, C., Cuevas-Agulló, E., Denn, F. M., Duprat, T., Fukuda, M., Grobe, H., Haeffelin, M., Hodges, G., Hyett, N., Ijima, O., Kallis, A., Knap, W., Kustov, V., Long, C. N., Longenecker, D., Lupi, A., Maturilli, M., Mimouni, M., Ntsangwane, L., Ogihara, H., Olano, X., Olefs, M., Omori, M., Passamani, L., Pereira, E. B., Schmithüsen, H., Schumacher, S., Sieger, R., Tamlyn, J., Vogt, R., Vuilleumier, L., Xia, X., Ohmura, A., and König-Langlo, G.: Baseline Surface Radiation Network (BSRN): structure and data description (1992–2017), Earth Syst. Sci. Data, 10, 1491–1501, https://doi.org/10.5194/essd-10-1491-2018, 2018.
Durre, I., Vose, R. S., and Wuertz, D. B.: Overview of the Integrated Global Radiosonde Archive, J. Climate, 19, 53–68, https://doi.org/10.1175/Jcli3594.1, 2006.
Durre, I., Menne, M. J., and Vose, R. S.: Strategies for evaluating quality assurance procedures, J. Appl. Meteorol. Clim., 47, 1785–1791, https://doi.org/10.1175/2007jamc1706.1, 2008.
Durre, I., Yin, X., Vose, R. S., Applequist, S., and Arnfield, J.: Enhancing the Data Coverage in the Integrated Global Radiosonde Archive, J. Atmos. Ocean. Tech., 35, 1753–1770, https://doi.org/10.1175/JTECH-D-17-0223.1, 2018.
Fogal, P. F., LeBlanc, L. M., and Drummond, J. R.: The Polar Environment Atmospheric Research Laboratory (PEARL): Sounding the Atmosphere at 80 degrees North, Arctic, 66, 377–386, 2013.
Fuehrer, P. L. and Friehe, C. A.: Flux Corrections Revisited, Bound.-Lay. Meteorol., 102, 415–458, https://doi.org/10.1023/A:1013826900579, 2002.
Gallagher, M. and Tjernström, J.: Accelerating research in weather prediction and model improvement with new free community open source software tools, in preparation, 2024.
Gallagher, M., Holt, J., Hartten, L., Khalsa, S. J., Uttal, T., and Svensson, G.: Merged Data File toolkit for file creation and checking, GitLab [code], https://gitlab.com/mdf-makers/mdf-toolkit (last access: 27 June 2024), 2021.
Goessling, H. F., Jung, T., Klebe, S., Baeseman, J., Bauer, P., Chen, P., Chevallier, M., Dole, R., Gordon, N., Ruti, P., Bradley, A., Bromwich, D. H., Casati, B., Chechin, D., Day, J. J., Massonnet, F., Mills, B., Renfrew, I., Smith, G., and Tatusko, R.: Paving the Way for the Year of Polar Prediction, B. Am. Meteorol. Soc., 97, Es85–Es88, https://doi.org/10.1175/Bams-D-15-00270.1, 2016.
Hannula, H.-R., Lemmetyinen, J., Kontu, A., Derksen, C., and Pulliainen, J.: Spatial and temporal variation of bulk snow properties in northern boreal and tundra environments based on extensive field measurements, Geosci. Instrum. Method. Data Syst., 5, 347–363, https://doi.org/10.5194/gi-5-347-2016, 2016.
Hartten, L. M. and Khalsa, S. J. S.: The H-K Variable SchemaTable developed for the YOPPsiteMIP (1.2), Zenodo [code], https://doi.org/10.5281/zenodo.6463464, 2022.
Hinkel, K. M. and Nelson, F. E.: Anthropogenic heat island at Barrow, Alaska, during winter: 2001–2005, J. Geophys. Res., 112, D06118, https://doi.org/10.1029/2006JD007837, 2007.
Holt, J.: Merged Observatory Data File (MODF) for Ny Alesund, Norwegian Meteorological Institute [data set], https://doi.org/10.21343/Y89M-6393, 2023.
Huang, L., Mariani, Z., and Crawford, R.: MODF for Erik Nielsen Airport, Whitehorse, Canada during YOPP SOP1 and SOP2, Norwegian Meteorological Institute [data set], https://doi.org/10.21343/A33E-J150, 2023a.
Huang, L., Mariani, Z., and Crawford, R.: MODF for Iqaluit Airport, Iqaluit, Nunavut, Canada during YOPP SOP1 and SOP2, Norwegian Meteorological Institute [data set], https://doi.org/10.21343/YRNF-CK57, 2023b.
Illingworth, A. J., Cimini, D., Gaffard, C., Haeffelin, M., Lehmann, V., Lohnert, U., O'Connor, E. J., and Ruffieux, D.: Exploiting Existing Ground-Based Remote Sensing Networks to Improve High-Resolution Weather Forecasts, B. Am. Meteorol. Soc., 96, 2107–2125, https://doi.org/10.1175/Bams-D-13-00283.1, 2015.
Joe, P., Melo, S., Burrows, W. R., Casati, B., Crawford, R. W., Deghan, A., Gascon, G., Mariani, Z., Milbrandt, J., and Strawbridge, K.: The Canadian Arctic Weather Science Project Introduction to the Iqaluit Site, B. Am. Meteorol. Soc., 101, E109–E128, https://doi.org/10.1175/Bams-D-18-0291.1, 2020.
Jung, T., Gordon, N. D., Bauer, P., Bromwich, D. H., Chevallier, M., Day, J. J., Dawson, J., Doblas-Reyes, F., Fairall, C., Goessling, H. F., Holland, M., Inoue, J., Iversen, T., Klebe, S., Lemke, P., Losch, M., Makshtas, A., Mills, B., Nurmi, P., Perovich, D., Reid, P., Renfrew, I. A., Smith, G., Svensson, G., Tolstykh, M., and Yang, Q. H.: Advancing Polar Prediction Capabilities on Daily to Seasonal Time Scales, B. Am. Meteorol. Soc., 97, 1631, https://doi.org/10.1175/Bams-D-14-00246.1, 2016.
Kochendorfer, J., Earle, M., Hodyss, D., Reverdin, A., Roulet, Y.-A., Nitu, R., Rasmussen, R., Landolt, S., Buisan, S., and Laine, T.: Undercatch Adjustments for Tipping-Bucket Gauge Measurements of Solid Precipitation, J. Hydrometeor., 21, 1193–1205, https://doi.org/10.1175/JHM-D-19-0256.1, 2020.
Koltzow, M., Casati, B., Bazile, E., Haiden, T., and Valkonen, T.: An NWP Model Intercomparison of Surface Weather Parameters in the European Arctic during the Year of Polar Prediction Special Observing Period Northern Hemisphere 1, Weather Forecast, 34, 959–983, https://doi.org/10.1175/Waf-D-19-0003.1, 2019.
Lawrence, H., Bormann, N., Sandu, I., Day, J., Farnan, J., and Bauer, P.: Use and impact of Arctic observations in the ECMWF Numerical Weather Prediction system, Q. J. Roy. Meteor. Soc., 145, 3432–3454, https://doi.org/10.1002/qj.3628, 2019.
Lesins, G., Duck, T. J., and Drummond, J. R.: Climate trends at Eureka in the Canadian high arctic, Atmos. Ocean, 48, 59–80, https://doi.org/10.3137/AO1103.2010, 2010.
Long, C. N. and Shi, Y.: An Automated Quality Assessment and Control Algorithm for Surface Radiation Measurements, Open Atmos. Sci. J., 2, 23–37, https://doi.org/10.2174/1874282300802010023, 2008.
Luojus, K., Pulliainen, J., Takala, M., Lemmetyinen, J., Mortimer, C., Derksen, C., Mudryk, L., Moisander, M., Hiltunen, M., Smolander, T., Ikonen, J., Cohen, J., Salminen, M., Norberg, J., Veijola, K., and Venalainen, P.: GlobSnow v3.0 Northern Hemisphere snow water equivalent dataset, Sci. Data, 8, 163, https://doi.org/10.1038/s41597-021-00939-2, 2021.
Mariani, Z., Dehghan, A., Gascon, G., Joe, P., Hudak, D., Strawbridge, K., and Corriveau, J.: Multi-Instrument Observations of Prolonged Stratified Wind Layers at Iqaluit, Nunavut, Geophys. Res. Lett., 45, 1654–1660, https://doi.org/10.1002/2017gl076907, 2018.
Mariani, Z., Crawford, R., Casati, B., and Lemay, F.: A Multi-Year Evaluation of Doppler Lidar Wind-Profile Observations in the Arctic, Remote Sens.-Basel, 12, 323, https://doi.org/10.3390/rs12020323, 2020.
Mariani, Z., Hicks-Jalali, S., Strawbridge, K.,Gwozdecky, J., Crawford, R. W., Casati, B., Lemay, F., Lehtinen, R., and Tuominen, P.: Evaluation of Arctic Water Vapor Profile Observations from a Differential Absorption Lidar, Remote Sens., 13, 551, https://doi.org/10.3390/rs13040551, 2021.
Mariani, Z., Huang, L., Crawford, R., Blanchet, J.-P., Hicks-Jalali, S., Mekis, E., Pelletier, L., Rodriguez, P., and Strawbridge, K.: Enhanced automated meteorological observations at the Canadian Arctic Weather Science (CAWS) supersites, Earth Syst. Sci. Data, 14, 4995–5017, https://doi.org/10.5194/essd-14-4995-2022, 2022.
Matrosov, S. Y., Shupe, M. D., and Uttal, T.: High temporal resolution estimates of Arctic snowfall rates emphasizing gauge and radar-based retrievals from the MOSAiC expedition, Elementa, 10, 00101, https://doi.org/10.1525/elementa.2021.00101, 2022.
Maturilli, M.: Basic and other measurements of radiation at station Ny-Ålesund (2006-05 et seq), Alfred Wegener Institute – Research Unit Potsdam, PANGAEA [data set], https://doi.org/10.1594/PANGAEA.914927, 2020a.
Maturilli, M.: Continuous meteorological observations at station Ny-Ålesund (2011-08 et seq), Alfred Wegener Institute – Research Unit Potsdam, PANGAEA [data set], https://doi.org/10.1594/PANGAEA.914979, 2020b.
Maturilli, M.: High resolution radiosonde measurements from station Ny-Ålesund (2017-04 et seq), Alfred Wegener Institute – Research Unit Potsdam, PANGAEA [data set], https://doi.org/10.1594/PANGAEA.914973, 2020c.
Maturilli, M.: Ceilometer cloud base height from station Ny-Ålesund (2017-08 et seq), Alfred Wegener Institute – Research Unit Potsdam, PANGAEA [data set], https://doi.org/10.1594/PANGAEA.942331, 2022.
Maturilli, M., Herber, A., and König-Langlo, G.: Climatology and time series of surface meteorology in Ny-Ålesund, Svalbard, Earth Syst. Sci. Data, 5, 155–163, https://doi.org/10.5194/essd-5-155-2013, 2013.
Maturilli, M., Hanssen-Bauer, I., Neuber, R., Rex, M., and Edvardsen, K.: The Atmosphere above Ny-Ålesund – Climate and global warming, ozone and surface UV radiation, in: Advances in Polar Ecology, The Ecosystem of Kongsfjorden, Svalbard, edited by: Hop, H. and Wiencke, C., Advances in Polar Ecology, The Ecosystem of Kongsfjorden, Svalbard, Springer, ISBN 978-3-319-46423-7, https://doi.org/10.1007/978-3-319-46425-1_2, 2019.
Mikola, J., Virtanen, T., Linkosalmi, M., Vähä, E., Nyman, J., Postanogova, O., Räsänen, A., Kotze, D. J., Laurila, T., Juutinen, S., Kondratyev, V., and Aurela, M.: Spatial variation and linkages of soil and vegetation in the Siberian Arctic tundra – coupling field observations with remote sensing data, Biogeosciences, 15, 2781–2801, https://doi.org/10.5194/bg-15-2781-2018, 2018.
Morris, S. M. and Akish, E.: A-M Variable and Attribute Template Table developed for the YOPPsiteMIP (1.2), Zenodo [data set], https://doi.org/10.5281/zenodo.6974550, 2022.
NCCS: Climate in Svalbard 2100 – a knowledge base for climate adaptation, Ocean Best Practices [data set], https://doi.org/10.25607/OBP-888, 2018.
NOAA: Global Ocean Monitoring and Observing Program, NOAA, https://doi.org/10.13039/100018302, 2021.
O'Connor, E.: Merged observation data file for Sodankyla, Norwegian Meteorological Institute [data set], https://doi.org/10.21343/M16P-PQ17, 2023.
Ohmura, A., Dutton, E. G., Forgan, B., Frohlich, C., Gilgen, H., Hegner, H., Heimo, A., Konig-Langlo, G., McArther, B., Muller, G., Philipona, R., Pinker, R., Whitlock, C.H., Dehne, K., and Wild, M.: Baseline Surface Radiation Network (BSRN/WCRP): New Precision Radiometry for Climate Research, B. Am. Meteorol. Soc., 79, 2115–2136, https://doi.org/10.1175/1520-0477(1998)079<2115:BSRNBW>2.0.CO;2, 1998.
Persson, O. and Stone, R.: Evidence of forcing of Arctic regional climates by mesoscale processes, AMS Symposium on Connection Between Mesoscale Processes and Climate Variability, San Antonio, Texas, 15–16 January 2007, 2.6, https://ams.confex.com/ams/87ANNUAL/techprogram/paper_119015.htm (last access: 13 May 2024), 2007.
Pollard, W. H. and Bell, T.: Massive Ice Formation in the Eureka Sound Lowlands: A Landscape Model, PERMAFROST – Seventh International Conference, Yellowknife, Canada, Collection Nordicana, 1998.
Pollard, W. H., Ward, M. A., and Becker, M. S.: The Eureka Sound lowlands: an ice-rich permafrost landscape in transition, Dept. of Geography, McGill University, https://members.cgs.ca/documents/conference2015/GeoQuebec/papers/402.pdf (last access: 13 May 2024), 2015.
Prakash, G., Shrestha, B., Younkin, K., Jundt, R., Martin, M., and Elliott, J.: Data Always Getting Bigger – A Scalable DOI Architecture for Big and Expanding Scientific Data, Data, 1, 11, https://doi.org/10.3390/data1020011, 2016.
Rantanen, M., Karpechko, A. Y., Lipponen, A., Nordling, K., Hyvarinen, O., Ruosteenoja, K., Vihma, T., and Laaksonen, A.: The Arctic has warmed nearly four times faster than the globe since 1979, Commun. Earth Environ., 3, 168, https://doi.org/10.1038/s43247-022-00498-3, 2022.
Rautiainen, K., Parkkinen, T., Lemmetyinen, J., Schwank, M., Wiesmann, A., Ikonen, J., Derksen, C., Davydov, S., Davydova, A., Boike, J., Langer, M., Drusch, M., and Pulliainen, J.: SMOS prototype algorithm for detecting autumn soil freezing, Remote Sens. Environ., 180, 346–360, https://doi.org/10.1016/j.rse.2016.01.012, 2016.
Sellmann, P. V., Brown, J., Lewellen, R., McKim, H. L., Merry, C. J.: The classification and geomorphic implications of thaw lakes on the Arctic coastal plain, Alaska. Cold Regions Research and Engineering Laboratory (CRREL); CRREL-No. 344, https://hdl.handle.net/11681/5852 (last access: 13 May 2024), 1975.
Shupe, M. D.: Clouds at Arctic Atmospheric Observatories. Part II: Thermodynamic Phase Characteristics, J. Appl. Meteorol. Clim., 50, 645–661, https://doi.org/10.1175/2010JAMC2468.1, 2011.
Shupe, M. D., Walden, V. P., Eloranta, E., Uttal, T., Campbell, J. R., Starkweather, S. M., and Shiobara, M.: Clouds at Arctic Atmospheric Observatories. Part I: Occurrence and Macrophysical Properties, J. Appl. Meteorol. Clim., 50, 626–644, https://doi.org/10.1175/2010JAMC2467.1, 2011.
Stone, R. S., Dutton, E. G., Harris, J. M., and Longenecker, D.: Earlier spring snowmelt in northern Alaska as an indicator of climate change, J. Geophys. Res., 107, ACL 10-1–ACL 10-13, https://doi.org/10.1029/2000JD000286, 2002.
Tremblay, S., Picard, J.-C., Bachelder, J. O., Lutsch, E., Strong, K., Fogal, P., Leaitch, W. R., Sharma, S., Kolonjari, F., Cox, C. J., Chang, R. Y.-W., and Hayes, P. L.: Characterization of aerosol growth events over Ellesmere Island during the summers of 2015 and 2016, Atmos. Chem. Phys., 19, 5589–5604, https://doi.org/10.5194/acp-19-5589-2019, 2019.
Uttal, T., Makshtas, A., and Laurila, T.: The Tiksi International Hydrometeorological Observatory – An Arctic Members Partnership, WMO Bulletin, 62, 22–26, 2013.
Uttal, T., Hartten, L. M., Khalsa, S. J., Casati, B., Svensson, G., Day, J., Holt, J., Akish, E., Morris, S., O'Connor, E., Pirazzini, R., Huang, L. X., Crawford, R., Mariani, Z., Godøy, Ø., Tjernström, J. A. K., Prakash, G., Hickmon, N., Maturilli, M., and Cox, C. J.: Merged Observatory Data Files (MODFs): An Integrated Observational Data Product Supporting Process-Oriented Investigations and Diagnostics, EGUsphere [preprint], https://doi.org/10.5194/egusphere-2023-2413, 2023.
Verlinde, J., Zak, B. D., Shupe, M. D., Ivey, M. D., and Stamnes, K.: The ARM North Slope of Alaska (NSA) Sites, Meteor. Mon., 57, 8.1–8.13, https://doi.org/10.1175/Amsmonographs-D-15-0023.1, 2016.
Weaver, D., Strong, K., Schneider, M., Rowe, P. M., Sioris, C., Walker, K. A., Mariani, Z., Uttal, T., McElroy, C. T., Vömel, H., Spassiani, A., and Drummond, J. R.: Intercomparison of atmospheric water vapour measurements at a Canadian High Arctic site, Atmos. Meas. Tech., 10, 2851–2880, https://doi.org/10.5194/amt-10-2851-2017, 2017.
Widener, K., Bharadwaj, N., and Johnson, K.: Ka-Band ARM Zenith Radar (KAZR) Instrument Handbook, United States Department of Energy (USDOE) [data set], https://doi.org/10.2172/1035855, 2012.
WMO: Guide to Meteorological Instruments and Methods of Observation. WMO-No.8, Geneva, Switzerland, ISBN 978-92-63-10008-5, , 2021.
Wohner, C., Peterseil, J., and Klug, H.: Designing and implementing a data model for describing environmental monitoring and research sites, Ecol. Inform., 70, 101708, https://doi.org/10.1016/j.ecoinf.2022.101708, 2022.
Younkin, K. and Long, C.: Improved Correction of IR Loss in Diffuse Shortwave Measurements: An ARM Value-Added Product, PNNL, Richland, WA, United States, Medium: ED, https://doi.org/10.2172/1020732, 2003.
- Abstract
- Introduction
- Site descriptions
- Instrumentation and derived variable calculation
- Dataset preparation, quality control, and post-processing
- MODF data structure
- Data availability
- Code availability
- Concluding remarks
- Appendix A
- Author contributions
- Competing interests
- Disclaimer
- Acknowledgements
- Financial support
- Review statement
- References