the Creative Commons Attribution 4.0 License.
the Creative Commons Attribution 4.0 License.
 | 13 Jun 2024
LamaH-Ice: LArge-SaMple DAta for Hydrology and Environmental Sciences for Iceland
Bart Nijssen
Access to mountainous regions for monitoring streamflow, snow and glaciers is often difficult, and many rivers are thus not gauged and hydrological measurements are limited. Consequently, cold-region watersheds, particularly heavily glacierized ones, are poorly represented in large-sample hydrology (LSH) datasets. We present a new LSH dataset for Iceland, termed LamaH-Ice (LArge-SaMple DAta for Hydrology and Environmental Sciences for Iceland). Glaciers and ice caps cover about 10 % of Iceland and, while streamflow has been measured for several decades, these measurements have not previously been published in a consistent manner. The dataset provides daily and hourly hydrometeorological time series and catchment characteristics for 107 river basins in Iceland, covering an area of almost 46 000 km2 (45 % of Iceland's area), with catchment sizes ranging from 4 to 7500 km2. LamaH-Ice conforms to the structure of existing LSH datasets and includes most variables contained in these datasets as well as additional information relevant to cold-region hydrology, e.g., time series of snow cover, glacier mass balance and albedo. LamaH-Ice also includes dynamic catchment characteristics to account for changes in land cover, vegetation and glacier extent. A large majority of the watersheds in LamaH-Ice are not subject to human activities, such as diversions and flow regulations. Streamflow measurements under natural flow conditions are highly valuable to hydrologists seeking to model and comprehend the natural hydrological cycle or estimate climate change trends. The LamaH-Ice dataset (Helgason and Nijssen, 2024) is intended for the research community to improve the understanding of hydrology in cold-region environments. LamaH-Ice is publicly available on HydroShare at https://doi.org/10.4211/hs.86117a5f36cc4b7c90a5d54e18161c91 (Helgason and Nijssen, 2024).
- Article
(11663 KB) - Full-text XML
-
Supplement
(805 KB) - BibTeX
- EndNote


In cold regions, glaciers and seasonal snow act as freshwater reservoirs and provide critical water resources for downstream communities. These water resources sustain irrigation, hydropower production, water supply and the health of ecosystems (Barnett et al., 2005; National Research Council, 2012; Niittynen et al., 2018; Immerzeel et al., 2020; Miles et al., 2021). Monitoring hydrological processes in snow and glacier melt-dominated catchments is important for water resource management and for understanding the impacts of climate change in cold regions. However, access to mountainous regions for monitoring snow and glaciers is often difficult (Brown et al., 2014; Rohrer et al., 2013). Many rivers in these regions are thus not gauged, and information about streamflow as well as other hydrological processes is limited. For this reason, there is currently a lack of availability of large datasets including hydrological measurements from snow and glacier melt-dominated catchments.
This paper presents a large-sample hydrology (LSH) dataset for Iceland named LamaH-Ice (LArge-SaMple DAta for Hydrology and Environmental Sciences for Iceland). LamaH-Ice provides easy access to hydrometeorological time series, including multiyear series of observed streamflow, and catchment characteristics for 107 Icelandic catchments. The dataset is available to the scientific community for large-sample studies. The structure of the dataset is based on existing LSH datasets. It is designed to be compatible with the Large-Sample Data for Hydrology and Environmental Sciences for Central Europe (LamaH-CE; Klingler et al., 2021) and the well-known Catchment Attributes for Large-Sample Studies (CAMELS; Addor et al., 2017; Newman et al., 2015). LamaH-Ice offers most hydrometeorological variables and catchment characteristics that are included in these datasets as well as additional information relevant to cold-region hydrology. In particular, LamaH-Ice includes glacier characteristics as well as dynamic catchment characteristics to facilitate the study of the effects of climate change and changes in land cover on hydrology. Streamflow measurements that are uninterrupted by human activities are of great importance in the field of hydrology, e.g., in climate change studies and in evaluations of hydrological model simulations (Stahl et al., 2010; Hannah et al., 2011). A large majority of the streamflow gauges included in LamaH-Ice (79 out of 107) exhibit natural flow conditions.
The hydrological cycle is a complicated system that consists of many different processes, which are characterized by high spatiotemporal variability. To understand these processes, hydrologists rely on data. Hydrologists have long looked for ways to regionalize their understanding, i.e., to transfer knowledge about the runoff response between two separate basins based on hydrological similarity (e.g., Kovács, 1984; Pilgrim, 1983; Merz et al., 2006). As this field of research has progressed, LSH has become an established branch of hydrology, developing rapidly in recent years. LSH studies, in contrast to intensive place- or region-based investigations, use data from many catchments simultaneously for hydrological investigations (Gupta et al., 2014). These studies use data from tens to thousands of catchments to learn from similarities and differences between different regions, enabling the transfer of knowledge between regions and the formulation of reliable conclusions regarding hydrological processes (Addor et al., 2020). The recent, rapid development of LSH has been strongly driven by the application of machine learning (ML) methods in hydrology. In recent years, it has been shown that, by leveraging LSH datasets, hydrologists can build accurate data-driven rainfall–runoff ML models that are generalizable and able to predict streamflow in ungauged basins (Kratzert et al., 2019; Gauch et al., 2021), which has been a long-standing problem in hydrology (Hrachowitz et al., 2013).
Several LSH datasets have now been assembled and published. The CAMELS dataset (Addor et al., 2017; Newman et al., 2015) provides catchment attributes, daily meteorological forcing data, and streamflow measurements for 671 river basins within the contiguous United States. New datasets, consistent with CAMELS, have been produced for other areas of the world, e.g., for Great Britain (CAMELS-GB; Coxon et al., 2020), Chile (CAMELS-CL; Alvarez-Garreton et al., 2018), Australia (CAMELS-AUS; Fowler et al., 2021), Brazil (CAMELS-BR; Chagas et al., 2020), and hydrologic Switzerland (CAMELS-CH; Höge et al., 2023). The meteorological forcings and catchment attributes in all the CAMELS datasets are aggregated over the full upstream area of streamflow gauges, thus offering no spatial variability and lacking information about upstream river networks. LamaH-CE (Klingler et al., 2021) is constructed in a similar manner to the CAMELS dataset, with the main difference that it includes a greater degree of spatially distributed forcings by encompassing intermediate catchments. Additionally, LamaH-CE enhances its temporal resolution by offering hourly hydrometeorological time series. This is important for process understanding and modeling, especially in snow and glacier melt-dominated catchments, where substantial subdaily variability exists in hydrological processes.
The consistent structure of the CAMELS and LamaH-CE datasets allows these datasets to be combined to facilitate global LSH studies. The AI4Water Python package (Abbas et al., 2022) enables users to combine the CAMELS and LamaH datasets for modeling purposes. Kratzert et al. (2023) combined and standardized several existing LSH datasets into Caravan, a unified global LSH dataset. They also provided cloud-based tools to enable users to add additional catchments, which has led to further extensions of the dataset. The first two community additions to Caravan were from Denmark (Koch, 2022) and Israel (Efrat, 2023). We have incorporated 88 catchments from LamaH-Ice into the Caravan dataset, excluding any that experience strong natural or anthropogenic influence on runoff (Sect. 5.9). The Icelandic Caravan extension is available in the LamaH-Ice HydroShare repository.
We chose the LamaH structure over the CAMELS structure for a few reasons. Streamflow observations in Iceland are available for nested catchments, and hourly streamflow observations are available for a part of the time of coverage. Further, LamaH-CE includes meteorological forcings that are available globally (ERA-5 Land, Sect. 4.2) and uses a pan-European land cover classification (Sect. 5.4) as well as a European soil database (Sect. 5.6). Additionally, LamaH-CE includes an important attribute for hydrology in Iceland, i.e., the fraction of each catchment area covered by glaciers.
The LamaH-Ice dataset contains additional variables that have not been part of previous LSH datasets. Time series of catchment-aggregated MODIS snow cover and glacier albedo are included as well as in situ glacier mass balance measurements for glaciated catchments. Topographical characteristics that affect glaciohydrological processes are calculated specifically for the glaciated areas within catchments. The dataset also includes dynamic attributes to account for changes in land cover, vegetation, and glacier extent. These dynamic attributes were also included in the recently released CAMELS-CH dataset (Höge et al., 2023). The inclusion of such dynamic attributes is important in LSH datasets given changes in the environment and their potential impact on water resources.
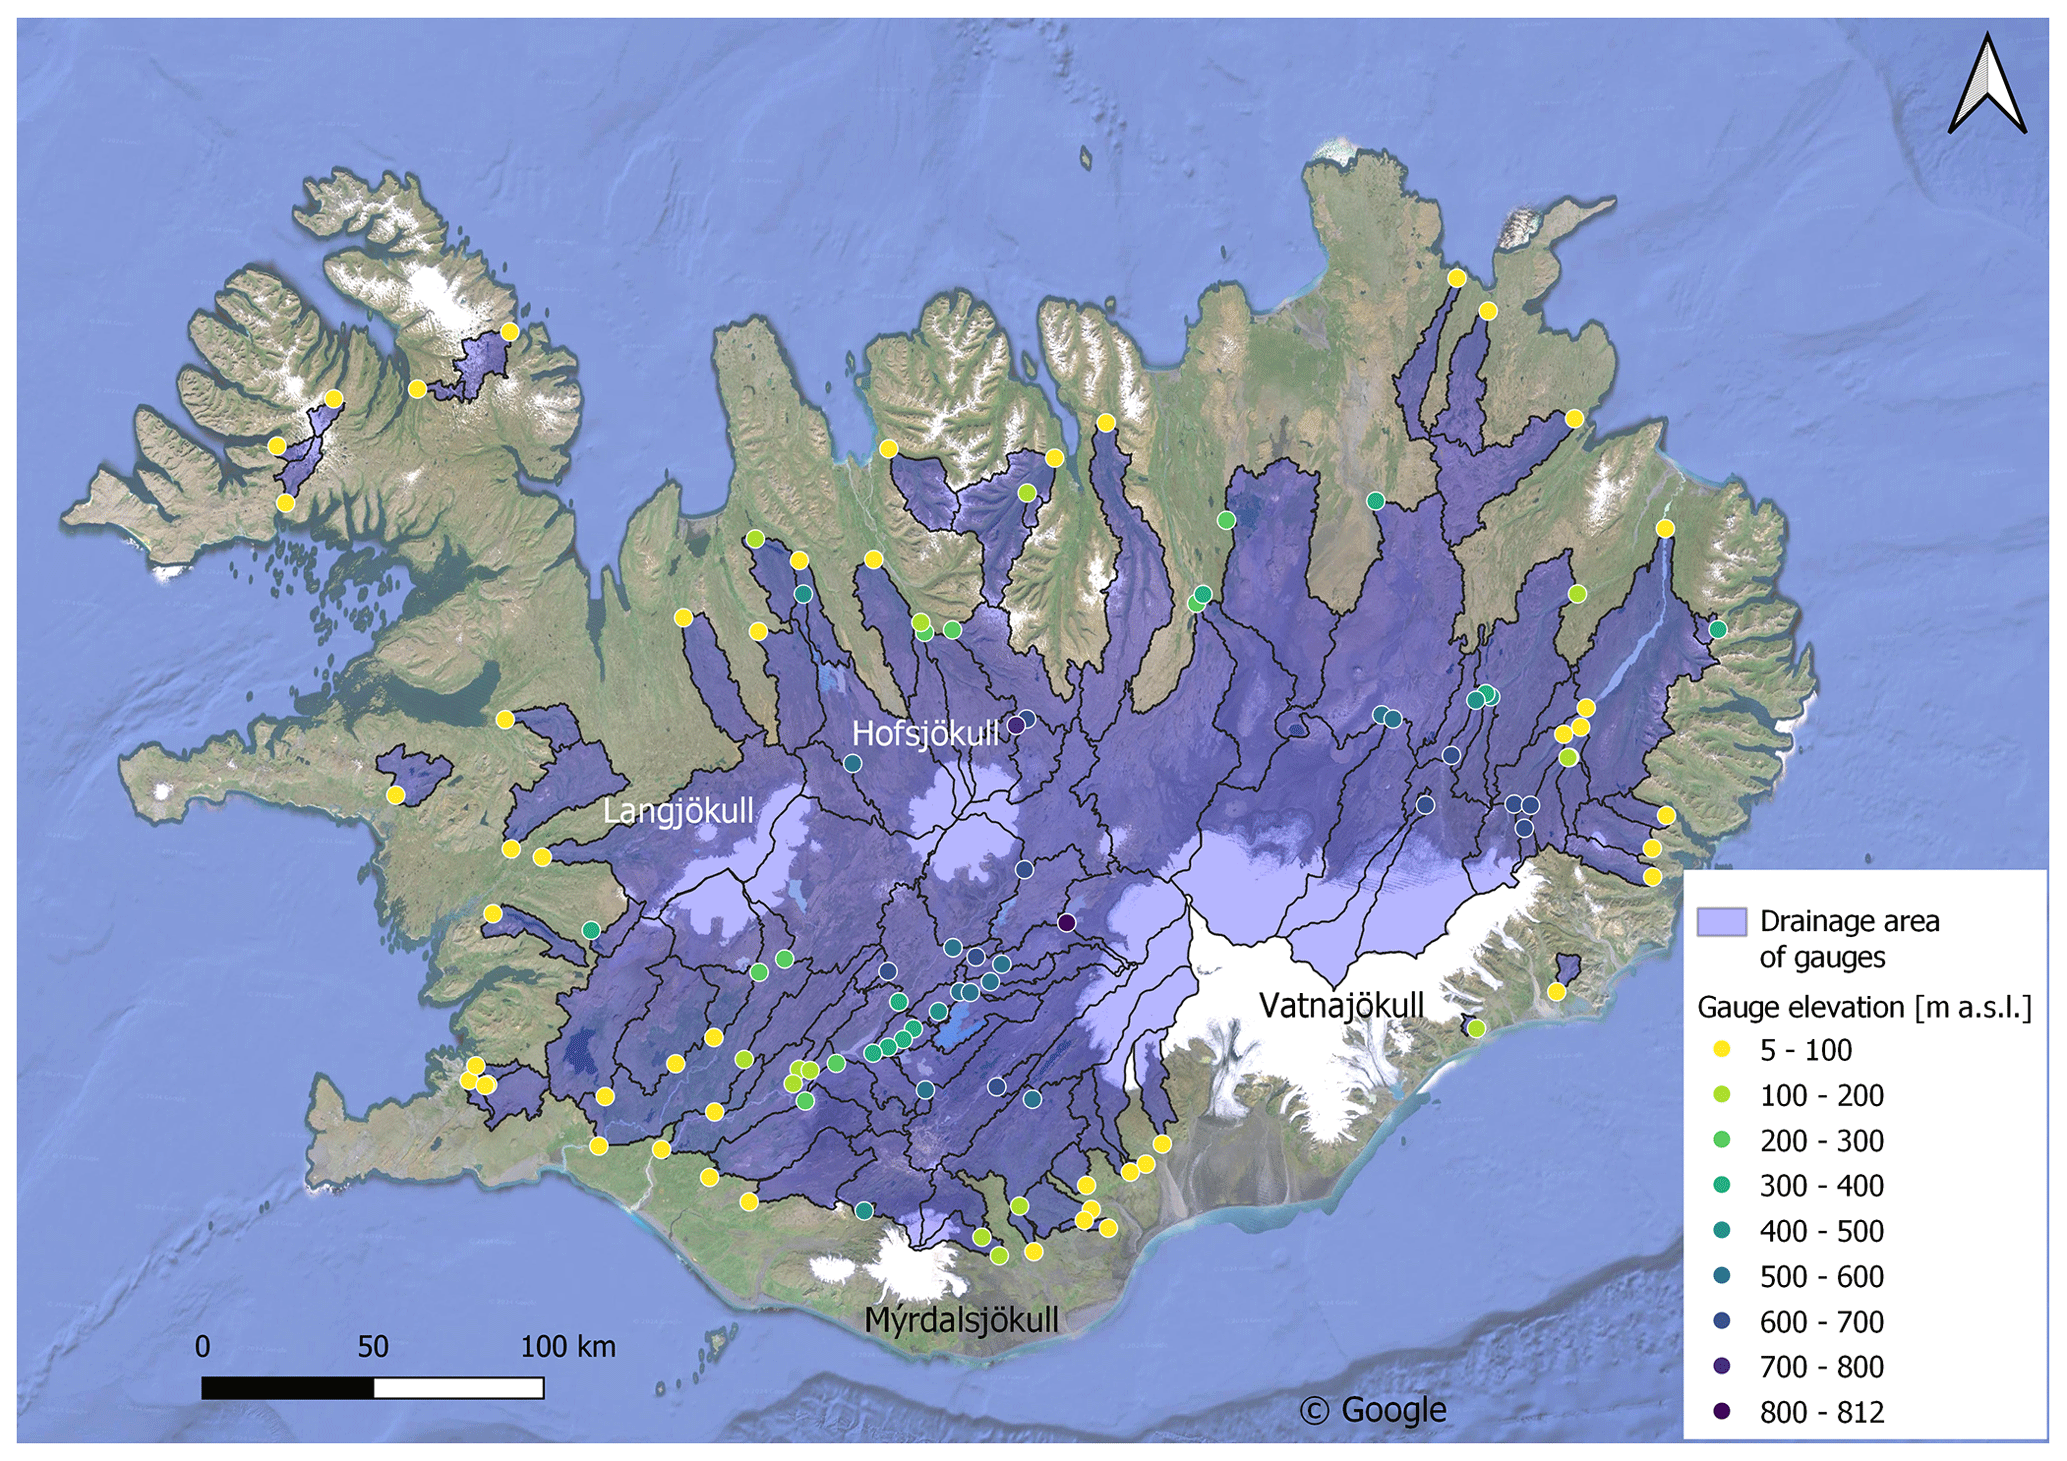
Figure 1Locations of gauges included in LamaH-Ice and their drainage areas. The elevation of each gauge is indicated with colors. Made with QGIS. Source of the background map: © Google Maps (2024).
This paper is organized as follows: the domain of coverage is described in Sect. 2, the basin delineation methods are described in Sect. 3, the compilation of hydrometeorological time series, remote sensing time series of snow cover, and glacier albedo and mass balance is described in Sect. 4, and the catchment attributes are described in Sect. 5. The available hydrometeorological time series and catchment attributes are listed in Appendix A (Tables A1–A12). Further information and details about the dataset and its data sources are presented in the Supplement. The time series and catchment attributes are available on HydroShare at https://doi.org/10.4211/hs.86117a5f36cc4b7c90a5d54e18161c91.
Iceland is located east of Greenland in the North Atlantic Ocean, with the island's northernmost coast lying just south of the Arctic Circle. Iceland has an area of 103 100 km2 and is the most sparsely populated country in Europe (Eurostat, 2023), with inhabited regions limited to the coastal zone and lowlands. The country has a high volcanic activity which strongly influences the landscape and hydrology of the island. Iceland has a mild climate given the country's high latitude. The island is warmed by a branch of the Gulf Stream that flows along its southern and western coasts. Moisture-laden cyclones crossing the Atlantic frequently pass close to or over the island, especially during winter, and the weather depends greatly on their tracks (Einarsson, 1984). Precipitation varies significantly within the island. The southern part of the island is generally warmer and wetter than other regions, with the highest precipitation occurring on glaciers. Winter snowfall is more common in the northern part of the island than in its southern part. With limited evaporation and high precipitation rates, annual river runoff in Iceland has been estimated to be almost 4 times the world average (Gíslason, 2008).
The island's central highlands account for 40 % of the island's area, and glaciers and ice caps cover about 10 % of the island. Europe's largest non-polar ice cap, Vatnajökull (∼ 7700 km2), is located in the southeast of the island, and two other ice caps (Langjökull: ∼ 835 km2; Hofsjökull: ∼ 810 km2) are located in the central highlands (Fig. 1). Mýrdalsjökull (∼ 598 km2) is located close to the central southern coast (glacier area estimates are from Hannesdóttir et al., 2020). Seven other glaciers are larger than 110 km2, in addition to more than 250 smaller glaciers (Aðalgeirsdóttir et al., 2020). Meltwater from the glaciers provides at least one-third of the country's total runoff, feeding the main rivers (Björnsson and Pálsson, 2008). Some of them are utilized for hydropower production.
Seasonal snow and groundwater also strongly influence the hydrology of Iceland. Icelandic rivers have traditionally been divided into three categories by their origin: glacial rivers, direct-runoff rivers, and spring-fed rivers (Jónsdóttir and Uvo, 2009), with many rivers being a mixture of these categories. In a classification of rivers of Nordic countries (Petersen et al., 2006), Icelandic rivers were considered alpine or arctic. Watersheds of Icelandic rivers have widely varying geophysical attributes, which manifest themselves in very diverse hydrological responses to atmospheric forcings (Jónsdóttir and Uvo, 2009).
The streamflow gauges in LamaH-Ice are distributed across Iceland with a denser gauge placement in the southwestern and eastern highlands, where major hydropower facilities are located. The altitude of the gauges ranges from 5 to 812 (Fig. 1). The geographical coordinates of the gauges were obtained from the Icelandic Meteorological Office (IMO) and Landsvirkjun (the National Power Company of Iceland, NPC).
Topographical catchments of the gauges were delineated using the Pysheds Python package (Bartos et al., 2020). The catchment delineation is further described in Sect. S1 in the Supplement. As in LamaH-CE, “basin delineation A” refers to the entire upstream area of each gauge, comparable to the catchments in the CAMELS datasets. The total area covered by LamaH-Ice watersheds is 45 945 km2, which corresponds to 45 % of Iceland's area. The glacierized area covered by LamaH-Ice watersheds in 2019 is 6202 km2, corresponding to 60 % of the total glacier area in Iceland. The locations of the gauges in LamaH-Ice and their catchments are shown in Fig. 1.
A total of 51 catchments in basin delineation A are located in other catchments. For a given gauge in basin delineation B, the catchment area of upstream gauges is subtracted, and thus intermediate catchments are represented. Table A1 describes the dependency among the connected catchments (“HIERARCHY”, “NEXTUPID”, “NEXTDOWNID”). Basin delineation C is like delineation B but excludes catchments with moderate or strong human or natural influence on streamflow (as explained in Sect. 5.9), and thus the catchments in delineation C exhibit natural or near-natural streamflow conditions. For a more detailed explanation of the differences between delineations A, B, and C, see Klingler et al. (2021).
We performed aggregation of the meteorological dataset and the various spatially distributed geophysical data sources for each delineation method by calculating the area-weighted arithmetic mean. Note that, for larger catchments, a mean value of meteorological variables and catchment characteristics is a great simplification and will not represent adequately the processes in the catchments. Thus, as the catchment area increases, it becomes more important to account for spatial variability.
4.1 Runoff data
The first streamflow measurements in Iceland were conducted in the late 19th century (Helland, 1882). Systematic streamflow gauging started in the 1940s by the National Energy Authority of Iceland. Since 2009, the IMO has been the government agency responsible for general hydrological research and streamflow measurements. The IMO operates a network of gauging stations. The NPC also operates a number of streamflow gauges to study and monitor the water resources at their current and proposed hydropower facilities. The IMO provided data from 60 gauges, and the NPC provided data from 47 gauges.
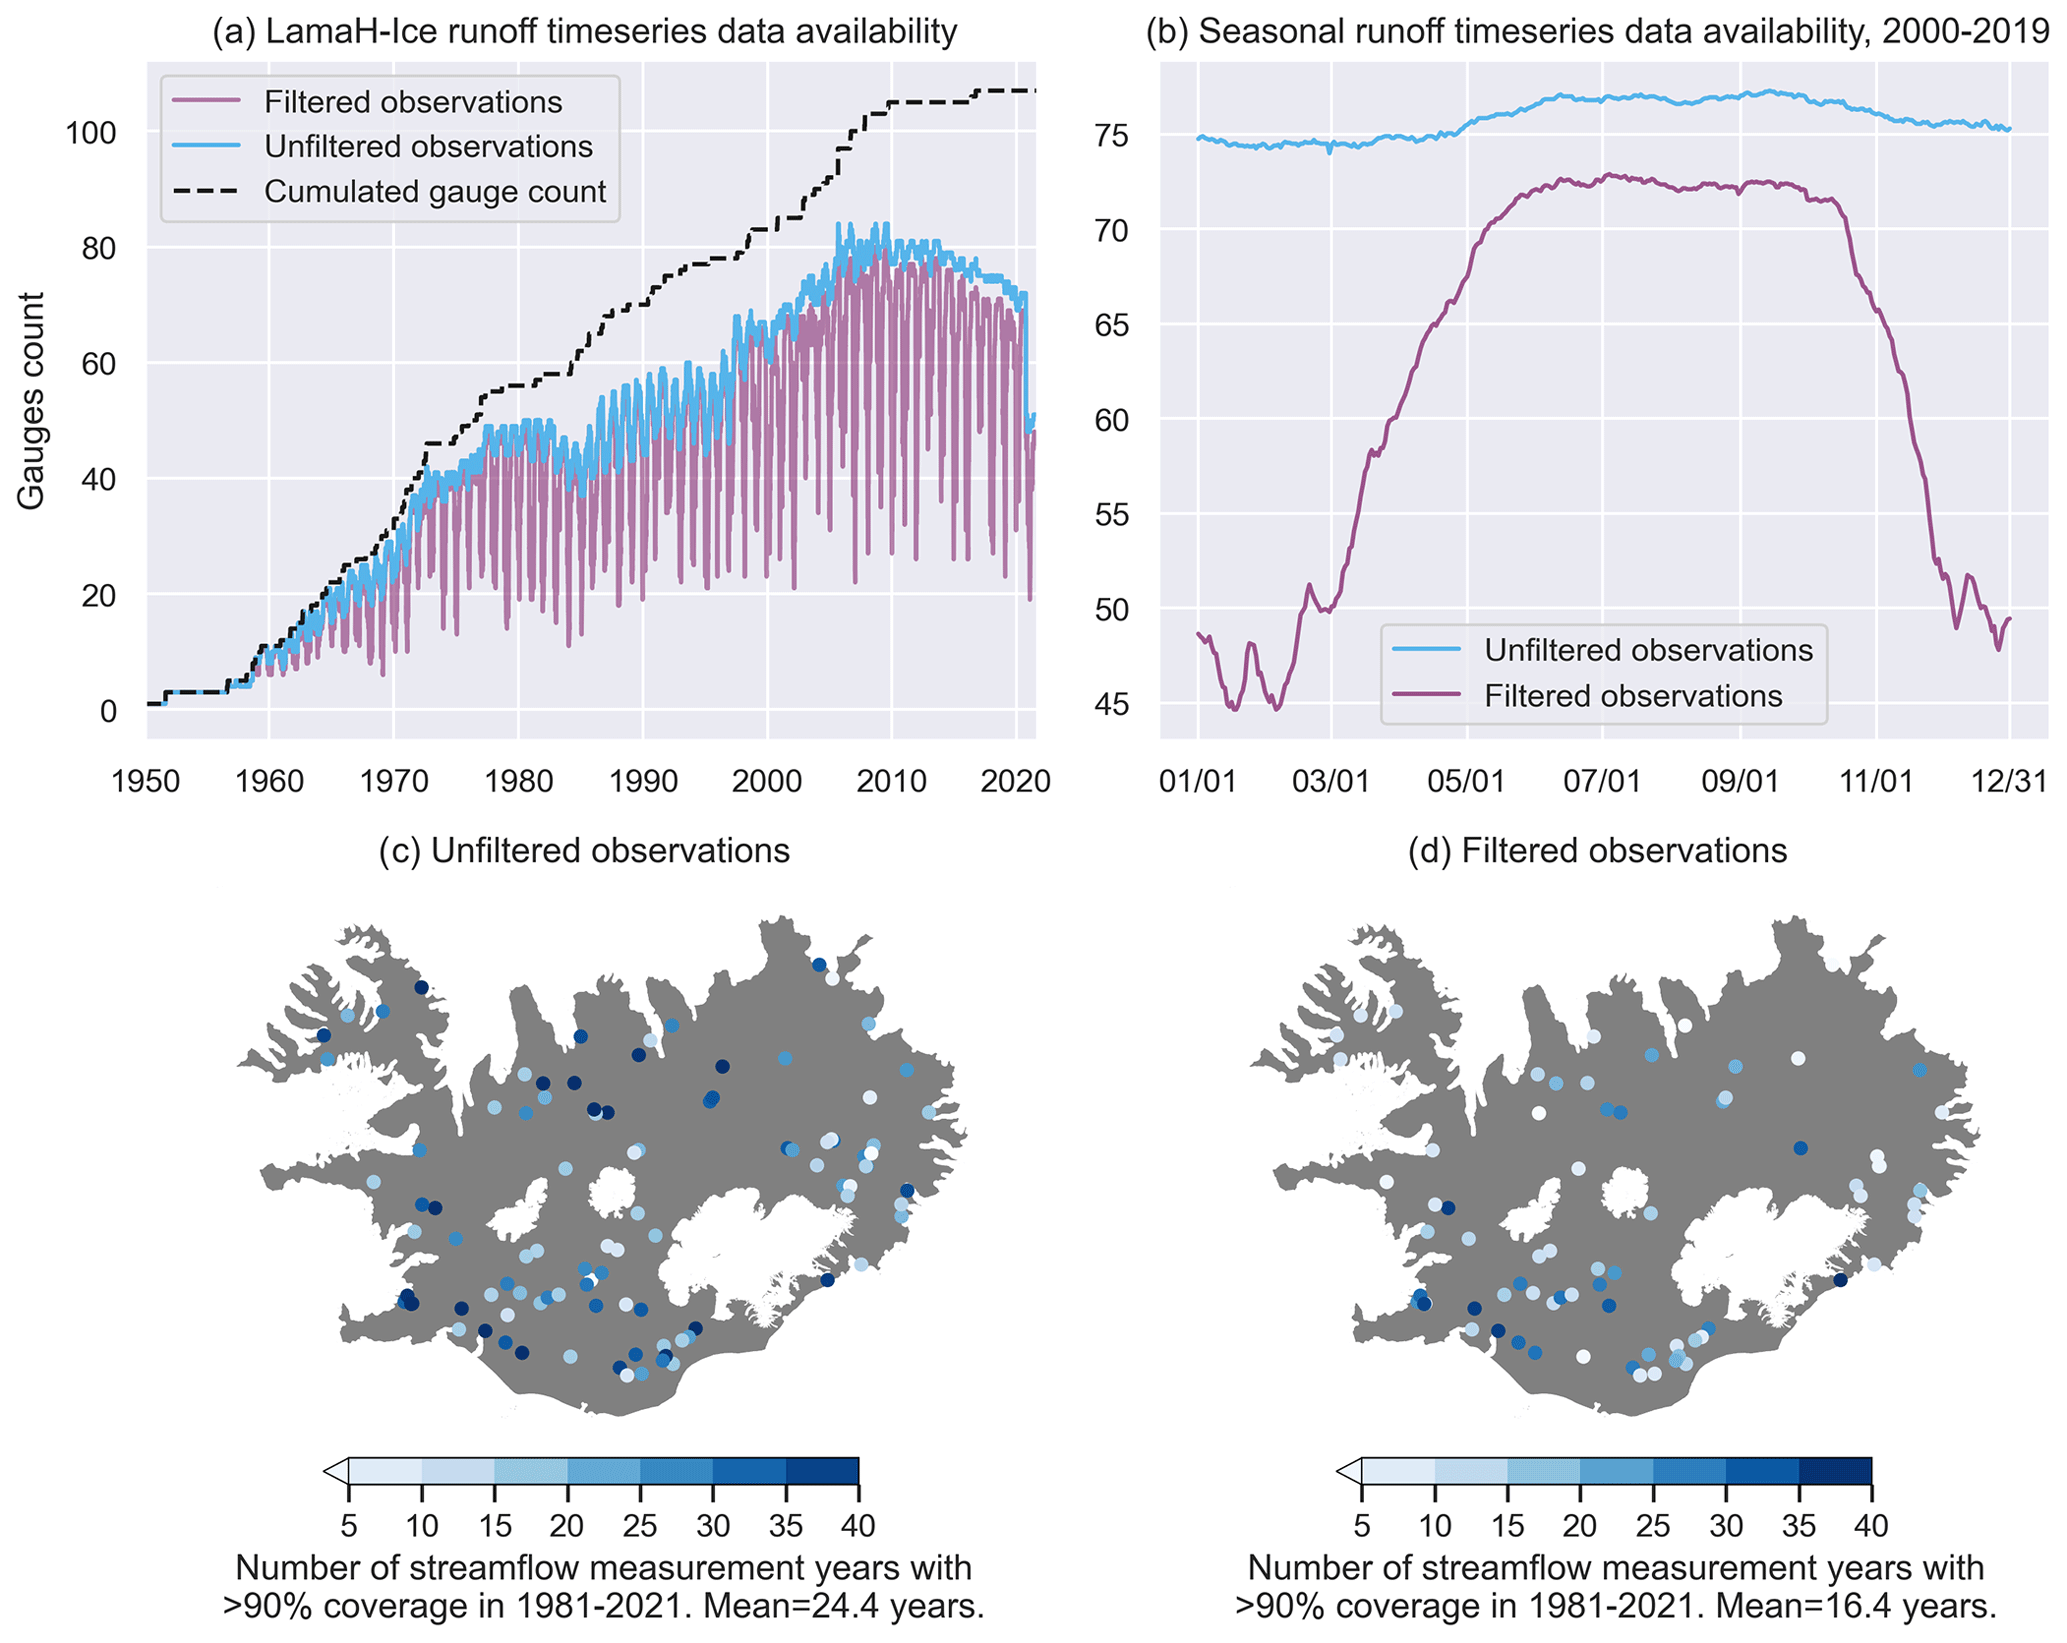
Figure 2Gauge data availability in LamaH-Ice. (a) The availability of daily streamflow measurements as a function of time from 1950 to 2021. Filtered and unfiltered measurements are shown in different colors. (b) The average seasonal data availability for the period 2000–2019. (c) The spatial distribution of gauges with a minimum of three hydrological years with > 90 % data coverage between 1981 and 2021 for unfiltered observations (97 gauges in total). The color indicates the number of years available for each gauge. The mean temporal coverage of the 97 gauges is 24.4 years. (d) The same analysis for filtered observations. The mean temporal coverage of the 72 gauges is 16.4 years. Basemap source: Hijmans (2015).
All streamflow measurements are quality-controlled in a consistent manner with quality codes and standard remarks. In LamaH-Ice, the streamflow measurements are provided along with the corresponding quality codes, allowing users to filter the measurements based on their reported quality. A prefiltered version of the streamflow time series is also provided, which only includes data of high quality. The quality codes, filtering, and gauge identification system are further described in Sect. S2 in the Supplement. Figure 2 illustrates the availability of daily streamflow measurements as a function of time.
The number of actively (simultaneously) reporting gauges in LamaH-Ice increases with time up until 2009, when it reaches an annual average high of 81. From 2006 to 2020 there are between 70 and 84 actively reporting gauges (Fig. 2a). Under winter ice conditions, streamflow measurements in Iceland are prone to interruptions, especially at gauges located at higher elevations, resulting in lengthy spells of missing data during winter. Some gauges are only operated for a part of the year since year-round maintenance is not viable. The average seasonal data availability for the 20-year period 2000–2019 is shown in Fig. 2b. Most of the active gauges during this period have year-round data coverage (unfiltered observations, blue line). However, after filtering out data with lower quality (estimated data due to ice interruptions or unchecked data), there is quite a reduction in data coverage during the winter months (purple line), from an average of 72 gauges over the summer (June–August) to 48 gauges over the winter (December–February).
Figure 2c and d show the spatial distribution of gauges with at least 3 years of 90 % temporal coverage for the 40-year period between 1 October 1981 and 30 September 2021. Gauges with less than 3 years of 90 % coverage are omitted from the figure. The mean number of valid years is 24.4 for unfiltered data (Fig. 2c) and 16.4 for filtered data (Fig. 2d).
4.2 Meteorological data
The meteorological data in LamaH-Ice are from three different atmospheric reanalysis datasets: ERA5-Land, RAV-II, and the Copernicus Arctic Regional Reanalysis (CARRA). ERA5-Land (Muñoz-Sabater et al., 2021) is a re-run of the land segment of the fifth iteration of the European Reanalysis (ERA5) from the European Centre for Medium-Range Weather Forecasts, with a finer spatial resolution (0.1° × 0.1° on a regular latitude–longitude grid, approximately 5 km × 11 km over Iceland). The dataset has global coverage and hourly time resolution and is continually updated with a latency of about 5 d. The ERA5-Land dataset contains 50 variables that describe hydrometeorological processes over land. LamaH-Ice includes 16 of these variables at an hourly and daily resolution for the period 1950–2021 (Table A2). We obtained the ERA5-Land dataset through the C3S Climate Data Store (Muñoz-Sabater, 2019).
The RAV-II dataset (Rögnvaldsson, 2020) used the WRF (Weather Research and Forecasting) mesoscale numerical weather prediction model to downscale the ERA-40 (1958–1979) and ERA-Interim (1979–2019) reanalyses onto a 2 km × 2 km grid over Iceland. We included 16 weather variables from RAV-II in LamaH-Ice at hourly and daily resolutions for the period 1958–2019 (Table A2). We also included precipitation from CARRA (2.5 km × 2.5 km grid; Schyberg et al., 2020) at daily resolution. CARRA is produced with the HARMONIE-AROME weather prediction model, using ERA-5 as lateral boundary conditions, and is available from 1991 to the present.
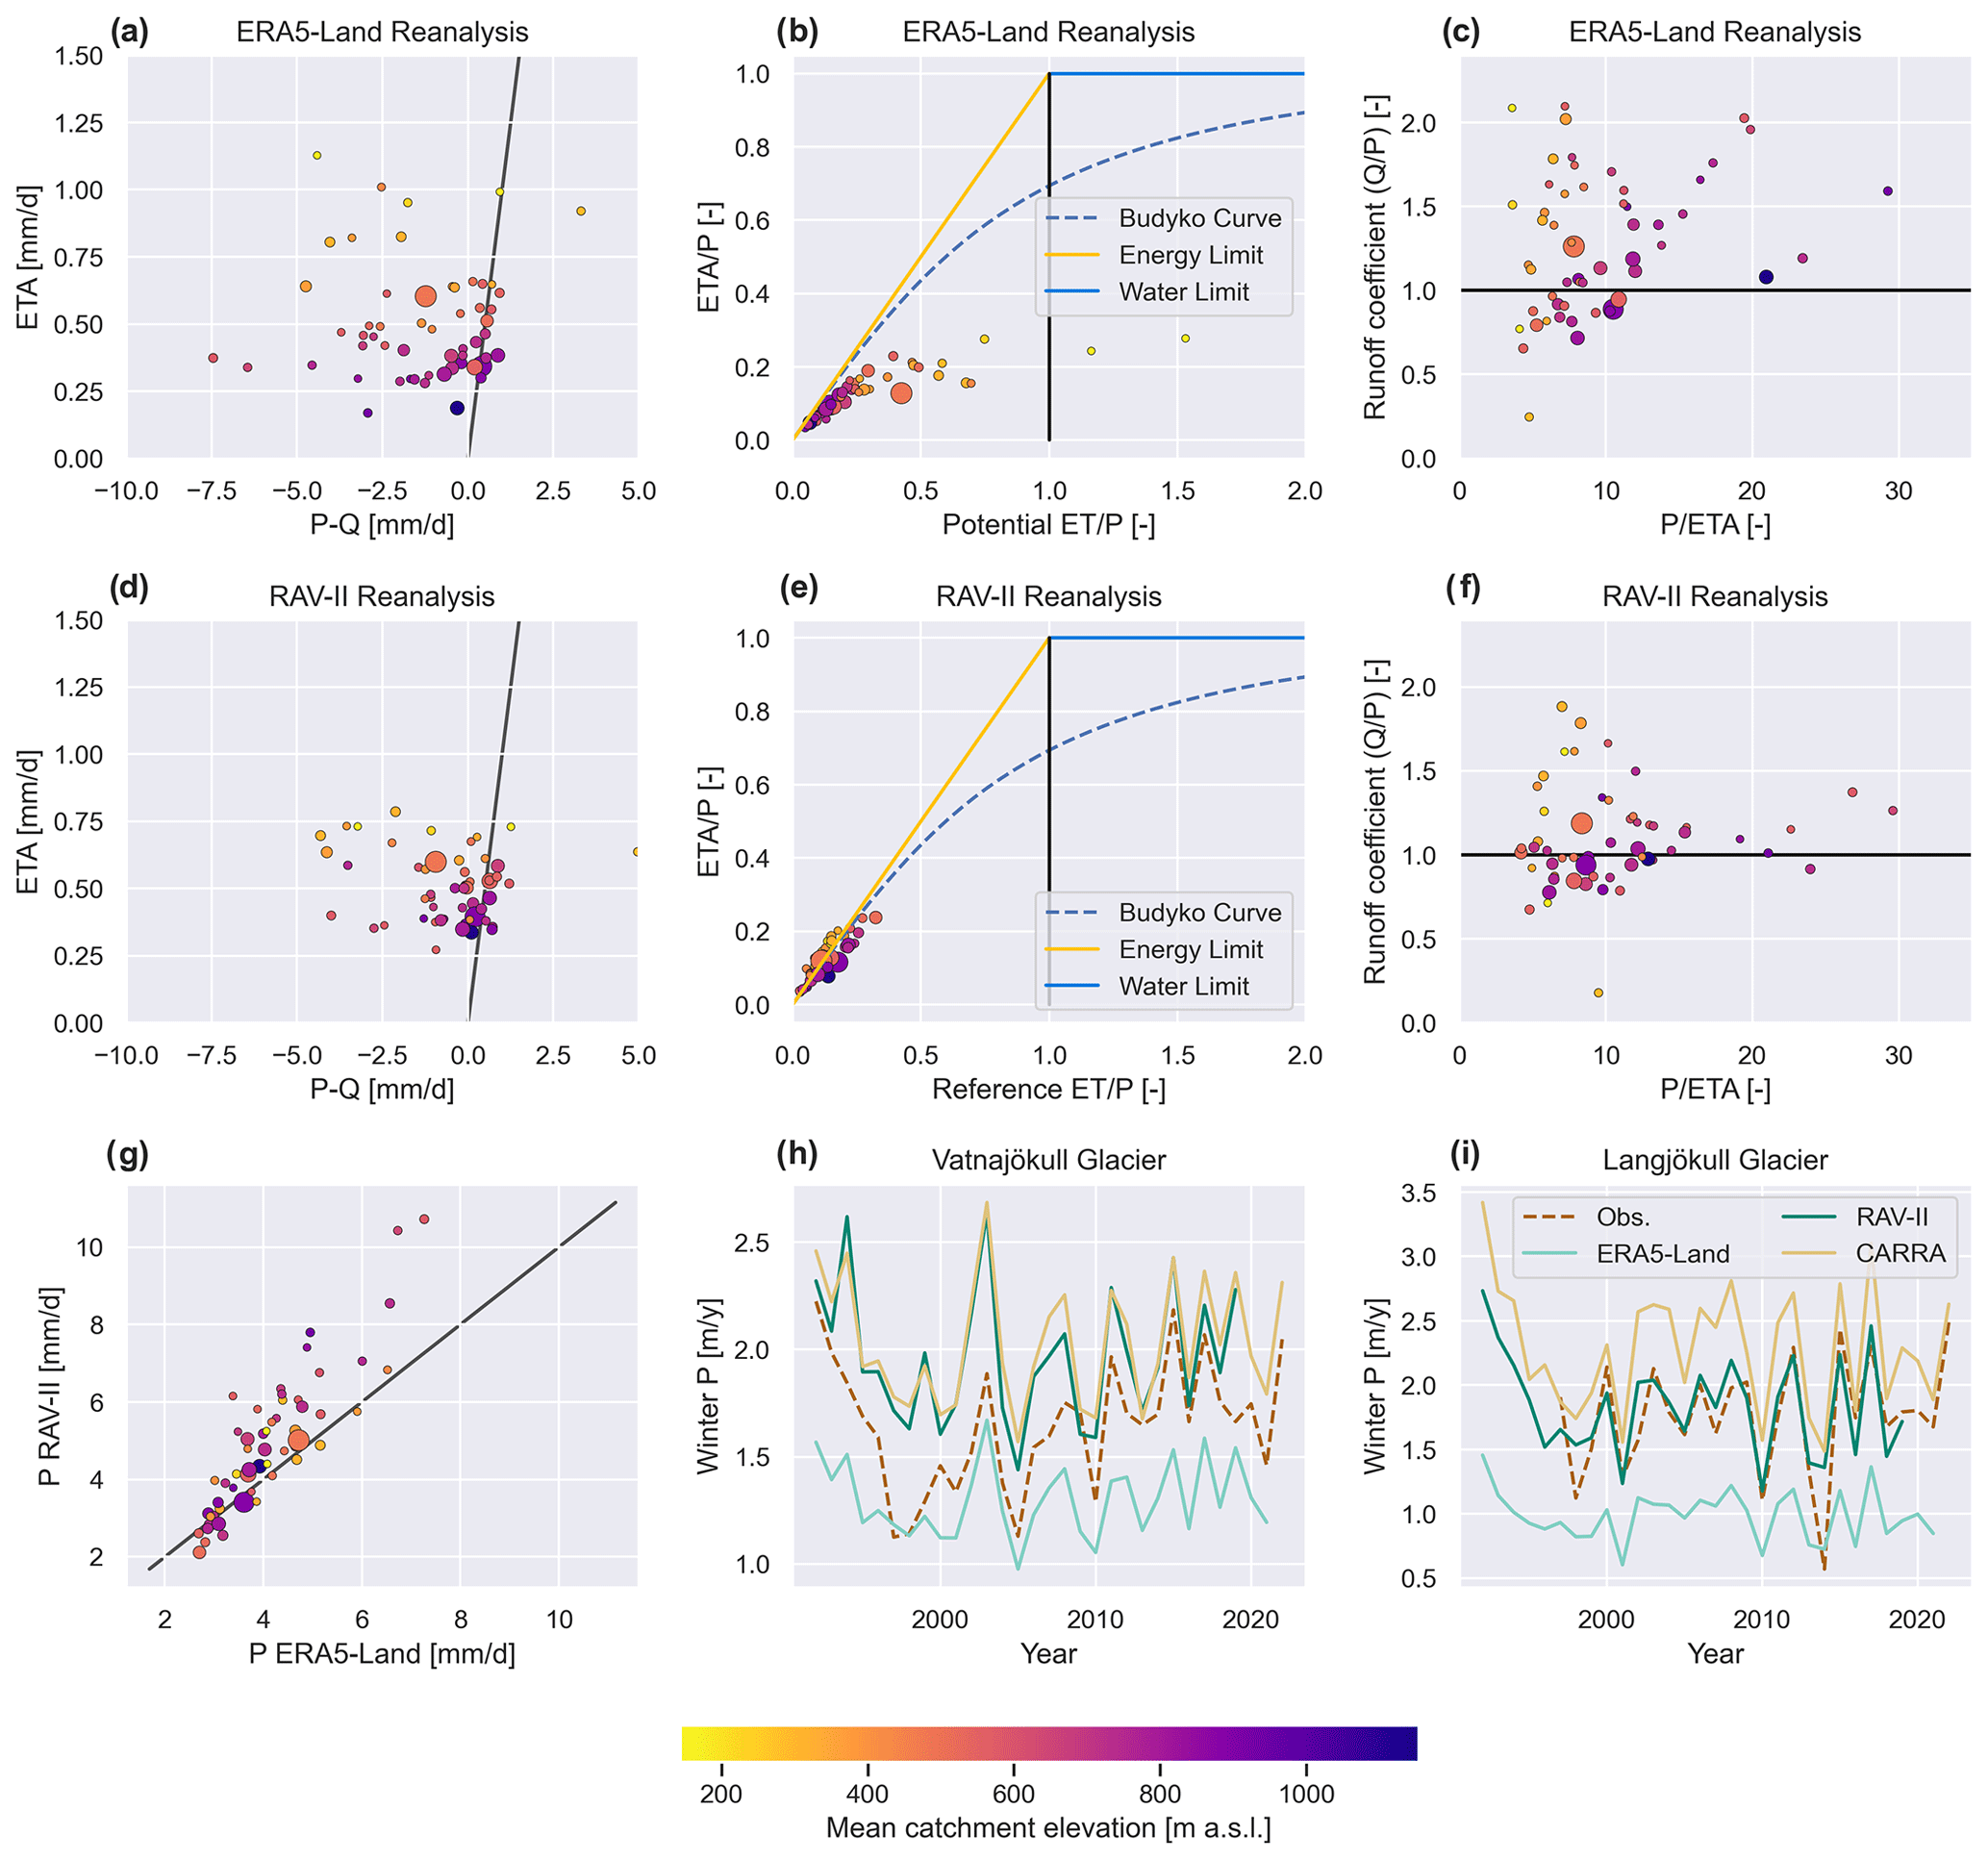
Figure 3A water balance analysis of the meteorological time series and measured streamflow for the period 1981–2018. Each point in panels (a)–(g) corresponds to a single catchment. Meteorological data from ERA5-Land are used in panels (a)–(c). Meteorological data from RAV-II are used in panels (d)–(f). The sizes of the points indicate the catchment size, and the color indicates the mean catchment elevation. (a) and (d): P−Q plotted against the actual ET (ETA). (b) and (e): a Budyko curve analysis for the catchments. (c) and (f): the runoff coefficient plotted against . (g): a comparison between precipitation from ERA5-Land and RAV-II. (h): Vatnajökull Glacier: winter precipitation from ERA5-Land, RAV-II and CARRA compared to measured winter accumulation. Winter precipitation is defined as precipitation falling between 15 October and 1 May in each year. (i) The same precipitation comparison for Langjökull Glacier. In panels (a)–(g), only hydrological years with > 90 % streamflow measurement coverage are considered. Gauge measurements with a strong (human or natural) influence (Sect. 5.9) are omitted. The total number of catchments analyzed is 55. Panels (b), (e), and (g) are shown for all 107 gauges in Sect. S3.2 in the Supplement. In panels (a)–(f), black lines indicate physical constraints.
We checked and verified the meteorological time series in LamaH-Ice by analyzing the components of the water balance. These were plotted for ERA5-Land (Fig. 3a–c) and RAV-II (Fig. 3d–f) for 55 gauges that have a high temporal coverage of streamflow observations and do not experience strong human or natural influence (Sect. 5.9). The water balance equation on a catchment scale can be written as , where P is the precipitation over the catchment, Q is the river discharge out of the basin, ETA is the total evapotranspiration, and ΔS is the change in storage of water within the catchment. For non-glacierized catchments, over long timescales, the ΔS component can be considered negligible. Figure 3a and d show P−Q plotted against ETA using weather variables from the ERA5-Land reanalysis and the RAV-II reanalysis. Each point on the graph corresponds to a single catchment. In both figures, the modeled evapotranspiration shows a plausible dependence on elevation, with a higher ETA at the warmer lower altitudes. However, the points should align on the 1:1 line, but that is not the case for either precipitation product. The modeled precipitation in both datasets seems to be insufficient, judging by the negative values of P−Q for the majority of the catchments, with means of −1.38 mm d−1 for ERA5-Land and −0.58 mm d−1 for RAV-II. The precipitation from ERA5-Land is compared to the RAV-II reanalysis in Fig. 3g (and compared to CARRA in Sect. S3.2 in the Supplement).
A viable way of estimating actual precipitation is to use observed winter snow accumulation on glaciers, which is derived from in situ measurements in fall and spring (Sect. 4.4). Due to factors such as occasional winter thaw events, winter precipitation that falls as rain, and sublimation of snow, this should be a slight underestimation of the actual precipitation on the glaciers. A comparison is made between the observed winter accumulation for Vatnajökull (Fig. 3h) and Langjökull (Fig. 3i) and the simulated winter precipitation on the glaciers from ERA5-Land, CARRA, and RAV-II. CARRA and RAV-II show significantly stronger agreement with the observed data than ERA5-Land. CARRA even shows higher precipitation values than are observed, especially for Langjökull. Given that the observations themselves underestimate the actual precipitation, the CARRA precipitation product is likely the most accurate out of the three reanalyses considered. This shows that the negative P−Q in the water balance analysis is largely due to an underestimation of precipitation in ERA5-Land, which is improved in RAV-II and even further in CARRA. The finer-resolution reanalysis datasets better capture the large orographic enhancement of precipitation in Iceland's complex terrain.
Another possible contributing factor of negative P−Q is a negative glacier mass balance, i.e., a net loss of glacier ice, which has been the case for Icelandic glaciers since 1994 (except for 2015). However, the glaciers gained mass between 1980 and 1993 (Aðalgeirsdóttir et al., 2020). Omitting the 19 basins with > 5 % glaciation results in mean P−Q values of −1.18 mm d−1 for ERA5-Land and −0.58 mm d−1 (no change) for RAV-II. Another possible reason for the negative P−Q could be that streamflow measurements for up to 10 % of the hydrological year are missing from many gauges used in this analysis (generally during the winter, when discharge is low). This results in slightly larger average annual streamflow values than if the full year were to be used. Other possible contributing reasons could be discrepancies between the topographic watersheds and groundwater watersheds of the gauges, wind redistribution of snow into the catchments, or errors in streamflow measurements.
The Budyko curve (Fig. 3b and e) describes the relationship between actual evapotranspiration (ETA), potential evapotranspiration (PET), and precipitation in a catchment. Catchments tend to fall along the Budyko curve between the theoretical energy limit (ETA=PET) and the water limit (ETA=P). Figure 3b shows the Budyko analysis for catchments in LamaH-Ice using atmospheric inputs from the ERA5-Land dataset. The figure shows that the catchments fall largely to the right of the Budyko curve, indicating that either ETA (y axis) is underestimated or PET (x axis) is overestimated in ERA5-Land. The potential evapotranspiration in ERA5-Land is calculated as open-water (pan) evaporation (ECMWF, 2024). From the RAV-II data, we used the Penman–Monteith equation to calculate the reference ET for well-watered agricultural land as recommended by Allen et al. (1998) (further explained in Sect. S3.3 in the Supplement). This alternative estimate (Fig. 3e) is lower than the ERA5-Land PET, while the RAV-II ETA is similar to that in ERA5-Land. Therefore, the catchments fall closer to the Budyko curve (Fig. 3e). The RAV-II Budyko analysis shows that evapotranspiration in all the catchments is strongly energy-limited.
Figure 3c and f show the ratio between measured runoff and modeled precipitation (runoff coefficient, ) against the ratio of mean precipitation to evapotranspiration () for the ERA5-Land and RAV-II reanalyses. The runoff coefficient is larger than 1 in 39 (ERA5-Land) and 32 (RAV-II) out of 55 catchments, again mostly due to the insufficient precipitation in the reanalysis.
Due to the RAV-II dataset having a long temporal coverage and more plausible precipitation and PET (reference ET) values compared to the ERA5-Land dataset, we calculated climate indices (Sect. 5.2) and hydrological signatures (Sect. 5.3) using the RAV-II dataset. To maintain consistency between LamaH-Ice and other large-sample datasets using ERA5-Land, we also provide climate indices calculated using ERA5-Land in the dataset. The aggregation to watersheds and uncertainty sources of the meteorological data is discussed in Sect. S3 in the Supplement.
4.3 Remote sensing observations of snow cover and glacier albedo
Snow and glacier melt strongly influence the streamflow regime of Icelandic rivers. Time series of catchment fractional snow cover and average blue-sky albedo observations from the NASA MODIS sensors at 500 m resolution are included in LamaH-Ice. Iceland's 75 % average annual cloud cover (with some variability depending on the location) and the limited daylight hours in winter (Gunnarsson et al., 2019) limit the use of non-cloud penetrating and visible spectrum remote sensing observations. Gunnarsson et al. (2019, 2021) produced two temporally continuous cloud-free datasets of MODIS observations for Iceland by merging data from the Aqua and Terra satellites and temporally aggregating the observational series. The first is a gap-filled MODIS snow cover product covering all of Iceland, and the second is a MODIS glacier albedo product. These datasets have gaps in winter (November–January) due to polar darkness limiting the data availability. We used these datasets to create snow cover and glacier albedo time series for catchments in LamaH-Ice from 2000 to 2021.
For catchment fractional snow cover, two daily time series are provided, a catchment average and an average for land area outside of glaciers. For albedo, the daily average value for the glacierized portion of the watershed is provided. The snow cover time series are available for all catchments in LamaH-Ice, and glacier albedo time series are available for all 61 catchments that have some degree of glaciation (as of 2019). Uncertainty sources of the MODIS products are discussed in Sect. S3.6 in the Supplement.
4.4 Glacier mass balance measurements
Annual in situ mass balance measurements have been made on the largest glaciers in Iceland for decades (Aðalgeirsdóttir et al., 2020). Winter snow accumulation is measured in spring, and summer ablation is measured in fall. These measurements are conducted at multiple locations situated along ice flow lines and cover the altitudinal range of the glaciers (the locations of the measurement sites are shown in Sect. S3.5 in the Supplement). Digital mass balance maps have been derived by interpolating the in situ measurements and using observed mass balance gradients (Pálsson et al., 2022, 2024). In LamaH-Ice, the available mass balance maps from Vatnajökull and Langjökull were used to create annual time series of mass balance changes (winter accumulation, summer melt, and annual net mass balance) within each catchment draining the two ice caps (32 catchments in total). The glacier mass balance measurements are performed by the NPC and the Institute of Earth Sciences at the University of Iceland. Uncertainties in the measurements are discussed in Sect. S3.5 in the Supplement.
The catchment characteristics in LamaH-Ice were assembled using global or pan-European datasets. The attributes and their data sources are consistent with the LamaH-CE dataset. In addition to that, local data sources with finer resolution were used to include more accurate information as a supplement to the characteristics provided in the LamaH-CE dataset. For consistency and comparability with the LamaH-CE paper, we chose color maps for most of the plots in this section that closely match the ones used in the LamaH-CE paper (Klingler et al., 2021). The maps in this section use a basemap shapefile from Hijmans (2015).
5.1 Topographic indices
LamaH-Ice includes 11 catchment attributes related to topography (Table A3). We used the digital elevation model IslandsDEM version 1.0 (National Land Survey of Iceland, 2020) at 20 m resolution to derive six elevation-related attributes (catchment area, mean, median, range and standard deviation of elevation within the catchments, as well as catchment mean slope).
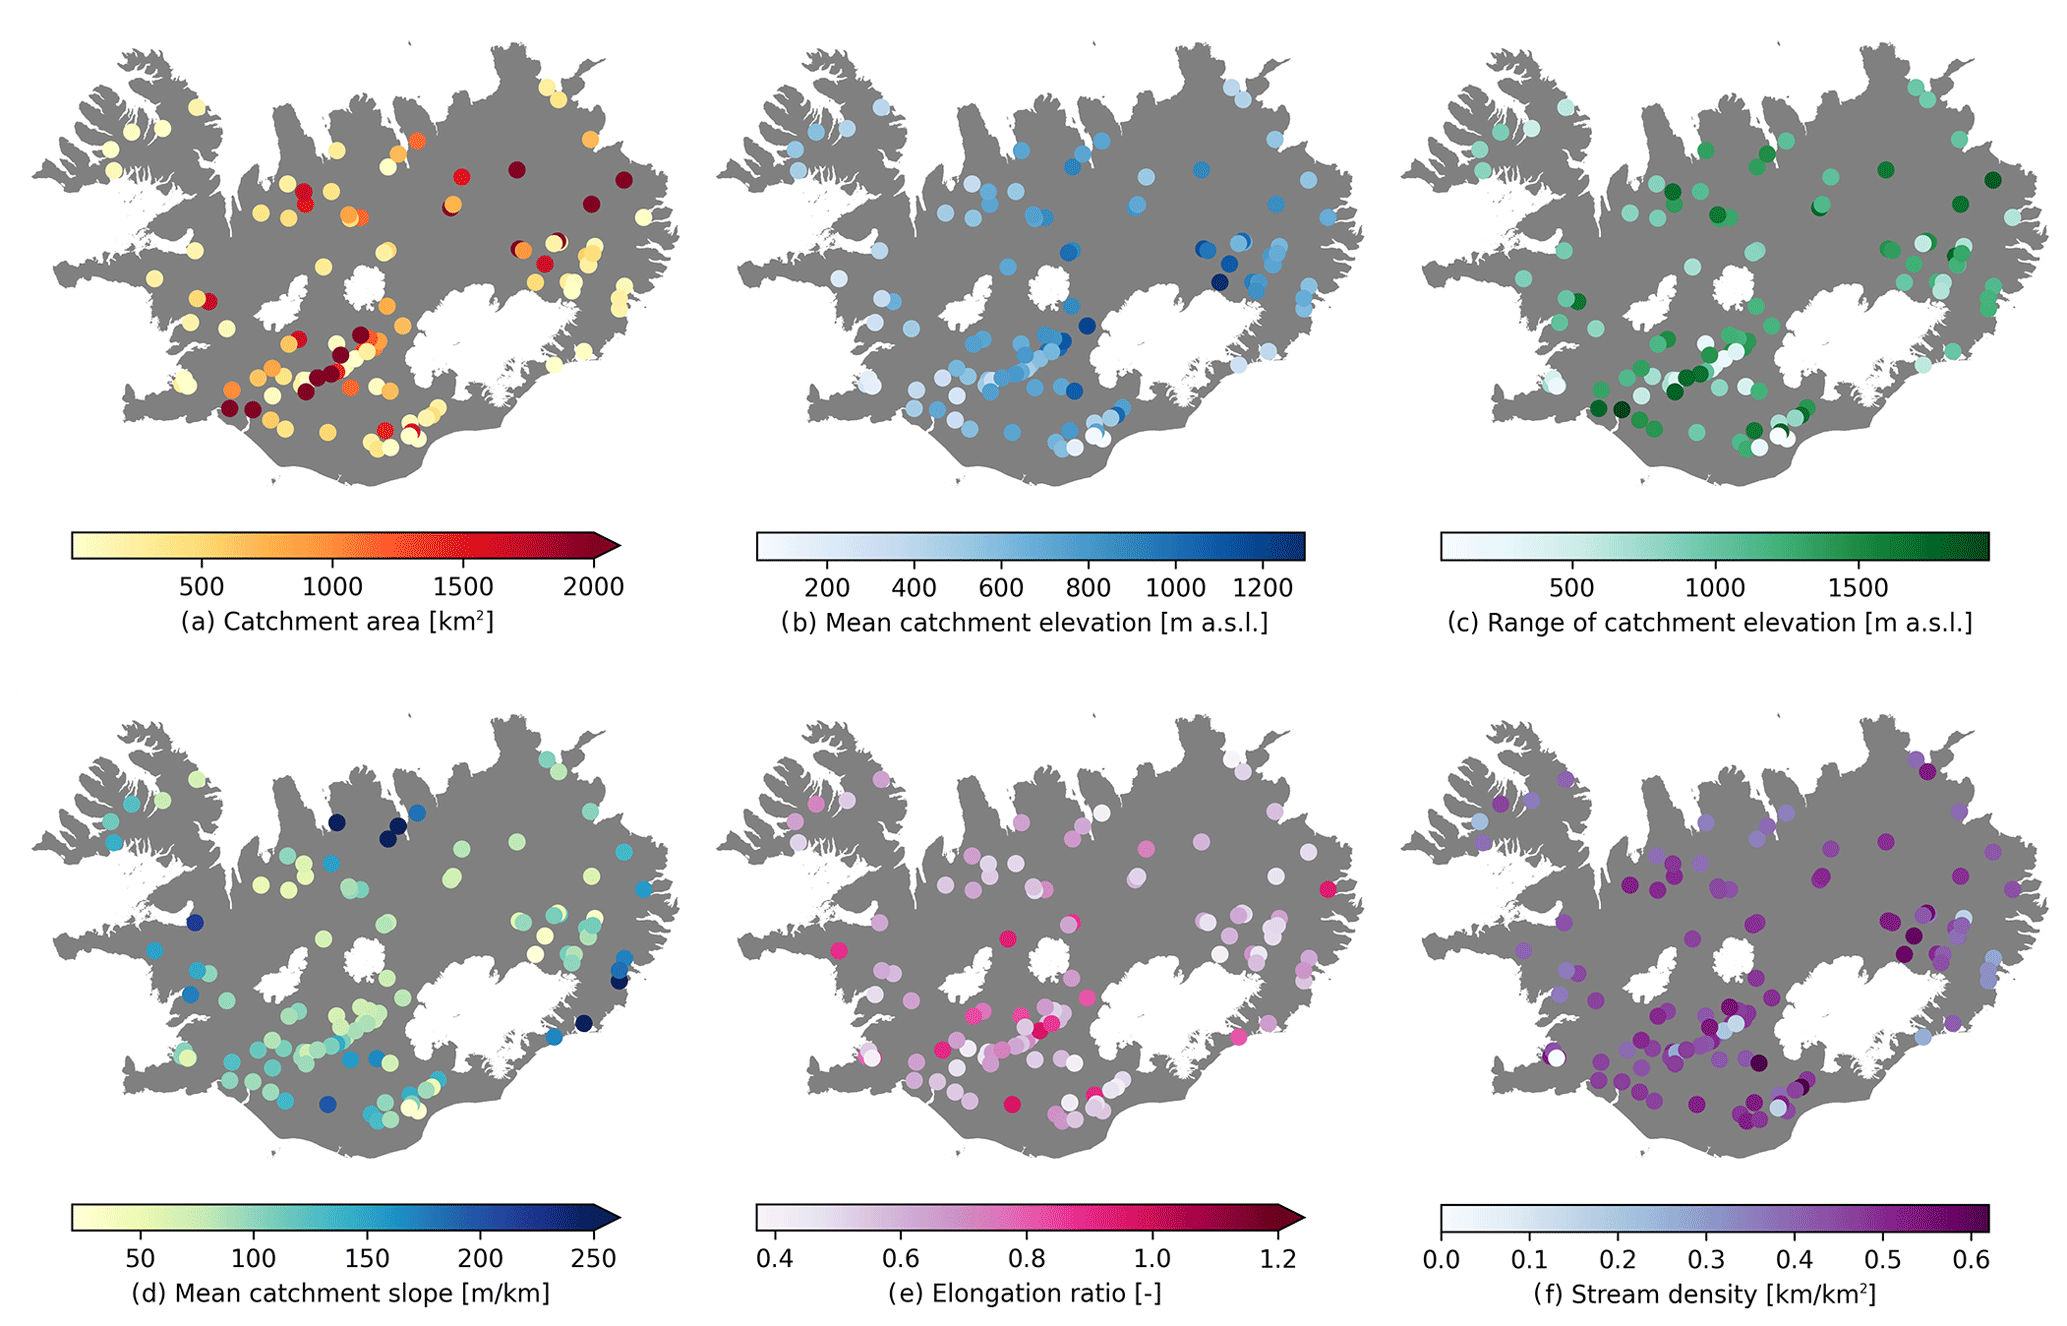
Figure 4Spatial distribution of 6 out of 10 topographical attributes for the catchments in LamaH-Ice. Basemap source: Hijmans (2015).
The area (“area_calc” in Table A3) of the LamaH-Ice catchments (basin delineation A) ranges from 4 to 7437 km2 with a mean of 899 km2 and a median of 386 km2. The mean elevation of the catchments (“elev_mean”) ranges from 38 to 1296 (Fig. 4b). The highest mean catchment slopes (“slope_mean”) are found in catchments close to the coast, and the slope is lower in catchments located in the central plateau of the island (Fig. 4d).
In addition to attributes related to elevation, LamaH-Ice includes five other attributes that describe the catchment shape and orientation as well as the stream network within the catchment.
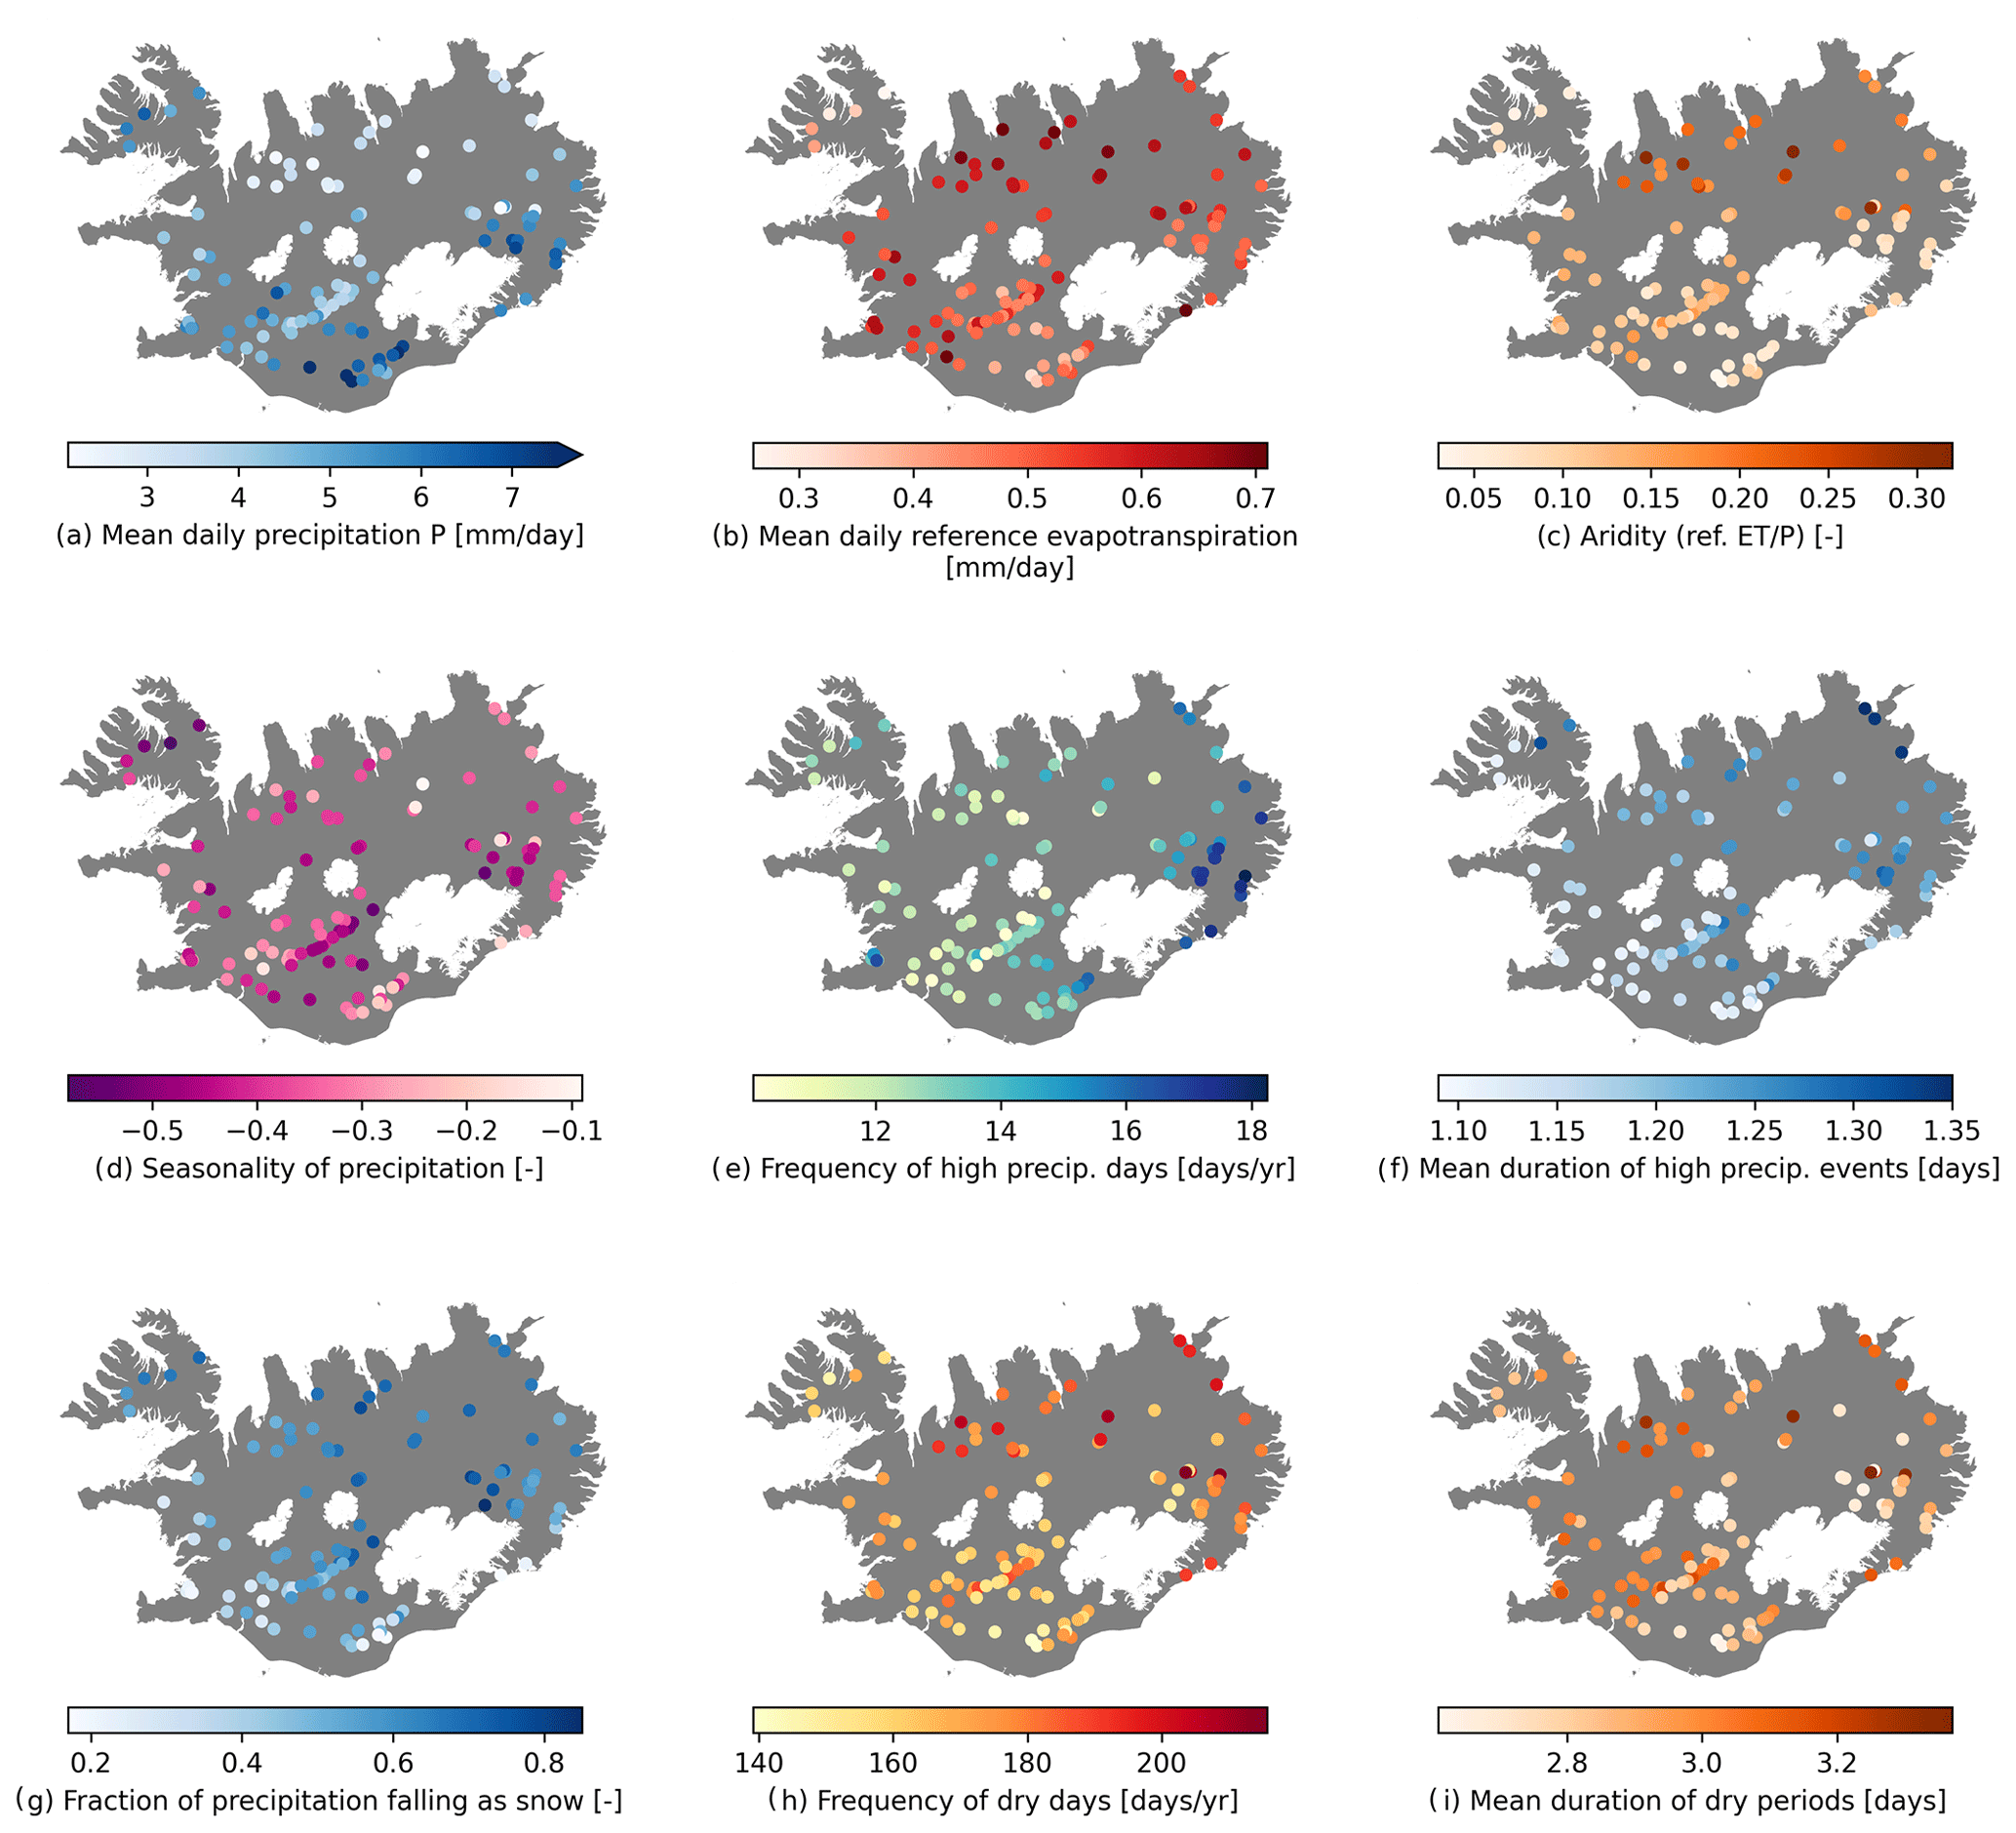
Figure 5Spatial distribution of climate indices for LamaH-Ice watersheds. The indices are computed from RAV-II reanalysis data for (hydrological) years 1990 to 2009. Basemap source: Hijmans (2015).
5.2 Climate indices
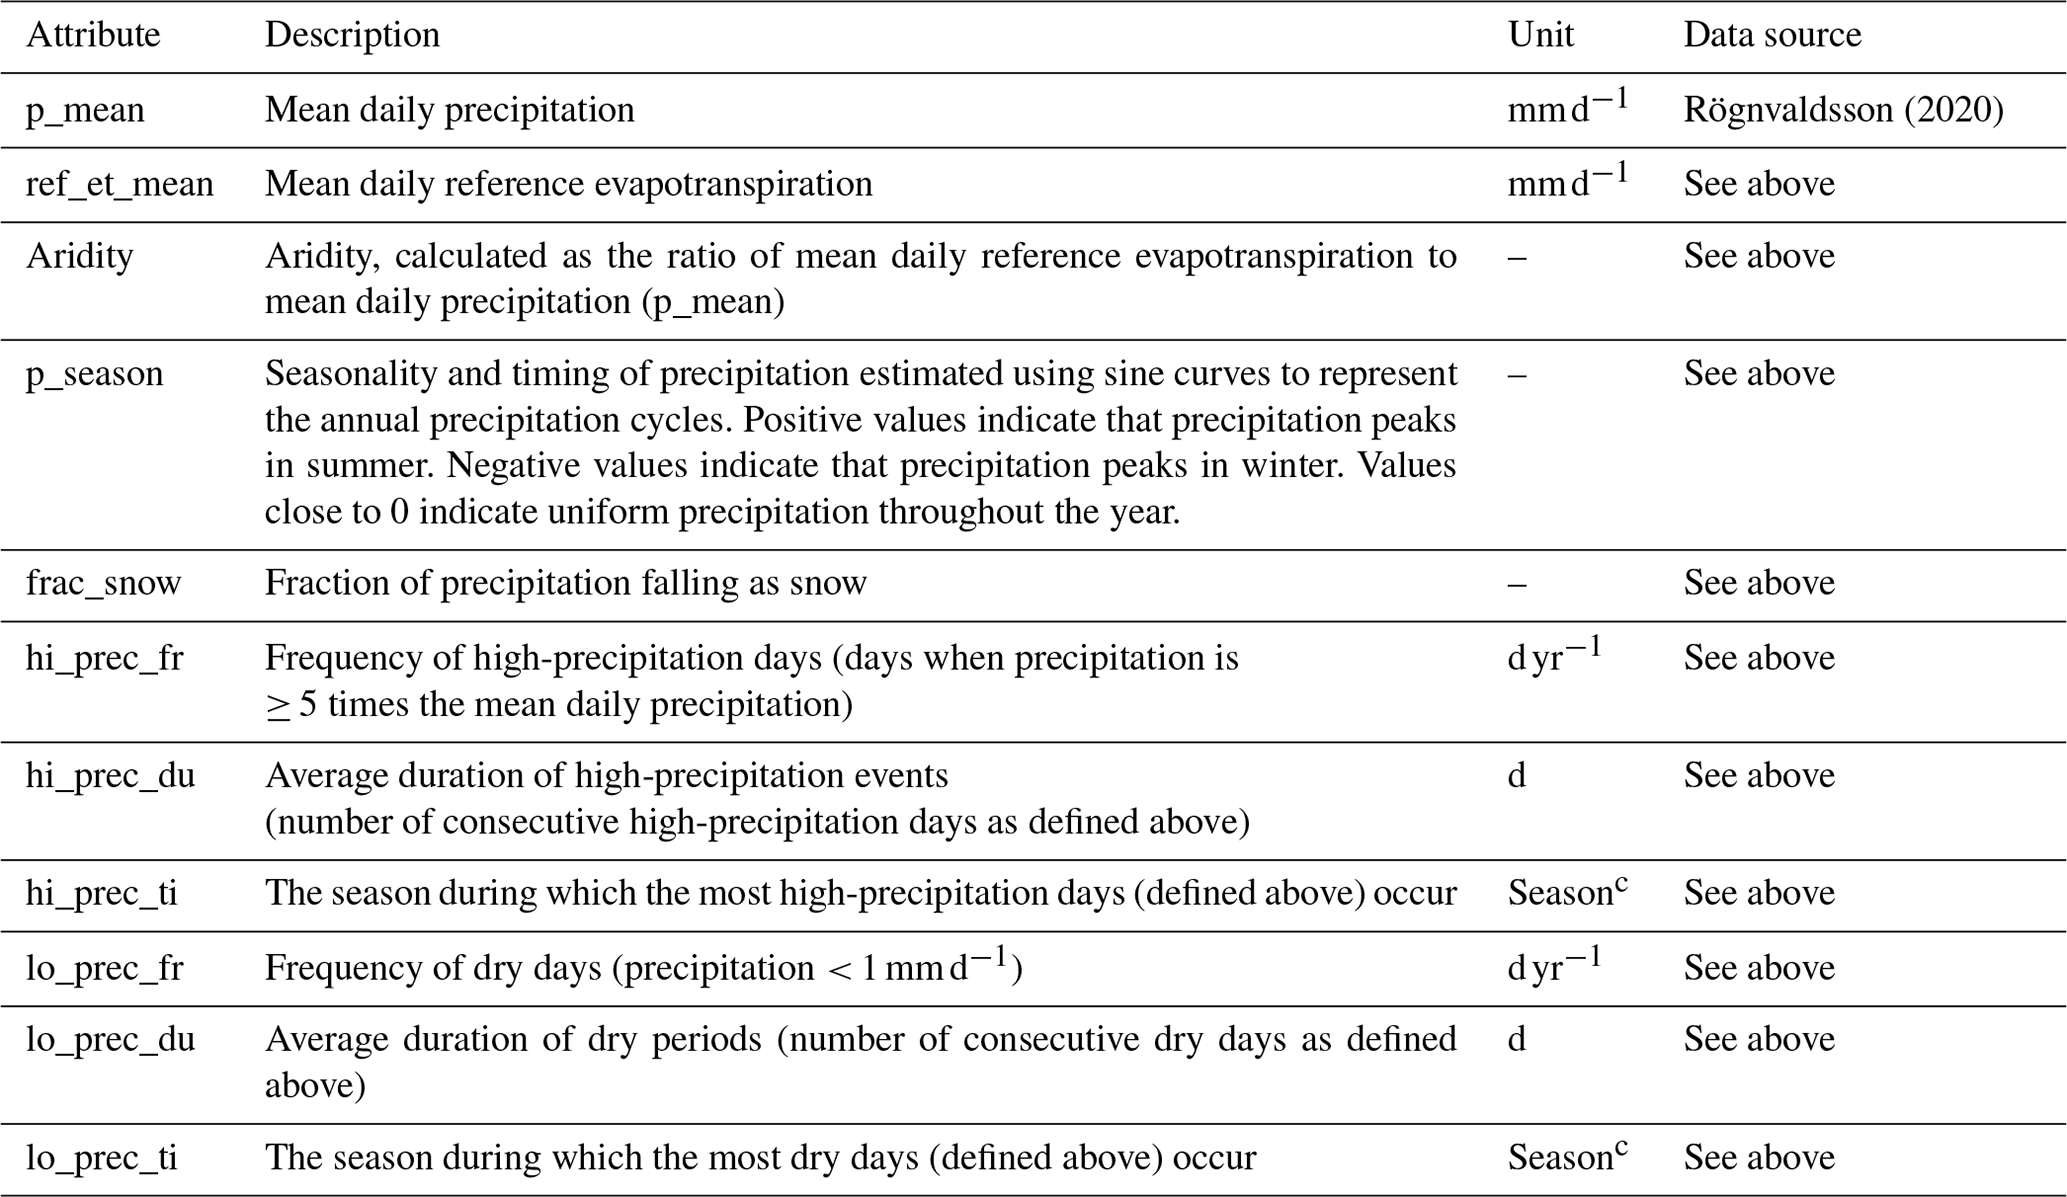
LamaH-Ice includes a total of 11 climate indices for all the catchments (Table A4). These indices are computed over hydrological years 1990 to 2009 as in the existing CAMELS and LamaH datasets. We calculated the climate indices using time series of precipitation, temperature, and reference evapotranspiration (derived) from the RAV-II reanalysis dataset (Sect. 4.2). The indices describe long-term, seasonal, and short-term characteristics of the climate. Figure 5 shows the spatial distribution of the climate indices. We also calculated these indices using time series from the ERA5-Land reanalysis. These indices are available in the catchment attribute file with an “_ERA5L” suffix.
Indices describing long-term climatology include the daily mean precipitation (“p_mean”), reference evapotranspiration (“ref_et_mean”), and aridity index (“aridity”). Watersheds in the south of Iceland experience the highest levels of precipitation, with levels gradually decreasing towards the north (Fig. 5a). Evapotranspiration levels in Iceland are low due to cool temperatures and high humidity. Figure 5b shows that reference evapotranspiration levels are lower in the central south of the island, generally increasing towards the north. Even though temperatures are higher in the south, air humidity is also higher in that region, which affects the ability of air to take up moisture. Net radiation, another main driver of ET, is also higher in catchments in the north (when computed with a hypothetical crop albedo of 0.23; see Supplement Sect S3.3). With a low reference ET in LamaH-Ice catchments (mean value of 0.5 mm d−1) and high precipitation (4.7 mm d−1), the aridity index is also low (Fig. 5c), which indicates a low degree of dryness compared to other regions with similar amounts of precipitation.
Indices describing seasonal characteristics of the climate include the snow fraction of precipitation (“frac_snow”) and the seasonality of precipitation index (“p_season”). Positive values of this index highlight summer as the peak precipitation season, and negative values emphasize winter. Figure 5d shows that the seasonality index is negative for all the regions. The largest negative values are in the highlands and in the catchments in the Westfjords in northwestern Iceland. These are watersheds where a large fraction of the annual precipitation falls as snow (Fig. 5g).
Indices that provide information on short-term weather events include the frequency of high-precipitation days (“hi_prec_fr”) and dry days (“lo_prec_fr”), the average duration of high-precipitation (“hi_prec_du”) and low-precipitation (“lo_prec_du”) days, and the most common season they occur in (“hi_prec_ti” and “lo_prec_ti”). The frequency of high-precipitation days is highest in the eastern part of Iceland and decreases towards the west (Fig. 5e). High-precipitation-intensity events are common in the eastern fjords, especially in the fall, when extratropical cyclones approach the coast with easterly or southeasterly winds. The heavy precipitation is caused by strong orographic uplift. The central region of Iceland experiences lower precipitation intensity as the air in this region has already shed much of its moisture due to the orographic uplift at the coast. Even though areas in the central region of the island experience few high-precipitation days, they also see few dry days (Fig. 5h), which are more common in the east and the north.
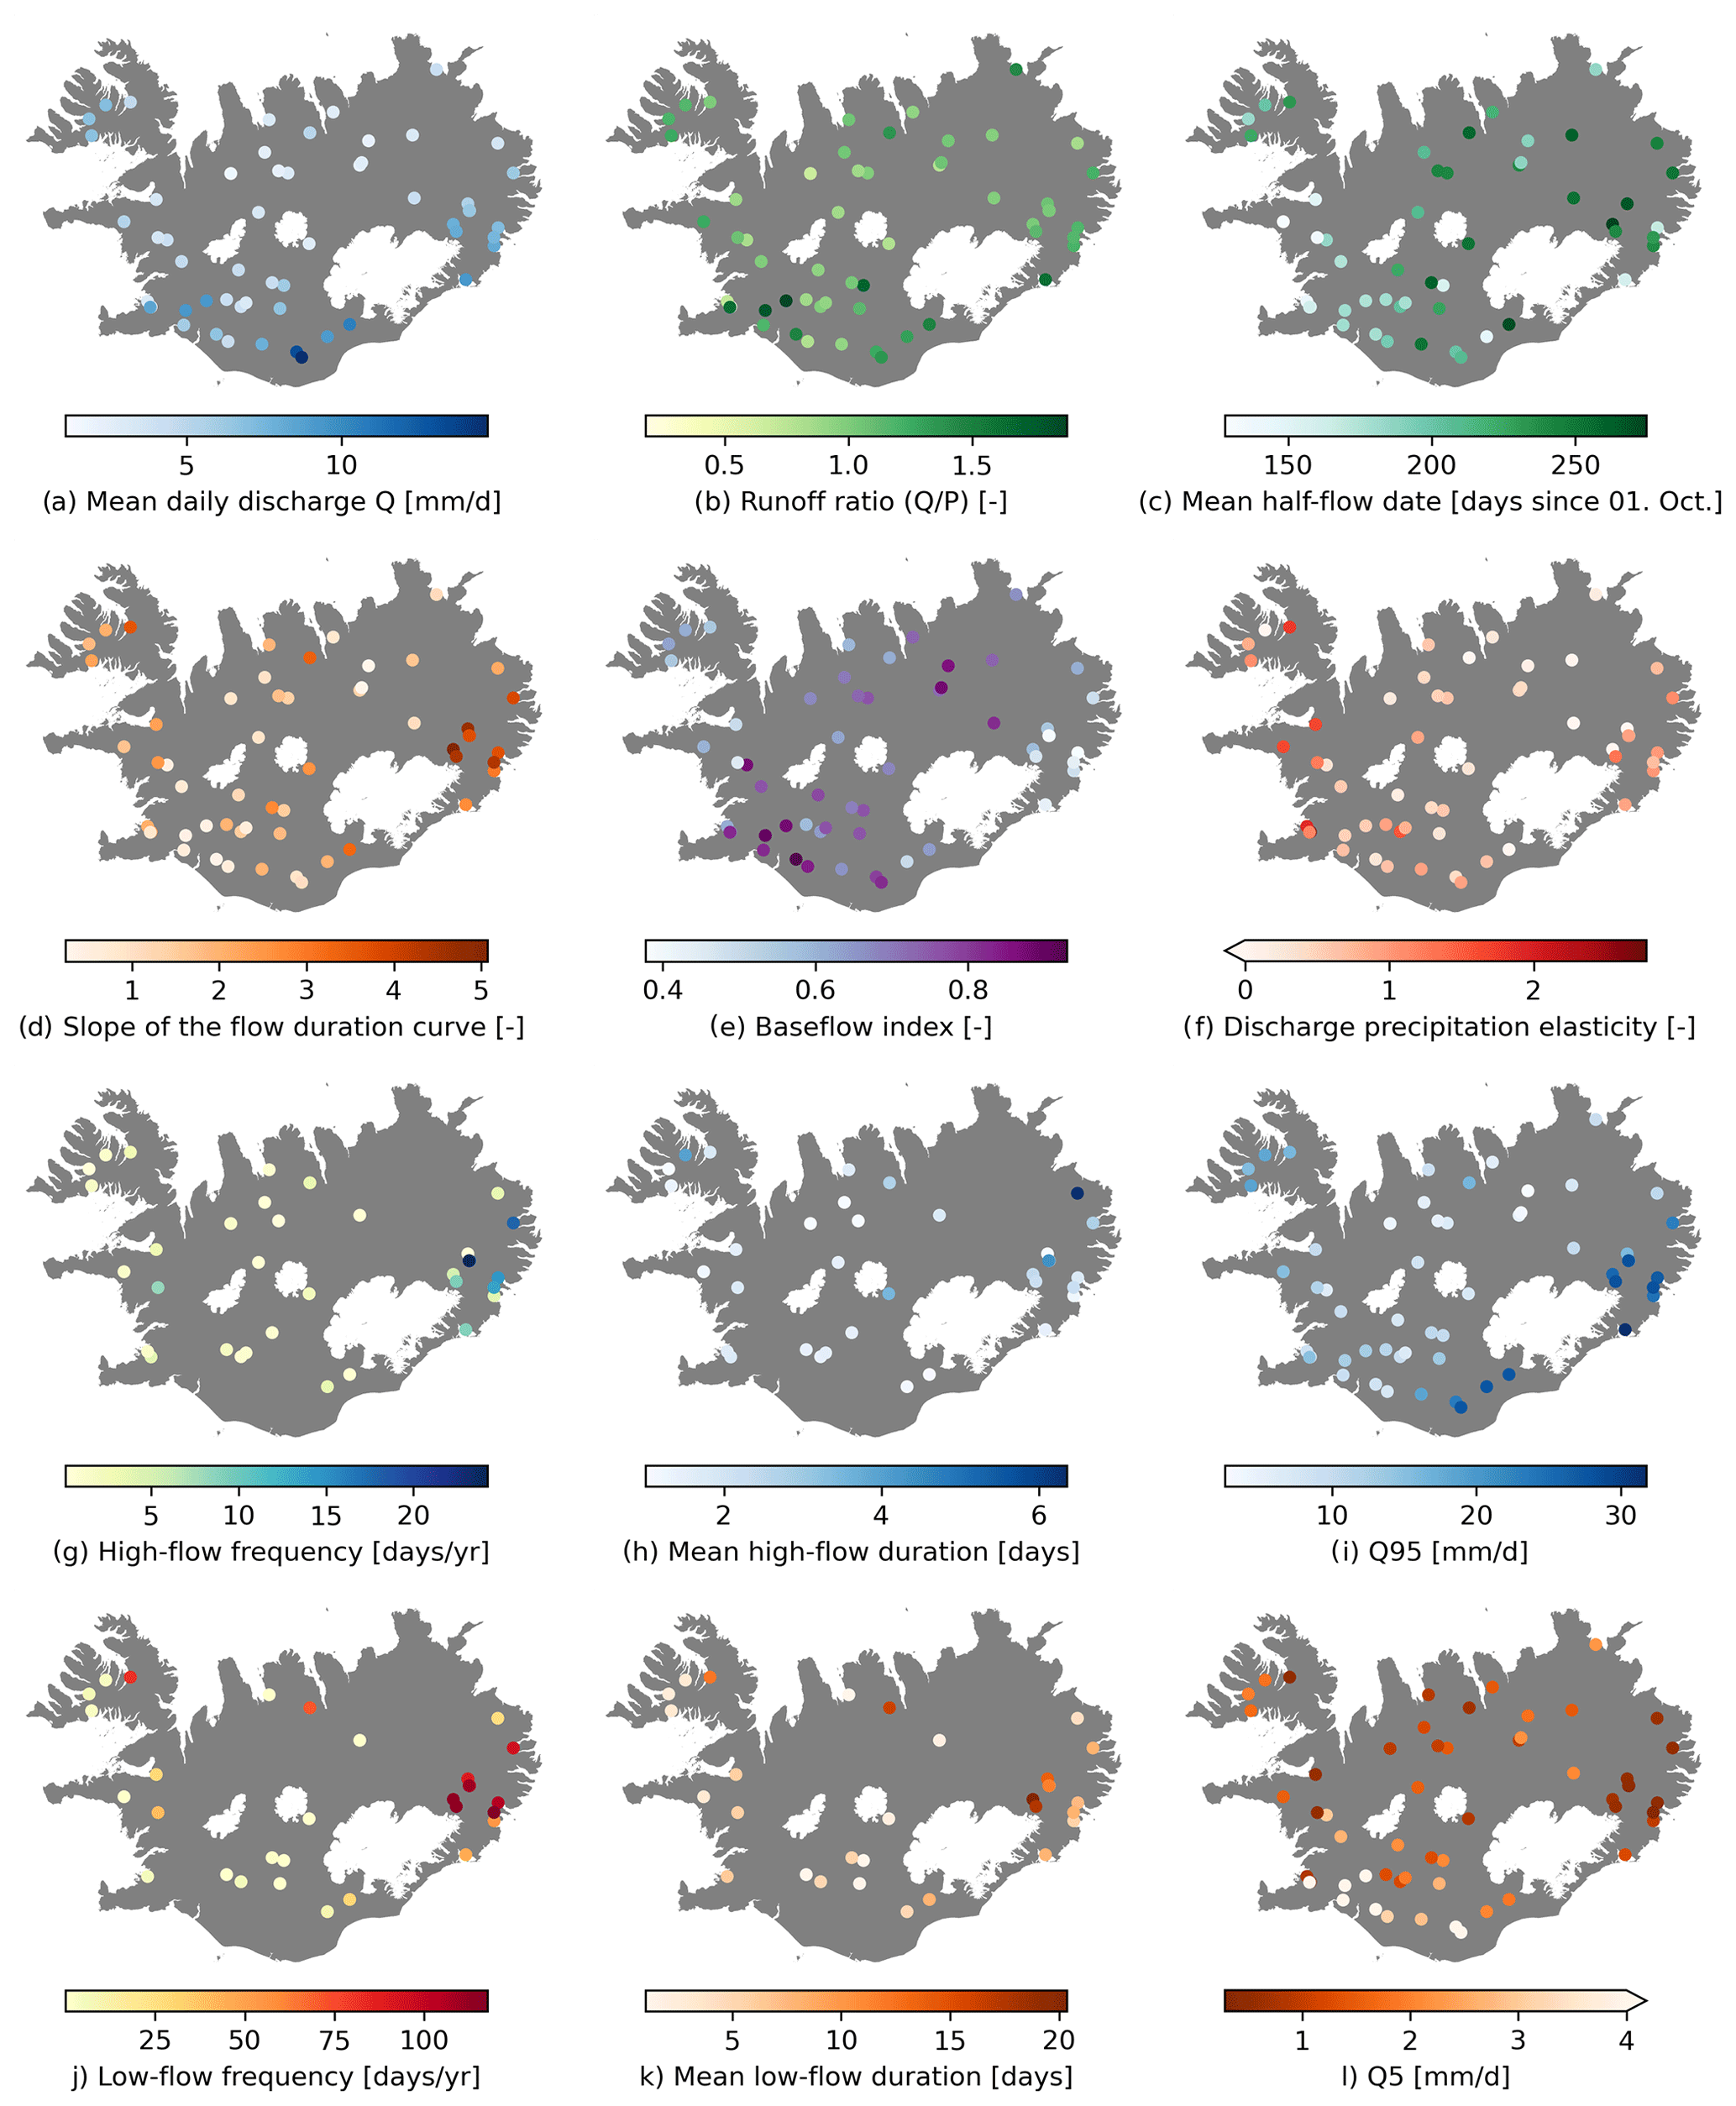
Figure 6Spatial distribution of hydrological signatures. The signatures were calculated using measured streamflow series and RAV-II precipitation for the 37-year period between 1 October 1981 and 30 September 2018. Only hydrological years with at least 90 % temporal coverage during this period were considered. Gauges with less than 3 years of 90 % coverage were omitted. The total number of gauges shown is 55. Panels (g), (h), (j), and (k) describe the frequency and duration of high and low flows. The number of gauges shown in these panels is lower since high and low flows, as they are defined here, do not occur in all the gauges. Basemap source: Hijmans (2015).
5.3 Hydrological signatures
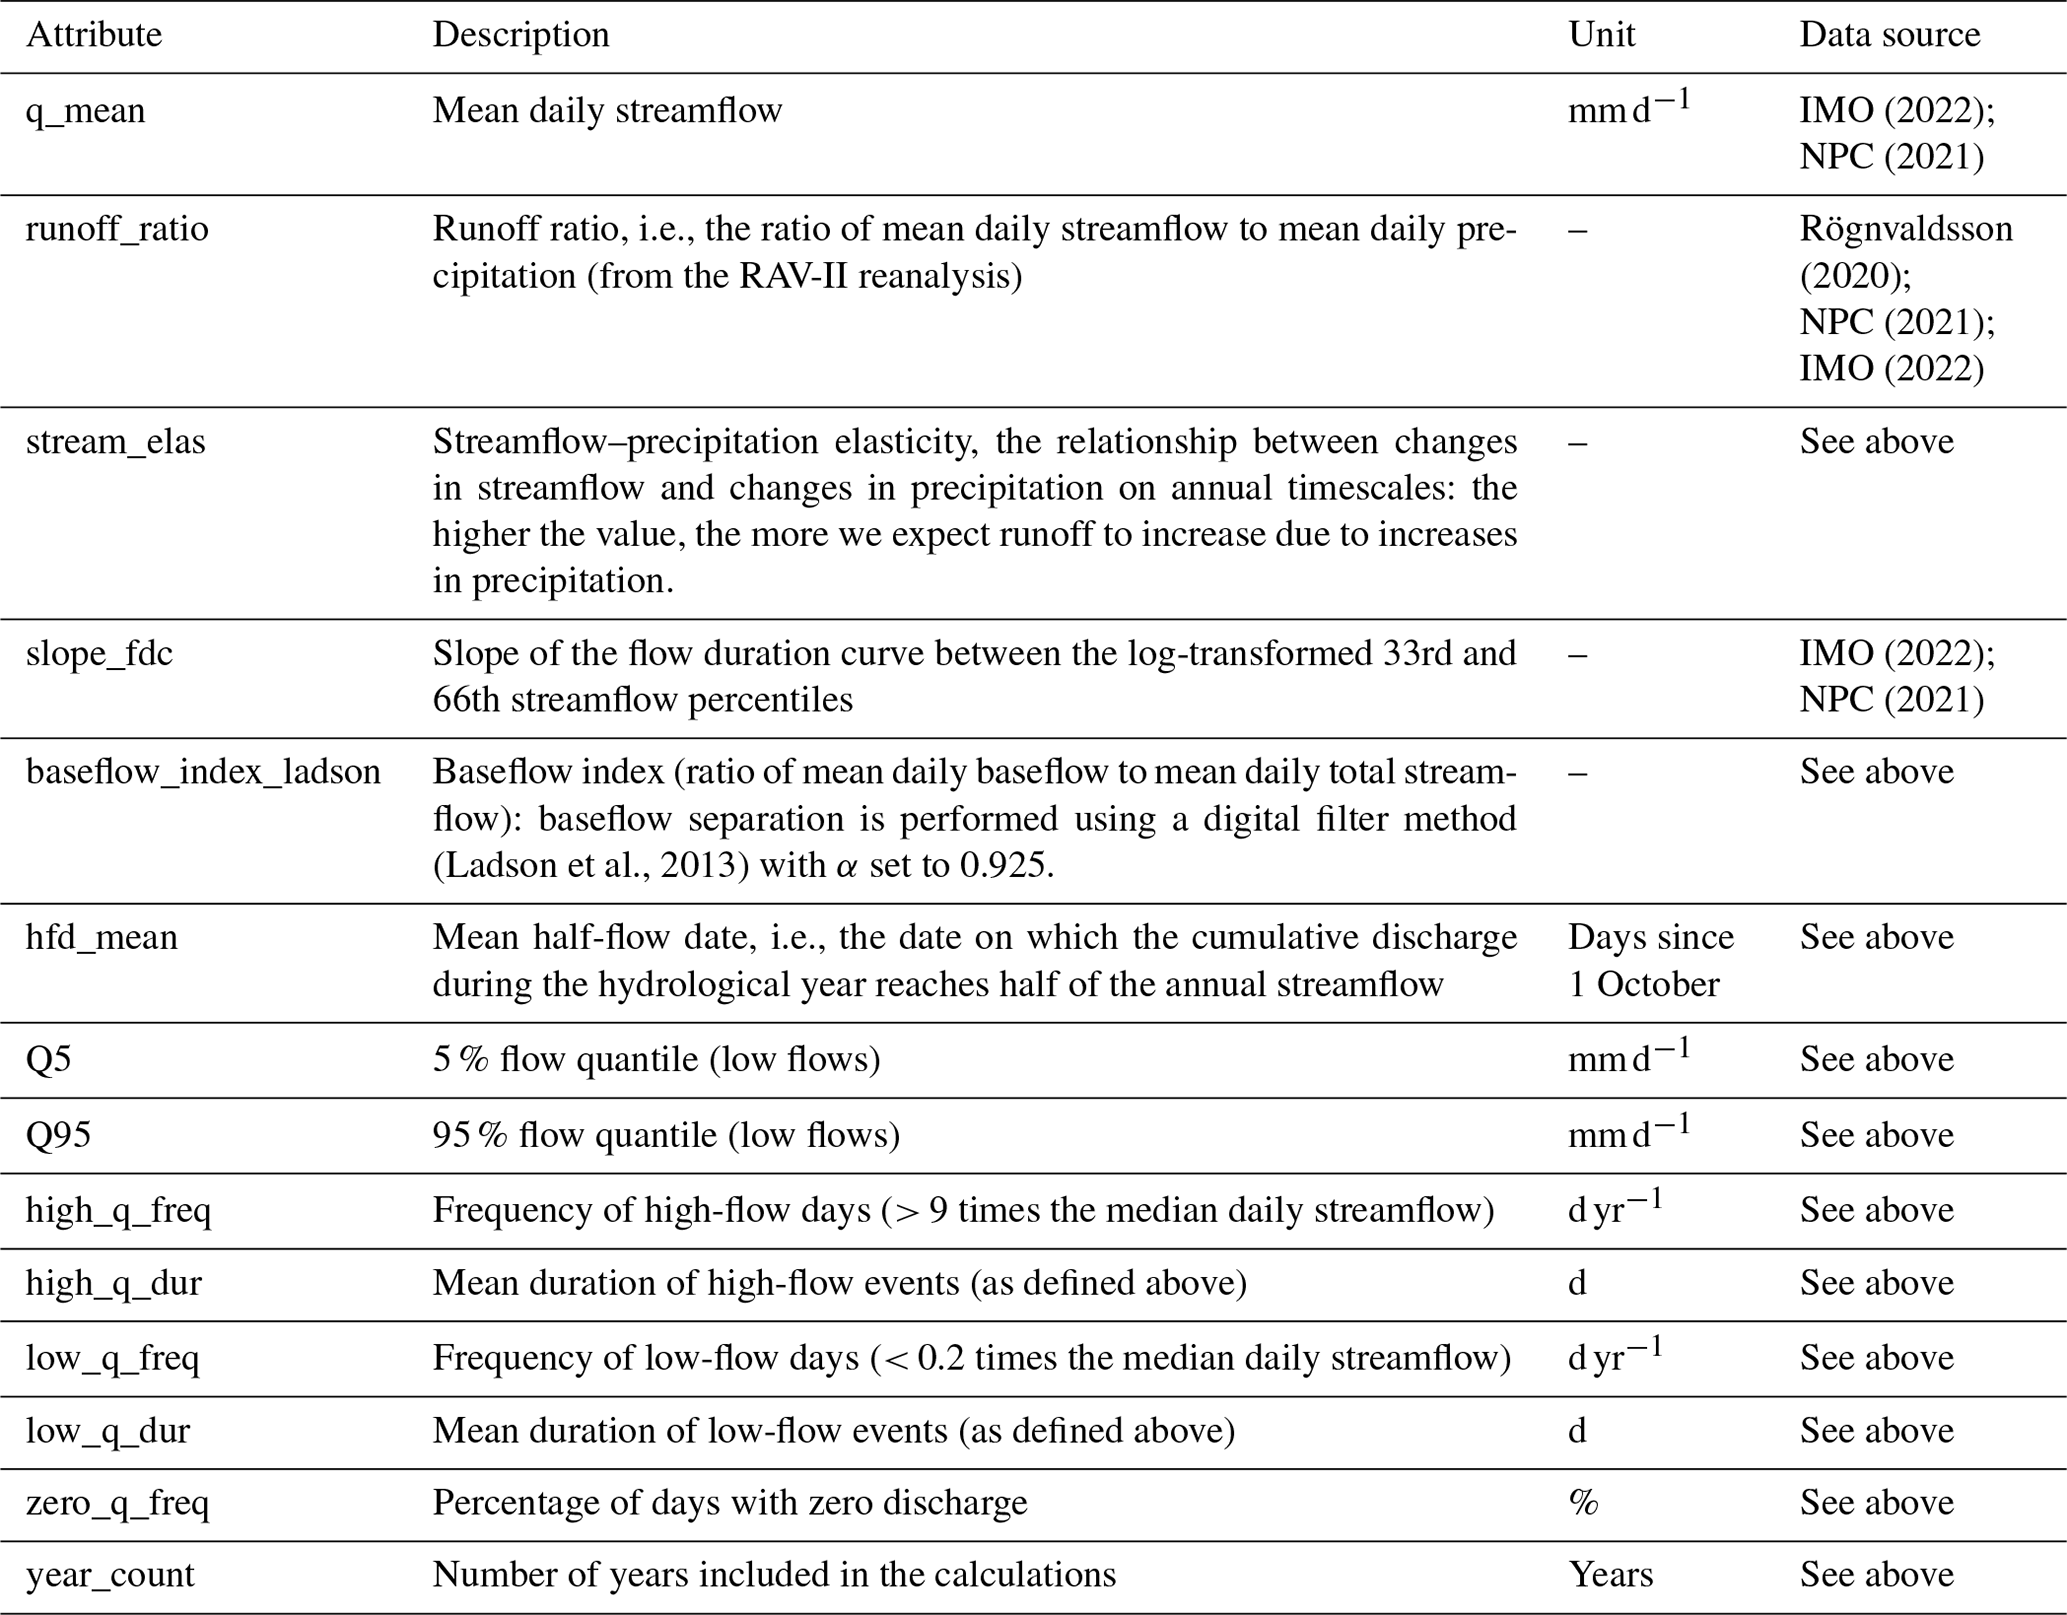
A total of 13 hydrological signatures were calculated to characterize the observed streamflow time series (Table A5). As with the climate indices, the streamflow signatures describe long-term, seasonal, and short-term characteristics of the hydrological system. Figure 6 shows the spatial distribution of hydrological signatures for the 55 gauges in LamaH-Ice that have a high temporal coverage of streamflow observations (Sect. 4.1) and exhibit natural streamflow conditions (Sect. 5.9). The mean daily discharge (“q_mean”, Fig. 6a) is highest along the southern coast of Iceland, where precipitation is highest. The runoff ratio (“runoff_ratio”) is derived by dividing the mean daily streamflow by the mean daily precipitation. It thus represents the fraction of the precipitation that exits the catchment via the stream channel. However, as reported in Sect. 4.2, the precipitation from RAV-II used here is biased low, and thus the computed runoff ratio is unrealistically high (Fig. 6b), with a mean of 1.1. A few high outliers include glaciated basins as well as spring-fed rivers. The relationship between changes in streamflow and changes in precipitation on annual timescales is represented via the runoff–precipitation elasticity (“stream_elas”, Fig. 6f). The higher the value, the more we expect runoff to increase due to increases in precipitation. The mean value for rivers in LamaH-Ice is 0.6, which means that a 10 % increase in precipitation would on average lead to a 6 % increase in streamflow. However, we see quite a spread in the elasticity values for the catchments in LamaH-Ice.
We separated the baseflow component from the total runoff using the method by Ladson et al. (2013). The ratio of baseflow to total runoff (“baseflow_index_ladson”) is shown in Fig. 6e. The figure shows that the rivers draining the young and porous bedrock along the volcanic rift zone (Sect. 5.7) have a high baseflow index, and rivers draining the low-permeability bedrock in the western and eastern regions have a low baseflow index.
Two streamflow signatures offer insights into the seasonality of streamflow. The mean half-flow date (“hfd_mean”) is shown in Fig. 6c. Rivers draining the largest glaciers generally have a high mean half-flow date, as do snowmelt-dominated rivers in the northern part of Iceland. The slope of the middle section of the flow duration curve (“slope_fdc”) describes the general flashiness of streamflow, with higher values indicating greater variability within the year. We see a higher flow duration curve slope for basins with a low baseflow index (R = −0.81).
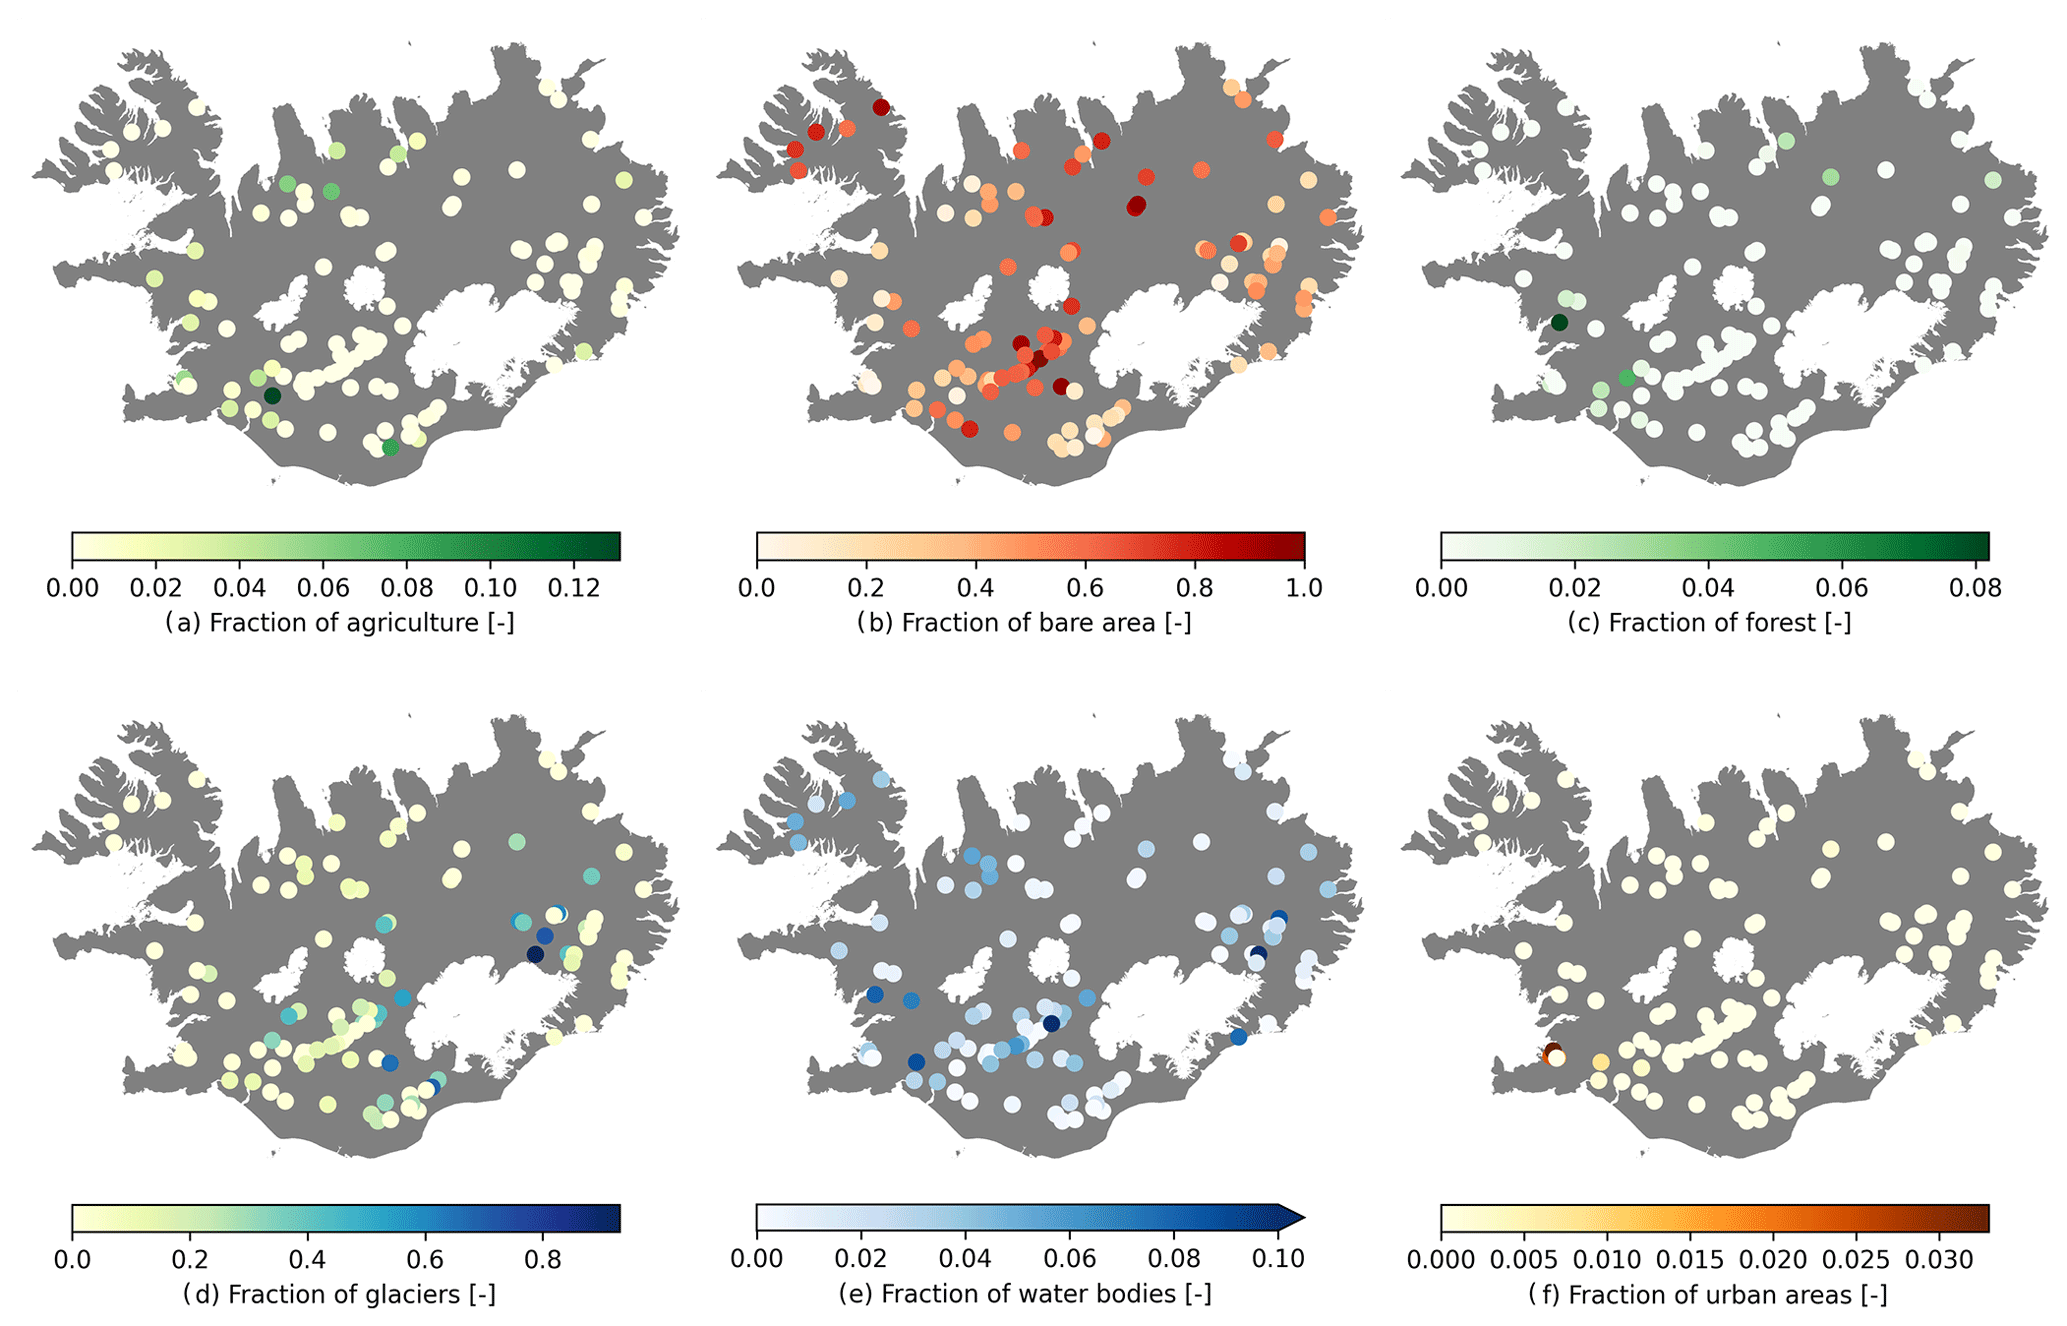
Figure 7Land cover classification from CORINE for the LamaH-Ice catchments. Basemap source: Hijmans (2015).
To describe short-term extremes in streamflow, seven indices are calculated that relate to high and low flows. For this purpose, high flows are defined as being at least 9 times the median daily streamflow (Clausen and Biggs, 2000), and low flows are defined as flows that are less than 20 % of the median daily streamflow (Olden and Poff, 2003). The frequencies of these events are calculated (“high_q_freq” and “low_q_freq”), together with their durations (“high_q_dur” and “low_q_dur”). High and low flows, as they are defined here, do not occur in all the gauges in LamaH-Ice. Figure 6g, h, j, and k therefore include fewer gauges than the other panels in Fig. 6. The magnitudes of high and low flows are described by calculating the 95th (“Q95”) and 5th (“Q5”) streamflow percentiles (Fig. 6i and l). The magnitude of high flows (Fig. 6i) is largest in the central south and southeast of Iceland, where precipitation is highest. The magnitude of low flows (Fig. 6l) is highest for rivers that have a high baseflow component (Fig. 6e). The magnitude of low flows is low in direct runoff-dominated catchments in the east and west of Iceland and where the contribution of glacier melt is high.
5.4 Land cover characteristics
LamaH-Ice includes seven attributes that describe the land cover (Table A6). All are based on the pan-European Coordination of Information on the Environment (CORINE) land cover dataset (Büttner, 2014). Two versions of CORINE land cover characteristics are provided in LamaH-Ice: a static version and a dynamic version. The static version uses the most recent CORINE update from 2018 (National Land Survey of Iceland, 2018), described by Árnason and Matthíasson (2020). The dynamic version uses the CORINE classifications from 2000, 2006, 2012 and 2018, thereby reflecting the changes in land cover in Iceland since 2000. The dynamic version is set up as a time series for each attribute, interpolating linearly between the four CORINE updates. The CORINE dataset is further described in Sect. S4.3 in the Supplement.
In LamaH-Ice, the dominant land class within each catchment (“lc_dom”) is calculated as the class with the largest area in the catchment. The areal fractions of agricultural areas (“agr_fra”), bare areas (“bare_fra”), forested areas (“forest_fra”), glaciers (“glac_fra”), water bodies (“lake_fra”), and urban areas (“urban_fra”) are also calculated. The static land cover attributes are shown in Fig. 7. Longer time series of glacier fractions that date back to 1890 are also made available (described in Sect. 5.8). The CORINE glacier fractions were included for consistency with the LamaH-CE dataset.
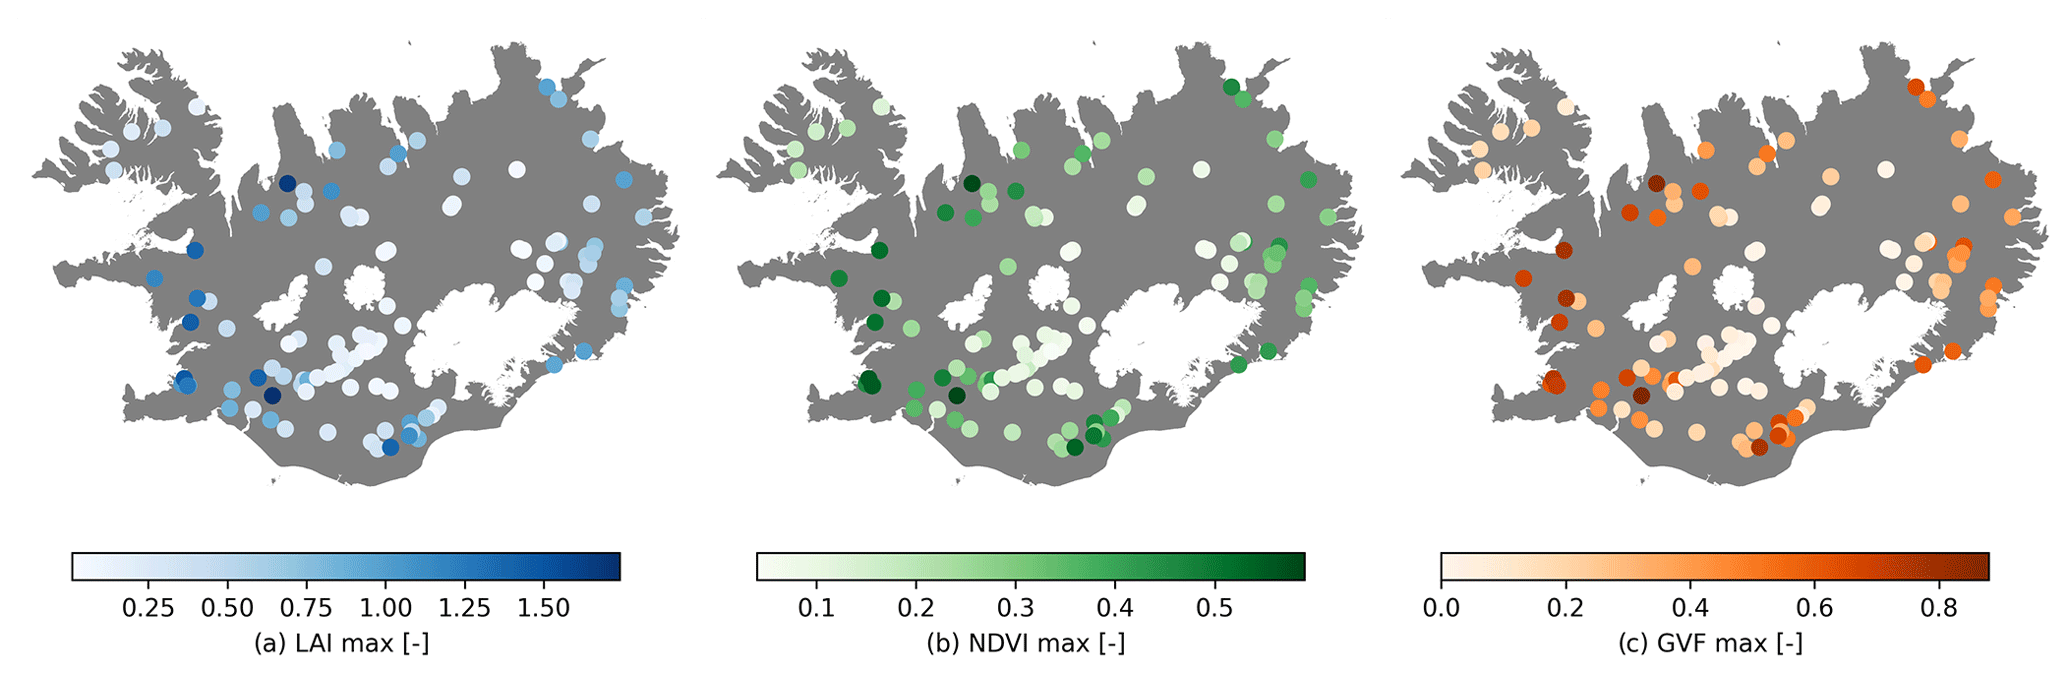
Figure 8The spatial distribution of vegetation indices for the catchments in LamaH-Ice. Basemap source: Hijmans (2015).
In most European countries, CORINE classifies the majority of land as forested, agricultural, and urban areas. As can be seen in Fig. 7a, c and f, this does not apply in Iceland, where agricultural areas are only 2.6 % of the area, urban areas only 0.39 %, and forested areas only 0.87 % (Árnason and Matthíasson, 2020). In turn, the percentage of natural areas in Iceland is by far the highest in any European country. Two of the five main CORINE categories that describe natural areas, forested and semi-natural areas, and wetlands cover 95 % of the country's area (Árnason and Matthíasson, 2020). Currently, natural forests only cover 1 % of the island (Raynolds et al., 2015). Therefore, forested areas do not contribute much to natural areas. In turn, bare areas are quite common in the LamaH-Ice catchments (Fig. 7b). Here, bare areas are defined as the two CORINE natural area classes “bare rock” and “sparsely vegetated areas”. The fraction of glaciers is high for gauges in the vicinity of the three largest ice caps (Fig. 7d).
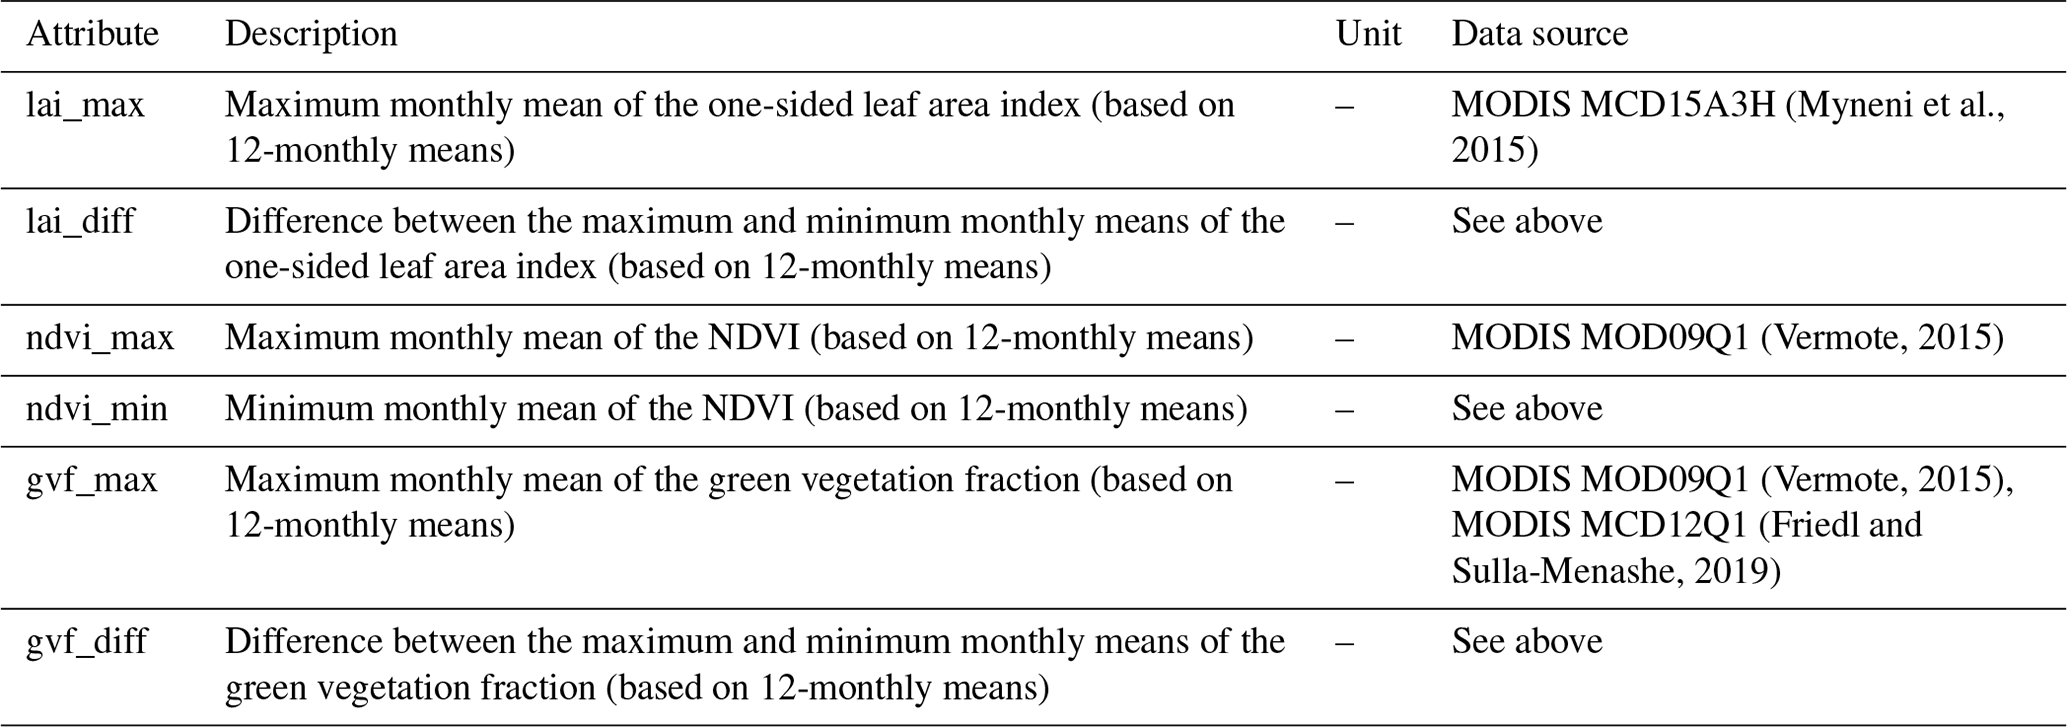
5.5 Vegetation indices
Vegetation plays an important role in the hydrological cycle. We processed remote sensing observations in the Google Earth Engine platform (Gorelick et al., 2017) to derive six static catchment characteristics relating to vegetation (listed in Table A7), all of which are also included in LamaH-CE.
The vegetation characteristics are based on three vegetation indices: leaf area index (LAI), green vegetation fraction (GVF), and normalized difference vegetation index (NDVI). The formulation of these indices is further described in Sect. S4.4 in the Supplement and in the LamaH-CE data description paper (Klingler et al., 2021). The characteristics are based on monthly means of these indices over an extended period. For all three, we calculated the maximum monthly mean (out of 12 monthly means) and calculated the minimum monthly mean (for the NDVI) or the difference between the lowest and highest means (for the LAI and GVF).
The spatial distribution of three vegetation characteristics (maximum monthly LAI, NDVI, and GVF) is shown in Fig. 8. The short growing seasons and cool temperatures in Iceland limit the growth and abundance of vegetation. This is shown by the low “lai_max” and “ndvi_max” values for the catchments in LamaH-Ice, which reach maxima of 1.7 and 0.6, respectively (Fig. 8). Winter vegetation activity in Iceland is low, and the minimum measured LAI and NDVI values for the LamaH-Ice catchments are close to zero. The maximum GVF values (“gvf_max”) are quite high in lowland areas, which shows that the volcanic soils in Iceland (Sect. 5.6) are quite fertile.
5.6 Surface deposits and soil characteristics
Many rainfall–runoff processes take place in the subsurface. It is thus important to include subsurface characteristics in LSH datasets. At the end of the last glacial period, about 10 000 years ago, glaciers receded and exposed erosion products that form most of the surface deposits currently found in Iceland. The primary surface deposits are glacial till, ancient deltas formed by higher sea levels after the glacial period, landslides, flood plains, and sediment deposited by modern surface waters (Pétursson and Bjarnason, 2023). Soils in Iceland are mostly Andisols, which are a soil type found in active volcanic areas, characterized by large proportions of volcanic glass (Arnalds and Óskarsson, 2009).
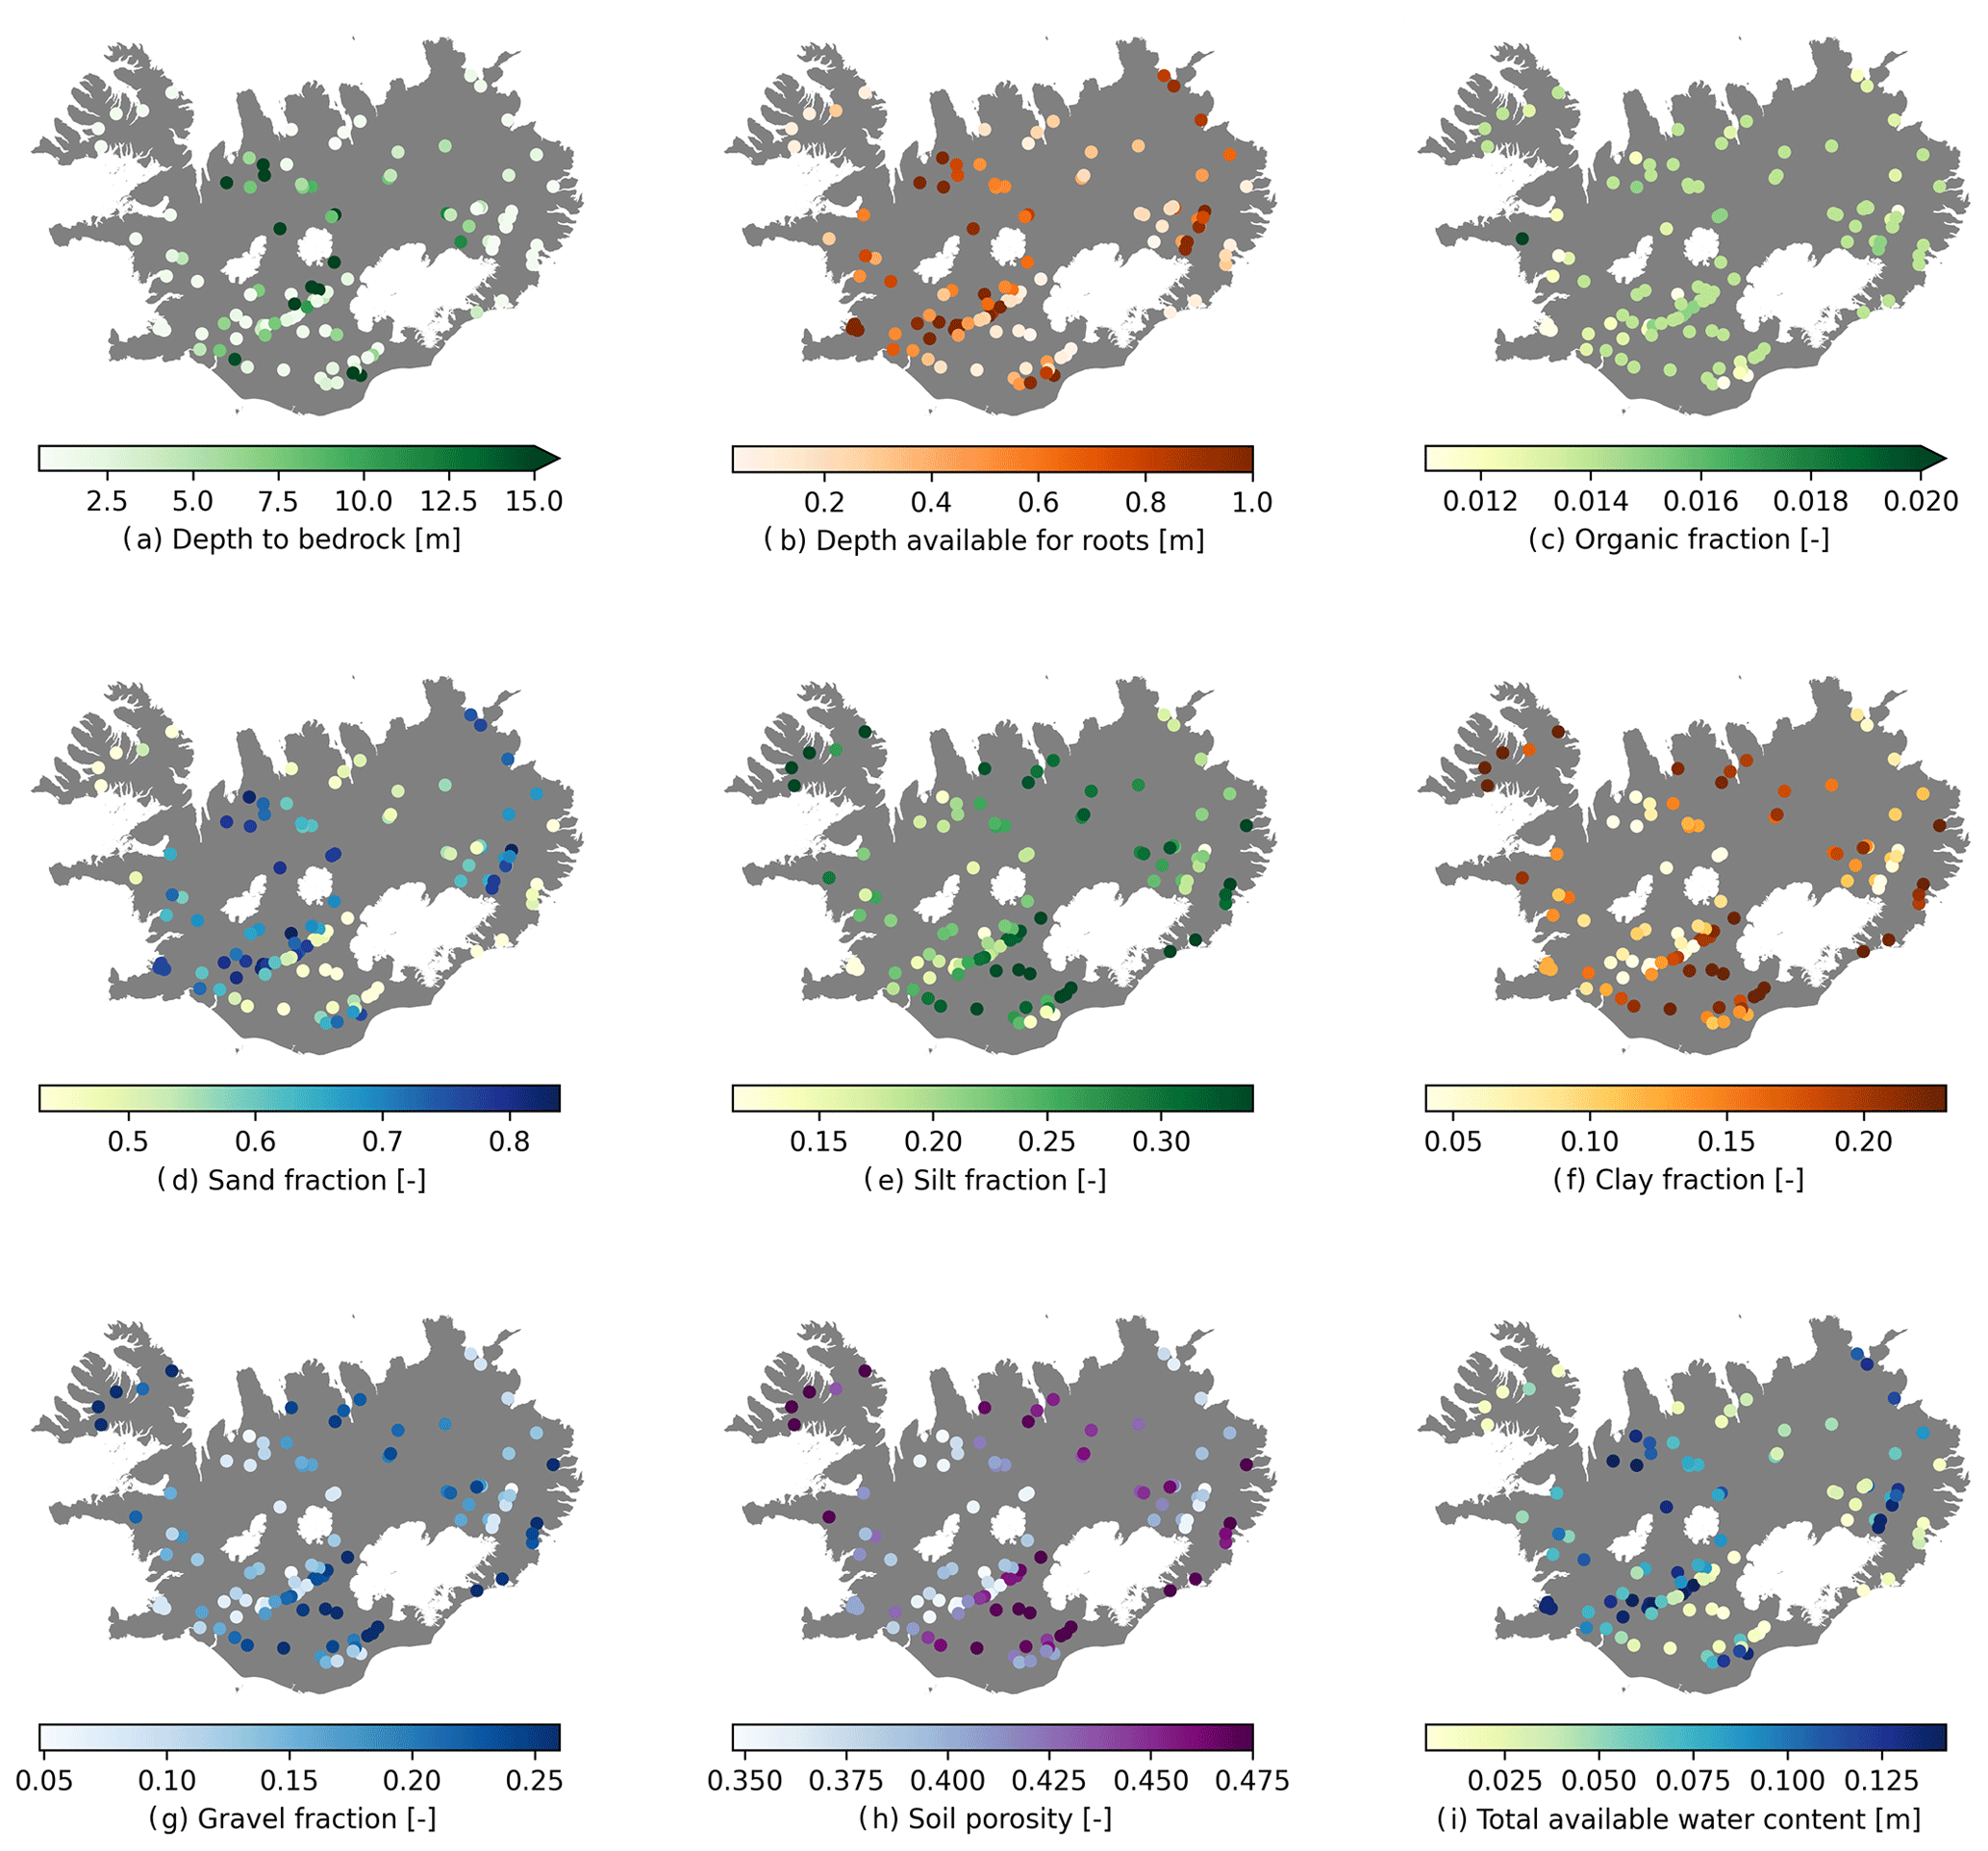
Figure 9Spatial distribution of soil attributes for the catchments in LamaH-Ice. Basemap source: Hijmans (2015).
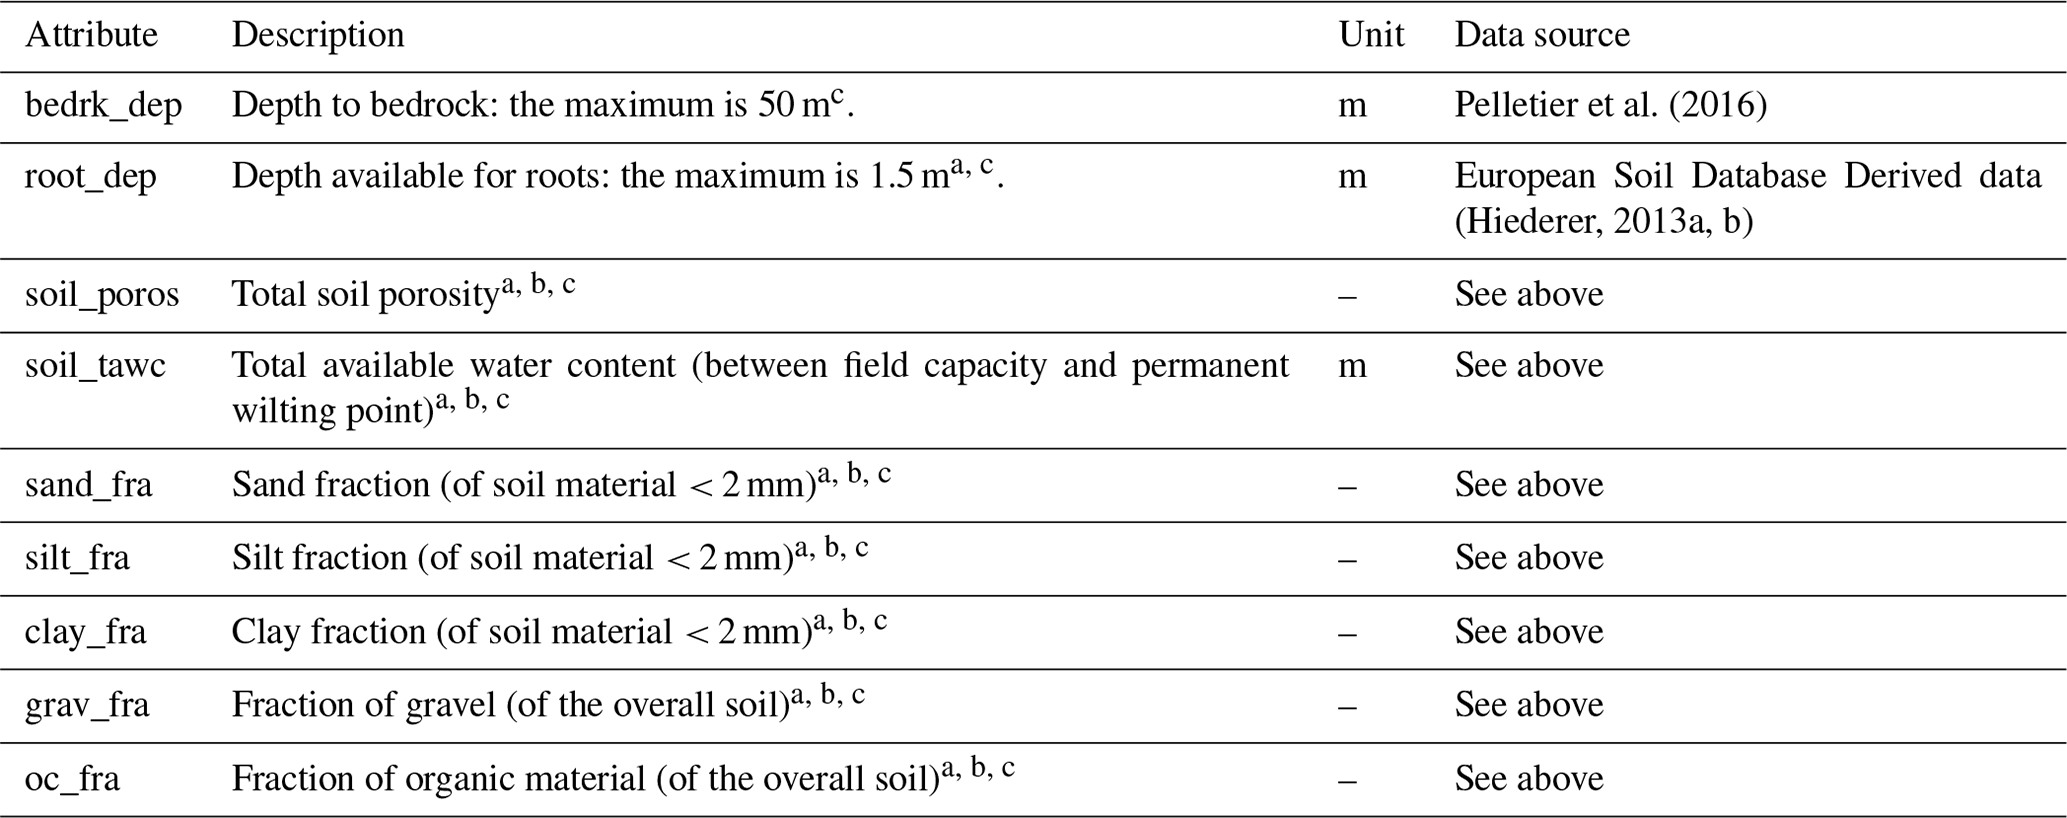
In LamaH-Ice, we include nine attributes that describe the properties of the soils, regolith, and sediment in Iceland (Table A8). We calculated the attributes in the same manner as in the LamaH-CE dataset. We derived the depth to bedrock attribute (“bedrk_dep”) from the Global 1 km Gridded Thickness of Soil, Regolith, and Sedimentary Deposit Layers (GGT; Pelletier et al., 2016). The depth to bedrock in Iceland varies widely depending on the location (Fig. 9a).
Other attributes relating to soils were extracted from the European Soil Database Derived data (ESDD; Hiederer, 2013a, b). ESDD presents data on soil texture as percentages showing the relative amounts of fine-earth materials (particle size < 2 mm) in the soil, sand (“sand_fra”), silt (“silt_fra”), and clay (“clay_fra”), and these percentages amount to 100. In addition, the fraction of gravel (“grav_fra”) and organic material (“oc_fra”) in the total soil is also included. These fractions for the soils of the LamaH-Ice catchments are shown in Fig. 9c–g. The data sources and their uncertainties are further described in Sect. S4.5 in the Supplement.
Of the three fine-earth material classes, sand has the highest mean fraction over all the catchments (62 %), followed by silt (24 %) and clay (14 %). The mean fraction of gravel in the total soils of catchments in LamaH-Ice is 16 % and the mean organic fraction is 1 % (note that these fractions represent additional components of the soil, distinct from the fine-earth fractions). The depth available to roots (“root_dep”) is generally high in the soils of Iceland (Fig. 9b), which is a characteristic of Andisols soils due to their low cohesion. In catchments with a high depth available to roots, there is a high portion of sand (R = 0.95), and soil porosity (“soil_poros”) is low (R 0.89).
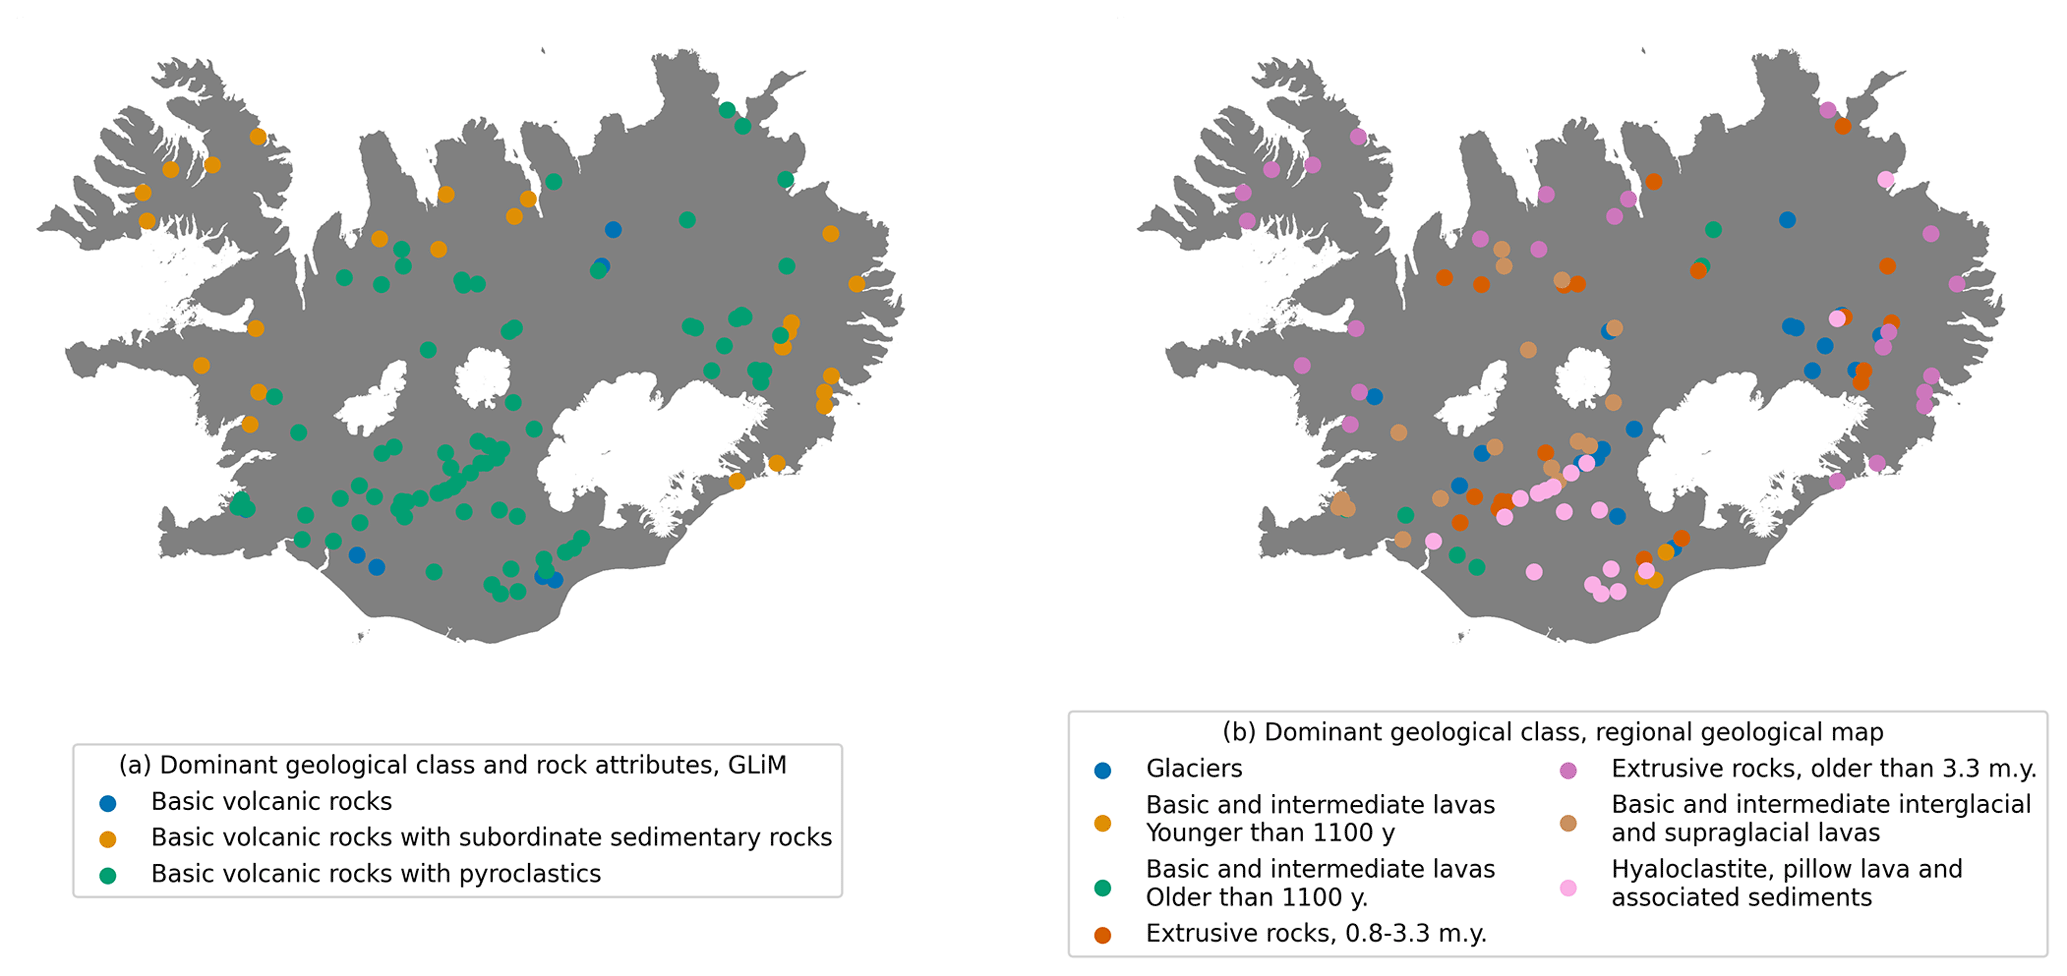
Figure 10The dominant geological class of each catchment in LamaH-Ice, as depicted in (a) the GLiM global lithological map, levels 2 and 3 (Hartmann et al., 2012), and (b) a regional geological map of Iceland (Icelandic Institute of Natural History, 2014). stands for million years. Basemap source: Hijmans (2015).
5.7 Geological characteristics
Iceland is a volcanically active island crossed by a volcanic rift zone that lies from the southwestern corner of the island to the north-northeastern part. The bedrock conditions strongly affect the hydrology, with large contrasts within the island. The bedrock in the rift zone is young, porous, and easily erodible, and the permeability is high. Rivers that drain these areas generally have a high baseflow component. Conversely, rivers draining areas with older, low-permeability bedrock in the eastern and western parts of the island are mostly surface-fed. Due to the variability of geological formations in Iceland and the extent to which bedrock conditions affect hydrology, we chose to include more detailed geological information in LamaH-Ice than in the LamaH-CE or CAMELS datasets (Table A9).
To calculate geological characteristics of catchments, a global lithological map, GLiM (Hartmann et al., 2012, further explained in Sect. S4.6 in the Supplement), and a geological map of Iceland at a much finer spatial resolution (Icelandic Institute of Natural History, 2014) were used. The spatial distribution of the dominant rock attributes from GLiM (levels 2 and 3, Fig. 10a) shows that basic volcanic rock is the most common type in Iceland, with variations depending on the catchment locations.
The geological map of Iceland (Icelandic Institute of Natural History, 2014) is on the scale 1:600 000. It contains 16 classes that describe the main characteristics of Iceland's bedrock geology. Bedrock is classified by type, composition, and age. The spatial distribution of the dominant geological class from this geological map is shown in Fig. 10b. The eastern and western regions are characterized by extrusive rocks that are older than 3.3 million years (“ggold_fra”). Younger extrusive rocks are found towards the center of the island, along with different types of lavas.
In LamaH-Ice, the dominant geological class for each catchment is specified for the geological classifications described above. The fraction of each class within the catchment is also specified (Table A9).
5.8 Glacial characteristics
Sixty-five out of the 107 catchments in LamaH-Ice were partly covered by glaciers in 1890. Nine glacial attributes are provided in the dataset (Table A10). The glacier-covered fraction of each catchment area (“g_frac”) and the glaciated area (“g_area”) are included as both static and dynamic attributes. The dynamic attributes are calculated from a national inventory of glacier outlines (Hannesdóttir et al., 2020). The inventory consists of historical reconstructions of glacier extents from various sources at multiple times from 1890 to 2019. The inventory is openly available as part of the Global Land Ice Measurements from Space (GLIMS) glacier database (nsidc.org/glims). The reconstructions reveal that Icelandic glaciers lost 18 % of their area during this time (Hannesdóttir et al., 2020). In LamaH-Ice, we created time series of glacier-covered fraction and glaciated area by linearly interpolating between the dates of the historical reconstructions. In 1890, the 56 catchments in LamaH-Ice with over 2 % glaciation had a mean glaciation of 29.8 % (393 km2), which was reduced to 24.2 % (331 km2) in 2019. The highest decrease in percent glaciation is 18.6 % (4 km2), while the highest areal decrease is 229 km2 (3.5 %). Four catchments lost all their glaciated area between 1890 and 2019. Static glacial area and fraction attributes are based on the most recent glacial outline from the inventory (2019).
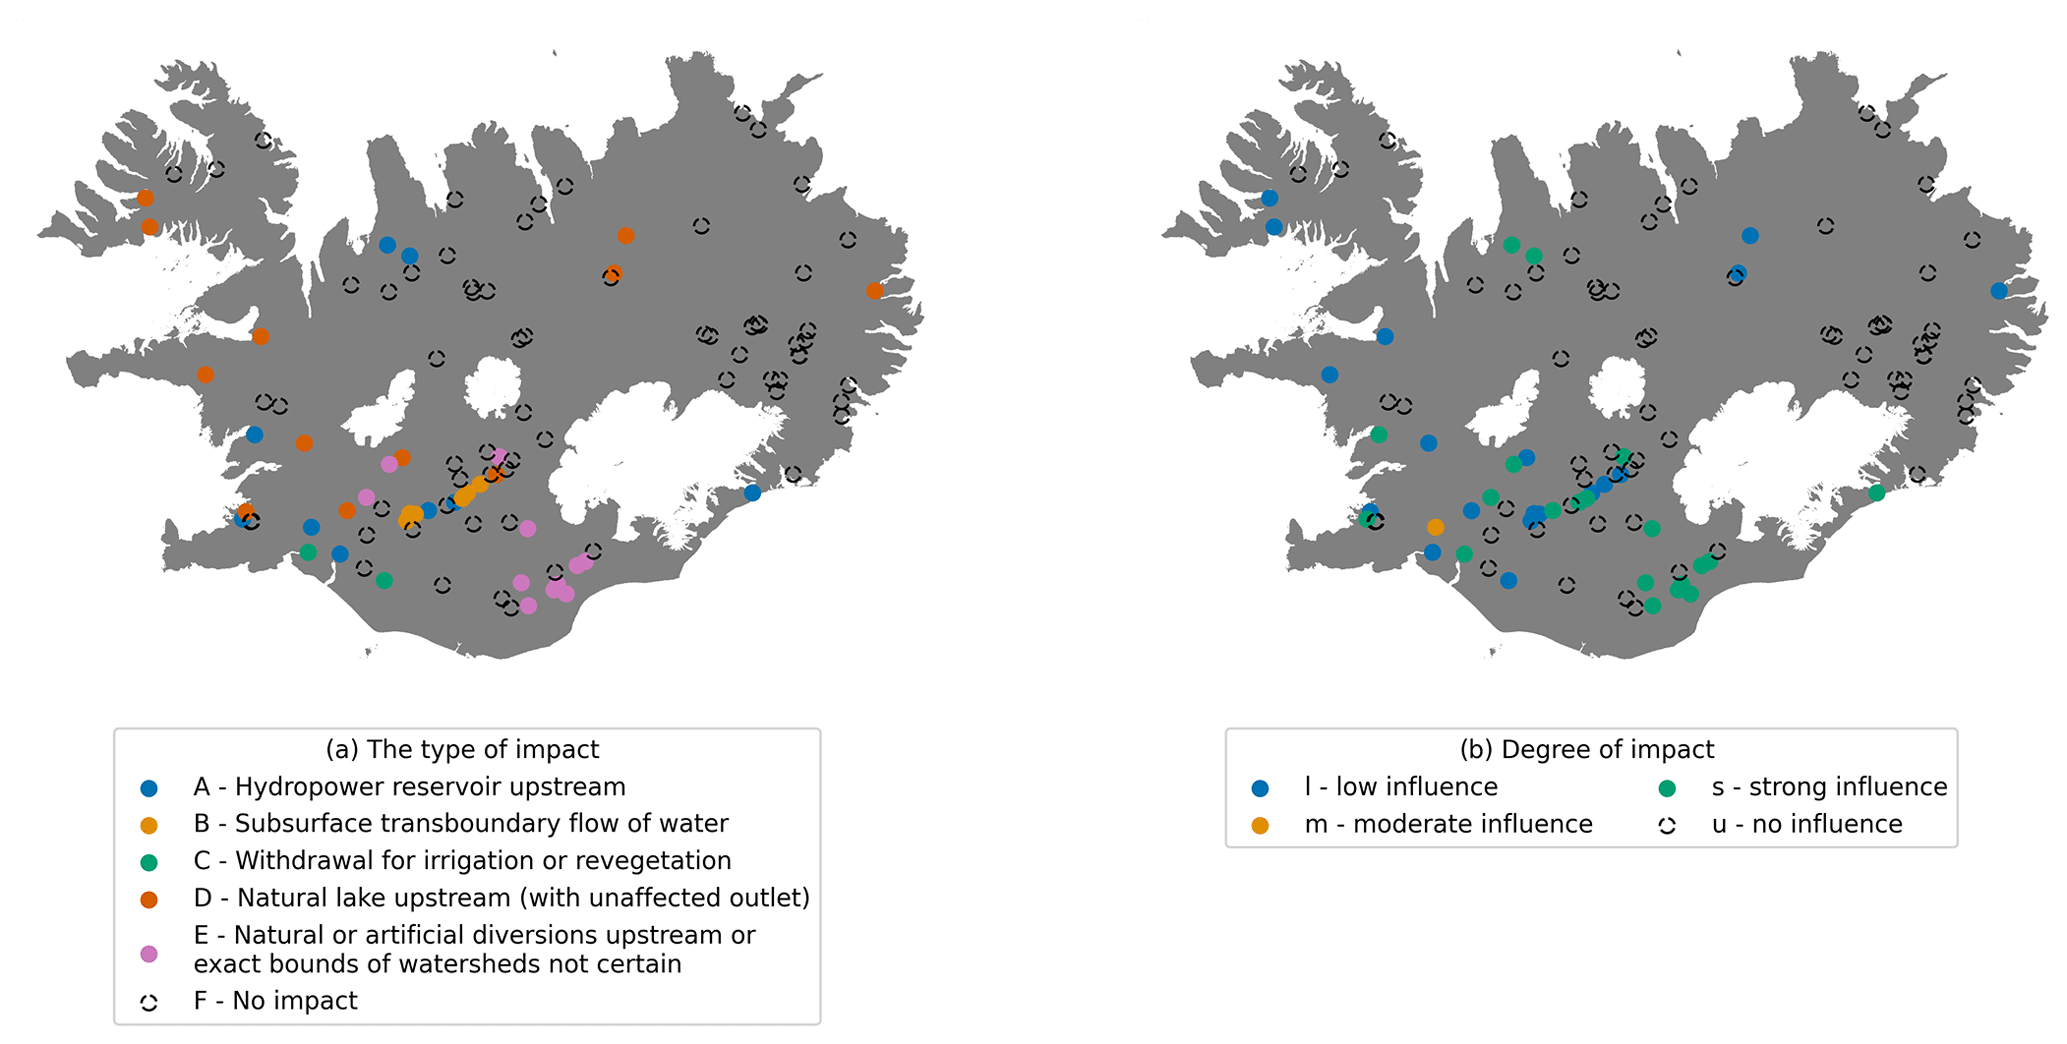
Figure 11Spatial distribution of the type of impact (a) and degree of impact (b) on the streamflow measurements in LamaH-Ice. Basemap source: Hijmans (2015).
Various topographical qualities of glaciers affect their glaciohydrological processes. Sensitivity studies performed in the Alps have shown that the lowermost 20 % area slope (“g_slopel20”), mean elevation (“g_mean_el“), aspect (“g_aspect”), latitude (“g_lat”), and longitude (“g_lon”) of the glacier centroid have statistically significant relationships with changes in the glacier equilibrium line altitude (ELA) and with changes in the annual surface mass balance (Rabatel et al., 2016, 2013; Bolibar et al., 2020). These attributes as well as the mean glacier slope (“g_slope”) and maximum (“g_max_el”) and minimum (“g_min_el”) glacier altitudes (Table A10) are included in LamaH-Ice for each glaciated catchment. We used the IslandsDEM version 1.0 DEM (National Land Survey of Iceland, 2020) to calculate the topographical attributes for the glaciated part of each catchment. The mean elevation of the glaciers in the 61 glaciated LamaH-Ice catchments is 1188 , their mean slope is 100 m km−1, and the mean slope of their lowermost 20 % area is 125 m km−1. Uncertainties in the DEM or watershed delineation method (described in Sect. S1 in the Supplement) can introduce potential inaccuracies into the calculations of these topographic indices.
5.9 Natural or anthropogenic impacts on runoff
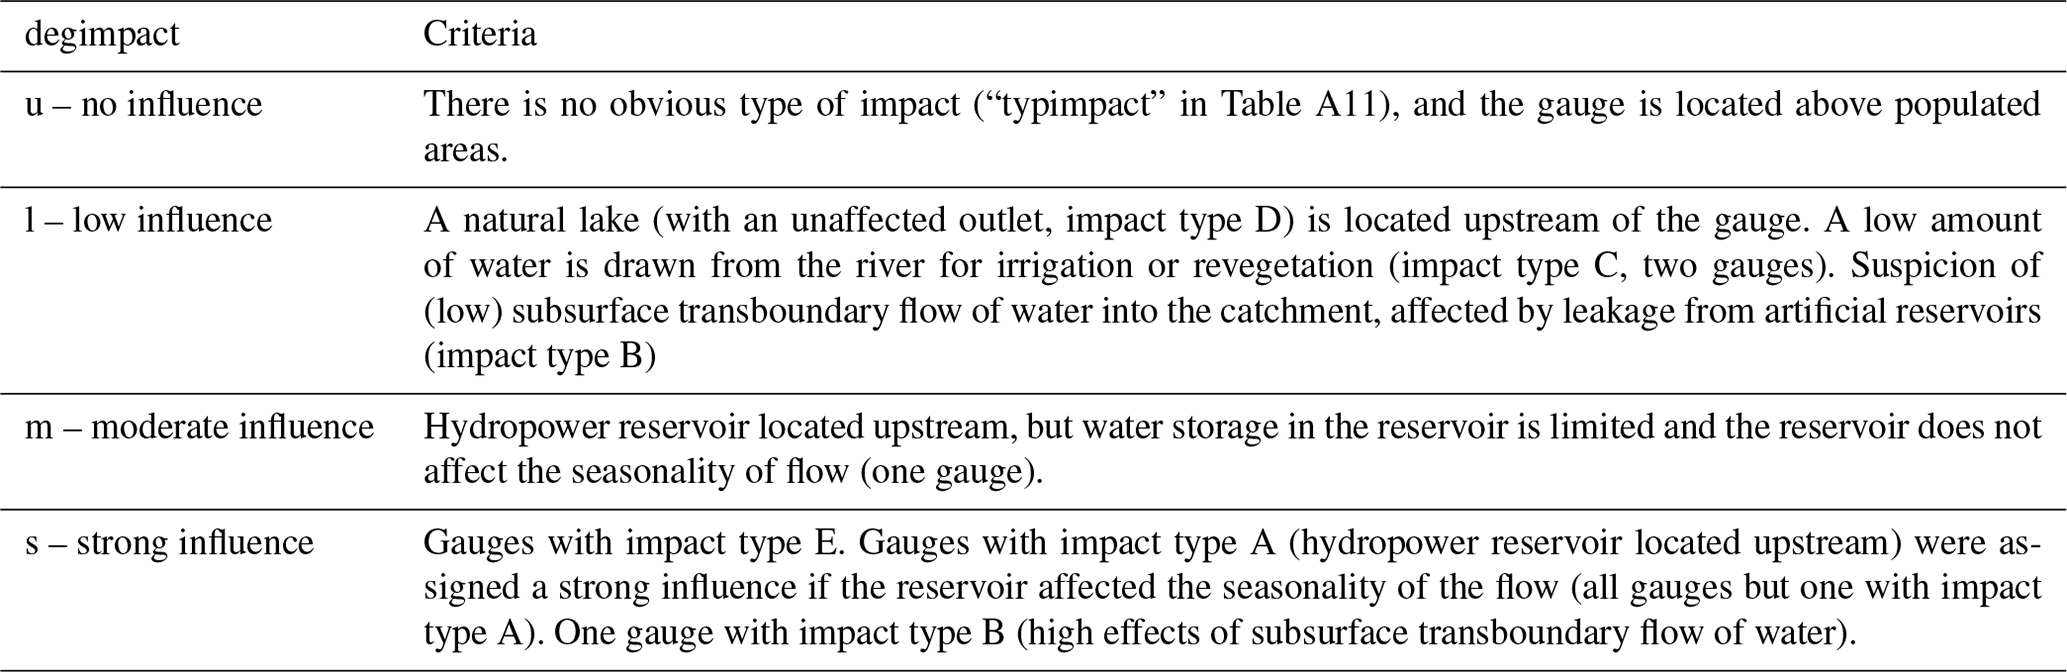
Two attributes are included in LamaH-Ice to indicate any possible anthropogenic impacts on runoff time series as well as natural impacts such as the presence of an upstream lake. In LamaH-CE, storage and anthropogenic impacts on runoff are categorized into 13 classes. We adopted this classification but removed classes that were either not relevant in Iceland or for which relevant information was unavailable. The six remaining impact classes (“typimpact”) are shown in Table A11. The classes were assigned manually using areal imagery or publicly available information. As in LamaH-CE, the degree of impact is also provided (“degimpact”), ranging from no influence to strong influence on runoff. Table A12 provides further information on the degree-type allocation. The degree types are based on LamaH-CE with certain adaptations.
Most gauges are not influenced (67 out of 107 or 63 %) and thus exhibit natural and uninterrupted flow conditions (Fig. 11). A total of 19 gauges (18 % of the total gauges) experience low natural or anthropogenic influence. Out of those 19 gauges, 12 gauges are only influenced by natural lakes upstream of the gauge. Thus, a total of 79 gauges (74 %) exhibit natural flow conditions. One gauge experiences moderate influence, and 20 gauges (19 %) experience strong influence.
The LamaH-Ice dataset is available for download from the HydroShare repository: https://doi.org/10.4211/hs.86117a5f36cc4b7c90a5d54e18161c91 (Helgason and Nijssen, 2024). Please consider the disclaimer and license which the data are subject to, stated on HydroShare. We offer three downloadable files: (1) “lamah_ice_hourly”, the LamaH-Ice dataset containing hydrometeorological time series with both daily and hourly resolutions; (2) “lamah_ice”, the dataset with hydrometeorological time series with daily resolution only; and (3) “Caravan_extension_lamahice”, the LamaH-Ice Caravan extension. For meteorological time-series and catchment attributes in LamaH-Ice, three folders are supplied, one for each delineation method (A, B, and C). Each folder contains three subfolders: “attributes”, “timeseries”, and “shapefiles”. The attributes folder contains one .csv file with static catchment attributes. The timeseries folder contains meteorological time series, snow cover or glacier albedo time series, and annual time series of the glacier mass balance and extent and CORINE land cover change. The shapefiles folder contains the catchment as shapefiles and GeoPackages. A separate folder contains information about the gauges, including the streamflow observations (“D_gauges”). A table showing the folder structure can be found in Table S3 in the Supplement.
All code used to produce the LamaH-Ice dataset and plot the figures in this paper is included in folder F in the LamaH-Ice dataset (https://doi.org/10.4211/hs.86117a5f36cc4b7c90a5d54e18161c91, Helgason and Nijssen, 2024) as well as in the GitHub repository of the dataset (https://github.com/hhelgason/LamaH-Ice, last access: 27 May 2024).
A new hydrological dataset for Iceland (LamaH-Ice) has been compiled containing daily and hourly hydrometeorological time-series and catchment characteristics for 107 river basins. The catchment characteristics describe the topographic, hydroclimatic, land cover, vegetation, soil, geological, and glaciological attributes of the river catchments as well as the human influence on streamflow in the catchments. In this paper, the dataset has been described and the distinctive attributes of Icelandic catchments have been showcased. The data in LamaH-Ice open new possibilities to investigate the relationship between weather forcings, catchment attributes, and streamflow in cold-region environments, with hourly streamflow measurements and a wealth of attributes relevant for cold regions. With the inclusion of glacier mass balance observations and dynamic catchment characteristics, LamaH-Ice provides new opportunities to evaluate the effects of changes in climate, land cover and glaciers on streamflow. This is important given the ongoing changes in these factors and their potential impact on water resources. A large majority of the gauged rivers in LamaH-Ice are unaffected by human activities, and thus the dataset can be valuable for improving our understanding of hydrological processes and our ability to manage water resources in cold regions.
The tables in Appendix A describe the catchment characteristics in LamaH-Ice. With some adaptations, the tables are based on the corresponding tables in LamaH-CE (Klingler et al., 2021).
Table A1Gauge-referred attributes (adapted from Klingler et al., 2021).
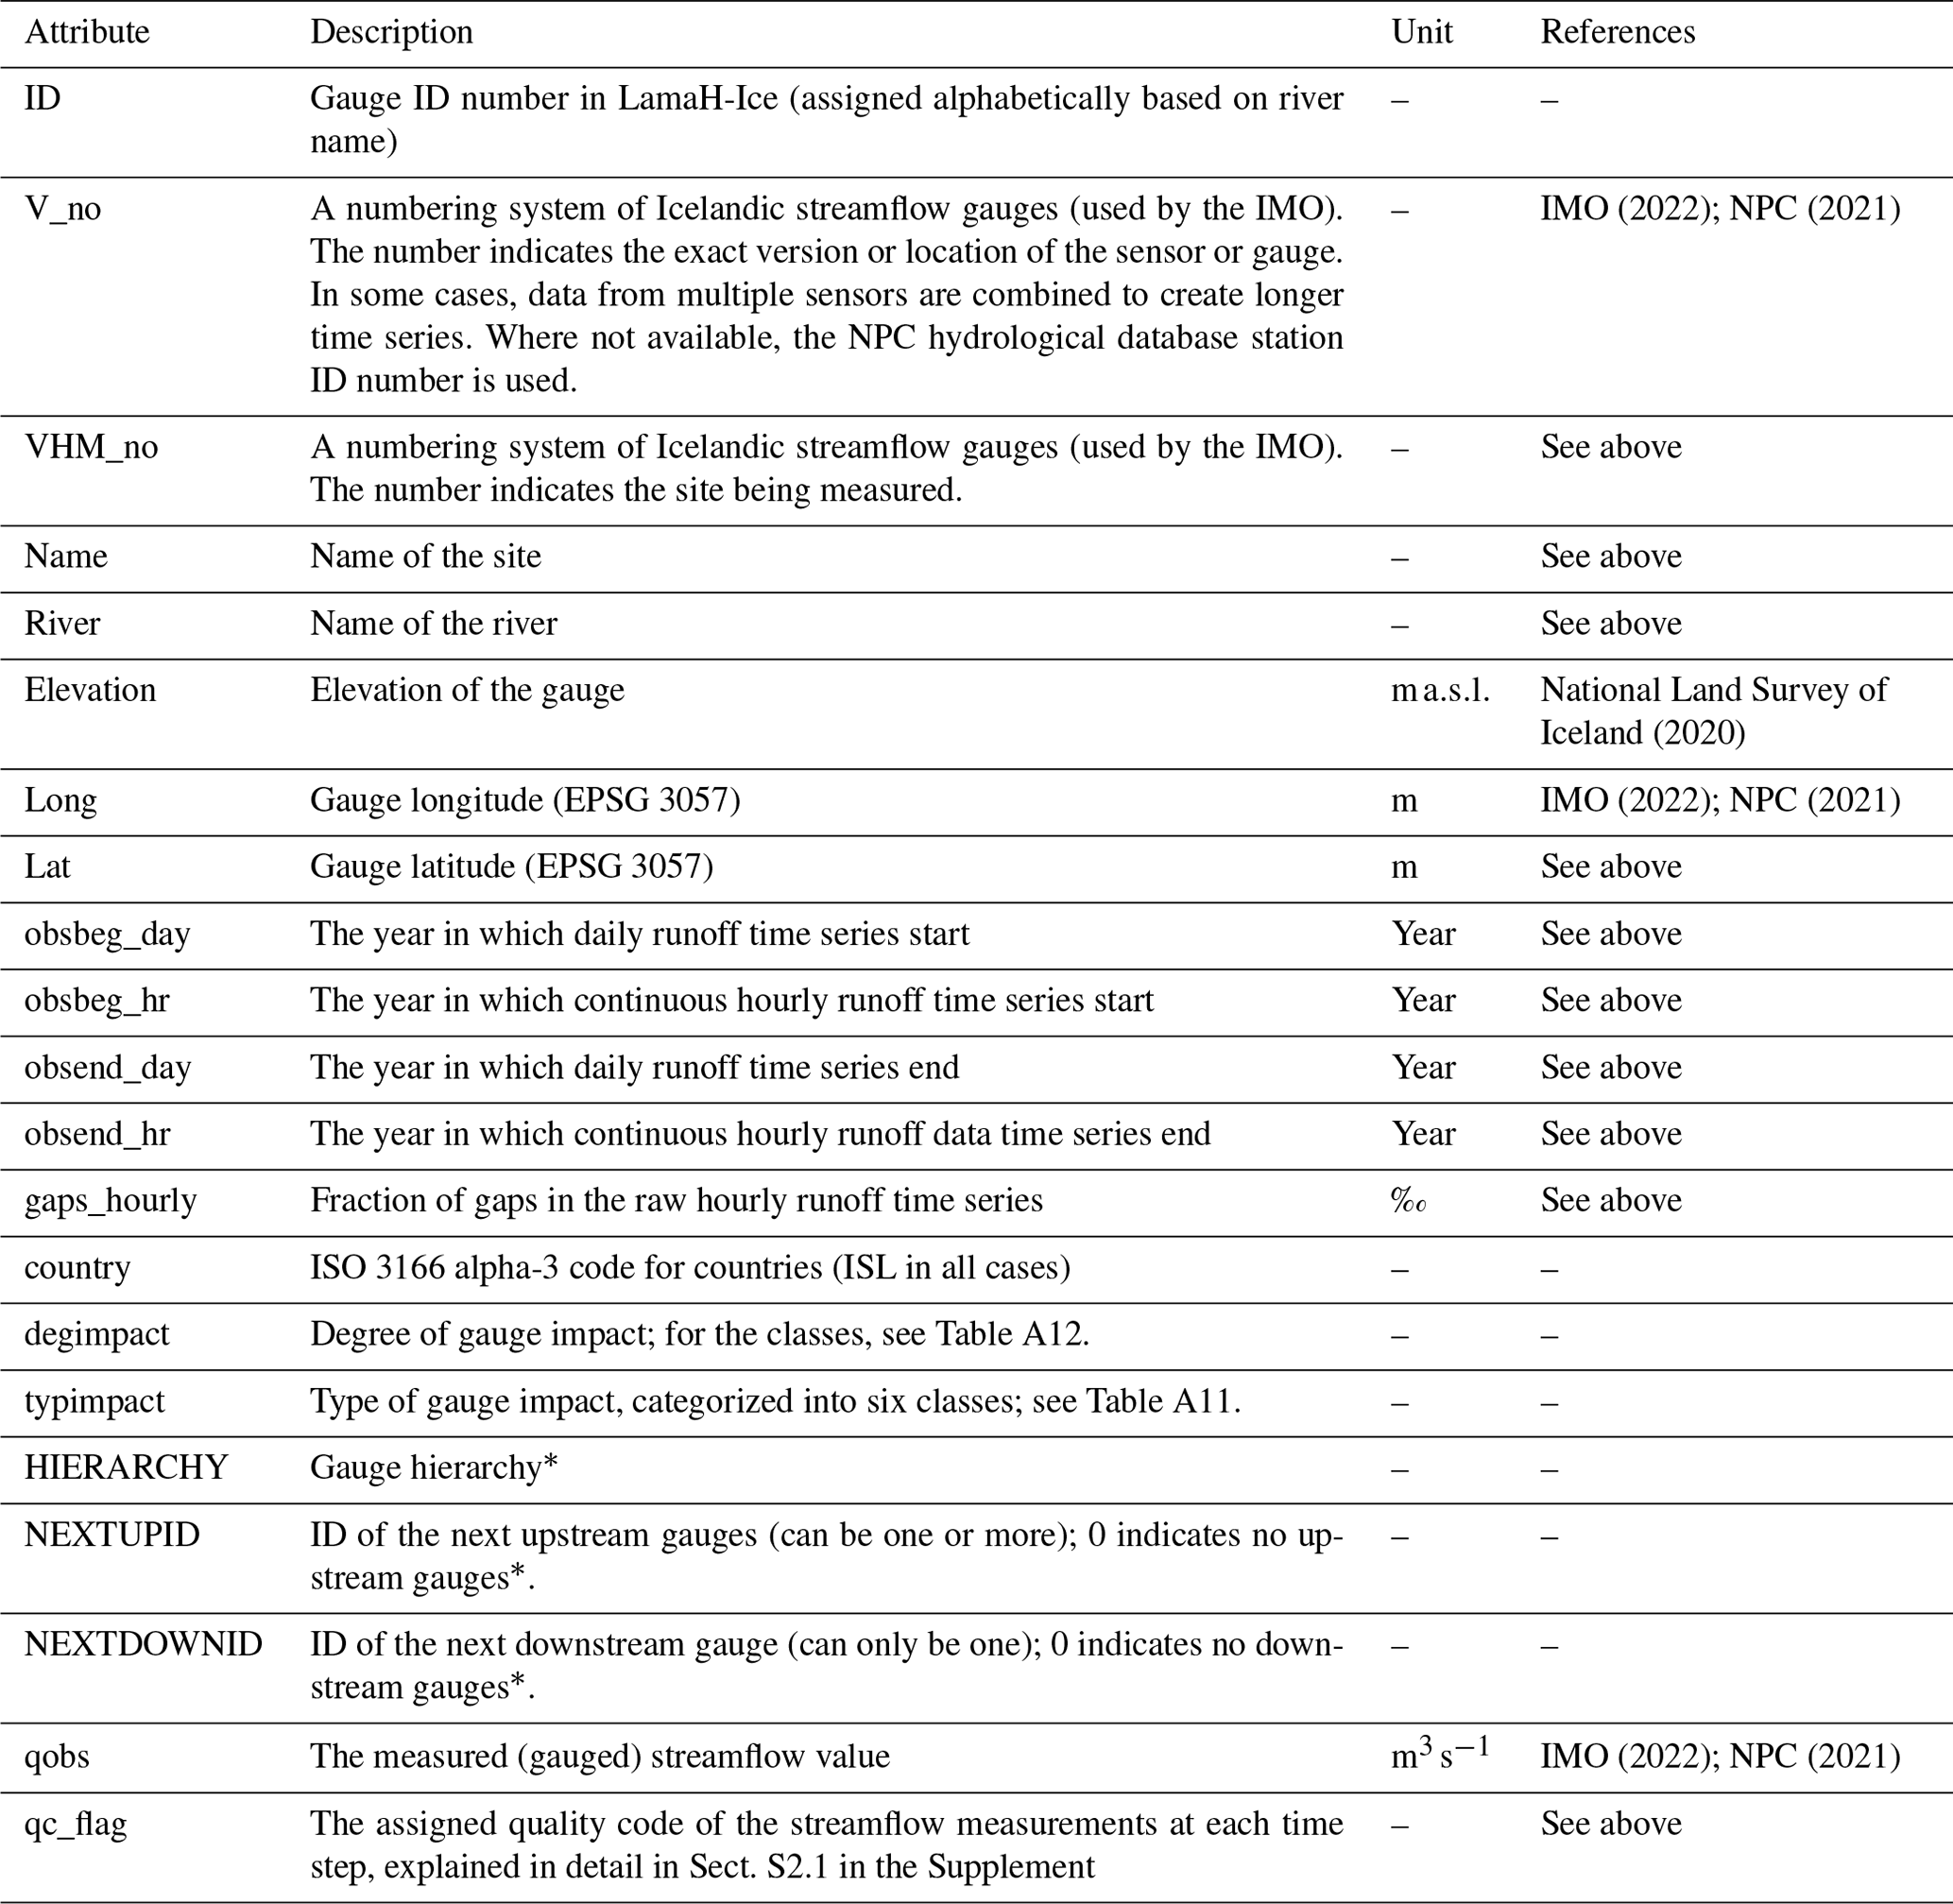
∗ Only for basin delineations B and C.
Table A2Meteorological variables from ERA5-Land, RAV-II, and CARRA reanalyses (adapted from Klingler et al., 2021).
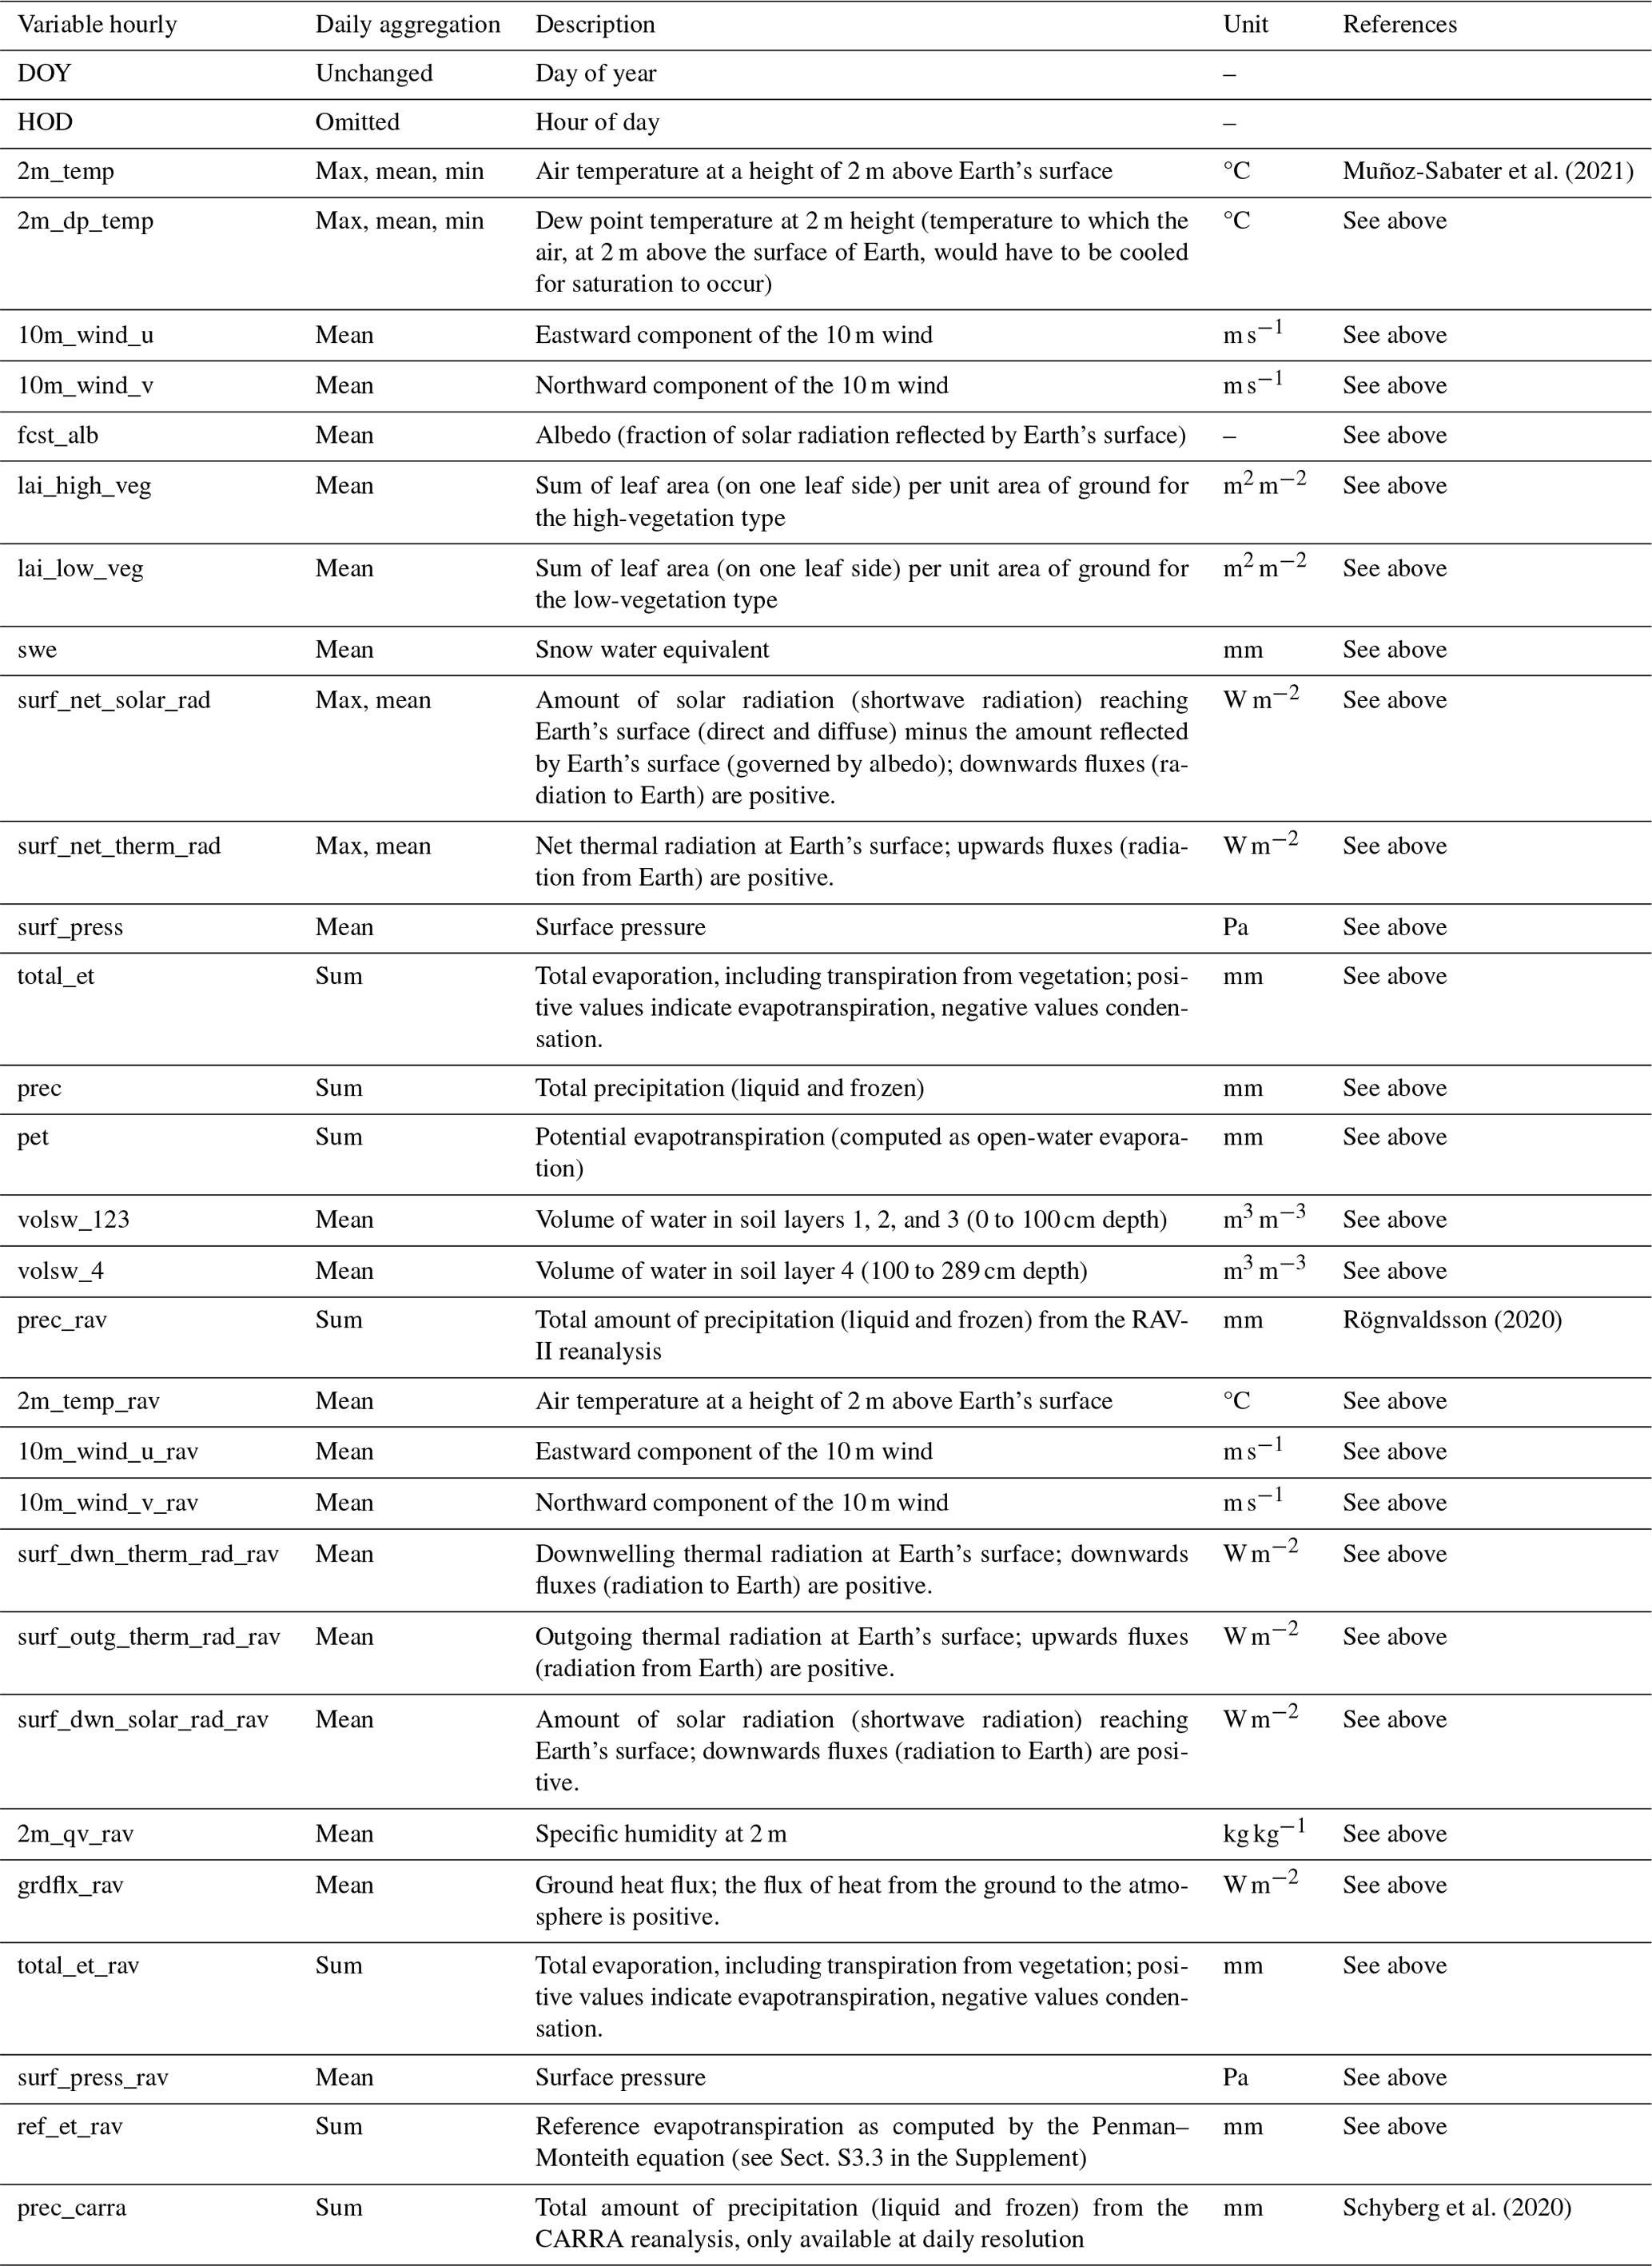
Table A3Topographical attributes (adapted from Klingler et al., 2021).
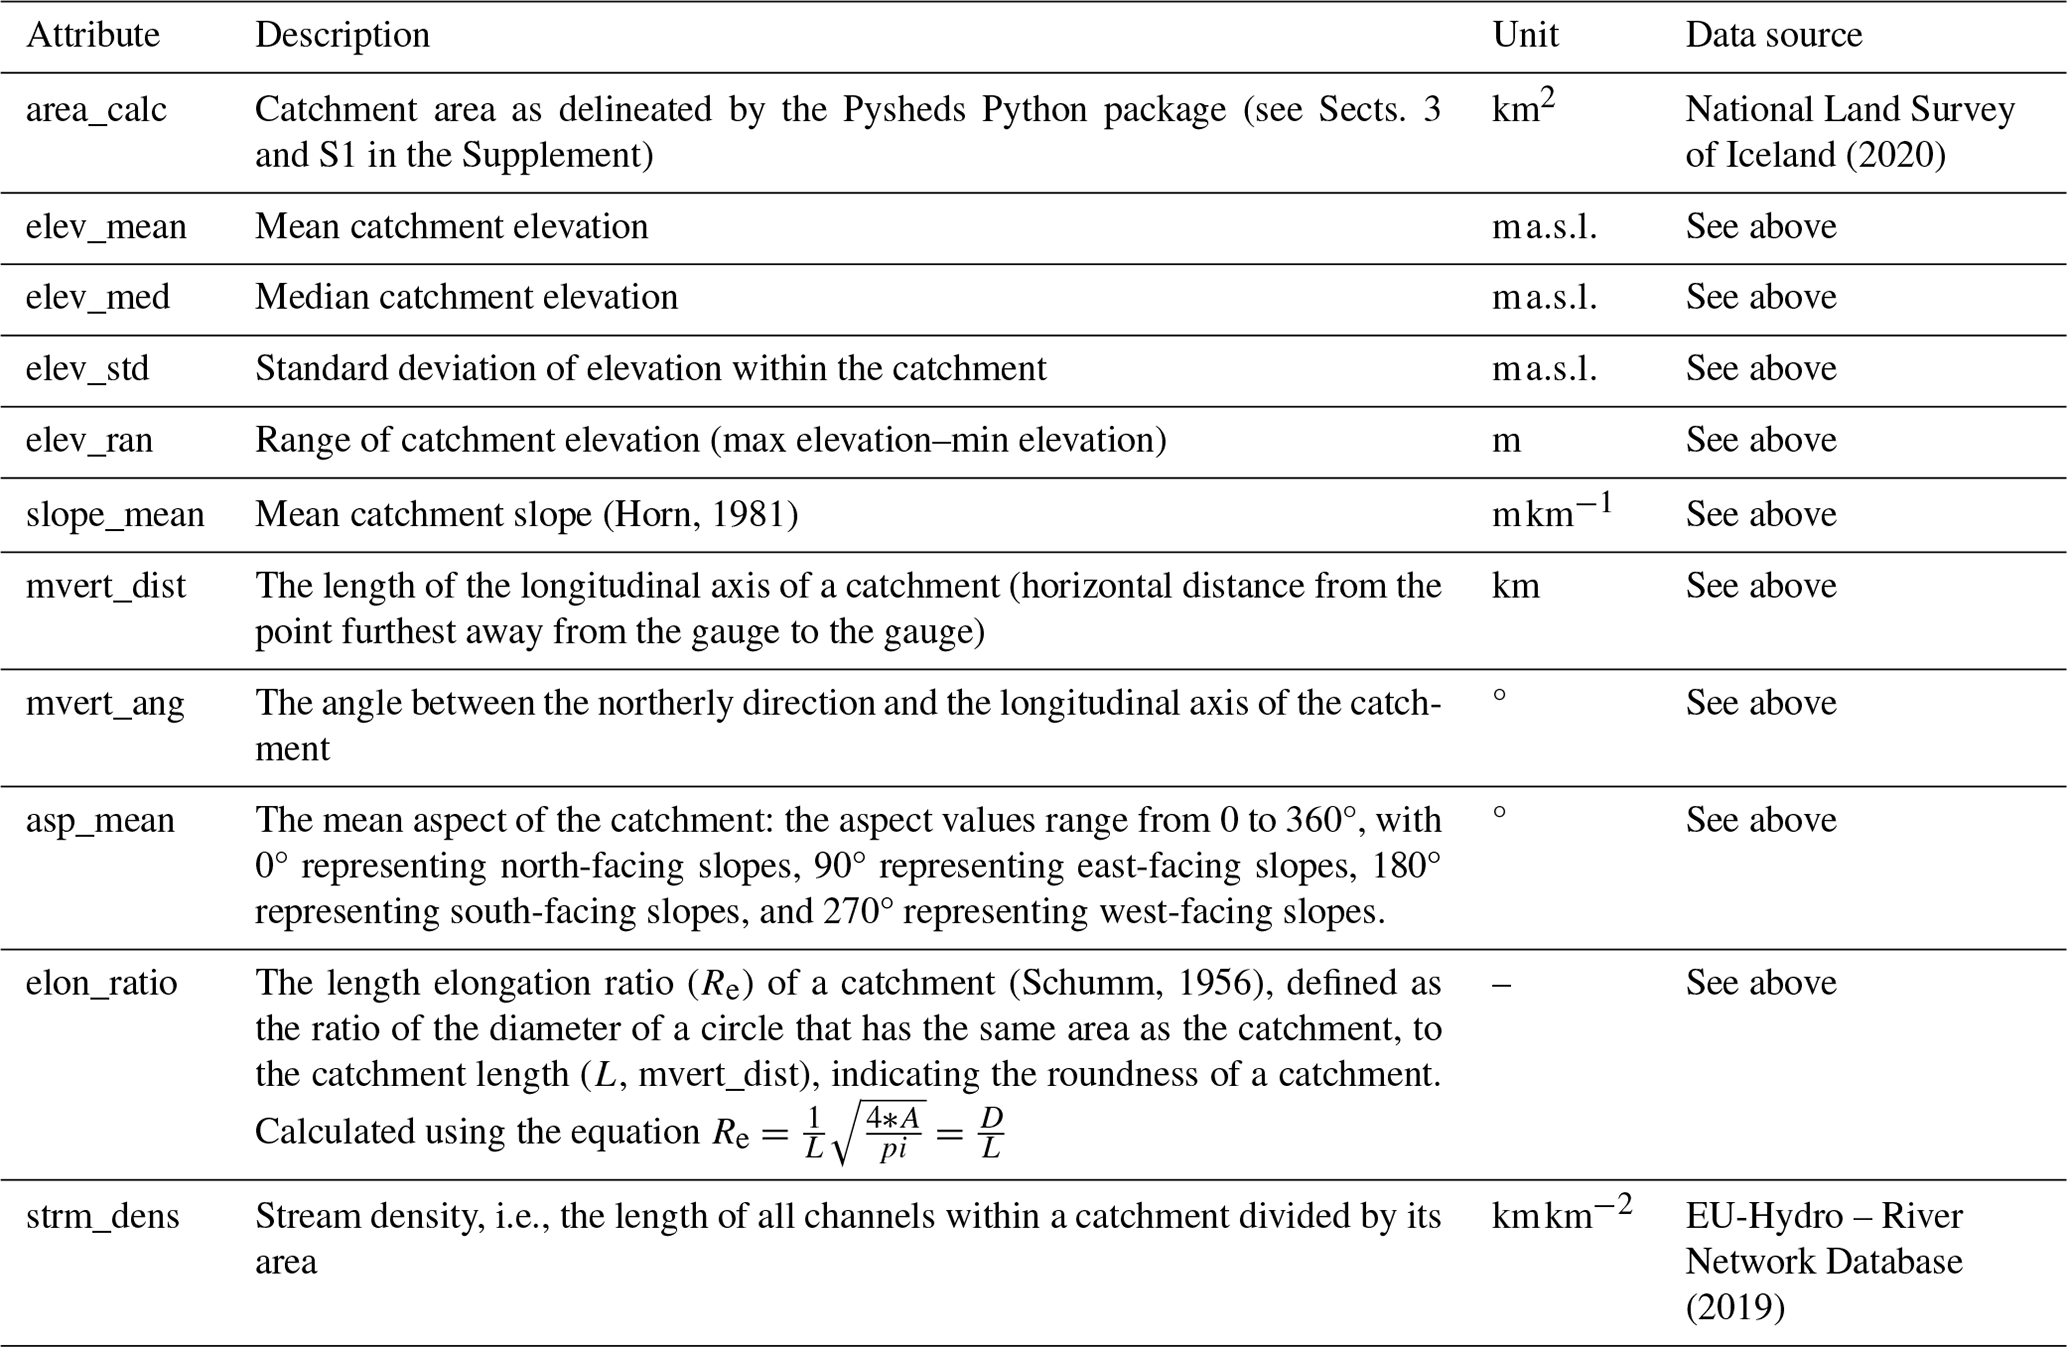
Table A4Climatic indicesa, b (adapted from Klingler et al., 2021; Addor et al., 2017).
a The climate indices are calculated over the period 1 October 1989 to 30 September 2009 using meteorological data from the RAV-II reanalysis. b We also calculated these indices using time series from the ERA5-Land reanalysis. These indices are available in the catchment attributes file with an “_ERA5L” suffix. c List of abbreviations for seasons: djf – December–January–February, mam – March–April–May, jja – June–July–August, son – September–October–November.
Table A5Hydrological signatures∗ (Klingler et al., 2021; Addor et al., 2017).
∗ The signatures were calculated for the period between 1 October 1981 and 30 September 2018 using the filtered (high-quality) version of the streamflow measurements. Only hydrological years with at least 90 % temporal coverage during this period were considered. Gauges with less than 3 years of 90 % coverage were omitted. The total number of gauges included in the calculations is 74. The signatures are also made available for unfiltered streamflow measurements (97 gauges in total).
Table A6Land cover attributes (adapted from Klingler et al., 2021).
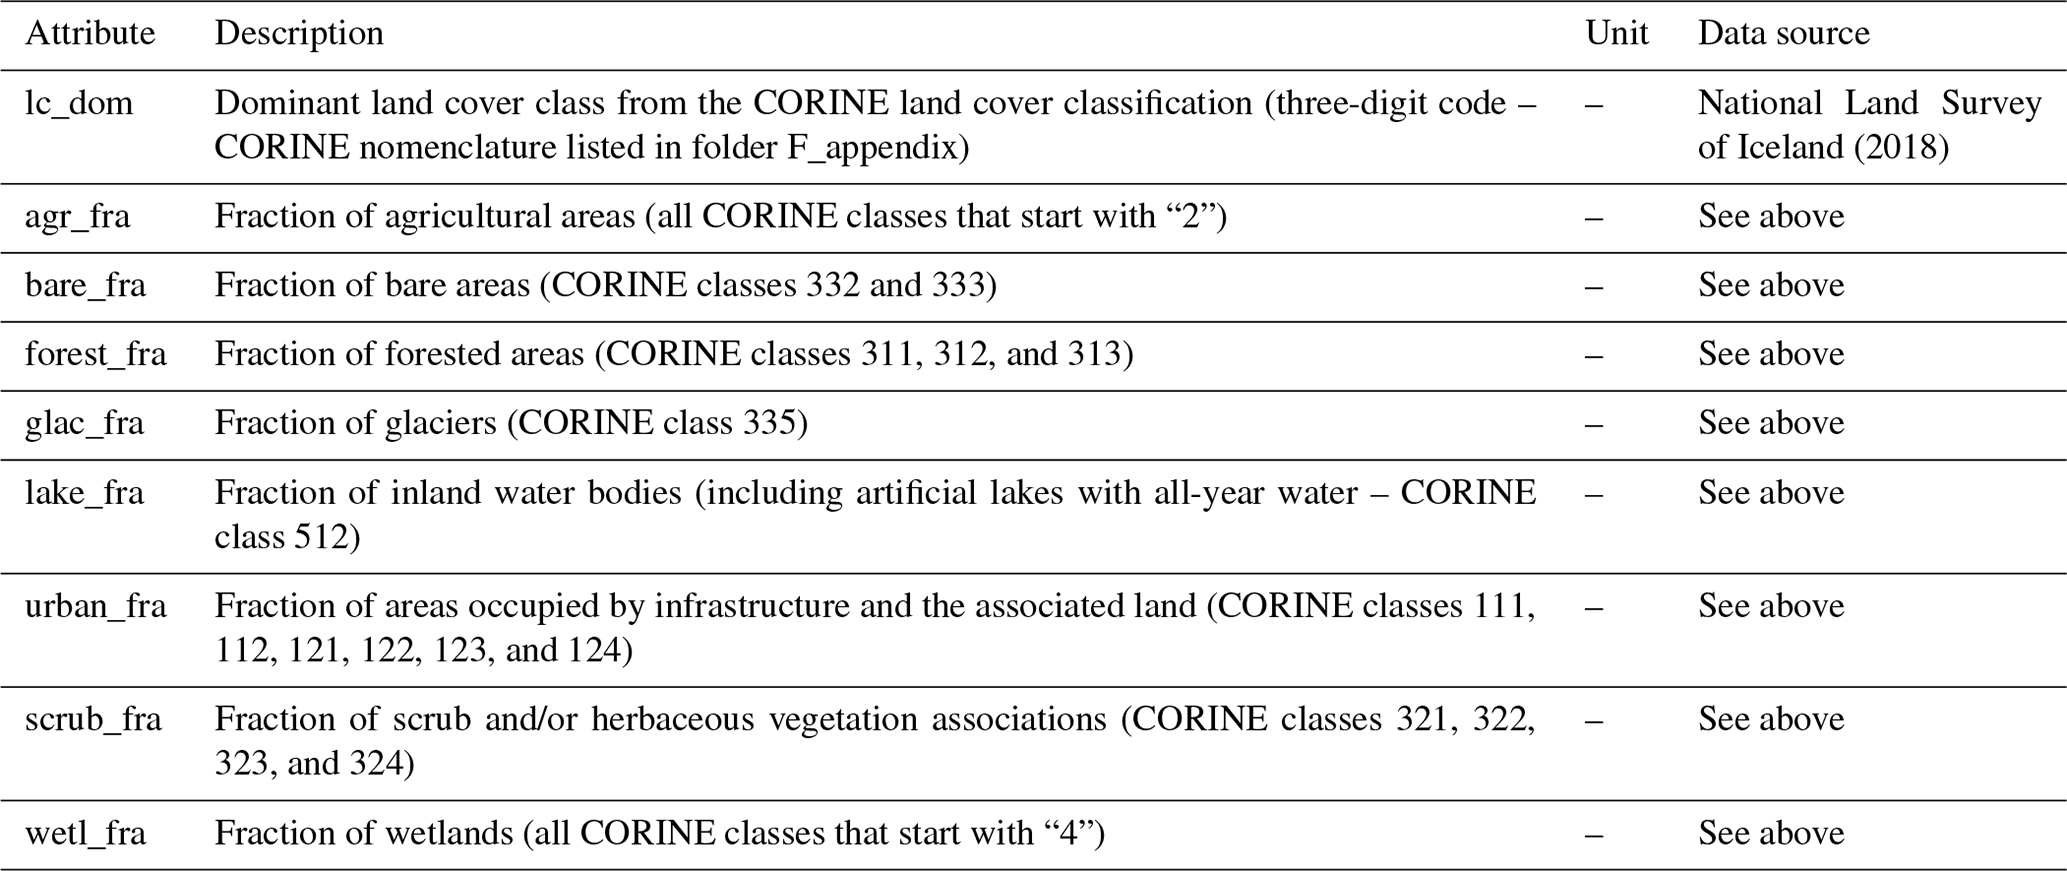
Table A7Vegetation indices∗ (unchanged from Klingler et al., 2021).
∗ Calculated by taking the mean of all raster cells whose centroids are located inside the watershed polygon.
Table A8Soil characteristics (adapted from Klingler et al., 2021).
a Areas marked as lakes or glaciers were excluded from the calculations. b Depth-weighted average, based on the topsoil (0–30 cm depth) and subsoil (30–150 cm) layers, using the depth available for roots as the maximum depth. c Calculated by taking the mean of all raster cells whose centroids are located inside the watershed polygon.
Table A9Geological attributes (adapted from Klingler et al., 2021).
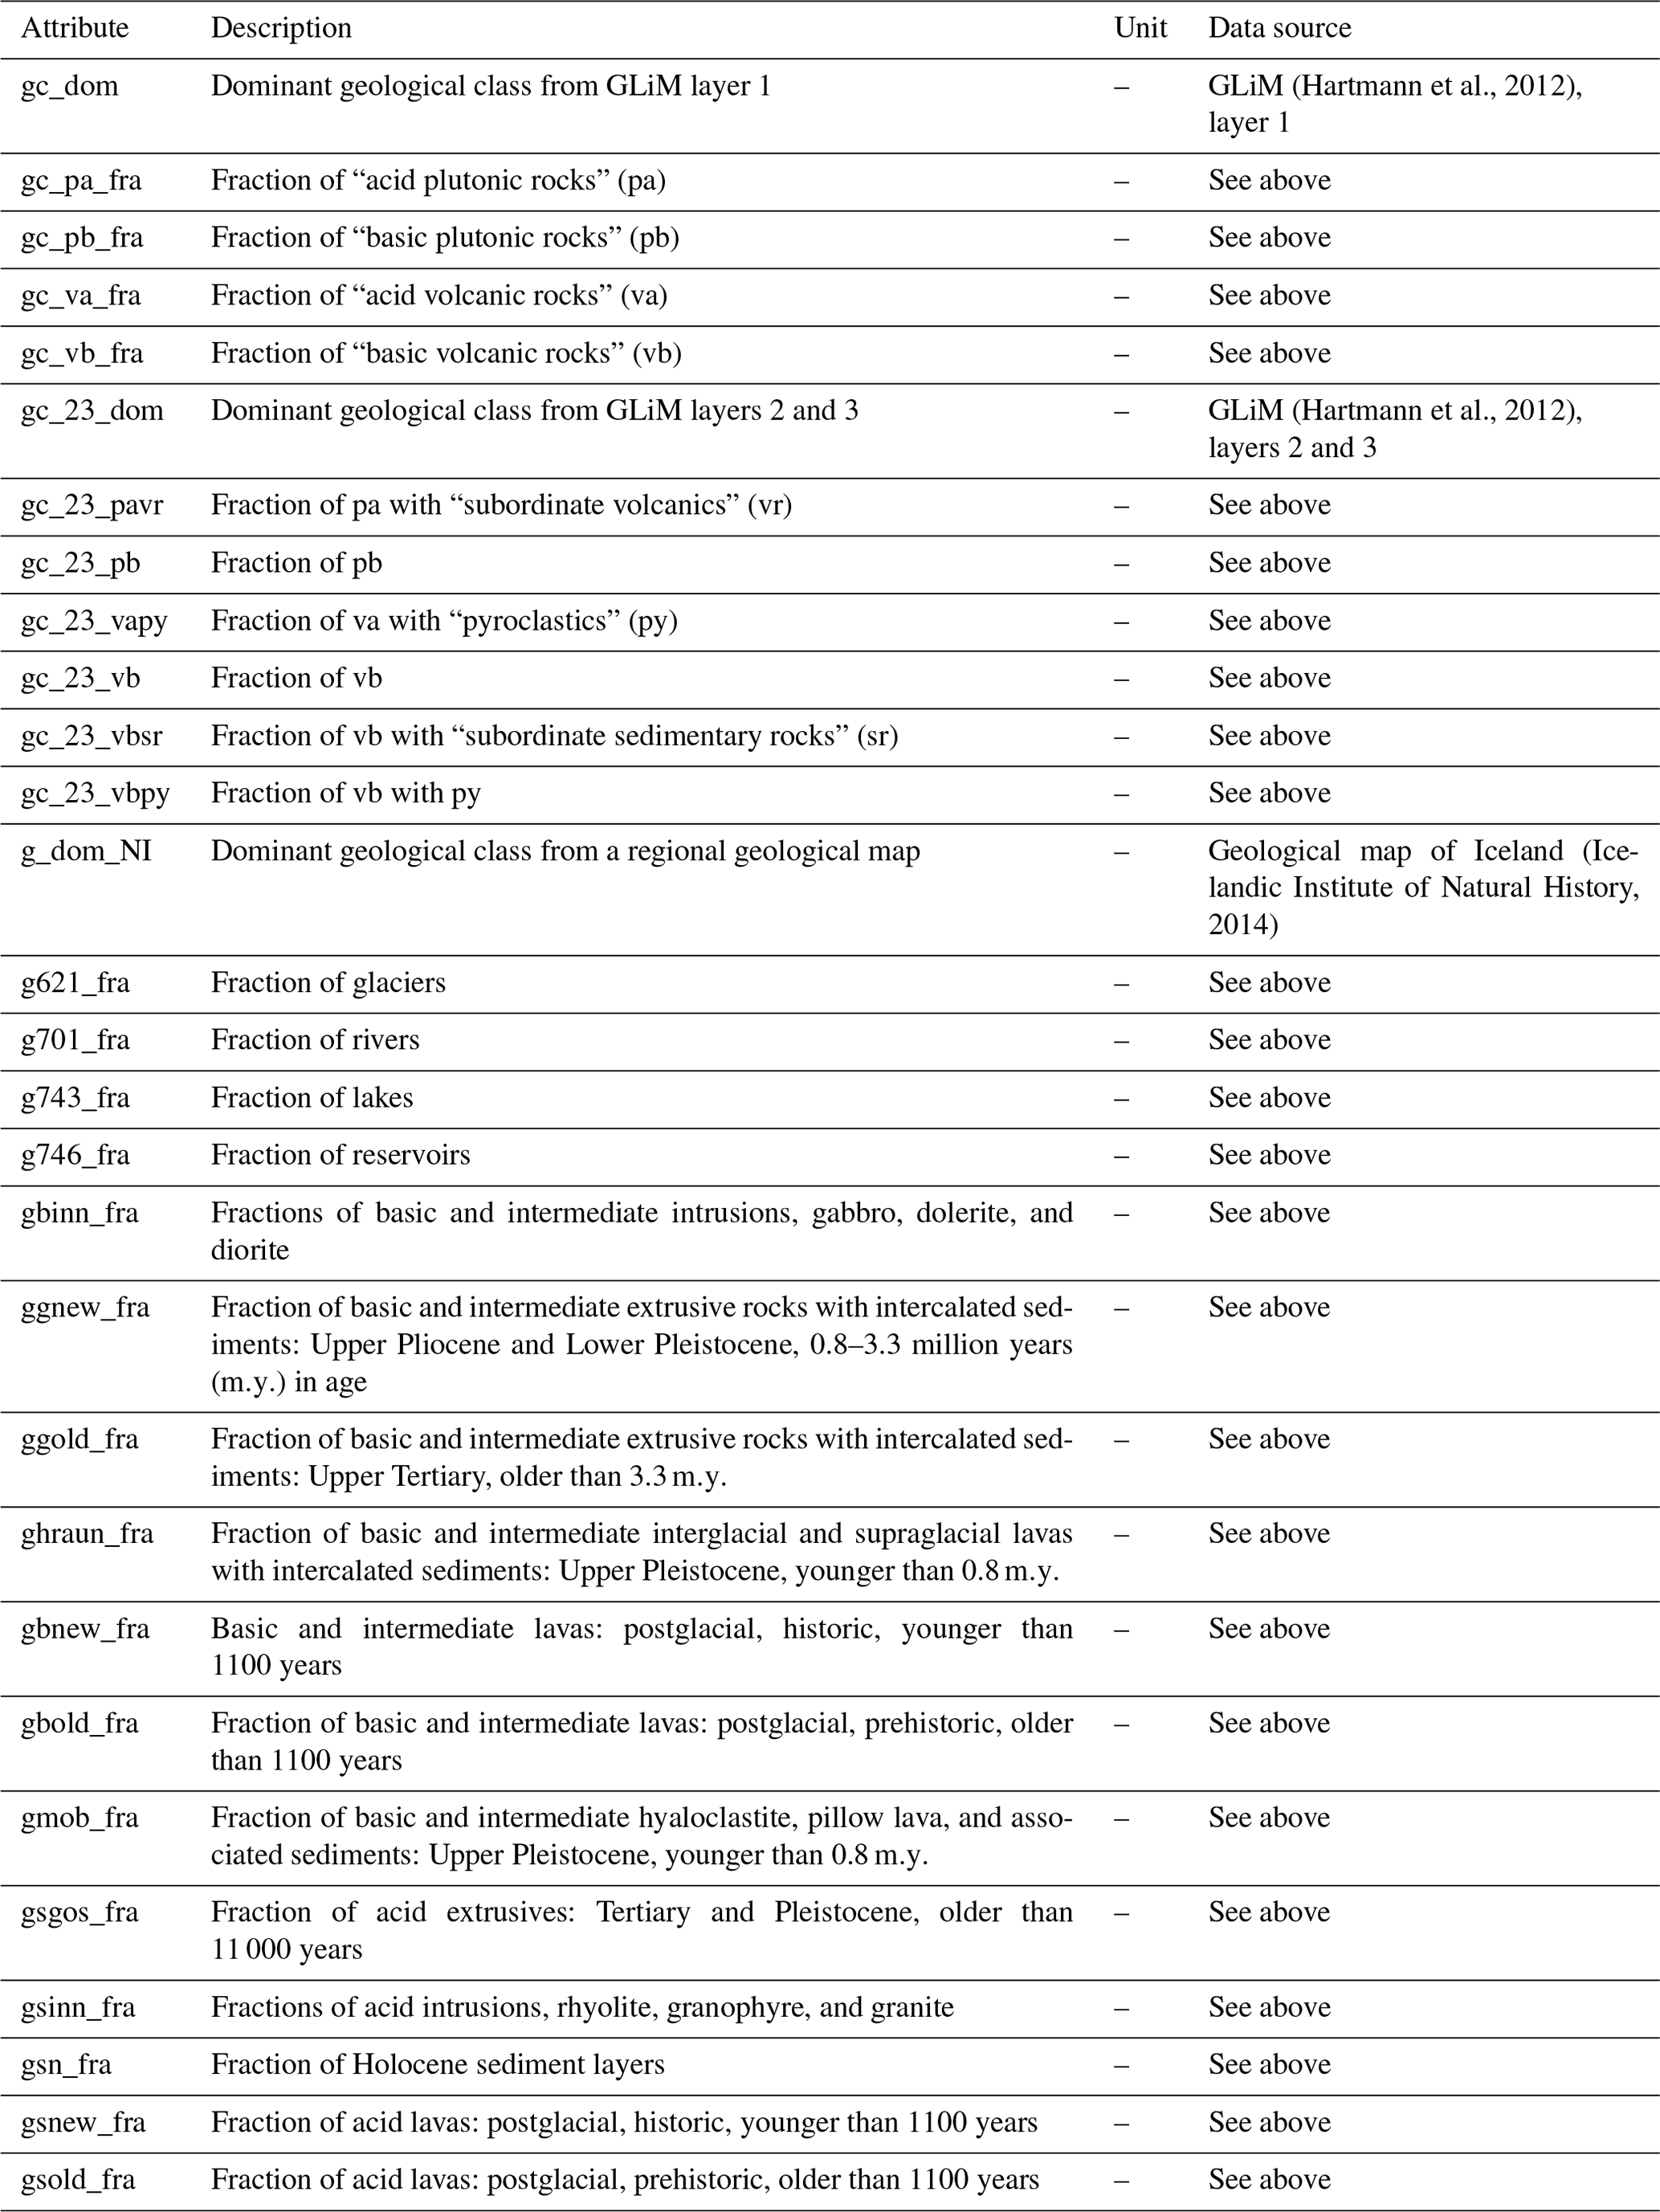
Table A10Glaciological attributes.
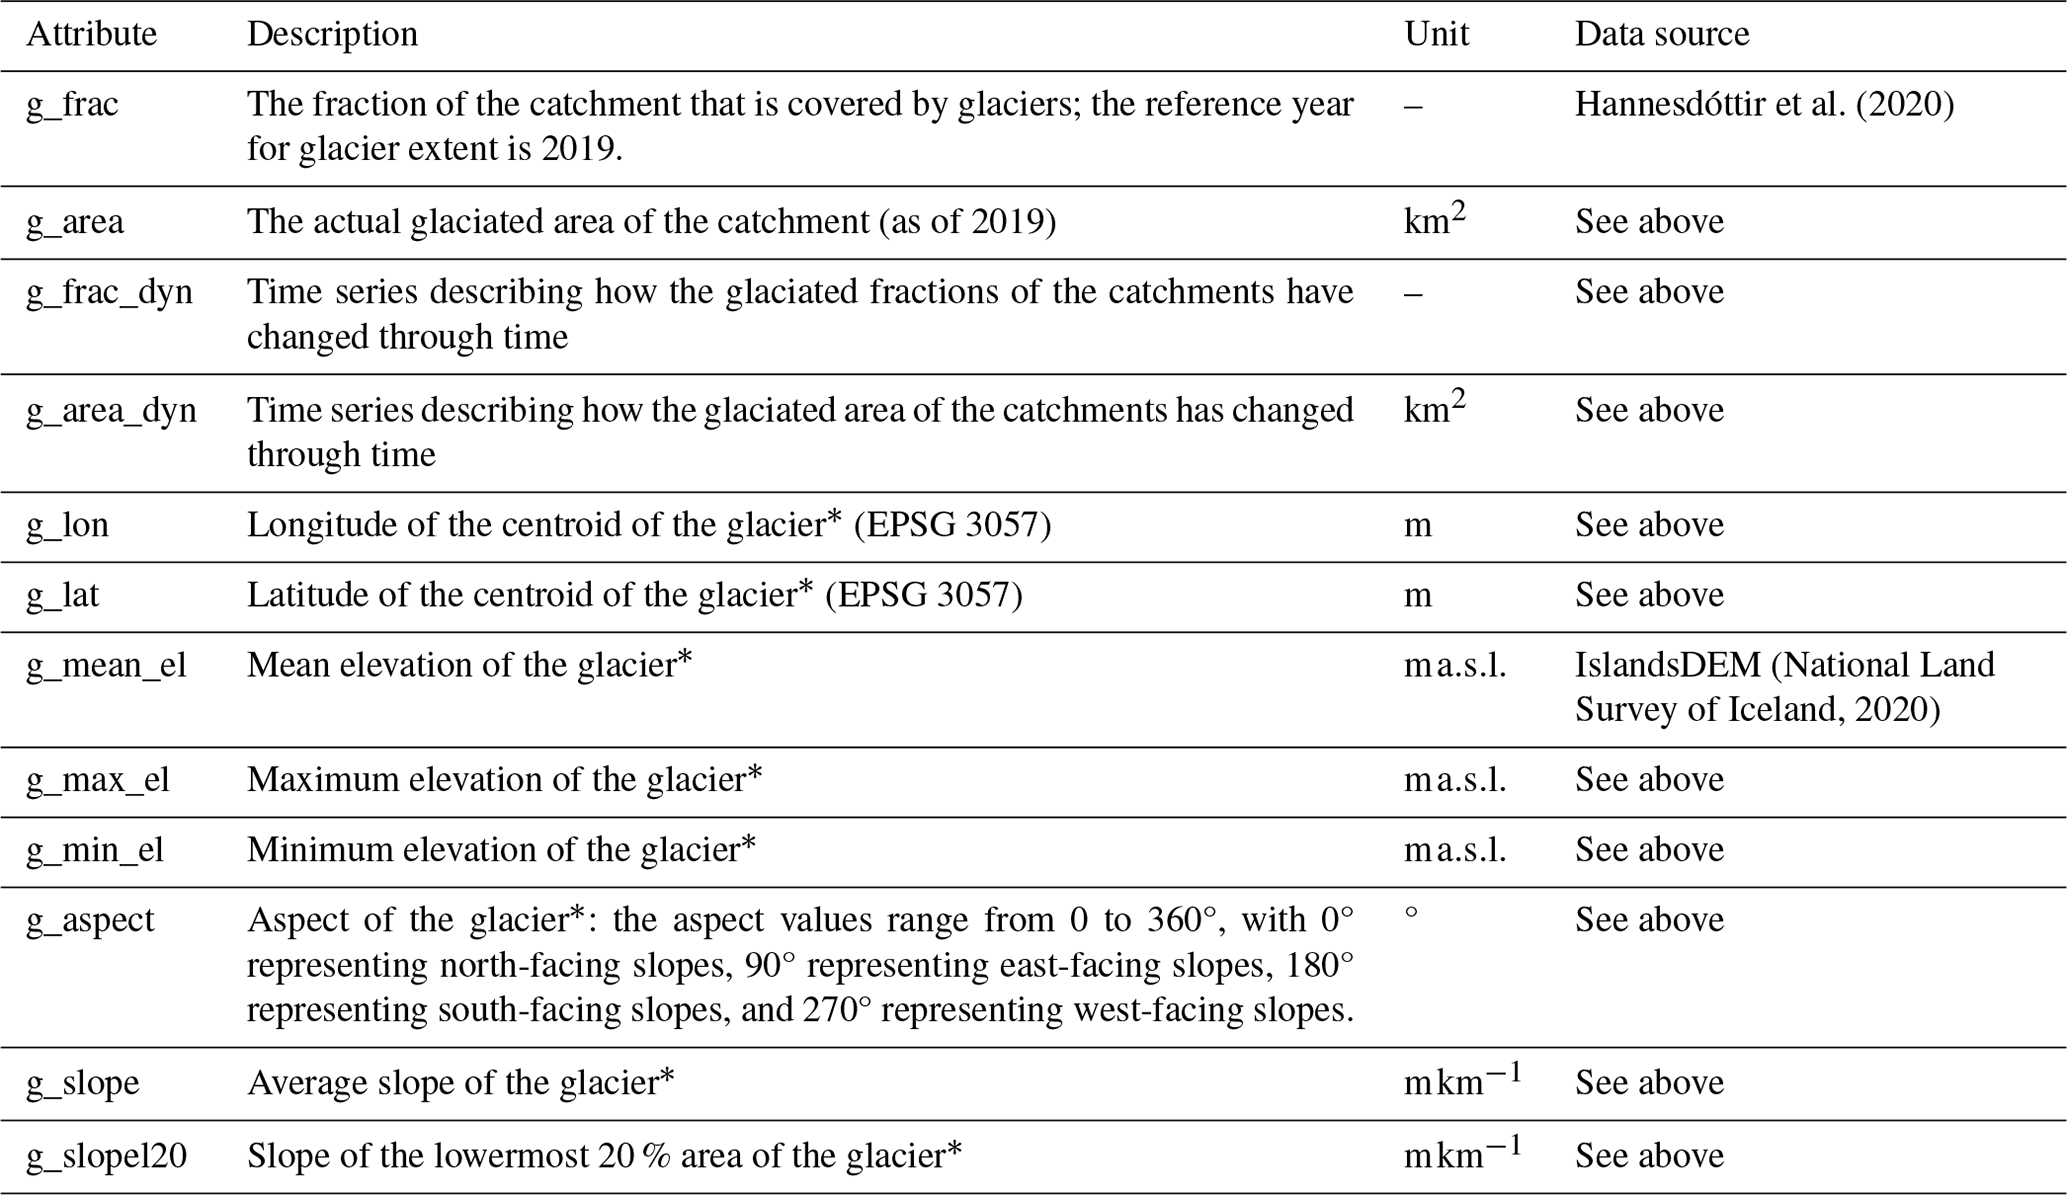
∗`The term “glacier” is used for the part of the catchment that is glacierized.
Table A11Attributes for natural or anthropogenic impacts on runoff (adapted from Klingler et al., 2021).
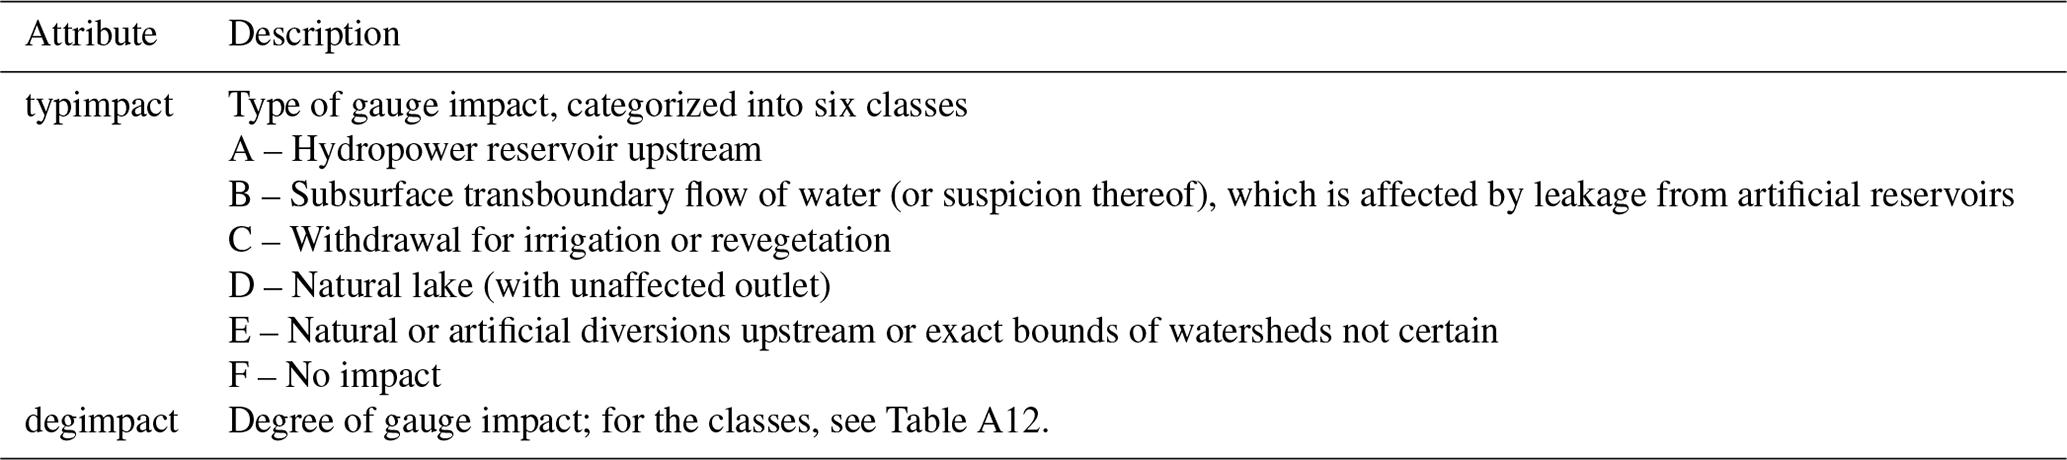
Table A12Criteria for the different degrees of gauge impact (adapted from Klingler et al., 2021).
The supplement related to this article is available online at: https://doi.org/10.5194/essd-16-2741-2024-supplement.
HBH and BN designed the study. HBH assembled the dataset, performed the analysis of the data, and prepared the manuscript. BN reviewed the results and the manuscript and provided consultations and contributions throughout the work.
The contact author has declared that none of the authors has any competing interests.
Publisher's note: Copernicus Publications remains neutral with regard to jurisdictional claims made in the text, published maps, institutional affiliations, or any other geographical representation in this paper. While Copernicus Publications makes every effort to include appropriate place names, the final responsibility lies with the authors.
The authors gratefully acknowledge the hydrological staff at the Icelandic Meteorological Office (IMO) for collecting and providing streamflow measurements from the IMO database, in particular Njáll Fannar Reynisson, Hilmar Björn Hróðmarsson, Kristjana G. Eyþórsdóttir, Gunnar Sigurðsson, and Óðinn Þórarinsson. The authors thank Egill Axelsson for providing helpful insights into the streamflow measurements database at Landsvirkjun. The authors would also like to thank all past and present hydrological surveyors in Iceland for their efforts in measuring streamflow under often difficult conditions. The authors thank the streamflow data owners for allowing the data to be published, including the Icelandic Meteorological Office, Landsvirkjun, the city of Reykjavík, Veitur Utilities, RARIK, the National Energy Authority of Iceland, Orkusalan, Reykjavík Energy, ON Power, HS Orka, and Suðurorka. The authors thank Christoph Klingler for sharing code and QGIS instructions to calculate catchment characteristics related to soils and vegetation. The authors thank Helgi Ó. Bragason, Óli G. B. Sveinsson, and Andri Gunnarsson for providing constructive feedback during review of the manuscript. Lastly, the authors wish to express their gratitude to Alexa Hinzman and an anonymous referee for their reviews and insightful comments, which significantly contributed to the improvements of the manuscript and the accompanying dataset. Special thanks are extended to Christoph Klingler, whose exceptionally detailed and helpful community comments enhanced the quality of our work even further.
This research has been supported by the Valle Scholarship and Scandinavian Exchange Program at the University of Washington (UW), the UW Herbold Fellowship, the Leifur Eiríksson Foundation Fellowship Program, the American Water Resources Association (Washington Section), and Landsvirkjun. This work was partially funded by the Future Rivers program at the University of Washington as part of an NSF National Research Traineeship award (DGE 1922004) and will be uploaded to the NSF's publication database.
This paper was edited by Andrea Popp and reviewed by Alexa Hinzman and one anonymous referee.
Abbas, A., Boithias, L., Pachepsky, Y., Kim, K., Chun, J. A., and Cho, K. H.: AI4Water v1.0: an open-source python package for modeling hydrological time series using data-driven methods, Geosci. Model Dev., 15, 3021–3039, https://doi.org/10.5194/gmd-15-3021-2022, 2022.
Aðalgeirsdóttir, G., Magnússon, E., Pálsson, F., Thorsteinsson, T., Belart, J. M. C., Jóhannesson, T., Hannesdóttir, H., Sigurðsson, O., Gunnarsson, A., Einarsson, B., Berthier, E., Schmidt, L. S., Haraldsson, H. H., and Björnsson, H.: Glacier Changes in Iceland From ∼ 1890 to 2019, Front. Earth Sci. (Lausanne), 8, 523646, https://doi.org/10.3389/feart.2020.523646, 2020.
Addor, N., Newman, A. J., Mizukami, N., and Clark, M. P.: The CAMELS data set: catchment attributes and meteorology for large-sample studies, Hydrol. Earth Syst. Sci., 21, 5293–5313, https://doi.org/10.5194/hess-21-5293-2017, 2017.
Addor, N., Do, H. X., Alvarez-Garreton, C., Coxon, G., Fowler, K., and Mendoza, P. A.: Large-sample hydrology: recent progress, guidelines for new datasets and grand challenges, Hydrolog. Sci. J., 65, 712–725, https://doi.org/10.1080/02626667.2019.1683182, 2020.
Allen, R. G., Pereira, L. S., Raes, D., and Smith, M.: Crop evapotranspiration – Guidelines for computing crop water requirements – FAO Irrigation and drainage paper no. 56, FAO, Rome, 1998.
Alvarez-Garreton, C., Mendoza, P. A., Boisier, J. P., Addor, N., Galleguillos, M., Zambrano-Bigiarini, M., Lara, A., Puelma, C., Cortes, G., Garreaud, R., McPhee, J., and Ayala, A.: The CAMELS-CL dataset: catchment attributes and meteorology for large sample studies – Chile dataset, Hydrol. Earth Syst. Sci., 22, 5817–5846, https://doi.org/10.5194/hess-22-5817-2018, 2018.
Arnalds, Ó. and Óskarsson, H.: Íslenskt Jarðvegskort/A soil map for Iceland, Náttúrufræðingurinn, 78, 107–121, 2009.
Árnason, K. and Matthíasson, I.: CORINE-landflokkun 2018 – Landgerðarbreytingar á Íslandi 2012-2018 (English: CORINE land cover classification 2018 – Land cover changes in Iceland 2012-2018), Technical report, National Land Survey of Iceland, Reykjavík, 2020.
Barnett, T. P., Adam, J. C., and Lettenmaier, D. P.: Potential impacts of a warming climate on water availability in snow-dominated regions, Nature, 438, 303–309, https://doi.org/10.1038/nature04141, 2005.
Bartos, M., Debbout, R., and Huard, D.: Pysheds, Zenodo [code], https://doi.org/10.5281/ZENODO.3822495, 2020.
Björnsson, H. and Pálsson, F.: Icelandic glaciers, Jökull, 58, 365–386, 2008.
Bolibar, J., Rabatel, A., Gouttevin, I., Galiez, C., Condom, T., and Sauquet, E.: Deep learning applied to glacier evolution modelling, The Cryosphere, 14, 565–584, https://doi.org/10.5194/tc-14-565-2020, 2020.
Brown, M. E., Racoviteanu, A. E., Tarboton, D. G., Sen Gupta, A., Nigro, J., Policelli, F., Habib, S., Tokay, M., Shrestha, M. S., Bajracharya, S., Hummel, P., Gray, M., Duda, P., Zaitchik, B., Mahat, V., Artan, G., and Tokar, S.: An integrated modeling system for estimating glacier and snow melt driven streamflow from remote sensing and earth system data products in the Himalayas, J. Hydrol. (Amst), 519, 1859–1869, https://doi.org/10.1016/j.jhydrol.2014.09.050, 2014.
Büttner, G.: CORINE land cover and land cover change products, Remote Sensing and Digital Image Processing, 18, 55–74, https://doi.org/10.1007/978-94-007-7969-3_5, 2014.
Chagas, V. B. P., Chaffe, P. L. B., Addor, N., Fan, F. M., Fleischmann, A. S., Paiva, R. C. D., and Siqueira, V. A.: CAMELS-BR: hydrometeorological time series and landscape attributes for 897 catchments in Brazil, Earth Syst. Sci. Data, 12, 2075–2096, https://doi.org/10.5194/essd-12-2075-2020, 2020.
Clausen, B. and Biggs, B. J. F.: Flow variables for ecological studies in temperate streams: groupings based on covariance, J. Hydrol. (Amst), 237, 184–197, https://doi.org/10.1016/S0022-1694(00)00306-1, 2000.
Coxon, G., Addor, N., Bloomfield, J. P., Freer, J., Fry, M., Hannaford, J., Howden, N. J. K., Lane, R., Lewis, M., Robinson, E. L., Wagener, T., and Woods, R.: CAMELS-GB: hydrometeorological time series and landscape attributes for 671 catchments in Great Britain, Earth Syst. Sci. Data, 12, 2459–2483, https://doi.org/10.5194/essd-12-2459-2020, 2020.
ECMWF: ERA5-Land: data documentation – Copernicus Knowledge Base – ECMWF Confluence Wiki, https://confluence.ecmwf.int/display/CKB/ERA5-Land%3A+data+documentation (last access: 31 January 2024), 2024.
Efrat, M.: Caravan extension Israel – Israel dataset for large-sample hydrology, Zenodo [data set], https://doi.org/10.5281/zenodo.7758516, 2023.
Einarsson, M.: Climate of Iceland, in: Climates of the Oceans, edited by: van Loon, H., Elsevier, Amsterdam, 673–697, ISBN-10 0444413375, 1984.
EU-Hydro – River Network Database, V.1.2: European Environment Agency under the framework of the Copernicus program, https://land.copernicus.eu/imagery-in-situ/eu-hydro/eu-hydro-river-network-database (last access: 30 June 2022), 2019.
Eurostat: The statistical office of the European Union: Population density, Online data code: TPS00003, https://ec.europa.eu/eurostat/databrowser/view/tps00003/default/table?lang=en (last access: 5 March 2023), 2023.
Fowler, K. J. A., Acharya, S. C., Addor, N., Chou, C., and Peel, M. C.: CAMELS-AUS: hydrometeorological time series and landscape attributes for 222 catchments in Australia, Earth Syst. Sci. Data, 13, 3847–3867, https://doi.org/10.5194/essd-13-3847-2021, 2021.
Friedl, M. and Sulla-Menashe, D.: MCD12Q1 MODIS/Terra+Aqua Land Cover Type Yearly L3 Global 500m SIN Grid V006, NASA EOSDIS Land Processes Distributed Active Archive Center [data set], https://doi.org/10.5067/MODIS/MCD12Q1.006, 2019.
Gauch, M., Mai, J., and Lin, J.: The proper care and feeding of CAMELS: How limited training data affects streamflow prediction, Environ. Model. Softw., 135, 104926, https://doi.org/10.1016/J.ENVSOFT.2020.104926, 2021.
Gíslason, S. R.: Weathering in Iceland, Jökull, 58, 387–408, 2008.
Google Maps: Google Maps Satellite imagery accessed through GDAL Web Map Service (WMS) in QGIS, Configuration specified via XML, http://mt.google.com/vt/lyrs=s&x=x&y=y&z=z (last access: 15 March 2024), 2024.
Gorelick, N., Hancher, M., Dixon, M., Ilyushchenko, S., Thau, D., and Moore, R.: Google Earth Engine: Planetary-scale geospatial analysis for everyone, Remote Sens. Environ., 202, 18–27, https://doi.org/10.1016/j.rse.2017.06.031, 2017.
Gunnarsson, A., Garðarsson, S. M., and Sveinsson, Ó. G. B.: Icelandic snow cover characteristics derived from a gap-filled MODIS daily snow cover product, Hydrol. Earth Syst. Sci., 23, 3021–3036, https://doi.org/10.5194/hess-23-3021-2019, 2019.
Gunnarsson, A., Gardarsson, S. M., Pálsson, F., Jóhannesson, T., and Sveinsson, Ó. G. B.: Annual and inter-annual variability and trends of albedo of Icelandic glaciers, The Cryosphere, 15, 547–570, https://doi.org/10.5194/tc-15-547-2021, 2021.
Gupta, H. V., Perrin, C., Blöschl, G., Montanari, A., Kumar, R., Clark, M., and Andréassian, V.: Large-sample hydrology: a need to balance depth with breadth, Hydrol. Earth Syst. Sci., 18, 463–477, https://doi.org/10.5194/hess-18-463-2014, 2014.
Hannah, D. M., Demuth, S., van Lanen, H. A. J., Looser, U., Prudhomme, C., Rees, G., Stahl, K., and Tallaksen, L. M.: Large-scale river flow archives: importance, current status and future needs, Hydrol. Process., 25, 1191–1200, https://doi.org/10.1002/HYP.7794, 2011.
Hannesdóttir, H., Sigurðsson, O., Þrastarson, R. H., Guðmundsson, S., Belart, J. M. C., Pálsson, F., Magnússon, E., Víkingsson, S., Kaldal, I., and Jóhannesson, T.: A national glacier inventory and variations in glacier extent in Iceland from the Little Ice Age maximum to 2019, Jökull, 70, 1–34, https://doi.org/10.33799/jokull2020.70.001, 2020.
Hartmann, J., Moosdorf, N., Hartmann, J., and Moosdorf, N.: The new global lithological map database GLiM: A representation of rock properties at the Earth surface, Geochem. Geophy. Geosy., 13, 12004, https://doi.org/10.1029/2012GC004370, 2012.
Helgason, H. B. and Nijssen, B.: LamaH-Ice: LArge-SaMple Data for Hydrology and Environmental Sciences for Iceland, HydroShare [data set], https://doi.org/10.4211/hs.86117a5f36cc4b7c90a5d54e18161c91 , 2024.
Helland, A.: Om Jakelelverne og deres Slamgehalt, Arkiv for Matematik og Naturvidenskab, VII, 213–232, 1882.
Hiederer, R.: Mapping Soil Properties for Europe – Spatial Representation of Soil Database Attributes, Luxembourg, https://doi.org/10.2788/94128, 2013a.
Hiederer, R.: Mapping Soil Typologies – Spatial Decision Support Applied to the European Soil Database, Luxembourg, https://doi.org/10.2788/87286, 2013b.
Hijmans, R.: Boundary, Iceland [Shapefile], University of California, Berkeley, Museum of Vertebrate Zoology, https://earthworks.stanford.edu/catalog/stanford-xz811fy7881 (last access: 9 September 2022), 2015.
Höge, M., Kauzlaric, M., Siber, R., Schönenberger, U., Horton, P., Schwanbeck, J., Floriancic, M. G., Viviroli, D., Wilhelm, S., Sikorska-Senoner, A. E., Addor, N., Brunner, M., Pool, S., Zappa, M., and Fenicia, F.: CAMELS-CH: hydro-meteorological time series and landscape attributes for 331 catchments in hydrologic Switzerland, Earth Syst. Sci. Data, 15, 5755–5784, https://doi.org/10.5194/essd-15-5755-2023, 2023.
Horn, B. K. P.: Hill Shading and the Reflectance Map, P. IEEE, 69, 14–47, https://doi.org/10.1109/PROC.1981.11918, 1981.
Hrachowitz, M., Savenije, H. H. G., Blöschl, G., McDonnell, J. J., Sivapalan, M., Pomeroy, J. W., Arheimer, B., Blume, T., Clark, M. P., Ehret, U., Fenicia, F., Freer, J. E., Gelfan, A., Gupta, H. v., Hughes, D. A., Hut, R. W., Montanari, A., Pande, S., Tetzlaff, D., Troch, P. A., Uhlenbrook, S., Wagener, T., Winsemius, H. C., Woods, R. A., Zehe, E., and Cudennec, C.: A decade of Predictions in Ungauged Basins (PUB)–a review, Hydrolog. Sci. J., 58, 1198–1255, https://doi.org/10.1080/02626667.2013.803183, 2013.
Icelandic Institute of Natural History: Geological map of Iceland, https://gatt.lmi.is/geonetwork/srv/eng/catalog.search#/metadata/%7B005FFDAD-69A1-4385-B16F-FD31B960FE33%7D (last access: 30 June 2022), 2014.
Immerzeel, W. W., Lutz, A. F., Andrade, M., Bahl, A., Biemans, H., Bolch, T., Hyde, S., Brumby, S., Davies, B. J., Elmore, A. C., Emmer, A., Feng, M., Fernández, A., Haritashya, U., Kargel, J. S., Koppes, M., Kraaijenbrink, P. D. A., Kulkarni, A. V., Mayewski, P. A., Nepal, S., Pacheco, P., Painter, T. H., Pellicciotti, F., Rajaram, H., Rupper, S., Sinisalo, A., Shrestha, A. B., Viviroli, D., Wada, Y., Xiao, C., Yao, T., and Baillie, J. E. M.: Importance and vulnerability of the world's water towers, Nature, 577, 364–369, https://doi.org/10.1038/S41586-019-1822-Y, 2020.
IMO: Streamflow measurements (Data received 10.01.2022), Icelandic Meteorological Office, 2022.
Jónsdóttir, J. F. and Uvo, C. B.: Long-term variability in precipitation and streamflow in Iceland and relations to atmospheric circulation, Int. J. Climatol., 29, 1369–1380, https://doi.org/10.1002/JOC.1781, 2009.
Klingler, C., Schulz, K., and Herrnegger, M.: LamaH-CE: LArge-SaMple DAta for Hydrology and Environmental Sciences for Central Europe, Earth Syst. Sci. Data, 13, 4529–4565, https://doi.org/10.5194/essd-13-4529-2021, 2021.
Koch, J.: Caravan extension Denmark – Danish dataset for large-sample hydrology, Zenodo [data set], https://doi.org/10.5281/zenodo.7962379, 2022.
Kovács, G.: Proposal to construct a coordinating matrix for comparative hydrology, Hydrolog. Sci. J., 29, 435–443, https://doi.org/10.1080/02626668409490961, 1984.
Kratzert, F., Klotz, D., Shalev, G., Klambauer, G., Hochreiter, S., and Nearing, G.: Towards learning universal, regional, and local hydrological behaviors via machine learning applied to large-sample datasets, Hydrol. Earth Syst. Sci., 23, 5089–5110, https://doi.org/10.5194/hess-23-5089-2019, 2019.
Kratzert, F., Nearing, G., Addor, N., Erickson, T., Gauch, M., Gilon, O., Gudmundsson, L., Hassidim, A., Klotz, D., Nevo, S., Shalev, G., and Matias, Y.: Caravan – A global community dataset for large-sample hydrology, Scientific Data, 10, 1–11, https://doi.org/10.1038/s41597-023-01975-w, 2023.
Ladson, A. R., Brown, R., Neal, B., and Nathan, R.: A standard approach to baseflow separation using the Lyne and Hollick filter, Austr. J. Water Resour., 17, 25–34, 2013.
Merz, R., Blöschl, G., and Parajka, J.: Regionalization methods in rainfall-runoff modelling using large catchment samples, IAHS-AISH P., 307, 117–125, 2006.
Miles, E., McCarthy, M., Dehecq, A., Kneib, M., Fugger, S., and Pellicciotti, F.: Health and sustainability of glaciers in High Mountain Asia, Nat. Commun., 12, 1–10, https://doi.org/10.1038/s41467-021-23073-4, 2021.
Muñoz-Sabater, J.: ERA5-Land hourly data from 1950 to present, Copernicus Climate Change Service (C3S) Climate Data Store (CDS) [data set], https://doi.org/10.24381/cds.e2161bac, 2019.
Muñoz-Sabater, J., Dutra, E., Agustí-Panareda, A., Albergel, C., Arduini, G., Balsamo, G., Boussetta, S., Choulga, M., Harrigan, S., Hersbach, H., Martens, B., Miralles, D. G., Piles, M., Rodríguez-Fernández, N. J., Zsoter, E., Buontempo, C., and Thépaut, J.-N.: ERA5-Land: a state-of-the-art global reanalysis dataset for land applications, Earth Syst. Sci. Data, 13, 4349–4383, https://doi.org/10.5194/essd-13-4349-2021, 2021.
Myneni, R., Knyazikhin, Y., and Park, T.: MCD15A3H MODIS/Terra+Aqua Leaf Area Index/FPAR 4-day L4 Global 500m SIN Grid V006, NASA EOSDIS Land Processes DAAC [data set], https://doi.org/10.5067/MODIS/MCD15A3H.006, 2015.
National Land Survey of Iceland. CORINE Land Cover Iceland (2000, 2006, 2012 and 2018) [data set], https://www.lmi.is/is/landupplysingar/gagnagrunnar/nidurhal (last access: 25 August 2023), 2018.
National Land Survey of Iceland: IslandsDEM version 1.0, https://gatt.lmi.is/geonetwork/srv/eng/catalog.search#/metadata/e6712430-a63c-4ae5-9158-c89d16da6361 (last access: 2 June 2022), 2020.
National Research Council: Himalayan Glaciers: Climate Change, Water Resources, and Water Security, National Academies Press, Washington, DC, https://doi.org/10.17226/13449, 2012.
Newman, A. J., Clark, M. P., Sampson, K., Wood, A., Hay, L. E., Bock, A., Viger, R. J., Blodgett, D., Brekke, L., Arnold, J. R., Hopson, T., and Duan, Q.: Development of a large-sample watershed-scale hydrometeorological data set for the contiguous USA: data set characteristics and assessment of regional variability in hydrologic model performance, Hydrol. Earth Syst. Sci., 19, 209–223, https://doi.org/10.5194/hess-19-209-2015, 2015.
Niittynen, P., Heikkinen, R. K., and Luoto, M.: Snow cover is a neglected driver of Arctic biodiversity loss, Nat. Clim. Change, 8, 997–1001, https://doi.org/10.1038/s41558-018-0311-x, 2018.
NPC: Streamflow measurements (Data received 10.01.2021), National Power Company of Iceland, 2021.
Olden, J. D. and Poff, N. L.: Redundancy and the choice of hydrologic indices for characterizing streamflow regimes, River Res. Appl., 19, 101–121, https://doi.org/10.1002/RRA.700, 2003.
Pálsson, F., Gunnarsson, A., Steinþórsson, S., Eiríksson, K., and Sigurbjörnsdóttir, Þ. A.: Afkomu- og hraðamælingar á Langjökli jökulárið 2021–2022, Technical report, LV-2022-053, Landsvirkjun, Reykjavík, 2022.
Pálsson, F., Gunnarsson, A., Magnússon, E., Steinþórsson, S., Pálsson, H. S., Björnsson, A., and Helgadóttir, S.: Vatnajökull: Mass balance, meltwater drainage and surface velocity of the glacial year 2022–2023, Technical report, LV-2024-010, Landsvirkjun, Reykjavík, 2024.
Pelletier, J. D., Broxton, P. D., Hazenberg, P., Zeng, X., Troch, P. A., Niu, G., Williams, Z. C., Brunke, M. A., and Gochis, D.: Global 1-km Gridded Thickness of Soil, Regolith, and Sedimentary Deposit Layers, ORNL DAAC, Oak Ridge, Tennessee, USA, https://doi.org/10.3334/ORNLDAAC/1304, 2016.
Petersen, R. C., Gíslason, G. M., and Vought, L.: Rivers of the Nordic countries, in: River and stream ecosystems of the world, edited by: Cushing, C., Cummins, K., and Minshall, G., University of California Press, Berkeley, California, 295–341, ISBN 0-520-24567-9, 2006.
Pétursson, P. and Bjarnason, G.: Efnisgæðaritið – Viðauki 3: Jarðmyndanir (English: The Quality of Earth Material – Appendix 3: Regolith), Technical report, LEI-3406, The Icelandic Road and Coastal Administration, Reykjavík, 2023.
Pilgrim, D. H.: Some problems in transferring hydrological relationships between small and large drainage basins and between regions, J. Hydrol. (Amst), 65, 49–72, https://doi.org/10.1016/0022-1694(83)90210-X, 1983.
Rabatel, A., Letréguilly, A., Dedieu, J.-P., and Eckert, N.: Changes in glacier equilibrium-line altitude in the western Alps from 1984 to 2010: evaluation by remote sensing and modeling of the morpho-topographic and climate controls, The Cryosphere, 7, 1455–1471, https://doi.org/10.5194/tc-7-1455-2013, 2013.
Rabatel, A., Dedieu, J. P., and Vincent, C.: Spatio-temporal changes in glacier-wide mass balance quantified by optical remote sensing on 30 glaciers in the French Alps for the period 1983–2014, J. Glaciol., 62, 1153–1166, https://doi.org/10.1017/JOG.2016.113, 2016.
Raynolds, M., Magnússon, B., Metúsalemsson, S., and Magnússon, S. H.: Warming, sheep and volcanoes: Land cover changes in Iceland evident in satellite NDVI trends, Remote Sens.-Basel, 7, 9492–9506, https://doi.org/10.3390/rs70809492, 2015.
Rögnvaldsson, Ó.: Observed and simulated weather: Description of dynamical downscaling experiments for the water year 2014–2015 and comparison with observations, Technical report, http://rav.betravedur.is/LVC/ObsSim-comparison-TechReport.pdf (last access: 15 February 2023), 2020.
Rohrer, M., Salzmann, N., Stoffel, M., and Kulkarni, A. V.: Missing (in-situ) snow cover data hampers climate change and runoff studies in the Greater Himalayas, Sci. Total Environ., 468–469, https://doi.org/10.1016/J.SCITOTENV.2013.09.056, 2013.
Schumm, S. A.: Evolution of drainage systems and slopes in Badlands at Perth Amboy, New Jersey, Geol. Soc. Am. Bull., 67, 597–646, https://doi.org/10.1130/0016-7606(1956)67[597:EODSAS]2.0.CO;2, 1956.
Schyberg, H., Yang, X., Køltzow, M. A. Ø., Amstrup, B., Bakketun, Å., Bazile, E., Bojarova, J., Box, J. E., Dahlgren, P., Hagelin, S., Homleid, M., Horányi, A., Høyer, J., Johansson, Å., Killie, M. A., Körnich, H., Le Moigne, P., Lindskog, M., Manninen, T., Nielsen Englyst, P., Nielsen, K. P., Olsson, E., Palmason, B., Peralta Aros, C., Randriamampianina, R., Samuelsson, P., Stappers, R., Støylen, E., Thorsteinsson, S., Valkonen, T., and Wang, Z. Q.: Arctic regional reanalysis on single levels from 1991 to present, Copernicus Climate Change Service (C3S) Climate Data Store (CDS), https://doi.org/10.24381/cds.713858f6 (last access: 15 February 2023), 2020.
Stahl, K., Hisdal, H., Hannaford, J., Tallaksen, L. M., van Lanen, H. A. J., Sauquet, E., Demuth, S., Fendekova, M., and Jódar, J.: Streamflow trends in Europe: evidence from a dataset of near-natural catchments, Hydrol. Earth Syst. Sci., 14, 2367–2382, https://doi.org/10.5194/hess-14-2367-2010, 2010.
Vermote, E.: MOD09Q1 MODIS/Terra Surface Reflectance 8-Day L3 Global 250m SIN Grid V006 [data set], NASA EOSDIS Land Processes DAAC, https://doi.org/10.5067/MODIS/MOD09Q1.006, 2015.
- Abstract
- Introduction
- Domain of coverage and hydroclimate of the region
- Catchment delineation and aggregation approaches
- Hydrometeorological time series
- Catchment attributes
- Data availability
- Code availability
- Conclusion
- Appendix A
- Author contributions
- Competing interests
- Disclaimer
- Acknowledgements
- Financial support
- Review statement
- References
- Supplement