the Creative Commons Attribution 4.0 License.
the Creative Commons Attribution 4.0 License.
 | 30 Apr 2024
Simbi: historical hydro-meteorological time series and signatures for 24 catchments in Haiti
Pierre Brigode
Vazken Andréassian
Charles Perrin
Vincent Moron
Cédric Gaucherel
Emmanuel Tric
Dominique Boisson
Haiti, a Caribbean country, is highly vulnerable to hydroclimatic hazards due to heavy rainfall, which is partly linked to tropical cyclones. Additionally, its steep slopes generate flash floods, particularly in small catchments. Moreover, the hydrology of this region remains poorly understood and understudied. Unfortunately, there is no accessible database for the scientific community to use in this country. To fill this gap, hydroclimatic data were collected to create the first historical database in Haiti. This database, called Simbi (guardian of rivers, freshwater, and rain in Haitian mythology), includes 156 monthly rainfall series over the period 1905–2005, 59 daily rainfall series over the period 1920–1940, 70 daily streamflow series, and 23 monthly temperature series, not necessarily continuous, over the period 1920–1940. It also provides simulated streamflow series over the period 1920–1940 using the GR2M and GR4J rainfall–runoff models for 24 catchments and 49 attributes covering a wide range of topographic, climatic, geological, land use, hydrogeological, and hydrological signature indices. Simbi is the first open-access hydro-meteorological dataset for Haiti and will contribute to a better knowledge of hydrological risk in Haiti. Several sources of uncertainty associated with Simbi are acknowledged, including data quality (historical data), digitisation of paper archives, identification of relevant rain gauges, and rainfall–runoff models. It is important to consider these uncertainties when using Simbi.
The database will be regularly updated to include additional historical data that will be digitised in the future. It will thus contribute toward better knowledge of the hydrology of Haitian catchments and will enable the implementation of various hydrological calculations useful for designing structures or flow forecasting. Simbi is an open-access database and is available for download at https://doi.org/10.23708/02POK6 (Bathelemy et al., 2023).
- Article
(8364 KB) - Full-text XML
- BibTeX
- EndNote


Hydroclimatic databases, generally composed of climatic (precipitation and air temperature) and hydrological (streamflow) time series at the catchment scale, are extremely useful (Tramblay et al., 2021). They are used for water resources planning and management as well as for monitoring and forecasting floods, droughts, and changes in surface and groundwater resources (Dewandel et al., 2003, 2004; Alfieri et al., 2020; Harrigan et al., 2020). These databases are also used to evaluate the performance of “new” hydro-meteorological products based on Earth observation satellites, which are increasingly applied in poorly instrumented regions (Beck et al., 2019; Brocca et al., 2019; Prakash, 2019; Bathelemy et al., 2022). Furthermore, they are central to studies of climate change impact, e.g. through the calibration and evaluation of hydrological models used to quantify climate change impacts on water resources (Abbaspour et al., 2009; Chokkavarapu and Mandla, 2019; Teutschbein and Seibert, 2012).
In recent years, hydroclimatic databases called CAMELS (catchment attributes and meteorology for large-sample studies) have been created in several countries: the United States (Addor et al., 2017), Chile (Alvarez-Garreton et al., 2018), Brazil (Chagas et al., 2020), Great Britain (Coxon et al., 2020), Australia (Fowler et al., 2021), central Europe (Klingler et al., 2021), and Switzerland (Höge et al., 2023). The CAMELS databases use large datasets (precipitation, streamflow, air temperature, etc.) from multiple sources (in situ, reanalysis, remote sensing, etc.) over several hundreds of catchments. They also include multiple catchment attributes covering a range of topographic, climatic, hydrological, geological, and land cover indices. While the CAMELS databases provide time series, indices, and hydroclimatic signatures of catchments, other databases only provide indices and hydroclimatic signatures of catchments, such as the African Database of Hydrometric Indices (ADHI; Tramblay et al., 2021). These databases give the scientific community easy access to the hydrological information available for the regions concerned.
Unfortunately, there are significant differences between countries in terms of the quality and quantity of hydroclimatic reference databases as well as regarding access to these data. Some countries do not have such reference databases. This is the case of Haiti, whose territory is, moreover, highly exposed to natural disasters (Khouakhi et al., 2017; Burgess et al., 2018) and climate change (Peterson et al., 2002). At the same time, Haiti is facing the consequences of massive deforestation and anarchic urbanisation (urban development that does not comply with planning regulations) in recent decades (Hedges et al., 2018; Tarter et al., 2018; Mompremier et al., 2022), resulting in increased vulnerability to hydroclimatic hazards. Currently, Haiti lacks a freely and easily accessible hydroclimatic database due to the absence of in situ hydroclimatic observations. The first hydrometric observations were conducted during the American occupation of Haiti and began in 1919. American engineers from the Water Resources Service (WRS) of the United States Geological Survey (USGS) supervised these hydrological observations, which continued into the 1940s and, exceptionally, later. The end of the American occupation is the main reason for the cessation of hydrometric observations. This is due to the loss of technical support from the WRS as well as financial constraints and socio-political difficulties in Haiti. The data time series and a description of the methods used to collect them were published annually in the Hydrographic Bulletin, summarising 70 daily streamflow time series over the 1920–1940 period. After these 2 decades of streamflow observations, very few hydrological data were produced in Haiti (Pouyaud and Hoepffner, 1987). In addition to hydrometric observations, rainfall measurements started in Haiti around 1905, using 15 rain gauges. Over time, the rain-gauge network became denser, with 25 stations operated by the Petit Séminaire Collège St. Martial (a school run by the Congrégation du Saint-Esprit), 38 by the Direction Générale des Travaux Publics, and nearly 30 by other institutions, such as the Frères de l'Instruction Chrétienne (Pouyaud and Hoepffner, 1987). Rainfall measurements are currently managed by the CNIGS (National Centre for Geospatial Information) and the UHM (hydrometeorological unit of Haiti). Since 2014, this observation network has had approximately 20 automatic rain gauges. However, due to a significant amount of missing data, the network remains highly fragmentary and unexploited.
In 1977, the Haitian government initiated a project to make an inventory and digitise some available hydroclimatic time series. As a result, the 70 daily streamflow series for the period 1920–1940 and almost 100 monthly rainfall series from the start of observations (∼ 1905) until 1975 were digitised. In 2012, the Haitian government launched a second project named BVH (Bassins Versants Haïtien in French, i.e. Haitian catchments; Gaucherel et al., 2018) for compiling available hydroclimatic data, better understanding hydrology in Haiti, and improving the management of water resources. Within this project, Haitian catchments were characterised using monthly streamflow data (Gaucherel et al., 2016) and rainfall data (Moron et al., 2015), and the relationships between their shape, relief, and river sinuosity were investigated (Gaucherel et al., 2017; Bonhomme et al., 2013). Unfortunately, the two databases produced within the BVH project (monthly rainfall time series and monthly streamflow time series) have never been analysed jointly, are not available online, and remain limited for several hydrological analyses due to their monthly time step (monthly). Thus, these databases have been underused to date.
The main objectives of this study are to make Haitian hydroclimatic data available to the scientific community and to merge these different datasets in order to propose the first hydroclimatic database for several Haitian catchments at both monthly and daily time steps. To overcome the issue of the numerous missing data present within the streamflow time series, two rainfall–runoff models were used to reconstruct the missing values and produce continuous streamflow time series (Brigode et al., 2016; Smith et al., 2019). The use of rainfall models for flow reconstruction has been used for several decades for various types of catchments covering different climatic regions (Caillouet et al., 2017; Crooks and Kay, 2015; Jones and Lister, 1998). Thus, monthly (GR2M, Mouelhi et al., 2006) and daily (GR4J, Perrin et al., 2003) lumped rainfall–runoff models were used to reconstruct continuous streamflow series in Haiti at both time steps.
The goal of our study is therefore fourfold.
- i.
Collecting all existing hydroclimatic time series in Haiti and digitising certain paper archives that have been identified as priorities
- ii.
Building climatic (air temperature and rainfall) time series at the catchment scale by spatially and temporally aggregating available series
- iii.
Creating a continuous Haitian hydroclimatic database for the 1920–1940 period using the catchment climatic series and the rainfall–runoff models
- iv.
Characterising the hydrological behaviour of Haitian catchments based on 49 hydrological indices and signatures covering six classes of catchment attributes (topographic, geological, hydrogeological, land cover, climate indices, and hydrological signatures)
Observed hydroclimatic data, simulated streamflow series, and catchment attributes make up the Simbi database, the first continuous and freely available hydrological database in Haiti. Simbi is a guardian of rivers, freshwater, and rain in Haitian mythology (https://en.wikipedia.org/wiki/Simbi, last access: 24 April 2024).
2.1 Streamflow
The streamflow data consist of 70 daily series, most of which are available from 1920 to 1940, with significant gaps (missing data) in some series (see Fig. 1). These data were collected by the Hydrographic Department of the Irrigation Service of the General Direction of Public Works in Haiti. On average, 12 gauging measurements were performed per station and per year. These data were digitised in 1977.
2.2 Rainfall
2.2.1 Monthly rainfall
A modified version of the monthly rainfall database compiled by Moron et al. (2015) has been produced for this study. The original data produced by Moron et al. (2015) were compared with the digitised data, allowing for correction of some data series. The modifications to the original database are described in detail in Appendix A. The original data produced by Moron et al. (2015) included 156 monthly rainfall series available from 1905 to 2005 and were derived from three different sources.
-
The CNIGS database with 162 monthly rainfall series
-
The database managed by the international company Chemonics with 109 monthly rainfall series
-
The CNSA (National Coordination for Food Security) database with 14 monthly rainfall series
These three databases were merged by Moron et al. (2015) by removing and/or correcting duplicates. In total, 156 monthly rainfall series were validated and retained to form the monthly rainfall database. However, several series have a high percentage of missing data, and most of them have data available only from 1930 to 1970 (see Fig. 1).
2.2.2 Daily rainfall
Nearly 15 paper registers containing hydroclimatic data between 1905 and 1970 have been recovered from the BHS (Bibliothèque Haïtienne des Spiritains, in French, Haitian Spiritual Library). These data were previously collected by the observatory of the Petit Séminaire Collège St. Martial (PSCSM) in Port-au-Prince during the 20th century. The daily rainfall time series considered a priority in this study are those available for the studied catchments (i.e. rain gauges located within or close to the studied catchments) and for the same period as the streamflow time series, i.e. the period 1920–1940. Overall, 59 rainfall times series available for the period 1920–1940 have been digitised for the Simbi database (see Fig. 1). Various optical character recognition tools were tested to perform this digitisation. However, the results were not satisfactory due to the poor readability of the documents, which were both secular and handwritten. Therefore, the daily data were transcribed manually. Four students from UEH (Université d'Etat d'Haïti in French, i.e. the State University of Haiti) were recruited for this digitisation task. They worked in pairs, with one student reading and the other entering the data.
Note that the monthly database created by Moron et al. (2015) resulted from an initial digitisation of monthly totals from the same rain gauges. Thus, our digitisation work extends the efforts of Moron et al. (2015) to assess the quality of the digitised daily rainfall series (referred to as BHS hereafter), and we compared their monthly sums with the Moron et al. (2015) database (referred to as MORON hereafter). We used two criteria to compare the BHS and MORON data:
-
the correlation between the BHS and MORON monthly series; and
-
the percentage of months where the errors between the monthly BHS and MORON data are greater than 5 %.
The BHS data were reviewed and corrected for each month in which discrepancies were found between the BHS and MORON data. It is worth noting that some errors were identified in the MORON data. Appendix A summarises the five types of errors detected in Moron et al. (2015), such as the correction of some extreme values (e.g. the precipitation of October 1933 at Camp-Pérrin was equal to the 196.9 mm in Moron et al. (2015), while the digitisation of the daily data confirmed that the actual monthly sum was 1196.9 mm). Therefore, this study allowed for the correction of both the BHS and MORON data (see Appendix A).
2.2.3 National Oceanic and Atmospheric Administration (NOAA) Twentieth Century Reanalysis (20CR) reanalysis rainfall
The third version of the NOAA 20CR project precipitation data (Slivinski et al., 2019) was used for the period 1920–1940. These data are available at a daily time step at a spatial scale of 1° (111 km at the Equator). These are not measured data but rainfall data from a global climatic model (reanalysis).
2.3 Air temperature
2.3.1 Digitisation of historical archives
Air temperature data are available at a monthly time step in paper archives in the same river bulletins that contain streamflow data. A total of 23 monthly temperature series with data available for the period 1926–1939 have been digitised by three students from UCA (Université Côte d'Azur) for the Simbi database. These temperature series are not continuous over time, and there are significant gaps (missing data) in some series (see Fig. 1).
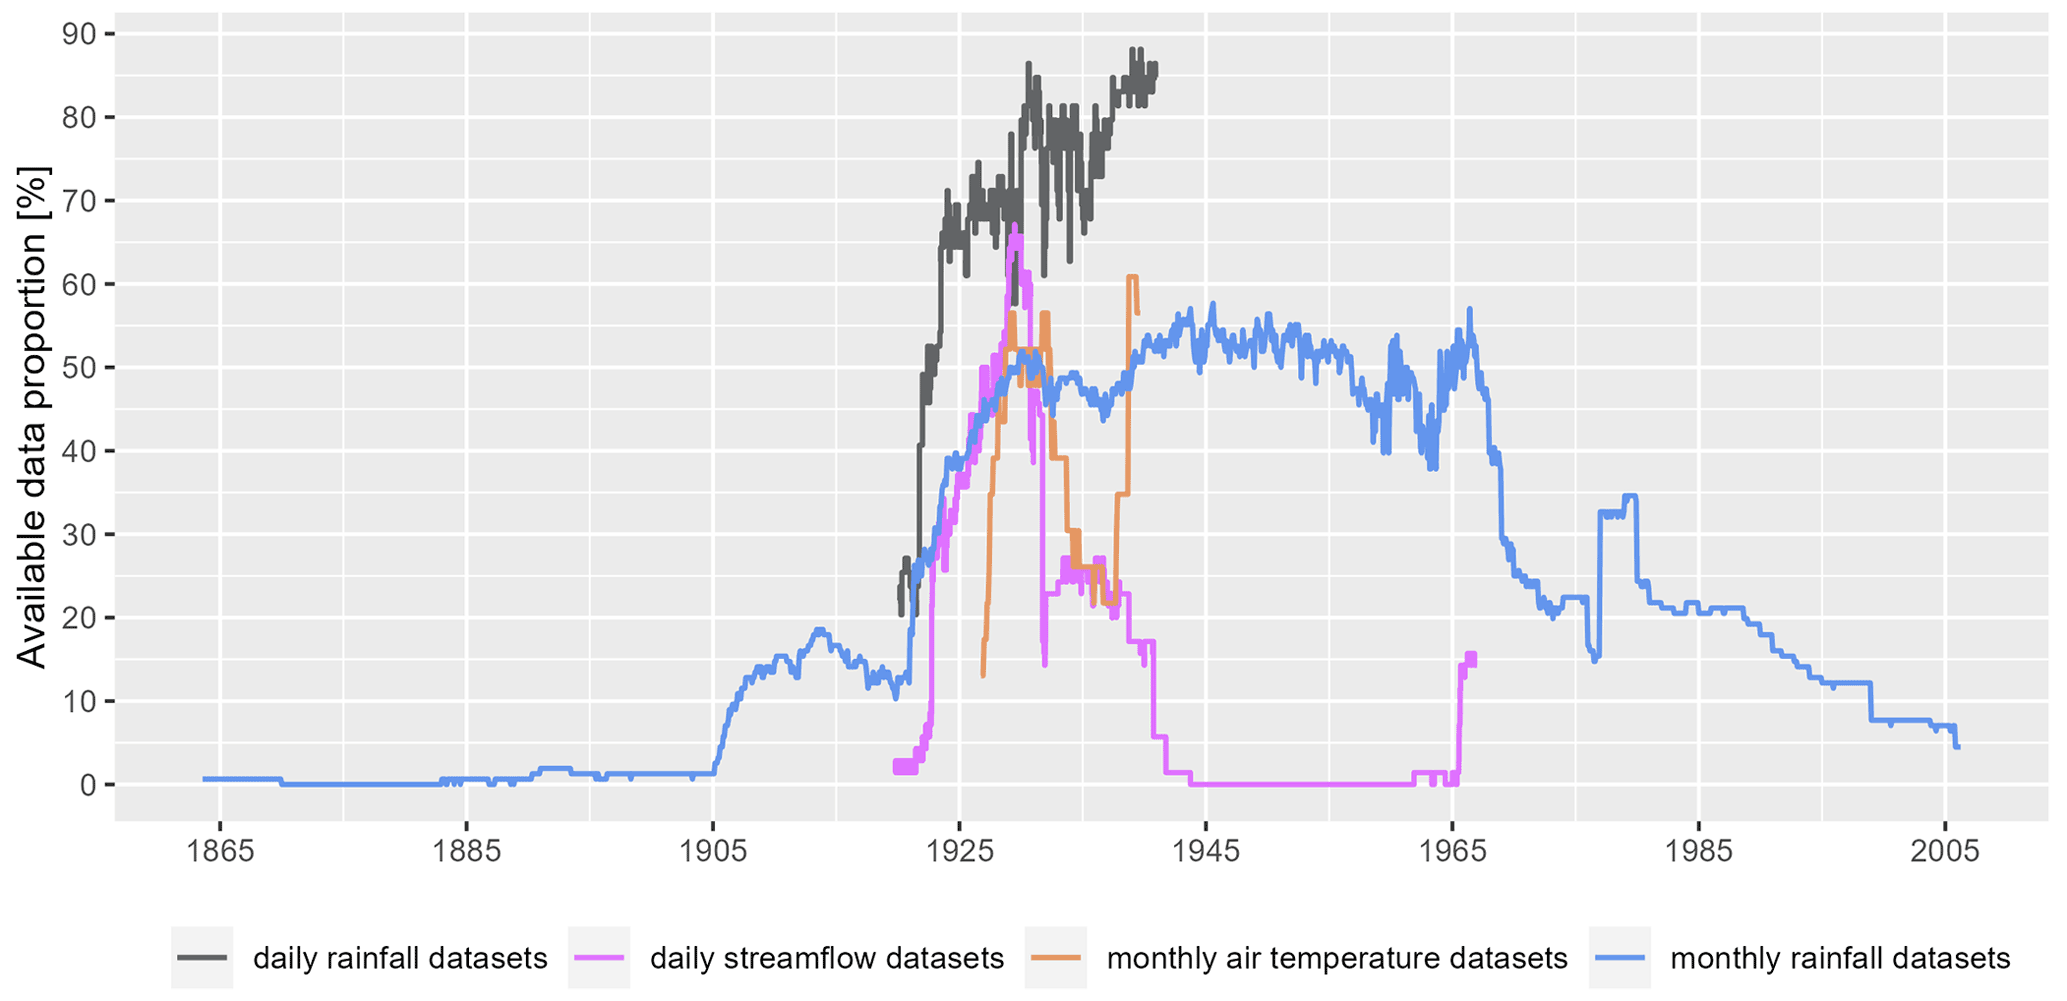
Figure 1Period of availability and percentage of stations with data available for digitised daily rainfall datasets, daily streamflow datasets, monthly air temperature datasets and monthly rainfall datasets produced by Moron et al. (2015).
2.3.2 NOAA 20CR reanalysis air temperature
The NOAA reanalysis air temperature database (Slivinski et al., 2019) was used in this study. This air temperature database is available at the same spatiotemporal resolution as the NOAA rainfall data (see Sect. 2.2.3).
2.3.3 Berkeley Earth Surface Temperature (BEST)
The BEST (Rohde et al., 2013) air temperature database was used in this study. BEST is a gridded air temperature produced by spatial interpolation using the kriging method (Krige, 1951; Cressie, 1990) of air temperature data observed around the world. BEST started in 1753 at the monthly resolution and in 1880 at a daily resolution of 1° spatial resolution.
2.4 Digital elevation model (DEM)
The digital elevation model used in this study is the Shuttle Radar Topography Mission (SRTM) of the United States Geological Survey (USGS) and the National Aeronautics and Space Administration (NASA). The digital elevation model was extracted for Haiti and is available at a spatial resolution of 90 m (Reuter et al., 2007).
This section presents the methodology followed (i) to select the hydrometric stations and climatic series used to produce the time series at the catchment scale, (ii) to simulate continuous streamflow series with rainfall–runoff models for the selected catchments, and (iii) to compute hydrological indices and signatures for the selected catchments.
The conceptual lumped GR2M and GR4J rainfall–runoff models are described in Appendix B. The KGE (Kling–Gupta efficiency; Gupta et al., 2009) objective function was used to evaluate the performance of both models. The KGE score is defined by the following analytical formula:
where r is the correlation coefficient, α is the ratio of the standard deviation of the simulated streamflow to the standard deviation of the observed streamflow, and β is the ratio of the mean of the simulated streamflow to the mean of the observed streamflow.
3.1 Selection of streamflow data and catchments
3.1.1 Selection of streamflow series
An analysis of the 70 available streamflow series was performed to select the “hydrologically relevant” streamflow series. Four criteria were initially used to make this selection.
-
The annual hydrographic bulletins reported the accuracy with which rating curves were established through three ratings: “well established,” “fairly well established”, and “poorly established.” Most of the streamflow series with poorly established rating curves were found to have significant measurement differences between periods. These streamflow series were not used in the remainder of this study.
-
Some hydrometric stations were located downstream of diversion channels or small dams used for irrigation. These streamflow series poorly represent the seasonality of streamflow and are therefore considered to be influenced by human activities. These streamflow series were not used in the remainder of this study.
-
Some hydrometric stations were located downstream of resurgences or springs. These groundwater resurgences are beyond the scope of this study. Therefore, these streamflow series were not used in the remainder of this study.
-
The streamflow series that had less than 5 years of data were not used in the remainder of this study.
In addition to these four criteria, three other indices inspired by the paper of Gudmundsson et al. (2018) were used to assess the quality of the streamflow data. These three criteria were calculated as follows.
-
The number of days for which Q<0, where Q denotes a daily streamflow value: the rationale underlying this rule is that streamflow values smaller than zero are non-physical (Gudmundsson and Seneviratne, 2016).
-
A sequence of more than 10 equal consecutive streamflow values larger than zero: this index was selected because equal consecutive streamflow values often occur due to instrument failure or flow regulation (Gudmundsson et al., 2018).
-
Detection of outliers, i.e. unusually large or small streamflow values that could come from instrument malfunction: the calculation of these outliers is inspired by the paper of Gudmundsson et al. (2018). Daily streamflow values are flagged as outliers if values of log (Q+0.01) are larger or smaller than the mean value of log (Q+0.01) plus or minus 6 times the standard deviation of log (Q+0.01) computed for that calendar day over the entire series. The mean and standard deviation are computed for a 5 d window centred on the calendar day to ensure that a sufficient amount of data is considered. The log transformation is used to account for the skewness of the distribution of daily streamflow values, and 0.01 was added because the logarithm of zero is undefined.
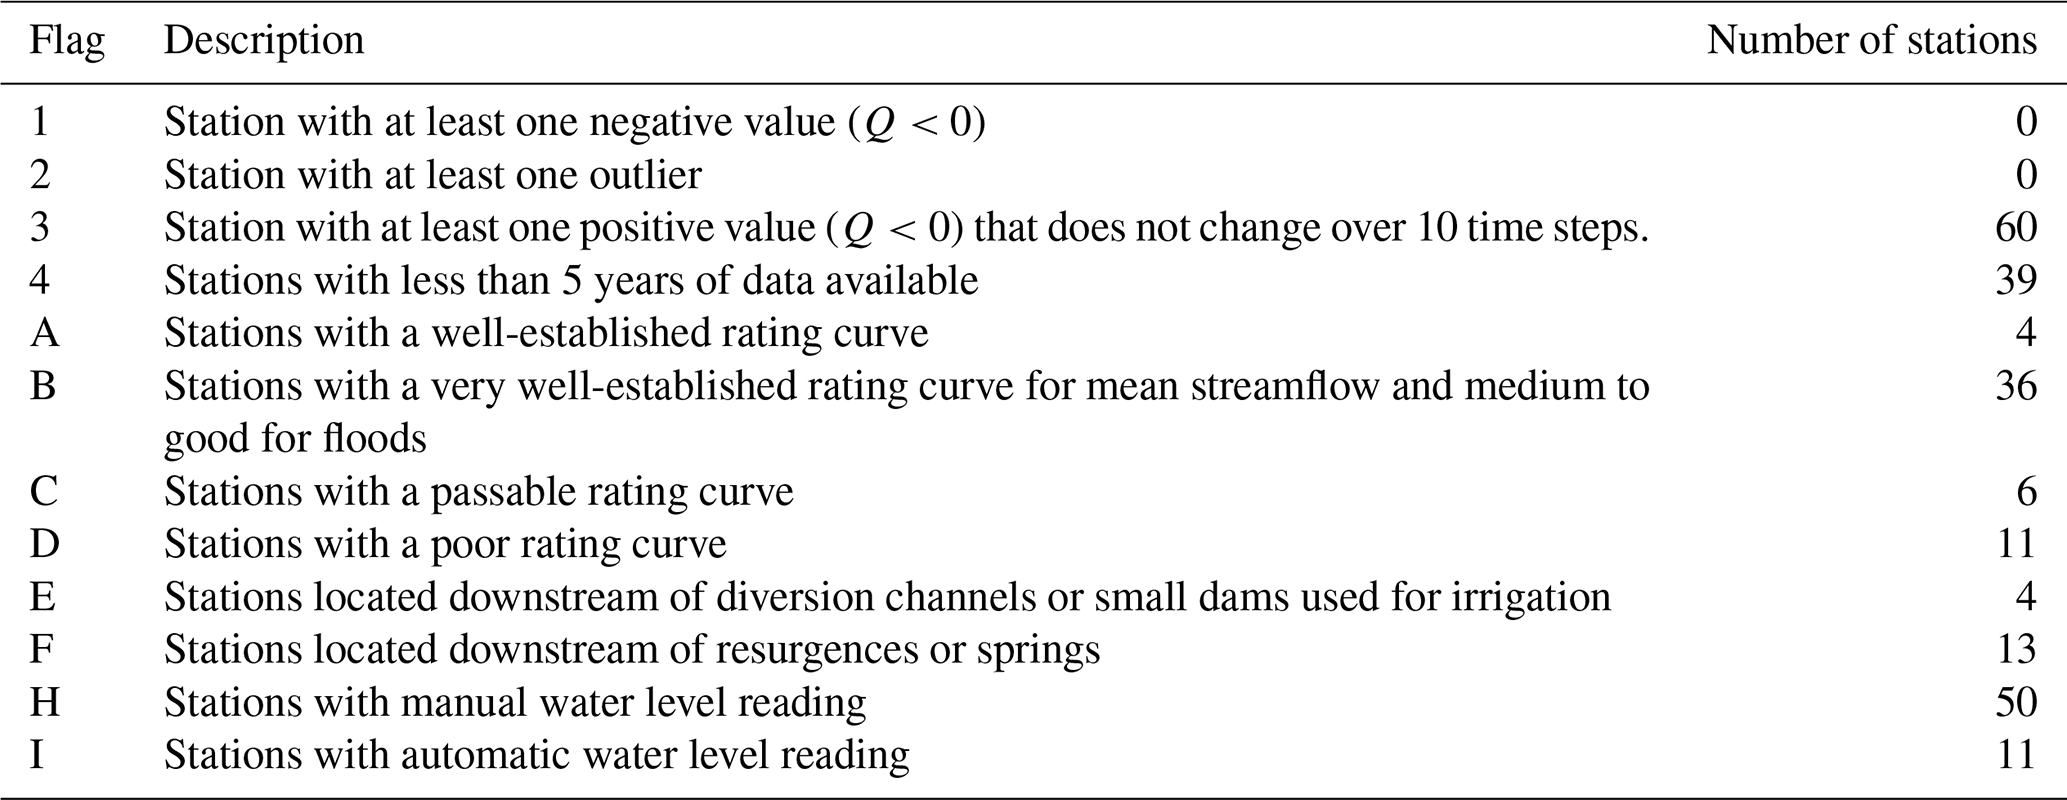
To summarise, the quality of the 70 streamflow daily series is described using 12 flags (1, 2, 3, 4, A, B, C, D, E, F, H, and I), as detailed in Table 1. Using these criteria, along with visual analysis to identify anomalies, i.e. non-natural records that may be erroneous streamflow values or anthropogenic influences that can lead to misinterpretation of actual hydrological processes (Strohmenger et al., 2023), 24 hydrometric stations were identified as “hydrologically relevant” from the 70 available.
3.1.2 Catchment boundaries and areas
The contours of the 24 catchments corresponding to the 24 selected hydrometric stations were delineated using the SRTM digital terrain model (Reuter et al., 2007) and the TauDEM algorithm (Tarboton et al., 2005). The catchment areas calculated with the TauDEM algorithm were compared with those reported in the Hydrographic Bulletin (areas estimated from U.S. Army maps). Table C1 in Appendix C presents the ratios and errors between the areas calculated with TauDEM and those in the hydrographic bulletins. The errors between the two areas are less than 10 % for 18 of the 24 catchment areas. However, significant errors were observed for six catchments (Q-045, Q-051, Q-056, Q-060, Q-061, and Q-065). Three factors account for significant differences between the two areas.
-
The positions of some hydrometric stations were wrong in the archives. Their locations were corrected using additional information in the hydrographic bulletins (name of a bridge, main road, monuments, etc.). For example, the name of a bridge for station Q-056 (Pont Parois) and the name of the river for station Q-060 (Massacre River) were used to correct the station position.
-
Due to the low resolution of the DEM, the river network generated with the TauDEM algorithm may differ from the real river network, especially in plain areas near the estuaries. Hydrometric stations were therefore relocated to match the stream generated by the TauDEM algorithm (stations Q-045, Q-065, and Q-051).
-
Three different stations (Q-053, Q-061, and Q-056) were associated with an upstream catchment area equal to 252 km2. We supposed that this is an error in the areas of the hydrographic bulletins.
Hereafter, we will only use areas calculated with the TauDEM algorithm and not areas noted in the paper archives. The geographic locations of the 24 selected hydrometric stations are shown as red dots in Fig. 2.
3.2 Building catchment climate series
3.2.1 Rainfall
Three sources of rainfall data were used to build catchment-scale rainfall series: (i) NOAA 20CR rainfall data, (ii) data from all available rain gauges, and (iii) data from several possible combinations of rain gauges.
NOAA 20CR rainfall data
Catchment-scale rainfall series were calculated as a weighted average of NOAA 20CR rainfall. The weights are proportional to the area of the NOAA pixel overlapping the catchment. The areas of most catchments are significantly smaller than the NOAA 20CR pixel. Thus, neighbouring catchments located on the same NOAA grid cell will have the same rainfall series (see Fig. 2).
Reference rainfall at the catchment scale
For each catchment, an initial rainfall series, called “reference rainfall” hereafter, was calculated as a weighted average of monthly rainfall data from Thiessen polygons (Croley and Hartmann, 1985; Han and Bray, 2006). Due to the high percentage of missing data in most rainfall series, the weights obtained from the Thiessen polygons are not the same for all the time steps. For each time step, the weights are calculated using the rain gauges with available data. The use of “reference rainfall”, i.e. the use of all the rain gauges, including those with a high percentage of missing data, may introduce non-stationarity into the catchment-scale rainfall series and may not be “relevant” for rainfall–runoff modelling. The low density of the rain gauges and the high spatial variability of rainfall in Haiti (Moron et al., 2015) make it difficult to apply methods to estimate missing data (Benoit et al., 2022; Di Piazza et al., 2011; Oriani et al., 2020). Therefore, gap-filling methods were not used.
Multiple rain-gauge combinations
All possible rain-gauge combinations are calculated for each catchment (combination of 1, 2, 3, ..., n rain gauges, where n is the number of available rain gauges). If a single rain gauge is available, its data are used as the catchment-scale rainfall series (weighting coefficient =1). If there are multiple rain gauges available, their weighting coefficients are calculated from the Thiessen polygons. Catchment-scale rainfall series with no missing data were used for rainfall–runoff modelling.
Selection of the “relevant” rain gauge for rainfall–runoff modelling
The performance of a rainfall–runoff model improves with a better description of the rainfall input (Andréassian et al., 2001). The GR2M monthly rainfall–runoff model was therefore used to determine, for each catchment and at the monthly time step, the “relevant” rain gauges in this study. NOAA 20CR rainfall series, reference rainfall series, and multiple rain-gauge combinations are used as inputs to the GR2M model, and relevant rain gauges are defined as those providing the best model performance.
The first 3 years of data (early 1920 to late 1922) were used to initialise the model, and a split-sample test (Klemeš, 1986), commonly used in hydrology, was implemented. This practice consists in splitting a streamflow time series into two distinct sub-periods P1 and P2, the first for calibration and the second for evaluation, and then exchanging these two sub-periods. The two sub-periods P1 and P2 are chosen so that they have the same available streamflow lengths. The combination of rain gauges with the best KGE score in evaluation (average of the KGE in evaluation over the two sub-periods) was considered the most relevant one for rainfall–runoff modelling.
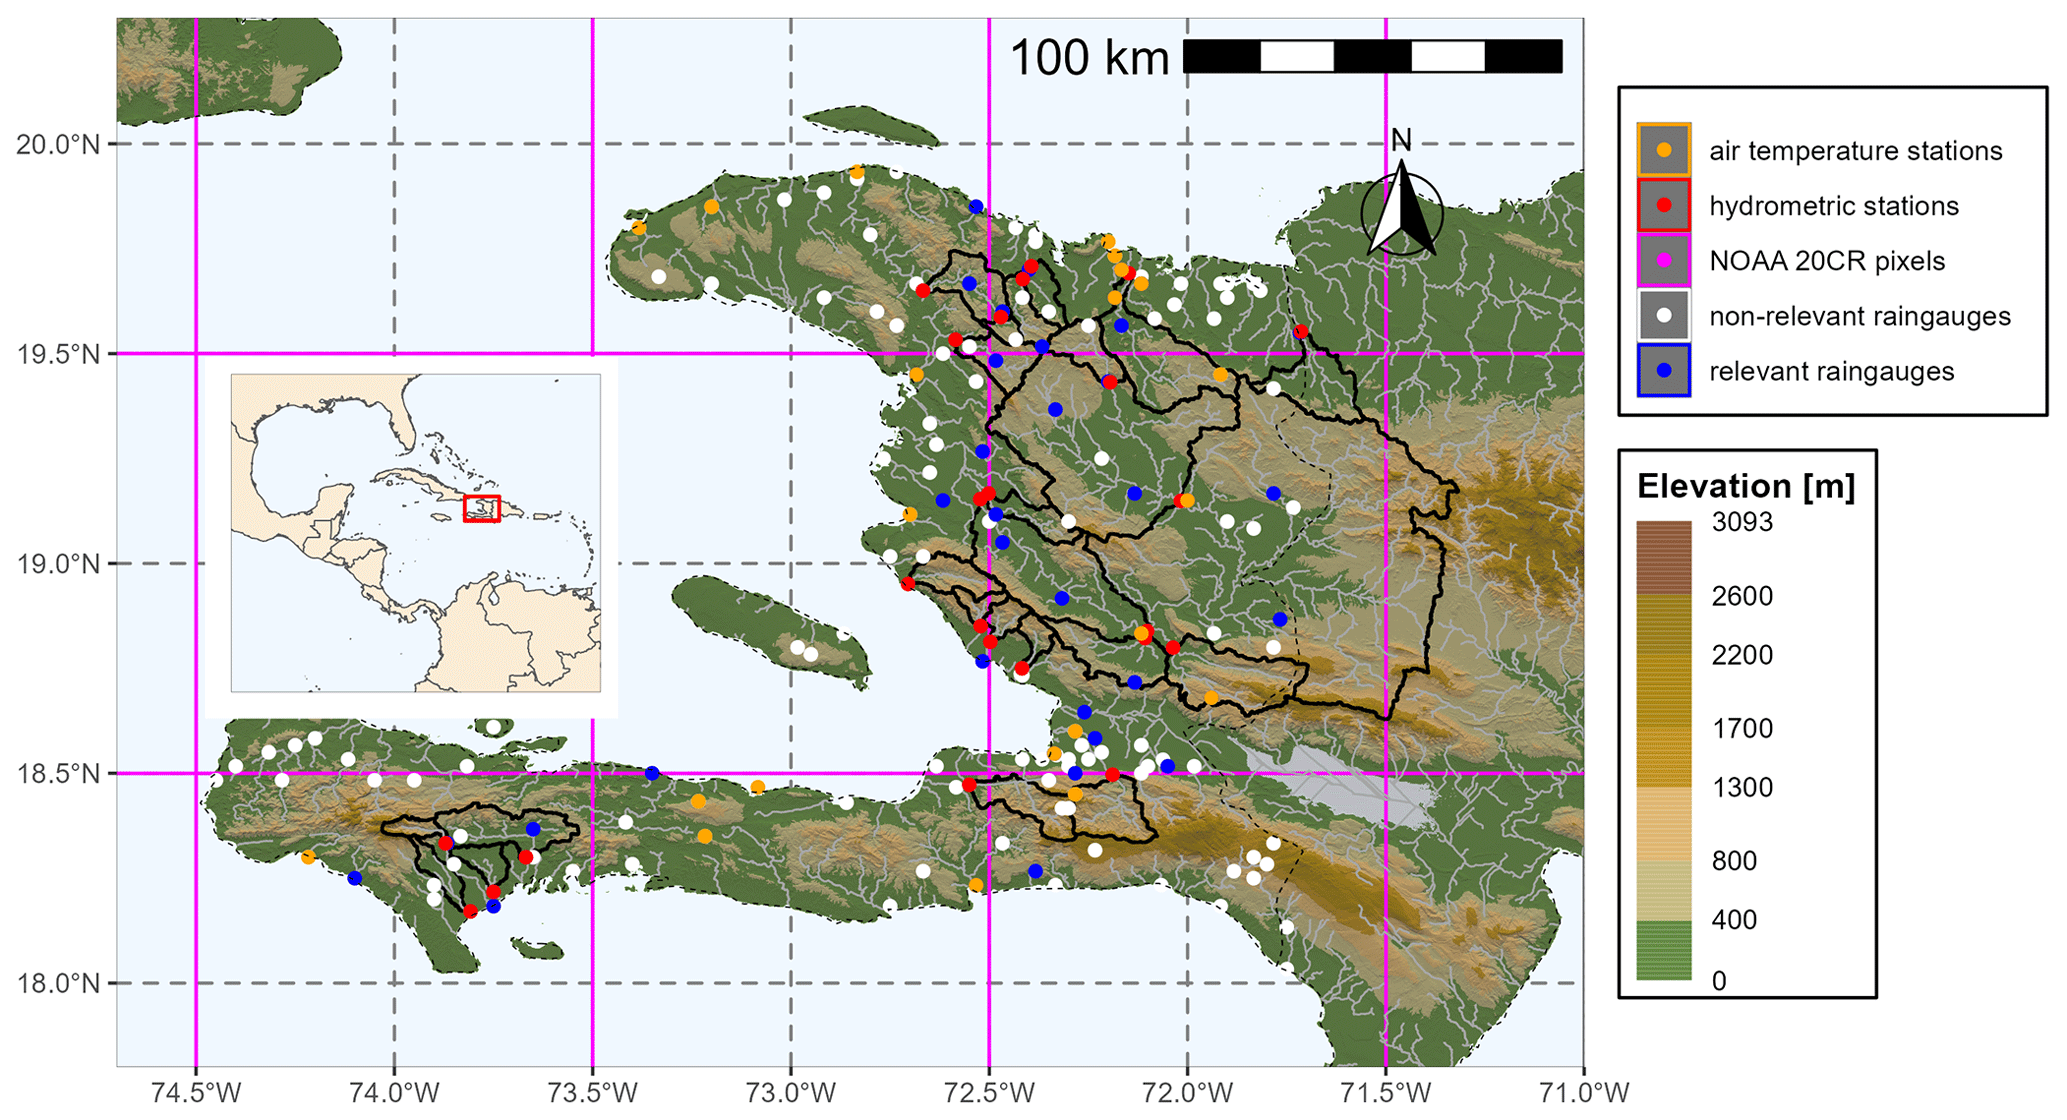
Figure 2Locations of the 24 hydrometric stations used (red dots), the associated catchment contours (black solid lines), and the locations of all rain gauges with monthly data for the period 1920–1940 (white, orange, and blue dots). Rain-gauge stations with air temperature data are shown in orange. Rain gauges considered relevant for hydrological modelling are shown in blue. NOAA 20CR pixels are shown in purple, the border between Haiti and the Dominican Republic is shown as a dashed black line, and the background topography is from the SRTM database.
3.2.2 Air temperature and potential evapotranspiration
The observed air temperature series are available at a monthly time step and are not available for the entire study period (1920–1940). In our context, continuous air temperature series are needed to estimate potential evapotranspiration (PET) series at the catchment scale. Because the air temperature series are incomplete, an annual average temperature was calculated for each station and used in the rainfall–runoff model.
Several studies have evaluated the impact of imperfect knowledge of air temperature data (using annual averages in our study) on the performance of rainfall–runoff models (Burnash, 1995; Fowler, 2002; Kribèche, 1994). The results converge to show that this source of uncertainty is the least important and that it can be largely compensated for by the model during calibration. To verify this hypothesis, two complementary temperature databases (NOAA 20CR and BEST) were used as inputs to the GR2M model. The aim is to test whether the performance of the model (KGE score) is sensitive to differences in air temperature data.
Using NOAA 20CR and BEST air temperature
Catchment air temperature series were computed at a daily time step for two temperature databases (NOAA 20CR and BEST) by taking the weighted average of pixels in the respective database (NOAA 20CR or BEST). The weights are proportional to the area of the NOAA 20CR or BEST pixel overlapping the catchment.
Using available meteorological stations
Annual average temperature series were calculated for each catchment at the monthly time step using observed (digitalised data) air temperatures. Daily air temperature series were then derived by interpolation from a second-degree polynomial. A similar study of interpolation of monthly temperature series to obtain daily temperatures was performed by Andréassian et al. (2004). Daily air temperature series at the catchment scale were calculated using the interpolated daily air temperature series and Thiessen polygons (Croley and Hartmann, 1985; Han and Bray, 2006).
PET catchment series
The PET series are calculated using the formula of Oudin et al. (2005), which is based on air temperature. This formula was chosen for the calculation of PET for two main reasons. The other climate variables commonly used to calculate PET (wind speed, humidity, radiation, etc.) are unavailable, which justifies the use of a formula based only on air temperature and extra-terrestrial radiation (which depends only on the Julian day and the latitude) in a context where data are scarce. Moreover, it is one of the most relevant approaches for rainfall–runoff modelling compared to 27 models for calculating PET and has been tested on more than 300 catchments covering several climatic zones, including tropical zones (Oudin et al., 2005).
3.3 Water balance
The water balance was used as a complementary analytical tool to the GR2M model. The annual average water balance was presented in the form of a Turc–Budyko diagram, as described by Coron et al. (2015), for all 24 study catchments.
3.4 Simulation of monthly and daily streamflow series for the period 1920–1940
Three sets of parameters were used to simulate the streamflow series for each catchment during the period 1920–1940. The first two sets of parameters called P1 and P2 were obtained by calibration over the two sub-periods using the catchment rainfall calculated from the relevant rain gauges and the PET series calculated from the digitised temperature series, as described in Sect. 3.2.1. The third set of parameters called P3 is obtained by calibration over the whole period 1920–1940 (the first 3 years being used to initialise the model). The GR2M model was used to simulate the monthly streamflow series for the 24 catchments studied, and the GR4J model was used to simulate the daily streamflow series for 21 of the 24 catchments where daily rainfall data are available. Modelling was performed using the airGR package (Coron et al., 2017, 2020) and R software (R Core Team, 2022).
3.5 Calculation of catchment attributes
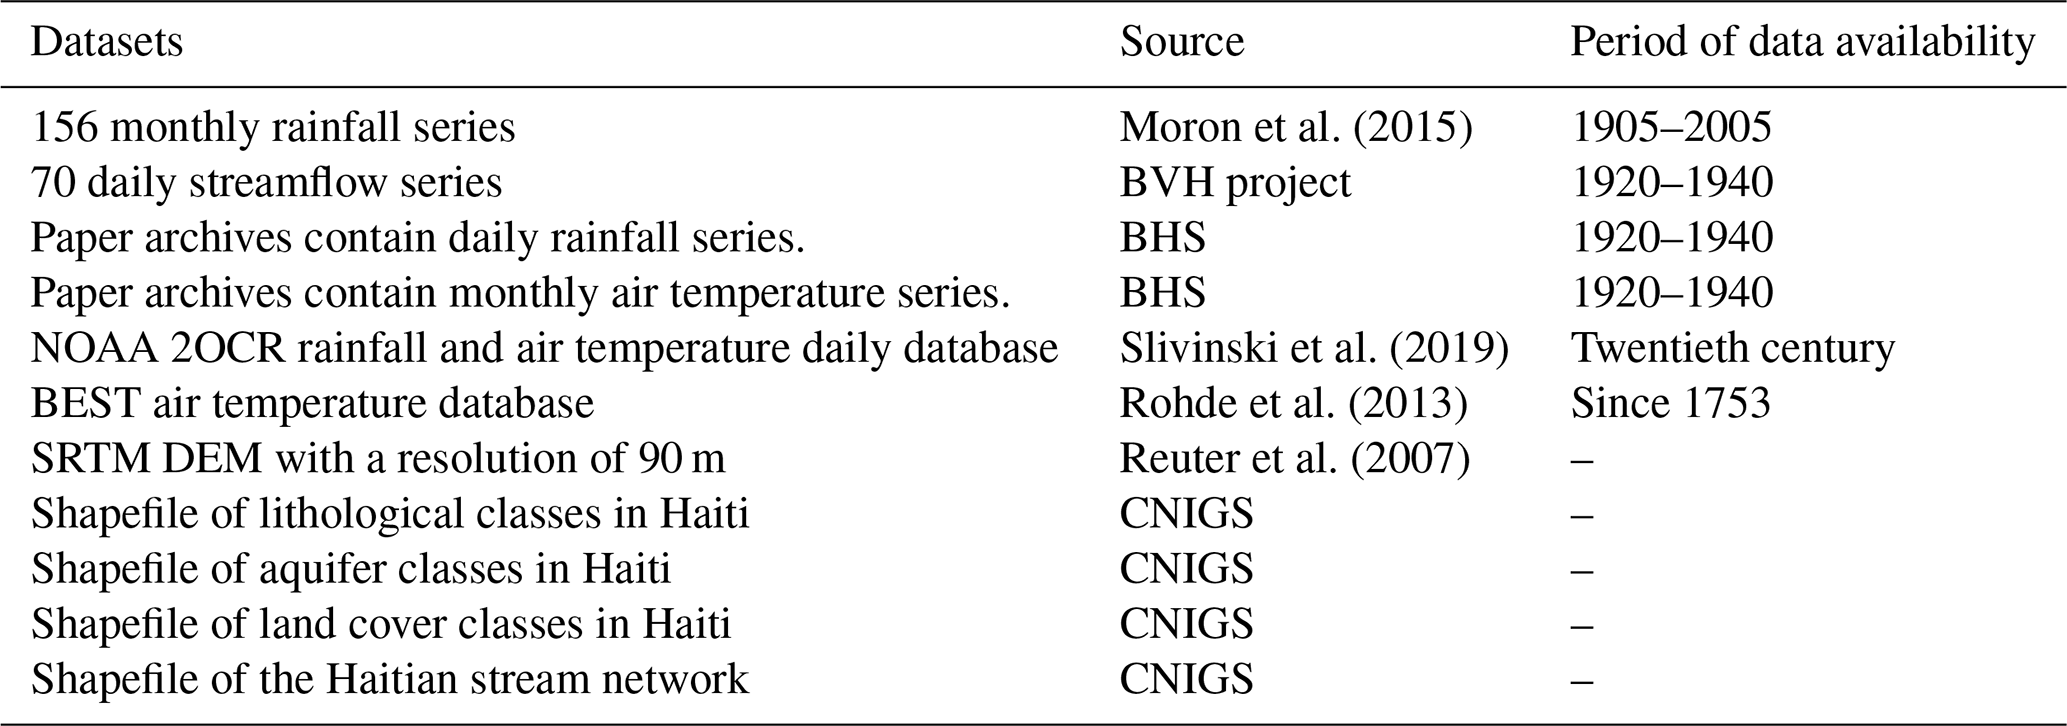
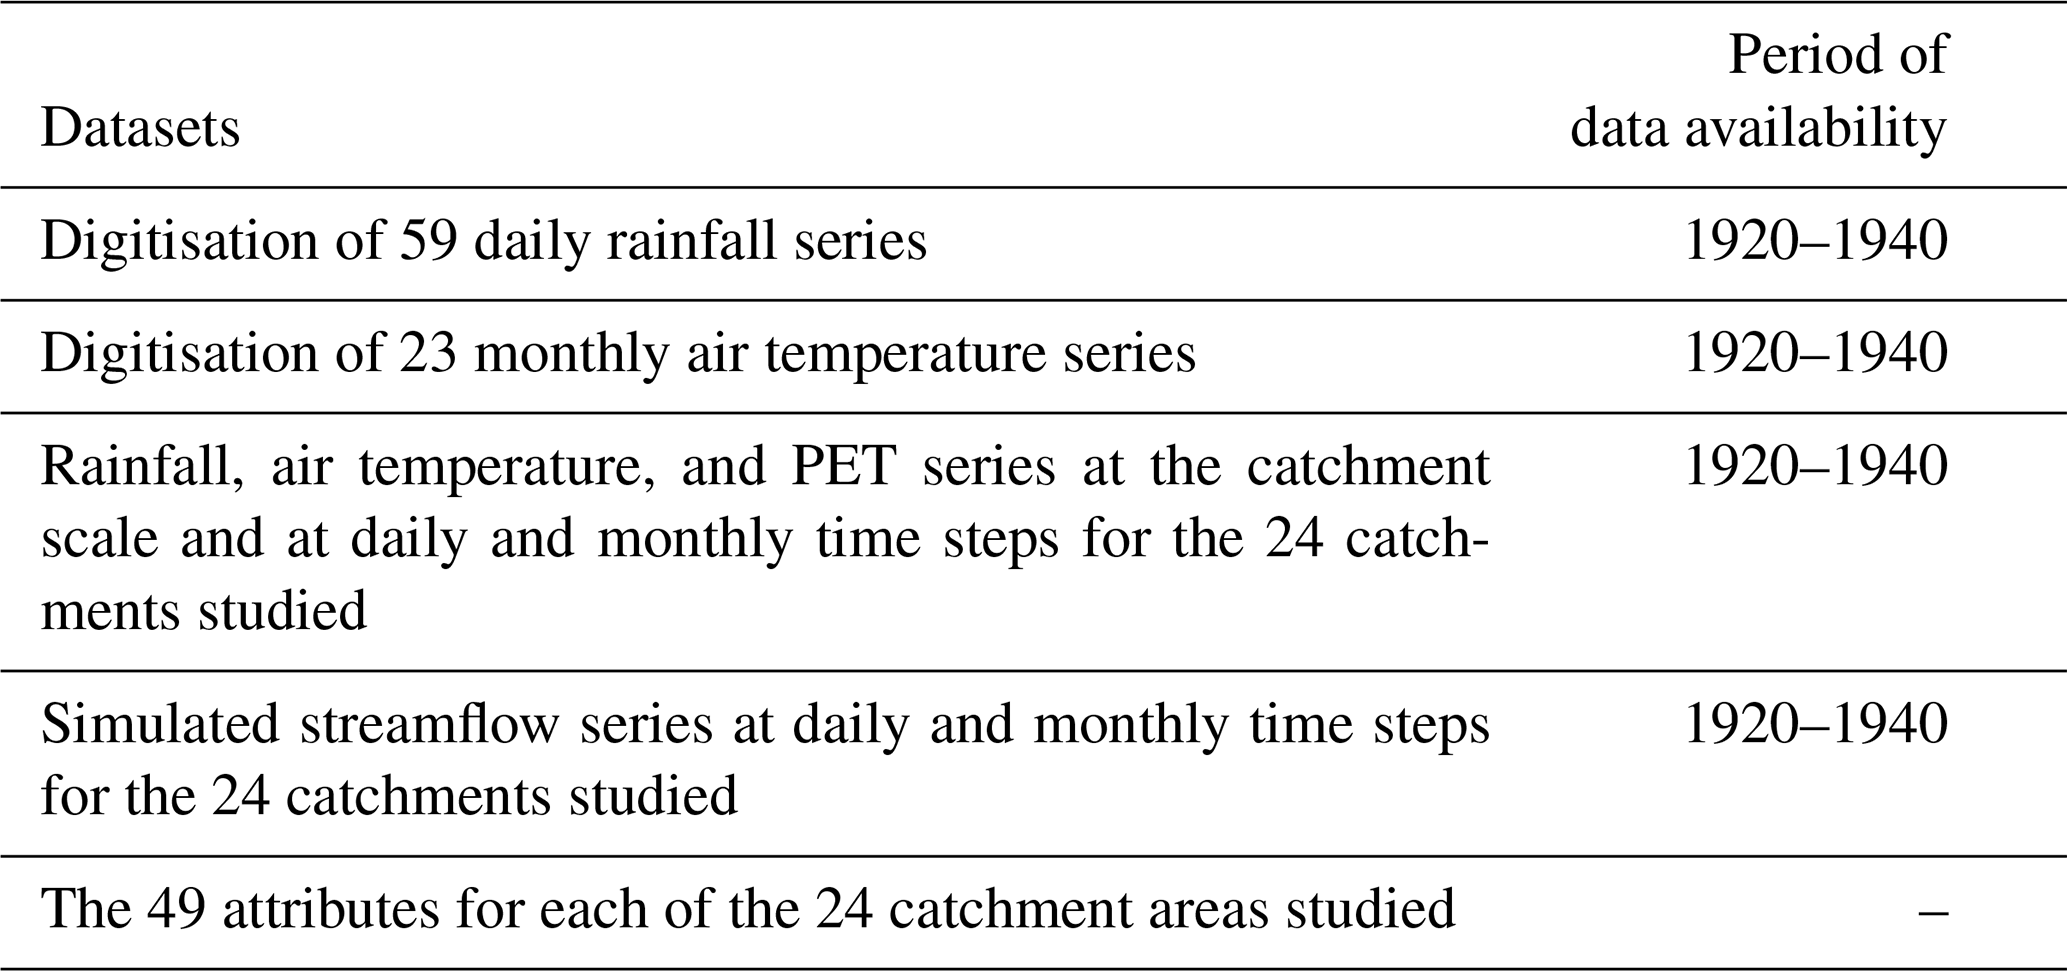
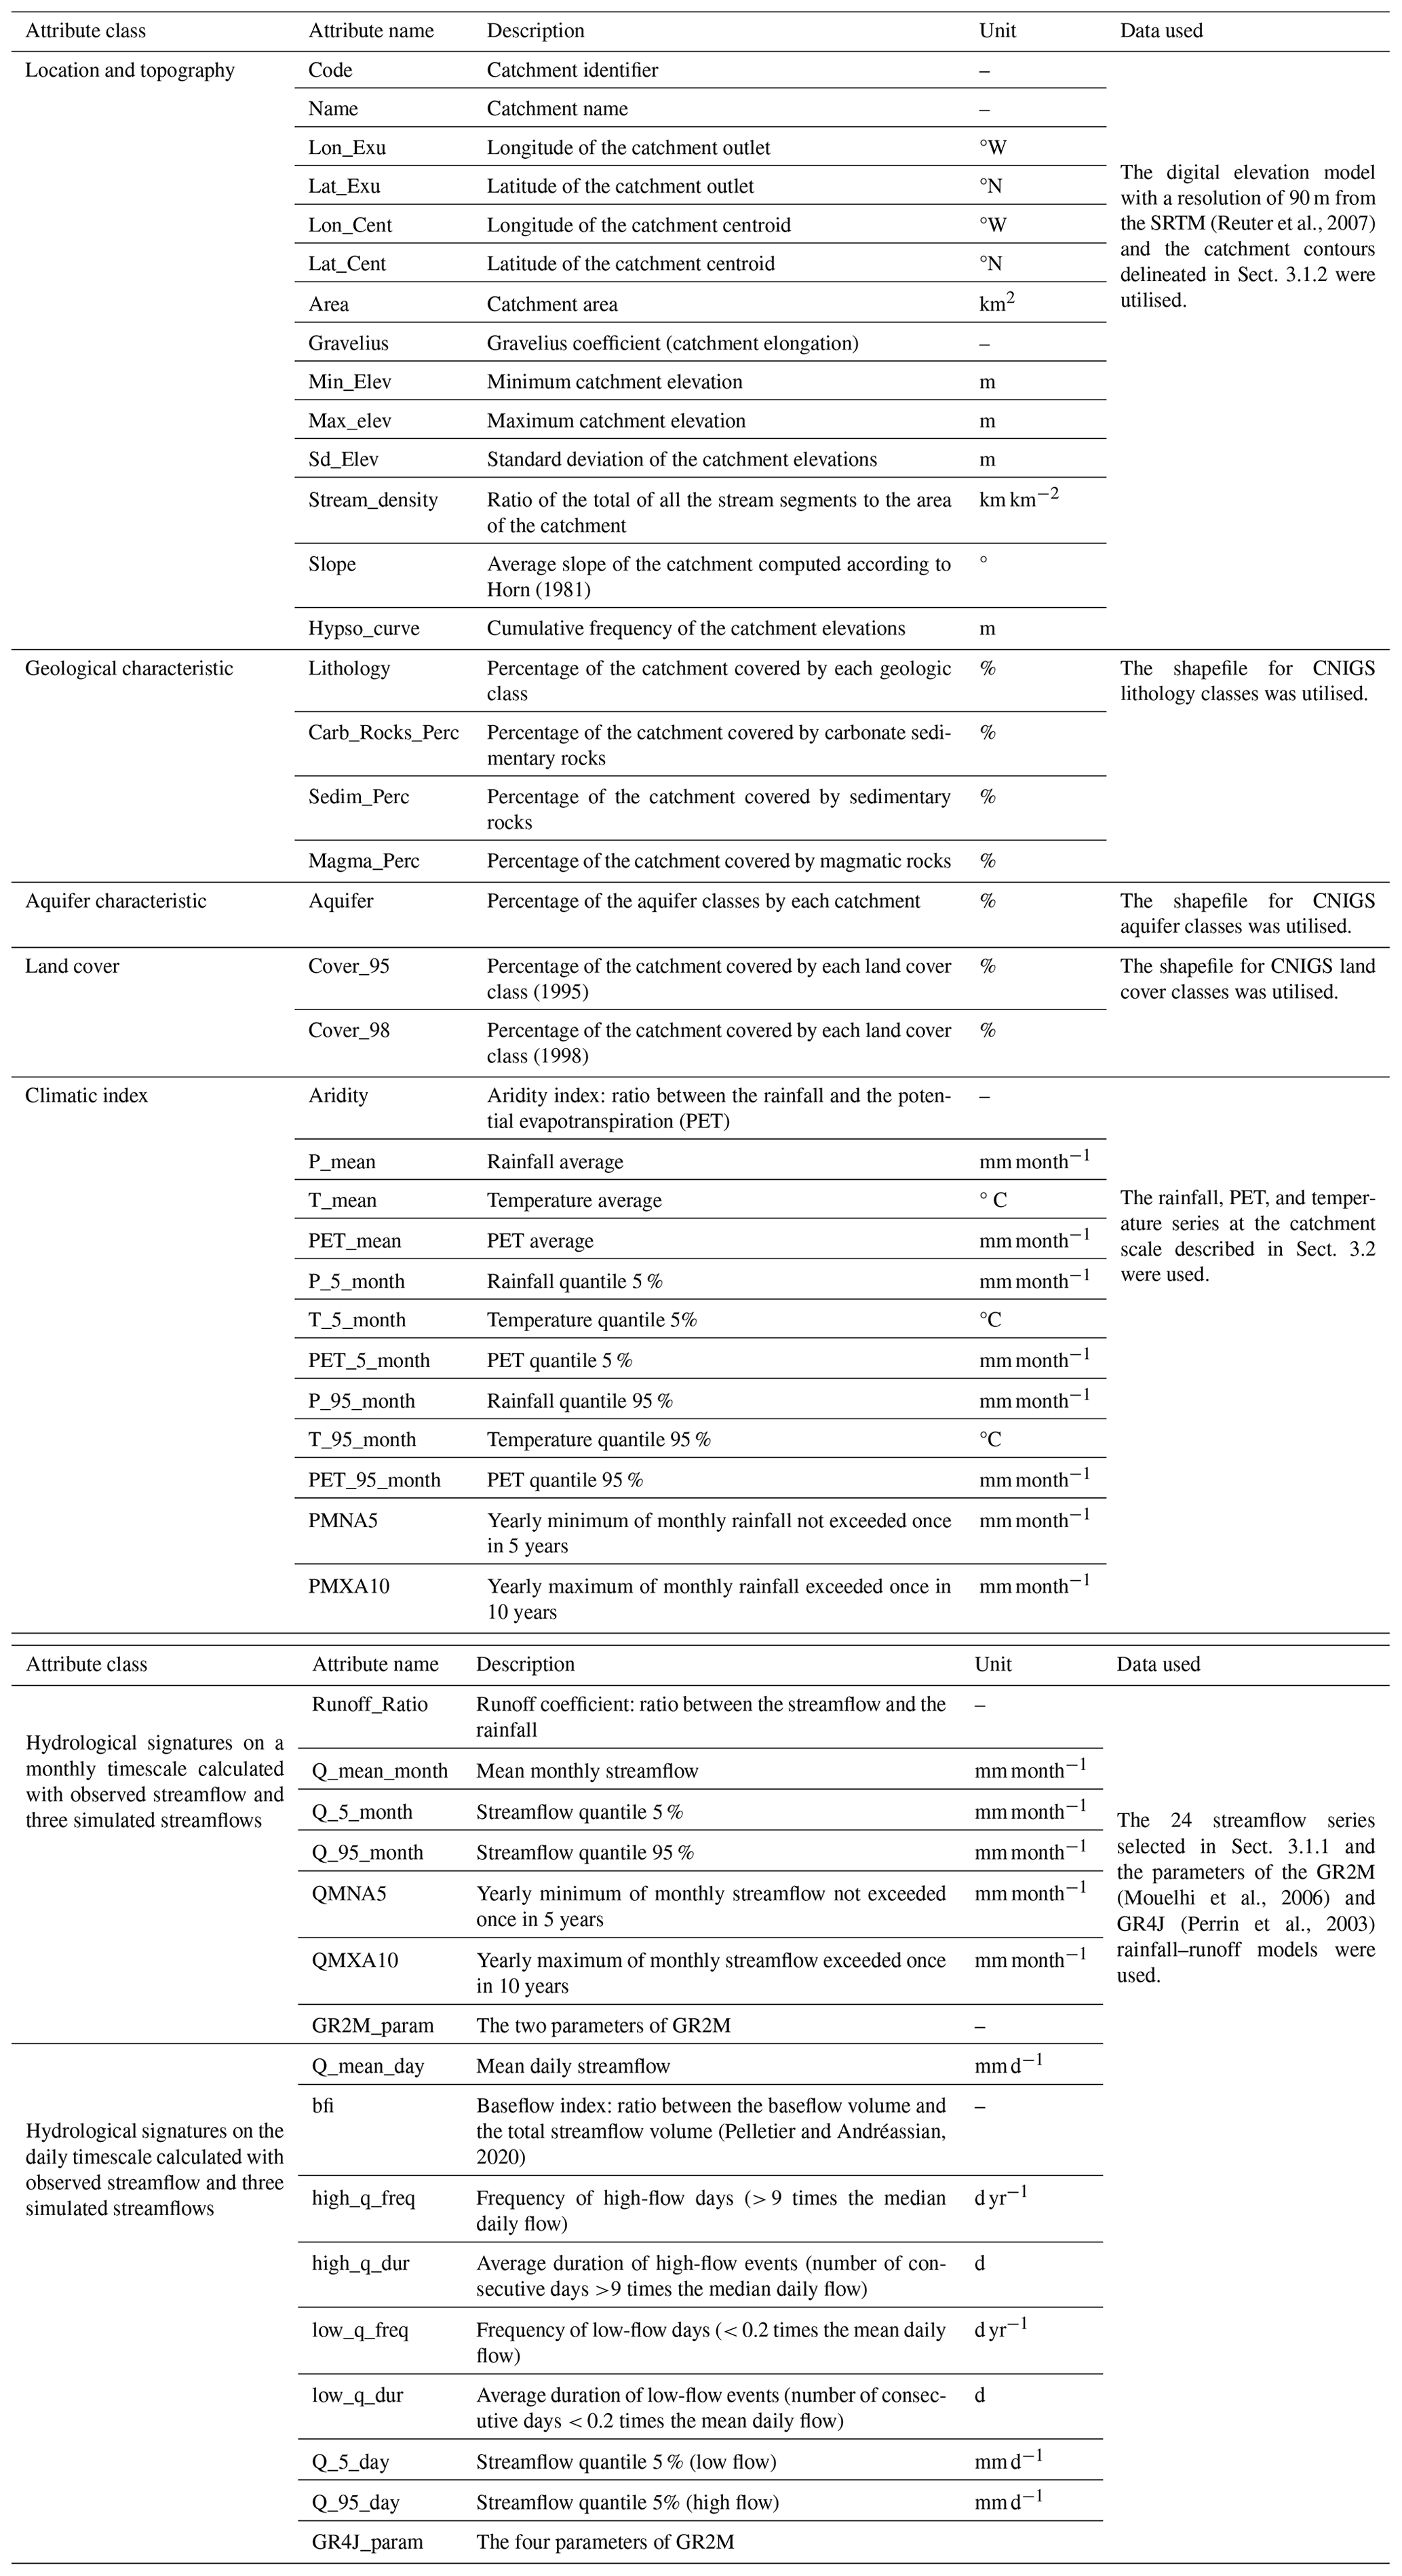
Similar to the CAMELS databases (Addor et al., 2017; Alvarez-Garreton et al., 2018; Chagas et al., 2020; Coxon et al., 2020; Fowler et al., 2021; Klingler et al., 2021), a set of attributes that describes a broad range of low-, moderate-, and high-precipitation and streamflow characteristics was chosen to characterise the hydrological regime of each catchment. Thus, 49 attributes grouped into six classes (14 topographical attributes, 12 climatic attributes, 16 hydrological signatures, 2 land cover attributes, 4 geological attributes, and 1 hydrogeological attribute) were calculated (see Table C3 in Appendix C). Tables 2 and 3 summarise all the datasets used and produced in this study.
3.5.1 Location and topography attributes
Table C3 presents the six location indices that were calculated. Catchments are identified by the same codes as the hydrographic stations, in the format Q-XXX, where XXX ranges from 001 to 070 to identify the 70 hydrographic stations. The catchments have the same names as the hydrographic stations and are taken from the hydrographic bulletins. The longitudes and latitudes of the outlets correspond to those of the hydrometric stations presented in Sect. 3.1.2 (and include coordinate modification). The longitudes and latitudes of the catchment centroids were calculated based on the catchment contours delineated in Sect. 3.1.2.
The topographic attributes include area, elevation, slope, catchment elongation, and drainage density. Catchment areas were calculated using the SRTM digital terrain model and the TauDEM algorithm (see Sect. 3.1.2). Elevation is a key factor in hydrological processes as it influences many other catchment characteristics (Addor et al., 2017). Therefore, minimum and maximum elevations, standard deviations, hypsometric curves (empirical elevation distribution function), and average catchment slopes were calculated using the SRTM digital terrain model. The average slopes of the catchments were calculated using the SRTM digital terrain model and the algorithm of Horn (1981). The Gravelius index, which provides information on the elongation of the catchment and therefore influences the hydrograph, was calculated. The Gavelius index is defined as the ratio of the perimeter of the catchment to the circumference of a circle with the same area (Bendjoudi and Hubert, 2002). Finally, stream density, the ratio of the total of all stream segments to the area of the catchment, was calculated using the CNIGS river network shapefile. The stream density is influenced by the density of the hydrographic network and therefore by the permeability of the catchment.
3.5.2 Climatic attributes
The 12 climatic attributes (see Table C3) were determined using the monthly time series of rainfall, air temperature, and potential evapotranspiration at the catchment scale, which are available for the 1920–1940 period. These attributes include the P_5_month, T_5_month, and PET_5_month indices, representing the 5th percentile of rainfall, temperature, and potential evapotranspiration as well as the PMNA5 index (yearly minimum of monthly rainfall not exceeded once in 5 years), which represent the low values. The P_mean, T_mean, and PET_mean indices represent the mean values of precipitation, air temperature, and potential evapotranspiration. The P_95_month, T_95_month, and PET_95_month indices represent the 95th percentile of precipitation, air temperature, and potential evapotranspiration, while the PMXA10 index (yearly maximum of monthly rainfall exceeded once in 10 years) represents the highest values. The return periods of the PMNA5 and PMXA10 indices were calculated using the generalised extreme value (Beirlant et al., 2004; Coles, 2001; Jenkinson, 1955). Finally, the aridity index was calculated. This index is the ratio of average rainfall to average evapotranspiration.
3.5.3 Hydrological signatures
The 16 hydrological attributes (see Table C3) for the 24 catchments studied were calculated using the observed and simulated streamflow time series available for the period 1920–1940 (see Sect. 3.4). There are four indicators for each of the hydrological signatures (one indicator for observed streamflow and three indicators for simulated streamflow series). These attributes include Q_5_month (5th percentile of monthly data), Q_5_day (5th percentile of daily data), QMNA5 (yearly minimum of monthly streamflow not exceeded once in 5 years), low_q_freq (frequency of low-flow days; <0.2 times the mean daily flow), and low_q_dur (average duration of low-flow events; the number of consecutive days <0.2 times the mean daily flow) indices, which characterise the frequency, duration, and magnitude of low flows. The Q_mean_month and Q_mean_day indices were used to characterise average flows at the daily and monthly time steps. The Q_95_month (95th percentile of monthly data), Q_95_day (95th percentile of daily data), QMXA10 (yearly maximum of monthly streamflow exceeded once in 10 years), high_q_freq (frequency of high-flow days; > 9 times the median daily flow), and high_q_ dur (average duration of high-flow events; number of consecutive days > 9 times the median daily flow) indices were used to characterise the frequency, duration, and magnitude of high flows. Additionally, the runoff coefficients, baseflow index calculated according to the method proposed by Pelletier and Andréassian (2020), and parameters of the GR2M and GR4J models (see Sect. 3.4) were provided.
3.5.4 Land cover
Land cover data for Haiti are provided by the CNIGS and are only available for two years: 1995 and 1998.
Although the land cover classifications used in 1998 differ from those used in 1995, Fig. 3 illustrates that most of the woodland areas in 1995 were converted to cropland, grassland, or savannah in 1998. According to the 1998 classification, medium-density cropland is the most dominant land use, accounting for a quarter of the total territory. High-density agroforestry systems occupy 18 %, high-density agricultural crops 17 %, savannah 7.3 %, pasture with other uses 4.7 %, wetlands 4.4 %, rock outcrops and bare ground 1.8 %, and forest 1.25 %. The area of other types of use is generally less than 1 % of the territory.
Shapefiles of land cover data (1995 and 1998) were cropped for each of the catchments studied. The proportion of each land cover class occupying the catchment was then calculated, corresponding to the two land cover indices calculated in Simbi: cover_95 (percentage of the catchment covered by each land cover class in 1995) and cover_98 (percentage of the catchment covered by each land cover class in 1998).
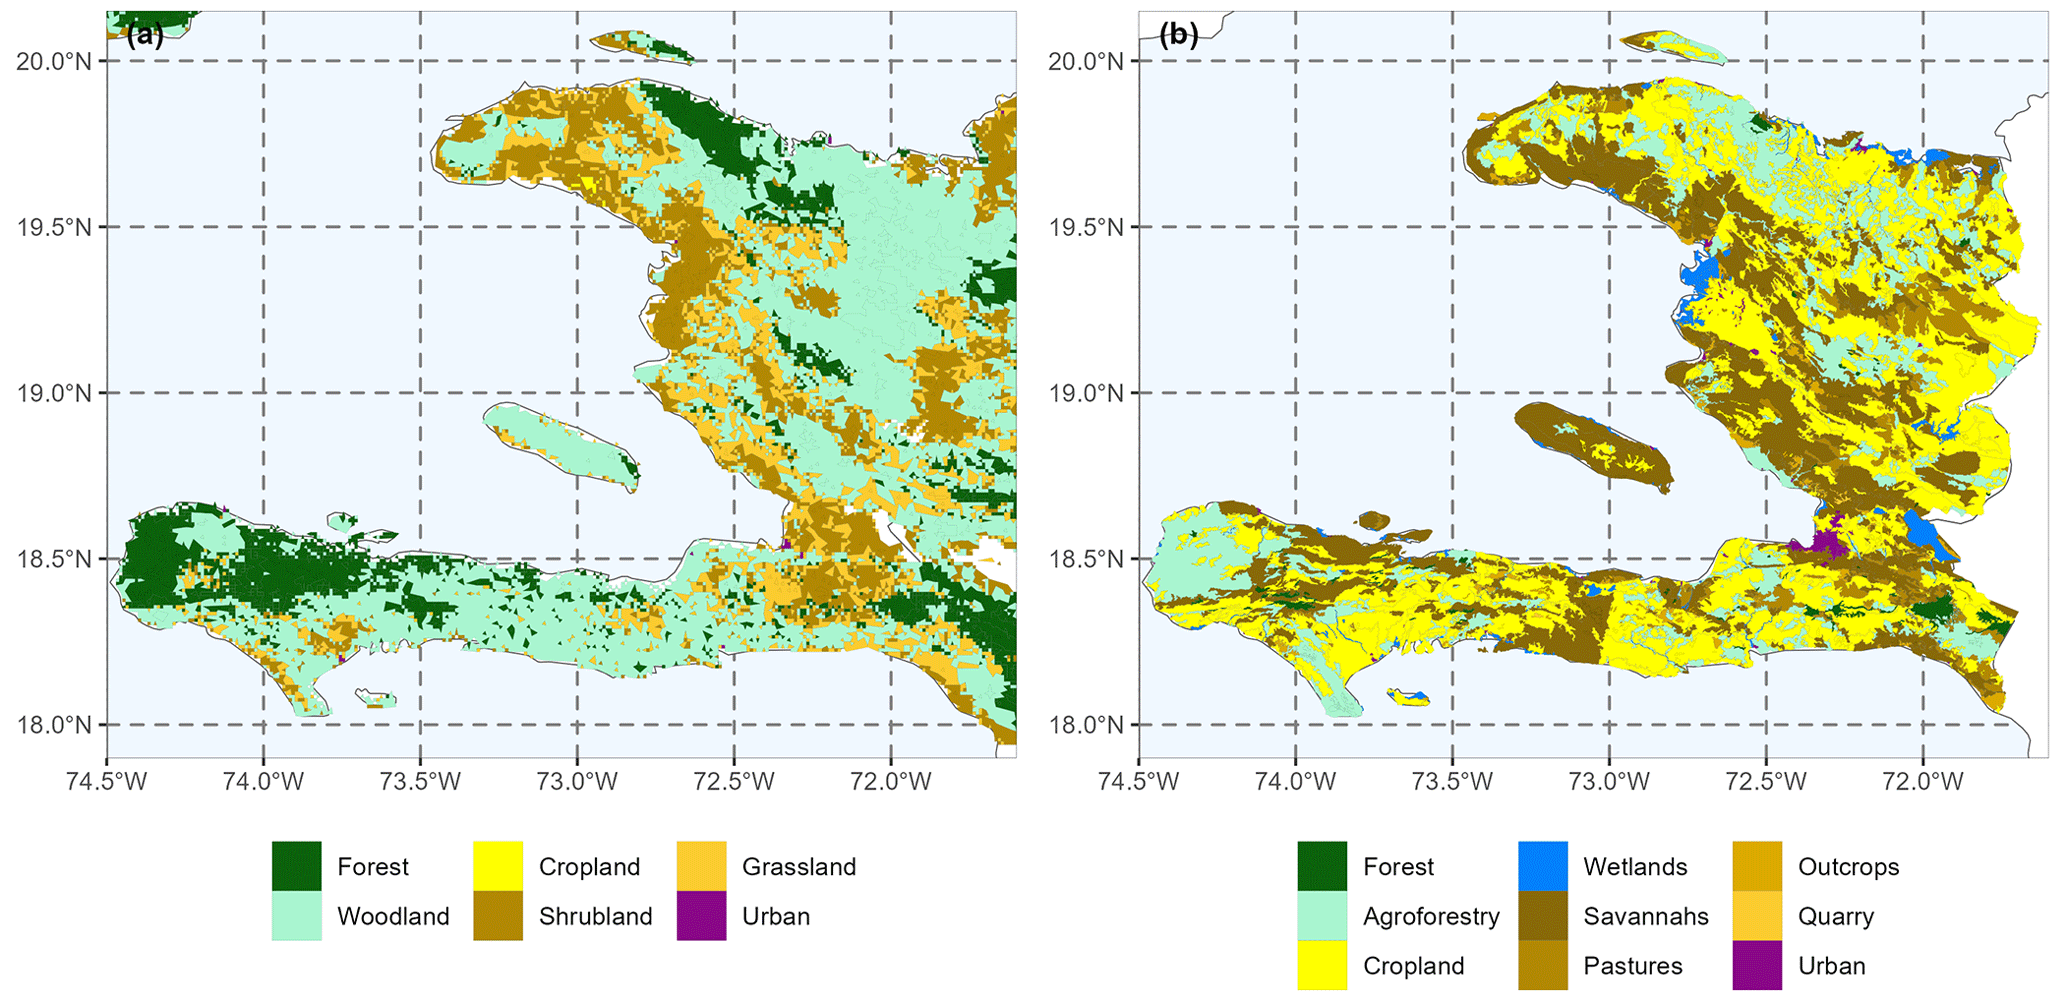
Figure 3(a) The 1995 land cover map and (b) the 1998 land cover map provided by the CNIGS.
3.5.5 Geological attributes
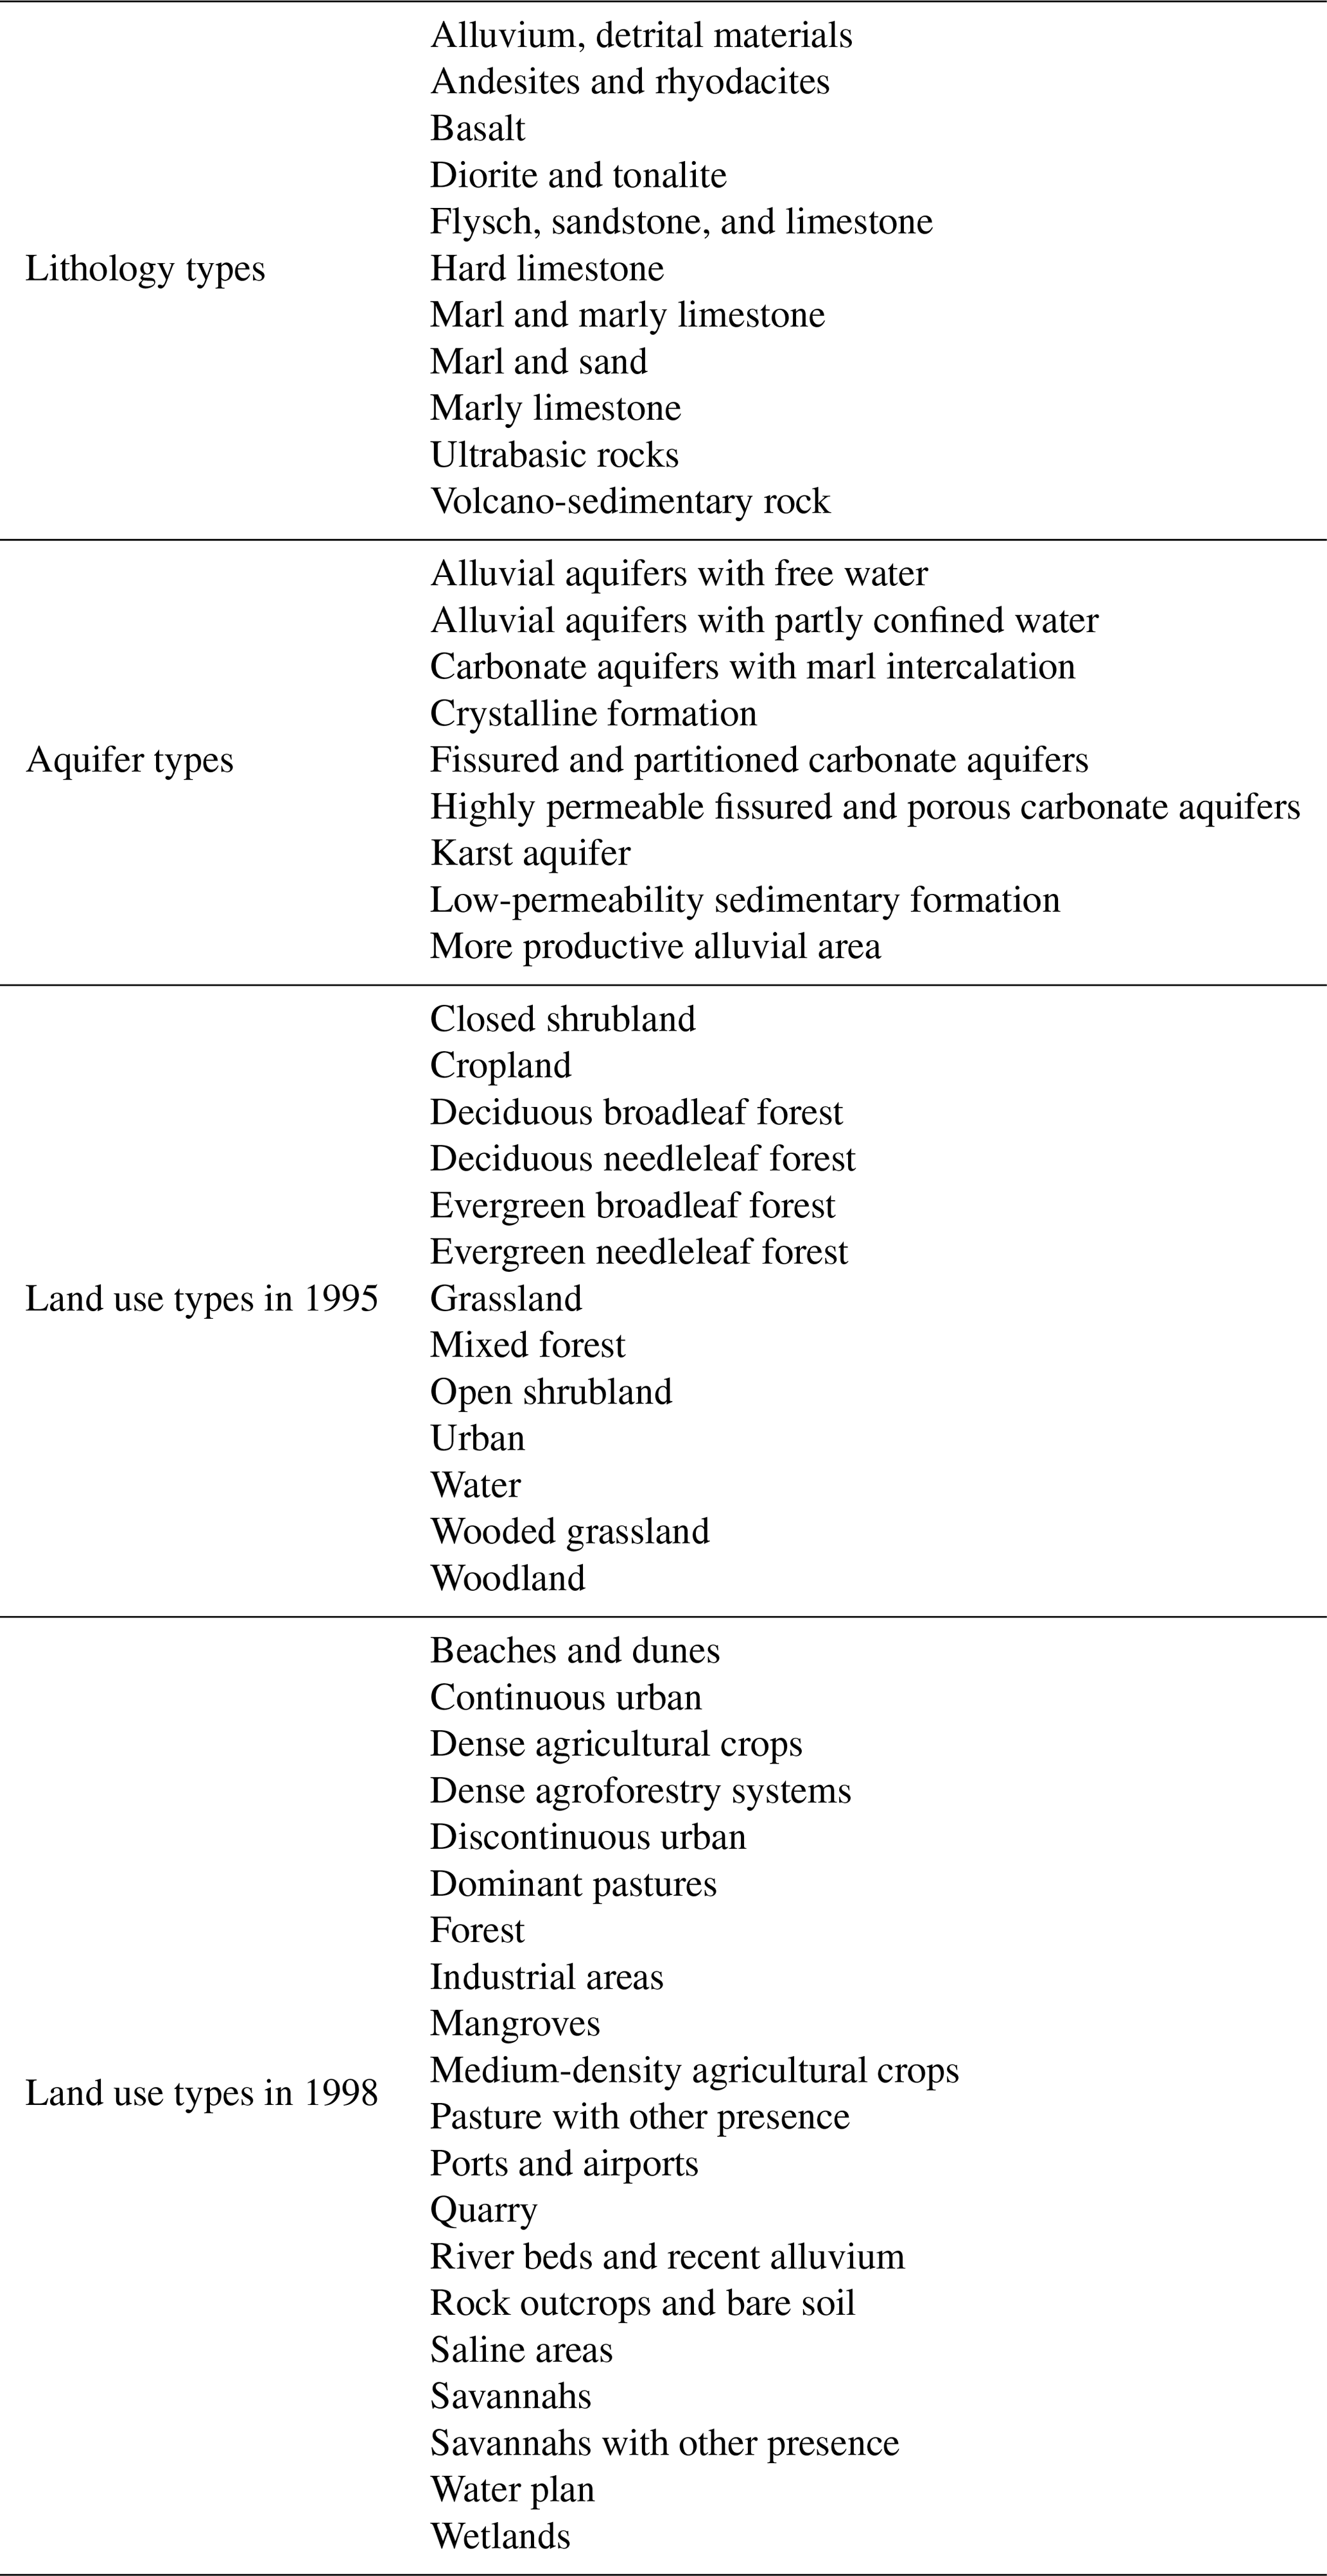
The geological data provided by Butterlin (1960), Boisson and Pubellier (1987), and Terrier et al. (2014) have been used and have been made available by the CNIGS. The most common lithology types in Haiti are calcareous sedimentary rocks, followed by magmatic rocks (see Fig. 4). The shapefile of lithology types has been cropped for each of the catchment studied (Table C4 shows the list of geological classes). The proportion of each lithology class in the catchment was calculated, corresponding to the “lithology” index. The proportion of carbonate rocks, sedimentary rocks, and magmatic rocks has been calculated for each of the catchment and corresponds to the Carb_Rocks_Perc, Sedim_Perc, and Magma_Perc indices.
3.5.6 Aquifer attributes
The aquifer data were produced by the MARNDR (Ministry of Agriculture, Natural Resources and Rural Development) in the 1990s and have been used and have been made available by the CNIGS. Carbonate aquifers are the most widespread in Haiti, consist of carbonate rocks (mainly limestone and marl), and cover 53 % of Haiti's surface area, of which karstic aquifers account for 18 %. Crystalline formations, mainly magmatic rocks, account for 17 %, alluvial aquifers for 16 %, and low-permeability sedimentary formations for 13 %. Figure 4 shows the spatial distribution of the different aquifer classes and Table C4 shows the list of aquifer classes. The shapefile of aquifer classes has been cropped for each of the catchments studied. The proportion of each class in a catchment was then calculated, corresponding to the “aquifer” index.
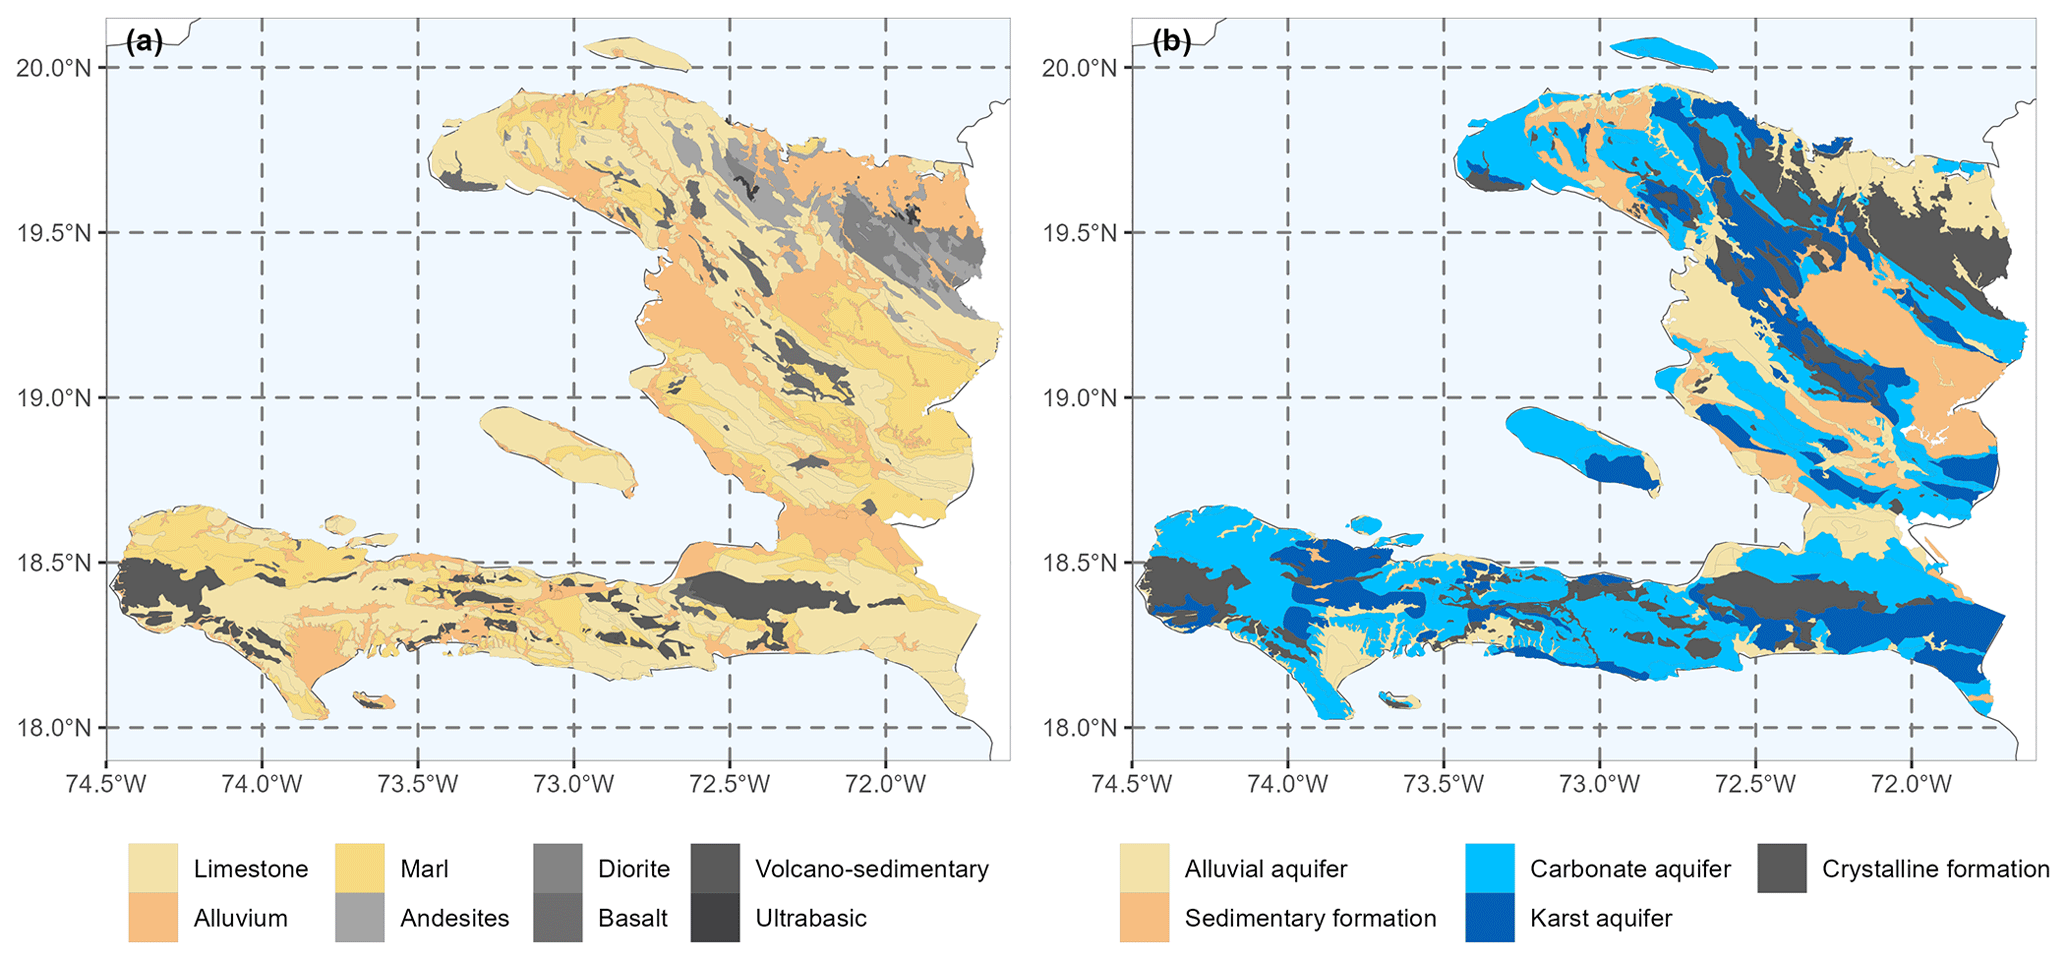
Figure 4(a) Lithological classes are represented by light colours for sedimentary rocks and shades of grey for magmatic rocks. (b) Aquifer classes are represented by light colours for alluvial aquifers, blue colours for carbonate aquifers, and grey for crystalline aquifers.
4.1 Impact of air temperature and PET series on rainfall–runoff modelling
Figure 5 shows (i) the relationship between digitised air temperatures (BHS) and the 20CR and BEST reanalyses (panels (a) to (c)) as well as (ii) the performance (KGE score) and parameters of the GR2M model (panels (d) to (f)) using the three air temperature databases to compute PET series. The BEST database overestimates the mean air temperature (symbolised by the red dots in the boxplots in Fig. 5a), and 20CR has difficulty representing temperatures below 20 °C and over 28 °C. The low dispersion (Fig. 5b) of 20CR and BEST may be due to spatial averaging effects at the scale of the grid boxes, which are large for the study area (1° for both). In addition, there is no linear correlation between the two temperature databases, and the 20CR data poorly represent the seasonal temperature variability in Haiti (Fig. 5c).
Although there is no clear correlation between the digitised and reanalysis temperatures, the KGE values (KGE in the evaluation for the two sub-periods) obtained with the three air temperature databases are very similar for most of the catchments (Fig. 5d). This shows that the GR2M model, through its two parameters and especially the X2 parameter (Fig. 5f), has the ability to absorb the potential biases associated with the air temperature data.
Thus, the three temperature databases could be used a priori for rainfall–runoff modelling, as the model parameters absorb the associated biases. However, since the reanalysis databases do not represent temperature well at the catchment scale, they will not be used in the remainder of this study. Therefore, the digitised temperatures will be used to build the Simbi database.
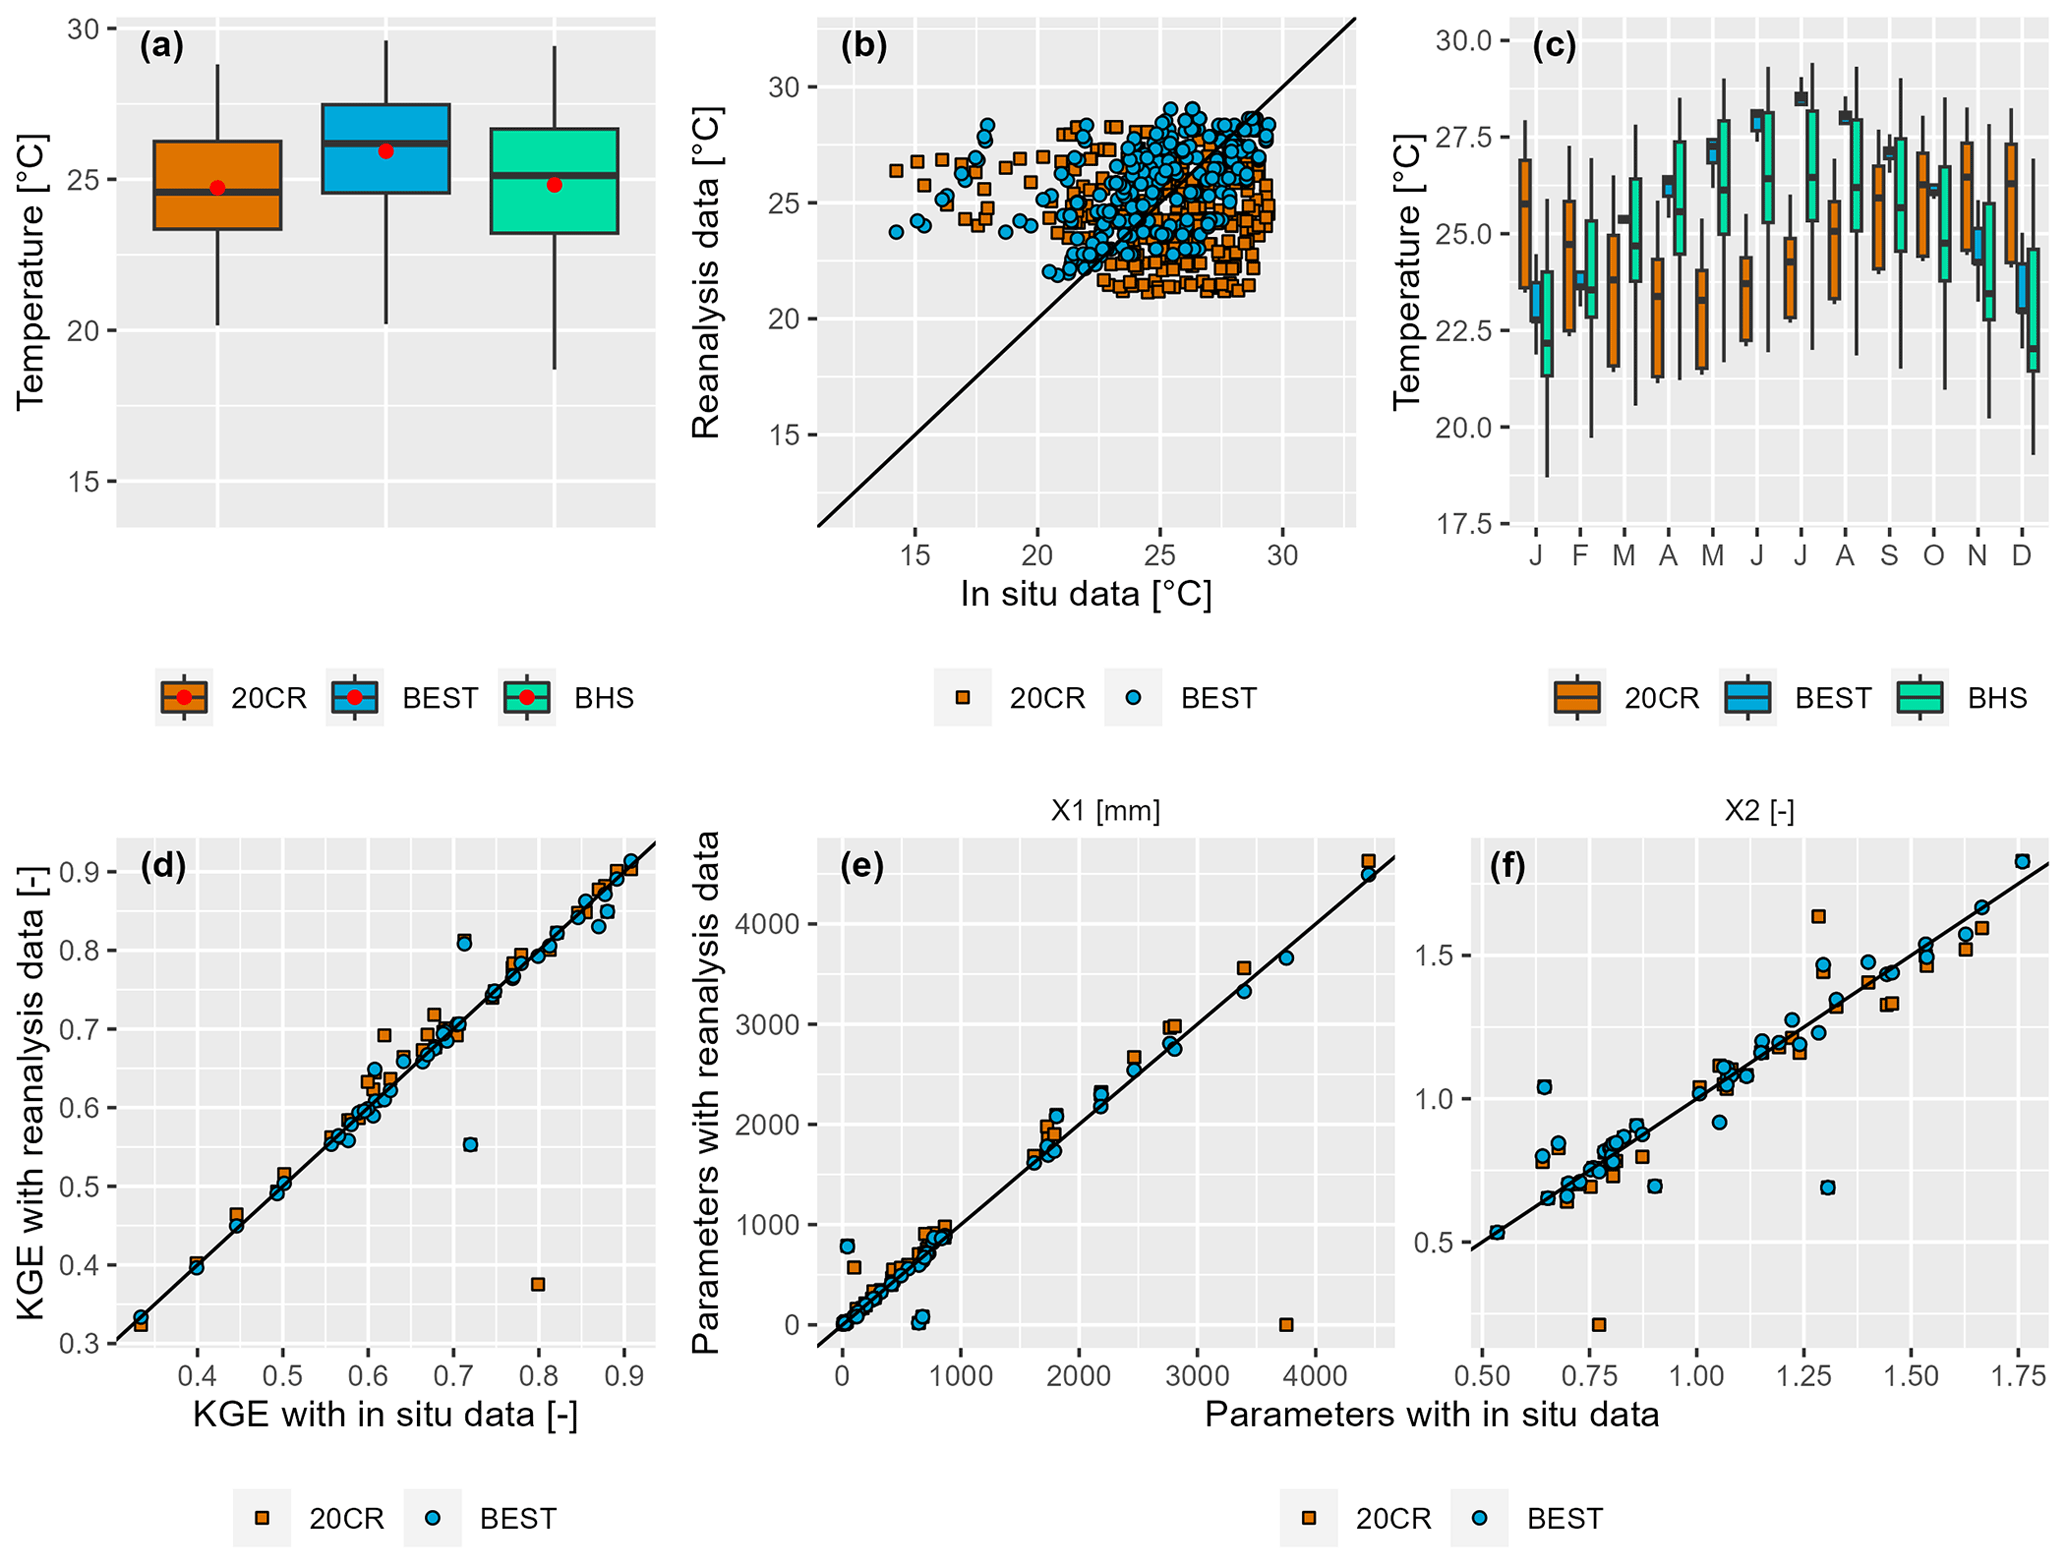
Figure 5(a) Monthly air temperatures at the catchment scale for the three datasets (20CR, BEST, and BHS data observed in situ). (b) Monthly air temperatures at the catchment scale from in situ data versus reanalyses (20CR and BEST). (c) Seasonal temperature variability as a boxplot (each boxplot represents monthly temperatures for all the catchments). (d) KGE values in the evaluation for the two sub-periods. Panels (e) and (f) show the GR2M parameters X1 and X2 obtained with in situ air temperatures versus those obtained with reanalysis air temperatures.
4.2 Selection of relevant rain gauges
4.2.1 GR2M performance analysis
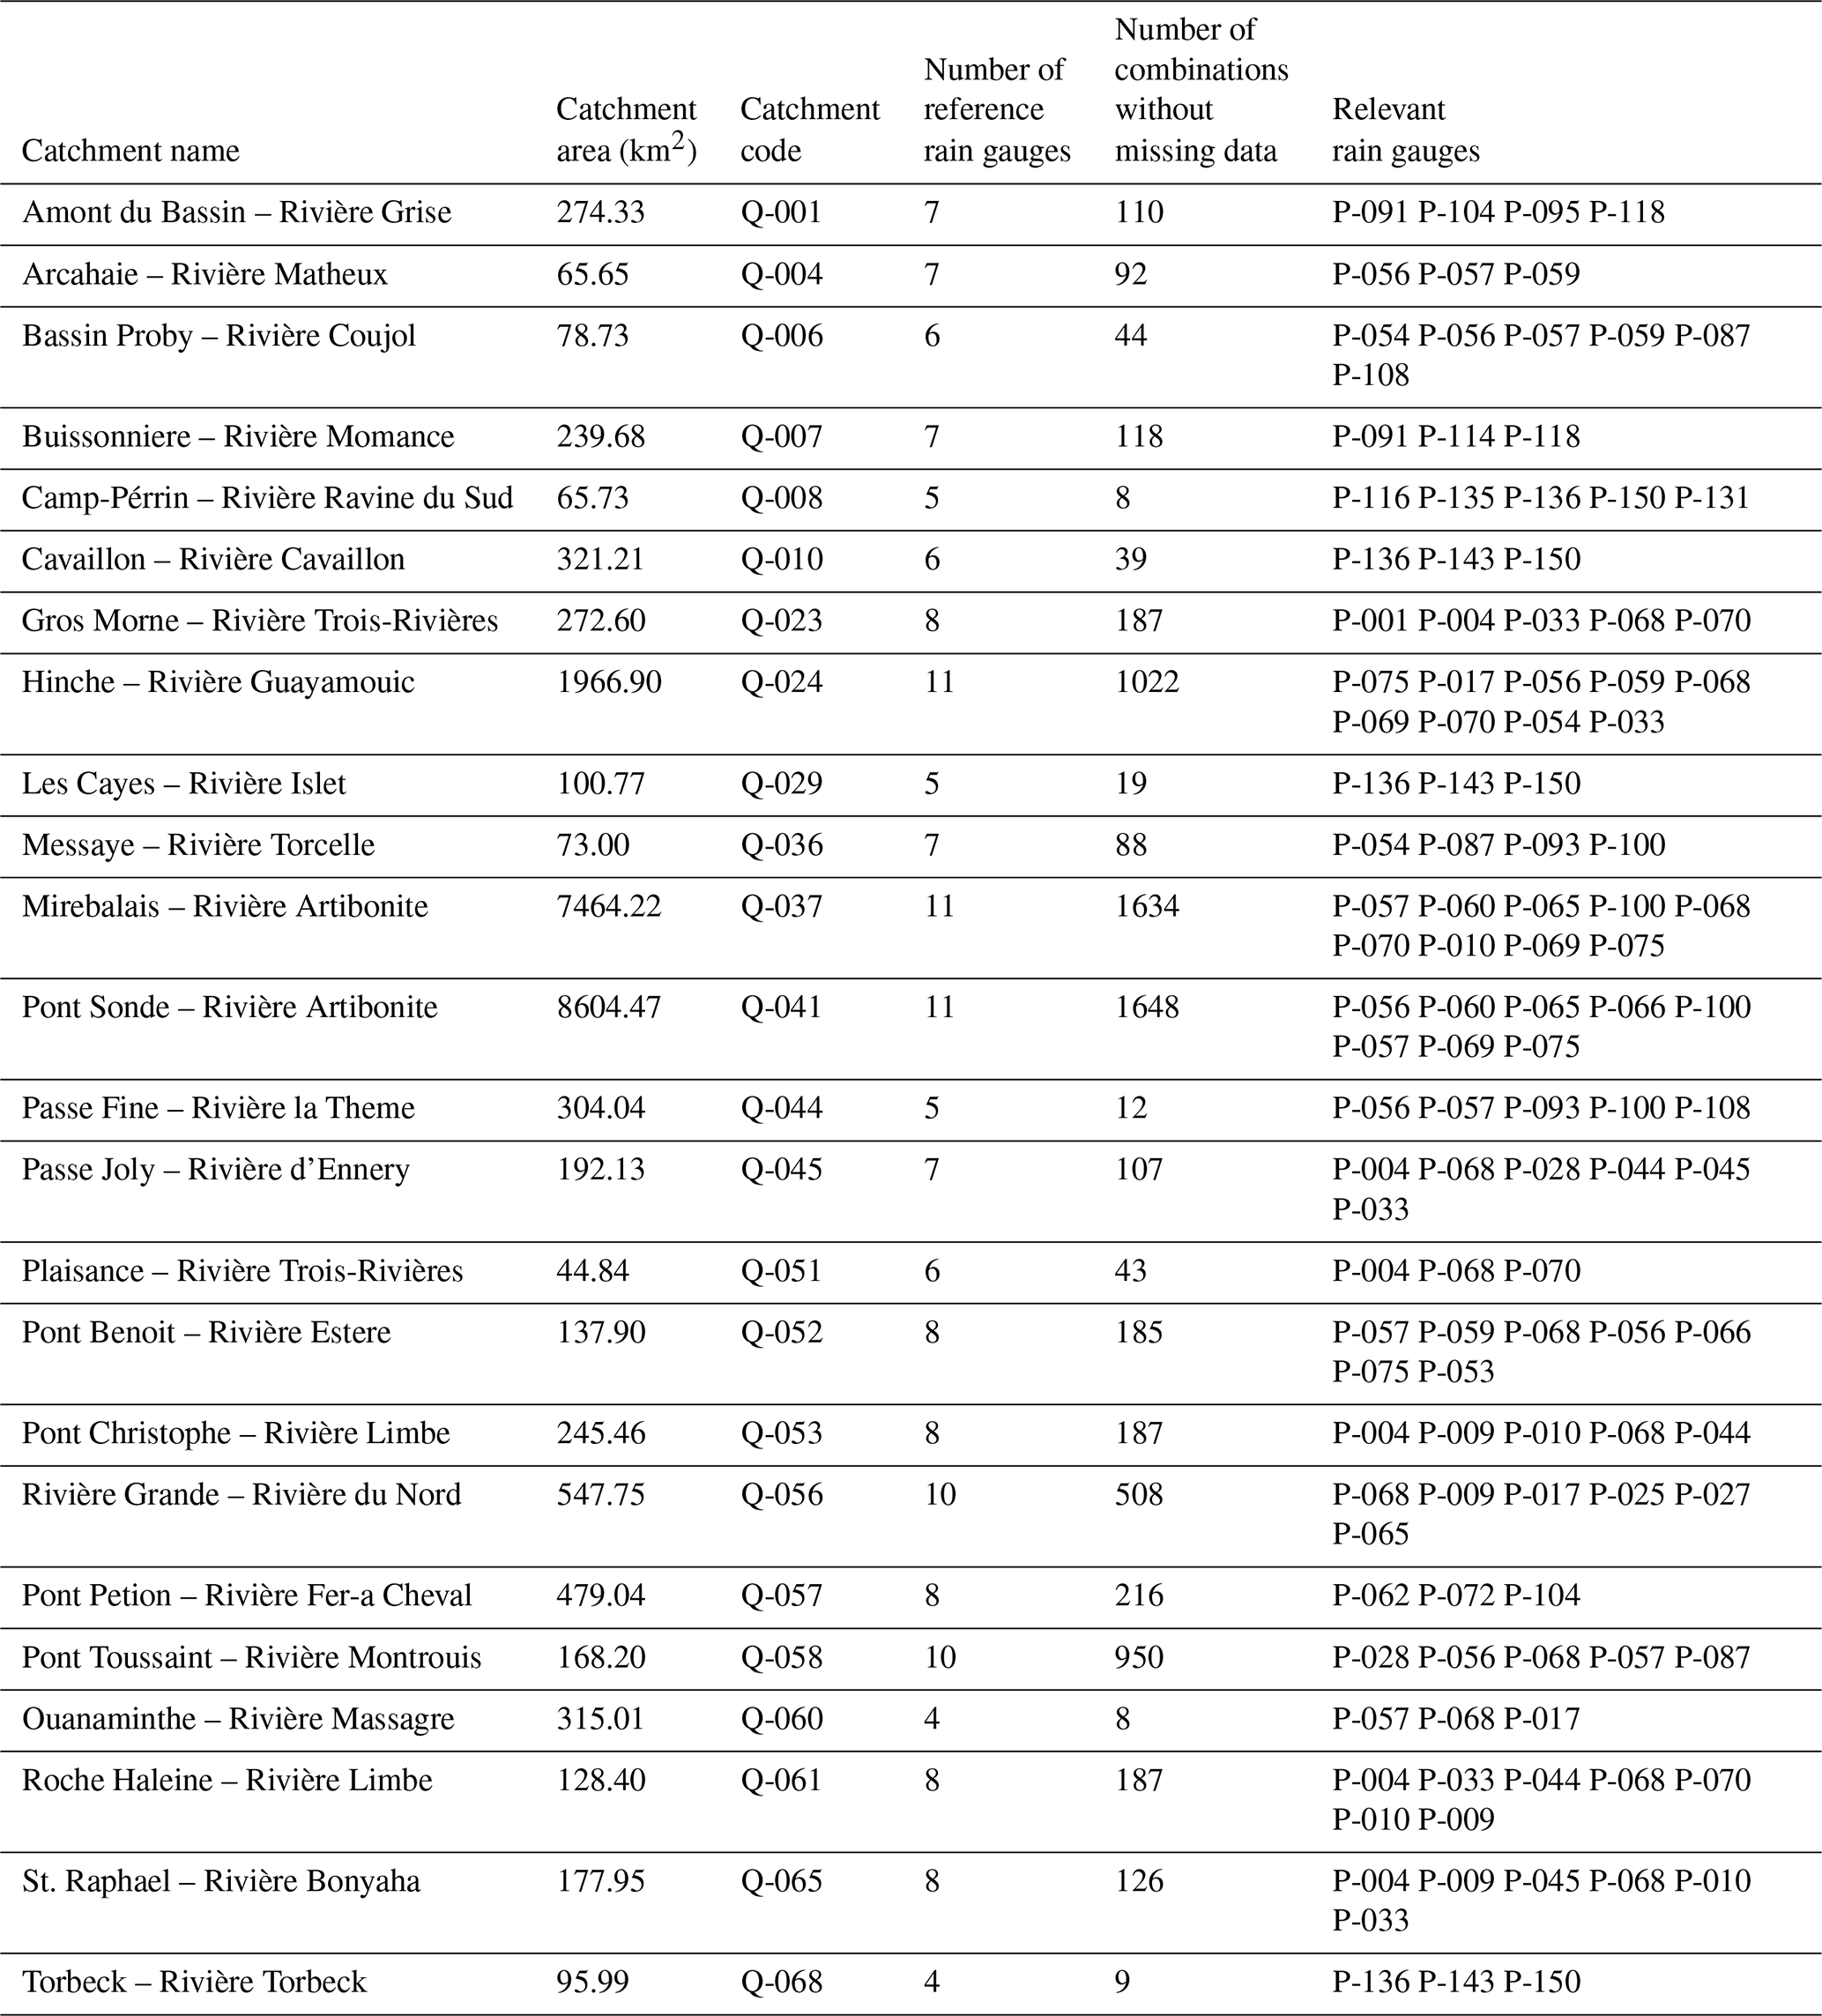
Reference rainfall and rainfall from all possible combinations of rain gauges were calculated at the catchment scale as described in Sect. 3.2.1. Table C2 in Appendix C presents the number of rain gauges used to calculate the reference rainfall, the number of combinations, and the most relevant rain gauges for rainfall–runoff modelling for each of the catchments.
Figure 6 shows a summary of the GR2M KGE scores and its three components obtained with NOAA 20CR rainfall, reference rainfall, and relevant rain-gauge combinations. The lowest KGE scores are obtained with NOAA 20CR rainfall, highlighting the limitations of this rainfall database for rainfall–runoff modelling in Haiti and the need to use observed data rather than reanalyses. There is also a clear improvement in KGE values when using the relevant rain gauges compared to the reference rain gauges. Nevertheless, some catchments have poor KGE scores in evaluation, despite the use of relevant rain gauges. Among the three components of the KGE, the correlation coefficient (r) contributes most to the improvement in model performance through the use of ground-based rainfall data. Indeed, there is a weak correlation between the simulated and observed streamflow obtained with NOAA 20CR rainfall data, and this correlation is greatly improved by using observed in situ rainfall data (reference rain gauges and relevant rain gauges). On the other hand, the coefficients α and β, which represent variability and bias, respectively, contribute most to the improvement of the model performance using the relevant rain gauges compared to the reference rain gauges. The values of these coefficients are much more centred around the optimal value of 1 for the relevant rain gauges, while they are more scattered for the reference rain gauges.
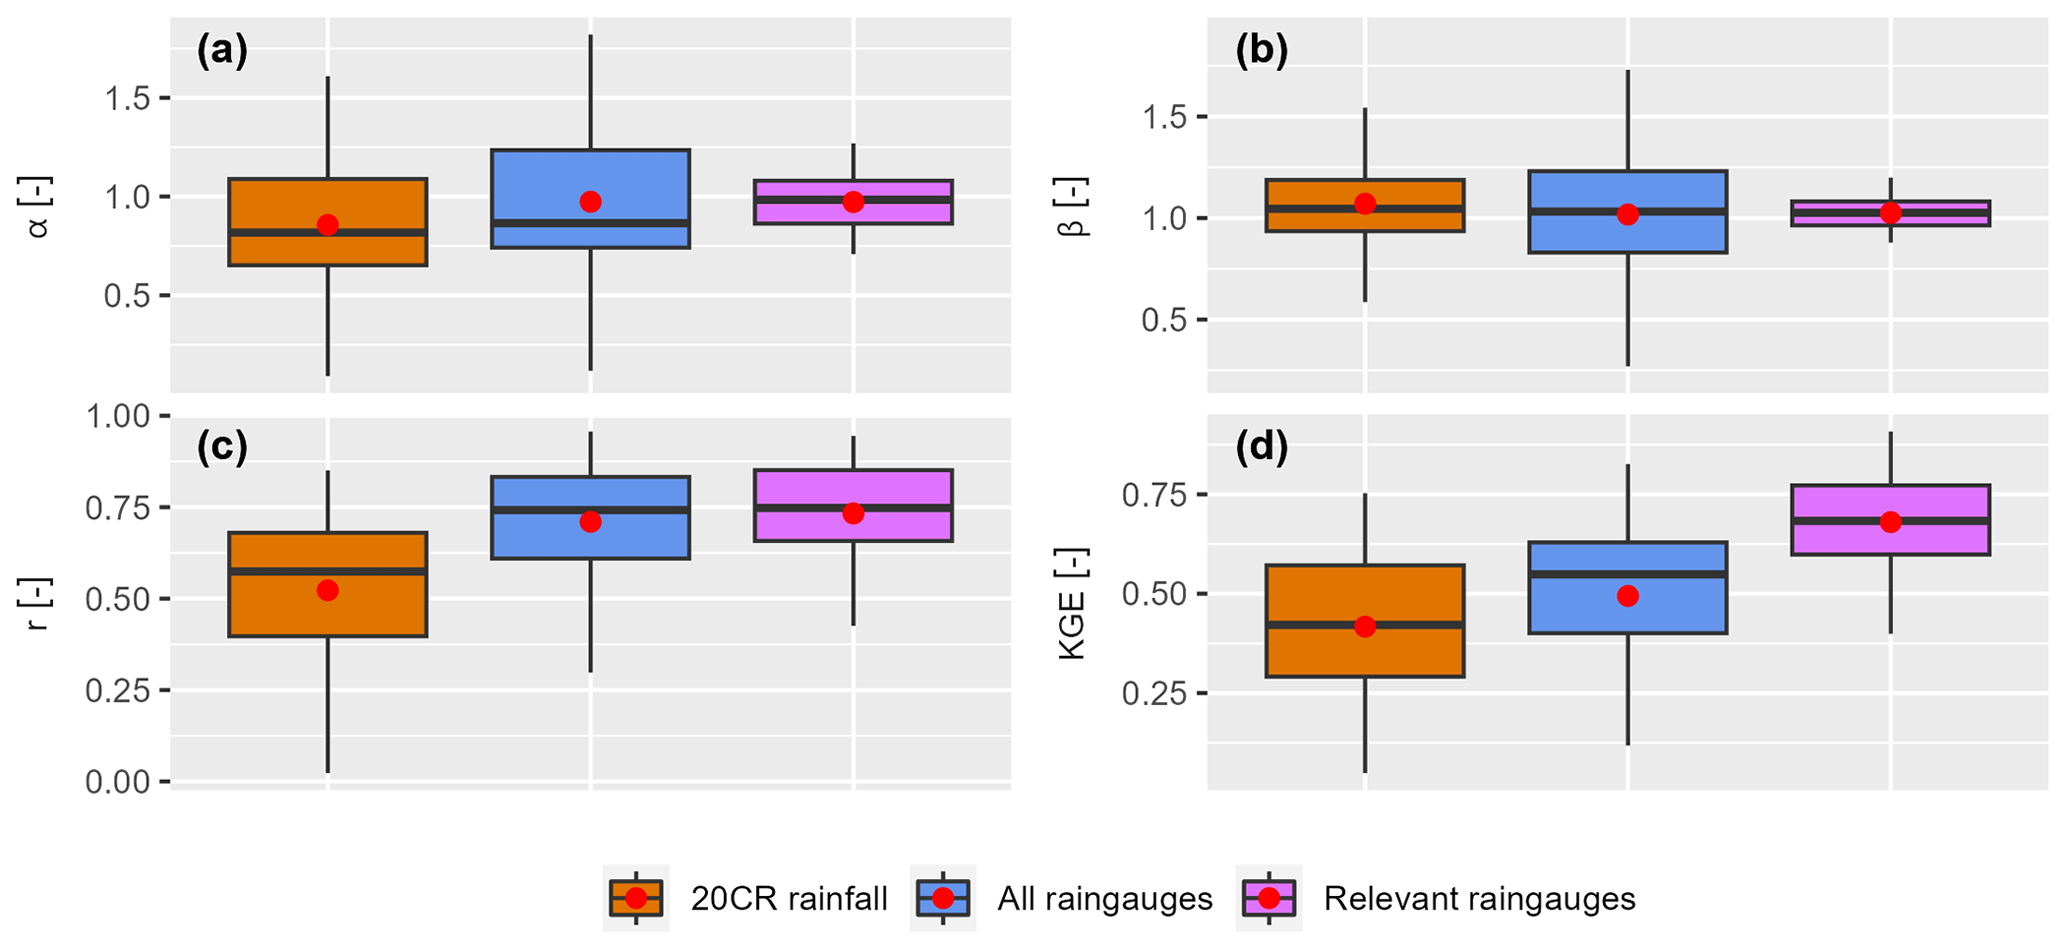
Figure 6Panels (a) to (d) give a summary of GR2M KGE scores and their three components obtained in evaluation with NOAA 20CR rainfall, reference rainfall, and relevant rain-gauge combinations for the 24 studied catchments.
Figure 7 shows the spatial distribution of GR2M KGE scores in evaluation using the three rainfall databases. As discussed earlier, the KGE scores in evaluation with 20CR data are low, with only five catchments having KGE scores over 0.60. The performance improved for 21 catchments with the relevant rain-gauge combination, and no improvement was achieved for three catchments only: the catchments of Tumbe at Passe Fine (Q-044), Rivière du Sud at Camp-Pérrin (Q-008), and Coujol at Proby (Q-006). Two of these three catchments (Q-044 and Q-008) were already performing relatively well, with an average KGE in the evaluation of over 0.60, and the use of the relevant rain-gauge combinations did not improve their performance further. Despite the use of relevant rain gauges, four catchments have KGE values below 0.50, two of which have negative or near-zero KGE values: the Trois Rivières at the Plaisance catchment (Q-051) and the Montrouis at the Pont Toussaint catchment (Q-058).
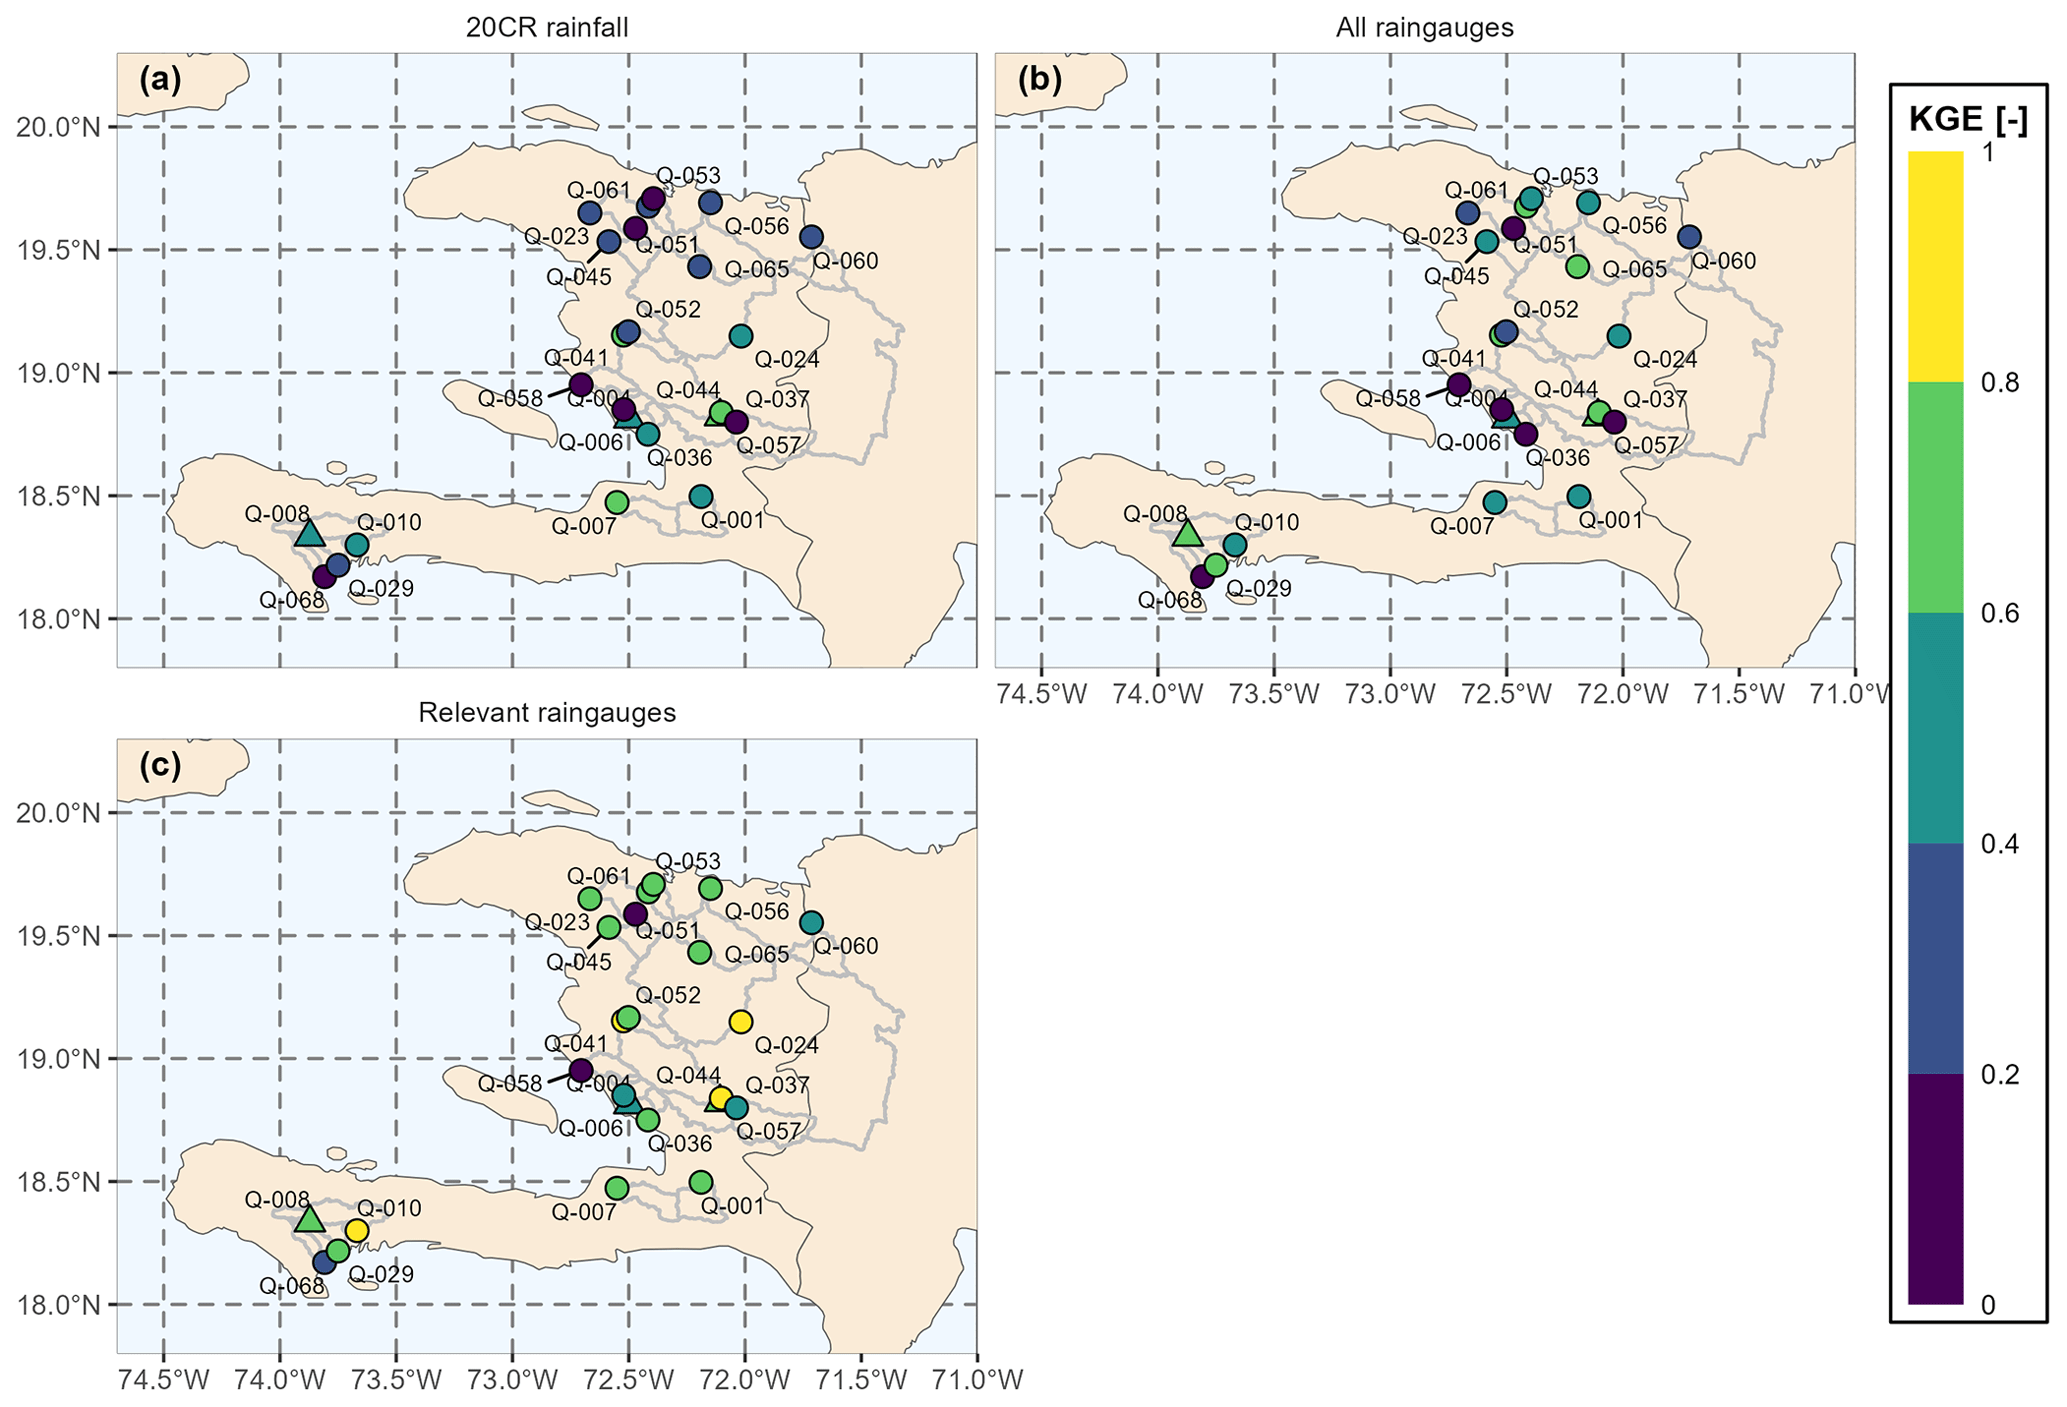
Figure 7Spatial distribution of the average of the two KGE values obtained with GR2M in evaluation for the two sub-periods. KGE values are calculated using (a) 20CR rainfall data, (b) reference rain gauges (all the rain gauges), and (c) relevant rain gauges. Dots represent catchments where model performance was improved by using the relevant rain-gauge combinations, and triangles represent catchments where model performance was not improved by using the relevant rain-gauge combinations.
4.2.2 Analysis of GR2M parameters
In Fig. 8, the influence of the relevant rain-gauge combinations on the stability of the model parameters is evaluated. The ratios of the parameters calibrated over the two calibration sub-periods were plotted as a boxplot for the reference and relevant rain-gauge combinations. The results showed that the relevant rain-gauge combinations led to more stable X1 and X2 parameters (ratio close to 1). Overall, the relevant rain gauges led to better performance and stability of the model parameters.
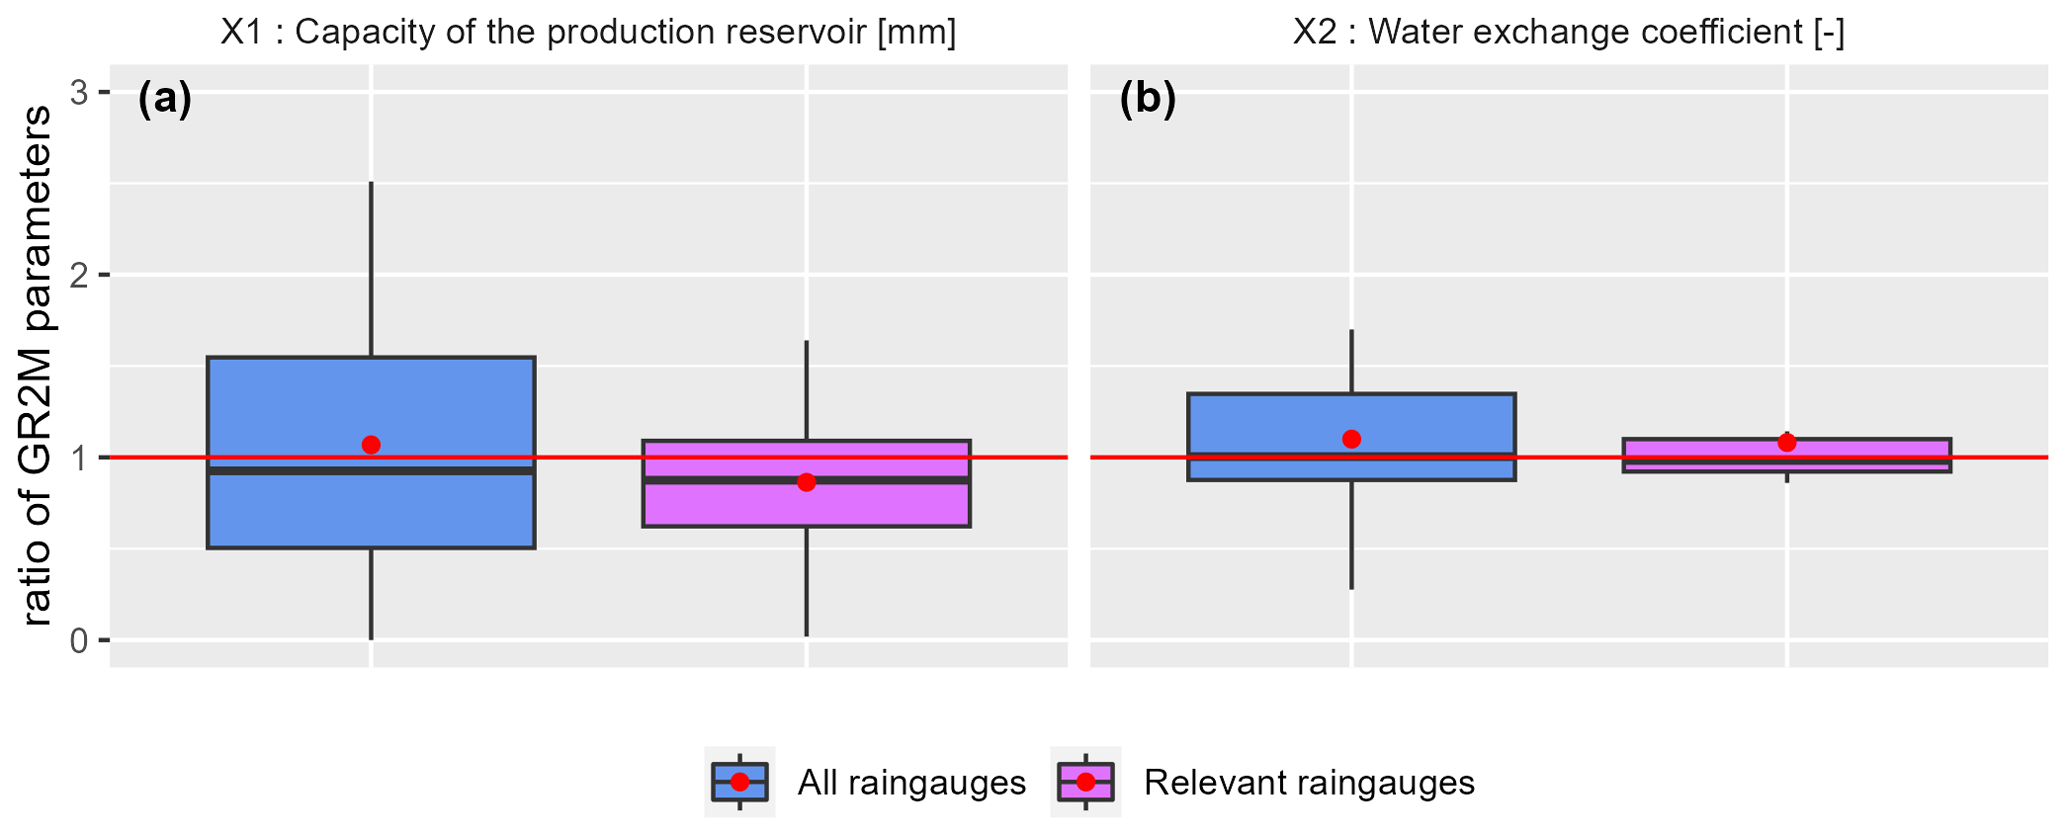
Figure 8Ratio of the GR2M-calibrated parameters X1 (a) and X2 (b) over the two sub-periods for the reference and relevant rain-gauge combinations. The red line represents the optimal ratio (r=1), while the red dot represents the mean value of the distribution.
4.2.3 Characteristics of relevant rain-gauge combinations
Figure 9 shows that the rain gauges used for the relevant rain-gauge combinations are those located at low elevations and with the longest data series. The relatively low percentage of missing data from the relevant rain gauges ensured better model stability (see Sect. 4.2.2) and contributed to the improvement in the model performance, especially by reducing the biases between simulated and observed streamflow (improvement in α and β parameters; see Sect. 4.2.1). Rain gauges at higher elevations are more difficult to access and are the least maintained, and therefore they have very high percentages of missing data (rain gauges with less than 10 years of data). However, the model tends to discard rain gauges with high percentages of missing data, which is why the retained or selected rain gauges are generally located at lower elevations. There is no clear trend of monthly rainfall in the selection of relevant rain gauges. However, some very wet rain gauges (rainfall totals over 180 mm month−1) were selected as relevant rain gauges.
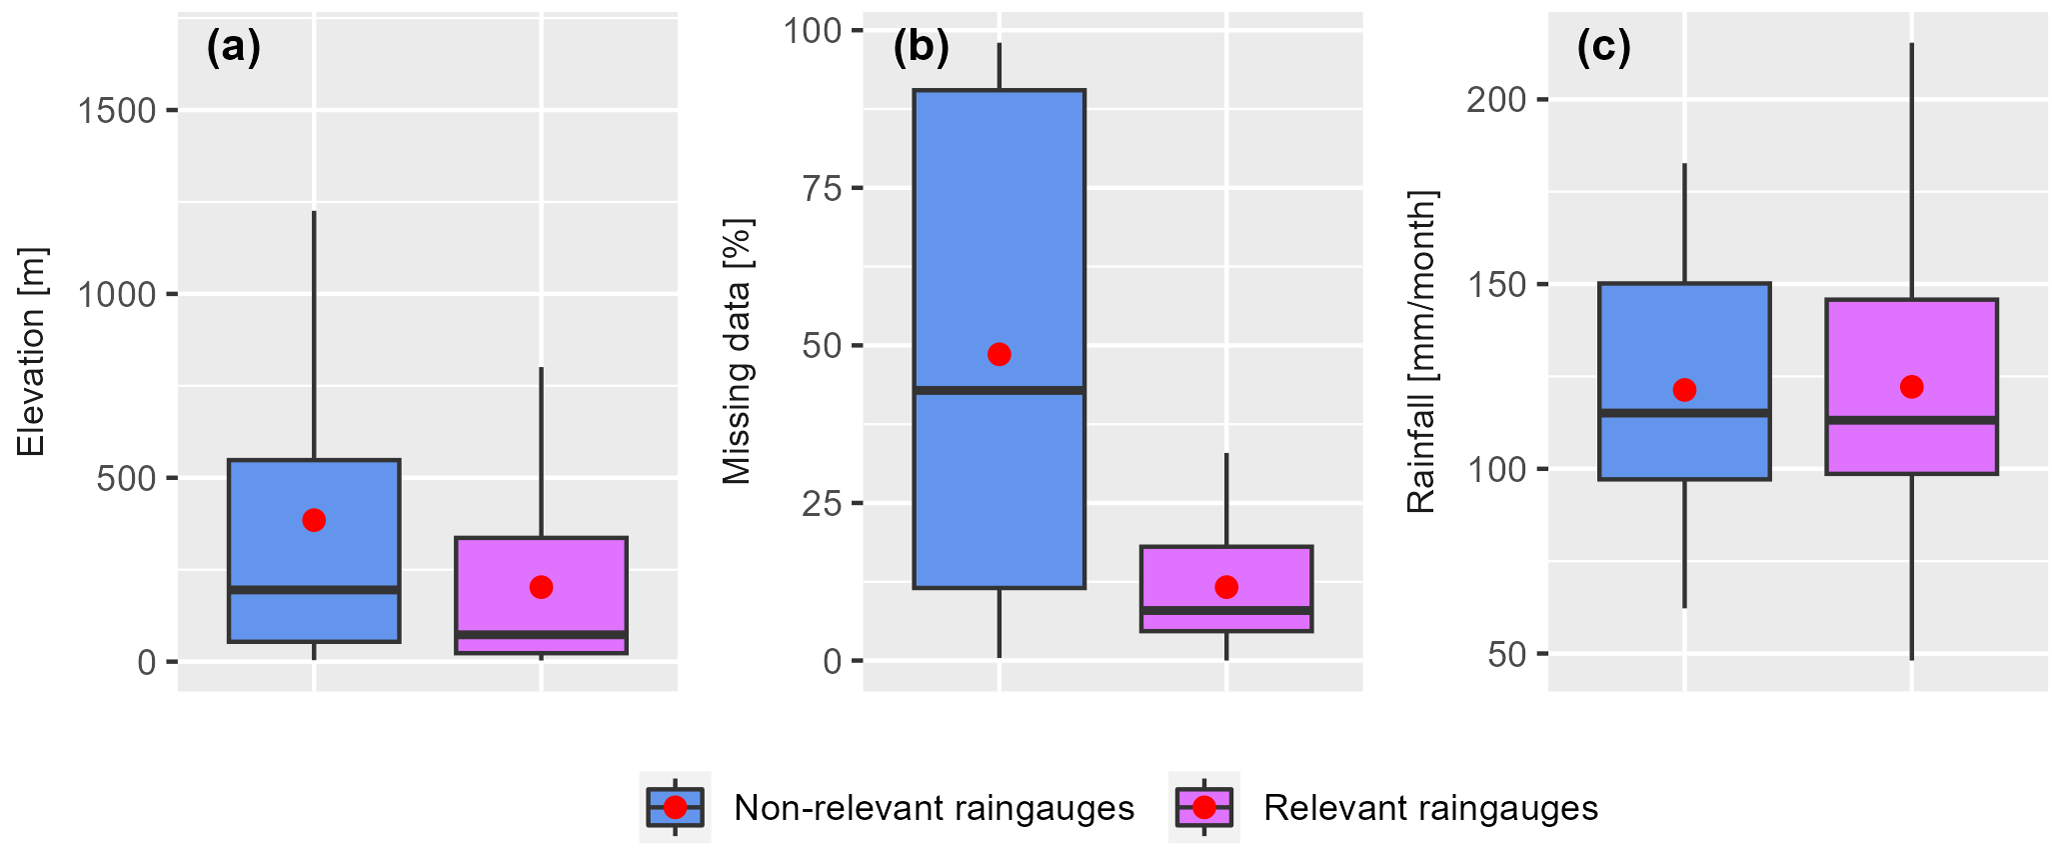
Figure 9(a) Distribution of rain-gauge elevations, (b) percentage of missing data, and (c) monthly rainfall for relevant (40) and non-relevant (21) rain gauges.
4.3 Water balance
The average annual water balance, in the form of a Turc–Budyko diagram, was used as another diagnostic tool to verify the hydroclimatic consistency of the assembled dataset. The results, presented in Fig. 10, show that the studied catchments correspond to conservative catchments (points located in the white part of the graph, i.e. Q<P and ), except for the catchments of Rivière du Sud at Camp-Pérrin (Q-008) and Rivière Grise (Q-001). More than 90 % of the Q-008 catchment is on a calcareous geological formation, and part of the catchment is also affected by karstic aquifers. Therefore, there may be a contribution of water from neighbouring catchments that justifies such a high ratio, but no such study has been conducted to confirm or refute this hypothesis. The interpretation of the results for the Q-001 catchment is more difficult, as it may be related to the choice of relevant rain-gauge combinations for this catchment, to a real exchange of streamflow with the neighbouring catchments, or to a mixture of both. The water balances obtained with the relevant rain-gauge combinations are shifted to the lower right (blue circles and triangles). This is related to the fact that some of the rain gauges used are very wet (see Sect. 4.2.3) and therefore increase the rainfall at the catchment scale. No clear trend was observed between the water balances obtained with observed streamflow and those obtained with simulated streamflow.
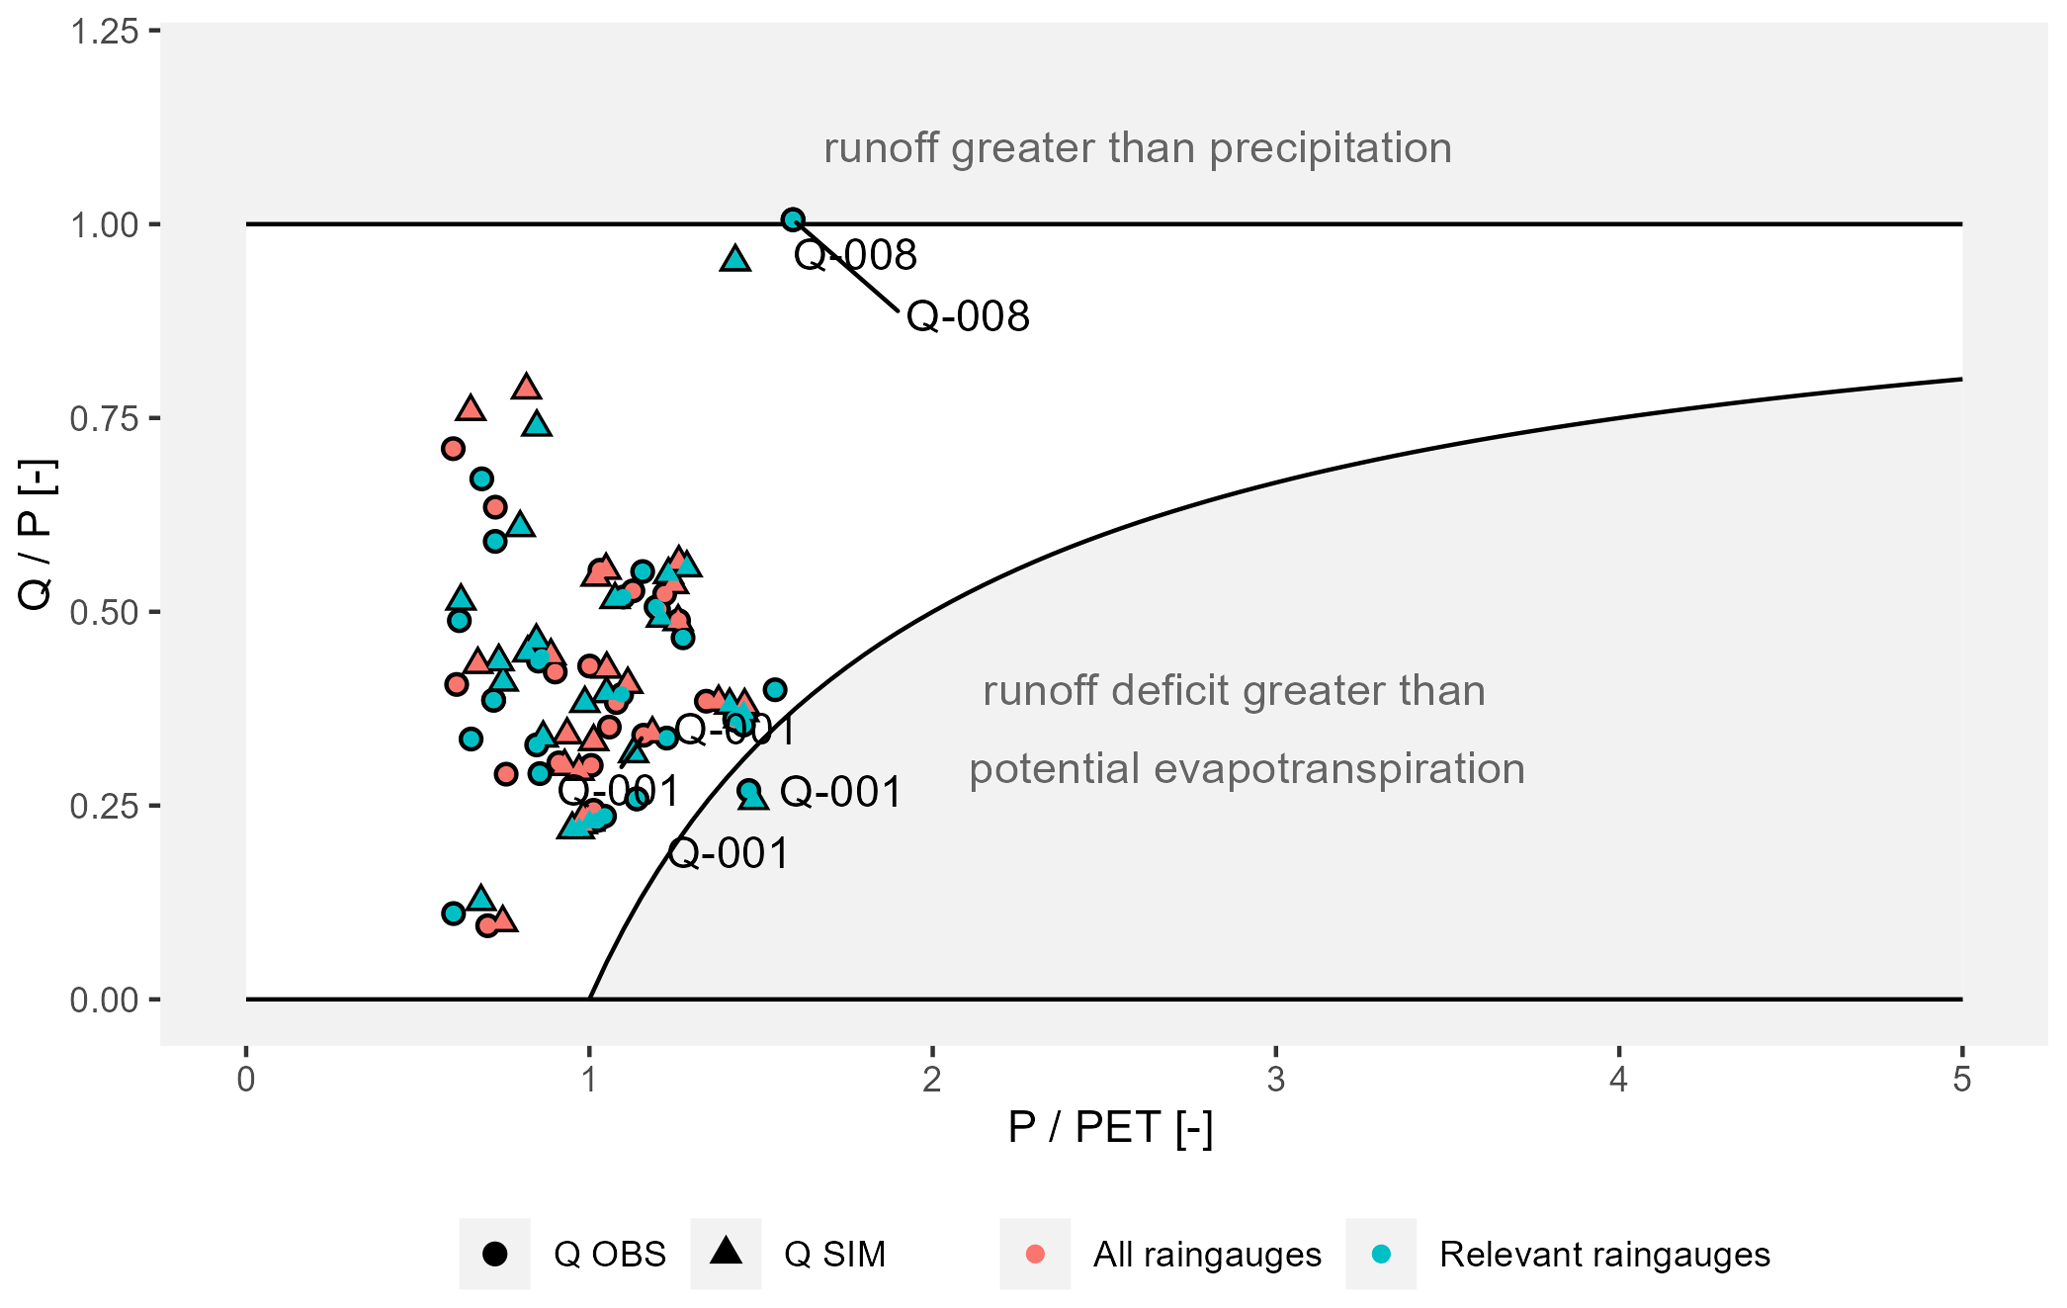
Figure 10Average annual water balance in the form of a Turc–Budyko diagram for all 24 catchments. The reference rain gauges are shown in red, and the relevant rain gauges are shown in blue. Observed streamflows are shown as circles, and simulated streamflows with parameters calculated over the whole period of available data are shown as triangles.
4.4 Performance of the rainfall–runoff models
Three sets of parameters (see Sect. 3.4) were used to simulate three sets of monthly streamflow for each of the 24 catchments using the GR2M rainfall–runoff model, forced by the relevant rain-gauge combinations and the PET calculated with digitised air temperatures. The results, presented in Fig. 11a, show that the KGE scores have median values of 0.75 in calibration and 0.67 in evaluation.
The relevant rain gauges have daily data for 21 of the 24 catchments. Therefore, daily streamflow series were simulated by the GR4J model for these 21 catchments. The KGE scores have median values of 0.57 in calibration and 0.44 in evaluation (Fig. 11b). The daily rainfall data used as input to GR4J may partly explain the low KGE values obtained. Indeed, rain gauges with high percentages of missing data led to instability and poor performance of the GR2M model in most catchments, which required a search for relevant rain gauges to improve the stability and performance of the model at the monthly time step (see Sect. 4.2). However, there is a higher percentage of missing data in the available daily rainfall data than in the monthly data. Furthermore, the limited availability of daily data makes it difficult to improve the performance of the model at the daily time step.
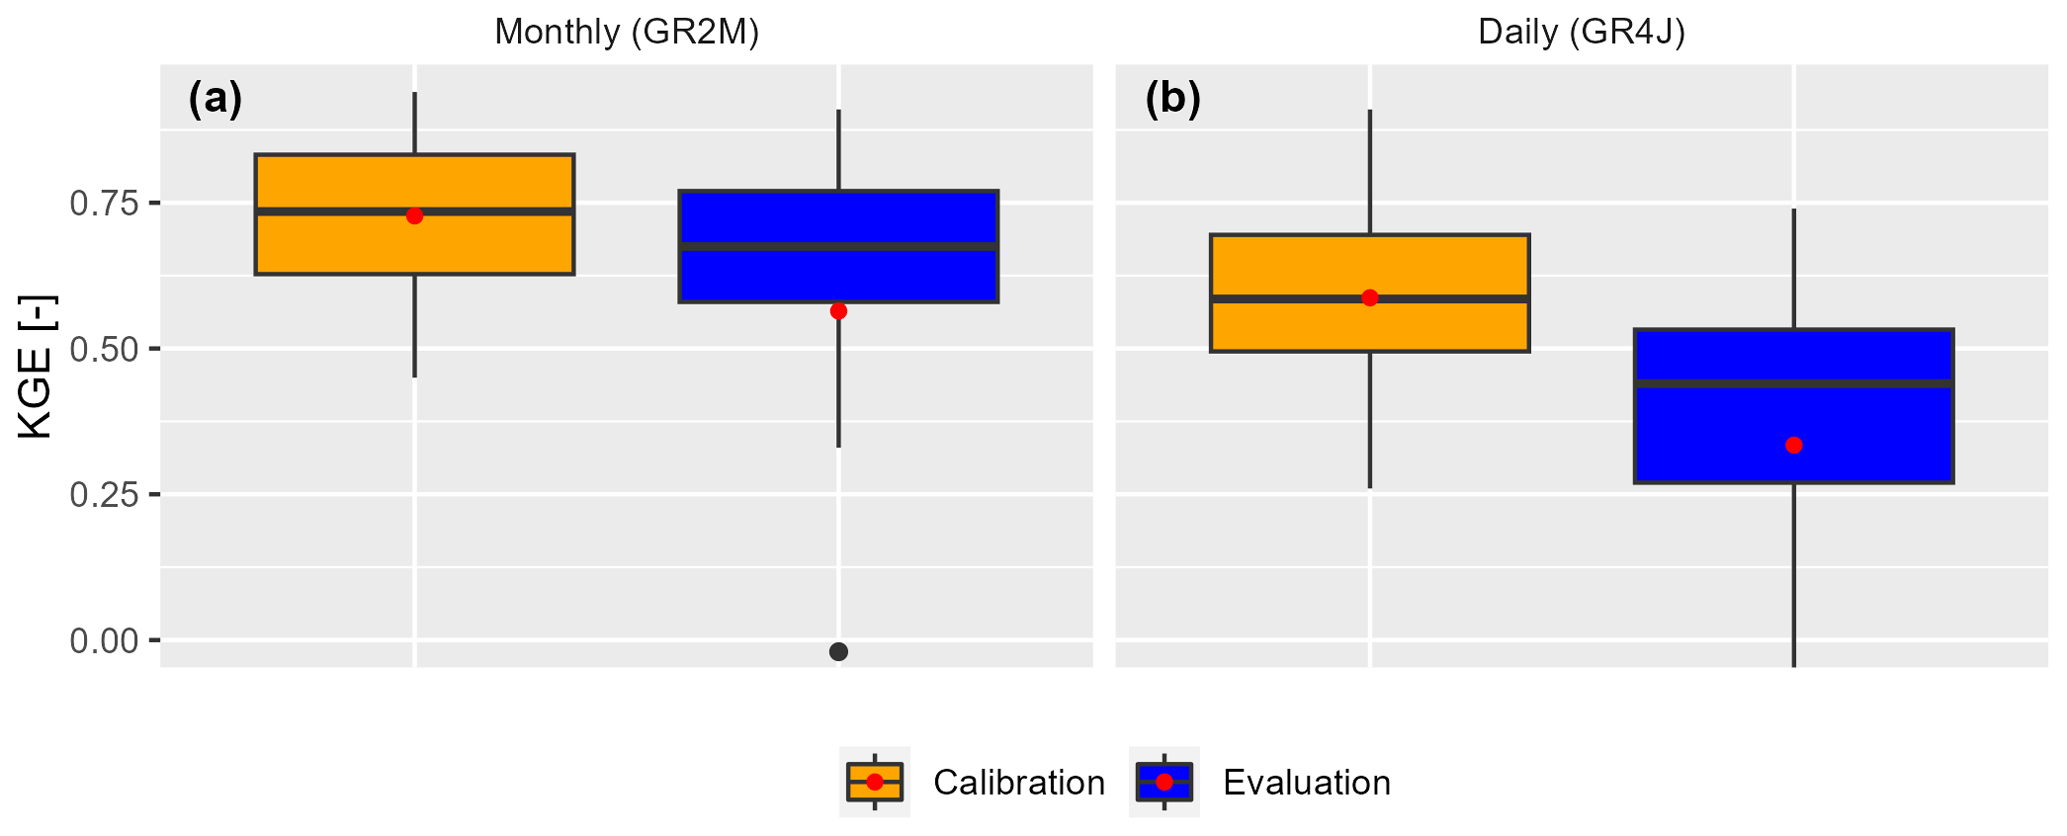
Figure 11Synthesis of KGE scores in calibration and evaluation at monthly (a) and daily time steps.
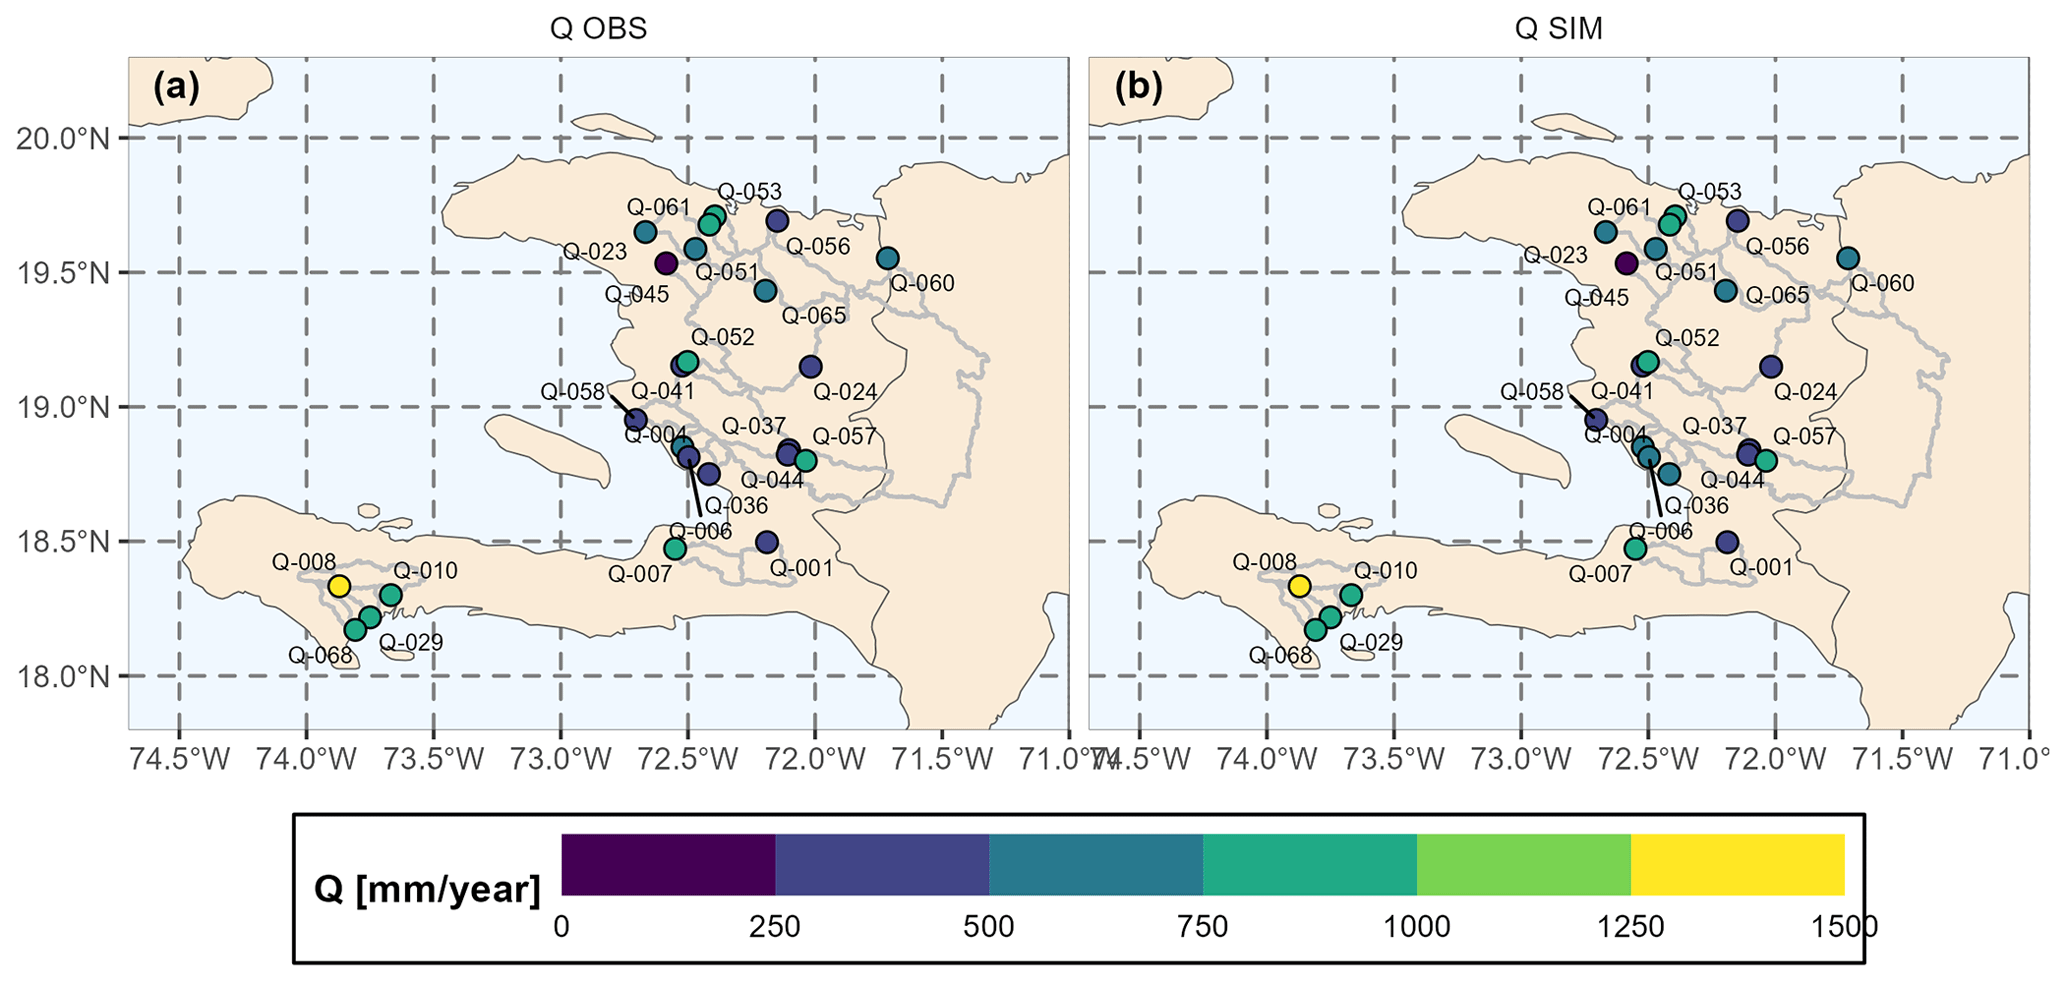
Figure 12Spatial distribution of observed mean annual streamflows (a) and simulated streamflows (b) with the GR2M parameters calculated over the entire period of available data.
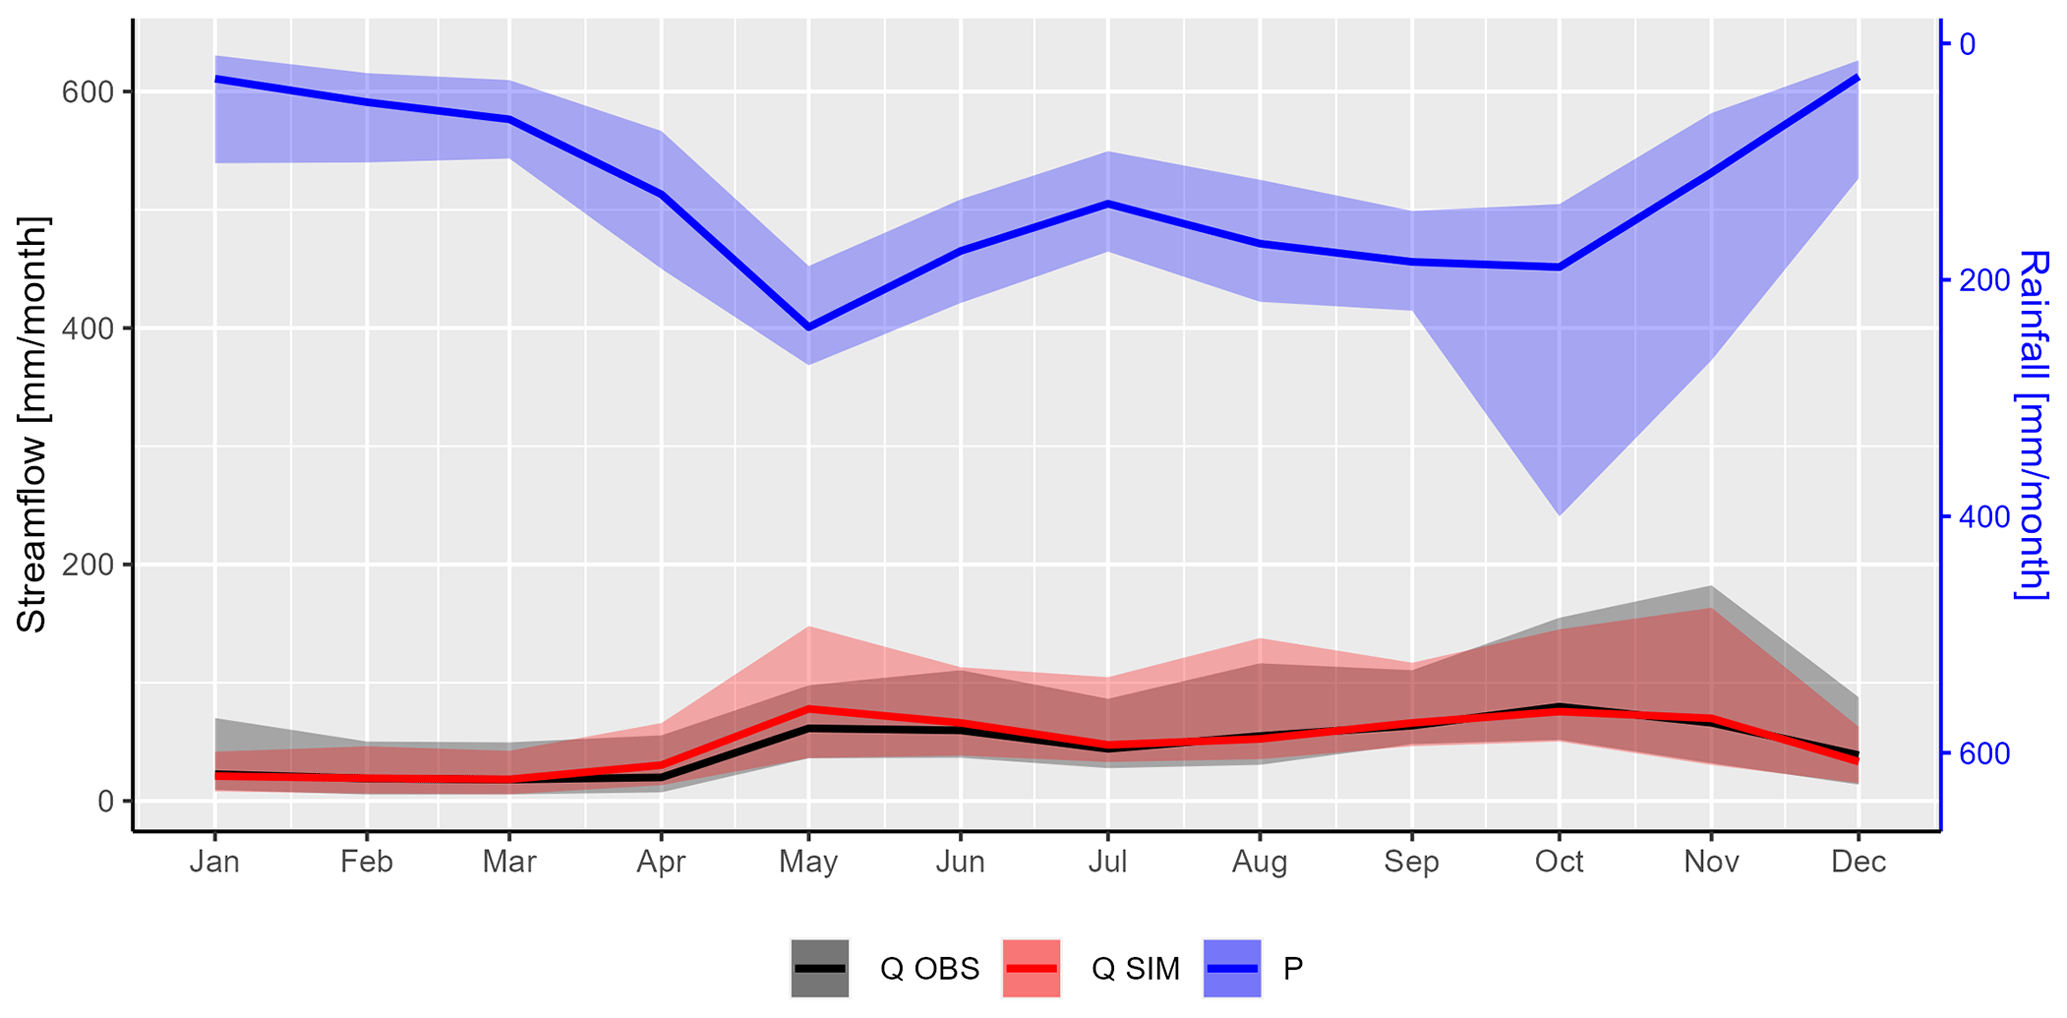
Figure 13Seasonality of rainfall (obtained by combining the relevant rain gauges) in blue, observed streamflow in black, and simulated streamflow with the parameters calculated over the entire period of available data in red. The ribbon value ranges have been estimated using the range of values between the 10th and 90th percentiles, while the thick line represents the median values for the 24 catchments studied.
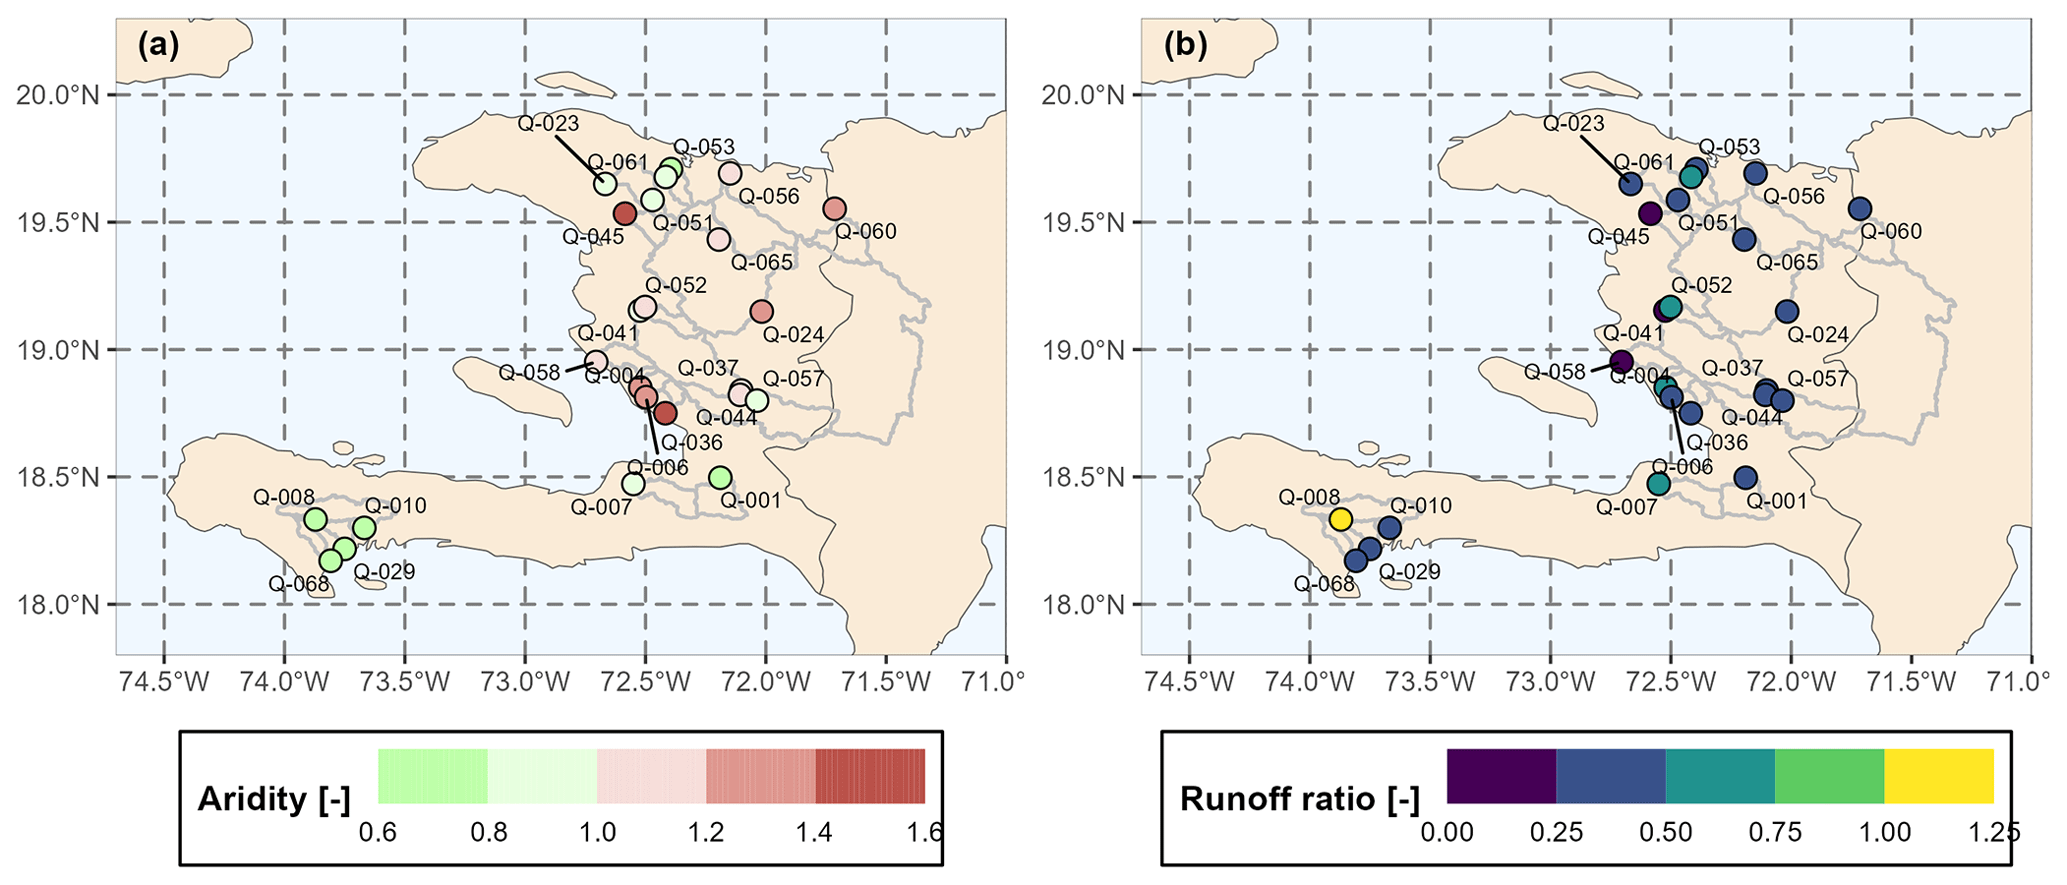
Figure 14(a) Aridity index calculated from rainfall series from relevant rain gauges. (b) Runoff coefficient calculated from observed streamflow series on the right.
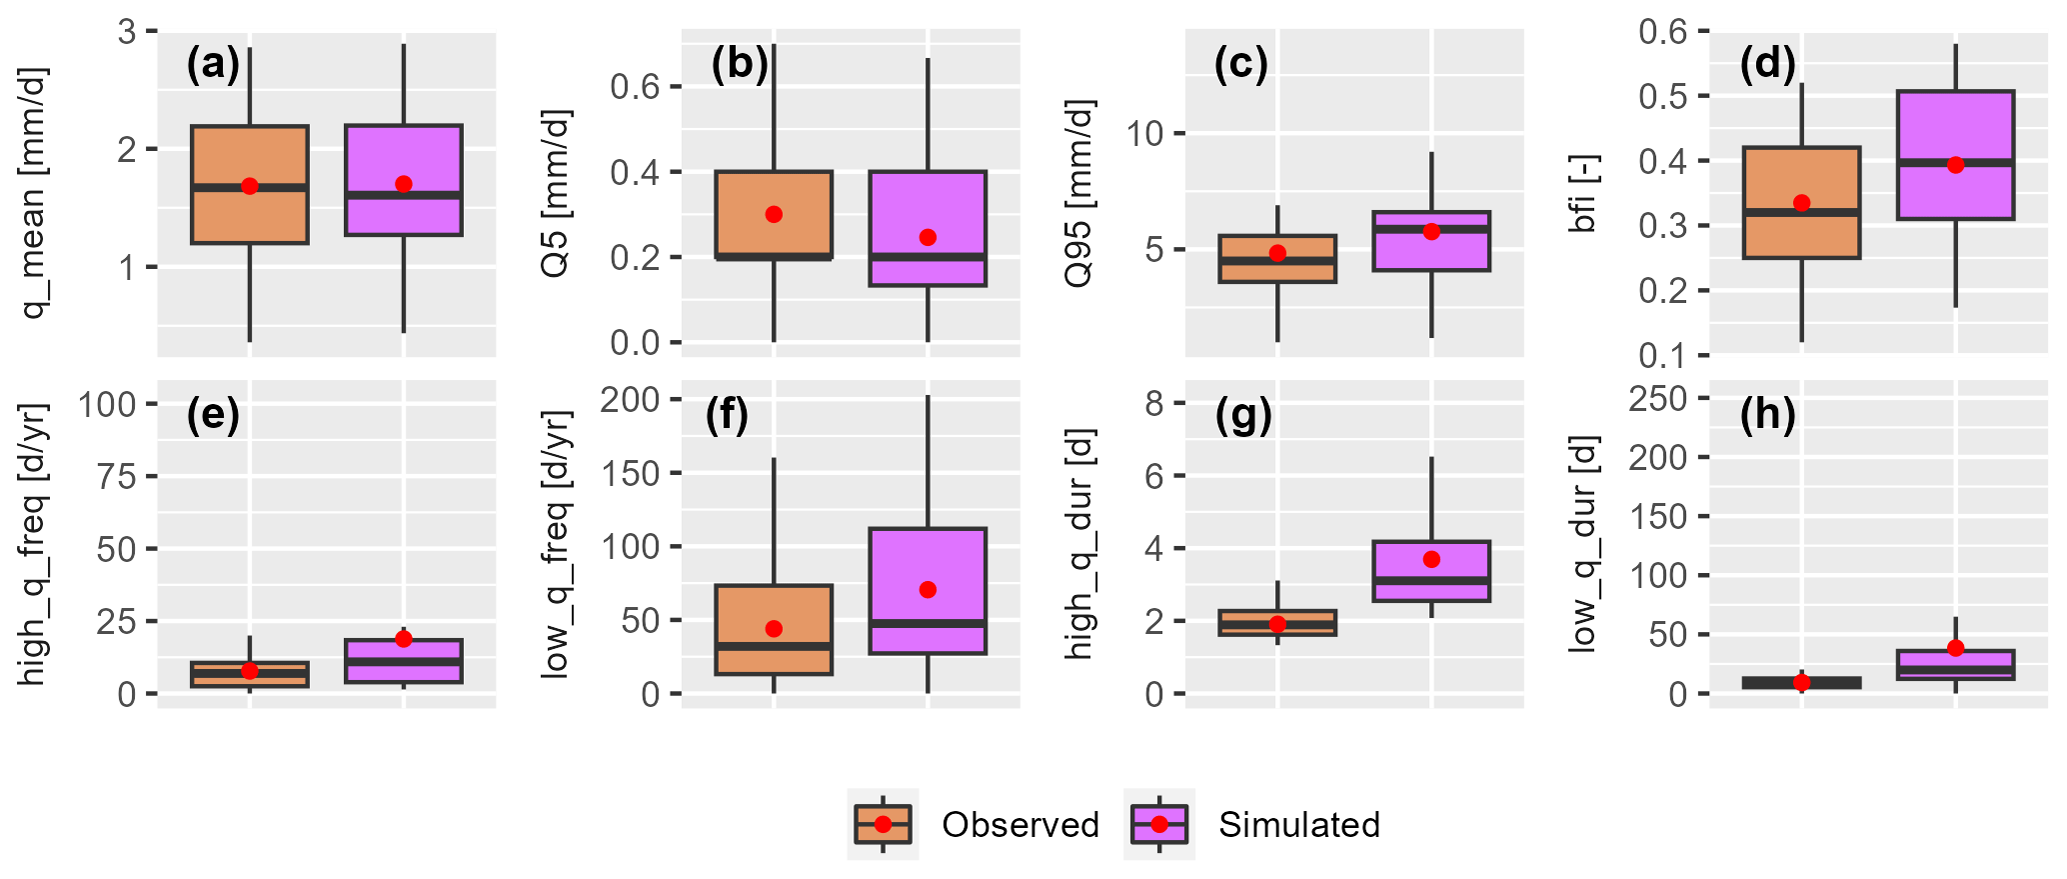
Figure 15Summary of hydrological signatures at the daily time step for observed and simulated streamflow and for 21 catchments. From (a) to (h): daily mean streamflow, 5 % quantiles, 95 % quantiles, baseflow, high streamflow frequencies, low streamflow frequencies, high streamflow durations, and low streamflow durations.
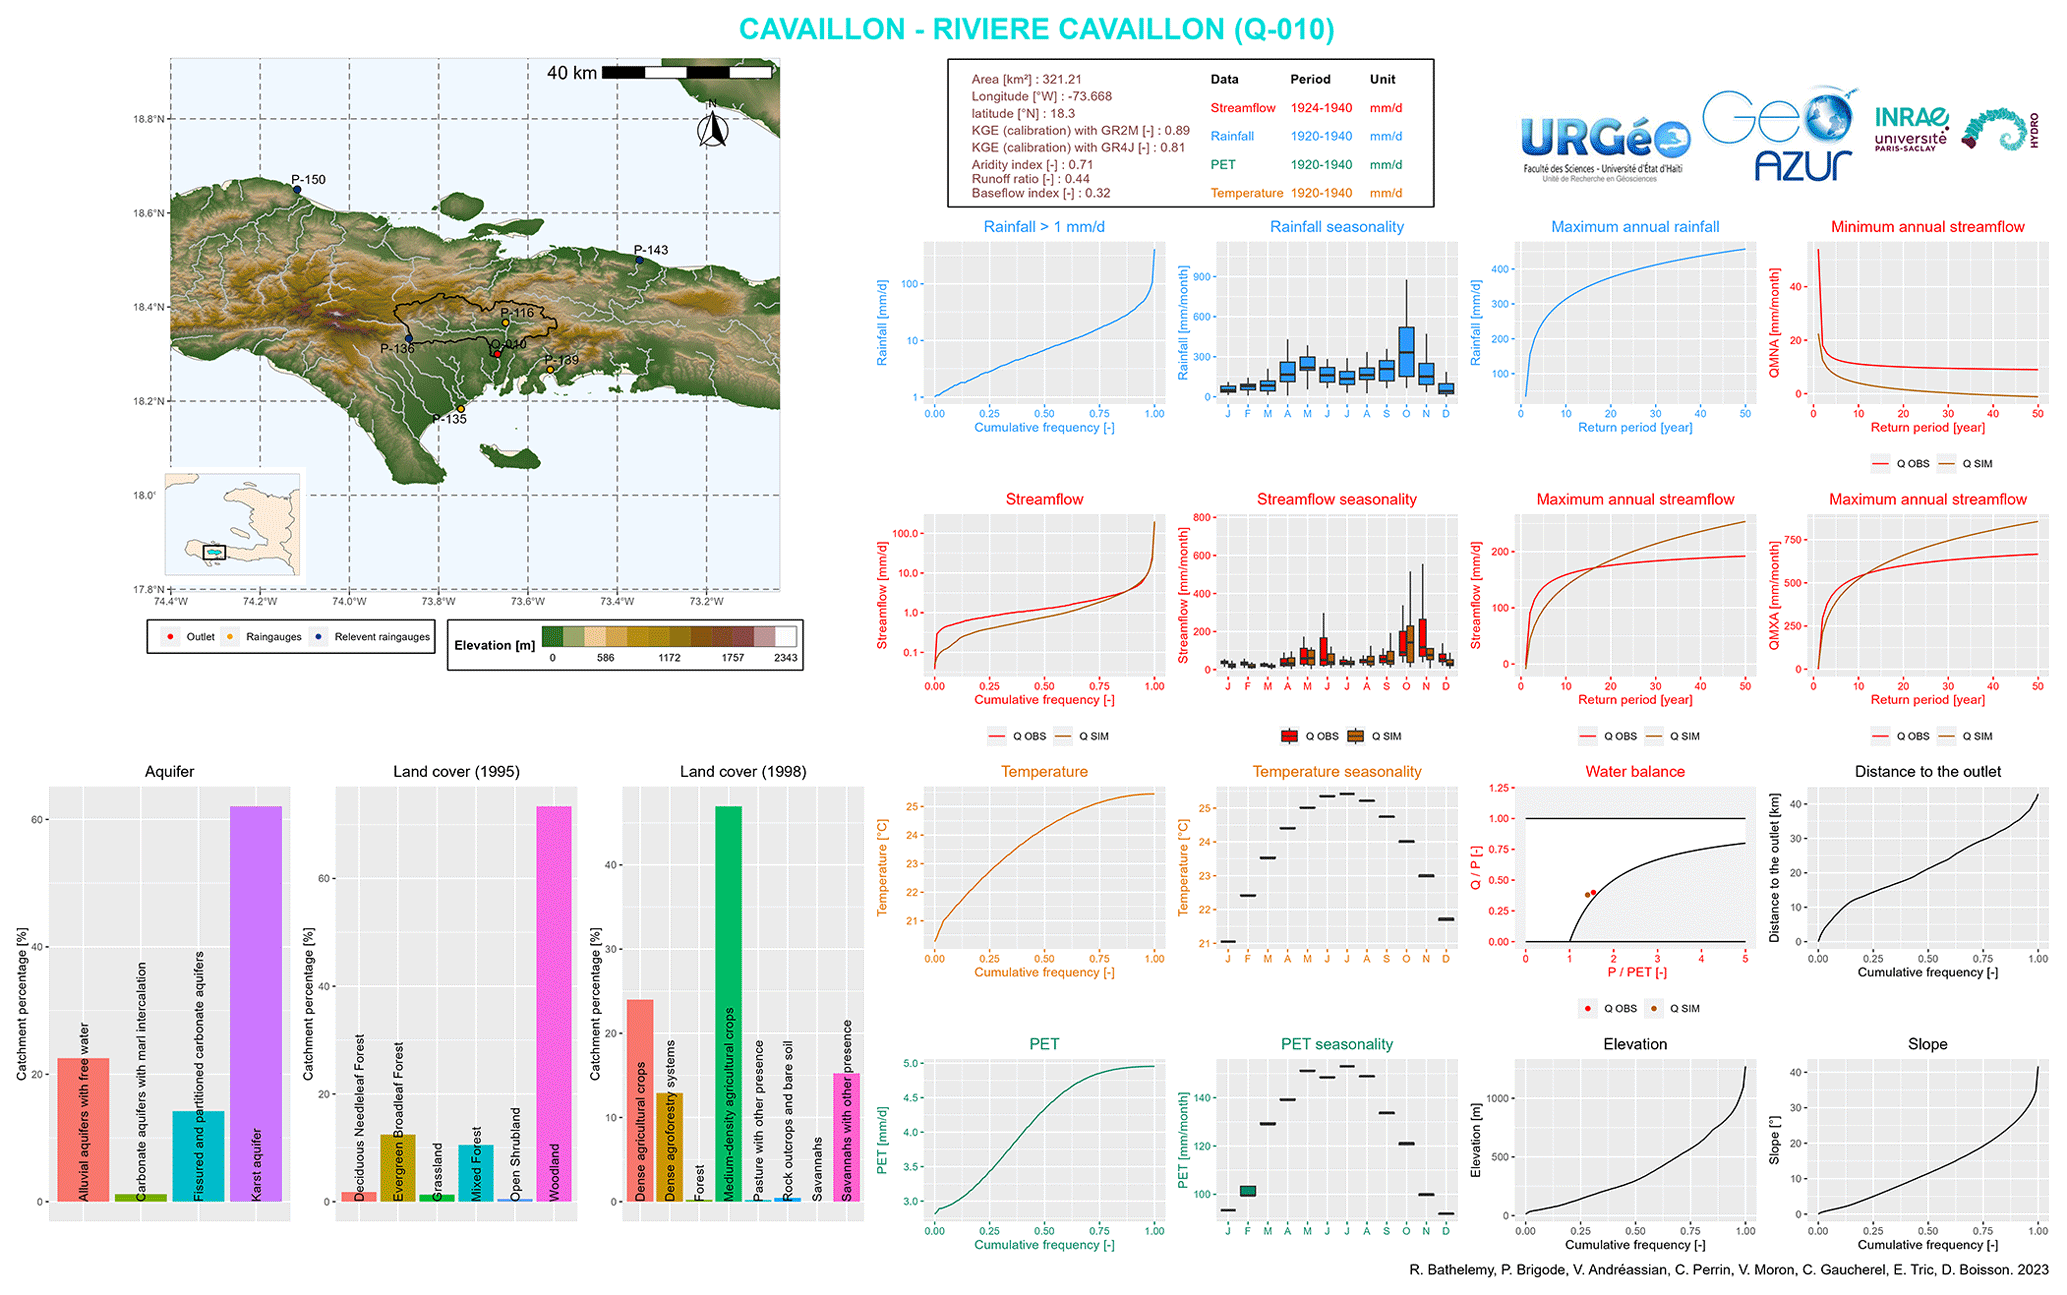
Figure 16Summary sheet of the characteristics of the Cavaillon catchment.
4.5 Catchment attributes
The 49 catchment attributes were calculated as described in Sect. 3.5 and Table C3. Results for all the attributes are not presented in this paper. Only some climate indices and hydrological signatures are presented.
4.5.1 Hydrological signature at the monthly time step
The observed and simulated mean annual streamflows from GR2M are illustrated in Fig. 12. The results show that streamflow is higher in the south-west and north of Haiti and lower in the central part. However, the Q-008 catchment has a significantly higher mean annual streamflow than its three neighbouring catchments (Q-010, Q-068, and Q-029). As shown in Sect. 4.3, over 90 % of the Q-008 catchment is situated on a calcareous geological formation, 40 % of which is on karstic aquifers. Therefore, it is probable that an influx of water from neighbouring catchments is responsible for such a high mean annual streamflow. Nevertheless, no study has been conducted to confirm or dispute this hypothesis. The simulated streamflow represents well the spatial pattern of the observed streamflow and gives good estimates of the observed mean annual streamflow.
Figure 13 shows the rainfall and streamflow regimes for the studied catchments. The results show a bi-modal rainfall–streamflow regime with two seasons of heavy rainfall or streamflow: the first season occurs around May and the second season between September and November, which corresponds to the cyclonic season. Rainfall is highly variable during the cyclonic season, with relatively heavy rainfall recorded in some catchments. The simulated streamflow represents well the seasonality of the observed streamflow (see Fig. 13). However, simulated streamflows overestimate the observed values in May and underestimate them in November. In addition, the simulated streamflows slightly overestimate the low values in January. A time lag has been observed between the peak rainfall in October and the peak flow in November. This lag can be explained by soil saturation. The second season of heavy rainfall in Haiti, from September to November, gradually moistens the soil until it is saturated. Although the rainfall in November is relatively lower than in October, the streamflows in November are generally higher due to soil saturation. However, this hypothesis requires further investigation in future study.
The aridity indices and runoff coefficients are presented in Fig. 14. The aridity indices show the same spatial pattern as the mean annual streamflow (Fig. 12). That is, they are greater than 1 in the central part of Haiti (arid zone) and lower in the south-west and north (humid zone).
The runoff coefficients are approximately 0.35 for catchments in the central zone and approximately 0.5 in the south-west and north of Haiti. The South River catchment at Camp-Pérrin (Q-008), discussed above, has a runoff coefficient greater than 1, meaning that runoff is greater than rainfall. This high runoff coefficient can be explained by the presence of karst aquifers in the Q-008 catchment.
4.5.2 Hydrological signatures at the daily time step
The hydrological attributes of the simulated and observed streamflows for the 21 selected catchments are summarised in Fig. 15. The results show that the simulated streamflows are able to represent average daily streamflow well, underestimate low streamflow (5 % quantile), and overestimate high streamflow (95 % quantile) and baseflow indices (Pelletier and Andréassian, 2020). These overestimates of high streamflow and underestimates of low streamflow result in increased frequencies and durations of simulated high and low streamflow relative to observed streamflow. This poor representation of simulated high and low streamflows is a consequence of the poor performance of the GR4J model for most catchments.
4.6 Graphical summary sheets of the Simbi database
The main catchment characteristics are summarised in sheets. These summary sheets have been inspired by those prepared by the catchment hydrology research group at INRAE (Brigode et al., 2020). An example is shown in Fig. 16 describing the main characteristics of the Cavaillon catchment, which was studied several times after Hurricane Matthew (Mathieu, 2023; Joseph, 2019; Joseph et al., 2018). This catchment has an area of 320 km2, half of which is at an elevation above 250 m with a slope greater than 10°, and overlies a karst aquifer. During the rainy season (April–November), the catchment receives more than 150 mm month−1 of rainfall and more than 280 mm month−1 during the peak rainfall in May and November. Streamflows can reach 100 mm month−1 during May–June and October–November. Simulated streamflows underestimate maximum annual flows with a return period of less than 10 years and overestimate flows beyond 10 years. The generalised extreme value (Beirlant et al., 2004; Coles, 2001; Jenkinson, 1955) and the distribution of annual values (precipitation, PET, air temperature, or streamflow) were used to estimate values for multiple return periods. Simulated streamflows also underestimate low flows (annual minimums). Thus, during flood periods, we can expect daily streamflows of several hundred millimetres, and conversely, during dry periods, streamflows can be of the order of 10 mm month−1.
This section discusses the main sources of uncertainty associated with the Simbi database. These uncertainties can be classified into four main types.
-
The Simbi database contains historical data, which may be prone to errors due to factors such as the used equipment, the methods employed to measure flows, and the establishment of rating curves. For most streams, water levels were measured manually by reading a vertical scale placed on one of the banks of the stream two or three times a day. Over time, 12 automatic recorders have been installed on 11 rivers, providing automatic and continuous readings of water levels on these streams. The metadata indicate the quality of the rating curves and the stations where the automatic recorders have been installed.
-
The historical data were originally in paper format and have been digitised. Despite quality-control tests, uncertainties remain regarding the digitisation of paper archives.
-
The rain gauges identified as relevant for hydrological modelling in this article depend on the use of a rainfall–runoff model. Different methodologies or rainfall–runoff models may produce different results and thus different catchment-scale precipitation forcings.
-
The simulated streamflows are dependent on the rainfall–runoff models that are used and may differ if other models are used. It is important to note that, especially at the daily time step, the KGE values obtained for some catchments are poor (KGE < 0.5).
The Simbi database is freely available for download at https://doi.org/10.23708/02POK6 (Bathelemy et al., 2023). The SIMBI_README.txt file contains a description of the database and the organisation of the various files and folders. Missing data in the Simbi database are indicated by −9999.
To the best of our knowledge, the hydro-meteorological database presented in this article represents the first open-access and exhaustively documented hydro-meteorological dataset for Haiti. This database, called Simbi, contains station observations and catchment-scale data. The station observations contain
-
59 daily rainfall series available from 1920 to 1940,
-
156 monthly rainfall series available from 1905 to 2005,
-
70 daily streamflow series available from 1920 to 1940, and
-
23 monthly air temperature series available from 1926 to 1939.
The data at the catchment scale contain the following.
-
Climate forcings (precipitation, air temperature, and potential evapotranspiration) at both monthly and daily time steps for 24 and 21 catchments, respectively
-
Simulated monthly streamflow series for 24 catchments and simulated daily streamflow series for 21 catchments using three sets of parameters (three simulated streamflow series per catchment) from the GR2M monthly and GR4J daily rainfall–runoff models
-
A set of indices that describe a wide range of low, moderate, and heavy rainfall and streamflow characteristics to characterise the hydrological regime and water resource management applications
The Simbi database highlights the spatial variability of Haiti's hydrological conditions. The central part of Haiti is associated with relatively low streamflow and high drought coefficients. The south-west is associated with relatively high streamflow. In fact, large floods are more frequent in these areas (Terrier et al., 2017). No clear trend was observed in the north. The simulated monthly streamflows perform well in representing average streamflow and their spatial variability. However, the model is less effective at the daily time step (the KGE score in evaluation is below 0.5 for most of the catchments). This results in poor representation of the frequency or number of consecutive days with high and low streamflow. This may be due to a combination of the quality of the data used and the calcareous geological formations that can create non-conservative catchments that are difficult to model.
Our database can be considered a starting point for any hydroclimatic study in Haiti, since it gathers, in addition to the simulated data, all the hydroclimatic data available in Haiti over several years. The database could contribute to better knowledge of the hydroclimatology in the 20th century and to studies of the evolution of the climate in Haiti for better adaptation to climate change. Frequency analysis methods can be utilised to estimate flood return periods. The accessibility of streamflow data allows for the possibility of various rainfall–runoff modelling approaches to be applied. Overall, this hydrological database will contribute to a better understanding of hydrological risk in Haiti. The database will be regularly updated by integrating the historical archives that will later be digitised, making it the most complete hydrological database in Haiti. However, Simbi is associated with several sources of uncertainty, including data quality (historical data), digitisation of paper archives, identification of relevant rain gauges, and rainfall–runoff models. It is important to consider these uncertainties when using Simbi.
A verification of the two rainfall databases used was performed by comparing the monthly totals of the digitised daily rainfall series with the monthly rainfall database created by Moron et al. (2015). For months where the monthly totals of the two databases differed, a re-verification of the digitised daily rainfall series was carried out, which improved the quality of the digitised daily rainfall data. For some months and stations, the rainfall data produced by Moron et al. (2015) were erroneous. The errors in the Moron et al. (2015) data are generally of five types.
-
A data entry error during the digitisation of these monthly data
-
Data from some months are confused with data from other stations with similar names (e.g. St. Louis du Nord and St. Louis du Sud, Verrettes and Fonds Verrettes), which are often not geographically close.
-
Some extreme values were eliminated, thinking that they were input errors. For example, the rainfall was in fact 1196.9 mm at Camp-Pérrin (P-136) in October 1933, but the Moron et al. (2015) database stated 196.9 mm.
-
There was error in calculating monthly totals. In fact, at the end of each month, the monthly rainfall totals were calculated by the rain-gauge managers, and sometimes there were errors in calculating the monthly totals. However, it is these monthly totals that were used to create the Moron et al. (2015) data.
-
There was mixing of data from stations located in the same city. Initially, all the rain gauges were managed by the observatory of the Petit Séminaire Collège St. Martial, and these rain gauges were named after the town in which they were installed. Around 1928, public works began to install stations in the same towns as the first stations. This sometimes led to confusion between neighbouring stations. For example, the 1920–1930 data for the Hinche station (P-065) are from the observatory station, and the 1931–1940 data are from the public works station. To avoid confusion, only the observatory stations were used in our study because they are more numerous and contain the longest data series.
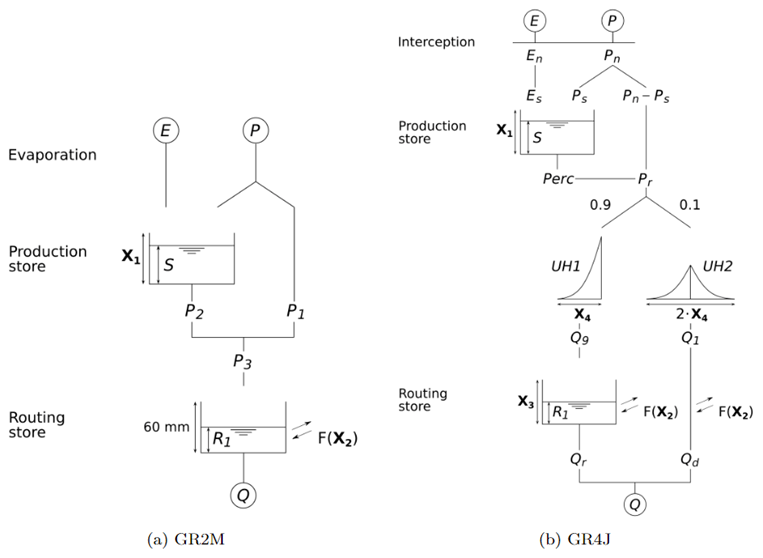
GR2M (Mouelhi et al., 2006) is a monthly lumped rainfall–runoff model. Its structure (see Fig. B1) combines a production store and a routing store to simulate the hydrological behaviour of the catchment. The model has two parameters to optimise during calibration:
- 1.
X1, the production store maximal capacity (mm); and
- 2.
X2, the catchment water exchange coefficient (–).
GR4J (Perrin et al., 2003) is a daily lumped rainfall–runoff model. Its structure (see Fig. B1) combines a production store and a routing store and unit to simulate the hydrological behaviour of the catchment. The model has four parameters to optimise during calibration:
- 3.
X1, the production store maximal capacity (mm);
- 4.
X2, the catchment water exchange coefficient (mm d−1);
- 5.
X3, the 1 d maximal capacity of the routing store (mm); and
- 6.
X4, the HU1 unit hydrograph time base (d).
Table C1Ratio and error between the catchment areas calculated with TauDEM and those of the hydrographic bulletins.
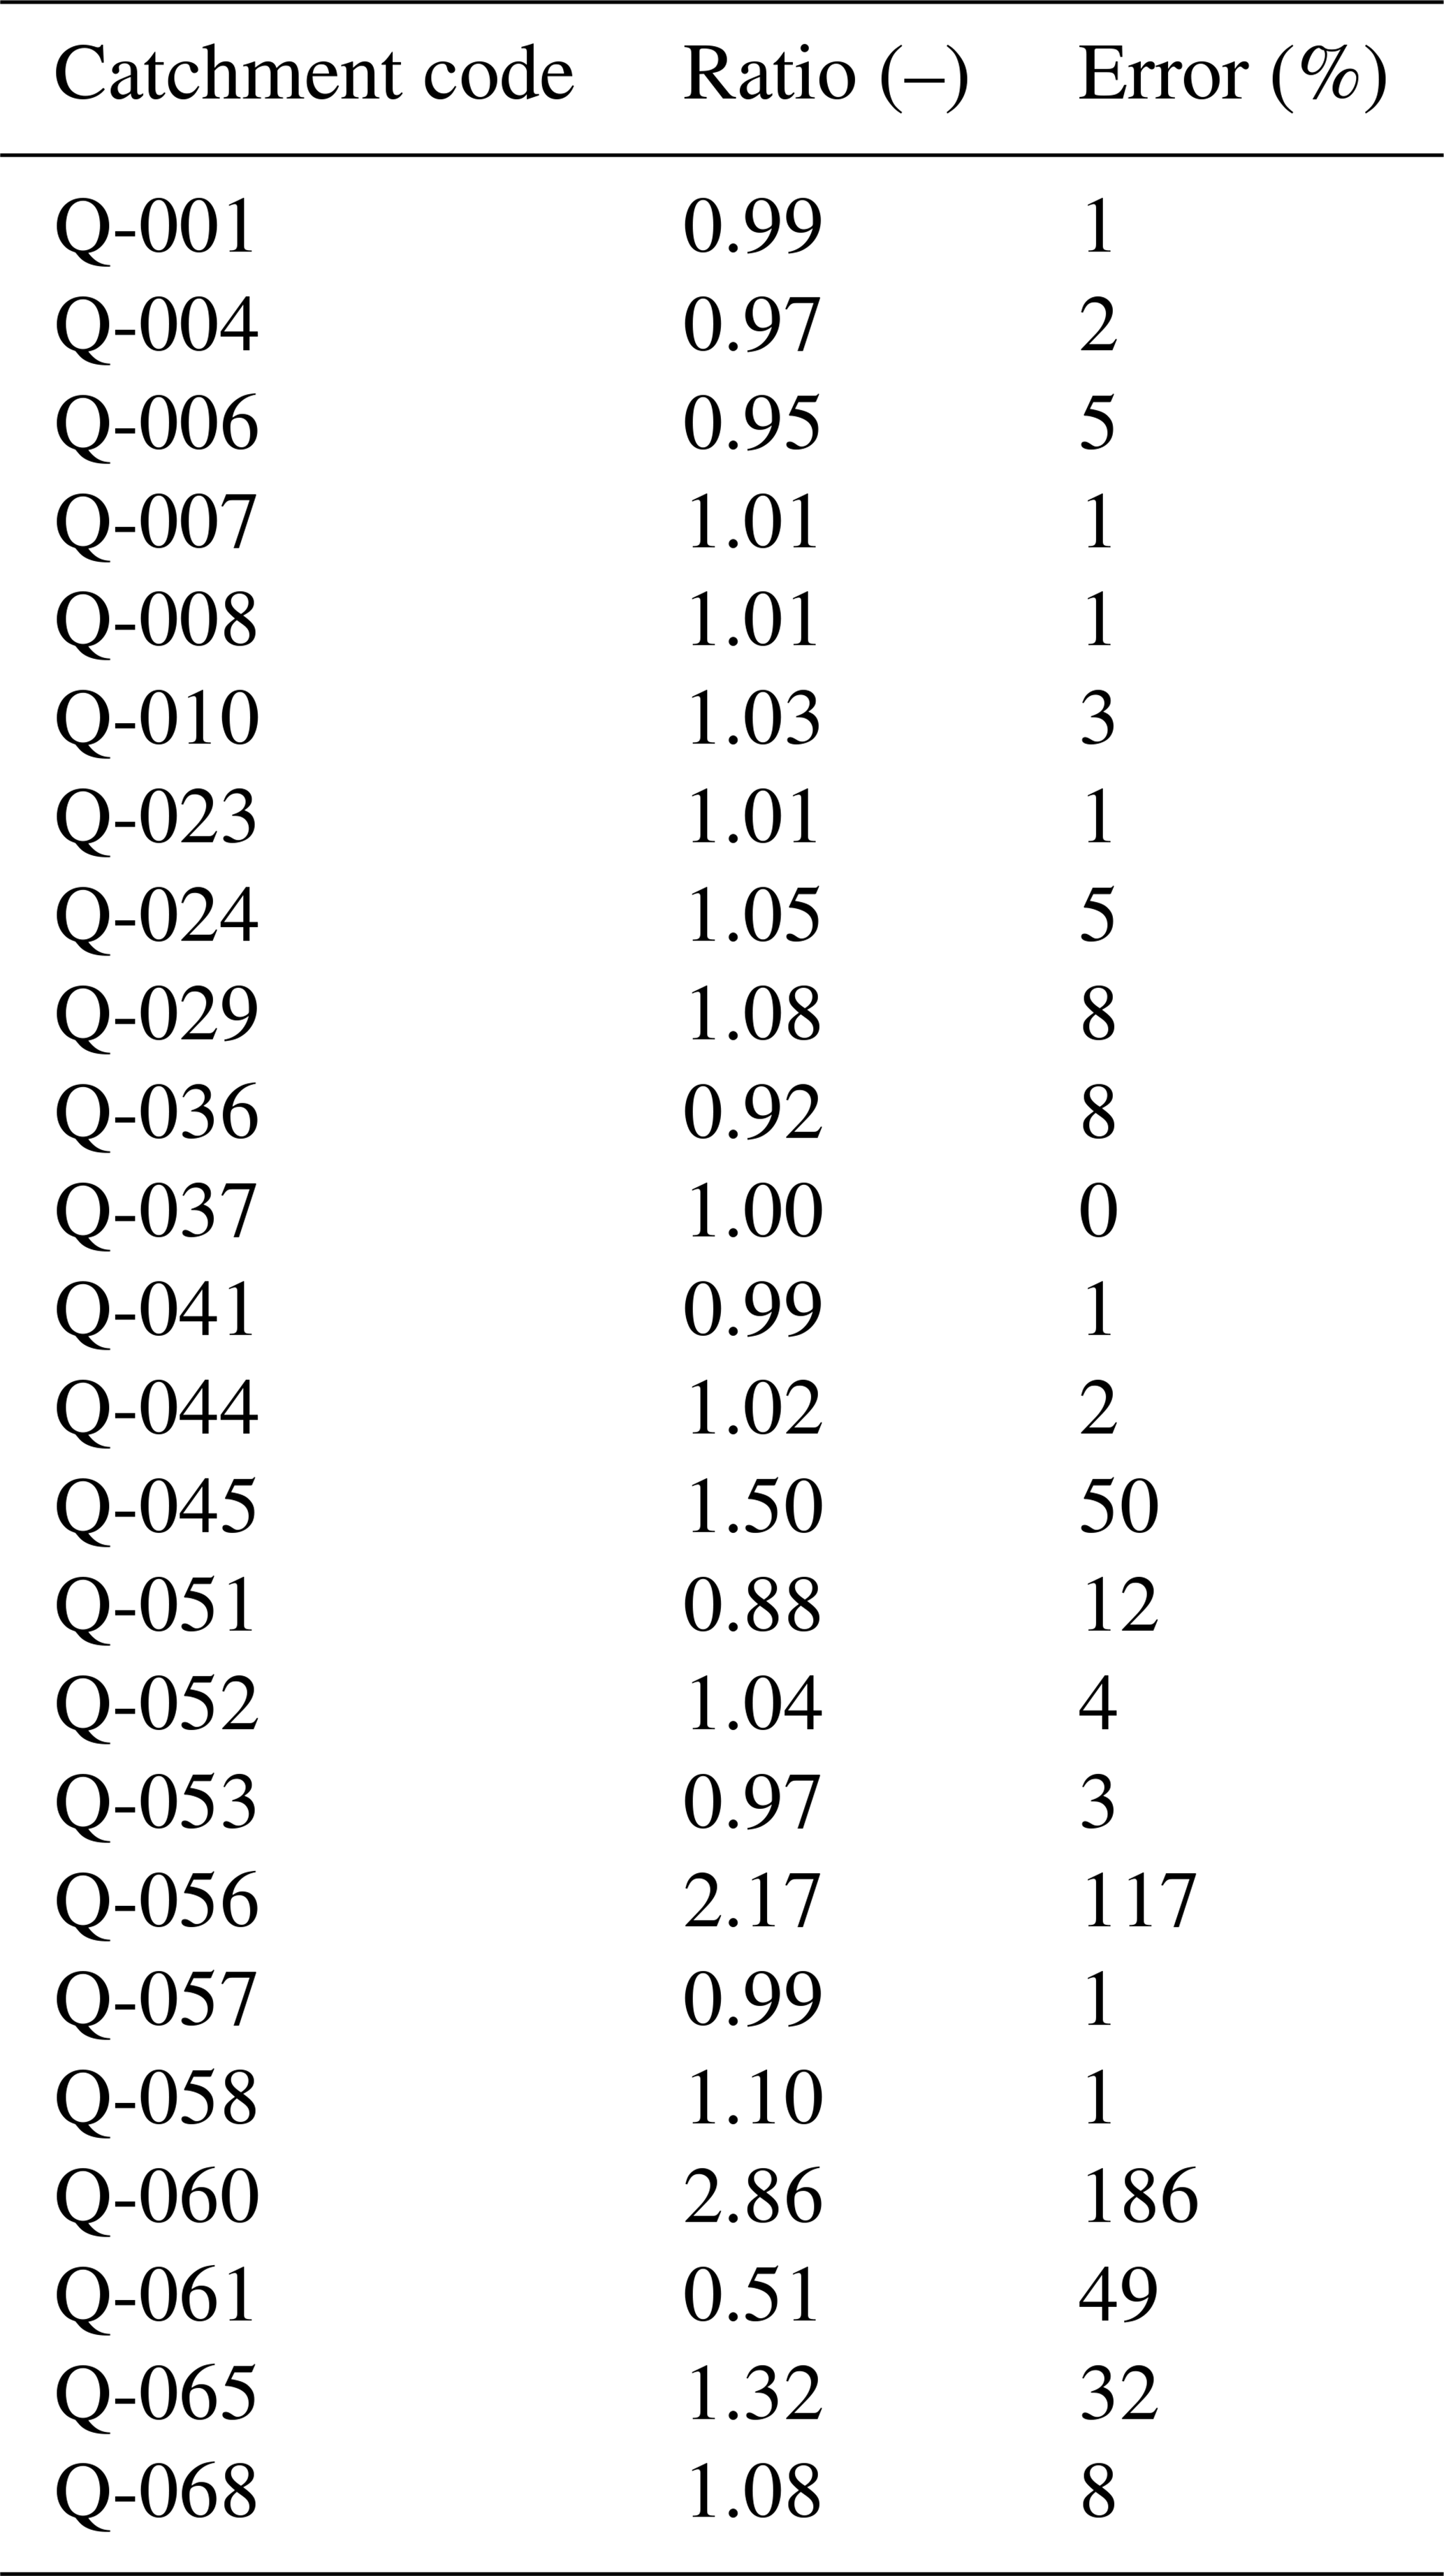
Table C2Summary of the number of rain gauges used to calculate the reference rainfall, the number of combinations of these rain gauges, and the most important rain gauges for hydrological modelling.
Conceptualisation and methodology: RB, PB, VA, CP. Data curation: RB, VM, CG. Original draft preparation: RB. Review and editing: all the authors.
The contact author has declared that none of the authors has any competing interests.
Publisher’s note: Copernicus Publications remains neutral with regard to jurisdictional claims made in the text, published maps, institutional affiliations, or any other geographical representation in this paper. While Copernicus Publications makes every effort to include appropriate place names, the final responsibility lies with the authors.
The authors thank the Bibliothèque Haïtienne des Spiritains (BHS) for providing the paper archive of daily rainfall data and the BVH project coordinators for providing the daily streamflow series. Special thanks go to the students Eddy-Terson François, Douninio Jeanite, Appollon Jean Philippe, and John Claury Ménélas of the Université d'Etat d'Haïti, who contributed to digitising the daily rainfall data, and to the students Kathleen Gerarduzzi, Camille Morillon, and Alexandre Antony of the Université Côte d'Azur, who digitised the monthly air temperature data. Olivier Delaigue’s work inspired the design of our files and the graphical summary sheets, and we extend our thanks to him. We thank Isabella Athanassiou for editing the English version of the manuscript. The authors thank the three reviewers and the editor, who provided constructive comments on an earlier version of the manuscript, which helped clarify the text.
This research has been supported by (i) an Anténor Firmin grant from the French Embassy in Haiti, (ii) the Institut de Recherche pour le Développement (IRD) through an ARTS grant, (iii) the CARIBACT International Mixed Laboratory, and (iv) the CLIMEXHA project (Anticipating Extreme CLIMATE events over HAITI for sustainable development). The Anténor Firmin, ARTS and CARIBACT grants funded the Ph.D. thesis of Ralph Bathelemy. The CLIMEXHA project financed the digitisation of the daily rainfall data.
This paper was edited by Di Tian and reviewed by three anonymous referees.
Abbaspour, K. C., Faramarzi, M., Ghasemi, S. S., and Yang, H.: Assessing the impact of climate change on water resources in Iran, Water Resour. Res., 45, 16, https://doi.org/10.1029/2008WR007615, 2009.
Addor, N., Newman, A. J., Mizukami, N., and Clark, M. P.: The CAMELS data set: catchment attributes and meteorology for large-sample studies, Hydrol. Earth Syst. Sci., 21, 5293–5313, https://doi.org/10.5194/hess-21-5293-2017, 2017.
Alfieri, L., Lorini, V., Hirpa, F. A., Harrigan, S., Zsoter, E., Prudhomme, C., and Salamon, P.: A global streamflow reanalysis for 1980–2018, J. Hydrol. X, 6, 100049, https://doi.org/10.1016/j.hydroa.2019.100049, 2020.
Alvarez-Garreton, C., Mendoza, P. A., Boisier, J. P., Addor, N., Galleguillos, M., Zambrano-Bigiarini, M., Lara, A., Puelma, C., Cortes, G., Garreaud, R., McPhee, J., and Ayala, A.: The CAMELS-CL dataset: catchment attributes and meteorology for large sample studies – Chile dataset, Hydrol. Earth Syst. Sci., 22, 5817–5846, https://doi.org/10.5194/hess-22-5817-2018, 2018.
Andréassian, V., Perrin, C., Michel, C., Usart-Sanchez, I., and Lavabre, J.: Impact of imperfect rainfall knowledge on the efficiency and the parameters of watershed models, J. Hydrol., 250, 206–223, https://doi.org/10.1016/S0022-1694(01)00437-1, 2001.
Andréassian, V., Perrin, C., and Michel, C.: Impact of imperfect potential evapotranspiration knowledge on the efficiency and parameters of watershed models, J. Hydrol., 286, 19–35, https://doi.org/10.1016/j.jhydrol.2003.09.030, 2004.
Bathelemy, R., Brigode, P., Boisson, D., and Tric, E.: Rainfall in the Greater and Lesser Antilles: Performance of five gridded datasets on a daily timescale, J. Hydrol.-Reg. Stud., 43, 101203, https://doi.org/10.1016/j.ejrh.2022.101203, 2022.
Bathelemy, R., Brigode, P., Andréassian, V., Perrin, C., Moron, V., Gaucherel, C., Tric, E., and Boisson, D.: Simbi database: historical hydro-meteorological time series and catchment attributes in Haiti 1905–2005, DataSuds [data set], https://doi.org/10.23708/02POK6, 2023.
Beck, H. E., Wood, E. F., Pan, M., Fisher, C. K., Miralles, D. G., Dijk, A. I. J. M. van, McVicar, T. R., and Adler, R. F.: MSWEP V2 Global 3-Hourly 0.1° Precipitation: Methodology and Quantitative Assessment, B. Am. Meteorol. Soc., 100, 473–500, https://doi.org/10.1175/BAMS-D-17-0138.1, 2019.
Beirlant, J., Goegebeur, Y., Segers, J., and Teugels, J.: Statistics of extremes: theory and applications, Wiley: Hoboken, 522 pp., ISBN 978-0-471-97647-9, 2004.
Bendjoudi, H. and Hubert, P.: Le coefficient de compacité de Gravelius: analyse critique d'un indice de forme des bassins versants, Hydrol. Sci. J., 47, 921–930, https://doi.org/10.1080/02626660209493000, 2002.
Benoit, L., Sichoix, L., Nugent, A. D., Lucas, M. P., and Giambelluca, T. W.: Stochastic daily rainfall generation on tropical islands with complex topography, Hydrol. Earth Syst. Sci., 26, 2113–2129, https://doi.org/10.5194/hess-26-2113-2022, 2022.
Boisson, D. and Pubellier, M.: Carte géologique à 1/250 000 de la République d’Haïti [Geologic map of the Republic of Haiti at 1/250,000] BME, IMAGEO, CNRS, Paris, https://books.openedition.org/iheal/5618?lang=en (last access: 25 April 2024), 1987.
Bonhomme, V., Frelat, R., and Gaucherel, C.: Application of elliptical Fourier analysis to watershed boundaries: a case study in Haiti, Géomorphologie: relief, processus, Environnement, 19, 17–26, https://doi.org/10.4000/geomorphologie.10100, 2013.
Brigode, P., Brissette, F., Nicault, A., Perreault, L., Kuentz, A., Mathevet, T., and Gailhard, J.: Streamflow variability over the 1881–2011 period in northern Québec: comparison of hydrological reconstructions based on tree rings and geopotential height field reanalysis, Clim. Past, 12, 1785–1804, https://doi.org/10.5194/cp-12-1785-2016, 2016.
Brigode, P., Génot, B., Lobligeois, F., and Delaigue, O.: Summary sheets of watershed-scale hydroclimatic observed data for France, Recherche Data Gouv [data set], https://doi.org/10.15454/UV01P1, 2020.
Brocca, L., Filippucci, P., Hahn, S., Ciabatta, L., Massari, C., Camici, S., Schüller, L., Bojkov, B., and Wagner, W.: SM2RAIN–ASCAT (2007–2018): global daily satellite rainfall data from ASCAT soil moisture observations, Earth Syst. Sci. Data, 11, 1583–1601, https://doi.org/10.5194/essd-11-1583-2019, 2019.
Burgess, C. P., Taylor, M. A., Spencer, N., Jones, J., and Stephenson, T. S.: Estimating damages from climate-related natural disasters for the Caribbean at 1.5°C and 2°C global warming above preindustrial levels, Reg. Environ. Change, 18, 2297–2312, https://doi.org/10.1007/s10113-018-1423-6, 2018.
Burnash, R. J. C.: The NWS River Forecast System-catchment modeling, Computer models of watershed hydrology, edited by: Singh, V. P., Water Resources Publications, 311–366, ISBN 978-0-918334-91-6, 1995.
Butterlin, J.: Geologie generale et regionale de la Republique d'Haiti, Éditions de l'IHEAL, Paris, 194 pp., https://doi.org/10.4000/books.iheal.5606, 1960.
Caillouet, L., Vidal, J.-P., Sauquet, E., Devers, A., and Graff, B.: Ensemble reconstruction of spatio-temporal extreme low-flow events in France since 1871, Hydrol. Earth Syst. Sci., 21, 2923–2951, https://doi.org/10.5194/hess-21-2923-2017, 2017.
Chagas, V. B. P., Chaffe, P. L. B., Addor, N., Fan, F. M., Fleischmann, A. S., Paiva, R. C. D., and Siqueira, V. A.: CAMELS-BR: hydrometeorological time series and landscape attributes for 897 catchments in Brazil, Earth Syst. Sci. Data, 12, 2075–2096, https://doi.org/10.5194/essd-12-2075-2020, 2020.
Chokkavarapu, N. and Mandla, V. R.: Comparative study of GCMs, RCMs, downscaling and hydrological models: a review toward future climate change impact estimation, SN Appl. Sci., 1, 1698, https://doi.org/10.1007/s42452-019-1764-x, 2019.
Coles, S.: An Introduction to Statistical Modeling of Extreme Values, Springer, London, 209 pp., https://doi.org/10.1007/978-1-4471-3675-0, 2001.
Coron, L., Andréassian, V., Perrin, C., and Le Moine, N.: Graphical tools based on Turc-Budyko plots to detect changes in catchment behaviour, Hydrol. Sci. J., 60, 1394–1407, https://doi.org/10.1080/02626667.2014.964245, 2015.
Coron, L., Thirel, G., Delaigue, O., Perrin, C., and Andréassian, V.: The suite of lumped GR hydrological models in an R package, Environ. Modell. Softw., 94, 166–171, https://doi.org/10.1016/j.envsoft.2017.05.002, 2017.
Coron, L., Delaigue, O., Thirel, G., Dorchies, D., Perrin, C., and Michel, C.: airGR: Suite of GR Hydrological Models for Precipitation-Runoff Modelling, R package version 1.7.6., https://doi.org/10.15454/EX11NA, 2020.
Coxon, G., Addor, N., Bloomfield, J. P., Freer, J., Fry, M., Hannaford, J., Howden, N. J. K., Lane, R., Lewis, M., Robinson, E. L., Wagener, T., and Woods, R.: CAMELS-GB: hydrometeorological time series and landscape attributes for 671 catchments in Great Britain, Earth Syst. Sci. Data, 12, 2459–2483, https://doi.org/10.5194/essd-12-2459-2020, 2020.
Cressie, N.: The origins of kriging, Math. Geol., 22, 239–252, https://doi.org/10.1007/BF00889887, 1990.
Croley, T. E. and Hartmann, H. C.: Resolving Thiessen polygons, J. Hydrol., 76, 363–379, https://doi.org/10.1016/0022-1694(85)90143-X, 1985.
Crooks, S. M. and Kay, A. L.: Simulation of river flow in the Thames over 120 years: Evidence of change in rainfall-runoff response?, J. Hydrol.-Reg. Stud., 4, 172–195, https://doi.org/10.1016/j.ejrh.2015.05.014, 2015.
Dewandel, B., Lachassagne, P., Bakalowicz, M., Weng, P., and Al-Malki, A.: Evaluation of aquifer thickness by analysing recession hydrographs. Application to the Oman ophiolite hard-rock aquifer, J. Hydrol., 274, 248–269, https://doi.org/10.1016/S0022-1694(02)00418-3, 2003.
Dewandel, B., Lachassagne, P., and Qatan, A.: Spatial measurements of stream baseflow, a relevant method for aquifer characterization and permeability evaluation. Application to a hard-rock aquifer, the Oman ophiolite, Hydrol. Process., 18, 3391–3400, https://doi.org/10.1002/hyp.1502, 2004.
Di Piazza, A., Conti, F. L., Noto, L. V., Viola, F., and La Loggia, G.: Comparative analysis of different techniques for spatial interpolation of rainfall data to create a serially complete monthly time series of precipitation for Sicily, Italy, Int. J. Appl. Earth Observ. Geoinform., 13, 396–408, https://doi.org/10.1016/j.jag.2011.01.005, 2011.
Fowler, A.: Assessment of the validity of using mean potential evaporation in computations of the long-term soil water balance, J. Hydrol., 256, 248–263, 2002.
Fowler, K. J. A., Acharya, S. C., Addor, N., Chou, C., and Peel, M. C.: CAMELS-AUS: hydrometeorological time series and landscape attributes for 222 catchments in Australia, Earth Syst. Sci. Data, 13, 3847–3867, https://doi.org/10.5194/essd-13-3847-2021, 2021.
Gaucherel, C., Frelat, R., Lustig, A., Rouy, B., Chéry, Y., and Hubert, P.: Time–frequency analysis to profile hydrological regimes: application to Haiti, Hydrol. Sci. J., 61, 274–288, https://doi.org/10.1080/02626667.2015.1006231, 2016.
Gaucherel, C., Frelat, R., Salomon, L., Rouy, B., Pandey, N., and Cudennec, C.: Regional watershed characterization and classification with river network analyses, Earth Surf. Process. Landf., 42, 2068–2081, https://doi.org/10.1002/esp.4172, 2017.
Gaucherel, C., Frelat, R., Polidori, L., El Hage, M., Cudennec, C., Mondesir, P., and Moron, V.: Weak relationships between landforms and hydro-climatologic processes: a case study in Haiti, Hydrol. Res., 50, 744–760, https://doi.org/10.2166/nh.2018.041, 2018.
Gudmundsson, L. and Seneviratne, S. I.: Observation-based gridded runoff estimates for Europe (E-RUN version 1.1), Earth Syst. Sci. Data, 8, 279–295, https://doi.org/10.5194/essd-8-279-2016, 2016.
Gudmundsson, L., Do, H. X., Leonard, M., and Westra, S.: The Global Streamflow Indices and Metadata Archive (GSIM) – Part 2: Quality control, time-series indices and homogeneity assessment, Earth Syst. Sci. Data, 10, 787–804, https://doi.org/10.5194/essd-10-787-2018, 2018.
Gupta, H. V., Kling, H., Yilmaz, K. K., and Martinez, G. F.: Decomposition of the mean squared error and NSE performance criteria: Implications for improving hydrological modelling, J. Hydrol., 377, 80–91, https://doi.org/10.1016/j.jhydrol.2009.08.003, 2009.
Han, D. and Bray, M.: Automated Thiessen polygon generation, Water Resour. Res., 42, 5, https://doi.org/10.1029/2005WR004365, 2006.
Harrigan, S., Zsoter, E., Alfieri, L., Prudhomme, C., Salamon, P., Wetterhall, F., Barnard, C., Cloke, H., and Pappenberger, F.: GloFAS-ERA5 operational global river discharge reanalysis 1979–present, Earth Syst. Sci. Data, 12, 2043–2060, https://doi.org/10.5194/essd-12-2043-2020, 2020.
Hedges, S. B., Cohen, W. B., Timyan, J., and Yang, Z.: Haiti's biodiversity threatened by nearly complete loss of primary forest, P. Natl. Acad. Sci. USA, 115, 11850–11855, https://doi.org/10.1073/pnas.1809753115, 2018.
Höge, M., Kauzlaric, M., Siber, R., Schönenberger, U., Horton, P., Schwanbeck, J., Floriancic, M. G., Viviroli, D., Wilhelm, S., Sikorska-Senoner, A. E., Addor, N., Brunner, M., Pool, S., Zappa, M., and Fenicia, F.: CAMELS-CH: hydro-meteorological time series and landscape attributes for 331 catchments in hydrologic Switzerland, Earth Syst. Sci. Data, 15, 5755–5784, https://doi.org/10.5194/essd-15-5755-2023, 2023.
Horn, B. K.: Hill shading and the reflectance map, P. IEEE, 69, 14–47, 1981.
Jenkinson, A. F.: The frequency distribution of the annual maximum (or minimum) values of meteorological elements, Q. J. Roy. Meteorol. Soc., 81, 158–171, https://doi.org/10.1002/qj.49708134804, 1955.
Jones, P. D. and Lister, D. H.: Riverflow reconstructions for 15 catchments over England and Wales and an assessment of hydrologic drought since 1865, Int. J. Climatol., 18, 999–1013, https://doi.org/10.1002/(SICI)1097-0088(199807)18:9<999::AID-JOC300>3.0.CO;2-8, 1998.
Joseph, A.: Caractérisation et modélisation des écoulements de crue: application aux inondations de la ville de Cavaillon en Haiti, PhD, UCL – Université Catholique de Louvain, http://hdl.handle.net/2078.1/264969, 2019.
Joseph, A., Gonomy, N., Zech, Y., and Soares-Frazão, S.: Modelling and analysis of the flood risk at Cavaillon City, Haiti, La Houille Blanche, 104, 68–75, https://doi.org/10.1051/lhb/2018020, 2018.
Khouakhi, A., Villarini, G., and Vecchi, G. A.: Contribution of Tropical Cyclones to Rainfall at the Global Scale, J. Climate, 30, 359–372, https://doi.org/10.1175/JCLI-D-16-0298.1, 2017.
Klemeš, V.: Operational testing of hydrological simulation models, Hydrol. Sci. J., 31, 13–24, https://doi.org/10.1080/02626668609491024, 1986.
Klingler, C., Schulz, K., and Herrnegger, M.: LamaH-CE: LArge-SaMple DAta for Hydrology and Environmental Sciences for Central Europe, Earth Syst. Sci. Data, 13, 4529–4565, https://doi.org/10.5194/essd-13-4529-2021, 2021.
Kribèche, R.: Etude de la sensibilité d’un modèle pluie-débit à l’exactitude de l’évaporation (modèle GR4J), DEA Thésis, Université Paris XII, Créteil, 42 pp., 1994.
Krige, D. G.: A statistical approach to some mine valuation and allied problems on the Witwatersrand, M.Sc, Engineering, University of the Witwatersrand, 62 pp., http://hdl.handle.net/10539/17975 (last access: 24 April 2024), 1951.
Mathieu, G.: Développement d’une méthodologie pour la cartographie du risque d’inondation: application à la rivière de Cavaillon en Haïti, Ph.D., UCL – Université Catholique de Louvain, Belgium, 221 pp., https://hdl.handle.net/2078.1/273984 (last access: 24 April 2024), 2023.
Mompremier, R., Her, Y., Hoogenboom, G., and Song, J.: Effects of deforestation and afforestation on water availability for dry bean production in Haiti, Agr. Ecosyst. Environ., 325, 107721, https://doi.org/10.1016/j.agee.2021.107721, 2022.
Moron, V., Frelat, R., Jean-Jeune, P. K., and Gaucherel, C.: Interannual and intra-annual variability of rainfall in Haiti (1905–2005), Clim. Dynam., 45, 915–932, https://doi.org/10.1007/s00382-014-2326-y, 2015.
Mouelhi, S., Michel, C., Perrin, C., and Andréassian, V.: Stepwise development of a two-parameter monthly water balance model, J. Hydrol., 318, 200–214, https://doi.org/10.1016/j.jhydrol.2005.06.014, 2006.
Oriani, F., Stisen, S., Demirel, M. C., and Mariethoz, G.: Missing Data Imputation for Multisite Rainfall Networks: A Comparison between Geostatistical Interpolation and Pattern-Based Estimation on Different Terrain Types, J. Hydrometeorol., 21, 2325–2341, https://doi.org/10.1175/JHM-D-19-0220.1, 2020.
Oudin, L., Hervieu, F., Michel, C., Perrin, C., Andréassian, V., Anctil, F., and Loumagne, C.: Which potential evapotranspiration input for a lumped rainfall–runoff model?: Part 2 – Towards a simple and efficient potential evapotranspiration model for rainfall–runoff modelling, J. Hydrol., 303, 290–306, https://doi.org/10.1016/j.jhydrol.2004.08.026, 2005.
Pelletier, A. and Andréassian, V.: Hydrograph separation: an impartial parametrisation for an imperfect method, Hydrol. Earth Syst. Sci., 24, 1171–1187, https://doi.org/10.5194/hess-24-1171-2020, 2020.
Perrin, C., Michel, C., and Andréassian, V.: Improvement of a parsimonious model for streamflow simulation, J. Hydrol., 279, 275–289, https://doi.org/10.1016/S0022-1694(03)00225-7, 2003.
Peterson, T. C., Taylor, M. A., Demeritte, R., Duncombe, D. L., Burton, S., Thompson, F., Porter, A., Mercedes, M., Villegas, E., Fils, R. S., Tank, A. K., Martis, A., Warner, R., Joyette, A., Mills, W., Alexander, L., and Gleason, B.: Recent changes in climate extremes in the Caribbean region, J. Geophys. Res.-Atmos., 107, ACL16-1–ACL16-9, https://doi.org/10.1029/2002JD002251, 2002.
Pouyaud, B. and Hoepffner, M.: Rapport d’expertise hydrologique: appui au Service National des Ressources en Eau de la République d’Haïti, ORSTOM, Centre ORSTOM Montpellier, 35 pp., https://horizon.documentation.ird.fr/exl-doc/pleins_textes/divers12-05/010018883.pdf (last access: 24 April 2024), 1987.
Prakash, S.: Performance assessment of CHIRPS, MSWEP, SM2RAIN-CCI, and TMPA precipitation products across India, J. Hydrol., 571, 50–59, https://doi.org/10.1016/j.jhydrol.2019.01.036, 2019.
R Core Team: R: A Language and Environment for Statistical Computing, R Foundation for Statistical Computing, Vienna, Austria, https://www.R-project.org/ (last access: 24 April 2024), 2022.
Reuter, H. I., Nelson, A., and Jarvis, A.: An evaluation of void-filling interpolation methods for SRTM data, Int. J. Geogr. Inf. Sci., 21, 983–1008, https://doi.org/10.1080/13658810601169899, 2007.
Rohde, R., Muller, R. A., Jacobsen, R., Muller, E., Perlmutter, S., Rosenfeld, A., Wurtele, J., Groom, D., and Wickham, C.: A new estimate of the average Earth surface land temperature spanning 1753 to 2011, Geoinfor. Geostat: An Overview, 1, 1, https://doi.org/10.4172/2327-4581.1000101, 2013.
Slivinski, L. C., Compo, G. P., Whitaker, J. S., Sardeshmukh, P. D., Giese, B. S., McColl, C., Allan, R., Yin, X., Vose, R., Titchner, H., Kennedy, J., Spencer, L. J., Ashcroft, L., Brönnimann, S., Brunet, M., Camuffo, D., Cornes, R., Cram, T. A., Crouthamel, R., Domínguez-Castro, F., Freeman, J. E., Gergis, J., Hawkins, E., Jones, P. D., Jourdain, S., Kaplan, A., Kubota, H., Blancq, F. L., Lee, T.-C., Lorrey, A., Luterbacher, J., Maugeri, M., Mock, C. J., Moore, G. W. K., Przybylak, R., Pudmenzky, C., Reason, C., Slonosky, V. C., Smith, C. A., Tinz, B., Trewin, B., Valente, M. A., Wang, X. L., Wilkinson, C., Wood, K., and Wyszyñski, P.: Towards a more reliable historical reanalysis: Improvements for version 3 of the Twentieth Century Reanalysis system, Q. J. Roy. Meteorol. Soc., 145, 2876–2908, https://doi.org/10.1002/qj.3598, 2019.
Smith, K. A., Barker, L. J., Tanguy, M., Parry, S., Harrigan, S., Legg, T. P., Prudhomme, C., and Hannaford, J.: A multi-objective ensemble approach to hydrological modelling in the UK: an application to historic drought reconstruction, Hydrol. Earth Syst. Sci., 23, 3247–3268, https://doi.org/10.5194/hess-23-3247-2019, 2019.
Strohmenger, L., Sauquet, E., Bernard, C., Bonneau, J., Branger, F., Bresson, A., Brigode, P., Buzier, R., Delaigue, O., Devers, A., Evin, G., Fournier, M., Hsu, S.-C., Lanini, S., de Lavenne, A., Lemaitre-Basset, T., Magand, C., Mendoza Guimarães, G., Mentha, M., Munier, S., Perrin, C., Podechard, T., Rouchy, L., Sadki, M., Soutif-Bellenger, M., Tilmant, F., Tramblay, Y., Véron, A.-L., Vidal, J.-P., and Thirel, G.: On the visual detection of non-natural records in streamflow time series: challenges and impacts, Hydrol. Earth Syst. Sci., 27, 3375–3391, https://doi.org/10.5194/hess-27-3375-2023, 2023.
Tarboton, D. G., Watson, D. W., Wallace, R., Schreuders, K. A. T., and Neff, J.: Terrain Analysis Using Digital Elevation Models, Utah State University, 48 pp., https://hydrology.usu.edu/taudem (last access: 24 April 2024), 2005.
Tarter, A., Freeman, K. K., Ward, C., Sander, K., Theus, K., Coello, B., Fawaz, Y., Miles, M., and Ahmed, T. T. G.: Charcoal in Haiti: A National Assessment of Charcoal Production and Consumption Trends, World Bank, Washington, DC, https://doi.org/10.1596/31257, 2018.
Terrier, M., Bialkowski, A., Nachbaur, A., Prépetit, C., and Joseph, Y. F.: Revision of the geological context of the Port-au-Prince metropolitan area, Haiti: implications for slope failures and seismic hazard assessment, Nat. Hazards Earth Syst. Sci., 14, 2577–2587, https://doi.org/10.5194/nhess-14-2577-2014, 2014.
Terrier, M., Rançon, J.-P., Bertil, D., Chêne, F., Desprats, J.-F., Lecacheux, S., Le Roy, S., Stollsteiner, P., Bouc, O., and Raynal, M.: Atlas des menaces naturelles en Haïti, Comité Interministériel d’Aménagement du Territoire., Bradley Lyon, Rafael Van der Borght, Haïti, 114 pp., ISBN 978-99970-4-871-4, 2017.
Teutschbein, C. and Seibert, J.: Bias correction of regional climate model simulations for hydrological climate-change impact studies: Review and evaluation of different methods, J. Hydrol., 456–457, 12–29, https://doi.org/10.1016/j.jhydrol.2012.05.052, 2012.
Tramblay, Y., Rouché, N., Paturel, J.-E., Mahé, G., Boyer, J.-F., Amoussou, E., Bodian, A., Dacosta, H., Dakhlaoui, H., Dezetter, A., Hughes, D., Hanich, L., Peugeot, C., Tshimanga, R., and Lachassagne, P.: ADHI: the African Database of Hydrometric Indices (1950–2018), Earth Syst. Sci. Data, 13, 1547–1560, https://doi.org/10.5194/essd-13-1547-2021, 2021.