the Creative Commons Attribution 4.0 License.
the Creative Commons Attribution 4.0 License.
Production and application of manure nitrogen and phosphorus in the United States since 1860
Zihao Bian
Qichun Yang
Rongting Xu
Shufen Pan
Bowen Zhang
Livestock manure nitrogen (N) and phosphorus (P) play an important role in biogeochemical cycling. Accurate estimation of manure nutrient is important for assessing regional nutrient balance, greenhouse gas emission, and water environmental risk. Currently, spatially explicit manure nutrient datasets over a century-long period are scarce in the United States (US). Here, we developed four datasets of annual animal manure N and P production and application in the contiguous US at a 30 arcsec resolution over the period of 1860–2017. The dataset combined multiple data sources including county-level inventory data as well as high-resolution livestock and crop maps. The total production of manure N and P increased from 1.4 Tg N yr−1 and 0.3 Tg P yr−1 in 1860 to 7.4 Tg N yr−1 and 2.3 Tg P yr−1 in 2017, respectively. The increasing manure nutrient production was associated with increased livestock numbers before the 1980s and enhanced livestock weights after the 1980s. The manure application amount was primarily dominated by production, and its spatial pattern was impacted by the nutrient demand of crops. The intense-application region mainly enlarged from the Midwest toward the southern US and became more concentrated in numerous hot spots after the 1980s. The South Atlantic–Gulf and Mid-Atlantic basins were exposed to high environmental risks due to the enrichment of manure nutrient production and application from the 1970s to the period of 2000–2017. Our long-term manure N and P datasets provide detailed information for national and regional assessments of nutrient budgets. Additionally, the datasets can serve as the input data for ecosystem and hydrological models to examine biogeochemical cycles in terrestrial and aquatic ecosystems. Datasets are available at https://doi.org/10.1594/PANGAEA.919937 (Bian et al., 2020).
- Article
(6727 KB) - Full-text XML
-
Supplement
(260 KB) - BibTeX
- EndNote
Animal manure, as a fertility package, is a traditional source of nutrients and can provide abundant nitrogen (N), phosphorus (P), and potassium for cropland and pasture. Animal manure nutrients circulate widely in the soil–plant–animal system and are highly involved in global nutrient cycling (Bouwman et al., 2013; Sheldrick et al., 2003). Although synthetic fertilizer has been widely used since the mid-20th century, livestock excreta are still the major nutrient source in agricultural soils, accounting for approximately 18 % and 28 % of the total N and P inputs to global cropland, respectively (Sheldrick et al., 2003; Zhang et al., 2020). Moreover, the total global animal manure N and P production has exceeded global fertilizer use (Bouwman et al., 2009). Therefore, the efficient recycling of manure can potentially meet the growing nutrient demand of crops. The circular nutrient source provided by manure enables nations to sustain their agricultural production with less reliance on imported fertilizer, especially mineral P fertilizer (Koppelaar and Weikard, 2013; Powers et al., 2019). Different from N, which can be fixed from the atmosphere through microbial symbiosis with plants and the Haber–Bosch process, P is a rock-derived nutrient, and there is no biological or atmospheric source for P. The limited and unevenly distributed P-rich rocks can threaten food security and have raised concerns in many resource-limited countries, including the United States (US) (Amundson et al., 2015). Enhanced recovery of nutrients from manure can not only increase agricultural dependence but also reduce nutrient losses out of the soil–plant–animal system. Additionally, the improvement of livestock operations in recent decades also facilitated the recoverability and utilization of animal manure (Kellogg et al., 2000).
Although the application of manure and fertilizer enhanced crop production, excessive nutrients might leave the soil–plant–animal system through the biogeochemical flow and potentially contaminate the environment if not properly managed (Mueller and Lassaletta, 2020; Zanon et al., 2019). Specifically, agricultural land is a sink for anthropogenic N and P inputs (e.g., synthetic fertilizer, manure, atmospheric deposition) and simultaneously acts as N and P sources for aquatic systems as well as an N source for the atmosphere (Bouwman et al., 2013; Elser and Bennett, 2011; Schlesinger and Bernhardt, 2013). The major N gaseous loss from fertilizer use and animal excreta includes the emissions of ammonia (NH3), nitrous oxide (N2O), and nitric oxide. NH3 can react with other air pollutants and form aerosols to reduce visibility and threaten human health (Bouwman et al., 2002; Xu et al., 2018), and N2O is one of the most important greenhouse gases (Davidson, 2009). N2O emission from animal manure is one of the major contributors to global anthropogenic N2O emissions (Tian et al., 2020). Additionally, large fractions of the N and P applied to cropland are lost through leaching, erosion, and surface runoff and are transported into rivers toward lakes and coastal oceans (Smith et al., 1998; Van Drecht et al., 2005). Excess N and P could dramatically impair freshwater and coastal ecosystems, causing eutrophication, hypoxia, and fish-killing (Garnier et al., 2015; Smith et al., 2007). Oxygen-depleted marine coastal “dead zones” associated with nutrient-stimulated algal blooms continue to expand. For example, the northern Gulf of Mexico is one of the largest dead zones in the world, and the hypoxic area often exceeds 15 600 km2 in midsummer (1968–2016) (Del Giudice et al., 2019).
Considering the importance of manure nutrients in crop production, greenhouse gas emission, and water pollution, it is vital to have a better understanding of livestock manure nutrient production and application at national or even global scales (Potter et al., 2010; Sheldrick et al., 2002; Tian et al., 2016). Quantized and spatialized manure nutrient data can help stakeholders find a local recyclable nutrient source or make strategies to minimize N and P losses. Currently, most studies only provide county-level manure nutrient production data in the US, with short periods (Kellogg et al., 2000; Ruddy et al., 2006). Nevertheless, terrestrial-biosphere models usually require spatially explicit manure nutrient input data to simulate the anthropogenic effect on biogeochemical cycles since the preindustrial period (Tian et al., 2019). Studies focusing on soil nutrient storage change and legacy soil nutrients also need long time series of manure nutrient data (MacDonald et al., 2012; Rowe et al., 2016). Moreover, previous studies usually assumed that nutrient excretion per animal is constant over time when quantifying nutrient production based on livestock number, which may lead to uncertainties (Zhang et al., 2020). Geographically explicit manure nutrient application in cropland (excluding pasture) as the direct nutrient input for the soil–crop system has not been specifically estimated across the US. In this study, our objectives are to (1) develop grid-level manure N and P production datasets in the US based on county-level livestock populations, dynamic livestock weight over time, and high-resolution livestock distribution maps; (2) develop grid-level manure N and P application in cropland datasets by integrating manure nutrient production and nutrient demand of crops; (3) investigate the spatiotemporal patterns of manure nutrient production and application based on these datasets; and (4) further identify regions with a high risk of excessive nutrient loading. The four datasets display the masses of manure N and P per area in each 30×30 arcsec grid cell during 1860–2017. The datasets can be used to drive ecosystem, land surface, and hydrological models to simulate manure-induced greenhouse gas emissions and nutrient loadings.
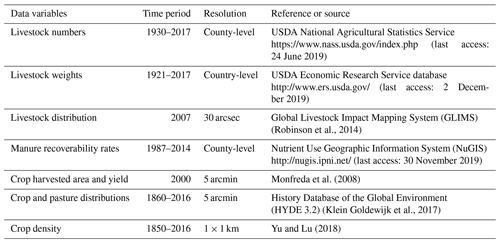
Datasets of manure N and P production and application were developed by incorporating multiple datasets (Table 1). The geographically explicit manure N and P production data were first calculated based on county-level livestock populations, dynamic livestock weights, and livestock distribution maps. Then the crop nutrient demand maps were developed by merging cropland distribution maps with crop-specific harvest area and nutrient-assimilative capacities. Finally, the spatially explicit manure N and P application data were estimated by incorporating county-level manure production, recoverability factors, cropland fraction, and cropland nutrient demand maps. To facilitate the study of the impact of manure nutrients on water quality, we further analyzed the average annual manure production and application in 4 decades (the 1860s, 1930s, 1970s, and 2010–2017) across the major 18 basins (Fig. 1).
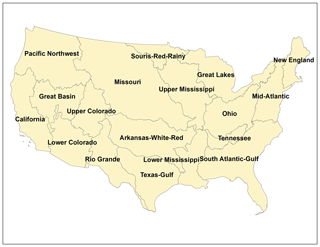
Figure 1Map of 18 hydrologic units in the contiguous US (recreated from the US hydrologic unit map: https://water.usgs.gov/GIS/regions.html, last access: 17 December 2019).
2.1 Manure nutrient production
Manure nutrient production refers to the animal excretion in this study. The county-level manure N and P production during 1930–2017 was calculated based on the livestock population, animal body weight, and nutrient excretion rates according to the method (Eq. 1) proposed by Puckett et al. (1998).
County-level manure nutrient production was calculated as follows:
where Prox,c is the annual manure nutrient x (N or P) production in county c (kg N yr−1 or kg P yr−1), i is animal type, Popi,c is the county-level animal population (head), Wi is the annual average live body weights of the animal (kg), Erx,i represents the excreted-manure-nutrient rate per unit weight of the animal (kg N kg−1 d−1 or kg P kg−1 d−1) (Table S1), and Days is the number of days in the life cycle of the animal within a year.
Data of livestock and poultry population were derived from the US Department of Agriculture (USDA) census reports from 1930 to 2017 at 4- or 5-year intervals. A total of 11 livestock and poultry categories were considered in this study, including beef cows, milk cows, heifers, steers, hogs, sheep, horses, chickens, pullets, broilers, and turkeys. Livestock population data for the five most recent census reports (1997–2017) can be directly collected from the USDA Census Data Query Tool. Livestock population data before 1997 were collected from the Cornell Institute for Social and Economic Research Data Archive (1949–1992) or manually digitalized from the USDA reports (1930–1945). More details of data collection and methods of dealing with missing data can be found in Yang et al. (2016). Annual average live weights of livestock and poultry, including cattle, hogs, sheep, broilers, chickens, and turkeys, were derived from the USDA Economic Research Service. We developed annual manure nutrient production by assuming a linear change between every 2 census years.
The Global Livestock Impact Mapping System (GLIMS) provided gridded livestock population maps at a resolution of 30 arcsec (https://livestock.geo-wiki.org/home-2/, last access: 2 August 2019). These maps were developed according to statistical relationships between livestock inventory data and multiple environmental variables, including climate, land cover, and human activities (Robinson et al., 2014). Combining with the GLIMS data, we spatially allocated manure nutrient production within each county. The grid-level manure nutrient production was first calculated based on the GLIMS data, and the total quantity of manure nutrient production in each county was obtained by calculating the sum of production in all grid cells within each county. Then, we calculated ratios of USDA-based county-level manure nutrient production to GLIMS-based county-level data, and these ratios were used to adjust grid cell values within each county. After this step, the developed grid-level products were in line with USDA-based annual county-level data in total quantities, with the spatial pattern inside each county inherited from the GLIMS-based manure nutrient production data (Eq. 2).
where Prox,j is manure nutrient production in grid cell j (kg N km−2 yr−1 or kg P km−2 yr−1), GProx,j is manure nutrient production in grid cell j calculated based on the GLIMS livestock data (kg N km−2 yr−1 or kg P km−2 yr−1), and GProx,c is the GLIMS-based manure nutrient production at county c where grid cell j is located (kg N yr−1 or kg P yr−1).
To generate grid-level manure production from 1860 to 1930, we obtained manure production change rates (1860–1930) from the dataset developed by Holland et al. (2005) and applied them to the grid-level manure nutrient production in 1930. Holland et al. (2005) provided global annual manure N production data from 1860 to 1960. In order to combine this dataset with the US manure nutrient production data, we assumed manure production changes in the US were consistent with the global trend, and the manure N:P ratio was constant during 1860–1930 (Zhang et al., 2017).
2.2 Manure nutrient application
Manure nutrient application data were developed by allocating the county-level recoverable manure nutrients according to the grid-level manure nutrient demand of crops. The recoverable manure nutrients represent the proportion of manure nutrients that could reasonably be expected to be collected from the confinement facility and later be applied to the land (Kellogg et al., 2000). The recoverable manure nutrients were applied to cropland and pastureland according to their demands. We calculated recoverable manure nutrient amounts by adjusting the county-level manure production with recoverability factors provided by the Nutrient Use Geographic Information System (NuGIS; http://nugis.ipni.net/, last access: 30 November 2019). The nutrient demand was estimated according to the assimilative capacity, the maximum amount of manure nutrient application without building up nutrient levels in the soil over time (Kellogg et al., 2000). We obtained the proportion of recoverable manure nutrients that can be applied to cropland by combining the assimilative capacities and areas of cropland and pastureland. The areas of cropland and pastureland during 1860–2016 were derived from the HYDE 3.2 (Klein Goldewijk et al., 2017).
The abovementioned processes are represented by the following equations:
where APPx,c is the recoverable animal manure nutrients available for application on cropland in county c (kg N yr−1 or kg P yr−1), Rfx,c is the manure nutrient recoverability rate (the recoverability rates are unitless and county-specific, with average values 0.19 for N and 0.35 for P), and refers to the fraction of manure nutrients that are available for cropland (unitless); Acrop,c and Apast,c represent the annual area of cropland and pasture in each county (km2), respectively, while Sx,crop and Sx,past represent the average assimilative capacities of cropland and pastureland (kg N km−2 or kg P km−2), respectively (Table S2).
To spatialize county-level recoverable animal manure nutrients to gridded maps, we first developed annual grid-level crop nutrient demand data as the base maps (Eq. 5). Nutrient demands of crops were estimated by combining the assimilative capacities, harvested areas, and yields of 13 crops (maize, soybeans, sorghum, cotton, barley, wheat, oats, rye, rice, peanuts, sugar beets, tobacco, and potatoes). The grid-level average assimilative capacity of cropland was calculated based on crop-specific yield and harvested-area maps in 2000 provided by Monfreda et al. (2008). Next, this map of cropland assimilative capacity was integrated with dynamic-cropland-fraction data (Yu and Lu, 2018) to obtain annual nutrient demand maps from 1860 to 2016. Original cropland fraction data were at a resolution of 1 km in the projected coordinate system, which approximates 30 arcsec resolution in the geographic coordinate system. We resampled the cropland fraction maps into the resolution of 30 arcsec to match the manure nutrient production data.
where Demx,j is the crop demand for manure nutrients in grid j (kg N km−2 yr−1 or kg P km−2 yr−1), Yj,k is the yield of crop k (metric tons per area of cropland), and Sx,k is the manure-nutrient-assimilative capacities of crop k (kg N or kg P per metric ton product) (Table S3); Denj represents the cropland density in each grid (unitless).
The downscaling of county-level recoverable manure nutrient data into grid maps was similar to the method used in developing manure nutrient production data (Eq. 2). The grid values on manure nutrient demand maps were adjusted to match annual county-level recoverable manure nutrient data (Eq. 6). The manure nutrient application data from 1860 to 2017 were developed through the abovementioned processes; however, several variables and parameters in these processes were not available through the whole study period (e.g., manure recoverability rate, crop yield). Therefore, we assumed these variables or parameters did not change before or after the data-available period (Kellogg et al., 2000; Puckett et al., 1998).
where APPx,j is the manure nutrient application in grid j (kg N km−2 yr−1 or kg P km−2 yr−1), and Demx,c refers to the demand for manure nutrients in county c where grid j is located (kg N yr−1 or kg P yr−1).
3.1 Temporal and spatial patterns of manure nutrient production
We estimate that the total manure N and P production increased from 1.4 Tg N yr−1 and 0.3 Tg P yr−1 in 1860 to 7.4 Tg N yr−1 and 2.3 Tg P yr−1 in 2017, respectively (Fig. 2). The manure N and P production reached the first peak in 1975 (6.1 Tg N yr−1 and 1.8 Tg P yr−1), and slightly declined thereafter; it has been regrowing since 1987, with the second peaks occurring in 2007 (N) and 2017 (P), respectively. The slight decrease in manure nutrient production between 2008 and 2012 may be associated with the financial crisis and the low demand for livestock products. The total manure N and P production increased fivefold and sevenfold during 1860–2017, with the increasing rates of 0.03 Tg N yr−2 and 0.006 Tg P yr−2 during 1860–1930 and 0.05 Tg N yr−2 and 0.02 Tg P yr−2 during 1930–2017 (p<0.01), respectively. The N:P ratio in total manure production changed from 4.33 in 1930 to 3.25 in 2017. The decrease in the N:P ratio in total manure production was related to the change in the structure of animal population. For example, the proportion of beef cows and broilers (N:P ratio in excretion: 3.0–3.2) increased, while that of milk cows and horses (N:P ratio in excretion: 5.5–6.7) decreased over the study period.
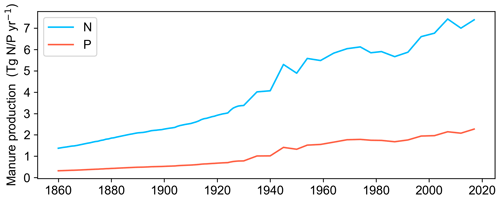
Figure 2Trend and variation in total manure N and P production in the contiguous US from 1860 to 2017.
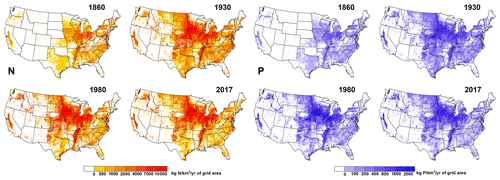
The spatial pattern of animal manure N and P production showed a similar change over the study period (Fig. 3). The distribution maps showed that the midwestern US (e.g., Iowa, Missouri, and Illinois) was the core region (> 300 kg N km−2 yr−1 or 100 kg P km−2 yr−1) of manure N and P production in 1860. From 1860 to 1930, the high-manure-nutrient production region (> 600 kg N km−2 yr−1 or 200 kg P km−2 yr−1) mainly enlarged outwards from the Midwest. Between 1930 and 1980, manure N and P production intensified not only in the Midwest but also in the southern US (e.g., Texas, Georgia, and North Carolina). After 1980, manure N and P production became more concentrated in many hot spots (> 6000 kg N km−2 yr−1 or 3000 kg P km−2 yr−1), especially in the southeastern US. Meanwhile, parts of the regions around these hot spots experienced a decline in manure production.
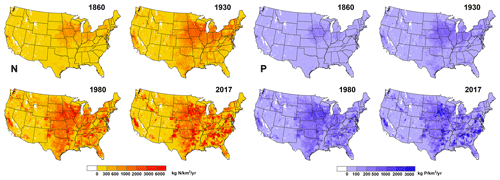
Figure 3Spatial distribution of manure N and P production across the contiguous US in 1860, 1930, 1980, and 2017. (Note: 1930 and 2017 were the earliest and latest years of available USDA census data, respectively, and 1980 was chosen as the year in the middle of these 2 years.)
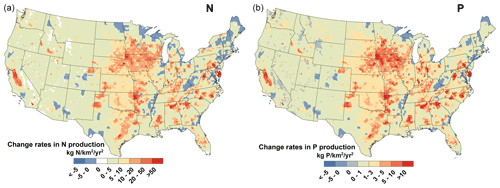
According to the change rates of manure nutrient production from 1860 through 2017 (Fig. 4), several growth poles (change rates > 20 kg N km−2 yr−2 or 5 kg P km−2 yr−2, p<0.01) located in Iowa, Arkansas, California, Alabama, and Pennsylvania were identified. The belt (change rates >5 kg N km−2 yr−2 or 1 kg P km−2 yr−2, p<0.01) from Minnesota to Texas, as well as scattered areas along the east and west coasts, was the primary contributor to the increase in manure N and P production. Aside from the huge increase in the Midwest and southeast, decreasing trends were exhibited in some regions, particularly the northeastern border of the US.
3.2 Comparison of manure nutrient demand and production
We assumed that the capacity of crops to assimilate nutrients was equal to manure nutrient demand. From 1860 to 1930, the manure N and P demand of cropland intensified and enlarged inside the Corn Belt region (e.g., Iowa, Illinois, Minnesota, Nebraska, North Dakota, and South Dakota) as well as the southern US (e.g., Texas, Oklahoma, Arkansas, Mississippi, Alabama, Georgia, and Tennessee) (Fig. 5). After 1930, change in the spatial pattern of manure nutrient demand was dominated by the abandonment of cropland, and the magnitude of demand slightly decreased, especially after 1980. Compared to the spatial patterns of manure production and demand (Figs. 3 and 5), it is worth noting that the regions of high manure production and demand overlapped in the Midwest and southeastern US, but a large deficit (demand higher than production) existed along the Lower Mississippi River valley.
3.3 Temporal and spatial patterns of manure nutrient application in cropland
Animal manure N and P application amount is primarily dominated by production and its spatial pattern is impacted by demand. The overall manure-application-to-production ratios were 0.15 and 0.23 for N and P, respectively. Driven by cropland expansion and enhanced manure production, total manure N and P application in croplands have increased 9-fold and 10-fold since 1860, reaching 1.3 Tg N yr−1 and 0.6 Tg P yr−1 in 2017 (Fig. 6). The N:P ratio in manure application decreased from 2.62 to 2.32 during 1930–2017. The substantial increase in manure N and P application mainly happened in two periods: 1924–1970 (increase rates: 0.009 Tg N yr−2 and 0.005 Tg P yr−2, p<0.01) and 1987–2017 (increase rates: 0.01 Tg N yr−2 and 0.005 Tg P yr−2, p<0.01). The variations in total application and production quantities did not follow the same trajectory. For example, from 1975 to 1987, when manure N production decreased, the total manure application still remained stable. The application-to-production ratios reached the first peak in 1891 (N: 0.14; P: 0.25), followed by a decrease until 1945 (N: 0.13; P: 0.20), and then resumed the increasing trend through 2017 (N: 0.18; P: 0.25).
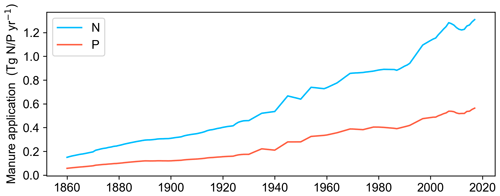
Figure 6Trend and variations in total manure N and P application in the contiguous US from 1860 to 2017.
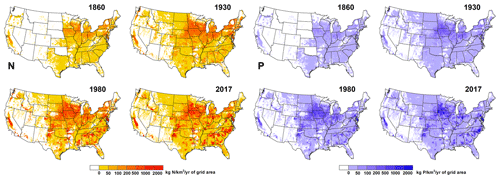
The spatial shift in manure application, similar to manure nutrient demand, gradually expanded inside the Corn Belt and toward the southern US (Fig. 7). The expansion of the manure application region primarily occurred during 1860–1930, induced by cropland expansion. After 1930, the changed spatial patterns of manure N and P application were characterized by intensified application in the Midwest and multiple hot spots (> 2000 kg N km−2 yr−1 or 1000 kg P km−2 yr−1). The spatial distribution of hot spots on application maps was similar to that on manure nutrient production maps. In 2017, regions of high manure nutrient application (> 500 kg N km−2 yr−1 or 200 kg P km−2 yr−1) were mainly distributed in the midwestern US, southern US, Mid-Atlantic (e.g., Pennsylvania, Maryland, and Virginia), and California, where abundant recoverable manure nutrients were applied in the local cropland to meet the high nutrient demand of crops. A quite low manure nutrient application rate (< 100 kg N km−2 yr−1 or 50 kg P km−2 yr−1) was observed in regions with less cropland demand (e.g., southwestern US) and low manure production (e.g., Lower Mississippi River valley).
3.4 Manure production and application across the major river basins
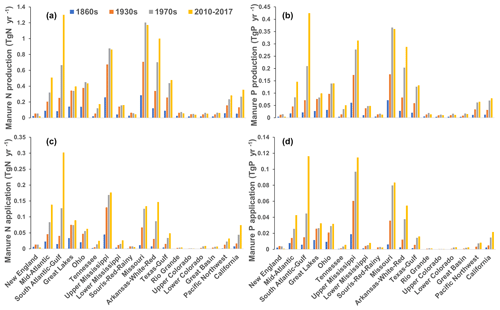
From the 1860s to the 1970s, all basins exhibit increased manure nutrient production (Fig. 8a and b). However, from the 1970s to the 2010s, the manure N and P production decreased in the New England and Missouri basins, while a dramatic increase was shown in the South Atlantic–Gulf, Mid-Atlantic, and Arkansas–White–Red basins. Manure application demonstrated a similar pattern across different basins (Fig. 8c and d), but it increased from the 1970s to the 2010s in most basins except the two basins (the New England and Souris–Red–Rainy) in the northern regions. In the 1970s, the Missouri basin was the largest source, contributing ∼ 20 % N and P of the total manure production, while the Upper Mississippi basin had the highest manure N and P application in cropland accounting for 19 % N and 24 % P of the total manure N and P application. During 2011–2017, however, the dominant regions of manure nutrient production and application were shifted to the South Atlantic–Gulf basin, which accounted for the largest single share (18 % N and 19 % P of the total N and P production, 24 % N and 21 % P of the total N and P application). The uneven distribution of manure application intensified during 1860–2017, demonstrated by the standard deviation of manure N and P application across all basins consistently increasing, from 0.013 Tg N yr−1 and 0.005 Tg P yr−1 in the 1860s to 0.081 Tg N yr−1 and 0.038 Tg P yr−1 during 2010–2017.
4.1 Comparison with previous investigations
Within this study, we compared manure nutrient production data with the other four datasets from the Food and Agriculture Organization Corporate Statistical Database (FAOSTAT, 2019), NuGIS, Kellogg et al. (2000), and Yang et al. (2016). FAOSTAT provides total manure N production at the national level from 1961 to 2017, while the other three datasets provide county-level manure N and P production data. The estimated manure N and P production from this study was lower than FAOSTAT (2019) and Yang et al. (2016) before 1982 and started to become the highest after 2003 (Fig. 9). During 1982–2007, the estimation from this study is very close to other estimations developed at the county level. The average total manure N (P) production over 1987–1997 was 6.02 Tg N yr−1 (1.79 Tg P yr−1), 6.75 Tg N yr−1, 5.96 Tg N yr−1 (1.75 Tg P yr−1), 5.64 Tg N yr−1 (1.67 Tg P yr−1), and 6.01 Tg N yr−1 (1.86 Tg P yr−1), respectively, for this study, FAOSTAT, NuGIS, Kellogg et al., and Yang et al. The differences among the datasets were derived from calculation methods, chosen livestock types and numbers, and parameters such as animal-specific excreted manure nutrient rates and the number of days in the life cycle. In terms of changing trends, manure N and P production was relatively stable after the 1960s in FAOSTAT, Kellogg et al. (2000), and Yang et al. (2016), while the NuGIS data increased slightly between 1987 and 2007 and then decreased sharply after 2010. In contrast, our results showed an increasing trend after the 1980s due to the consideration of the increased animal body sizes.
In the previous four datasets, temporal changes in manure N and P production are driven by animal numbers. It is worth noting that manure N and P production can still increase despite the stabilization of livestock numbers in recent years. Driven by advanced technology, livestock live weight and size consistently increased, which may enhance the manure nutrient excretion rate of each animal (Lassaletta et al., 2014; Sheldrick et al., 2003; Thornton, 2010). We compared manure nutrient production calculated with constant average weights and with dynamic weights of livestock. The results showed that manure production with dynamic weights increased dramatically after the 1990s (Fig. 10). Enhanced livestock weights contributed 59 % and 54 % of the increase in manure N and P production, respectively, from 1987 to 2017, when the differences between the total production data reached 0.98 Tg N yr−1 and 0.31 Tg P yr−1.

Figure 10Comparison of manure N and P production calculated based on dynamic weight of livestock and constant weight.
It is difficult to compare our dataset of manure N and P application in cropland with previous studies since these datasets provided reference values with various definitions and were generated based on different statistical methods. For example, FAOSTAT provided annual data of “manure applied to soils” in the US, whereas this dataset was developed based on the assumption that all treated manure (net of losses; e.g., NH3 volatilization, N leaching, and runoff) is applied to soils following the method in the 2006 Intergovernmental Panel on Climate Change (IPCC) guidelines (Eggleston et al., 2006). Kellogg et al. (2000) and NuGIS both estimated recoverable manure nutrients by multiplying confined livestock units, recoverability factors, and nutrients per metric ton of manure after losses. All three datasets do not separate manure application to cropland and pastureland. This study developed manure nutrient application data in cropland by applying the method of recoverability factor in combination with the cropland nutrient-assimilative capacity. Compared to the other three datasets, our data subtracted the proportion of manure application on pastureland and considered the impact of the change in cropland area, which can lead to relatively low data values.
4.2 The impact of manure nutrient enrichment on coastal oceans
Animal manure N and P that are lost through surface runoff or leaching exacerbated eutrophication and hypoxia in the aquatic system in the US (Feyereisen et al., 2010; Williams et al., 2011). During the expansion of manure production from the Midwest to the southeastern coastline, massive amounts of nutrients got more of a chance to be transported to the estuary. When rivers transport nutrients from land to coastal oceans, nutrients could be removed or retained through denitrification, plant and microbial uptake, organic matter burial in sediment, and sediment sorption (Billen et al., 1991; Seitzinger et al., 2002). As the accumulated manure gets closer to the coastline, manure nutrients that enter into rivers may be less likely to decrease during transportation due to the short distance. Additionally, the risk of massive manure loss in hurricane events increases against the background of enhanced Atlantic hurricane activities since 1995 (Saunders and Lea, 2008; Trenberth, 2005). Flooding rains and high winds may destroy manure storage structures (e.g., pad, pond, lagoon, tank, and building), resulting in the direct release of untreated manure into rivers (Tabachow et al., 2001).
The South Atlantic–Gulf and Mid-Atlantic basins are two critical coastal regions with the enrichment of manure nutrient production and application from the 1970s to the 2010s due to intensive livestock farming. The low recovery and reuse rate of animal manure N and P can potentially cause a significant amount of manure N and P export from the basins into the Gulf of Mexico and the Atlantic Ocean (Sheldrick et al., 2003). The Upper Mississippi, Missouri, and Arkansas–White–Red sub-basins within the Mississippi River basin were the three largest sources of manure production and were the dominant contributors to N and P loads into the Gulf of Mexico (David et al., 2010; Jones et al., 2019). The Upper Mississippi and Missouri basins had the highest manure nutrient production and application in the 1970s and maintained the high quantities until 2010, while manure N and P production and application largely increased in the Arkansas–White–Red basin during 2011–2017. The enhanced total manure production may continually be responsible for the enriched loads of N and P that can lead to coastal water pollution (Rabalais and Turner, 2019).
4.3 Implication for manure nutrient management
The structure of animal agriculture has shifted toward the concentrated animal feeding operations (CAFOs), which led to the increased numbers of animals in confinement (Kellogg et al., 2000). Thus, manure production became increasingly concentrated in several regions with large operations. Meanwhile, the decreased manure production in some areas of the midwestern and southern US was due to the disappearance of small family farms. On the other hand, the enhanced animal weight caused an additional increase in manure production in operations with plenty of confined animals. The unevenly intensified distribution of manure production may have further exacerbated the imbalance of regional nutrient allocation. Currently, opportunities for widespread manure application are limited because the transport of manure can be costly. Furthermore, the long distance between livestock farms and cropland can bring difficulties to practical operations (MacDonald, 2009). There remain gaps between manure production and demand in some regions of the US (e.g., the Lower Mississippi River valley). In contrast, manure collected from many farms cannot be properly used to fertilize crops. The unusable manure is not only a waste of manure resources but may also cause serious environmental problems through nutrient losses into the atmosphere and aquatic systems.
The efficient recovery and processing of manure nutrients, the transportation of manure from the CAFOs to the specific crop area, and the utilization of manure as bioenergy can be important pathways to control pollution caused by the uneven distribution of manure production (He et al., 2016). The CAFOs facilitate the recovery of animal manure, which has created conditions for large-scale utilization and management of manure. Because of the economies of scale, the cost of transportation and management per unit animal manure can be reduced, making the utilization of manure more feasible. Establishing a direct link between CAFOs and specific crop area ensures that animal manure production can be consumed in large quantities, thereby improving economic efficiency. For the centralized management of animal manure, nutrient losses during collection, storage, and application should be constrained or avoided because a small proportion of nutrient losses can even contaminate the regional environment if manure nutrient amounts are huge. Manure management systems with the integrated package of measures are necessary for controlling nutrient losses from the feed–animal–manure–crop chain (Oenema et al., 2007).
4.4 Assumptions and uncertainties
Uncertainties in this study are primarily associated with data sources and methods that were used. First, multiple data sources were used to develop the datasets of manure production and application data; however, biases exist in these source data. For instance, the non-disclosure of the livestock data in the USGS Census of Agriculture can cause an underestimate of manure production in numerous counties (Yang et al., 2016). Second, the parameters in the calculation model, e.g., excreted manure nutrient rates, could bring uncertainties in the estimation of animal manure nutrient production and application. Third, various assumptions were made in this study to extend the time series of data and spatialize data from the county level to the grid level. These assumptions were established based on available data and experience, but uncertainties still existed and influenced the accuracy of the dataset. The limitations and uncertainties in these assumptions were further discussed and explained in the following part.
The livestock distribution maps from the GLIMS dataset were the reference of the spatial pattern of manure nutrient production data within each county. The GLIMS data were developed by establishing statistical relationships between livestock inventory data and multiple environmental variables (e.g., climate, land cover, human activities) and using these relationships to predict livestock distributions across the globe. We assumed livestock distribution within each county was stable over the study period because the dynamic livestock maps were unavailable. However, the environmental variables can change and induce the variation in livestock distribution inside each county. The accuracy of this manure nutrient production dataset can be improved once dynamic livestock maps are developed in the future.
The manure nutrient production before 1930 was generated based on change rates in global manure N datasets from Holland et al. (2005). There is a period of overlap (1930–2004) between this global dataset and the USDA census data. During 1930–2004, the average annual change rates of manure N production were 1.08 % in the global dataset and 1.01 % in this study. Therefore, the changes in estimated manure N production in the US before 1930 might be reasonable at a long timescale. The ratio of N to P in animal manure varies among different animal species and changes along with proportions of different animal populations over time. From 1930 to 2017, the N:P ratio in the total manure production slightly decreased from 4.33 to 3.25. Due to the lack of manure P production data before 1930, we calculated manure P production in this period according to manure N production and the constant N:P ratio in 1930. If the N:P ratio kept decreasing before 1930, the total manure P production may be overestimated during 1860–1929.
Changes in recoverability factors and crop yields over the study period were ignored due to lack of data support and may cause a bias in quantifying manure nutrient application. With the development of livestock confinement facilities, the confinement and recoverability factors of animal manure may increase in recent decades (Kellogg et al., 2000). Hence, manure application can be overestimated before the 1980s and underestimated after the 2000s. The yields of different crops may change at different speeds over the study period, and that can affect the spatial patterns of manure nutrient demand of cropland as well as manure nutrient application.
In addition, the development of manure application data was based on two assumptions: (1) the allocation of manure nutrient application within the county was proportional to crop nutrient demands; (2) manure is assumed to be applied in the county where it was produced. Manure application is controlled by distance, cost, and operating practice of humans. Currently, the specific locations of animal farms across the country are not available; thus it is difficult to evaluate the influence of distances between farms and croplands. Due to the practical limits of manure transportation (Buckwell and Nadeu, 2016; MacDonald, 2009), it is reasonable to assume manure production and application happen within the same county on a large scale. However, ignoring the impact of multiple factors on manure application within the county can still result in biases in the spatial distribution of manure application.
The gridded datasets of manure N and P production and application in the contiguous US are available at https://doi.org/10.1594/PANGAEA.919937 (Bian et al., 2020). A Supplement is added to provide information about manure demand and all parameters used to develop the datasets.
Manure nutrient production and application in the livestock–crop system substantially altered the regional and global N and P cycle. In this study, we developed geographically explicit datasets of animal manure N and P production and their application in cropland across the contiguous US from 1860 to 2017. The dataset indicated that both manure N and P production and application significantly increased over the study period. Although livestock numbers became stable in recent decades, manure nutrient production still increased due to the enhanced livestock body weight after the 1980s. Enhanced livestock weights contributed 59 % and 54 % of the increase in manure N and P production, respectively, from 1987 to 2017. Meanwhile, manure nutrient production intensified and enlarged inside the Midwest and toward the southern US from 1980 to 2017 and became more concentrated in numerous hot spots. As manure nutrient application also expanded toward the southeastern coastline, massive amounts of nutrients got more of a chance to be transported to the estuary. The enrichment of manure nutrients in the South Atlantic–Gulf, Mid-Atlantic, and Mississippi River basins increased the risk of excessive nutrient loading into the Gulf of Mexico and the Atlantic Ocean under extreme weather conditions. Therefore, it is of great importance to effectively store, utilize, and transport animal manure in order to reduce nutrient pollution and restore the environment.
The supplement related to this article is available online at: https://doi.org/10.5194/essd-13-515-2021-supplement.
HT designed and led this work. ZB is responsible for developing the datasets. QY provided the county-level livestock dataset. RX proposed the methods in the study. SP and BZ analyzed the results. All authors contributed to the writing of the manuscript.
The authors declare that they have no conflict of interest.
This research has been supported by the National Science Foundation (grant no. 1903722), the National Oceanic and Atmospheric Administration (grant nos. NA16NOS4780204 and NA16NOS4780207), and the National Aeronautics and Space Administration (grant nos. NNX12AP84G, NNX14AO73G, NNX10AU06G, and NNX14AF93G).
This paper was edited by David Carlson and reviewed by three anonymous referees.
Amundson, R., Berhe, A. A., Hopmans, J. W., Olson, C., Sztein, A. E., and Sparks, D. L.: Soil and human security in the 21st century, Science, 348, 1261071–1261071, https://doi.org/10.1126/science.1261071, 2015.
Bian, Z., Tian, H., Yang, Q., Xu, R., Pan, S., and Zhang, B.: Gridded datasets of animal manure nitrogen and phosphorus production and application in the continental US from 1860 to 2017, PANGAEA, https://doi.org/10.1594/PANGAEA.919937, 2020.
Billen, G., Lancelot, C., and Meybeck, M.: N, P, and Si retention along the aquatic continuum from land and ocean, in: Dahlem workshop on ocean margin processes in global change, 18 March 1990, Berlin, Germany, 19–44, 1991.
Bouwman, A. F., Boumans, L. J. M., and Batjes, N. H.: Estimation of global NH3 volatilization loss from synthetic fertilizers and animal manure applied to arable lands and grasslands, Global Biogeochem. Cy., 16, 8–14, 2002.
Bouwman, A. F., Beusen, A. H., and Billen, G.: Human alteration of the global nitrogen and phosphorus soil balances for the period 1970–2050, Global Biogeochem. Cy., 23, GB0A04, https://doi.org/10.1029/2009GB003576, 2009.
Bouwman, L., Goldewijk, K. K., Van Der Hoek, K. W., Beusen, A. H. W., Van Vuuren, D. P., Willems, J., Rufino, M. C., and Stehfest, E.: Exploring global changes in nitrogen and phosphorus cycles in agriculture induced by livestock production over the 1900–2050 period, P. Natl. Acad. Sci. USA, 110, 20882–20887, https://doi.org/10.1073/pnas.1012878108, 2013.
Buckwell, A. and Nadeu, E.: Nutrient Recovery and Reuse (NRR) in European agriculture. A review of the issues, opportunities, and actions, Bruss. RISE Found., 2016.
David, M. B., Drinkwater, L. E., and McIsaac, G. F.: Sources of nitrate yields in the Mississippi River Basin, J. Environ. Qual., 39, 1657–1667, 2010.
Davidson, E. A.: The contribution of manure and fertilizer nitrogen to atmospheric nitrous oxide since 1860, Nat. Geosci., 2, 659, https://doi.org/10.1038/NGEO608, 2009.
Del Giudice, D., Matli, V. R. R., and Obenour, D. R.: Bayesian mechanistic modeling characterizes Gulf of Mexico hypoxia: 1968–2016 and future scenarios, Ecol. Appl., e02032, https://doi.org/10.1002/eap.2032, 2019.
Eggleston, S., Buendia, L., Miwa, K., Ngara, T., and Tanabe, K.: 2006 IPCC guidelines for national greenhouse gas inventories, Institute for Global Environmental Strategies, Hayama, Japan, available at: http://www.ipcc-nggip.iges.or.jp/public/2006gl/index.html (last access: 29 January 2020), 2006.
Elser, J. and Bennett, E.: A broken biogeochemical cycle, Nature, 478, 29–31, https://doi.org/10.1038/478029a, 2011.
FAOSTAT (Food and Agriculture Organization Corporate Statistical Database): FAO online database, available at: http://www. fao.org/faostat/en/#data, last access: Decmber 2019.
Feyereisen, G. W., Kleinman, P. J., Folmar, G. J., Saporito, L. S., Way, T. R., Church, C. D., and Allen, A. L.: Effect of direct incorporation of poultry litter on phosphorus leaching from coastal plain soils, J. Soil Water Conserv., 65, 243–251, 2010.
Garnier, J., Lassaletta, L., Billen, G., Romero, E., Grizzetti, B., Némery, J., Le, T. P. Q., Pistocchi, C., Aissa-Grouz, N., and Luu, T. N. M.: Phosphorus budget in the water-agro-food system at nested scales in two contrasted regions of the world (ASEAN-8 and EU-27), Global Biogeochem. Cy., 29, 1348–1368, 2015.
He, Z., Pagliari, P. H., and Waldrip, H. M.: Applied and environmental chemistry of animal manure: A review, Pedosphere, 26, 779–816, 2016.
Holland, E. A., Lee-Taylor, J., Nevison, C., and Sulzman, J. M.: Global N Cycle: Fluxes and N2O Mixing Ratios Originating from Human Activity. ORNL DAAC, Oak Ridge, Tennessee, USA, https://doi.org/10.3334/ORNLDAAC/797, 2005.
Jones, C. S., Drake, C. W., Hruby, C. E., Schilling, K. E., and Wolter, C. F.: Livestock manure driving stream nitrate, Ambio, 48, 1143–1153, 2019.
Kellogg, R. L., Lander, C. H., Moffitt, D. C., and Gollehon, N.: Manure nutrients relative to the capacity of cropland and pastureland to assimilate nutrients, United States Department of Agriculture, Natural Resources Conservation Service, Washington DC, USA, 140 pp., 2000.
Klein Goldewijk, K., Beusen, A., Doelman, J., and Stehfest, E.: Anthropogenic land use estimates for the Holocene – HYDE 3.2, Earth Syst. Sci. Data, 9, 927–953, https://doi.org/10.5194/essd-9-927-2017, 2017.
Koppelaar, R. H. E. M. and Weikard, H. P.: Assessing phosphate rock depletion and phosphorus recycling options, Glob. Environ. Change, 23, 1454–1466, https://doi.org/10.1016/j.gloenvcha.2013.09.002, 2013.
Lassaletta, L., Billen, G., Grizzetti, B., Anglade, J., and Garnier, J.: 50 year trends in nitrogen use efficiency of world cropping systems: the relationship between yield and nitrogen input to cropland, Environ. Res. Lett., 9, 105011, https://doi.org/10.1088/1748-9326/9/10/105011, 2014.
MacDonald, G. K., Bennett, E. M., and Taranu, Z. E.: The influence of time, soil characteristics, and land-use history on soil phosphorus legacies: a global meta-analysis, Glob. Change Biol., 18, 1904–1917, https://doi.org/10.1111/j.1365-2486.2012.02653.x, 2012.
MacDonald, J. M.: Manure use for fertilizer and for energy: report to congress, DIANE Publishing, No. (AP-037), 53 pp., available at: https://www.ers.usda.gov/publications/pub-details/?pubid=42740# (last access: 10 July 2019), 2009.
Monfreda, C., Ramankutty, N., and Foley, J. A.: Farming the planet: 2. Geographic distribution of crop areas, yields, physiological types, and net primary production in the year 2000, Global Biogeochem. Cy., 22, GB1022, https://doi.org/10.1029/2007GB002947, 2008.
Mueller, N. D. and Lassaletta, L.: Nitrogen challenges in global livestock systems, Nat. Food, 1, 400–401, https://doi.org/10.1038/s43016-020-0117-7, 2020.
Oenema, O., Oudendag, D., and Velthof, G. L.: Nutrient losses from manure management in the European Union, Livest. Sci., 112, 261–272, https://doi.org/10.1016/j.livsci.2007.09.007, 2007.
Potter, P., Ramankutty, N., Bennett, E. M., and Donner, S. D.: Characterizing the Spatial Patterns of Global Fertilizer Application and Manure Production, Earth Interact., 14, 1–22, https://doi.org/10.1175/2009EI288.1, 2010.
Powers, S. M., Chowdhury, R. B., MacDonald, G. K., Metson, G. S., Beusen, A. H. W., Bouwman, A. F., Hampton, S. E., Mayer, B. K., McCrackin, M. L., and Vaccari, D. A.: Global Opportunities to Increase Agricultural Independence Through Phosphorus Recycling, Earths Future, 7, 370–383, https://doi.org/10.1029/2018EF001097, 2019.
Puckett, L., Hitt, K., and Alexander, R.: County-based estimates of nitrogen and phosphorus content of animal manure in the United States for 1982, 1987, and 1992, US Geological Survey, Reston, USA Geological Survey meta data file, available at: http://water.usgs.gov/lookup/getspatial?manure (last access: 31 July 2019), 1998.
Rabalais, N. N. and Turner, R. E.: Gulf of Mexico Hypoxia: Past, Present, and Future, Limnol. Oceanogr. Bull., 28, 117–124, https://doi.org/10.1002/lob.10351, 2019.
Robinson, T. P., Wint, G. R. W., Conchedda, G., Van Boeckel, T. P., Ercoli, V., Palamara, E., Cinardi, G., D'Aietti, L., Hay, S. I., and Gilbert, M.: Mapping the Global Distribution of Livestock, PLoS ONE, 9, e96084, https://doi.org/10.1371/journal.pone.0096084, 2014.
Rowe, H., Withers, P. J. A., Baas, P., Chan, N. I., Doody, D., Holiman, J., Jacobs, B., Li, H., MacDonald, G. K., McDowell, R., Sharpley, A. N., Shen, J., Taheri, W., Wallenstein, M., and Weintraub, M. N.: Integrating legacy soil phosphorus into sustainable nutrient management strategies for future food, bioenergy and water security, Nutr. Cycl. Agroecosys., 104, 393–412, https://doi.org/10.1007/s10705-015-9726-1, 2016.
Ruddy, B. C., Lorenz, D. L., and Mueller, D. K.: County-Level Estimates of Nutrient Inputs to the Land Surface of the Conterminous United States, 1982–2001, U.S. Geological Survey Scientific Investigations Report 2006-5012, 17 p., 2006.
Saunders, M. A. and Lea, A. S.: Large contribution of sea surface warming to recent increase in Atlantic hurricane activity, Nature, 451, 557–560, https://doi.org/10.1038/nature06422, 2008.
Schlesinger, W. H. and Bernhardt, E. S.: Biogeochemistry: An Analysis of Global Change, Academic Press, San Diego, USA, 2013.
Seitzinger, S. P., Styles, R. V., Boyer, E. W., Alexander, R. B., Billen, G., Howarth, R. W., Mayer, B., and Van Breemen, N.: Nitrogen retention in rivers: model development and application to watersheds in the northeastern USA, in: The nitrogen cycle at regional to global scales, edited by: Boyer, E. W. and Howarth, R. W., Springer, Dordrecht, Netherlands, 199–237, https://doi.org/10.1007/978-94-017-3405-9, 2002.
Sheldrick, W., Syers, J. K., and Lingard, J.: Contribution of livestock excreta to nutrient balances, Nutr. Cycl. Agroecosystems, 66, 119–131, 2003.
Sheldrick, W. F., Syers, J. K., and Lingard, J.: A conceptual model for conducting nutrient audits at national, regional, and global scales, Nutr. Cycl. Agroecosys., 62, 61–72, 2002.
Smith, D. R., Owens, P. R., Leytem, A. B., and Warnemuende, E. A.: Nutrient losses from manure and fertilizer applications as impacted by time to first runoff event, Environ. Pollut., 147, 131–137, 2007.
Smith, K. A., Chalmers, A. G., Chambers, B. J., and Christie, P.: Organic manure phosphorus accumulation, mobility and management, Soil Use Manag., 14, 154–159, https://doi.org/10.1111/j.1475-2743.1998.tb00634.x, 1998.
Tabachow, R. M., Peirce, J. J., and Essiger, C.: Hurricane-Loaded Soil, J. Environ. Qual., 30, 1904–1910, https://doi.org/10.2134/jeq2001.1904, 2001.
Thornton, P. K.: Livestock production: recent trends, future prospects, Philos. T. R. Soc. B, 365, 2853–2867, https://doi.org/10.1098/rstb.2010.0134, 2010.
Tian, H., Lu, C., Ciais, P., Michalak, A. M., Canadell, J. G., Saikawa, E., Huntzinger, D. N., Gurney, K. R., Sitch, S., and Zhang, B.: The terrestrial biosphere as a net source of greenhouse gases to the atmosphere, Nature, 531, p. 225, https://doi.org/10.1038/nature16946, 2016.
Tian, H., Yang, J., Xu, R., Lu, C., Canadell, J. G., Davidson, E. A., Jackson, R. B., Arneth, A., Chang, J., Ciais, P., Gerber, S., Ito, A., Joos, F., Lienert, S., Messina, P., Olin, S., Pan, S., Peng, C., Saikawa, E., Thompson, R. L., Vuichard, N., Winiwarter, W., Zaehle, S., and Zhang, B.: Global soil nitrous oxide emissions since the preindustrial era estimated by an ensemble of terrestrial biosphere models: Magnitude, attribution, and uncertainty, Glob. Change Biol., 25, 640–659, https://doi.org/10.1111/gcb.14514, 2019.
Tian, H., Xu, R., Canadell, J. G., Thompson, R. L., Winiwarter, W., Suntharalingam, P., Davidson, E. A., Ciais, P., Jackson, R. B., Janssens-Maenhout, G., Prather, M. J., Regnier, P., Pan, N., Pan, S., Peters, G. P., Shi, H., Tubiello, F. N., Zaehle, S., Zhou, F., Arneth, A., Battaglia, G., Berthet, S., Bopp, L., Bouwman, A. F., Buitenhuis, E. T., Chang, J., Chipperfield, M. P., Dangal, S. R. S., Dlugokencky, E., Elkins, J. W., Eyre, B. D., Fu, B., Hall, B., Ito, A., Joos, F., Krummel, P. B., Landolfi, A., Laruelle, G. G., Lauerwald, R., Li, W., Lienert, S., Maavara, T., MacLeod, M., Millet, D. B., Olin, S., Patra, P. K., Prinn, R. G., Raymond, P. A., Ruiz, D. J., van der Werf, G. R., Vuichard, N., Wang, J., Weiss, R. F., Wells, K. C., Wilson, C., Yang, J., and Yao, Y.: A comprehensive quantification of global nitrous oxide sources and sinks, Nature, 586, 248–256, https://doi.org/10.1038/s41586-020-2780-0, 2020.
Trenberth, K.: Uncertainty in Hurricanes and Global Warming, Science, 308, 1753–1754, https://doi.org/10.1126/science.1112551, 2005.
Van Drecht, G., Bouwman, A. F., Boyer, E. W., Green, P., and Siebert, S.: A comparison of global spatial distributions of nitrogen inputs for nonpoint sources and effects on river nitrogen export: Global news-comparison of global nitrogen inputs, Global Biogeochem. Cy., 19, GB4S06, https://doi.org/10.1029/2005GB002454, 2005.
Williams, M. R., Feyereisen, G. W., Beegle, D. B., Shannon, R. D., Folmar, G. J., and Bryant, R. B.: Manure application under winter conditions: Nutrient runoff and leaching losses, Trans. ASABE, 54, 891–899, 2011.
Xu, R. T., Pan, S. F., Chen, J., Chen, G. S., Yang, J., Dangal, S. R. S., Shepard, J. P., and Tian, H. Q.: Half-century ammonia emissions from agricultural systems in Southern Asia: Magnitude, spatiotemporal patterns, and implications for human health, GeoHealth, 2, 40–53, 2018.
Yang, Q., Tian, H., Li, X., Ren, W., Zhang, B., Zhang, X., and Wolf, J.: Spatiotemporal patterns of livestock manure nutrient production in the conterminous United States from 1930 to 2012, Sci. Total Environ., 541, 1592–1602, https://doi.org/10.1016/j.scitotenv.2015.10.044, 2016.
Yu, Z. and Lu, C.: Historical cropland expansion and abandonment in the continental US during 1850 to 2016, Glob. Ecol. Biogeogr., 27, 322–333, https://doi.org/10.1111/geb.12697, 2018.
Zanon, J. A., Favaretto, N., Goularte, G. D., Dieckow, J., and Barth, G.: Manure application at long-term in no-till: Effects on runoff, sediment and nutrients losses in high rainfall events, Agric. Water Manag., 228, 105908, https://doi.org/10.1016/j.agwat.2019.105908, 2019.
Zhang, B., Tian, H., Lu, C., Dangal, S. R. S., Yang, J., and Pan, S.: Global manure nitrogen production and application in cropland during 1860–2014: a 5 arcmin gridded global dataset for Earth system modeling, Earth Syst. Sci. Data, 9, 667–678, https://doi.org/10.5194/essd-9-667-2017, 2017.
Zhang, X., Davidson, E. A., Zou, T., Lassaletta, L., Quan, Z., Li, T., and Zhang, W.: Quantifying Nutrient Budgets for Sustainable Nutrient Management, Global Biogeochem. Cy., 34, e2018GB006060, https://doi.org/10.1029/2018GB006060, 2020.


