the Creative Commons Attribution 4.0 License.
the Creative Commons Attribution 4.0 License.
A 16-year dataset (2000–2015) of high-resolution (3 h, 10 km) global surface solar radiation
Wenjun Tang
Jun Qin
Xin Li
Xiaolei Niu
The recent release of the International Satellite Cloud Climatology Project (ISCCP) HXG cloud products and new ERA5 reanalysis data enabled us to produce a global surface solar radiation (SSR) dataset: a 16-year (2000–2015) high-resolution (3 h, 10 km) global SSR dataset using an improved physical parameterization scheme. The main inputs were cloud optical depth from ISCCP-HXG cloud products; the water vapor, surface pressure and ozone from ERA5 reanalysis data; and albedo and aerosol from Moderate Resolution Imaging Spectroradiometer (MODIS) products. The estimated SSR data were evaluated against surface observations measured at 42 stations of the Baseline Surface Radiation Network (BSRN) and 90 radiation stations of the China Meteorological Administration (CMA). Validation against the BSRN data indicated that the mean bias error (MBE), root mean square error (RMSE) and correlation coefficient (R) for the instantaneous SSR estimates at 10 km scale were −11.5 W m−2, 113.5 W m−2 and 0.92, respectively. When the estimated instantaneous SSR data were upscaled to 90 km, its error was clearly reduced, with RMSE decreasing to 93.4 W m−2 and R increasing to 0.95. For daily SSR estimates at 90 km scale, the MBE, RMSE and R at the BSRN were −5.8 W m−2, 33.1 W m−2 and 0.95, respectively. These error metrics at the CMA radiation stations were 2.1 W m−2, 26.9 W m−2 and 0.95, respectively. Comparisons with other global satellite radiation products indicated that our SSR estimates were generally better than those of the ISCCP flux dataset (ISCCP-FD), the global energy and water cycle experiment surface radiation budget (GEWEX-SRB), and the Earth's Radiant Energy System (CERES). Our SSR dataset will contribute to the land-surface process simulations and the photovoltaic applications in the future. The dataset is available at https://doi.org/10.11888/Meteoro.tpdc.270112 (Tang, 2019).
- Article
(6668 KB) - Full-text XML
- BibTeX
- EndNote
Surface solar radiation (SSR), which drives the energy, water and carbon cycles of Earth's system, is the driving input for simulations of hydrology, ecology, agriculture and land-surface processes (Wild, 2009; Wang et al., 2012). The accuracy of SSR data influences simulations of runoff, gross primary productivity, growth and yield of crops, and land data assimilation (Wild, 2012; Jia et al., 2013). SSR is also an important variable that affects the speed of glacier melting (Yang et al., 2011). Variations of SSR also affect the rate of global warming and the change of pan evaporation (Wild et al., 2007; Qian et al., 2006).
Information on the spatiotemporal distribution of SSR is fundamental for the selection of sites for solar power plants, decisions on energy policy, optimization of solar power systems and operations management (Mondol et al., 2008; Sengupta et al., 2018). To address issues such as these, historical SSR data have been obtained mainly through ground-based observations, station-based estimates and satellite-based retrievals (Pinker and Laszlo, 1992; Li and Leighton, 1993; Liang et al., 2006; Zhang et al., 2004; Wang et al., 2011; Huang et al., 2011; Kato et al., 2013; Ma and Pinker, 2012; Zhang et al., 2014; Wang et al., 2015; Niu and Pinker, 2015).
Measurement by the accurately calibrated and well-maintained radiometer of pyranometer is the most effective method to obtain reliable long-term SSR data. Although these data are valuable for simulations of land surface processes, solar power applications and evaluation of satellite retrievals (Sengupta et al., 2018), the high cost of maintaining radiation radiometers means that networks of radiation stations are too sparsely distributed. However, networks of routine meteorological stations are denser than those of radiation stations, and the variables observed at routine meteorological stations can be used to estimate SSR. For example, based on sunshine duration data, Tang et al. (2013, 2018) constructed long-term datasets of both daily global radiation and direct radiation over China at more than 2400 routine meteorological stations of the China Meteorological Administration (CMA). These datasets are generally more accurate than those derived from satellite retrievals (Yang et al., 2010). However, station-based estimates of SSR can be conducted only at routine weather stations, many of which are sparsely distributed, often in remote regions and harsh environments.
Alternatively, remote sensing retrievals based on satellites can provide reliable spatiotemporally continuous SSR data, either globally or regionally. The many methods that have been developed to retrieve SSR from satellite data can be roughly divided into two categories: statistical methods and methods based on radiative transfer processes (Huang et al., 2019). According to Sengupta et al. (2018), these methods can also be subdivided into three types: empirical, semi-empirical and physical.
Empirical methods build function relationships between SSR measured at limited numbers of stations and satellite data by applying regression or artificial intelligence technology (Lu et al., 2011; Wei et al., 2019). Empirical methods may work well at some locations, but the ability to expand their coverage to broader regions is limited.
Semi-empirical methods generally combine a physical model for clear-sky conditions with an empirical scheme for cloudy conditions. A well-known semi-empirical method is the Heliosat method of Cano et al. (1986), from which several improved versions have since been developed (Hammer et al., 2003; Mueller et al., 2009; Posselt et al., 2012; Wang et al., 2014).
Physical methods are generally well-suited to generalization because they take into account the physics processes of transfer of solar radiation from the top of the atmosphere to the Earth's surface. The look-up table (LUT) and physical parameterization methods (Pinker and Laszlo, 1992; Liang et al., 2006; Lu et al., 2010; Qin et al., 2015; Xie et al., 2016; Huang et al., 2018) are two typical physical methods that have been widely used to estimate SSR from satellite data.
Several well-known global SSR datasets have been produced by physical methods. These include the global energy and water cycle experiment surface radiation budget (GEWEX-SRB; Pinker and Laszlo, 1992), the International Satellite Cloud Climatology Project flux dataset (ISCCP-FD; Zhang et al., 2004) and the Earth's Radiant Energy System (CERES) radiation products (Kato et al., 2013). Although each of these have been widely used in various fields, the spatial resolutions ( km) of these SSR products is too coarse to meet the requirements of high-resolution SSR data. A high-resolution (5 km, 3 h) global SSR product of the Global Land Surface Satellite (GLASS) was recently released, but it contains data spanning only 3 years (Zhang et al., 2014). The GLASS SSR products were retrieved by a look-up table method with the visible band top-of-atmosphere (TOA) radiance from multi-source geostationary and polar-orbiting satellite data. Tang et al. (2016) also produced a high-resolution SSR product (5 km, 1 h) by combining data from polar-orbit and geostationary satellites, but the product covers only China and the dataset spans only 8 years.
The greatest uncertainty in satellite retrievals of SSR is the lack of a high-quality cloud product, which severely limits the development of high-resolution, long-term global satellite SSR products. However, the release in 2017 of new, global, long-term ISCCP H-series cloud products at a spatial resolution of about 10 km has provided an opportunity to develop a long-term high-resolution global-scale climate dataset of SSR.
We developed a global-scale 16-year dataset (2000–2015) of SSR data from the new ISCCP H-series cloud products and ERA5 reanalysis data, validated the accuracy of this dataset with surface observations, and compared its performance with other global satellite products. Section 2 introduces the method we used to estimate SSR. Section 3 describes the input data we used for SSR estimation and the observation data used for SSR validation. In Sect. 4, we presented our evaluation of the SSR product and compared it with other satellite products. Data availability is given in Sect. 5, and Sect. 6 presents some conclusions and explores future work to further improve SSR products.
The method we used to estimate SSR with ISCCP H-series cloud data is mainly based on the SUNFLUX scheme, which was developed by Sun et al. (2012, 2014) and first used by Tang et al. (2017) to retrieve SSR data from Moderate Resolution Imaging Spectroradiometer (MODIS) atmospheric and land products. Their validation of their results against measurements at Baseline Surface Radiation Network (BSRN) stations indicated a mean root mean square error (RMSE) of ∼90 W m−2 for instantaneous SSR. Although Tang et al. (2017) achieved higher accuracy than we did in this study (because the MODIS cloud products they used are generally of better quality than the ISCCP H-series cloud data), the instantaneous SSR they retrieved is slightly overestimated at most stations because the original method they used only considers the effect of aerosol scattering on SSR but ignores the effect of aerosol absorption. To overcome this issue, we replaced the aerosol parameterization scheme used by Tang et al. (2017) with that used by Qin et al. (2015) and Tang et al. (2016). The resultant method is a pure physical parameterization scheme with an efficient calculation speed. The inputs to the method include cloud optical depth (COD) in the visible band, cloud cover, aerosol optical depth (AOD), surface pressure, precipitable water, total ozone, surface albedo and carbon dioxide concentration (fixed at 375 ppm by volume). Detailed information about the method is provided by Tang et al. (2017, 2016).
3.1 Input data
To produce the 16-year SSR products at global scale, we used three types of input data.
The first of these was the level 2 ISCCP H-series cloud product HXG (H-series pixel-level global, here called ISCCP-HXG), which is a globally merged product generated based on the HGS (H-series gridded by satellite) product. The resolutions of HXG are 3 h and 10 km, and the HXG cloud products are available for the period from July 1983 to December 2015. Note that the ISCCP-HXG data are 0.1∘ gridded snapshots (or instantaneous) available every 3 h, not the average value over 3 h. More information about the ISCCP-HXG cloud product is provided by Young et al. (2018). Four variables were used in the ISCCP-HXG cloud product: cloud mask, visible (VIS) retrieved liquid cloud optical depth, VIS retrieved ice cloud optical depth and cloud top temperature. The cloud mask was used to distinguish clear-sky pixels from cloudy pixels and the cloud top temperature was used to distinguish liquid cloud and ice cloud. In the ISCCP H-series cloud product, cloud types are roughly defined by two phases (liquid and ice), which are determined by cloud top temperature (TC) with liquid for TC ≥253.1 K, and ice for TC <253.1 K.
The second data type we used was the new ERA5 reanalysis data. Three variables of the ERA5 reanalysis data were used: surface pressure, total column water vapor and total column ozone. The resolutions of the ERA5 reanalysis data are 1 h and 25 km. To derive the same spatial resolution as the ISCCP-HXG cloud product, we re-sampled the three variables of ERA5 reanalysis data to a spatial resolution of 10 km. The third data type comprised aerosol and albedo data. The MODIS aerosol (MOD08_D3 or MYD08_D3) and albedo (MCD43A3, Schaaf et al., 2002) daily products were used. The MODIS AOD product of the combined Dark Target and Deep Blue AOD at 0.55 µm for land and ocean was used. MOD and MYD denote product obtained from Terra and Aqua platforms, respectively, and MCD indicates a combined product processed from both platforms (King et al., 2003). The spatial resolution of MODIS aerosols and albedo data are about 100 and 5 km, respectively, so we re-sampled them both to 10 km. To match the temporal scale of ISCCP HXG products, we re-sampled MODIS aerosols and albedo to 3 h by assuming that their values are constant within a day. Missing values in the MODIS aerosol and albedo products (included the period of 1 January to 23 February 2000) were replaced with the corresponding values of monthly mean climatological data. Note that the use of climatological data to replace the real information of aerosol and albedo would have introduced some uncertainty. Thus, care should be taken when using the SSR dataset we derived for trend analysis.
3.2 Validated data
In this study, we used radiation observations made in 2009 to validate the accuracy of the global-scale SSR estimate. These radiation observations were collected at two networks. The first set was the radiation observations (with temporal resolution of 1 min) measured at 42 BSRN stations (Ohmura et al., 1998), which were marked as red crosses in Fig. 1. Radiation observations measured at BSRN stations are regarded as the most reliable radiation data due to the instruments of highest available accuracy and careful maintenance (see website: https://bsrn.awi.de/, last access: 10 July 2019). To reduce uncertainty caused by the cosine response error of the pyranometers, we did not use the measured global radiation data; instead we used the total of the measured direct and diffuse radiation to evaluate the accuracy of the retrieved SSR.
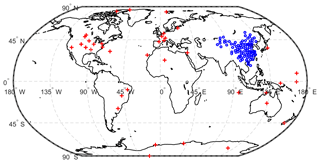
Figure 1Distribution of radiation measurement stations used to evaluate the performance of the estimated SSR. The blue circles mark the locations of the 90 CMA radiation stations, and the red crosses mark those of the 42 BSRN stations. Note that two stations (labeled as DAR and DWN) in Australia and two stations (labeled as BIL and E13) in North America are very close to each other.
The second set was the daily radiation observations measured at 90 CMA radiation stations, which are denoted by black circles in Fig. 1. Though the pyranometers used to measure global radiation at CMA radiation stations were calibrated by a series of standard procedures (Yang et al., 2008), the observed radiation data collected at CMA radiation stations frequently include questionable values, which may have been a result of improper operation of instruments and/or instrument defects (Shi et al., 2008). To reduce the uncertainty caused by the questionable radiation data, we used a quality-check procedure (Tang et al., 2010) to exclude the spurious and erroneous measurements. The quality-check procedure consists of two steps. One is the physical threshold test to eliminate the obvious errors, and the other is the statistical test using an artificial neural network method to eliminate the more insidious errors. More detailed information about the two-step procedure can be found in the article of Tang et al. (2010).
4.1 Validation of estimated SSR against observations at BSRN stations
Firstly, the estimated SSR were validated against the observations measured at the 42 BSRN stations at both instantaneous and daily scales. To reduce the uncertainties induced by broken clouds, we validated the estimated instantaneous SSR against hourly mean observed ones centered on the time of satellite overpass, according to the suggestion of Wang and Pinker (2009). To examine the effect of different spatial resolutions on the accuracy of our SSR estimates, in addition to the 10 km spatial resolution, we also evaluated our estimated SSR at spatial resolutions of 30, 50, 70, 90 and 110 km, derived by averaging the SSR values observed at the original scale of 10 km.
Accuracy for instantaneous SSR at 90 km scale (RMSE =93.4 W m−2, R=0.95; Fig. 2, Table 1) was clearly superior to that at 10 km scale (RMSE 113.5 W m−2, R=0.92), which may indicate that the surface observation points are generally representative of more than 10 km, especially under cloudy conditions. Another possible reason for this phenomenon is the time mismatch between satellite observation and surface observation, because the satellites do not take instantaneous snapshots of the entire Earth. Generally, the last generation of geostationary satellites, such as the Geostationary Operational Environmental Satellite (GOES), take about 30 min to scan the entire Earth. The averaging inherent in the upscaling of spatial resolution would tend to decrease these time mismatches.
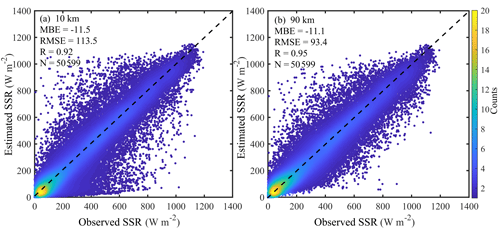
Figure 2Comparisons of our estimated instantaneous SSR at spatial resolutions of (a) 10 km and (b) 90 km with observed SSR for 42 BSRN stations.
Table 1Effect of spatial resolution on accuracy of our estimated instantaneous SSR compared to observations at the 42 BSRN stations. A comparison with instantaneous SSR of ISCCP-FD is also shown.
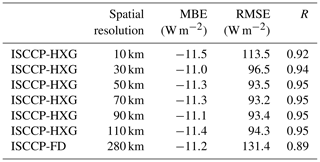
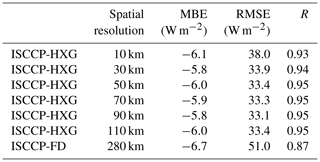
To further illustrate this issue, the performances of our instantaneous SSR with different spatial resolutions at the 42 BSRN stations were given in Table 1, which suggests that the accuracy was clearly improved when the data were upscaled to 30 km, with a further slight improvement at 70 km, but that accuracy started to decrease at 90 km. The performance of the ISCCP-FD was also presented in Table 1. Apparently, the accuracy of our estimated instantaneous SSR is significantly higher than that of the ISCCP-FD. A further advantage of our dataset is that its spatial resolution is far higher than that of the ISCCP-FD products.
Figure 3 shows the spatial distribution of RMSE for the estimated instantaneous SSR (spatial resolution 90 km) at all individual BSRN stations. The RMSE was <90 W m−2 at 30 of the 42 BSRN stations. RMSE values were between 90 and 105 W m−2 at five stations and >105 W m−2 at seven stations. The 12 stations where RMSE values were W m−2 are generally in coastal areas, on islands and in the Antarctic polar region. Part of the reason for these large error is the same as that explained by Tang et al. (2017), who estimated instantaneous SSR with MODIS level-2 land and atmospheric products. For example, the large RMSE value for station IZA can be attributed to the poor representativeness of the station, which is located on a mountain top, and this station point cannot represent the satellite observations. Another reason for the large RMSE values may be the uncertainties contained in the inputs, especially uncertainties in cloud and aerosol data. The great uncertainties for the MODIS AOD retrieval over coastal or island stations (Anderson et al., 2013) would lead to large RMSE values at these stations. The large errors for the two Antarctic stations (SYO and GVN) may reflect failure of cloud detection, which is difficult over the Antarctic region because the similarity of the properties of cloud and surfaces snow over the Antarctica Pole, and because the temperature of cloud is generally not lower than that of surface snow (Zhang et al., 2013).
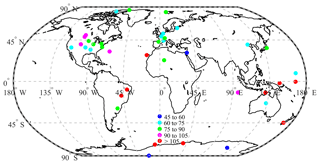
Figure 3Spatial distribution of RMSE (W m−2) for our estimated instantaneous SSR (spatial resolution 90 km) at 42 BSRN stations.
Figure 4 presents the validation results for our estimated daily SSR at 42 BSRN stations. The MBE values were −6.1 and 5.8 W m−2 for spatial resolutions of 10 and 90 km, respectively. The RMSE for 10 km was 38.0 W m−2, and its value was decreased to 33.1 W m−2 for 90 km. The R for 10 km was 0.93 and its value was increased to 0.95 for 90 km. Table 2 also lists the performances of our daily SSR estimate with different spatial resolutions and the performance of the ISCCP-FD daily SSR product. Our estimates of daily SSR at all spatial resolutions were clearly more accurate than that of ISCCP-FD, and they obviously improved when upscaled to more than 30 km.
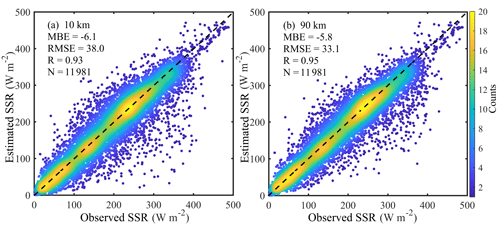
Figure 4Comparisons of our estimated daily SSR at spatial resolutions of (a) 10 km and (b) 90 km with observed SSR for 42 BSRN stations.
Table 2Effect of spatial resolution on accuracy of our estimated daily SSR compared to observations at 42 BSRN stations. A comparison with daily SSR of ISCCP-FD is also shown.
The spatial distribution of RMSE for our estimated daily SSR at spatial resolution of 90 km (Fig. 5) showed that RMSE at most of the 42 BSRN stations were <35 W m−2, although there were four stations with RMSE between 35 and 40 W m−2 and 6 with RMSE >40 W m−2. These higher RMSE values may be attributed to a lack of representativeness for some stations, errors in the inputs and uncertainty of the algorithm, similar to the reasons for the higher errors in our estimates of instantaneous SSR.
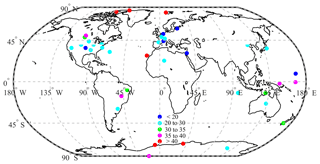
Figure 5Spatial distribution of RMSE (W m−2) for our estimated daily SSR (spatial resolution 90 km) at 42 BSRN stations.
GWEWX-SRB and CERES are two other well-known and widely used global satellite radiation products. Zhang et al. (2013; Fig. 8) evaluated the performance of GEWEX-SRB SSR products with the mean 3 h observed data from the BSRN and found that RMSEs for the instantaneous and daily SSR of GEWEX-SRB were 88.3 and 35.5 W m−2, respectively. To compare our results with those derived from GEWEX-SRB by Zhang et al. (2013), we re-evaluated our estimated SSR with the mean 3 h observed data from the BSRN. The RMSEs for our estimated instantaneous and daily SSR at 10 km spatial resolution were 108.1 and 36.5 W m−2, respectively, both of which are greater than those of GWEX-SRB. However, when we upscaled our estimated SSR to 90 km scale, RMSEs for our instantaneous and daily SSR were lower, 82.4 and 30.6 W m−2, respectively, indicating that our estimates of SSR were more accurate than those of GEWEX-SRB at the same spatial resolution. We also compared the performance of our estimates of SSR with that of CERES (SYN1deg_Ed4A, Fig. 6). The accuracies of CERES were generally higher than those of ISCCP-FD at both instantaneous and daily scales, but obviously lower than those of our estimates at all spatial resolutions from 10 to 110 km (Fig. 6 and Table 2).
Thus, our estimated SSR based on ISCCP-HXG cloud products provided a more accurate, higher spatial resolution dataset than those of ISCCP-FD, GEWEX-SRB and CERES products.
4.2 Validation of estimated SSR against observations at 90 CMA radiation stations
Our estimated SSR were further evaluated against the observations collected at the 90 CMA radiation stations at both daily and monthly scales. Figure 7 presents the validation results for the estimated daily SSR at spatial resolutions of 10 and 90 km. The MBE, RMSE and R for our estimated daily SSR at 10 km spatial resolution were 1.8 W m−2, 32.4 W m−2 and 0.93, respectively. Accuracy clearly improved for spatial resolutions up to 90 km, for which the corresponding metrics were 2.1 W m−2, 26.9 W m−2 and 0.95. The RMSE for our estimate of daily SSR at 10 km spatial resolution is comparable to that of GEWEX-SRB daily SSR, which was also validated against observations at the CMA radiation stations (RMSE 32. 2 W m−2; see Fig. 7b of Qin et al., 2015). However, the RMSE for the GEWEX-SRB daily SSR is clearly higher than that of our estimate of daily SSR at 90 km spatial resolution, thus indicating that the accuracy of our daily SSR estimates is superior to that of the GEWEX-SRB daily SSR product at the same spatial resolution.
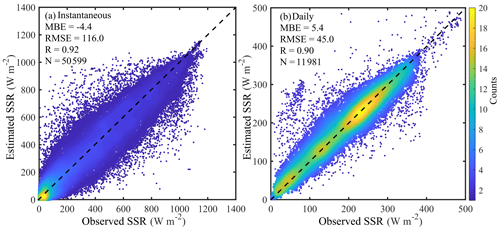
Figure 6Comparison of CERES SSR products with observed SSR at 42 BSRN stations for both (a) instantaneous and (b) daily scales.
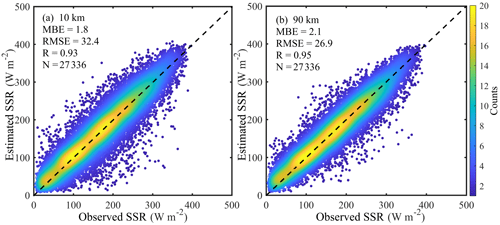
Figure 7Comparisons of our estimated daily SSR at spatial resolutions of (a) 10 km and (b) 90 km with observed SSR at 90 CMA radiation stations.
Table 3 shows that the accuracy of our estimates of daily SSR clearly improved when upscaled to 30 km spatial resolution and were most accurate at 90 km spatial resolution. RMSE and R (36.5 W m−2 and 0.91, respectively) for daily SSR of ISCCP-FD show that our estimates are more accurate at all spatial resolutions. The spatial distribution of RMSE for our daily SSR estimate at 90 km spatial resolution was also given in Fig. 8. Only nine CMA stations had RMSE >35 W m−2 (Fig. 8); most of these stations are in southern China where there is generally more cloud and its distribution is more complicated than in other parts of China (Yu et al., 2001).
Table 3Effect of spatial resolution on accuracy of our estimated daily SSR compared to observations at 90 CMA radiation stations. A comparison with daily SSR of ISCCP-FD is also shown.
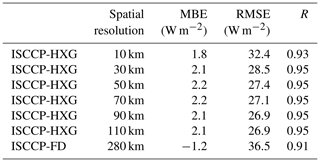
Table 4Effect of spatial resolution on accuracy of our estimated monthly SSR compared to observations at 90 CMA radiation stations. A comparison with monthly SSR of ISCCP-FD data is also shown.
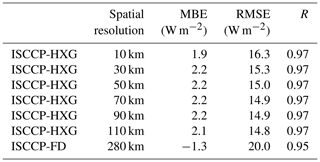
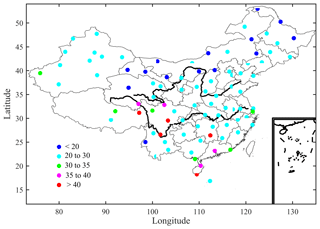
Figure 8Spatial distribution of RMSE (W m−2) for our estimated daily SSR (spatial resolution 90 km) at 90 CMA radiation stations.
Figure 9 presents the validation results for our estimated monthly SSR. The MBE, RMSE and R for our estimated monthly SSR at 10 km spatial resolution were 1.9 W m−2, 16.3 W m−2 and 0.97, and the corresponding values for 90 km changed to 2.2 W m−2, 14.9 W m−2 and 0.97. It can be clearly seen that the accuracy of the ISCCP-FD monthly SSR are inferior to our estimated monthly SSR at scales from 10 to 110 km (Table 4).
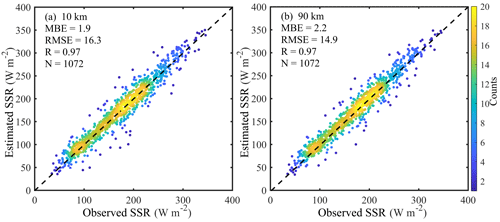
Figure 9Comparisons of our estimated monthly SSR at spatial resolutions of (a) 10 km and (b) 90 km with observed monthly SSR at 90 CMA radiation stations.
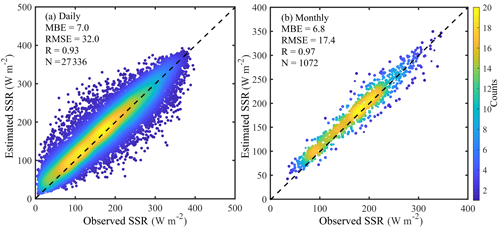
Figure 10Comparison of CERES (a) daily and (b) monthly SSR products with those observed at 90 CMA stations.
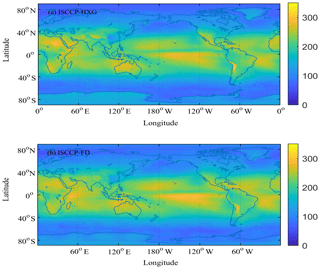
Figure 11Spatial distribution of global annual mean SSR (W m−2) of (a) ISCCP-HXG and (b) ISCCP-FD in 2009.
The performances for CERES daily and monthly SSR were evaluated against observations at the 90 CMA radiation stations (Fig. 10) and also compared with those of our estimates from ISCCP-HXG (Table 4). The MBEs for CERES daily and monthly SSR were greater than those of our estimates at all scales, and the RMSE for CERES daily SSR was slightly smaller than that of our estimates at 10 km spatial resolution, but obviously greater than our estimates at spatial resolutions from 30 to 110 km. The RMSE for CERES monthly SSR was greater than those of our estimates at all scales. Thus, the accuracy of our estimates is generally higher than that of CERES.
4.3 Spatial distribution of the annual SSR
Figure 11 presents the comparison of the global distribution of the annual mean SSR in 2009 between our retrievals and the ISCCP-FD SSR product. From the figure, it can be seen that the global distribution for our SSR estimate based on the ISCCP-HXG cloud products is almost the same as that of the ISCCP-FD SSR product, but the spatial resolution of our estimate is far higher than that of ISCCP-FD. There is no doubt that we can get more details that the coarse resolution product ISCCP-FD can not capture. For example, the region of high SSR clearly identified over the Tibetan Plateau by our estimate (Fig. 11a) is barely discernible in the ISCCP-FD-derived data (Fig. 11b). The high values are mainly from around the Equator and the low latitudes, and the low values are mainly from over the high latitudes and the Arctic and Antarctic regions. This phenomenon is primarily determined by the solar elevation angle. In addition, the relatively high values are also found over the Bolivian Plateau, the Tibetan Plateau and other high-altitude regions due to less radiative extinction over high altitudes.
The 16-year dataset of global SSR is available at the National Tibetan Plateau Data Center (https://doi.org/10.11888/Meteoro.tpdc.270112, Tang, 2019), Institute of Tibetan Plateau Research, Chinese Academy of Sciences.
This study produced a 16-year (2000–2015) global dataset of SSR (with resolutions of 3 h and 10 km) based on recently updated ISCCP H-series cloud products, new ERA5 reanalysis data and MODIS albedo and aerosol products with a physically based scheme. The retrieved SSR dataset was evaluated globally with observations collected at BSRN and CMA radiation stations. Validation against observations collected at BSRN showed that the MBE and RMSE were −11.5 and 113.5 W m−2 for the instantaneous SSR estimates, and −6.1 and 38.0 W m−2 for the daily SSR estimates, but their accuracies clearly improved when upscaled to more than 30 km. For example, the RMSEs decreased to 93.4 and 33.1 W m−2 when our estimates were upscaled to 90 km. Validation against observations collected at CMA indicated that our estimates of daily and monthly SSR produced RMSE values of 32.4 and 16.3 W m−2, respectively, but these values decreased to 26.9 and 14.9 W m−2 when our estimates were upscaled to 90 km. Comparisons with other global satellite SSR products indicated that the accuracies of our SSR estimates were clearly higher than those of GEWEX-SRB, ISCCP-FD and CERES products.
The spatial resolution and accuracy of the new dataset are both higher than those of the global satellite radiation products of GEWEX-SRB, ISCCP-FD and CERES and will contribute to photovoltaic applications and research related to simulation of land surface processes. When reliable global aerosol and albedo datasets become available, we intend to expand our dataset of SSR estimates back to mid-1983. We also plan to expand the dataset beyond 2015 by using SSR estimates from new-generation geostationary satellites.
All authors discussed the results and contributed to the paper. WT calculated the dataset, analyzed the results, and drafted the paper.
The authors declare that they have no conflict of interest.
The CMA radiation station data were obtained from the National Meteorological Information Center (NMIC), and the ISCCP-HXG cloud products were obtained from the NOAA's National Centers for Environmental Information (NCEI). The ERA5 reanalysis data and MODIS albedo and aerosol data were downloaded from official websites (https://www.ecmwf.int, last access: 10 July 2019 and https://ladsweb.modaps.eosdis.nasa.gov, last access: 10 July 2019). The authors would like to thank the Baseline Surface Radiation Network (BSRN) observation teams for their maintenance work.
This work was supported by the National Key Research and Development Program of China (grant nos. 2018YFA0605400 and 2017YFA0603604), the National Natural Science Foundation of China (grant nos. 41671372), the Youth Innovation Promotion Association CAS (no. 2017100), the 13th Five-Year Informatization Project of the Chinese Academy of Sciences (grant no. XXH13505-06), and the Strategic Priority Research Program of the Chinese Academy of Sciences (grant no. XDA20100102).
This paper was edited by Yasuhiro Murayama and reviewed by Guanghui Huang and one anonymous referee.
Anderson, J. C., Wang, J., Zeng, J., Leptoukh, G., Petrenko, M., Ichoku, C., and Hu, C.: Long-term statistical assessment of Aqua-MODIS aerosol optical depth over coastal regions: bias characteristics and uncertainty sources, Tellus B, 65, 20805, https://doi.org/10.3402/tellusb.v65i0.20805, 2013.
Cano, D., Monget, J. M., Albuisson, M., Guillard, H., Regas, N., and Wald, L.: A method for the determination of the global solar radiation from meteorological satellite data, Sol. Energy, 37, 31–39, https://doi.org/10.1016/0038-092X(86)90104-0, 1986.
Hammer, A., Heinemann, D., Hoyer, C., Lorenz, E., Muller, R., and Beyer, H. G.: Solar energy assessment using remote sensing technologies, Remote Sens. Environ., 86, 423–432, https://doi.org/10.1016/S0034-4257(03)00083-X, 2003.
Huang, G., Ma, M., Liang, S., Liu, S., and Li, X.: A LUT-based approach to estimate surface solar irradiance by combining MODIS and MTSAT data, J. Geophys. Res., 116, D22201, https://doi.org/10.1029/2011JD016120, 2011.
Huang, G., Liang, S., Lu, N., Ma, M., and Wang, D.: Toward a broadband parameterization scheme for estimating surface solar irradiance: Development and preliminary results on MODIS products, J. Geophys. Res.-Atmos., 123, 12180–12193, https://doi.org/10.1029/2018JD028905, 2018.
Huang, G., Li, Z., Li, X., Liang, S., Yang, K., Wang, D., and Zhang, Y.: Estimating surface solar irradiance from satellites: Past, present, and future perspectives, Remote Sens. Environ., 233, 111371, https://doi.org/10.1016/j.rse.2019.111371, 2019.
Jia, B., Xie, Z., Dai, A., Shi, C., and Chen, F.: Evaluation of satellite and reanalysis products of downward surface solar radiation over East Asia: Spatial and seasonal variations, J. Geophys. Res.-Atmos., 118, 3431–3446, https://doi.org/10.1002/jgrd.50353, 2013.
Kato, S., Loeb, N. G., Rose, F. G., Doelling, D. R., Rutan, D. A., Caldwell, T. E., Yu, L., and Weller, R. A.: Surface irradiances consistent with CERES-derived top-of-atmosphere shortwave and longwave irradiances, J. Climate, 26, 2719–2740, 2013.
King, M. D., Menzel, W. P., Kaufman, Y. J., Tanre, D., Gao, B., Platnick, S., Ackerman, S. A., Remer, L. A., Pincus, R., and Hubanks, P. A.: Cloud and aerosol properties, perceptible water, and profiles of temperature and humidity from MODIS, IEEE T. Geosci. Remote, 41, 442–458, https://doi.org/10.1109/TGRS.2002.808226, 2003.
Li, Z. Q. and Leighton, H. G.: Global climatologies of solar radiation budgets at the surface and in the atmosphere from 5 years of ERBE data, J. Geophys. Res., 98, 4919–4930, 1993.
Liang, S., Zheng, T., Liu, R. G., Fang, H. L., Tsay, S. C., and Running, S.: Estimation of incident photosynthetically active radiation from Moderate Resolution Imaging Spectrometer data, J. Geophys. Res., 111, D15208, https://doi.org/10.1029/2005JD006730, 2006.
Lu, N., Liu, R., Liu, J., and Liang, S.: An algorithm for estimating downward shortwave radiation from GMS 5 visible imagery and its evaluation over China, J. Geophys. Res., 115, D18102, https://doi.org/10.1029/2009JD013457, 2010.
Lu, N., Qin, J., Yang, K., and Sun, J.: A simple and efficient algorithm to estimate daily global solar radiation from geostationary satellite data, Energy, 36, 3179–3188, https://doi.org/10.1016/j.energy.2011.03.007, 2011.
Ma, Y. and Pinker, R. T.: Modeling shortwave radiative fluxes from satellites, J. Geophys. Res., 117, D23202, https://doi.org/10.1029/2012JD018332, 2012.
Mondol, J. D., Yohanis, Y. G., and Norton, B.: Solar radiation modelling for the simulation of photovoltaic systems, Renew. Energ., 33, 1109–1120, 2008.
Mueller, R., Matsoukas, C., Gratzki, A., Behr, H., and Hollmann, R.: The CM–SAF operational scheme for the satellite based retrieval of solar surface irradiance – A LUT based eigenvector hybrid approach, Remote Sens. Environ., 113, 1012–1024, https://doi.org/10.1016/j.rse.2009.01.012, 2009.
Niu, X. and Pinker, R. T.: An improved methodology for deriving high-resolution surface shortwave radiative fluxes from MODIS in the Arctic region, J. Geophys. Res.-Atmos., 120, 2382–2393, https://doi.org/10.1002/2014JD022151, 2015.
Ohmura, A., Dutton, E. G., Forgan, B., Frohlich, C., Gilgen, H., Hegner, H., Heimo, A., Konig-Langlo, G., McArthur, B., Miiller, G., Philipona, R., Pinker, R., Whitlock, C. H., Dehne, K., and Wild, M.: Baseline Surface Radiation Network (BSRN/WCRP): New precision radiometry for climate change research, B. Am. Meteorol. Soc., 79, 2115–2136, https://doi.org/10.1175/1520-0477(1998)079<2115:BSRNBW>2.0.CO;2, 1998.
Pinker, R. T. and Laszlo, I.: Modeling surface solar irradiance for satellite application on a global scale, J. Appl. Meteorol., 31, 194–211, https://doi.org/10.1175/1520-0450(1992)031<0194:MSSIFS>2.0.CO;2, 1992.
Posselt, R., Mueller, R., Stöckli, R., and Trentmann, J.: Remote sensing of solar surface radiation for climate monitoring–The CM-SAF retrieval in international comparison, Remote Sens. Environ., 118, 186–198, 2012.
Qian, Y., Kaiser, D. P., Leung, L. R., and Xu, M.: More frequent cloud-free sky and less surface solar radiation in China from 1955 to 2000, Geophys Res. Lett., 33, L01812, https://doi.org/10.1029/2005GL024586, 2006.
Qin, J., Tang, W., Yang, K., Lu, N., Niu, X., and Liang, S.: An efficient physically based parameterization to derive surface solar irradiance based on satellite atmospheric products, J. Geophys. Res.-Atmos., 120, 4975–4988, https://doi.org/10.1002/2015JD023097, 2015.
Schaaf, C. B., Gao, F., Strahler, A. H., Lucht, W., Li, X., Tsang, T., Strugnell, N. C., Zhang, X., Jin, Y., Muller, J.-P., Lewis, P., Barnsley, M., Hobson, P., Disney, M., Roberts, G., Dunderdale, M., Doll, C., d'Entremont, R. P., Hu, B., Liang, S., Privette, J. L., and Roy, D.: First operational BRDF, albedo nadir reflectance products from MODIS, Remote Sens. Environ., 83, 135–148, https://doi.org/10.1016/S0034-4257(02)00091-3, 2002.
Sengupta, M., Xie, Y., Lopez, A., Habte, A., Maclaurin, G., and Shelby, J.: The national solar radiation data base (NSRDB), Renew. Sust. Energ. Rev., 89, 51–60, https://doi.org/10.1016/j.rser.2018.03.003, 2018.
Shi, G. Y., Hayasaka, T., Ohmura, A., Chen, Z. H., Wang, B., Zhao, J. Q., Che, H. Z., and Xu, L.: Data quality assessment and the long-term trend of ground solar radiation in China, J. Appl. Meteorol. Clim., 47, 1006–1016, 2008.
Sun, Z., Liu, J., Zeng, X., and Liang, H.: Parameterization of instantaneous global horizontal irradiance: Cloudy sky component, J. Geophys. Res., 117, D14202, https://doi.org/10.1029/2012JD017557, 2012.
Sun, Z., Zeng, X., Liu, J., Liang, H., and Li, J.: Parametrization of instantaneous global horizontal irradiance: clear-sky component, Q. J. Roy. Meteor. Soc. 140, 267–280, https://doi.org/10.1002/qj.2126, 2014.
Tang, W.: A 16-year dataset of high-resolution (3 hour, 10 km) global surface solar radiation (2000–2015), Big Data System for Pan-Third Pole, https://doi.org/10.11888/Meteoro.tpdc.270112, 2019.
Tang, W., Yang, K., He, J., and Qin, J.: Quality control and estimation of global solar radiation in China, Sol. Energy, 84, 466–475, 2010.
Tang, W., Qin, J., Yang, K., Niu, X., Zhang, X., Yu, Y., and Zhu X.: Reconstruction of Daily Photosynthetically Active Radiation and its Trends over China, J. Geophys. Res.-Atmos., 118, 13292–13302, https://doi.org/10.1002/2013JD020527, 2013.
Tang, W., Qin, J., Yang, K., Liu, S., Lu, N., and Niu, X.: Retrieving high-resolution surface solar radiation with cloud parameters derived by combining MODIS and MTSAT data, Atmos. Chem. Phys., 16, 2543–2557, https://doi.org/10.5194/acp-16-2543-2016, 2016.
Tang, W., Yang, K., Sun, Z., Qin, J., and Niu, X.: Global Performance of a Fast Parameterization Scheme for Estimating Surface Solar Radiation From MODIS Data, IEEE T. Geosci. Remote Sens, 55, 3558–3571, https://doi.org/10.1109/TGRS.2017.2676164, 2017.
Tang, W., Yang, K., Qin, J., Min, M., and Niu, X.: First effort for constructing a direct solar radiation data set in China for solar energy applications, J. Geophys. Res.-Atmos., 123, 1724–1734, https://doi.org/10.1002/2017JD028005, 2018.
Wang, H. and Pinker, R. T.: Shortwave radiative fluxes from MODIS: Model development and implementation, J. Geophys. Res., 114, D20201, https://doi.org/10.1029/2008JD010442, 2009.
Wang, K. C., Dickinson, R. E., Wild, M., and Liang, S.: Atmospheric impacts on climatic variability of surface incident solar radiation, Atmos. Chem. Phys., 12, 9581–9592, https://doi.org/10.5194/acp-12-9581-2012, 2012.
Wang, K. C., Ma, Q., Li, Z., and Wang, J.: Decadal variability of surface incident solar radiation over China: Observations, satellite retrievals, and reanalyses, J. Geophys. Res.-Atmos., 120, 6500–6514, 2015.
Wang, P., Stammes, P., and Mueller, R.: Surface solar irradiance from SCIAMACHY measurements: algorithm and validation, Atmos. Meas. Tech., 4, 875–891, https://doi.org/10.5194/amt-4-875-2011, 2011.
Wang, P., Sneep, M., Veefkind, J. P., Stammes, P., and Levelt, P. F.: Evaluation of broadband Surface solar irradiance from the Ozone Monitoring Instrument, Remote Sens. Environ., 149, 88–99, https://doi.org/10.1016/j.rse.2014.03.036, 2014.
Wei, Y., Zhang, X., Hou, N., Zhang, W., Jia, K., and Yao, Y.: Estimation of surface downward shortwave radiation over China from AVHRR data based on four machine learning methods, Sol. Energy, 177, 32–46, 2019.
Wild, M.: Global dimming and brightening: A review, J. Geophys. Res.-Atmos., 888 114, D00D16, 2009.
Wild, M.: Enlightening global dimming and brightening, B. Am. Meteorol. Soc., 93, 27–37, 2012.
Wild, M., Ohmura, A., and Makowski, K.: Impact of global dimming and brightening on global warming. Geophys. Res. Lett., 34, L04702, https://doi.org/10.1029/2006GL028031, 2007.
Xie, Y., Sengupta, M., and Dudhia, J.: A Fast All-sky Radiation Model for Solar applications (FARMS): algorithm and performance evaluation, Sol. Energy 135, 435–445, 2016.
Yang, K., He, J., Tang, W., Qin, J., and Cheng, C.: On downward shortwave and longwave radiations over high altitude regions: Observation and modeling in the Tibetan Plateau, Agr. Forest Meteorol., 150, 38–46, https://doi.org/10.1016/j.agrformet.2009.08.004, 2010.
Yang, W., Guo, X., Yao, T., Yang, K., Zhao, L., Li, S., and Zhu, M.: Summertime surface energy budget and ablation modeling in the ablation zone of a maritime Tibetan glacier, J. Geophys. Res., 116, D14116, https://doi.org/10.1029/2010JD015183, 2011.
Yang, Y., Wang, D., Lv, W. H., Mo, Y. Q., and Ding, L.: Solar radiation standard and its values transfer system in China, available at: http://www.knmi.nl/samenw/geoss/wmo/TECO2008/IOM-96-TECO2008/P1(52)_Yang_China.pdf (last access: 10 July 2019), 2008.
Young, A. H., Knapp, K. R., Inamdar, A., Hankins, W., and Rossow, W. B.: The International Satellite Cloud Climatology Project H-Series climate data record product, Earth Syst. Sci. Data, 10, 583–593, https://doi.org/10.5194/essd-10-583-2018, 2018.
Yu, R. C., Yu, Y. Q., and Zhang, M. H.: Comparing cloud radiative properties between the eastern China and the Indian monsoon region, Adv. Atmos. Sci., 18, 1090–1102, 2001.
Zhang, T., Stackhouse Jr., P. W., Gupta, S. K., Cox, S. J., Mikovitz, J. C., and Hinkelman, L. M.: The validation of the GEWEX SRB surface shortwave flux data products using BSRN measurements: A systematic quality control, production and application approach, J. Quant. Spectrosc. Ra., 122, 127–140, https://doi.org/10.1016/j.jqsrt.2012.10.004, 2013.
Zhang, X., Liang, S., Zhou, G., Wu, H., and Zhao, X.: Generating Global LAnd Surface Satellite incident shortwave radiation and photosynthetically active radiation products from multiple satellite data, Remote Sens. Environ., 152, 318–332, 2014.
Zhang, Y. C., Rossow, W. B., Lacis, A. L., Valdar, O., and Michael, I. M.: Calculation of radiative fluxes from the surface to top of atmosphere based on ISCCP and other global data sets: refinements of the radiative transfer model and the input data, J. Geophys. Res., 109, D19105, https://doi.org/10.1029/2003JD004457, 2004.


