the Creative Commons Attribution 4.0 License.
the Creative Commons Attribution 4.0 License.
 | 14 Jun 2024
Underwater light environment in Arctic fjords
Robert W. Schlegel
Rakesh Kumar Singh
Bernard Gentili
Simon Bélanger
Laura Castro de la Guardia
Dorte Krause-Jensen
Cale A. Miller
Mikael Sejr
Jean-Pierre Gattuso
Most inhabitants of the Arctic live near the coastline, which includes fjord systems where socio-ecological coupling with coastal communities is dominant. It is therefore critically important that the key aspects of Arctic fjords be measured as well as possible. Much work has been done to monitor temperature and salinity, but in-depth knowledge of the light environment throughout Arctic fjords is lacking. This is particularly problematic knowing the importance of light for benthic ecosystem engineers such as macroalgae, which also play a major role in ecosystem function. Here we document the creation and implementation of a high-resolution (∼50–150 m) gridded dataset for surface photosynthetically available radiation (PAR), diffuse attenuation of PAR through the water column (KPAR), and PAR available at the seafloor (bottom PAR) for seven Arctic fjords distributed throughout Svalbard, Greenland, and Norway during the period 2003–2022. In addition to KPAR and bottom PAR being available at a monthly resolution over this time period, all variables are available as a global average, annual averages, and monthly climatologies, with standard deviations provided for the latter two. Throughout most Arctic fjords, the interannual variability of monthly bottom PAR is too large to determine any long-term trends. However, in some fjords, bottom PAR increases in spring and autumn and decreases in summer. While a full investigation into these causes is beyond the scope of the description of the dataset presented here, it is hypothesized that this shift is due to a decrease in seasonal ice cover (i.e. enhanced surface PAR) in the shoulder seasons and an increase in coastal runoff (i.e. increased turbidity and decreased surface PAR) in summer. A demonstration of the usability of the dataset is given by showing how it can be combined with known PAR requirements of macroalgae to track the change in the potential distribution area for macroalgal habitats within fjords with time.
The datasets are available on PANGAEA at https://doi.org/10.1594/PANGAEA.962895 (Gentili et al., 2023a) and https://doi.org/10.1594/PANGAEA.965460 (Gentili et al., 2024).
A toolbox for downloading and working with this dataset is available in the form of the FjordLight R package, which is available via CRAN (Gentili et al., 2023b, https://doi.org/10.5281/zenodo.10259129) or may be installed via GitHub: https://face-it-project.github.io/FjordLight (last access: 29 April 2024).
- Article
(6699 KB) - Full-text XML
-
Supplement
(1531 KB) - BibTeX
- EndNote


The Arctic Ocean is surrounded by three continents, whose extensive coastlines ensure that coastal ecosystems are an important component of the overall Arctic marine realm. The area shallow enough for light to reach the seafloor is estimated to be approximately 3×10⁶ km2 (Gattuso et al., 2006), which is roughly equivalent to the central Arctic Ocean (3.3×10⁶ km2; PAME, 2016). Fjords are one of seven distinct coastscapes found in the Arctic and are common in Norway, Greenland, Iceland, and eastern Canada (CAFF, 2019). Fjords are defined in a geographic context as deep narrow inlets of water, sometimes with a sill, a physical barrier that creates inner and outer deep areas, and are generally surrounded by steeply rising topography. Coupled with a high-northern-latitude location, this has historically meant that most Arctic fjord systems are strongly influenced by glaciers in a number of important ways. Due, in part, to the confluence of geography and the cryosphere, Arctic fjord ecosystems are 1 order of magnitude more productive than terrestrial Arctic ecosystems, providing suitable areas for spawning grounds and nurseries of marine fauna (e.g. Spotowitz et al., 2022) and acting as carbon sinks (Smith et al., 2015), and they may even be productive enough for aquaculture development (Hermansen and Troell, 2012; Aanesen and Mikkelsen, 2020).
The light available throughout the water column referred to in this study is specifically limited to photosynthetically available radiation (PAR). This is solar radiation found between the wavelengths of 400 and 700 nm and can be absorbed by the dominant photosynthetic pigments in marine primary producers (Morel, 1978). PAR diminishes as it penetrates the water column due to its optical properties. This reduction in the availability of PAR with depth can be estimated using the diffuse downwelling attenuation coefficient for PAR (KPAR) of the water column. The higher the scattering (e.g. due to high or large sediment load and phytoplankton) and absorption (e.g. due to high concentrations of dissolved organic matter, organic detritus, minerals, and phytoplankton) in the water column, the higher the KPAR. This is an important consideration as the PAR reaching the seafloor (bottom PAR or PARB) is one of the major limiting factors for the distribution, production, and composition of benthic phototrophic communities. The geographical distribution of PAR and KPAR therefore plays an important role in regulating the global carbon cycle through the control of light availability on the depth distribution of benthic primary producers (Gattuso et al., 2020).
In general, there are three known processes that affect the penetration of light through the water column in most Arctic coastal ecosystems and, particularly, in Arctic fjords:
-
The loss of sea ice has resulted in and will continue to result in longer periods of open water, allowing greater penetration of light below the sea surface (Pavlov et al., 2019).
-
Suspended particles in the water column that originate from glacial or terrestrial runoff or resuspension from increased fetch and wave action limit light penetration (Frigstad et al., 2020; Nowak et al., 2021).
-
Cloudiness may increase as the Arctic warms, reducing incident PAR over the sea surface (Bélanger et al., 2013; Laliberté et al., 2021).
The processes listed above are likely to exhibit considerable regional and local variability, making it a complex task to quantify trends in coastal PAR. This means that the drivers of light availability in fjords might follow different trajectories in different geographical settings. While it has been well established and quantified how light availability and pelagic productivity have increased in the open Arctic Ocean due to reductions in sea-ice cover (Pavlov et al., 2019), the response of benthic primary producers in fjords remains poorly constrained.
Benthic primary producers in Arctic fjords include microalgae (i.e. microphytobenthos), macroalgae (e.g. kelps and encrusting corallines), and seagrass (Zostera marina, known as eelgrass, is the only seagrass that extends into the Arctic zone). Kelps and seagrasses are canopy-forming and act as ecosystem engineers by creating vertical structures used by a wide range of species, thereby supporting marine biodiversity (Wernberg et al., 2019). Even in the Arctic, the areal extent and production of kelps and other macrophytes can be substantial (Krause-Jensen et al., 2020; Filbee-Dexter et al., 2022; Castro de la Guardia et al., 2023).
Due to light limitation, the highest abundance of benthic primary producers is restricted to narrow coastal margins, with seaweeds dominating rocky shores, while rooted macrophytes and microalgae colonize sandy or soft sediments. These macrophytes are well adapted to low-light environments and tend to have low compensating and saturating irradiances (e.g. Borum et al., 2002). It is therefore an important finding that the biomass of these coastal communities has increased (Kędra et al., 2010; Bartsch et al., 2016). A possible regime shift occurred in 1995 in the rocky-bottom community of a well-studied Arctic fjord (Kongsfjorden; Kortsch et al., 2012). An Arctic-wide study showed a general increase in macroalgae abundance, productivity, and/or biodiversity, accompanied by a poleward migration rate of 18–23 km per decade (Krause-Jensen et al., 2020).
In addition, the depth at which macroalgal biomass is highest in at least one Arctic fjord (i.e. Kongsfjorden) is becoming shallower (Bartsch et al., 2016). The two main hypotheses for why macroalgal biomass is shifting to shallower depths in some fjords are both related to PAR availability:
-
Less sea-ice cover means both less ice scour and more light penetration at shallower depths, which is preferred by macroalgae (Bartsch et al. 2016; Fredriksen et al., 2019, and citations therein; Wiktor et al., 2022).
-
Increasing turbidity (e.g. melting glaciers, increased wave action, and coastal erosion) inhibits light penetration to the deeper depths where macroalgae have historically been found (Bartsch et al., 2016).
The shift towards darker water is known as water “darkening” or “browning” and has been documented at high northern latitudes (Finstad et al., 2016), including in most fjords of western Svalbard (1935–2007; Konik et al., 2021) and mainland Norway (1935–2007; Aksnes et al., 2009). However, this trend is complex and spatially variable. For example, in a given fjord, underwater PAR may be decreasing, but the areas furthest away from the points of freshwater input may show an increase in PAR because they are less affected by sediment input. Therefore, the same trend of increasing PAR observed in the open ocean due to sea-ice loss (Arrigo and van Dijken, 2011) may also apply to these outer-fjord regions.
As the Arctic climate continues to change rapidly, it is predicted that light availability in the open ocean will continue to increase due to sea-ice loss (Pavlov et al., 2019). This, combined with increases in temperature and possibly also nutrient availability, would hypothetically be beneficial for some macroalgae (Goldsmit et al., 2021; Assis et al., 2022), although too much heat could eventually become problematic (Filbee-Dexter et al., 2016; Bass et al., 2023). Indeed, it has been shown that the depth distribution of macroalgae may increase with an increasing number of open-water days (Castro de la Guardia et al., 2023). However, it is still very uncertain to what extent and for how long PAR will continue to change in Arctic fjords (Walch et al., 2022). Dissolved organic matter, which affects PAR availability, may also be altering benthic ecology (Sejr et al., 2022) or otherwise negatively affecting macroalgae communities (Niedzwiedz and Bischof, 2023). Understanding these changes is important and timely as shallow Arctic fjord communities are predicted to shift from invertebrate-dominated to algal-dominated communities (Kortsch et al., 2012; Lebrun et al., 2022).
The importance of underwater light for the distribution of benthic primary producers is undeniable, but there are still many uncertainties about the overall spatial distribution and trends of PAR in Arctic fjords at the surface and at depth. This is due to the fact that in situ PAR measurements are rare and spatially sparse. To this end, we document here the use of optical remote sensing data in combination with high-resolution bathymetric maps to estimate PAR at the surface of the ocean and its water column attenuation (KPAR) and to combine them to estimate PAR reaching the seafloor, PARB. We provide spatial summaries of PAR, as well as time series showing how PAR may have changed in the shallow zones (depth ≤50 m), from 2003 to 2022. Finally, we compare the present state of PARB with the known light requirements of key benthic macrophyte primary producers to highlight the utility of this dataset.
2.1 Study sites
Arctic fjords share a common glacial origin and history, but there are many differences between them, including latitude, climate, bathymetry, freshwater input, orientation, and seasonal ice cover. The study sites for this data product were chosen in order to include an appropriate range of environments within the area considered to be the European Arctic (66–90° N and 25–60° E), subdivided here into mainland Norway, Svalbard, and Greenland (Table 1, Fig. 1).
Table 1Study sites included in this dataset, with summary notes on their state of glaciation and seasonal sea-ice cover. Latitude values are approximated from the middle of the fjord system and are provided here as a general indication.
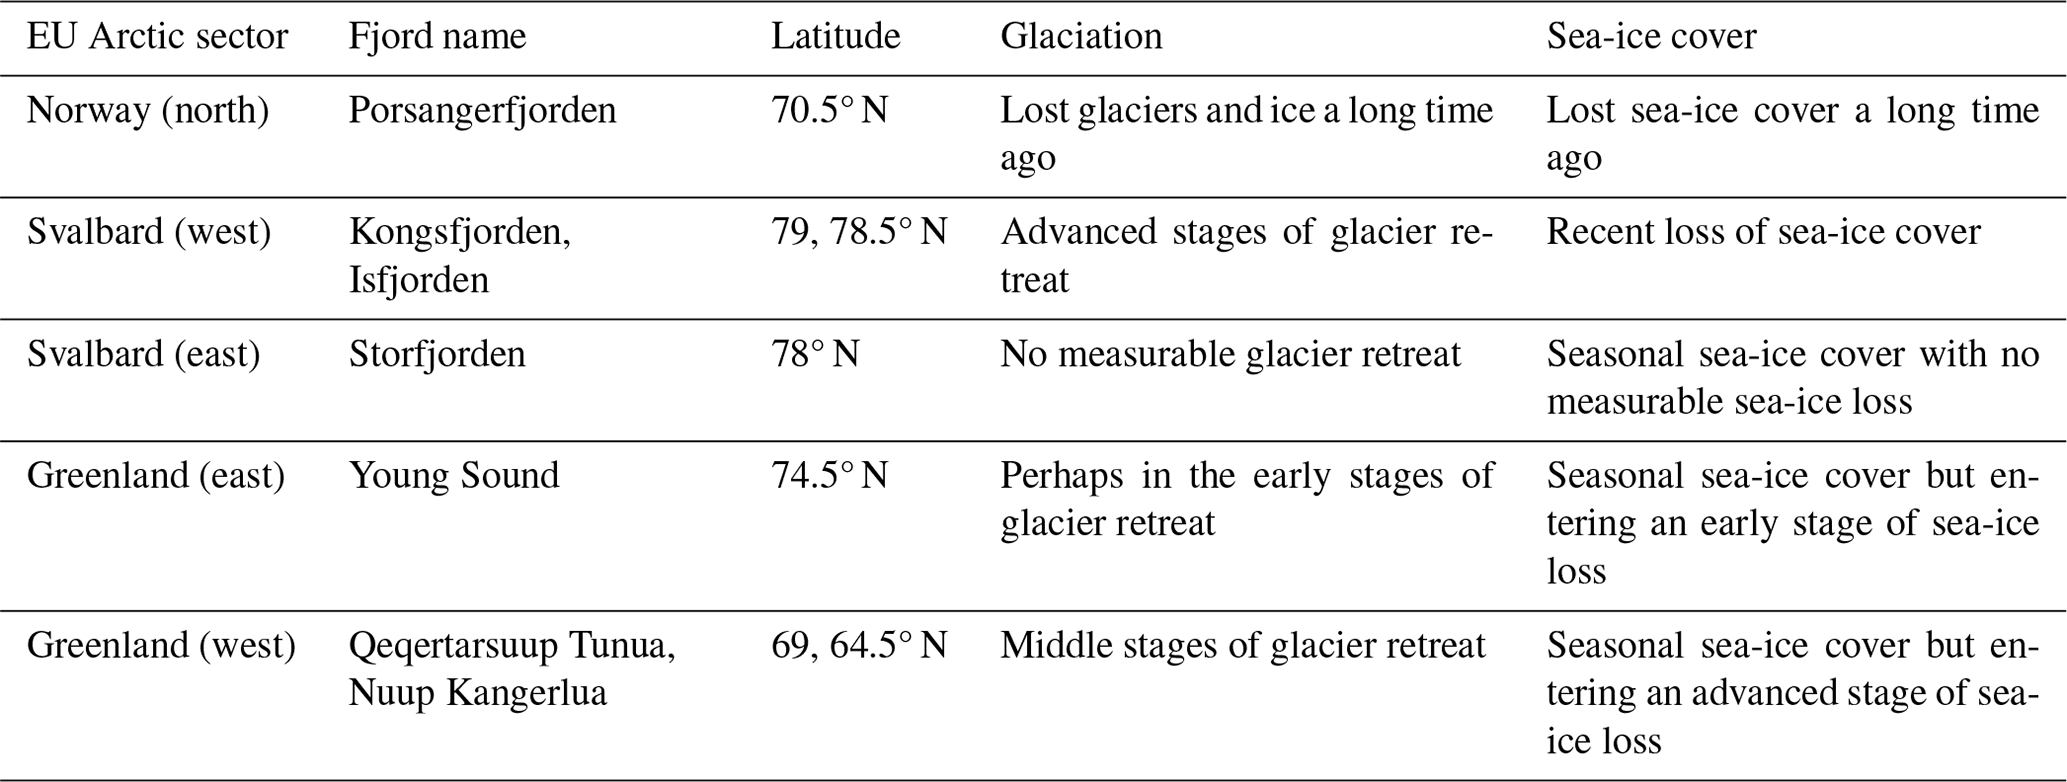
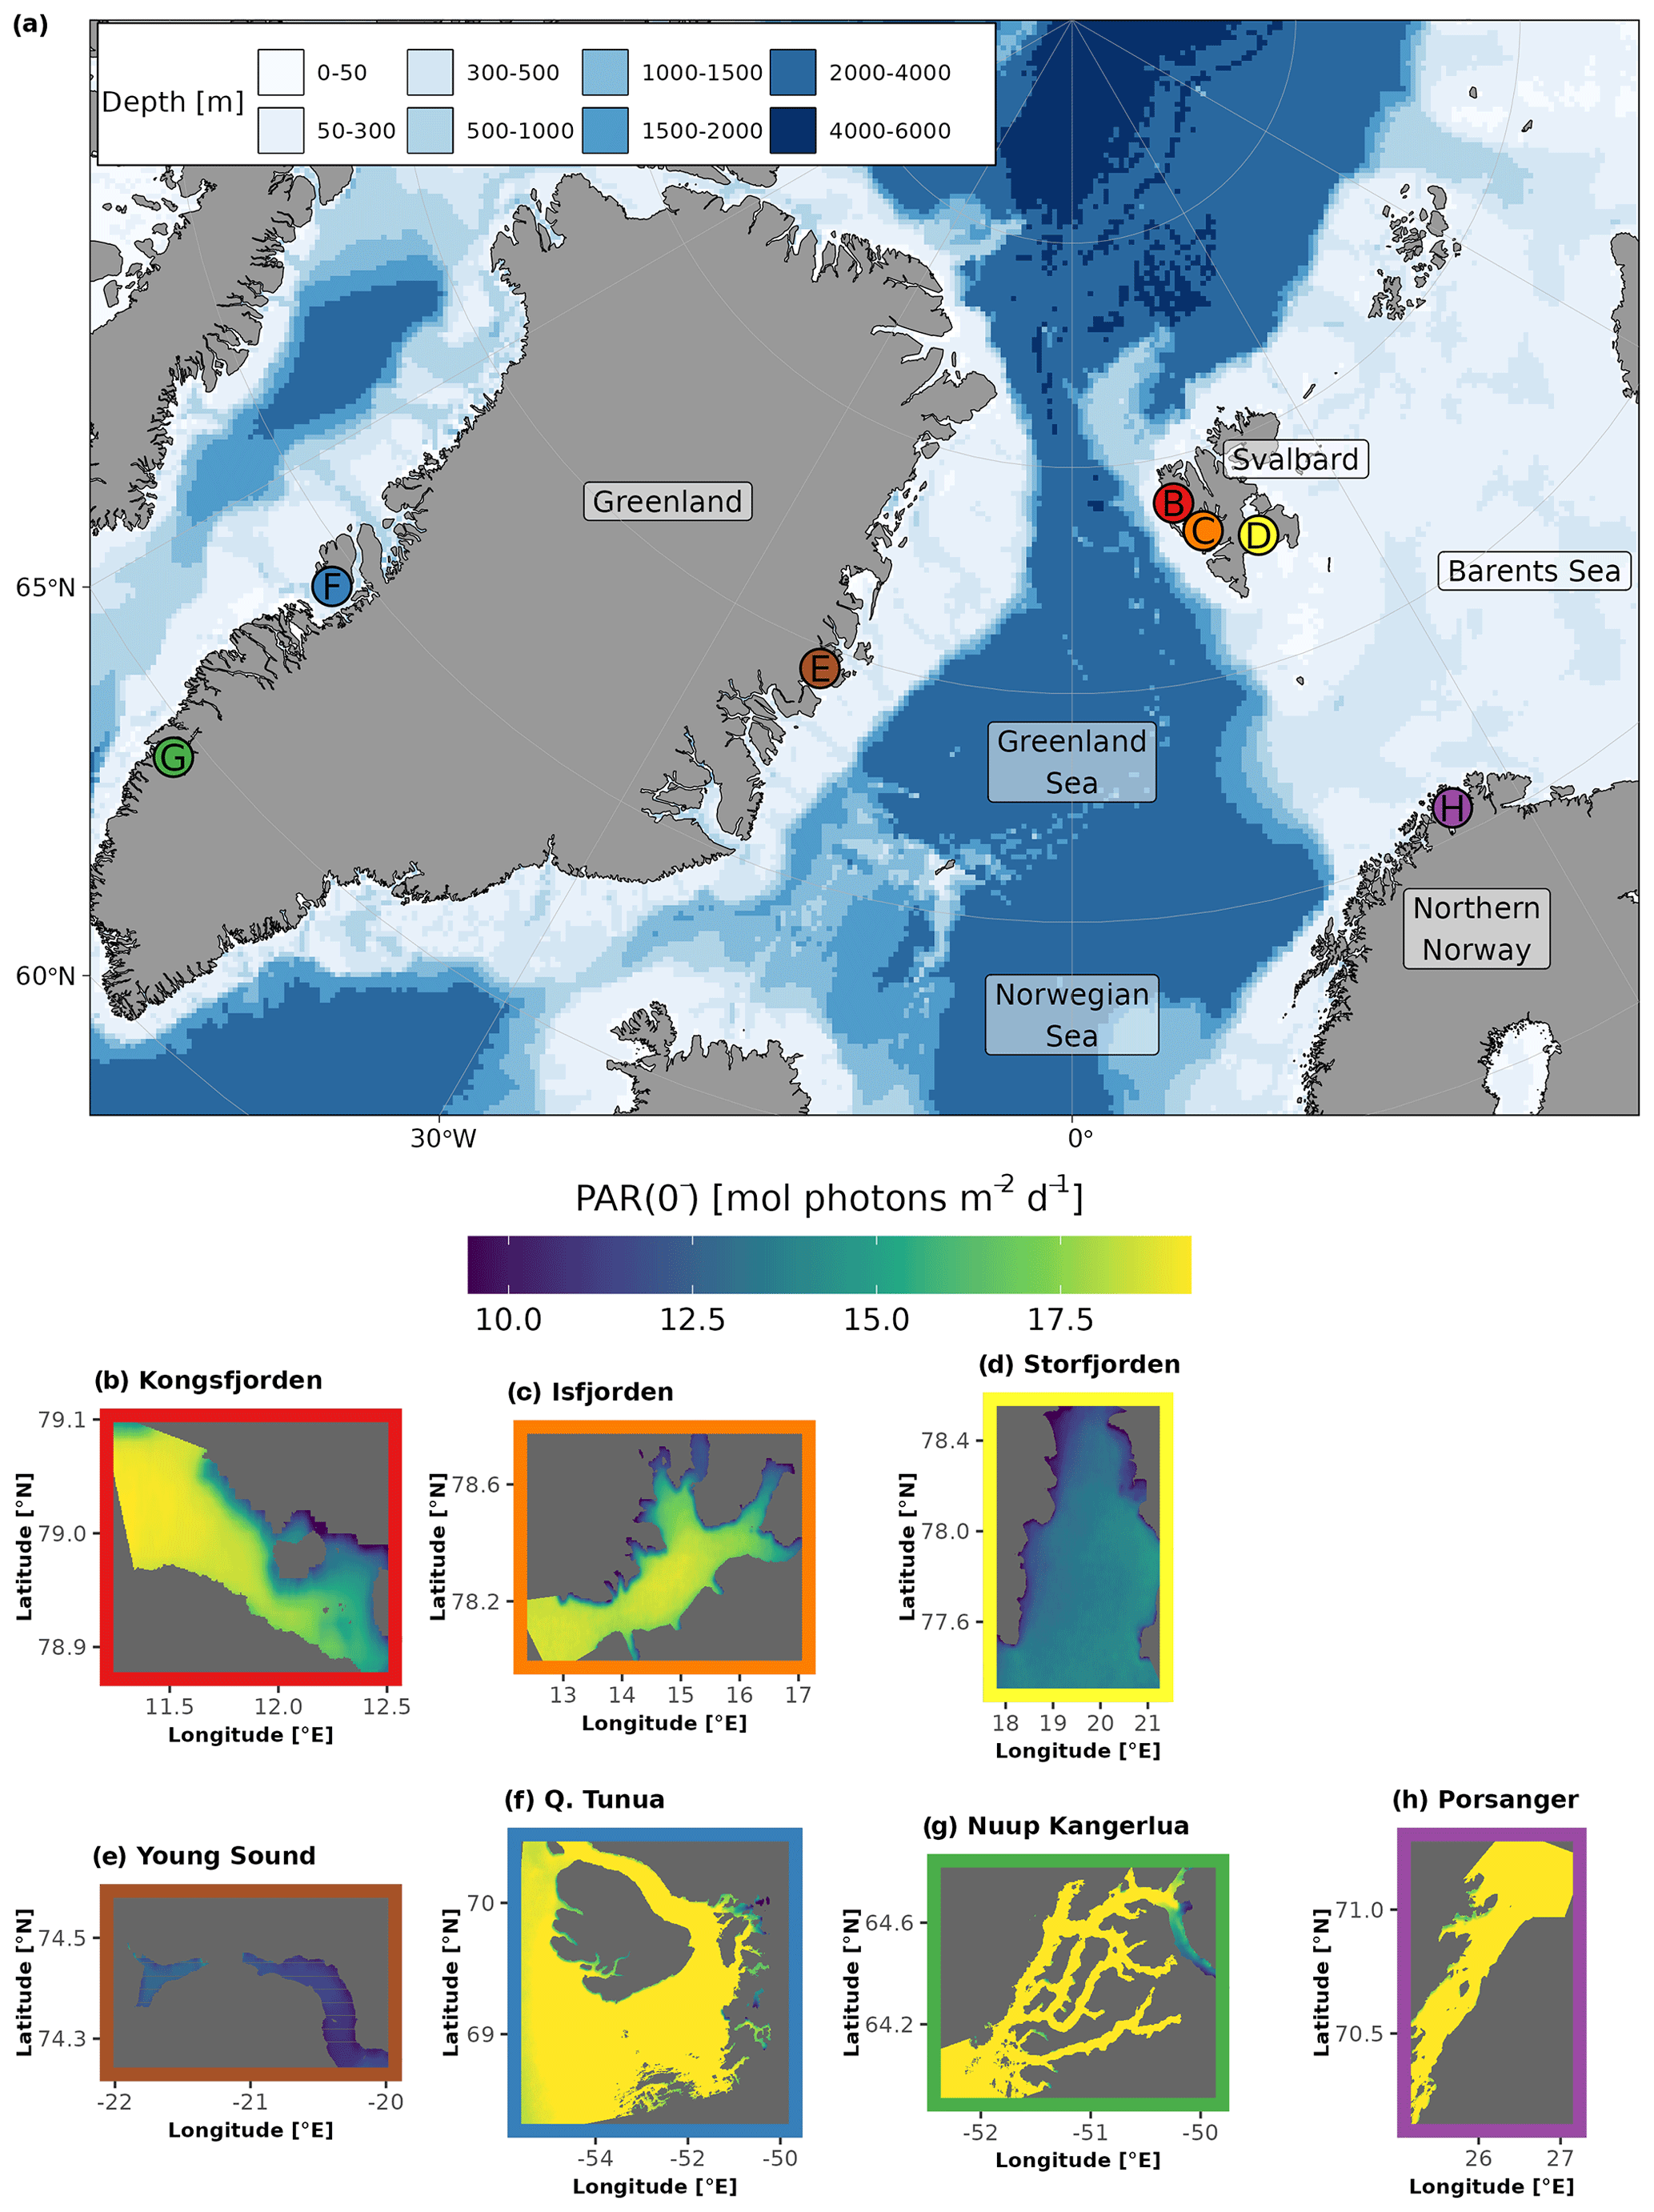
Figure 1The location (denoted by dots in panel a) and regional subsets of the global PAR just below the water surface (PAR(0−); bottom panels; b–h) for the seven sites included in the FjordLight dataset. The scales for PAR(0−) (mol photons m−2 d−1) are the same in all panels, while the scales for longitude and latitude differ. Note that differences in PAR(0−) between sites are generally due to the difference in the seasonal cycle of sea-ice cover. The colours of the frames in panels (b)–(h) correspond to the colours of the dots in panel (a). The names for Qeqertarsuup Tunua (f) and Porsangerfjorden (h) have been contracted to fit the plotting area. See Table 2 for the exact sizes and count of pixels per site.
The fjords of northern Norway presently lack glaciers (e.g. Porsangerfjorden; Table 1). Thus, freshwater inputs are limited to terrestrial and riverine runoff, which may cause more darkening or browning of waters than glacial runoff. These fjords also have little to no sea-ice cover throughout the entire year, making them systems where surface PAR is more available in the spring and autumn relative to other Arctic regions. These fjords may be precursors of fjords presently associated with glaciers elsewhere in the Arctic. Note that, throughout this paper, Porsangerfjorden is given as a representative example of northern Norwegian fjords generally.
Western Svalbard fjords (e.g. Kongsfjorden and Isfjorden) are currently undergoing radical changes primarily driven by a warming climate (Table 1). These fjords are experiencing the effects of rapidly melting glaciers and drastic declines in sea-ice cover. Increased runoff has also led to a darkening of the nearshore waters, making the changes in PARB in this region unclear. Eastern Svalbard fjords (e.g. Storfjorden) are not yet heavily impacted by climate change but could be relatively soon. They still have relatively stable glaciers and seasonal sea-ice cover. Therefore, seasonal surface PAR values in these fjords are not expected to differ significantly from the historically stable baseline.
The selected Greenlandic fjords in the east (Young Sound) and west (Qeqertarsuup Tunua, Nuup Kangerlua) show different degrees of glaciation and sea-ice cover (Table 1). Nuup Kangerlua is sea-ice-free year round, while Young Sound has a short sea-ice-free period of 2–3 months per year. The effects of climate warming (e.g. glacier retreat) are greater in the west than in the east but, overall, are less than in the rest of the EU Arctic. This means that the seasonal cryosphere cycle shows fewer signs of breakdown due to climate change, as has been observed in northern Norway and as is currently happening in western Svalbard.
In addition to the changes in sea-ice cover and/or glaciation in Arctic fjords, latitude introduces a strong gradient in the seasonal light regime (with an increasing length of polar day and night towards the north), which plays an important role in shaping the light climate of Arctic fjord ecosystems.
2.2 Data sources
2.2.1 Bathymetry data
In order to accurately calculate PARB, it was necessary to utilize the highest-resolution bathymetric data available. The base layer used for all sites was version 4.2 of the International Bathymetric Chart of the Arctic Ocean (IBCAO; Jakobsson et al., 2020), an Arctic-specific data product produced by the General Bathymetric Chart of the Oceans (GEBCO). IBCAO contains all bathymetric data from 64° N to the pole at a gridded resolution of 200 m on the IBCAO Polar Stereographic projection (WGS 84; EPSG:3996). However, higher resolutions were often available within the focal study sites for this dataset, and these were used wherever possible.
For northern Norway (Porsangerfjorden) and Svalbard (Kongsfjorden, Isfjorden, and Storfjorden), data with a 50 m resolution were available from the Norwegian mapping authority (https://kartverket.no/api-og-data/bestille-dybdedata, last access: 13 June 2024). Gaps within the bathymetry of the Svalbard sites from this source were filled with IBCAO data and interpolated down to 50 m. However, it should be noted that, due to large gaps in the bathymetry for Kongsfjorden (Fig. 1i), the average pixel resolution is 100 m. For western Greenland (Qeqertarsuup Tunua and Nuup Kangerlua), 150 m data were utilized from version 5.0 of the IceBridge BedMachine Greenland product (IDBMG4; Morlighem et al., 2017), which is on the National Sea and Ice Data Center (NSIDC) Sea Ice Polar Stereographic North projection (WGS 84; EPSG:3413). For eastern Greenland (Young Sound), a site-specific dataset that was created by Rysgaard et al. (2003) and subsequently improved with additional data was used. This has a spatial resolution of 100 m on a WGS 84 datum with EPSG:4326 projection.
To match the gridded satellite data (see Sect. 2.2.2), all bathymetric data were re-interpolated from their native projection to the even grid cell system of the Standard Global Degree Decimal Projection (WGS 84; EPSG:4326) using the highest resolutions mentioned above.
2.2.2 Satellite data
The top-of-atmosphere (TOA) radiance MODIS-Aqua (∼1 km daily resolution from 4 July 2002 to present) level-1A (L1A) data were acquired from NASA's Ocean Biology Distributed Active Archive Center (OB.DAAC; https://oceancolor.gsfc.nasa.gov, last access: 13 June 2024), covering the study area from January 2003 to December 2022. The L1A data were processed to level 2 at the native resolution of MODIS ocean colour bands (∼1 km) using SeaDAS v8. The atmospheric correction algorithm in SeaDAS was modified to use the aerosol correction of Singh et al. (2019), which has been shown to improve the accuracy of retrieving water-leaving radiance, particularly in turbid coastal waters.
In addition to the ocean colour data from MODIS-Aqua, the Earth Probe (EP) Total Ozone Mapping Spectrometer (TOMS; TOMS Science Team, 1998; ∼50 km daily resolution from 25 July 1996 to present) and the Ozone Monitoring Instrument (OMI; Bhartia, 2012; ∼13 km daily resolution from 15 July 2004 to present) on board Aura were used to obtain ozone optical thickness and near-real-time sea-ice concentration using passive microwave radars. These data were obtained from the National Snow and Ice Data Center (NSIDC; Maslanik and Stroeve, 1999; Meier et al., 2021).
2.3 Analysis of remote sensing images
The PAR just below the water surface (PAR(0−)) was calculated following the radiative-transfer-based approach of Singh et al. (2022). This method has been found to work adequately at high solar zenith angles, which is the usual case for satellite-acquired optical signals in the Arctic region. At high latitudes, the importance of using PAR(0−) rather than PAR above the surface (PAR(0+)) becomes more evident as the higher solar zenith angle results in a significant difference between the PAR reaching the water surface and the PAR entering the water column (Gregg and Carder, 1990). In polar regions, the daily average solar zenith angle is mostly higher than 55° (Hartmann, 2016). This algorithm is integrated with a per-pixel flagging approach to differentiate between open water, sea ice, and cloud, which increases the robustness of model inputs for calculating the subsurface PAR in ice-covered waters.
The atmospheric parameters computed from MODIS-Aqua data are utilized to compute cloud optical thickness, while atmospherically corrected products are used to compute the ice–cloud–water flag and surface albedo for the PAR(0−) (Singh et al., 2022; for details about the lookup tables used to compute PAR(0−), see Laliberté et al., 2016). The ozone optical thickness was acquired from TOMS and OMI (Sect. 2.2.2). In addition, sea-ice concentration from NSIDC was used to compute the surface albedo under the clouds. With these inputs and the solar zenith angle, the daily PAR(0−) was computed for each pixel and at a spatial resolution of ∼1 km.
The PAR that penetrates the water column diminishes as it travels downwards due to scattering and absorption. This loss of PAR in the water column is governed by the attenuation coefficient for PAR (KPAR), which is a function of the inherent optical properties (IOPs; absorption and backscattering coefficients) of the water column and the solar zenith angle. Hence, KPAR can be used to account for the attenuation of PAR in the water column. Saulquin et al. (2013) found that the attenuation coefficient of downwelling irradiance at 490 nm (Kd(490 nm)) computed using IOPs estimated with a quasi-analytical algorithm (QAA; Lee et al., 2002, 2005) can be used to derive KPAR in coastal and turbid coastal waters with reasonable accuracy. Therefore, the KPAR values provided in this dataset were calculated using the remote sensing reflectance at 555 nm (Rrs(555)) from MODIS-Aqua using the methodology from Saulquin et al. (2013) with the updated formulation of the QAA (Lee et al., 2013).
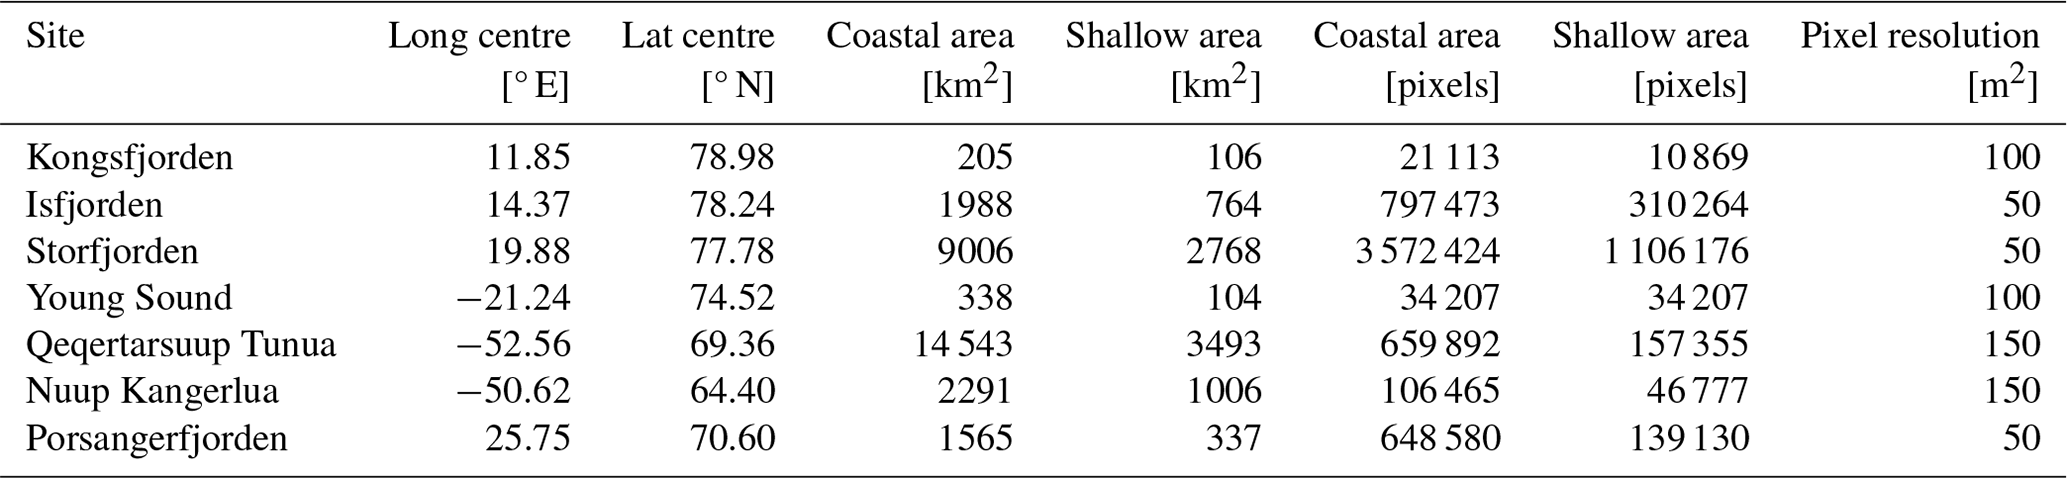
Once the daily PAR(0−) values per ∼1 km were calculated, these values were assigned to all corresponding pixels within the finer-scale grid as determined by the bathymetry resolution per site (Table 2). While this means that the surface values contain more spatial heterogeneity than the finer scales of 50–150 m grids would imply, the bottom PAR values do follow the finer-scale grid (see below).
Table 2The sizes of the seven study sites in this dataset (provided in km2 and count of pixels). The coastal values shown here are determined from all pixels with a depth of 200 m or less. The shallow values are for a depth of 50 m or less.
2.4 PARB calculation
As mentioned in the previous section, PAR(0−) rather than PAR(0+) was used to compute PARB. PAR(0−) values were calculated using the SBDART (Santa Barbara DISORT Atmospheric Radiative Transfer) lookup tables described in Laliberté et al. (2016) and Singh et al. (2022).
Using the Beer–Lambert law, PARB can be approximated as a function of PAR(0−) and KPAR for a known depth (m):
Note that this equation can also be used to calculate PAR at any depth in the water column by replacing “bottom_depth” with the desired depth value in metres.
2.5 P functions
We define a P function as the percentage of the surface area in a shallow (depth ≤50 m) or coastal (depth ≤200 m) zone that receives PARB greater than a threshold. The P function was introduced by Gattuso et al. (2006, 2020) and can be calculated for a given region (i.e. a fjord) over a given time interval. Within this dataset, the time periods available are global (i.e. the full 20 years of data; 2003–2022), yearly (i.e. a year from 2003 to 2022), or the climatology for a given month (i.e. March to October – averaged over the full 20 years of data).
While a more detailed explanation may be found in Sect. 2.5.2 of Gattuso et al. (2020), it is relevant to the dataset being presented here to see how the data for the P functions were calculated. Let E be a value of irradiance (expressed in mol photons m−2 d−1), and let d be a given day. For this day, let Sa,d be the available surface (i.e. the total surface of pixels for which an irradiance value is available), and let sd(E) be the total surface of pixels collecting irradiance greater than E. The P function for a given time interval of n d is therefore
We may apply this by letting P be a P function and by letting Sgeo be the surface of the shallow coastal area of the fjord (0–50 m); the area receiving PARB above a given threshold (expressed as s(E) and measured in mol photons m−2 d−1) is thus
The threshold value assigned to E in Eq. (3) could be a given benthic light requirement based on field observations, as presented in the next section for a number of Arctic macroalgae.
2.6 Benthic light requirements
As an exercise to demonstrate the usability of the new dataset, an analysis of the light requirements of benthic macroalgae (kelps) was performed. This required a literature review of the light requirements and depth extensions of these organisms. It was found that the minimum light requirements (Emin) of Arctic kelps are typically between 40 and 50 mol photons m−2 yr−1, often equivalent to about 1 % of surface irradiance (Table 3). The depth ranges of these organisms vary, but within fjords, most are found between 0 and 20 m depth.
Table 3Minimum light requirement (Emin; mol photons m−2 yr−1) of Arctic kelps, the corresponding percentage of surface irradiance (SI), the corresponding depth limit, and the species considered. A: Alaria (esculenta) or Agarum (clathratum), S: Saccharina, and L: Laminaria.
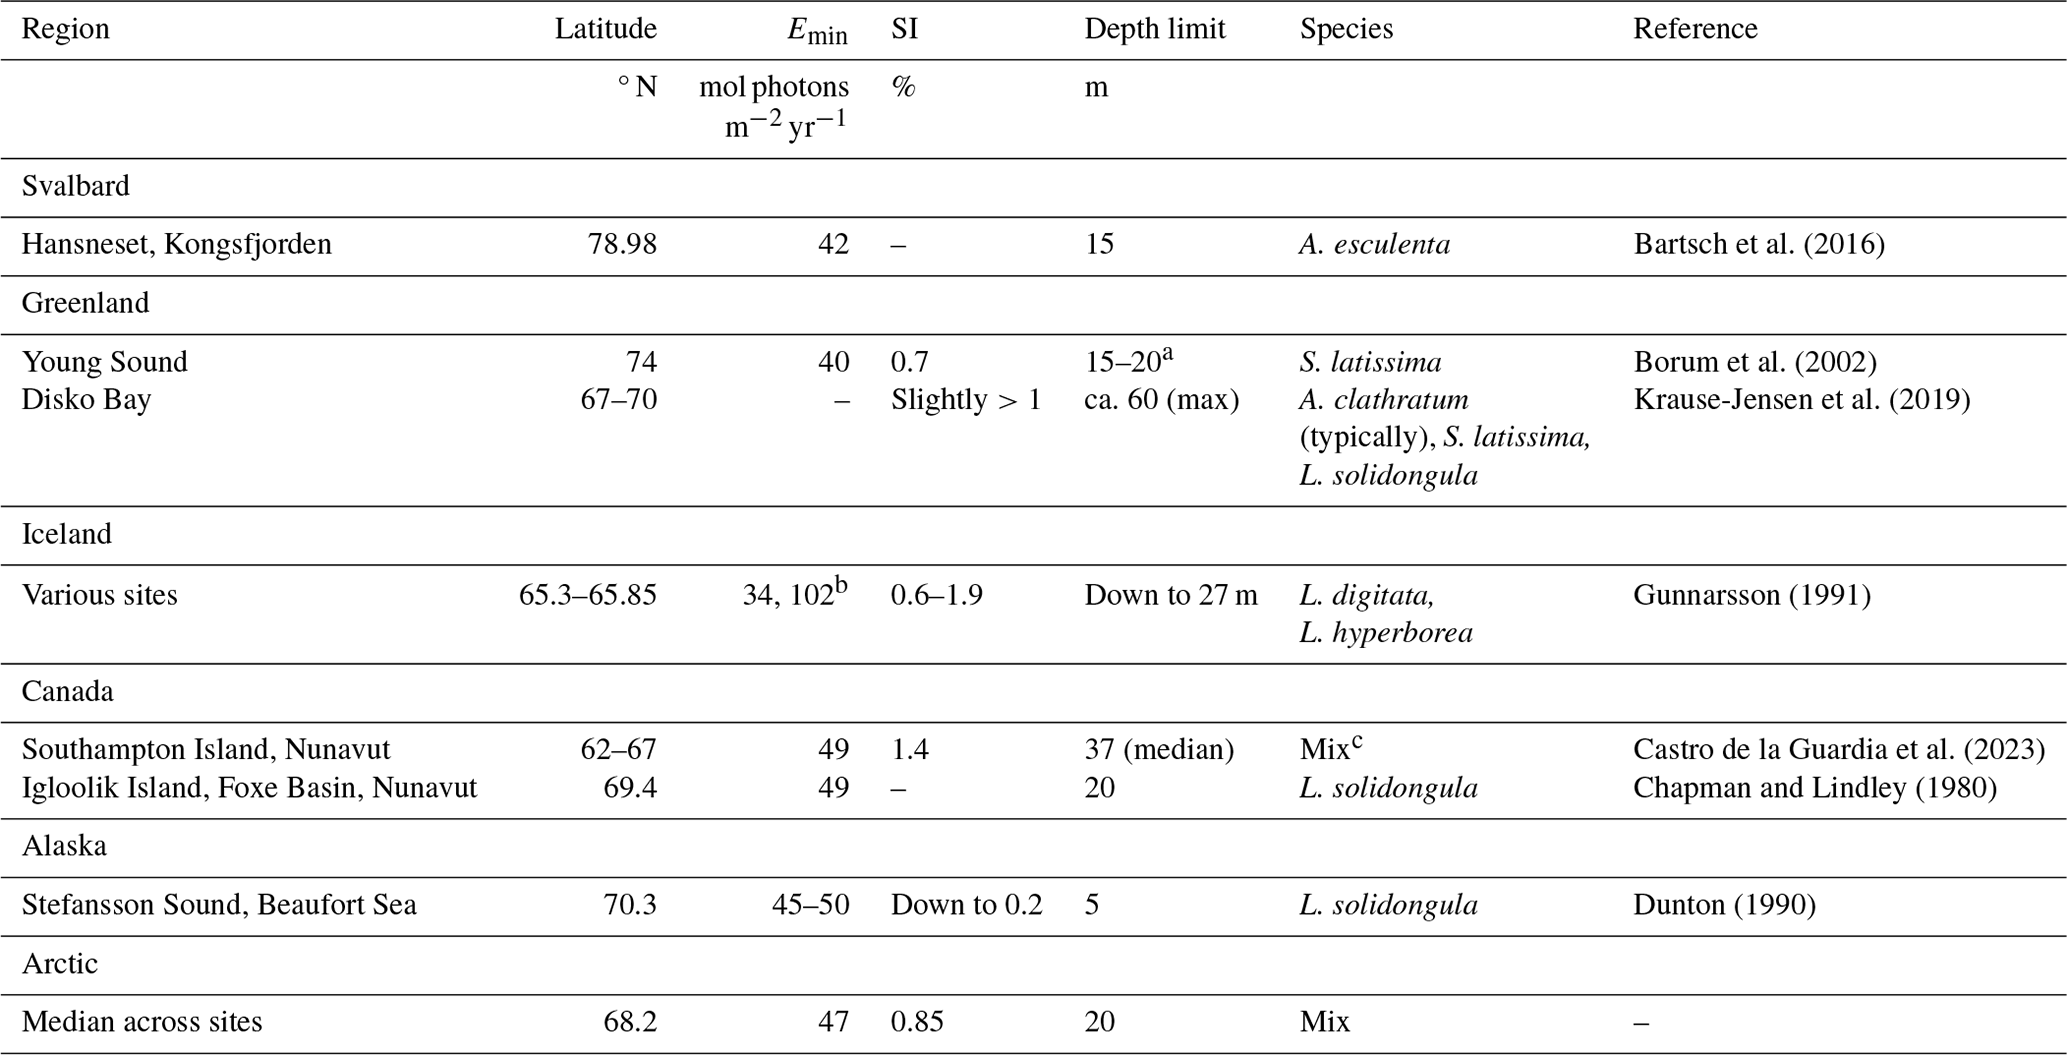
a Young specimens with thin thalli extended to 20 m, while older specimens with thicker thalli and poorer light utilization capacity extended solely to 15 m.
b Each value provided here corresponds to the species listed in the same row.
c Depth limits were reported for the kelp assemblage in general, comprising high-canopy kelps including S. latissima (var. hollow buoyant stipes), A. esculenta, and L. solidungula and low-canopy kelps including A. clathratum and kelp juveniles, with the low-canopy assemblage often forming the depth limit.
3.1 PAR(0−) and KPAR
KPAR is available for all sites as monthly values, while both PAR(0−) and KPAR are available as global mean, annual mean, and monthly climatological mean values. The standard deviations are also provided for all annual mean and monthly climatology values. By taking the median (spatial) value for each site for pixels in the shallow zone (i.e. pixels with depth ≤50 m), we can better visualize the seasonal changes (Fig. 2). Note that median values are reported for the results from all spatial averages for the PAR variables within fjords due to the tendency of the distributions to be right skewed, meaning that there are usually small pockets that have very high PAR values, which disproportionately affect the mean.
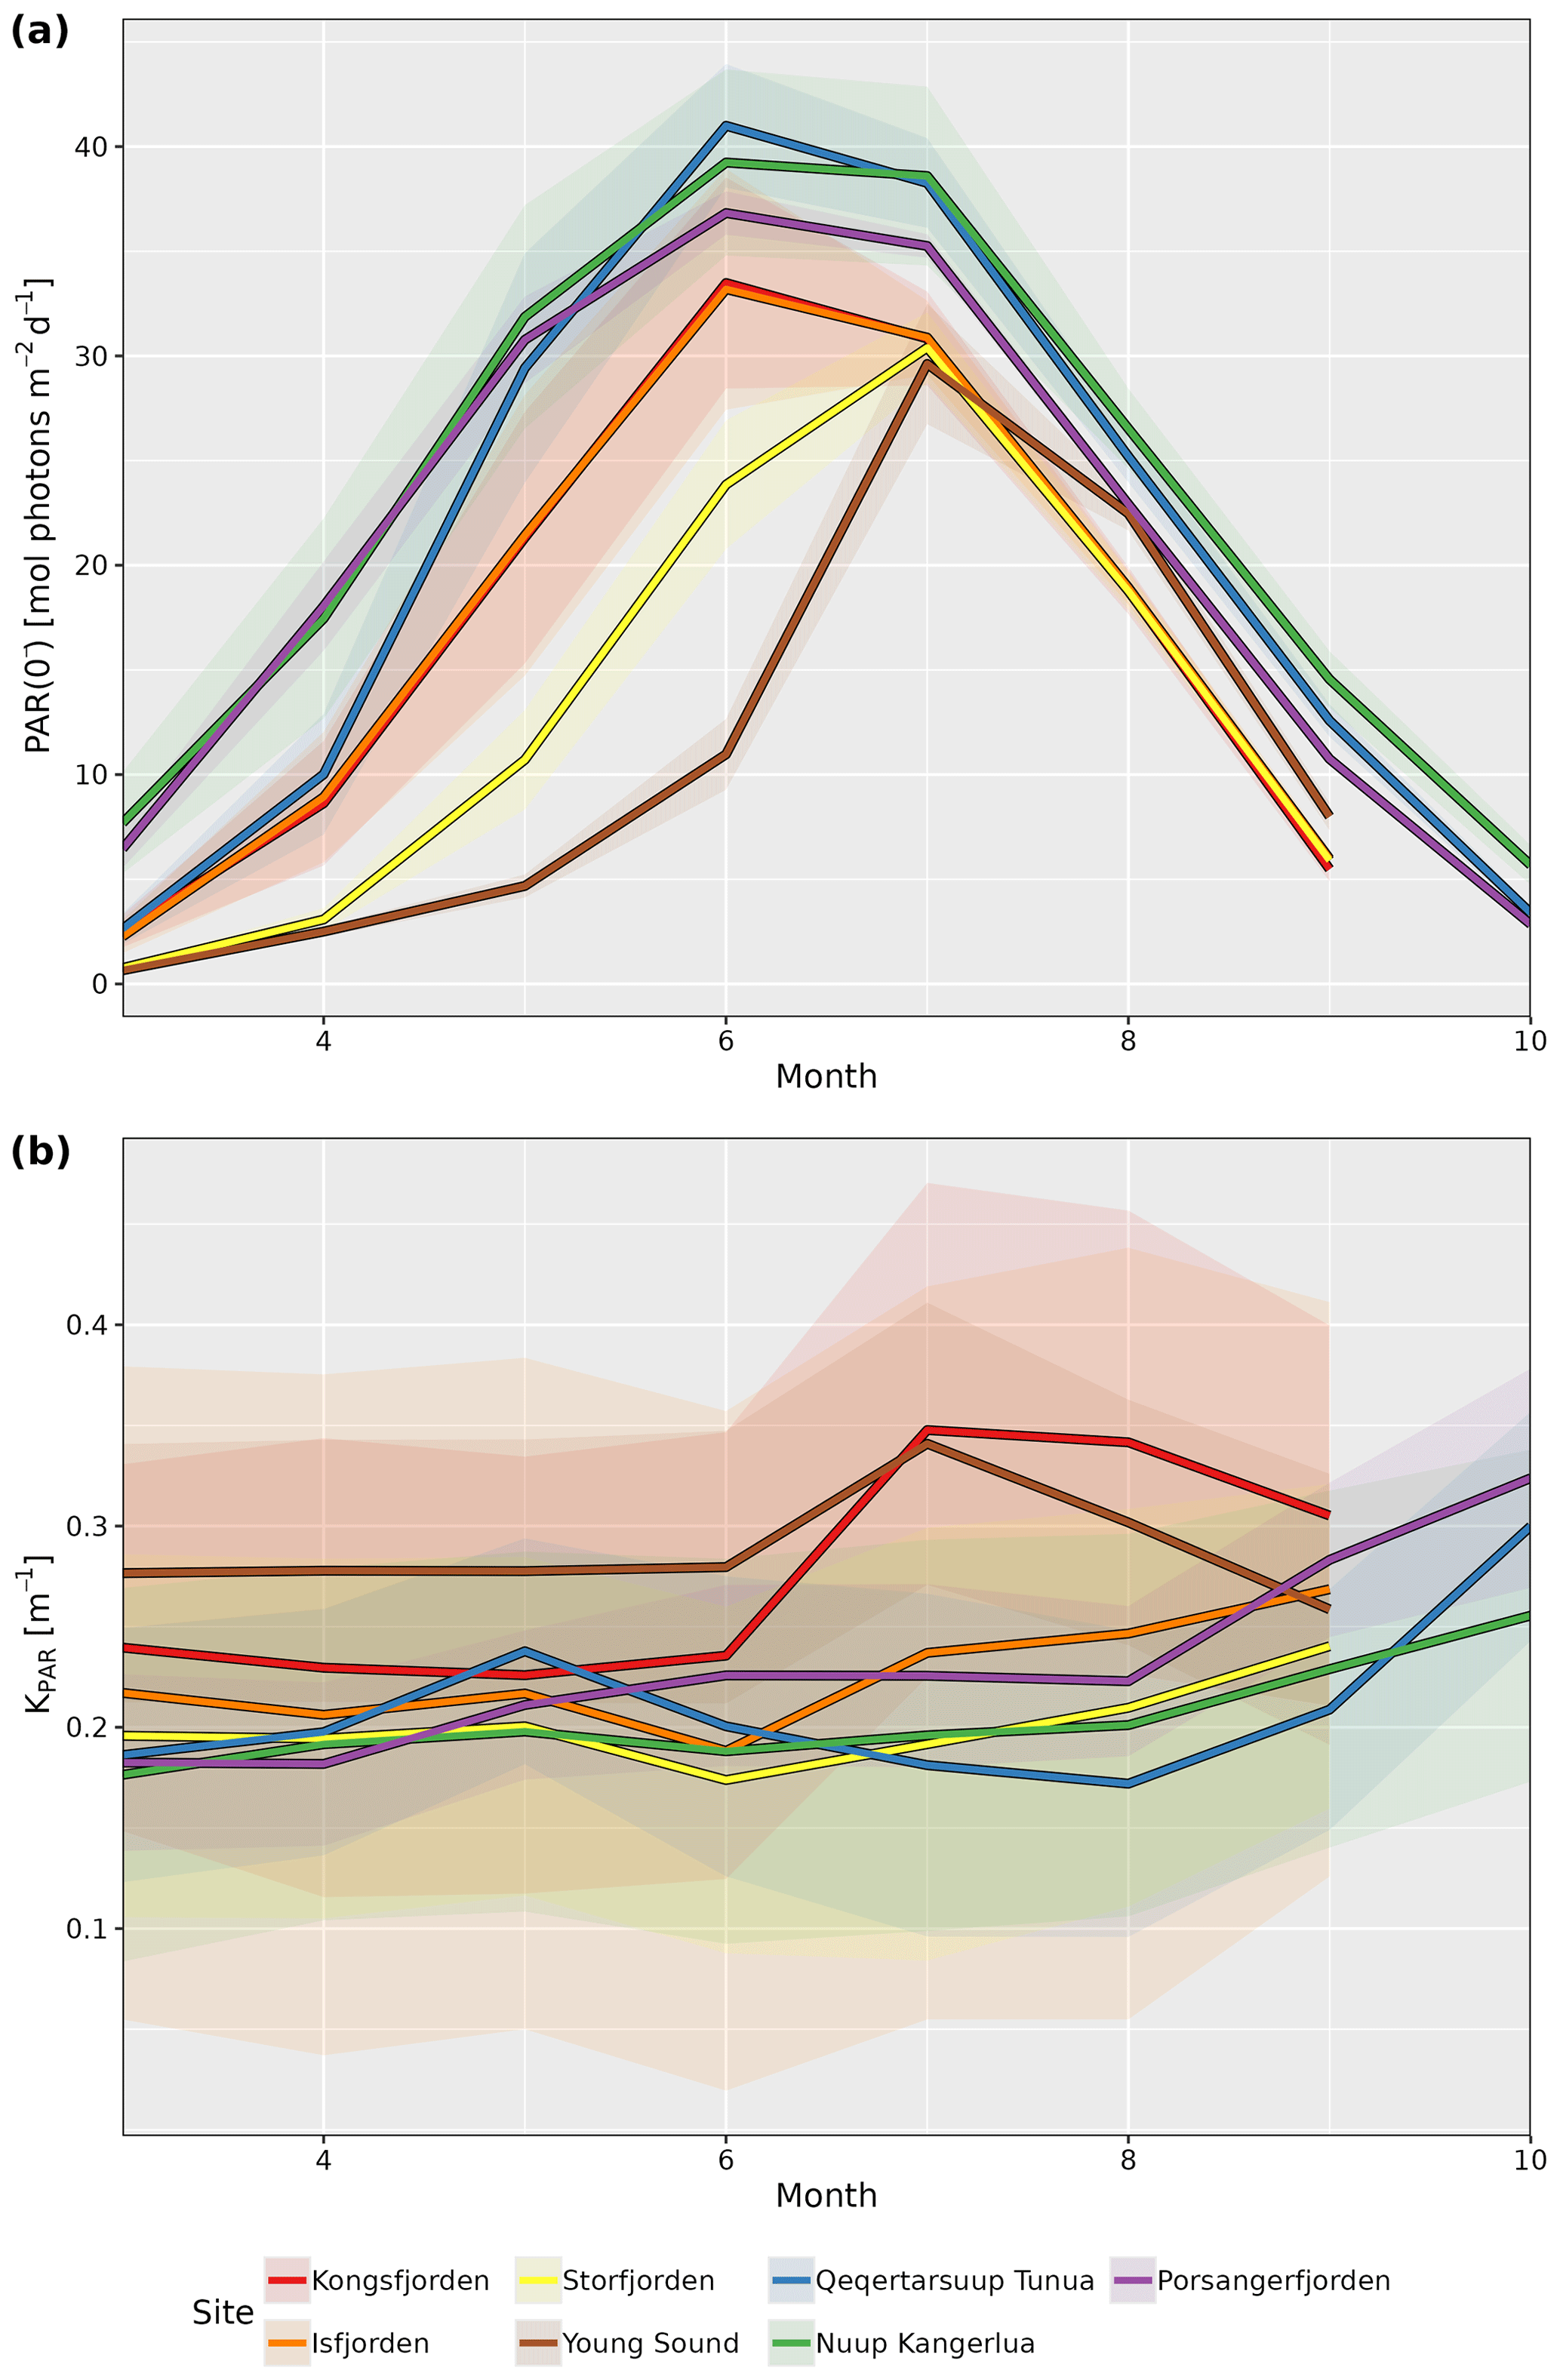
Figure 2Median monthly climatology values for (a) PAR just below the surface (PAR(0−)) and (b) attenuation coefficient of PAR (KPAR) for the shallow-zone pixels (depth ≤50 m) from each site. Note the seasonal cycle in PAR(0−) for all sites but the different patterns for KPAR. Shaded ribbons show the standard deviation.
There is a clear seasonal cycle in the monthly climatology of light penetrating the surface of the shallow zone at all seven study sites (Fig. 2a). The median value of PAR(0−) across all sites starts out relatively low in March, where it then increases to a peak sometime between June and July before decreasing again until September to October. The delay in seasonal PAR(0−) peak relative to solar solstice is due to the sea-ice cover, unlike for the PAR(0+) (i.e. PAR above the surface) that usually occurs prior to the solstice (Laliberté et al., 2021).
The monthly climatology of the shallow-zone KPAR (Fig. 2b) shows two different patterns. The first pattern, found in all Svalbard and eastern Greenland sites, is a stable or decreasing KPAR from March to June and then an increase until June to September before another decrease until the end of the illuminated part of the year. The second pattern, which is found in western Greenland and northern Norway, is a stable or fluctuating KPAR until August, followed by a rapid increase up until the end of the illuminated part of the year. While it is beyond the scope of the description of this dataset to investigate these patterns in detail, it is hypothesized here that the first pattern is representative of a system that is still dominated by a marine-terminating glacier, and that the bulk of the turbidity in the water (i.e. KPAR) is due to the glacial runoff during the warmest summer months (July and August). This is why it starts to build up in June but decreases after a couple of months. The second pattern likely represents systems dominated by riverine runoff – that is, systems in which there is no dominant marine-terminating glacier.
When looking at the annual median time series of PAR(0−) and KPAR in the shallow zone of each site, it is possible to see some changes over time (Fig. 3). Even though there are very high levels of interannual variation in PAR(0−) for all sites, the increase seen for Storfjorden is significant (p=0.01). For KPAR, there have been significant increases for Kongsfjorden (p=0.02) and Porsangerfjorden (p<0.01). It is important to recall that the monthly climatologies for PAR(0−) and KPAR differ (Fig. 2), meaning that changes to one or the other within a given year may result in non-linear changes in PARB.
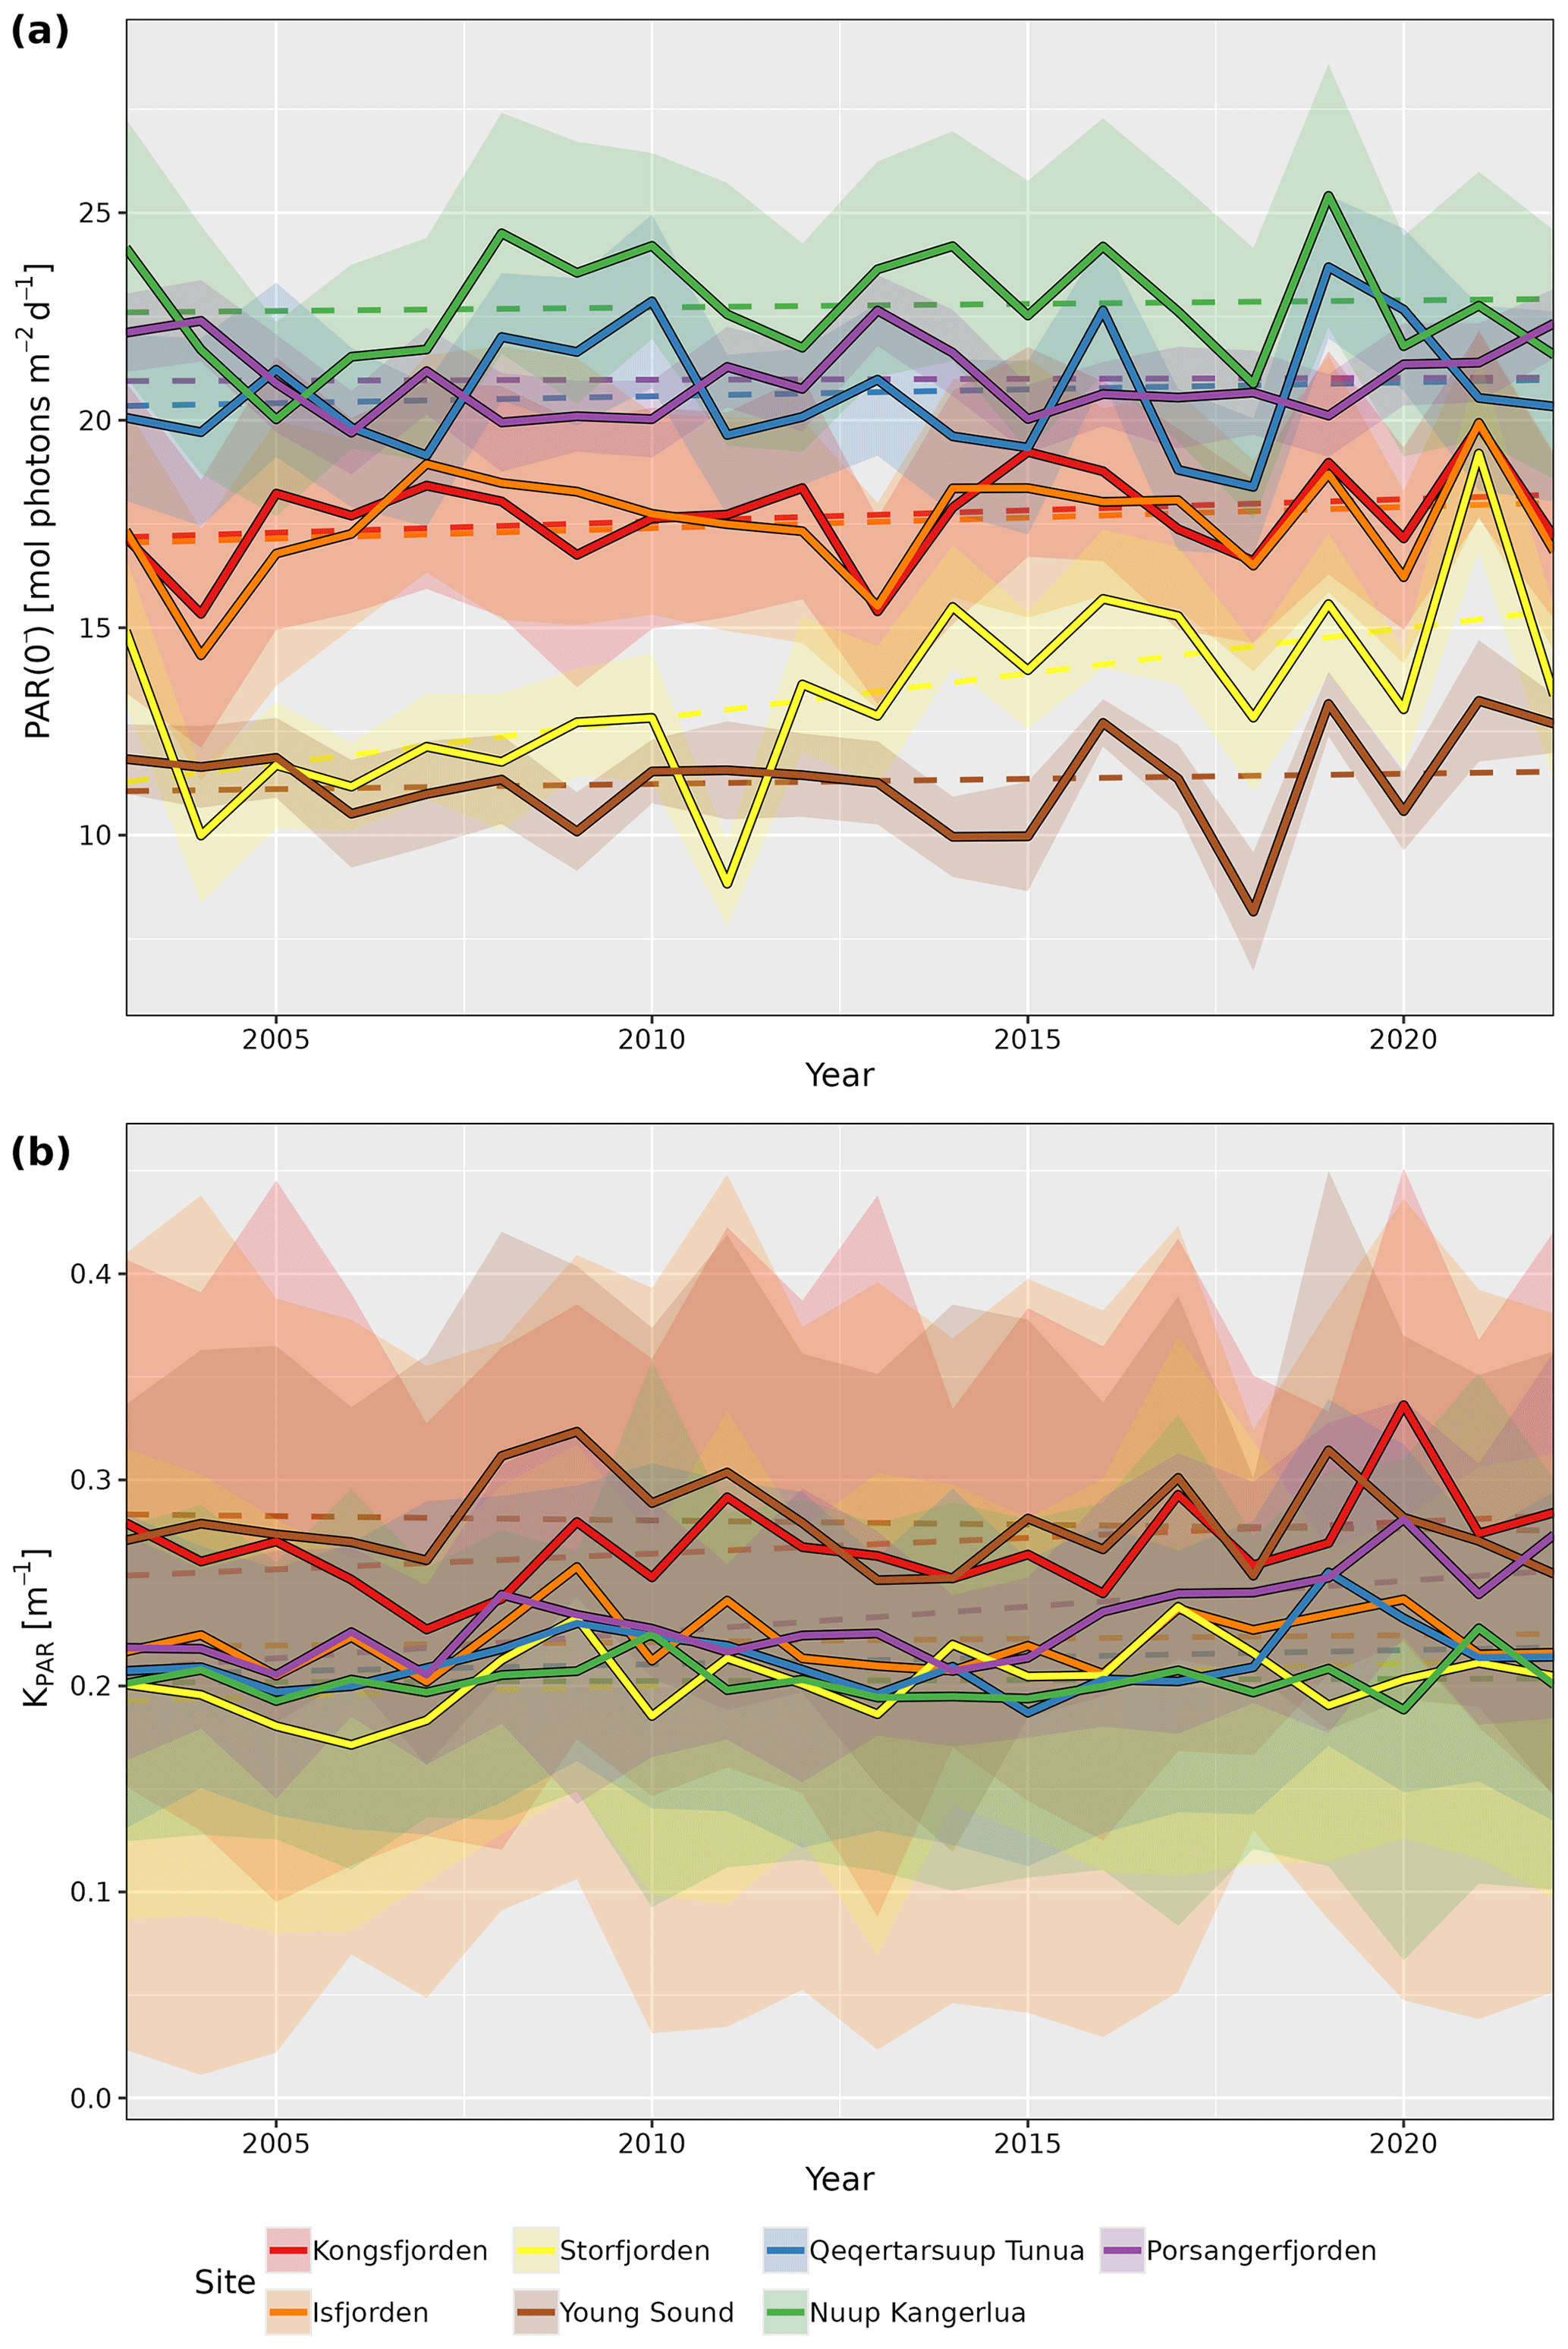
Figure 3Annual median values for (a) PAR just below the surface (PAR(0−)) and (b) the attenuation coefficient of PAR (KPAR) for the shallow pixels (depth ≤50 m) from each site. Dashed lines show the linear trends, and shaded ribbons show the standard deviations for the annual medians.
3.2 Bottom values: PARB
As PARB is available at a monthly resolution (March to October) within this dataset, we can look at how this value has changed across all sites for each individual month (Table 4, Fig. 4). In this way, we are able to track changes in the phenology of PARB. Looking at the median values of PARB for all shallow pixels (depth ≤50 m), the most notable result is the large change in magnitude between months. The months of June to August generally have much higher PARB than March and/or October, as would be expected. Less expected is the large interannual variance, which may mask significant changes over time. For example, although there is an apparent decrease in PARB for the month of June in Kongsfjorden, the change is not statistically significant (simple linear model; p=0.4). The same can be said for the apparent increase in PARB for Storfjorden in June (p=0.2). However, there is a significant decrease in PARB in Kongsfjorden for September (p=0.02). There is also a significant decrease in PARB in Storfjorden for May (p=0.04), July (p<0.01), and August (p<0.01). Porsangerfjorden shows significant decreases in August (p<0.01) and September (p<0.01). Nuup Kangerlua shows a significant decrease in PARB for the month of March (p=0.02). Considering the fact that many benthic species (e.g. kelps) require a certain minimum amount of PARB to survive (see Sect. 3.4), changes to these values over time could have notable impacts on local ecosystems.
Table 4Trends for the changes in shallow (depth ≤50 m) bottom PAR (PARB) from 2003 to 2022 for each month (columns) per site (rows). All units are expressed in rates of mol photons m−2 d−1 yr−1 and are accompanied in brackets by the p value of the fitted linear model. These values therefore show the change in PAR for the given month (columns) per year. Months with significant positive trends are shown in bold, and significant negative trends are in bold and italic.
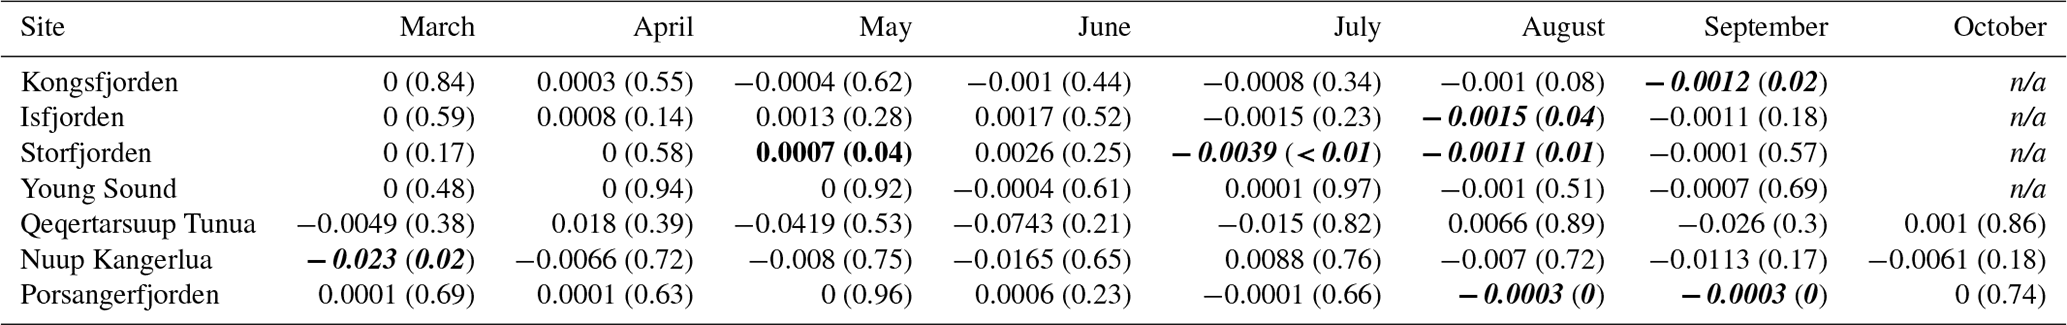
n/a: not applicable
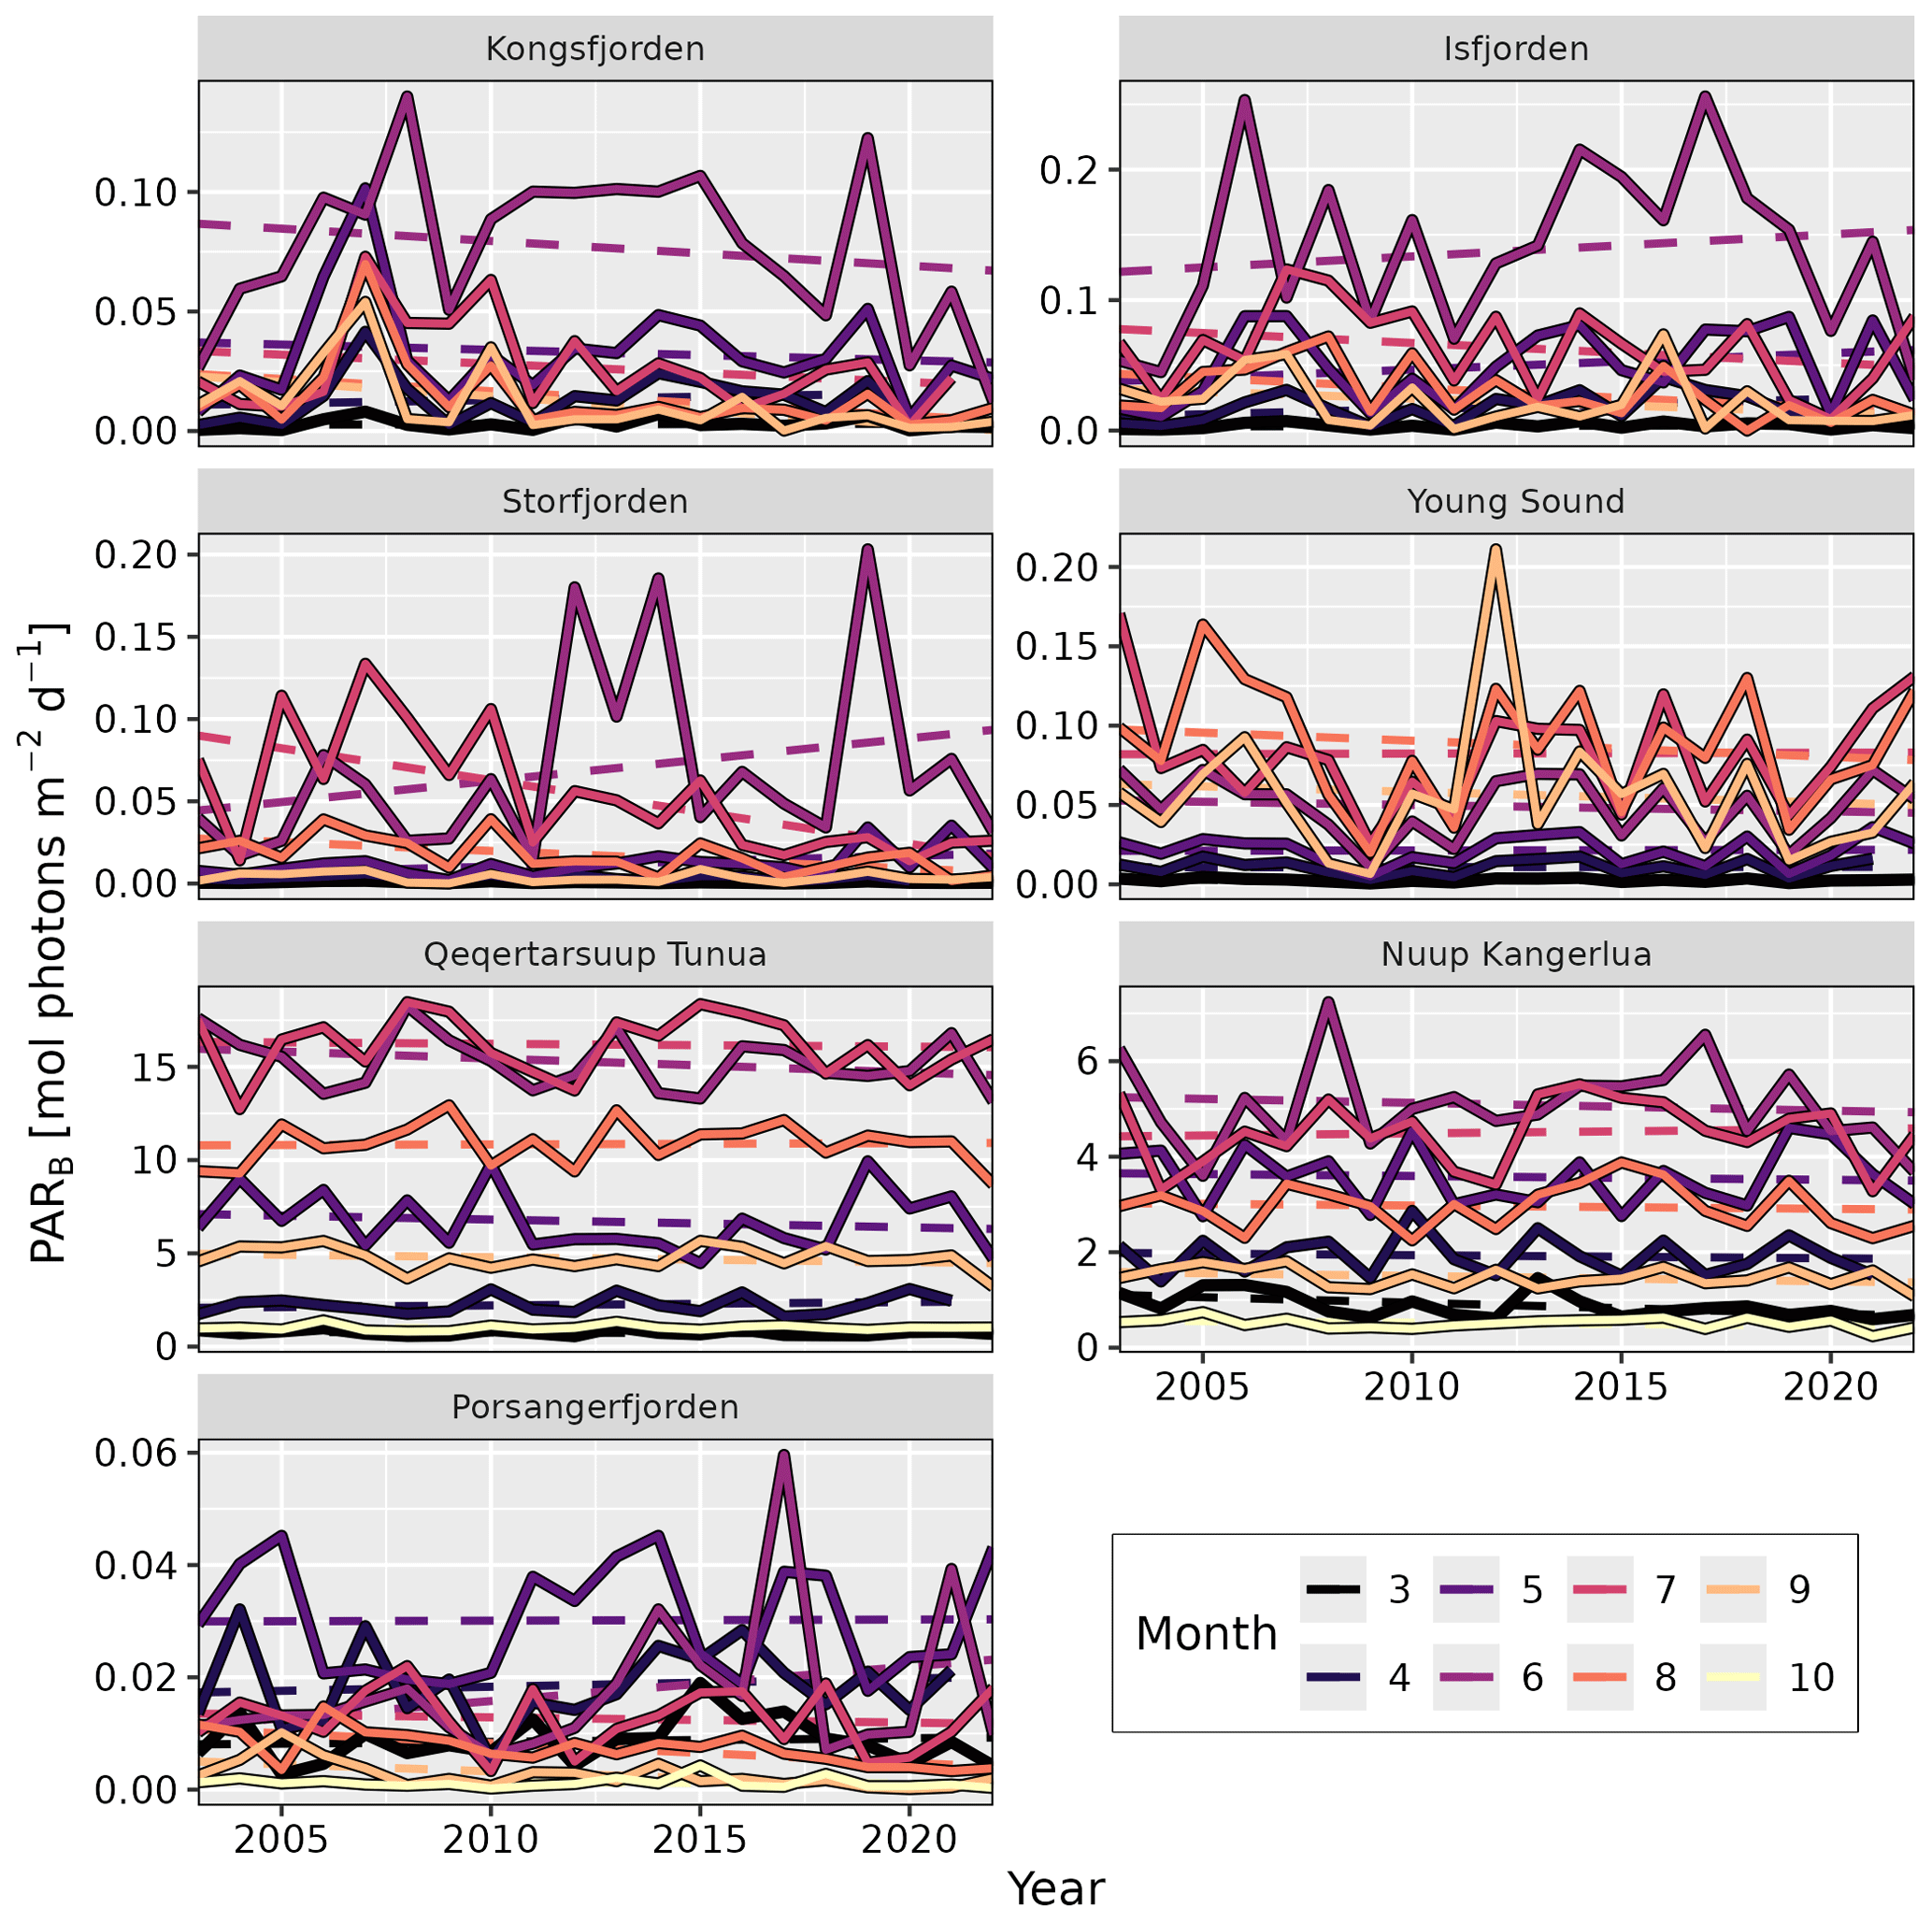
Figure 4Changes in shallow (depth ≤50 m) bottom PAR (PARB) over time by month. Solid lines represent the median values averaged for all pixels with a depth of 50 m or shallower. Dashed lines show the trend over time, whose slope and p value are given in Table 4. Note the different y axes between panels. Standard deviation ribbons not shown due to over-plotting.
3.3 P functions
The global shallow (i.e. depth ≤50 m) P functions show substantial differences between sites (Fig. 5). The shallow seafloor of western Greenland (Nuup Kangerlua and Qeqertarsuup Tunua) has, by far, the largest cumulative area receiving the highest levels of PARB (25 % ≥10 mol photons m−2 d−1) and, by far, the largest cumulative area receiving ≥0.001 mol photons m−2 d−1 (∼90 %). This is largely due to the extensive area of open-ocean water that is used to estimate PARB at these sites. For all other sites, less than 10 % of the shallow seafloor receives more than 10 mol photons m−2 d−1, with ∼60 % receiving more than 0.001 mol photons m−2 d−1. Note, however, the difference in the area of the seafloor receiving light for Storfjorden (Svalbard) and Porsangerfjorden (northern Norway). While the percentages for the high and low light levels are similar amongst most sites, the amounts receiving intermediate light levels are much lower.
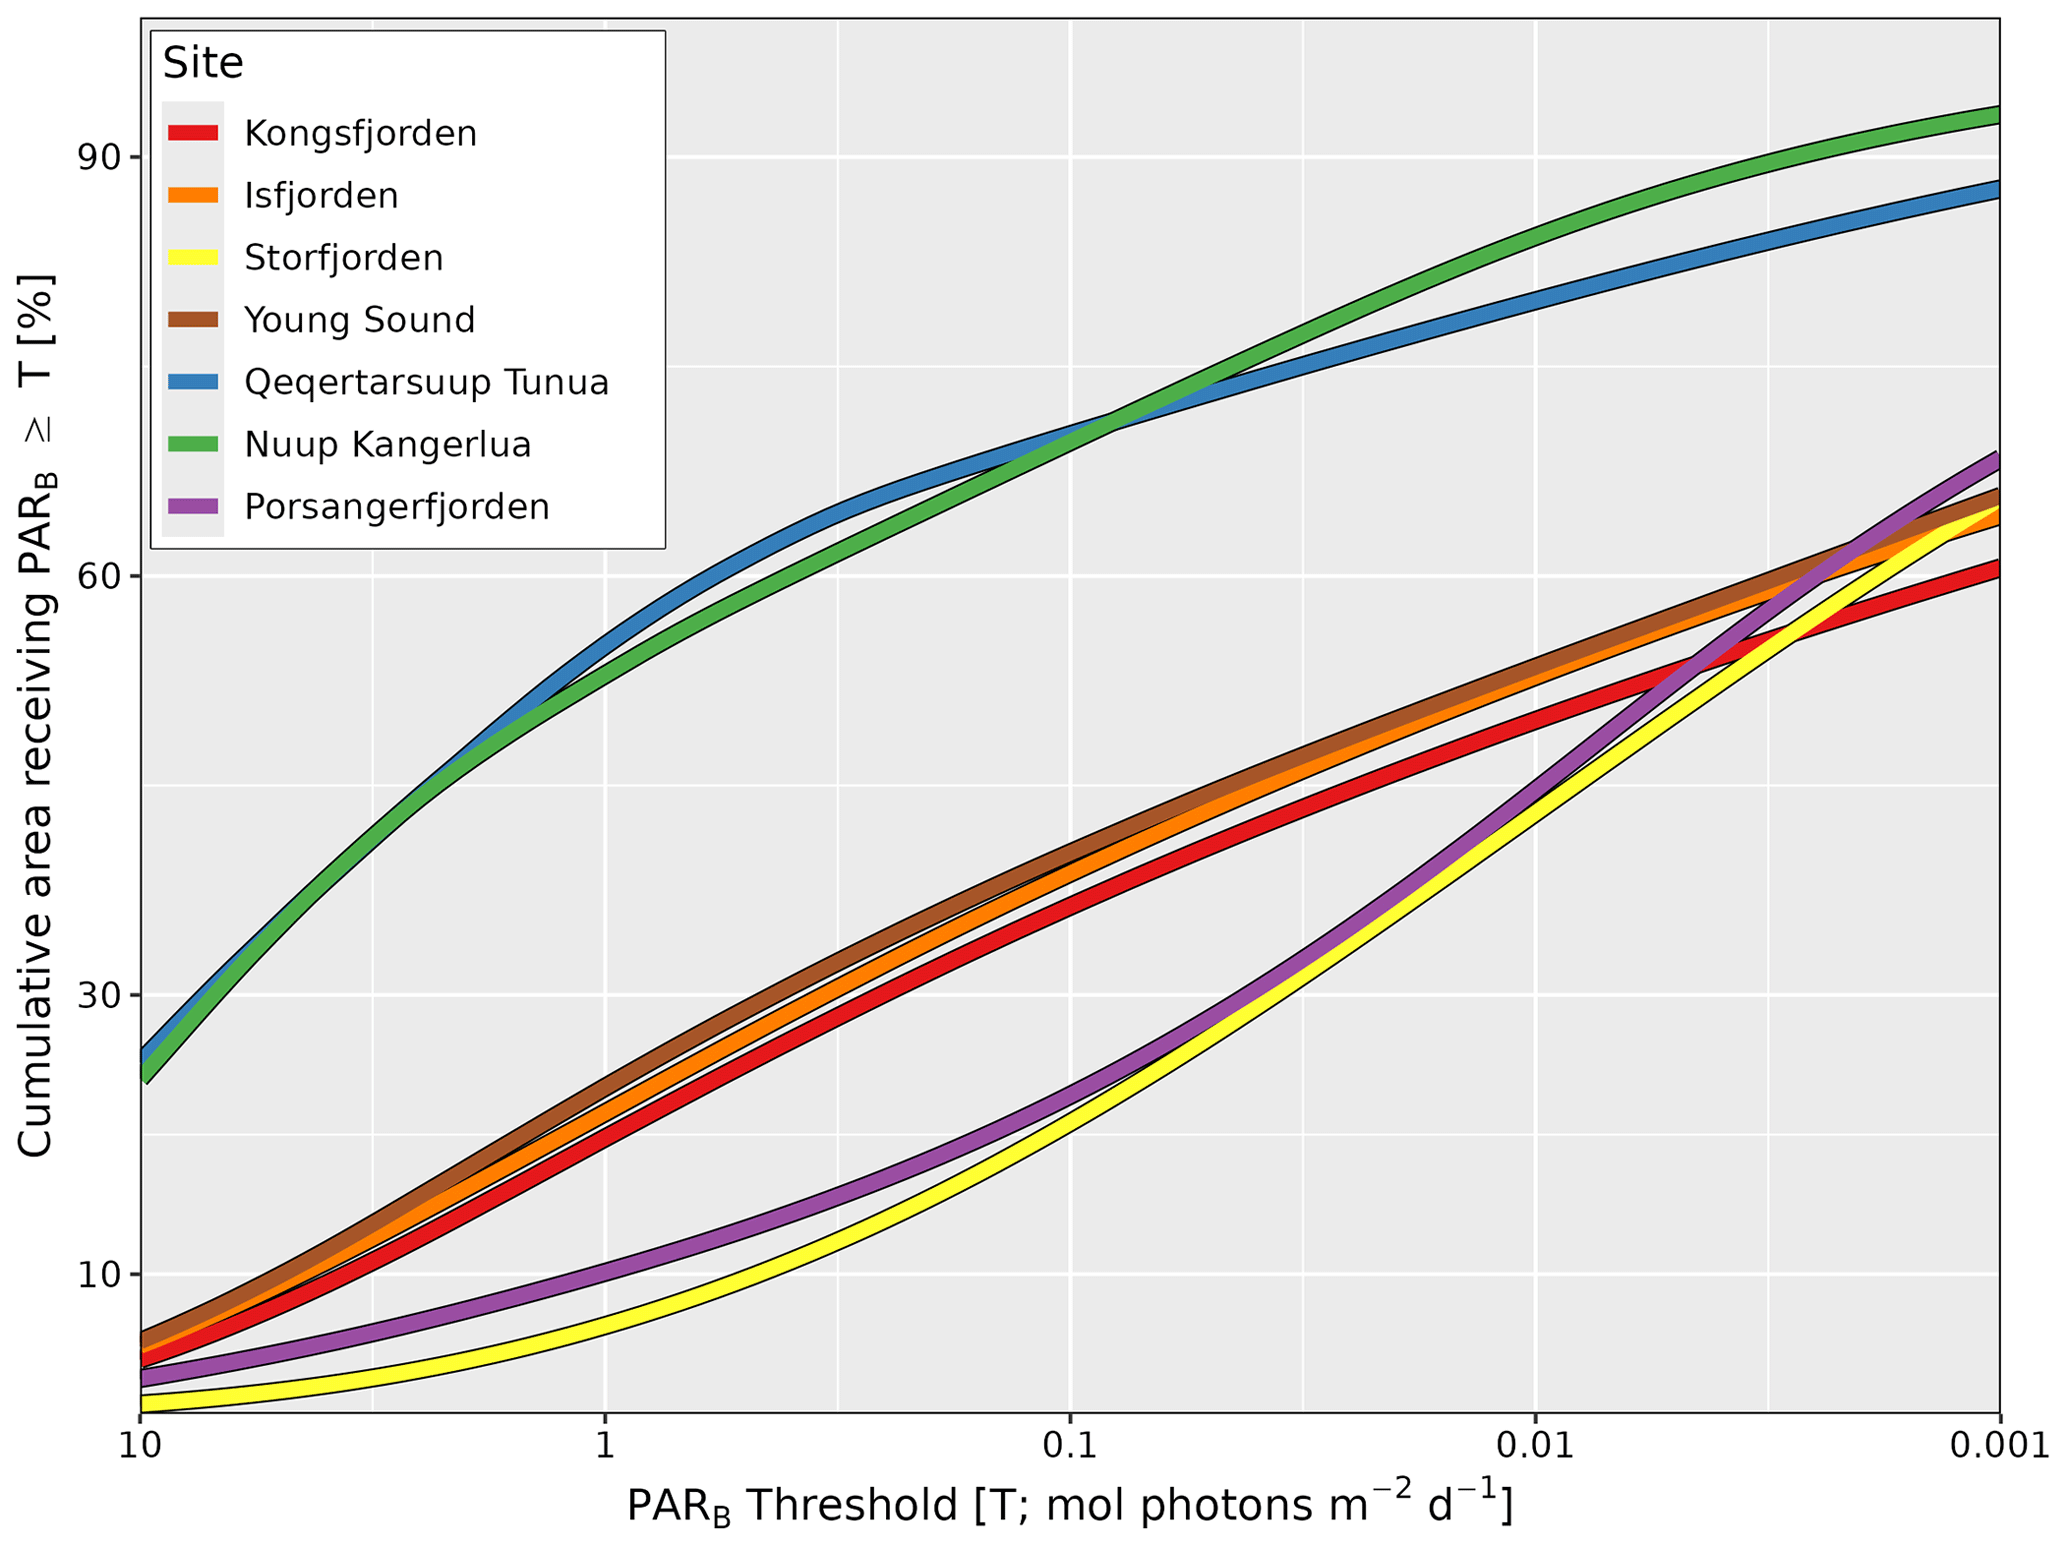
Figure 5Percentage surface area of the seafloor receiving PARB above a prescribed threshold (T) at each site. Curves illustrate the global average in percent of the total area (y axis) of each fjord not deeper than 50 m that experiences the PARB value shown on the x axis. Note that the x axis is reversed (larger values are on the left) and log10-transformed. For example, Qeqertarsuup Tunua has about 25 % of the surface area of the seafloor experiencing a global average of at least 10 mol photons m−2 d−1, and roughly 90 % of the seafloor receives at least 0.001 mol photons m−2 d−1.
Within these sites, there are also different patterns in the monthly climatology (Fig. S1 in the Supplement). Generally, the peak in PARB for all sites, at both high and low levels of PARB, occurs in June, with a build-up to (and down from) this peak over the preceding (following) 3 to 4 months. Exceptions to this pattern may be seen in Young Sound and Qeqertarsuup Tunua, where the months of peak PARB occur between July and August. These patterns are driven by the combined effect of many variables: solar zenith angle, cloud and ice cover, KPAR, and the underwater fjord morphology.
Using the annual P functions per site, we may see that the shallow areas receiving high levels of PARB across all sites did not change much from 2003 to 2022 (Fig. S2). The shallow areas receiving lower levels of PARB for western Greenland (Qeqertarsuup Tunua and Nuup Kangerlua) have also remained relatively stable. Increasing interannual variance in the P functions for low light may be seen in eastern Greenland (Young Sound), northern Norway (Porsangerfjorden), and western Svalbard (Kongsfjorden and Isfjorden) (Fig. S2).
Changes in PAR(0−), KPAR, and PARB are interesting on their own, but when used in combination with known photic limits for ecologically important species, the results become illuminating.
3.4 Changes in inhabitable benthic area for kelp growth
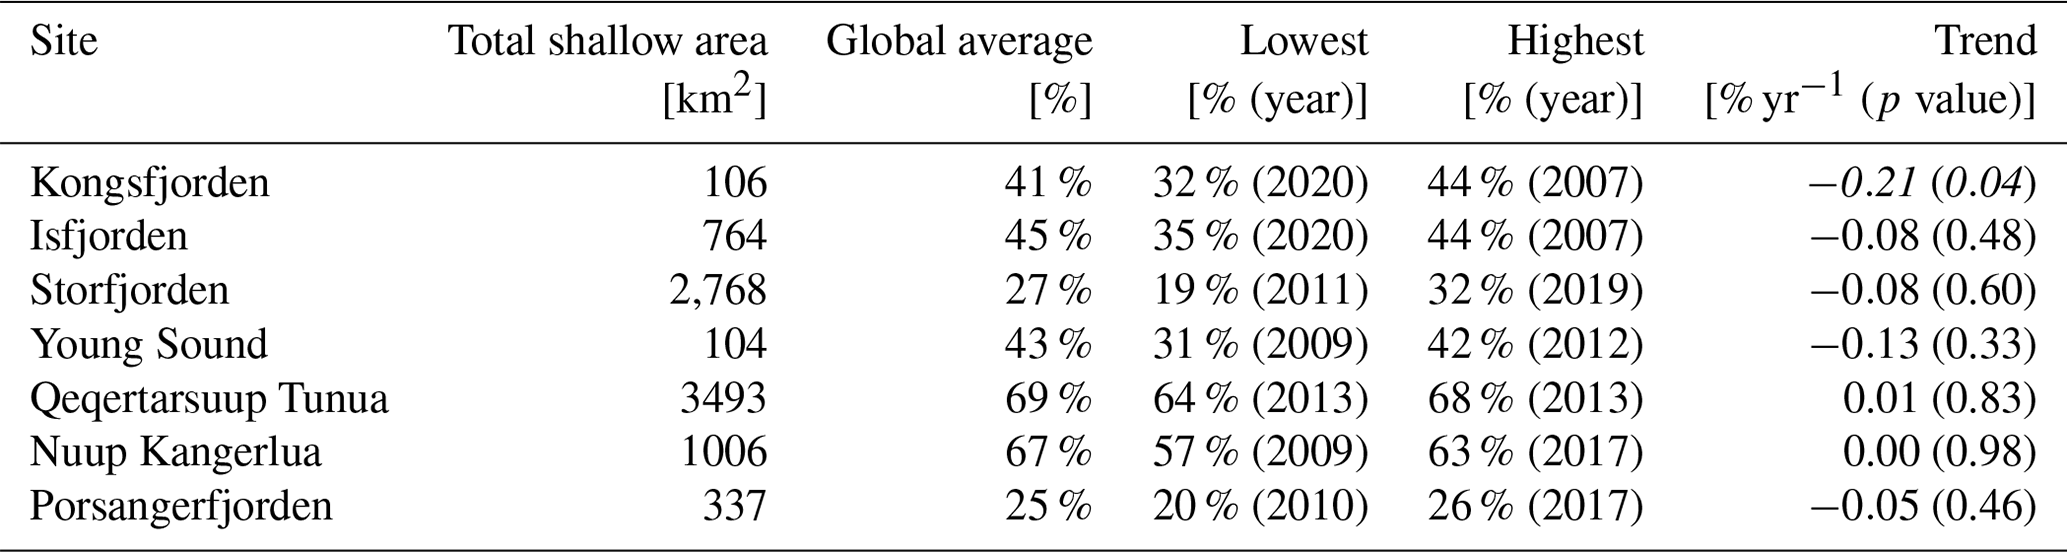
In the interest of demonstrating a clear use case for this dataset, the biologically relevant PAR limitation of 47 mol photons m−2 yr−1 (median of Table 3) was converted to 0.13 mol photons m−2 d−1 by simply dividing 47 by 365 and was used as a filter to investigate changes in the shallow bottom area within fjords where ecologically important species (kelp) could survive (Table 5). By utilizing the annual PARB data, we were able to see what percentage of the shallow area of each fjord should be able to support benthic macroalgal communities and if any changes have occurred over time. One may see that the annual spatial area changes somewhat between years, but a significant decrease is only seen in Kongsfjorden.
Table 5Area of the fjords capable of supporting benthic macroalgae. The total shallow area (≤50 m; km2) of each site is shown, followed by the global suitable area (% of shallow area averaged over the full dataset). Note the year at which the lowest and highest values for spatial availability were observed. The linear trend (% spatial availability per year; p value) in the dataset from 2003 to 2022 is also provided. Note that this is the trend value for the full time series, not the trend between the high and low columns also provided in this table. Significant negative trends are shown in bold and italic. Note that the trend values are in percent values, meaning a slope of −0.21 % would mean a reduction of 2.1 % in terms of available substrate over 10 years.
The code written for the analysis of these data and the creation of the figures may be found on GitHub at https://github.com/FACE-IT-project/fjord_PAR (last access: 29 April 2024) and https://doi.org/10.5281/zenodo.11633656 (Schlegel, 2024).
The PAR dataset would be most easily accessed via the R package FjordLight, which can be installed via CRAN (Gentili et al., 2023b, https://doi.org/10.5281/zenodo.10259129) or GitHub at https://face-it-project.github.io/FjordLight (last access: 29 April 2024). The data are also available for download from the World Data Center PANGAEA as a series of NetCDF files, one for each fjord: https://doi.org/10.1594/PANGAEA.962895 (Gentili et al., 2023a) and https://doi.org/10.1594/PANGAEA.965460 (Gentili et al., 2024).
All data were generated from a base of daily gridded remotely sensed observations (see Sect. 2.2 and 2.3). The primary variables created are PAR(0−), KPAR, and PARB (Table 6). These three variables are available at ∼50–150 m resolution across all sites. P functions, which are a summary value and are therefore not gridded, were computed from PARB and the surface area of all shallow (depth ≤50 m) and coastal (depth ≤200 m) pixels. For these four primary variables, four different levels were created and are available in this dataset:
-
Monthly. This is the average of all available daily data within a given month and is expressed in units of mol photons m−2 d−1 (except KPAR [m−1]). For example, the monthly value for June 2006 is the average of all available days of data from 1 June 2006 to 30 June 2006. It is important to note that a given pixel during a given month was required to have at least 20 d of available data to be included in the dataset (Table S1 in the Supplement).
-
Climatology. This is the average of all of the same months of data across the available years of data. For example, the July climatological value is the average of all July monthly values from 2003 to 2022. The standard deviation (SD) for these averaged values is also available. It is important to note that, due to latitudinal differences, some sites do not receive 20 d of light in October and so are missing October climatologies (e.g. Kongsfjorden).
-
Yearly. This is the average of all available monthly values during a given year, with the SD also provided.
-
Global. This is the average of all yearly values.
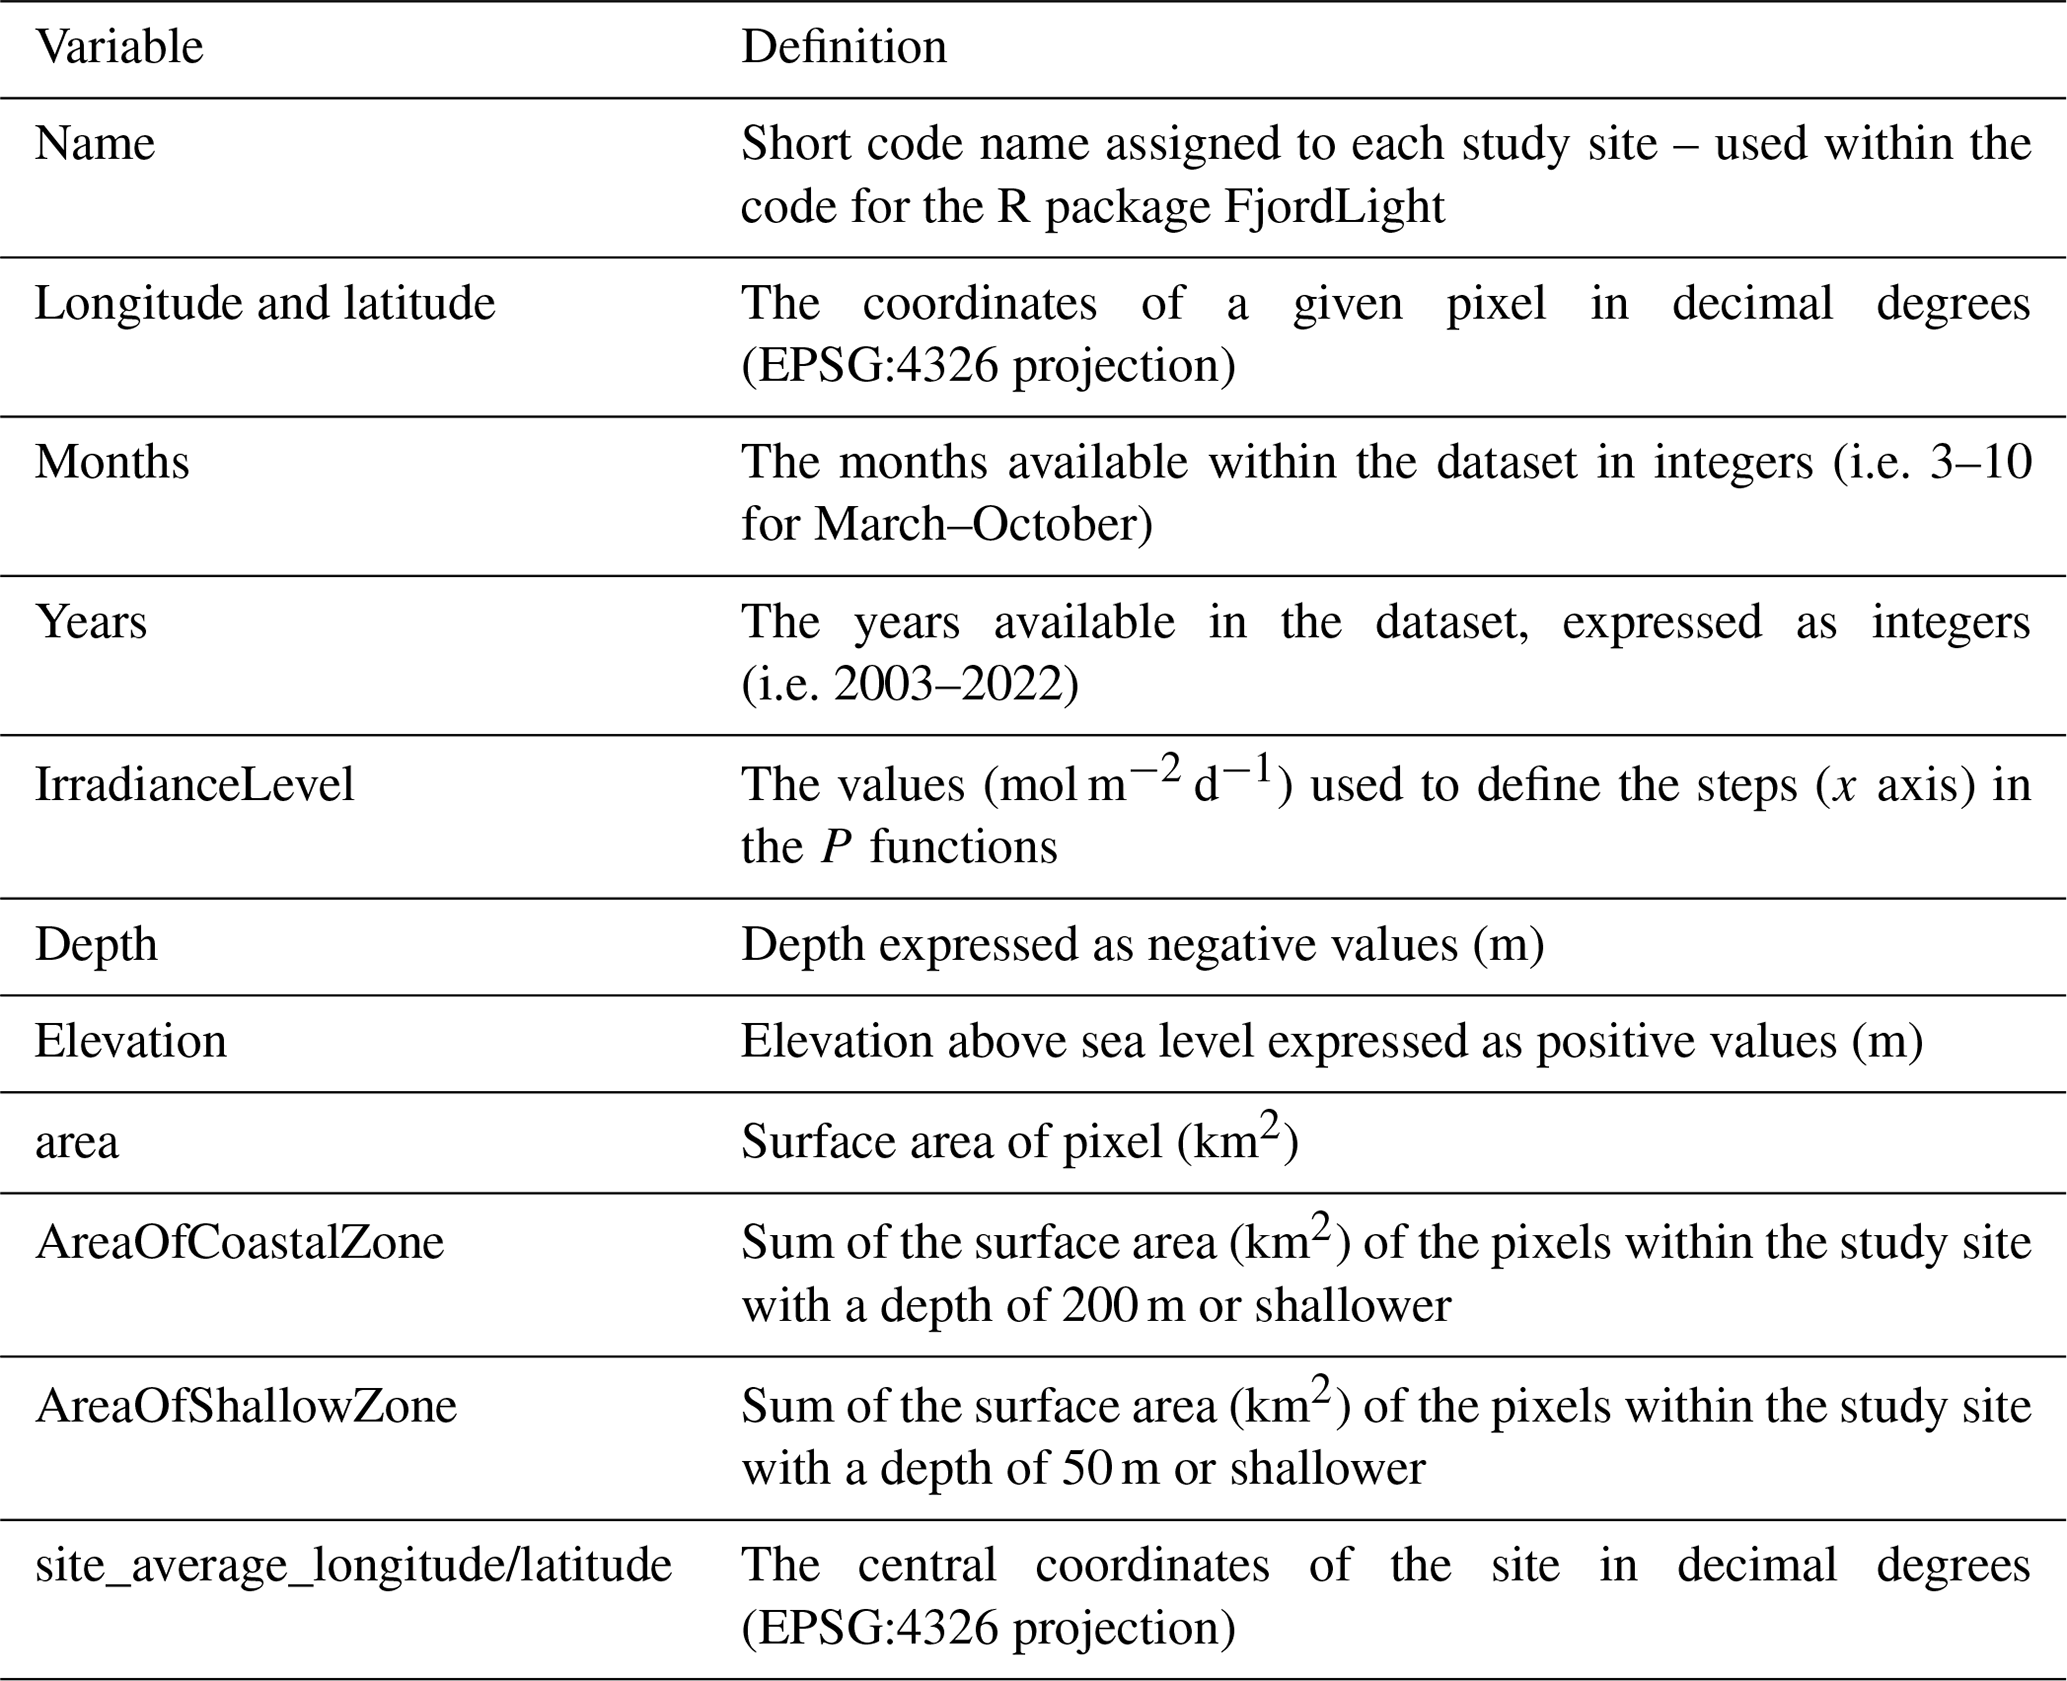
Note that, because the primary utility of this dataset is identified to be PAR within the water column, only PARB and KPAR data are available at the monthly temporal resolution. This technical choice was made because the inclusion of all monthly data for all variables would make the NetCDF files too large to load into memory for anything other than servers or very powerful desktop computers. It was determined that this would severely limit the usability of these data; therefore, it was preferable to remove the monthly data for PAR(0−) and the P functions. The NetCDF files contain a range of meta-data that may also be of interest to users (Table 7).
Table 6The code names (rows) for the available data (columns) for the PAR values provided in the dataset. Shown in brackets are the names for standard deviation (SD) values.
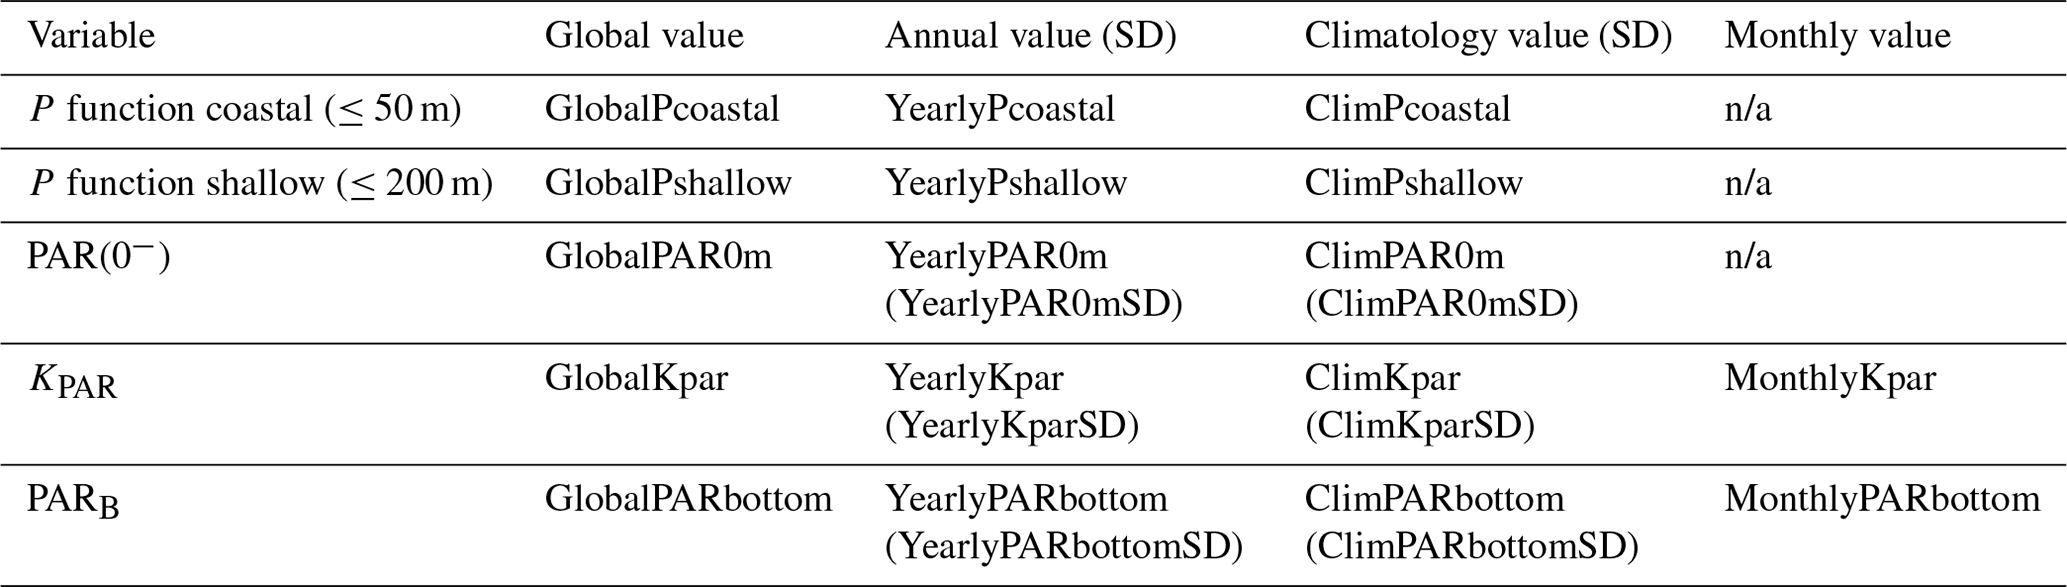
n/a: not applicable
Table 7Secondary variables of interest provided within the dataset.
The data product summarized in this report was designed to provide a number of variables in a range of EU Arctic fjords. Monthly PARB is the primary variable of interest, but the dataset also provides monthly values for KPAR, as well as global mean values, annual values, and monthly climatologies for PAR(0−), KPAR, and PARB. The data are currently available from 2003 to 2022 but can be updated annually because they are created from algorithms that utilize operational data streams applicable to MODIS but also to VIIRS and future PACE missions. Establishing the runtime environment within which these updates could occur will be time-consuming, but once established, this process could be left to run operationally. Should this dataset prove to be useful for ongoing research, in the future, this setup could be arranged.
With the exception of Kongsfjorden (Svalbard), the available PARB in the EU Arctic fjords shows no significant signs of long-term change. However, although PAR(0−) and KPAR are not changing much at an annual rate, PARB values of certain months (e.g. July) are changing more rapidly than others. One must also note the large interannual and intra-annual variance seen in the various PAR measurements. In some cases, there are strong upward trends in PARB during the early and late months of the year, which is interpreted here as an extension of the sea-ice-free period. As sea ice melts earlier and freezes later, more light reaches the bottom during the months that have historically had lower light levels. However, there is still an overall (not statistically significant) downward trend in the annual averages due to increased light attenuation in the water column (KPAR) during the peak months of the year. This reduction in PARB is interpreted to be caused by increased terrestrial and/or glacial runoff into fjords, which causes darkening of the water due to the delivery of dissolved and particulate material. The darkening effect has an overall larger impact on the annual PARB because its timing coincides with the peak in PAR(0−). These results are consistent with those of Singh et al. (2022) at a pan-Arctic scale but emphasize the need to consider the local processes that control light attenuation. That being said, 20 years of data is generally not regarded to be a long enough time period to make statements on long-term (e.g. inter-decadal) trends. This is particularly relevant for these PAR data because of how widely the values swing up or down from one year to the next.
Because benthic algae rely on photosynthesis to survive throughout the year, any reduction in PARB at water depths where the algae are light-limited is likely to have a negative effect. However, the changes observed in the PAR dataset are complex and non-linear and vary greatly between years. Therefore, trends presented here should not be extrapolated into the future. It is also known that, at some point in the future, the peak rates of terrestrial and/or glacial runoff will be reached (this may have already occurred in parts of Svalbard), after which fjord waters are expected to lighten again as terrestrial and/or glacial runoff is reduced. One must also consider that PAR thresholds for important benthic species are, to some extent, driven by ambient seawater temperature (e.g. eelgrass – Staehr and Borum, 2011; kelps – Niedzwiedz and Bischof, 2023). Therefore, as the Arctic warms, PAR thresholds (and thus historical depth ranges) will change regardless of how turbid the water may or may not be in the future.
As shown in the inhabitable-area example (Sect. 3.4), this dataset can be useful for a suite of research questions (e.g. Fig. 1). The high-spatial-resolution PAR(0−), KPAR, and PARB values can also be integrated into a workflow that uses any number of other datasets. For example, species distribution modelling (SDM) within fjords must be done at a very high resolution but tends to use only global values. On the other hand, the life cycle of an organism within the water column could be better understood by utilizing the monthly values for KPAR, or annual PAR(0−) could be used to understand changes in the irradiance received by fjord surface waters over time. Other examples include the potential benefits of using this dataset for forcing or initial conditions in state-of-the-art ocean–biogeochemical models and/or forcing for ecosystem box models. The purpose here is to demonstrate some of the many potential applications of this dataset, which fills a gap in the physical understanding of EU Arctic fjord systems.
The supplement related to this article is available online at: https://doi.org/10.5194/essd-16-2773-2024-supplement.
The paper was conceived by JPG, and the original dataset was created by BG based on prior work done by BG, JPG, RKS, and SB. The analyses and visualizations were performed by RWS. All the authors contributed to the writing and editing of the paper. RWS coordinated the editing and managed the submission.
The contact author has declared that none of the authors has any competing interests.
Publisher's note: Copernicus Publications remains neutral with regard to jurisdictional claims made in the text, published maps, institutional affiliations, or any other geographical representation in this paper. While Copernicus Publications makes every effort to include appropriate place names, the final responsibility lies with the authors.
This study is a contribution to the project FACE-IT (The Future of Arctic Coastal Ecosystems – Identifying Transitions in Fjord Systems and Adjacent Coastal Areas).
FACE-IT has received funding from the European Union's Horizon 2020 research and innovation programme (grant no. 869154).
This paper was edited by Alberto Ribotti and reviewed by two anonymous referees.
Aanesen, M. and Mikkelsen, E.: Cost-benefit analysis of aquaculture expansion in Arctic Norway, Aquac. Econ. Manag., 24, 20–42, https://doi.org/10.1080/13657305.2019.1641570, 2020.
Aksnes, D., Dupont, N., Staby, A., Fiksen, Ø., Kaartvedt, S., and Aure, J.: Coastal water darkening and implications for mesopelagic regime shifts in Norwegian fjords, Mar. Ecol. Prog. Ser., 387, 39–49, https://doi.org/10.3354/meps08120, 2009.
Arrigo, K. R. and van Dijken, G. L.: Secular trends in Arctic Ocean net primary production, J. Geophys. Res., 116, C09011, https://doi.org/10.1029/2011JC007151, 2011.
Assis, J., Serrão, E. A., Duarte, C. M., Fragkopoulou, E., and Krause-Jensen, D.: Major Expansion of Marine Forests in a Warmer Arctic, Front. Mar. Sci., 9, https://doi.org/10.3389/fmars.2022.850368, 2022.
Bartsch, I., Paar, M., Fredriksen, S., Schwanitz, M., Daniel, C., Hop, H., and Wiencke, C.: Changes in kelp forest biomass and depth distribution in Kongsfjorden, Svalbard, between 1996–1998 and 2012–2014 reflect Arctic warming, Polar Biol., 39, 2021–2036, https://doi.org/10.1007/s00300-015-1870-1, 2016.
Bass, A. V., Smith, K. E., and Smale, D. A.: Marine heatwaves and decreased light availability interact to erode the ecophysiological performance of habitat-forming kelp species, J. Phycol., 59, 481–495, https://doi.org/10.1111/jpy.13332, 2023.
Bélanger, S., Babin, M., and Tremblay, J.-É.: Increasing cloudiness in Arctic damps the increase in phytoplankton primary production due to sea ice receding, Biogeosciences, 10, 4087–4101, https://doi.org/10.5194/bg-10-4087-2013, 2013.
Bhartia, P. K.: OMI/Aura TOMS-Like Ozone, Aerosol Index, Cloud Radiance Fraction L3 1 day 1 degree × 1 degree V3, NASA Goddard Space Flight Center, Goddard Earth Sciences Data and Information Services Center (GES DISC), Goddard Earth Sci. Data Inf. Serv. Cent. GES DISC [data set], https://doi.org/10.5067/Aura/OMI/DATA3001, 2012.
Borum, J., Pedersen, M., Krause-Jensen, D., Christensen, P., and Nielsen, K.: Biomass, photosynthesis and growth of Laminaria saccharina in a high-arctic fjord, NE Greenland, Mar. Biol., 141, 11–19, https://doi.org/10.1007/s00227-002-0806-9, 2002.
CAFF: Arctic Coastal Biodiversity Monitoring Plan. Conservation of Arctic Flora and Fauna International Secretariat: Akureyri, Iceland, CAFF, 2019.
Castro de la Guardia, L., Filbee-Dexter, K., Reimer, J., MacGregor, K. A., Garrido, I., Singh, R. K., Bélanger, S., Konar, B., Iken, K., Johnson, L. E., Archambault, P., Sejr, M. K., Søreide, J. E., and Mundy, C. J.: Increasing depth distribution of Arctic kelp with increasing number of open water days with light, Elem. Sci. Anthr., 11, 00051, https://doi.org/10.1525/elementa.2022.00051, 2023.
Chapman, A. R. O. and Lindley, J. E.: Seasonal growth of Laminaria solidungula in the Canadian High Arctic in relation to irradiance and dissolved nutrient concentrations, Mar. Biol., 57, 1–5, https://doi.org/10.1007/BF00420961, 1980.
Dunton, K. H.: Growth and production inLaminaria solidungula: relation to continuous underwater light levels in the Alaskan High Arctic, Mar. Biol., 106, 297–304, https://doi.org/10.1007/BF01314813, 1990.
Filbee-Dexter, K., Feehan, C. J., and Scheibling, R. E.: Large-scale degradation of a kelp ecosystem in an ocean warming hotspot, Mar. Ecol. Prog. Ser., 543, 141–152, https://doi.org/10.3354/meps11554, 2016.
Filbee-Dexter, K., MacGregor, K. A., Lavoie, C., Garrido, I., Goldsmit, J., Castro de la Guardia, L., Howland, K. L., Johnson, L. E., Konar, B., McKindsey, C. W., Mundy, C. J., Schlegel, R. W., and Archambault, P.: Sea Ice and Substratum Shape Extensive Kelp Forests in the Canadian Arctic, Front. Mar. Sci., 9, https://doi.org/10.3389/fmars.2022.754074, 2022.
Finstad, A. G., Andersen, T., Larsen, S., Tominaga, K., Blumentrath, S., de Wit, H. A., Tømmervik, H., and Hessen, D. O.: From greening to browning: Catchment vegetation development and reduced S-deposition promote organic carbon load on decadal time scales in Nordic lakes, Sci. Rep., 6, 31944, https://doi.org/10.1038/srep31944, 2016.
Fredriksen, S., Karsten, U., Bartsch, I., Woelfel, J., Koblowsky, M., Schumann, R., Moy, S. R., Steneck, R. S., Wiktor, J. M., Hop, H., and Wiencke, C.: Biodiversity of Benthic Macro- and Microalgae from Svalbard with Special Focus on Kongsfjorden, in: The Ecosystem of Kongsfjorden, Svalbard, edited by: Hop, H. and Wiencke, C., Springer International Publishing, Cham, 331–371, https://doi.org/10.1007/978-3-319-46425-1_9, 2019.
Frigstad, H., Kaste, Ø., Deininger, A., Kvalsund, K., Christensen, G., Bellerby, R. G. J., Sørensen, K., Norli, M., and King, A. L.: Influence of Riverine Input on Norwegian Coastal Systems, Front. Mar. Sci., 7, 332, https://doi.org/10.3389/fmars.2020.00332, 2020.
Gattuso, J.-P., Gentili, B., Duarte, C. M., Kleypas, J. A., Middelburg, J. J., and Antoine, D.: Light availability in the coastal ocean: impact on the distribution of benthic photosynthetic organisms and their contribution to primary production, Biogeosciences, 3, 489–513, https://doi.org/10.5194/bg-3-489-2006, 2006.
Gattuso, J.-P., Gentili, B., Antoine, D., and Doxaran, D.: Global distribution of photosynthetically available radiation on the seafloor, Earth Syst. Sci. Data, 12, 1697–1709, https://doi.org/10.5194/essd-12-1697-2020, 2020.
Gentili, B., Singh, R., Bélanger, S., Schlegel, R., and Gattuso, J-P.: FjordLight: PAR data for Arctic fjords, PANGAEA [data set], https://doi.org/10.1594/PANGAEA.962895, 2023a.
Gentili, B., Gattuso, J-P., Schlegel, R.: FjordLight: Available Light Within the Water Column and Seafloor of Arctic Fjords, Zenodo [code], https://doi.org/10.5281/zenodo.10259129, 2023b.
Gentili, B., Singh, R., Bélanger, S., Schlegel, R., Gattuso, J-P.: FjordLight: addendum to PAR data for Arctic fjords, PANGAEA [data set], https://doi.org/10.1594/PANGAEA.965460, 2024.
Goldsmit, J., Schlegel, R. W., Filbee-Dexter, K., MacGregor, K. A., Johnson, L. E., Mundy, C. J., Savoie, A. M., McKindsey, C. W., Howland, K. L., and Archambault, P.: Kelp in the Eastern Canadian Arctic: Current and Future Predictions of Habitat Suitability and Cover, Front. Mar. Sci., 8, https://doi.org/10.3389/fmars.2021.742209, 2021.
Gregg, W. W. and Carder, K. L.: A simple spectral solar irradiance model for cloudless maritime atmospheres, Limnol. Oceanogr., 35, 1657–1675, https://doi.org/10.4319/lo.1990.35.8.1657, 1990.
Gunnarsson, K.: Populations de laminaria hyperborea et laminaria digitata (phéophycées) dans la baie de Breiðifjörður, Islande, Hafrannsoknastofnunin, Rit Fiskideildar, J. Mar. Res. Inst. Reykjavik, 12, 1–148, 1991.
Hartmann, D. L.: Chapter 2 – The Global Energy Balance, in: Global Physical Climatology (Second Edition), edited by: Hartmann, D. L., Elsevier, Boston, 25–48, https://doi.org/10.1016/B978-0-12-328531-7.00002-5, 2016.
Hermansen, Ø. and Troell, M.: Aquaculture in the Arctic – a review, Nofima rapportserie, Report no. 36, Nofima, Tromsø, ISBN 978-82-8296-029-8, , 2012.
Jakobsson, M., Mayer, L. A., Bringensparr, C., Castro, C. F., Mohammad, R., Johnson, P., Ketter, T., Accettella, D., Amblas, D., An, L., Arndt, J. E., Canals, M., Casamor, J. L., Chauché, N., Coakley, B., Danielson, S., Demarte, M., Dickson, M.-L., Dorschel, B., Dowdeswell, J. A., Dreutter, S., Fremand, A. C., Gallant, D., Hall, J. K., Hehemann, L., Hodnesdal, H., Hong, J., Ivaldi, R., Kane, E., Klaucke, I., Krawczyk, D. W., Kristoffersen, Y., Kuipers, B. R., Millan, R., Masetti, G., Morlighem, M., Noormets, R., Prescott, M. M., Rebesco, M., Rignot, E., Semiletov, I., Tate, A. J., Travaglini, P., Velicogna, I., Weatherall, P., Weinrebe, W., Willis, J. K., Wood, M., Zarayskaya, Y., Zhang, T., Zimmermann, M., and Zinglersen, K. B.: The International Bathymetric Chart of the Arctic Ocean Version 4.0, Sci. Data, 7, 176, https://doi.org/10.1038/s41597-020-0520-9, 2020.
Kędra, M., Włodarska-Kowalczuk, M., and Węsławski, J. M.: Decadal change in macrobenthic soft-bottom community structure in a high Arctic fjord (Kongsfjorden, Svalbard), Polar Biol., 33, 1–11, https://doi.org/10.1007/s00300-009-0679-1, 2010.
Konik, M., Darecki, M., Pavlov, A. K., Sagan, S., and Kowalczuk, P.: Darkening of the Svalbard Fjords Waters Observed With Satellite Ocean Color Imagery in 1997–2019, Front. Mar. Sci., 8, https://doi.org/10.3389/fmars.2021.699318, 2021.
Kortsch, S., Primicerio, R., Beuchel, F., Renaud, P. E., Rodrigues, J., Lønne, O. J., and Gulliksen, B.: Climate-driven regime shifts in Arctic marine benthos, P. Natl. Acad. Sci. USA, 109, 14052–14057, https://doi.org/10.1073/pnas.1207509109, 2012.
Krause-Jensen, D., Sejr, M. K., Bruhn, A., Rasmussen, M. B., Christensen, P. B., Hansen, J. L. S., Duarte, C. M., Bruntse, G., and Wegeberg, S.: Deep Penetration of Kelps Offshore Along the West Coast of Greenland, Front. Mar. Sci., 6, https://doi.org/10.3389/fmars.2019.00375, 2019.
Krause-Jensen, D., Archambault, P., Assis, J., Bartsch, I., Bischof, K., Filbee-Dexter, K., Dunton, K. H., Maximova, O., Ragnarsdóttir, S. B., Sejr, M. K., Simakova, U., Spiridonov, V., Wegeberg, S., Winding, M. H. S., and Duarte, C. M.: Imprint of Climate Change on Pan-Arctic Marine Vegetation, Front. Mar. Sci., 7, 617324, https://doi.org/10.3389/fmars.2020.617324, 2020.
Laliberté, J., Bélanger, S., and Frouin, R.: Evaluation of satellite-based algorithms to estimate photosynthetically available radiation (PAR) reaching the ocean surface at high northern latitudes, Remote Sens. Environ., 184, 199–211, https://doi.org/10.1016/j.rse.2016.06.014, 2016.
Laliberté, J., Bélanger, S., and Babin, M.: Seasonal and interannual variations in the propagation of photosynthetically available radiation through the Arctic atmosphere, Elem. Sci. Anthr., 9, 00083, https://doi.org/10.1525/elementa.2020.00083, 2021.
Lebrun, A., Comeau, S., Gazeau, F., and Gattuso, J.-P.: Impact of climate change on Arctic macroalgal communities, Glob. Planet. Change, 219, 103980, https://doi.org/10.1016/j.gloplacha.2022.103980, 2022.
Lee, Z., Carder, K. L., and Arnone, R. A.: Deriving inherent optical properties from water color: a multiband quasi-analytical algorithm for optically deep waters, Appl. Optics, 41, 5755–5772, https://doi.org/10.1364/AO.41.005755, 2002.
Lee, Z., Hu, C., Shang, S., Du, K., Lewis, M., Arnone, R., and Brewin, R.: Penetration of UV-visible solar radiation in the global oceans: Insights from ocean color remote sensing, J. Geophys. Res.-Oceans, 118, 4241–4255, https://doi.org/10.1002/jgrc.20308, 2013.
Lee, Z.-P., Darecki, M., Carder, K. L., Davis, C. O., Stramski, D., and Rhea, W. J.: Diffuse attenuation coefficient of downwelling irradiance: An evaluation of remote sensing methods, J. Geophys. Res.-Oceans, 110, C02017, https://doi.org/10.1029/2004JC002573, 2005.
Maslanik, J. and Stroeve, J.: Near-Real-Time DMSP SSMIS Daily Polar Gridded Sea Ice Concentrations, Version 1, Boulder, Colorado USA, NASA National Snow and Ice Data Center Distributed Active Archive Center [data set], https://doi.org/10.5067/U8C09DWVX9LM, 1999.
Meier, W. N., Stewart, J. S., Wilcox, H., Hardman, M. A., and Scott, D. J.: Near-Real-Time DMSP SSMIS Daily Polar Gridded Sea Ice Concentrations, Version 2, Boulder, Colorado USA, NASA National Snow and Ice Data Center Distributed Active Archive Center [data set], https://doi.org/10.5067/YTTHO2FJQ97K, 2021.
Morel, A.: Available, usable, and stored radiant energy in relation to marine photosynthesis, Deep-Sea Res., 25, 673–688, https://doi.org/10.1016/0146-6291(78)90623-9, 1978.
Morlighem, M., Williams, C. N., Rignot, E., An, L., Arndt, J. E., Bamber, J. L., Catania, G., Chauché, N., Dowdeswell, J. A., Dorschel, B., Fenty, I., Hogan, K., Howat, I., Hubbard, A., Jakobsson, M., Jordan, T. M., Kjeldsen, K. K., Millan, R., Mayer, L., Mouginot, J., Noël, B. P. Y., O'Cofaigh, C., Palmer, S., Rysgaard, S., Seroussi, H., Siegert, M. J., Slabon, P., Straneo, F., van den Broeke, M. R., Weinrebe, W., Wood, M., and Zinglersen, K. B.: BedMachine v3: Complete Bed Topography and Ocean Bathymetry Mapping of Greenland From Multibeam Echo Sounding Combined With Mass Conservation, Geophys. Res. Lett., 44, 11051–11061, https://doi.org/10.1002/2017GL074954, 2017.
Niedzwiedz, S. and Bischof, K.: Glacial retreat and rising temperatures are limiting the expansion of temperate kelp species in the future Arctic, Limnol. Oceanogr., 68, 816–830, https://doi.org/10.1002/lno.12312, 2023.
Nowak, A., Hodgkins, R., Nikulina, A., Osuch, Wawrzyniak, T., Kavan, J., Łepkowska, E., Majerska, M., Romashova, K., Vasilevich, I., Sobota, I., and Rachlewicz, G.: From land to fjords: The review of Svalbard hydrology from 1970 to 2019 (SvalHydro), Loughborough University, Leicestershire, UK, 2021.
PAME: Central Arctic Ocean LME, PAME, Iceland, PAME International Secretariat, Borgir, Iceland, https://www.pame.is/images/03_Projects/EA/LMEs/Factsheets/13_Central_Arctic_Ocean_LME_.pdf (last access: 13 June 2024), 2016.
Pavlov, A. K., Leu, E., Hanelt, D., Bartsch, I., Karsten, U., Hudson, S. R., Gallet, J.-C., Cottier, F., Cohen, J. H., Berge, J., Johnsen, G., Maturilli, M., Kowalczuk, P., Sagan, S., Meler, J., and Granskog, M. A.: The Underwater Light Climate in Kongsfjorden and Its Ecological Implications, in: The Ecosystem of Kongsfjorden, Svalbard, edited by: Hop, H. and Wiencke, C., Springer International Publishing, Cham, 137–170, https://doi.org/10.1007/978-3-319-46425-1_5, 2019.
Rysgaard, S., Vang, T., Stjernholm, M., Rasmussen, B., Windelin, A., and Kiilsholm, S.: Physical Conditions, Carbon Transport, and Climate Change Impacts in a Northeast Greenland Fjord, Arct. Antarct. Alp. Res., 35, 301–312, https://doi.org/10.1657/1523-0430(2003)035[0301:PCCTAC]2.0.CO;2, 2003.
Saulquin, B., Hamdi, A., Gohin, F., Populus, J., Mangin, A., and d'Andon, O. F.: Estimation of the diffuse attenuation coefficient KdPAR using MERIS and application to seabed habitat mapping, Remote Sens. Environ., 128, 224–233, https://doi.org/10.1016/j.rse.2012.10.002, 2013.
Schlegel, R.: Code used for an analysis of the FjordLight dataset (v1.0), Zenodo [code], https://doi.org/10.5281/zenodo.11633656, 2024.
Sejr, M. K., Bruhn, A., Dalsgaard, T., Juul-Pedersen, T., Stedmon, C. A., Blicher, M., Meire, L., Mankoff, K. D., and Thyrring, J.: Glacial meltwater determines the balance between autotrophic and heterotrophic processes in a Greenland fjord, P. Natl. Acad. Sci. USA, 119, e2207024119, https://doi.org/10.1073/pnas.2207024119, 2022.
Singh, R. K., Shanmugam, P., He, X., and Schroeder, T.: UV-NIR approach with non-zero water-leaving radiance approximation for atmospheric correction of satellite imagery in inland and coastal zones, Opt. Express, 27, A1118–A1145, https://doi.org/10.1364/OE.27.0A1118, 2019.
Singh, R. K., Vader, A., Mundy, C. J., Søreide, J. E., Iken, K., Dunton, K. H., Castro de la Guardia, L., Sejr, M. K., and Bélanger, S.: Satellite-Derived Photosynthetically Available Radiation at the Coastal Arctic Seafloor, Remote Sens., 14, 5180, https://doi.org/10.3390/rs14205180, 2022.
Smith, R. W., Bianchi, T. S., Allison, M., Savage, C., and Galy, V.: High rates of organic carbon burial in fjord sediments globally, Nat. Geosci., 8, 450–453, https://doi.org/10.1038/ngeo2421, 2015.
Spotowitz, L., Johansen, T., Hansen, A., Berg, E., Stransky, C., and Fischer, P.: New evidence for the establishment of coastal cod Gadus morhua in Svalbard fjords, Mar. Ecol. Prog. Ser., 696, 119–133, https://doi.org/10.3354/meps14126, 2022.
Staehr, P. A. and Borum, J.: Seasonal acclimation in metabolism reduces light requirements of eelgrass (Zostera marina), J. Exp. Mar. Biol. Ecol., 407, 139–146, https://doi.org/10.1016/j.jembe.2011.05.031, 2011.
TOMS Science Team: TOMS Earth-Probe Total Ozone (O3) Aerosol Index UV-Reflectivity UV-B Erythemal Irradiance Daily L3 Global 1 deg × 1.25 deg V008, Goddard Earth Sci. Data Inf. Serv. Cent. GES DISC Greenbelt MD USA [data set], https://disc.gsfc.nasa.gov/datasets/TOMSEPL3_008/summary (last access: 13 June 2024), 1998.
Walch, D. M. R., Singh, R. K., Søreide, J. E., Lantuit, H., and Poste, A.: Spatio-Temporal Variability of Suspended Particulate Matter in a High-Arctic Estuary (Adventfjorden, Svalbard) Using Sentinel-2 Time-Series, Remote Sens., 14, 3123, https://doi.org/10.3390/rs14133123, 2022.
Wernberg, T., Krumhansl, K., Filbee-Dexter, K., and Pedersen, M. F.: Status and Trends for the World's Kelp Forests, in: World Seas: An Environmental Evaluation (Second Edition), edited by: Sheppard, C., Academic Press, 57–78, https://doi.org/10.1016/B978-0-12-805052-1.00003-6 , 2019.
Wiktor, J. M., Tatarek, A., Kruss, A., Singh, R. K., Wiktor, J. M., and Søreide, J. E.: Comparison of macroalgae meadows in warm Atlantic versus cold Arctic regimes in the high-Arctic Svalbard, Front. Mar. Sci., 9, https://doi.org/10.3389/fmars.2022.1021675, 2022.