the Creative Commons Attribution 4.0 License.
the Creative Commons Attribution 4.0 License.
 | 02 Mar 2021
Hyperspectral-reflectance dataset of dry, wet and submerged marine litter
Sindy Sterckx
Gert Strackx
Johan Mijnendonckx
Mehrdad Moshtaghi
Shungudzemwoyo P. Garaba
Dieter Meire
This paper describes a dataset consisting of 47 hyperspectral-reflectance measurements of plastic litter samples. The plastic litter samples include virgin and real samples from the Port of Antwerp. They were measured in dry conditions in the Flemish Institute for Technological Research (VITO) calibration facility, and a selection of the samples were also measured in wet conditions and submerged in a water tank at Flanders Hydraulics. The construction on top of the tank allowed us to submerge the plastics and keep sediments in suspension. The spectral measurements were performed using an Analytical Spectral Devices (ASD) FieldSpec 4 and a Spectral Evolution (SEV) spectrometer. The datasets are available on the 4TU.ResearchData open-access repository (ASD dataset: https://doi.org/10.4121/12896312.v2, Knaeps et al., 2020; SEV dataset: https://doi.org/10.4121/uuid:9ee3be54-9132-415a-aaf2-c7fbf32d2199; Garaba et al., 2020).
Please read the corrigendum first before continuing.
-
Notice on corrigendum
The requested paper has a corresponding corrigendum published. Please read the corrigendum first before downloading the article.
-
Article
(12479 KB)
-
The requested paper has a corresponding corrigendum published. Please read the corrigendum first before downloading the article.
- Article
(12479 KB) - Full-text XML
- Corrigendum
- BibTeX
- EndNote


Spectral-reflectance measurements of plastic specimens have been collected in the framework of the Hyperspectral Remote Sensing Of Marine Plastics (HYPER) project. The data were used to provide guidance on the selection of appropriate wavelengths for marine-plastic identification. Spectral reflectance of dry plastic polymers is known, and this knowledge is used in the industry for sorting plastics from other litter and to discriminate between different polymers (Huth-Fehre et al., 1995; Masoumi et al., 2012). Knowledge of spectral reflectance of marine litter, which is wet or submerged, is however limited. To this end, there has been a rising interest in establishing spectral-reference libraries of plastic litter in different conditions, states, types, pixel coverage and observation geometries (Garaba et al., 2021).
More recently, an open-access dataset of the spectral reflectance of marine-harvested and virgin plastics which were measured in dry and wet conditions was reported and discussed (Garaba and Dierssen, 2020). The HYPER dataset is an extension to the existing datasets because it includes spectral measurements of additional plastic specimens and involves simulated scenarios of submerged samples with varied water clarity. The dataset has the potential to help to develop appropriate algorithms for marine-plastic detection and identification and to select appropriate sensors relevant for marine plastics.
In total, 47 plastic specimens were measured with the Analytical Spectral Devices (ASD) FieldSpec 4 spectrometer. Six of them were also submerged in a controlled way in a water tank. The plastic specimens consist of virgin plastics and real samples from the Port of Antwerp. The dataset has been made publicly available (Knaeps et al., 2020: https://doi.org/10.4121/12896312.v2). For comparison, a few plastic specimens have also been measured with a Spectral Evolution (SEV) SR-3501 hyperspectral radiometer with its own preprocessing applied. The SEV dataset is also publicly available (Garaba et al., 2020: https://doi.org/10.4121/uuid:9ee3be54-9132-415a-aaf2-c7fbf32d2199).
Figure 1(a) Original set-up of the tank; (b) schematic of the aluminium frame; (c) experimental set-up of the tank inside, covered with black cloth; and (d) foreoptic ends of the ASD and SEV spectroradiometers.
Measurements of the spectral reflectance were performed at two locations. The first was an optical calibration laboratory at Flemish Institute for Technological Research (VITO), Belgium. The spectral observations of dry plastics were conducted in the dark laboratory room equipped with two halogen tungsten lamps. Further experiments were done using a water tank at the Flanders Hydraulics facility in Antwerp, Belgium (Fig. 1). The water tank (diameter = 2 m, depth = 3 m) was customized to simulate and assess the optical properties of submerged plastics at fixed water depths and changing water clarity. The tank was equipped with a propeller that allowed the mixing of the water to create near-homogenous distribution of sediments. A set of two halogen tungsten lamps (12 V 50 W GY9.5, Original Gilway L9389) were used to provide artificial lighting simulating sunlight.
A tailor-made aluminium frame was attached to the water tank for the attachment of the spectroradiometer detector, lights and samples (Fig. 1b). The frame was also painted black so that it would not contribute to the bulk spectral signal expected from only the plastic targets. An adjustable arm was integrated on the frame with a holder for the targets and predetermined depth markings (Fig. 1c). A black cloth was used to create a dark surrounding over the water tank to mitigate unwanted stray light from the laboratory surfaces. Furthermore, the side walls of the tank were covered with a black plastic to mitigate background reflections; no background correction was applied to the measurements as it was determined to be negligible. The foreoptic end of the ASD and SEV radiometers was attached to the aluminium frame on top of the tank to make sure they viewed the same target at the same distance (Fig. 1d).
Data collection consisted of spectral-reflectance measurements of different plastic specimens, both virgin plastics and plastic waste from the Port of Antwerp. Spectral measurements were performed by two different teams using different instruments (ASD FieldSpec 4 and SEV SR-3501 hyperspectral radiometers). In the tank, sediments were added, and the total suspended matter (TSM) concentration was analysed after each set of measurements.
Table 1Hyperspectral-radiometer specifications and settings during the study. VNIR: visible–near infrared; SWIR: shortwave infrared.
3.1 Spectral measurements
Spectral reflectance of the plastic targets was measured with an ASD FieldSpec 4 and a SEV SR-3501 hyperspectral spectroradiometer from the ultraviolet (UV) to shortwave infrared (SWIR). The ASD spectrometer has a spectral resolution of approximately 3 nm at around 700 nm. The spectral resolution in the SWIR varies between 10 and 12 nm. The SEV spectroradiometer has a spectral resolution between 4 and 10 nm. For both instruments, we derived a relative hemispherical directional reflectance (R) of the sample, which was normalized to a 99 % Labsphere Spectralon® Lambertian panel. In the tank, the Spectralon panel was placed at the same position where the plastic specimen was placed, i.e. on the holder of the adjustable arm. For brevity, additional specifications are summarized below (Table 1).
Processing of the ASD data included calculation of the mean and standard deviation (SD) from the replicate measurements. No additional smoothing was applied to the data. The SEV measurements were smoothed using a third-order polynomial Savitzky–Golay least-square algorithm at a frame length of 31. No splice correction was applied to the data to compensate for typical steps in spectra due to the transition between the three detectors. We computed the unbiased percentage difference (UPD) as a measure of uncertainty between the two spectroradiometers:
where R is the reflectance at wavelength (λ) the ASD and SEV, respectively.
3.2 TSM measurements
Water clarity was changed by adding fine clay collected from Deurganckdok, a tidal dock in the Port of Antwerp, connected to the Scheldt River (B). The clay had a median particle size D50 of 11.0 ± 0.3 µm and ranged between a D10 of 2 µm and a D90 of 51 µm. Initial water clarity was high, meaning no suspended material; a small amount of clay was then added to achieve medium and finally low visibility with a high concentration of TSM. The sediment concentration was measured by taking water samples of 1 L at the water surface and filtering the samples.
3.3 Plastic specimens
Several criteria were used to select the plastic items. First of all, the plastics should be representative of the plastics that are commonly found in rivers and coastal areas. Secondly, plastics with different colours should be included to understand the effect on the spectral reflectance. Finally, several plastics should be selected which are uniform and can be submerged in a controlled way in the tank.
Table 2Overview of measurements.
n/a: not applicable
The above criteria resulted in a set of real and weathered and virgin plastics. Weathered marine litter was gathered from the Port of Antwerp consisting of plastic bottles, plastic bags, rope, drinking containers and wood (Fig. 2). Virgin plastics (off the shelf) consisted of ropes, bags, place mats, bottles, cups and foam. We gathered blue, yellow, pink and orange place mats as well as orange, blue and white ropes. The ropes were prepared for the reflectance measurements in three ways: compact on a roll as bought in the store, unrolled and nicely aligned along a frame (Table 2).
The following naming convention (name_state_depth_TSM) was utilized to identify the type or name of plastic specimen; state of sample as d (dry), w (wet) or s (submerged); the depth below water surface [cm]; and TSM concentration [mg L−1]. For example, OrangePlacemat_s_4_200 refers to measurements of an orange place mat submerged at 4 cm depth and a TSM of 200 mg L−1. There are four different polymer types within the dataset: polyethylene terephthalate (PET), Low-density polyethylene (LD-PE), Polyester(PEST) and polypropylene (PP). A total of 47 materials were investigated, and the descriptors as well as metadata are summarized below (Table 2).
3.4 Tank scenarios
The tank experiment involved carefully submerging a selection of plastic samples to fixed depths. The selected samples include the new place mats (orange, blue, pink, yellow) and PP ropes (orange, blue, white) bound to a plexiglass frame, making a uniform flat target. First tests were performed with clear water before adding the clay sediments. The plastics were measured first in dry conditions in the tank just above the water surface followed by submerging to fixed depths of 2.5 (as just below water surface), 5, 9, 12, 16 and (the deepest) 32 cm. Finally, the plastics were measured again just above the water surface as wetted plastics. These steps were repeated after adding sediments for the two scenarios of moderate and high TSM concentrations.
4.1 TSM results
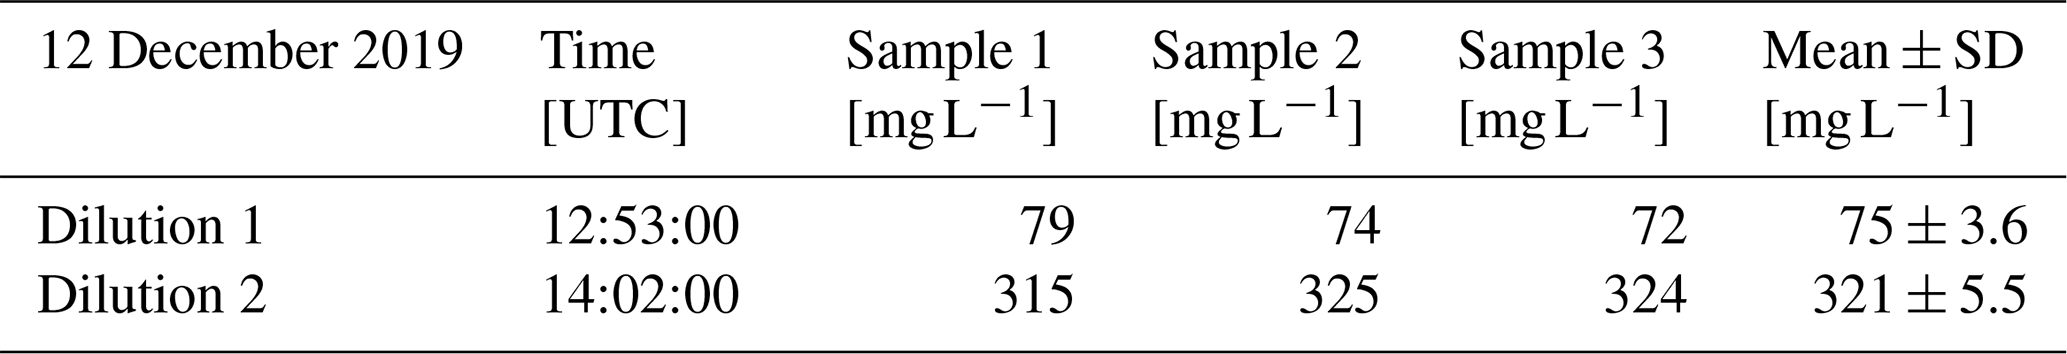
Laboratory analyses of the water samples taken from the tank after dilution 1 showed a TSM concentration of 75 mg L−1 and a TSM concentration of 321 mg L−1 after dilution 2 (Table 2).

4.2 Reflectance results
4.2.1 Tank water
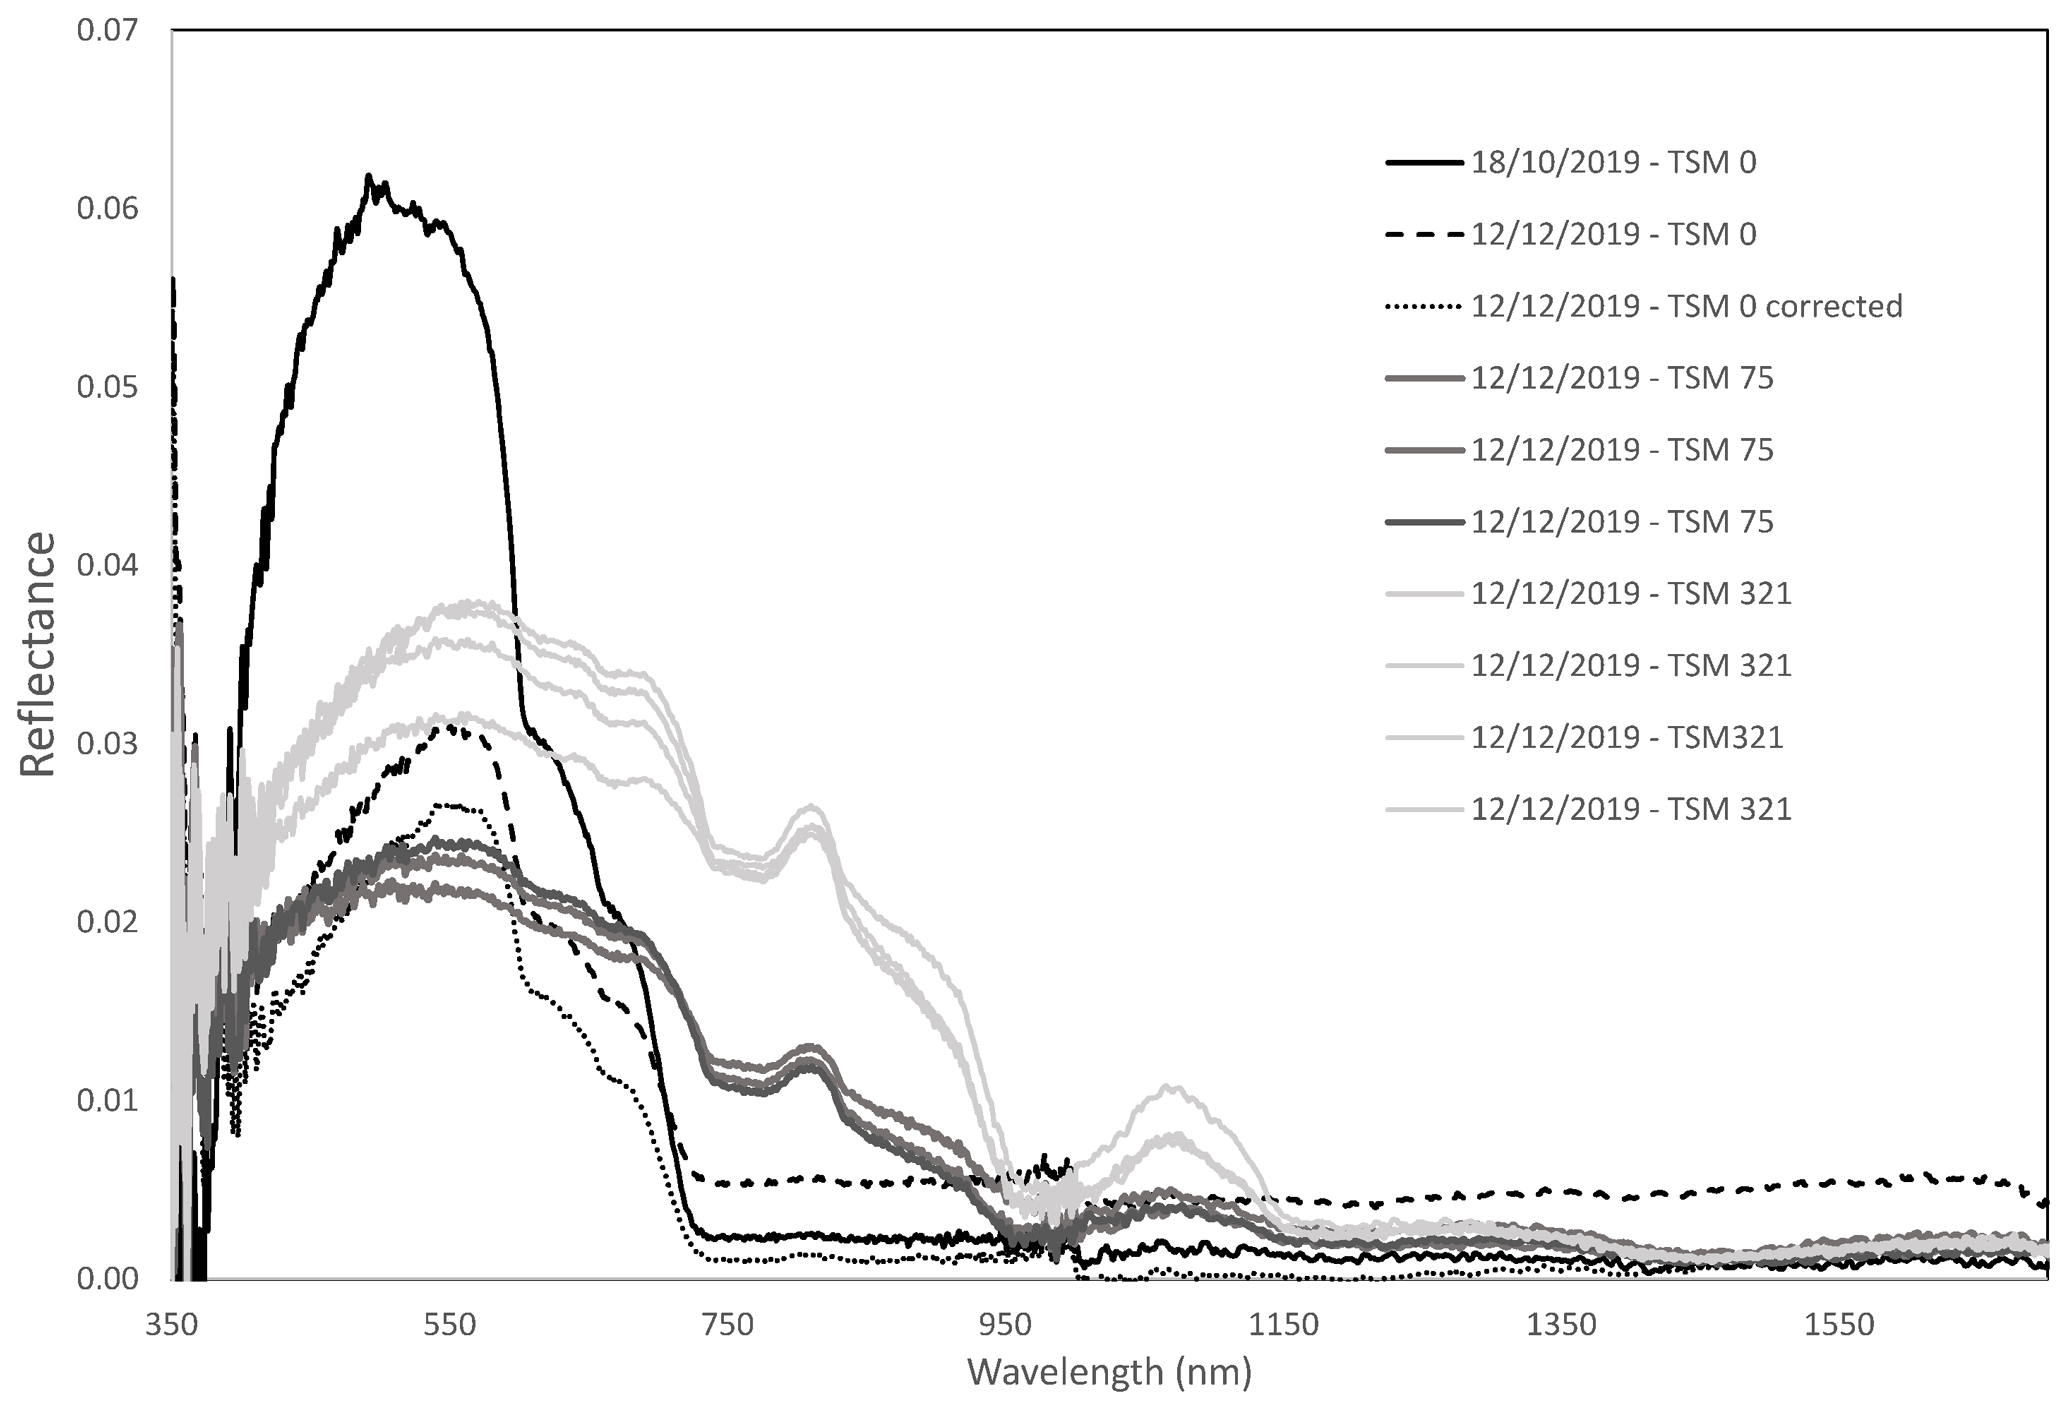
The water in the tank was measured with the ASD spectrometer without any plastics in the water. “Clear” tank water was measured on two dates: 18 October 2019 and 12 December 2019. Both water spectra are shown in Fig. 4 by a black and dashed black line. In the visible region, the tank water measured on 18 October has a higher reflectance than the tank water measured on 12 December. In the near-infrared (NIR) and SWIR, the water from 12 December has a clear reflectance signal, which is not expected because of strong pure water absorption. The reason for the difference in reflectance between both dates can be some remaining sediments in the water and some dust floating on the surface on 12 December, meaning that the water was not completely clear. On 18 October the water was clearer, and the white bottom of the tank was visible, which can contribute to the reflectance signal. On 12 December the white bottom was less visible, and the dust on the surface might cause the non-zero reflectance in the NIR and SWIR. It is possible to account for this remaining reflectance in the NIR and SWIR by subtracting the reflectance at 1200 nm as is also done to account for residual sky glint reflection in outdoor water reflectance measurements (Knaeps et al., 2015). The result is shown in Fig. 4 by the dotted black line. The reflectance of the turbid tank water with TSM concentrations corresponding to 75 and 321 mg L−1 is also shown in (Fig. 3). Increase in TSM concentration results in an overall increase in the spectral reflectance. The NIR is no longer zero, and a local maximum reflectance is observed around 1070 nm in the SWIR.
4.2.2 Place mats
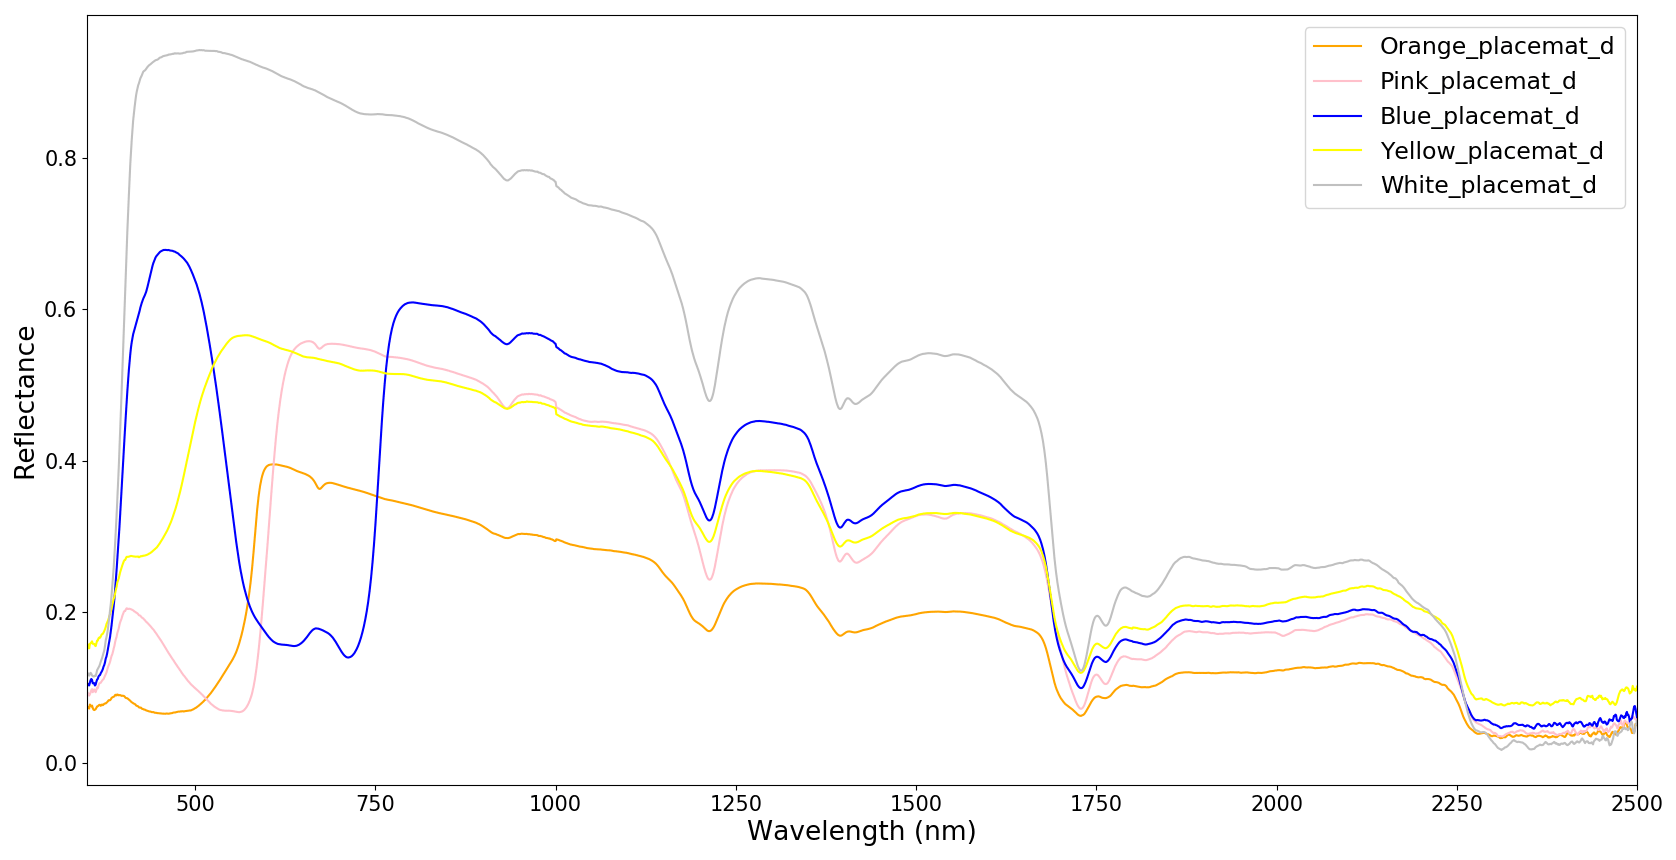
The reflectance in dry conditions from the VIS to the SWIR can be seen in (Fig. 4). In the visible–near-infrared (VNIR) spectral range, all place mats look very different, and the inherent spectral-reflectance shape in the visible spectrum was consistent with the apparent colour of the samples. Overall, the white place mat had the highest reflectance, and in the SWIR, the spectral shapes of the specimens were identical. Furthermore, the absorption features in the SWIR spectrum were located at the same wavebands, suggesting these place mats shared similar polymeric composition. The strongest absorption features were observed around 1216, 1397 and 1730 nm. Absolute reflectance differs considerably, in particular between 1000 and 1700 nm.
The mean and SD, as shown in Fig. 5, were calculated based on five replicate measurements. The dry measurements were collected in the VITO calibration facility, and the replicate measurements were obtained by slightly changing the position of the plastic target. Hence, very homogeneous targets will have a smaller SD. The mean and SD for the blue and orange place mats were very small: 0.00056 and 0.00283 for the blue place mat at 400 and 900 nm, respectively, and 0.00484 and 0.00690 for the orange place mat at 400 and 900 nm, respectively (Fig. 5). The small SD was also used as a prerequisite for submersion in the tank because measurements at the different depths should not be influenced by differences in the spectral reflectance of the plastic specimen itself (due to e.g. inhomogeneities of the surface).
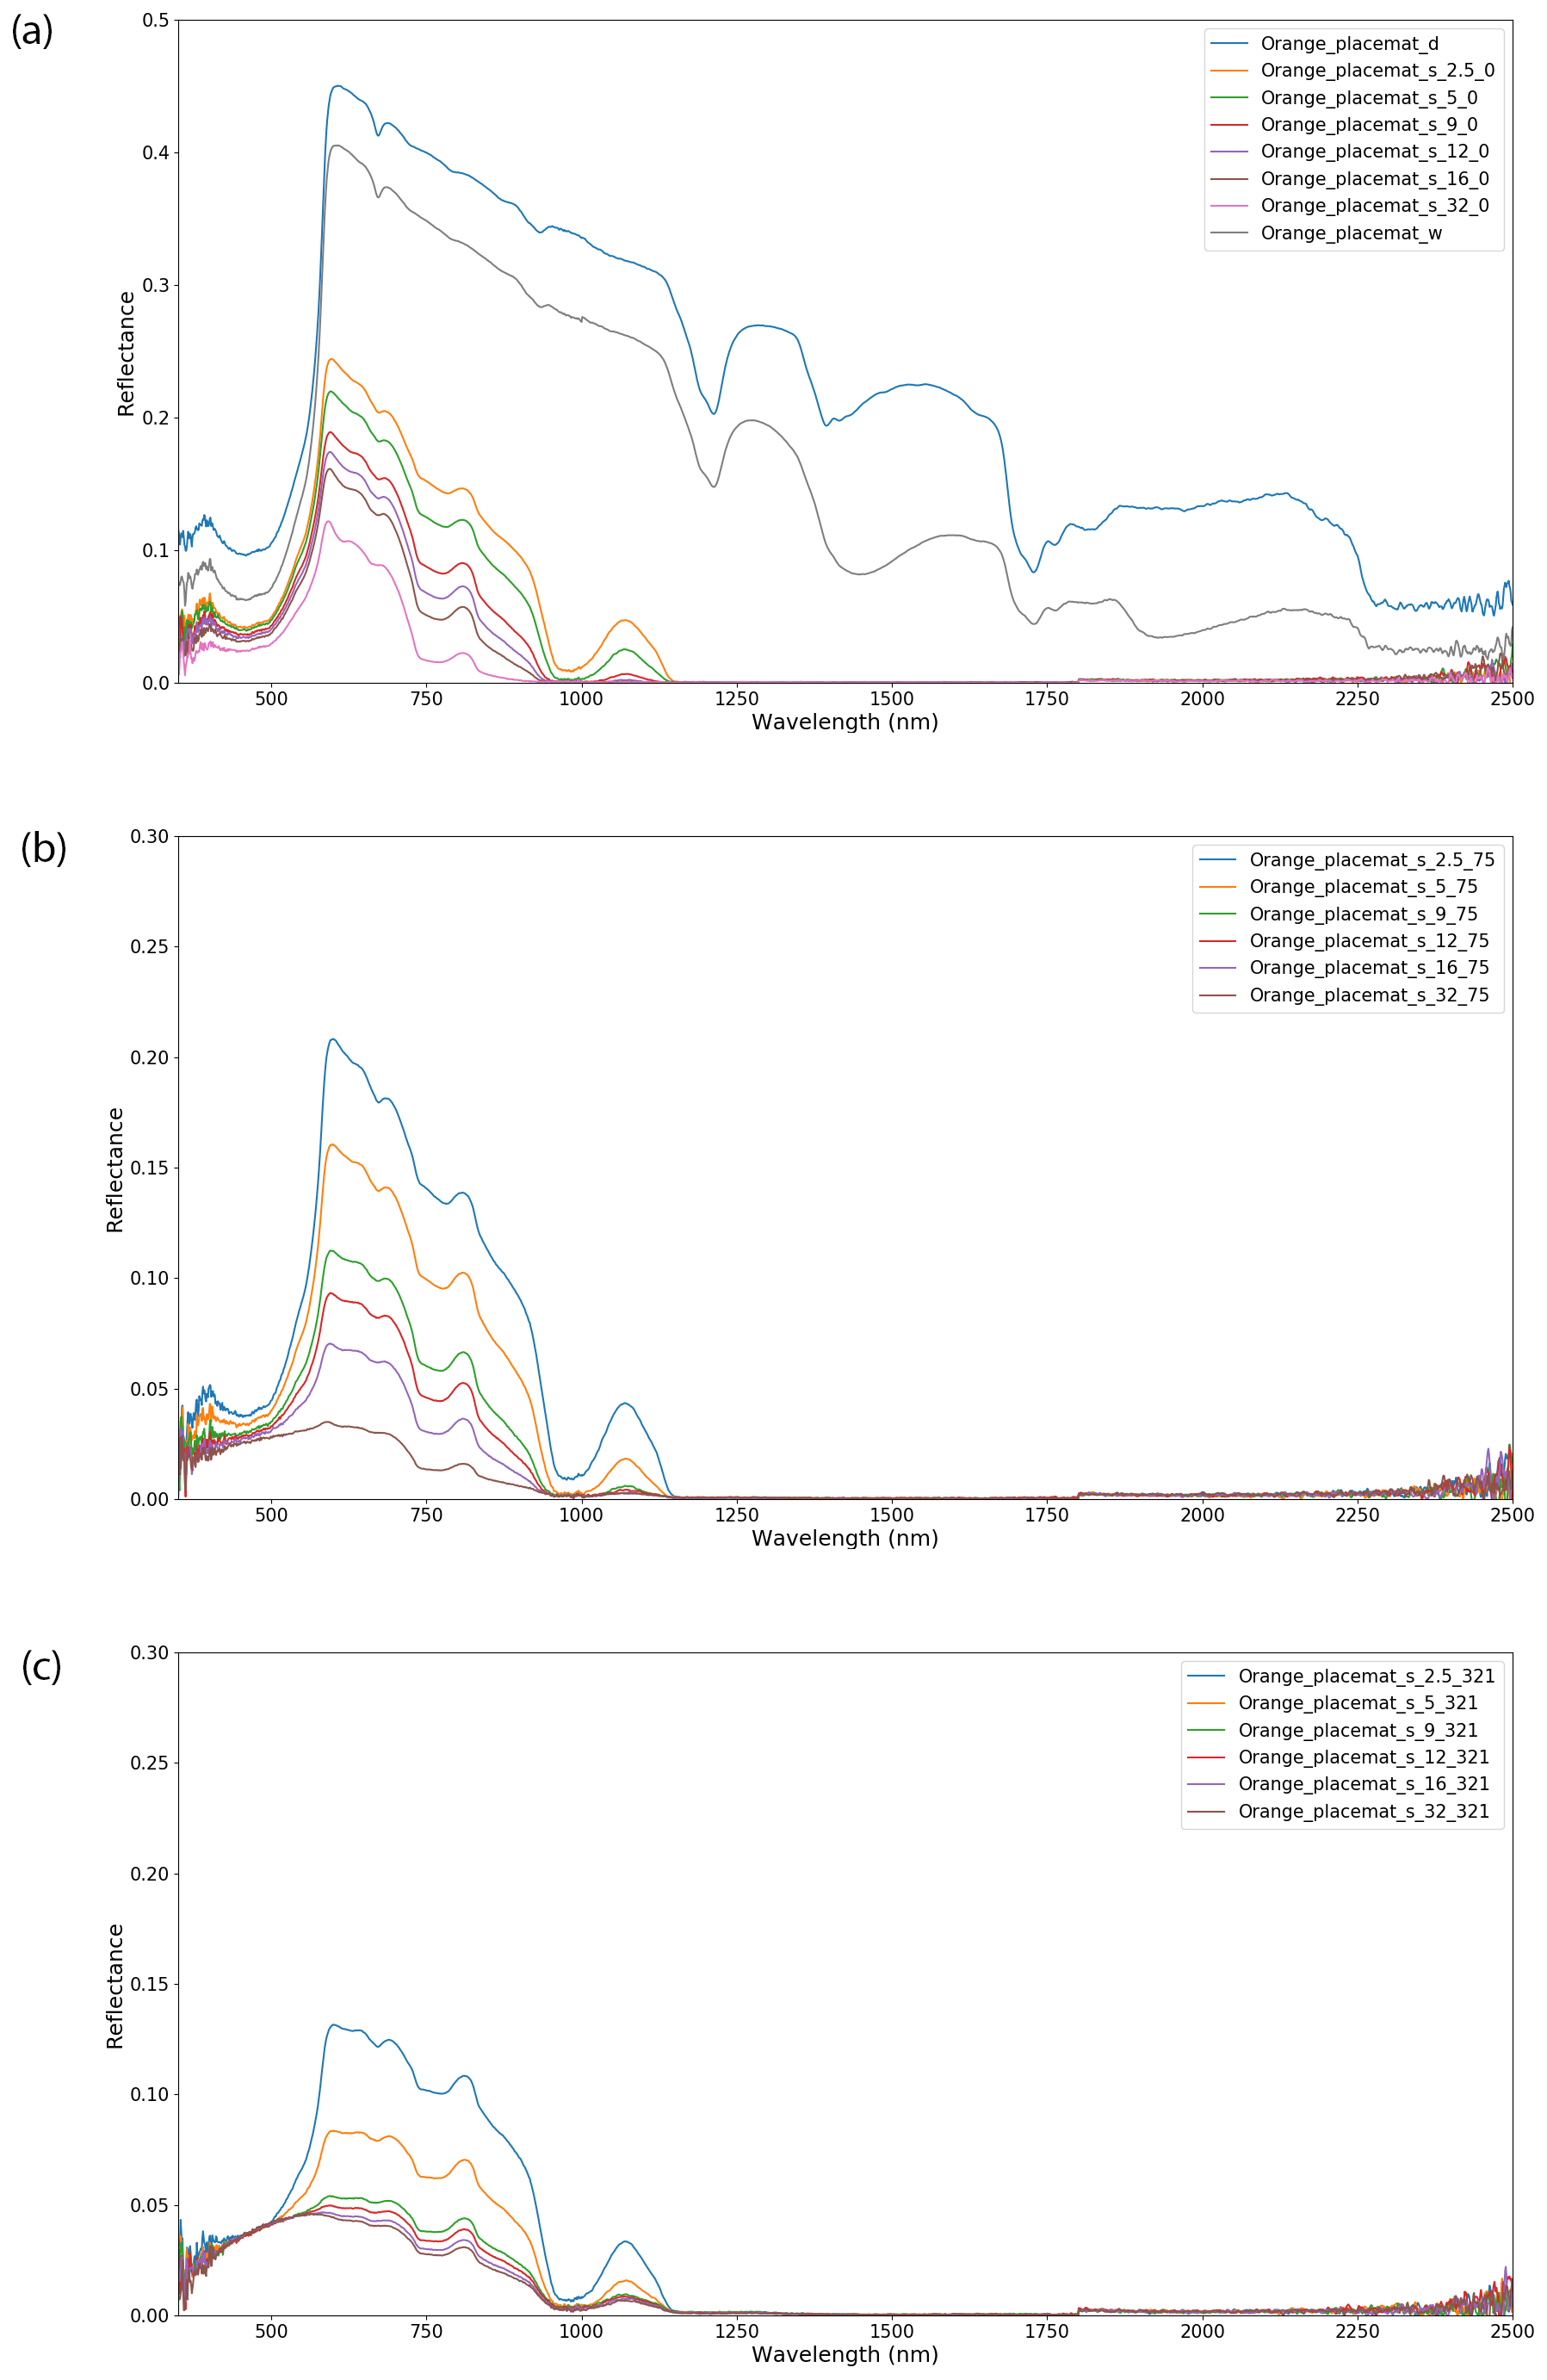
Figure 6Spectral reflectance of the orange place mat submerged in (a) clear water, (b) water with a TSM concentration of 75 mg L−1 and (c) water with a TSM concentration of 321 mg L−1.
Table 4Wavelength corresponding to a reflectance threshold of 0.001 for the orange place mat.
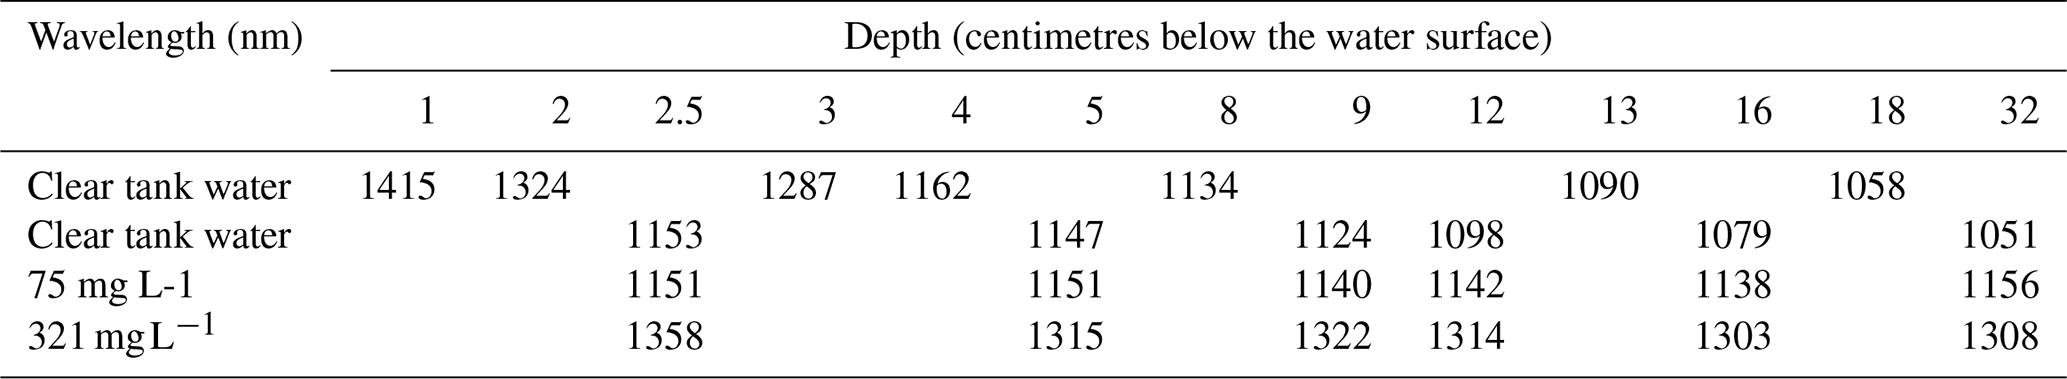

Figure 7Spectral reflectance of dry ropes; (a) white, orange and blue rope; and (b) all ropes in different conditions: on a roll as bought in the store, unrolled and aligned on a plexiglass frame.
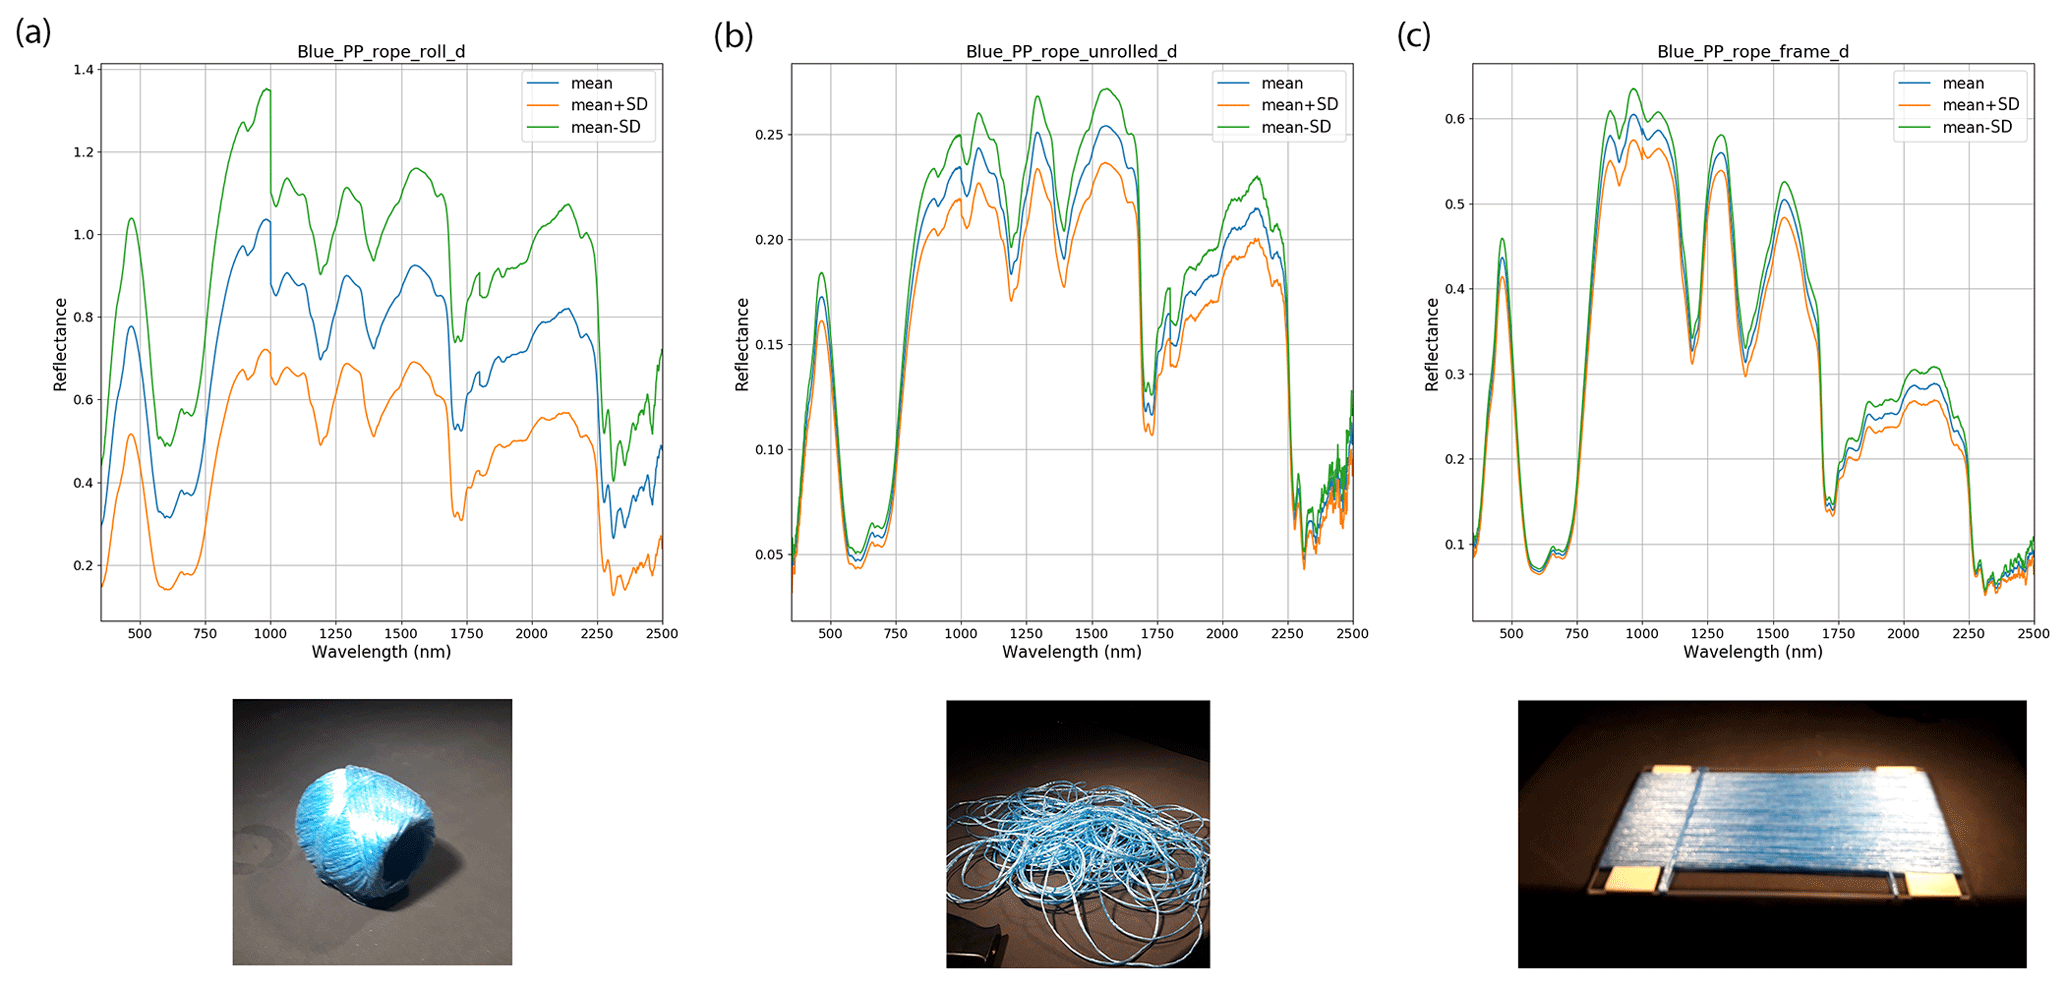
Figure 8Mean and SD for the blue rope in three conditions: on a roll as bought in the store, unrolled and aligned on a plexiglass frame.
The spectral measurements of the orange place mat when submerged in the water tank, in clear conditions and with different dilutions of sediment, are shown in Fig. 6. In addition, the first figure includes a dry measurement in blue and a wet measurement in grey. The figures show the decrease in reflectance when the plastic is wet and submerged and the changes to the shape of the spectrum, particularly in the NIR. Between 900 and 1000 nm, the absorption of water strongly increases, causing a rapid decrease in reflectance detected from the submerged targets in both deep (32 cm) and shallow (2.5 cm) water. Compared to the neighbouring wavebands between 1000 and 1140 nm, absorption by water is lower, resulting in reflectance peaks of the plastic targets over this spectrum range. Table 4 shows, for all the depths and for different turbidity, the wavelength at which the reflectance reaches a threshold of 0.001. Beyond this wavelength, reflectance will always be lower than 0.001, and the plastic target cannot be detected. For instance, when the orange place mat is submerged in clear tank water at a depth of 8 cm, there will be no measurable reflectance beyond 1134 nm. These values are specific for the orange place mat and will be different for other plastic specimens. The reader can easily produce similar values based on the published dataset. The reflectance threshold was subjectively chosen, and the reader is also free to use a different one. For the clear tank water, measurements from 18 October 2019 and 12 December 2019 are included. Although TSM concentrations are not exactly known, it has been shown (Fig. 4) that on 18 October 2019 the water in the tank was clearer, and there was remaining dust and/or sediment in the tank on 12 December 2019.
The values in Table 4 for the clearest tank water (18 October 2019) show that SWIR wavelengths between 1000 and 1415 nm provide information on the orange place mat when slightly submerged (1 up till 18 cm). These results should however be confirmed in an outdoor setting under different lightning conditions and in the presence of surface features. With sediment in suspension, the reflectance of the orange place mat will be slightly or fully masked by the reflectance of the sediments. As shown in the table, there is measurable reflectance in the SWIR, even with the orange place mat at 32 cm depth. Comparing these values with the values of the clear tank water shows that the reflectance at these longest wavelengths is coming from the sediments in the water.

Figure 9Spectral reflectance of the blue rope submerged in (a) clear water, (b) water with a TSM concentration of 75 mg L−1 and (c) water with a TSM concentration of 321 mg L−1.
4.2.3 Ropes
The white polyester rope (unrolled) was the most reflective item in this group, particularly in the visible. The blue and orange ropes had a lower reflectance in the visible, with spectral shapes in agreement with the apparent colour (Fig. 7). Three of the ropes are polypropylene polymers, which can also be observed from the spectral-absorption features in the SWIR. The white polyester rope has different features in the SWIR. Additional measurements were conducted on the off-the-shelf and rolled ropes, unrolled ropes and the rope aligned on the plexiglass. It was noted that the rolled rope had the highest reflectance (Fig. 7b). One of the rolled ropes even had a reflectance above 1, probably due to the exact position of the ASD fibres pointing towards a highly reflective glint area on the rope. The SD is smallest for the rope aligned along the frame (Fig. 8). The rope aligned on a plexiglass frame was also used for submersion in the tank. In some of the spectra, a small jump can be observed around 1000 nm and a second smaller one around 1750 nm. This is caused by the design of the ASD, consisting of three spectrometers and a fibre-optic cable, which is actually a bundle of 57 individual, randomly oriented fibres (Analytical Spectral Devices, 1999). VNIR and SWIR fibres are organized differently, which leads to different areas of the surface being observed with different parts of the spectrum, resulting in steps in spectra at the joints between each detector (Arthur et al., 2012). This effect is observed when targets are non-uniform. It was decided not to apply any correction to the spectra because the jumps can provide information on the uniformity of the target. However, readers can apply a splice correction themselves, which might be useful when readers apply further analysis to the data. The splice correction removes or compensates for the steps in the spectra. The VNIR and SWIR-2 data can be adjusted to match the SWIR-1 data. The difference at 1000 and 1001 nm can be used to correct the VNIR data, whilst the difference at 1800 and 1801 nm can be used to correct the SWIR-2 data.
4.2.4 Bags, cups and bottles
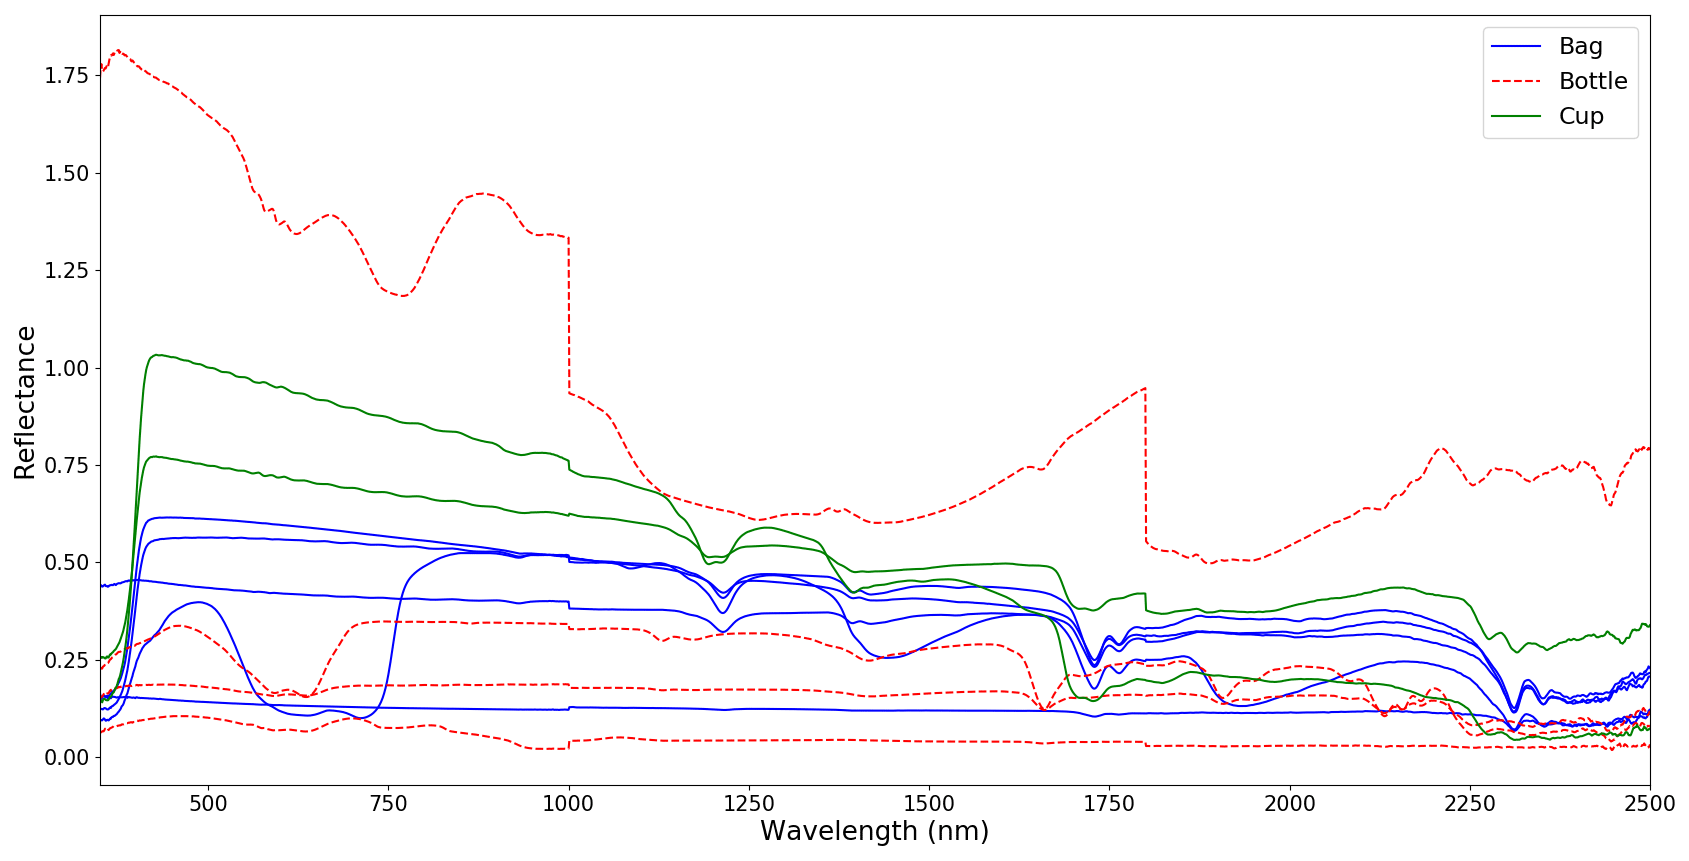
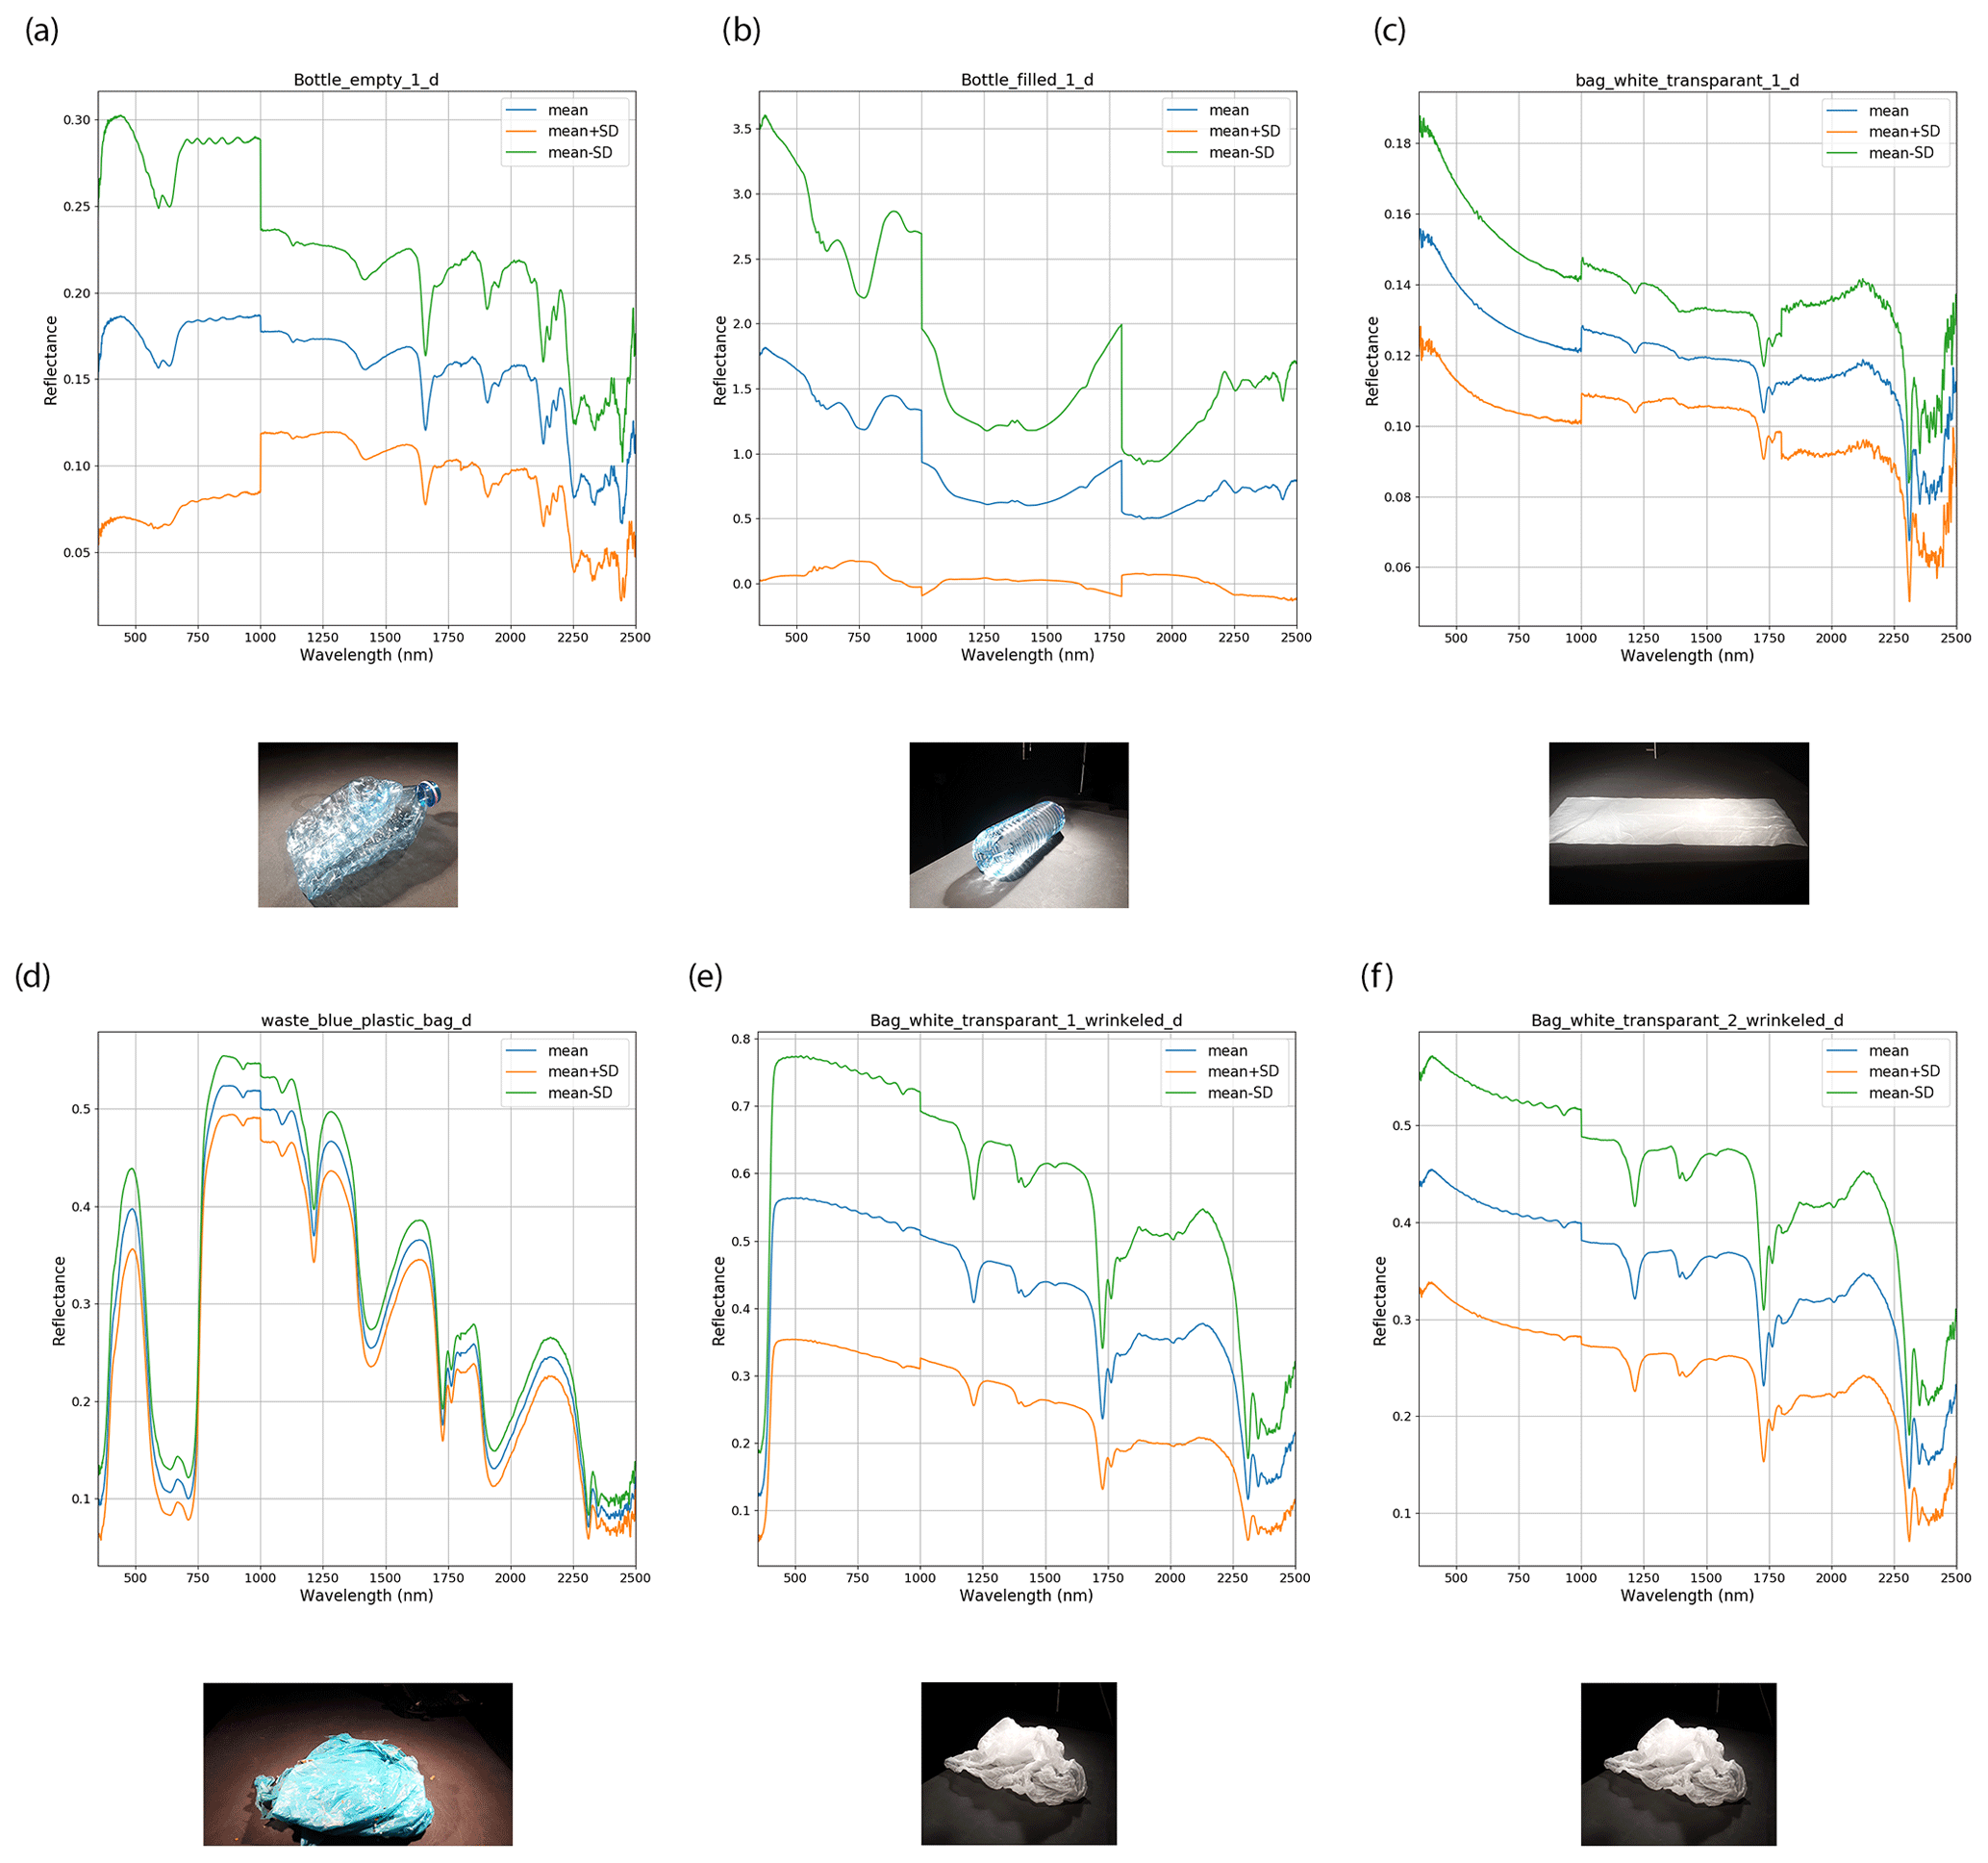
The spectral reflectance of plastic cups, bottles and bags was less uniform than the solid plastic samples shown earlier (ropes and place mats). Cups and bottles have different polymeric composition, HD-PE vs. PET, which is also reflected in the absorption features in the SWIR (Fig. 10). We observed variations in the magnitude and shape of reflectance of the cup, bag and bottle that were influenced by the condition of the items as wrinkled, crushed, straightened or containing a fluid (Fig. 11).

Figure 12Comparison of ASD and SEV with unbiased percentage difference (UPD) for the blue rope.
Figure 13Comparison of ASD and SEV with unbiased percentage difference (UPD) for the orange place mat.
4.3 Comparison of ASD and SEV
Figures 12 and 13 show the comparison of the spectral-reflectance measurements made with the ASD and SEV spectroradiometers in the tank. Figure 12 shows the results for the blue rope aligned along the frame, and Fig. 13 shows the results for the orange place mat. The plastic specimens were measured dry, wet and submerged at 2.5, 5, 9, 12, 16 and 32 cm without adding any sediments in the tank. The unbiased percentage difference (UPD) was calculated for the dry specimens. For the dry measurements, the datasets agree very well with the UPD mostly below 10 %. At short (< 400 nm) and long (< 2240 nm) wavelengths, larger differences can be observed due to the lower sensitivity of the instruments and noisy spectra. Small differences can also be explained by a slightly different position of the two instruments. Although mounted closely, the footprint of the two instruments on the water surface will be slightly different.
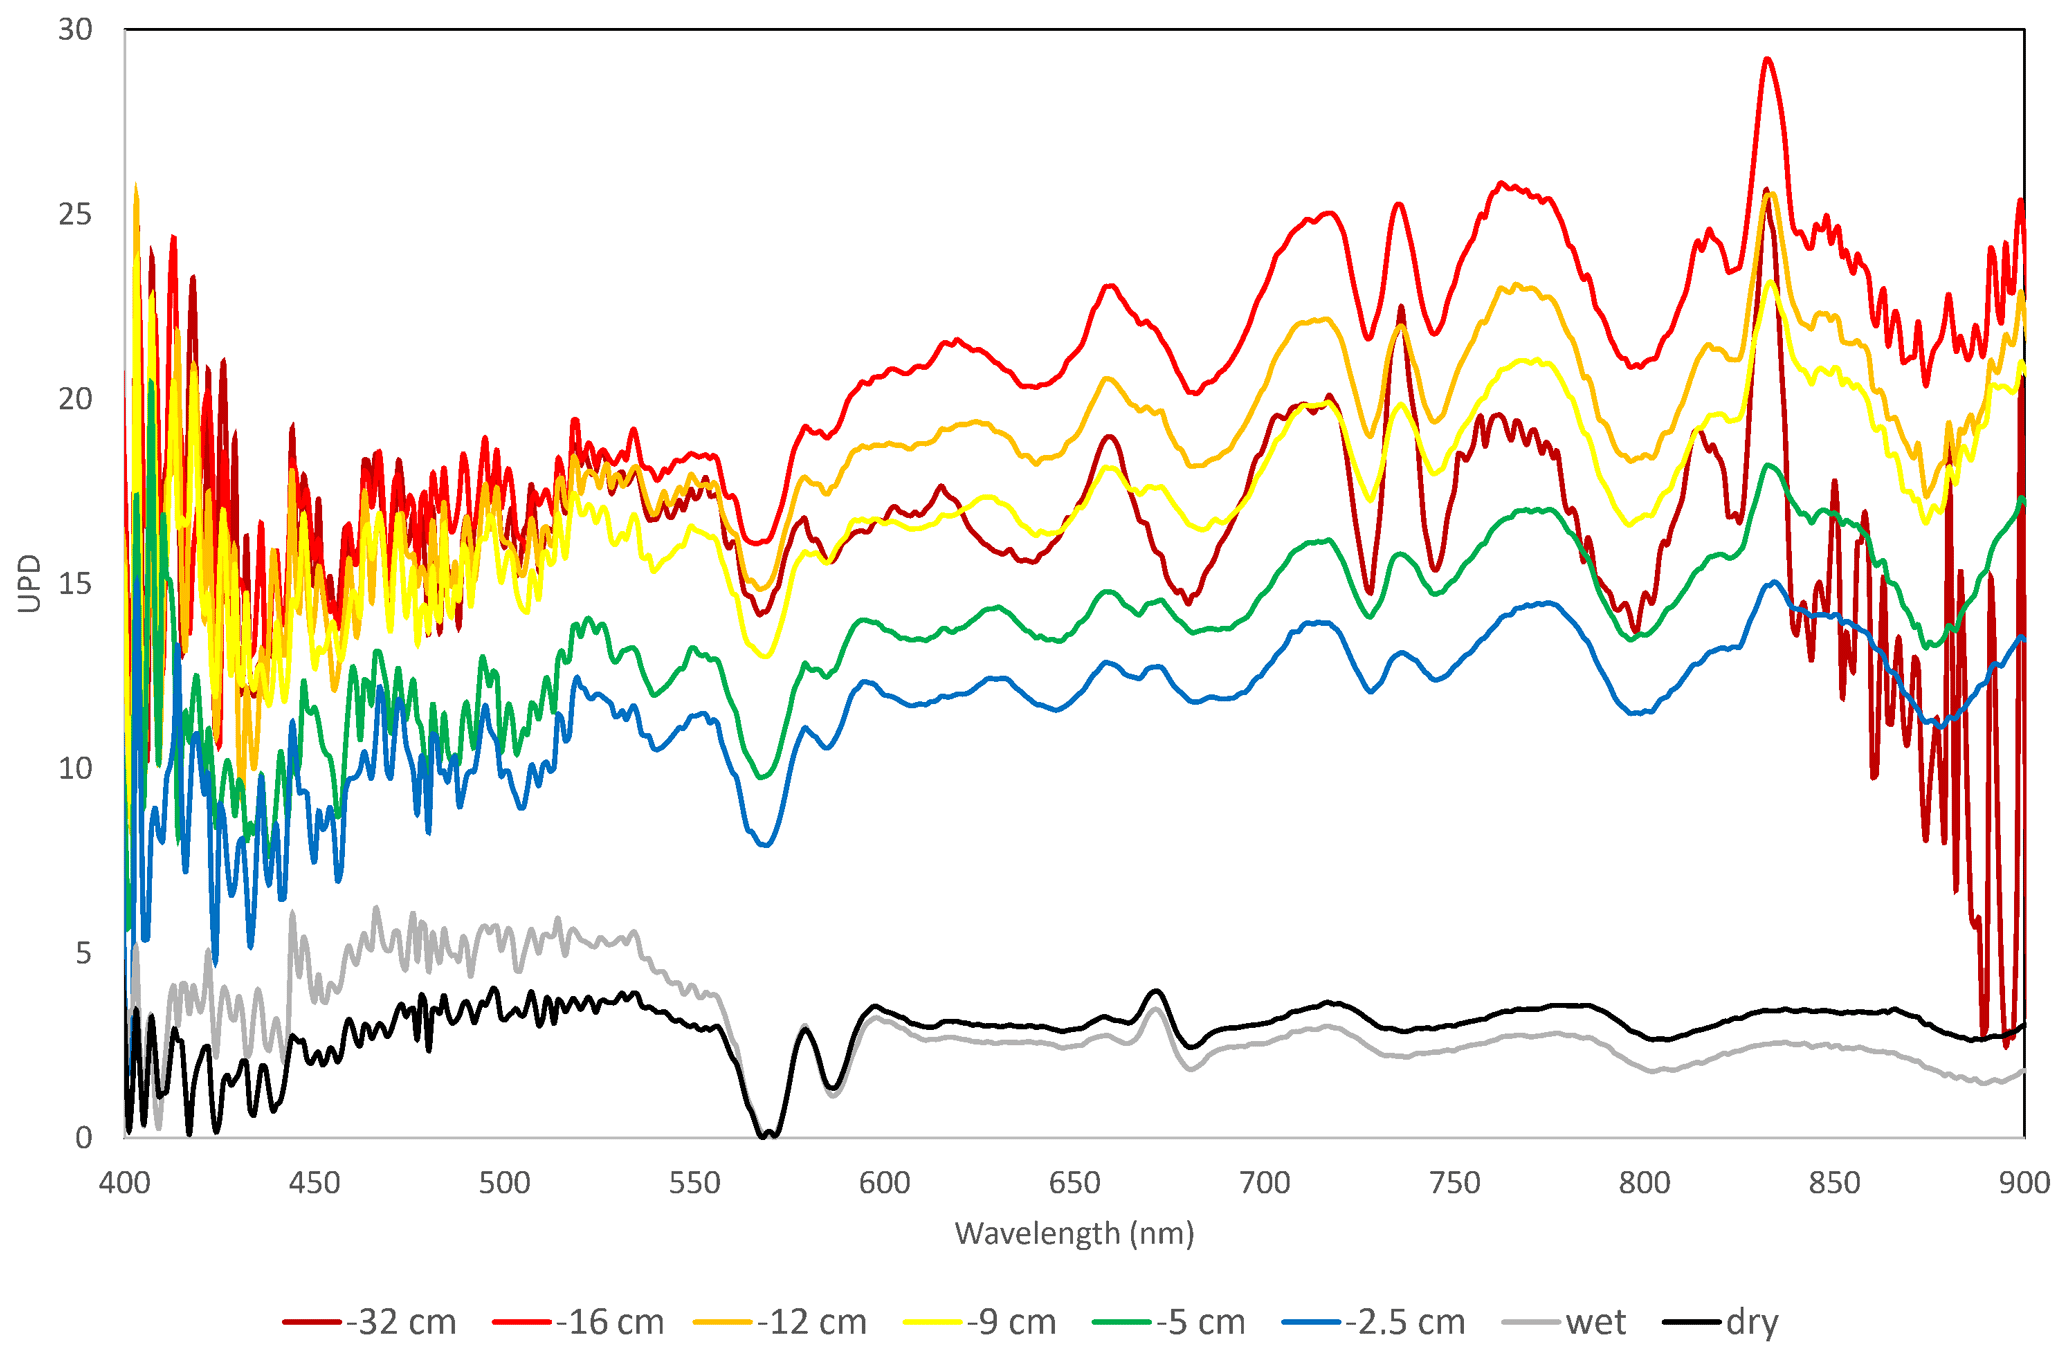
Figure 14Unbiased percentage difference (UPD) for the orange place mat, measured at different depths.
Figure 14 shows the UPD for the dry, wet and submerged orange place mat for wavelengths from 400 to 900 nm. The UPD is higher for the submerged plastic samples, and it generally increases with deeper submersion of the samples. Where the UPD for the dry plastic is below 5 % for this spectral range, the UPD for the plastic submerged at 16 cm lies between 15 % and 30 %. This can be explained by the footprint of the spectrometer, which will increase and will be slightly different for the two spectrometers as submersion depth increases.
All the datasets are available in a public data repository. ASD measurements are available at https://doi.org/10.4121/12896312.v2 (Knaeps et al., 2020); SEV measurements are available at https://doi.org/10.4121/uuid:9ee3be54-9132-415a-aaf2-c7fbf32d2199 (Garaba et al., 2020).
Remote-sensing images, collected either by satellites, drones or fixed cameras, have a great potential to provide a better view of the marine-plastic distribution and quantities. There is however a lack of knowledge of the optical properties of marine plastics in order to design appropriate detection algorithms and process these images into actionable maps for decision-making. This spectral-reflectance dataset contributes to a better understanding of the optical properties of marine-plastic litter and encourages scientists to use the dataset in developing remote sensing of marine-litter-relevant algorithms.
The results have shown that high-quality spectral-reflectance measurements were made in the VITO calibration facility and the tank at Flanders Hydraulics. The dataset includes a large variety of plastic specimens, measured in dry and wet conditions and submerged in the tank. Submerging of plastics was done in a controlled way. Only plastics which were flat and homogeneous were submerged in the tank, and their spectral reflectance was measured. Although these plastics are not found in the same way in nature, the results provide insights into the effect of water absorption and suspended sediments on the measured reflectance. It allows researchers to select the most appropriate wavelengths and prevent false detections. For instance, a turbid water plume can be easily misinterpreted for a brownish plastic sample. A deeper submersion of plastics might be misinterpreted as a decrease in the abundance of plastics.
The gathered dataset also shows the complexity of measuring plastics in a marine environment. Even more complexity is expected in an outdoor environment when surface features (glint, white caps) and changing light conditions come into play.
EK and SS designed the experiments. GS designed the construction on top of the tank. EK, JM, SS, GS and SPG performed the spectral measurements in the calibration facility and the tank. MM (ASD) and SPG (SEV) prepared the spectral-reflectance databases. DM performed the TSM measurements. EK prepared the manuscript with contributions from all co-authors.
The authors declare that they have no conflict of interest.
We would like to thank the Port of Antwerp for providing the plastic litter samples and Robin de Vries for supporting the SEV spectral measurements.
This project has received funding from the ATTRACT project funded by the EC (grant no. 777222). Shungudzemwoyo P. Garaba was supported by the Deutsche Forschungsgemeinschaft (grant no. 417276871) and Discovery Element of the European Space Agency's Basic Activities (ESA contract no. 4000132037/20/NL/GLC).
This paper was edited by David Carlson and reviewed by Konstantinos Topouzelis and two anonymous referees.
Analytical Spectral Devices: ASD Technical guide, Analytical Spectral Devices, Inc., Boulder, 1999.
Arthur, A. M., MacLellan, C. J., and Malthus, T.: The fields of view and directional response functions of two field spectroradiometers, IEEE T. Geosci. Remote, 50, 3892–3907, https://doi.org/10.1109/TGRS.2012.2185055, 2012.
Garaba, S. P. and Dierssen, H. M.: Hyperspectral ultraviolet to shortwave infrared characteristics of marine-harvested, washed-ashore and virgin plastics, Earth Syst. Sci. Data, 12, 77–86, https://doi.org/10.5194/essd-12-77-2020, 2020.
Garaba, S. P., de Vries, R., Knaeps, E., Mijnendonckx, J., and Sterckx, S.: Spectral reflectance measurements of dry and wet virgin plastics at varying water depth and water clarity from UV to SWIR (SEV-1), 4TU.Centre for Research Data, https://doi.org/10.4121/uuid:9ee3be54-9132-415a-aaf2-c7fbf32d2199, 2020.
Garaba, S. P., Arias, M., Corradi, P., Harmel, T., de Vries, R., and Lebreton, L.: Concentration, anisotropic and apparent colour effects on optical reflectance properties of virgin and ocean-harvested plastics, J. Hazard. Mater., 406, 124290, https://doi.org/10.1016/j.jhazmat.2020.124290, 2021.
Huth-Fehre, T., Feldhoff, R., Kantimm, T., Quick, L., Winter, F., Cammann, K., van den Broek, W., Wienke, D., Melssen, W., and Buydens, L.: NIR – Remote sensing and artificial neural networks for rapid identification of post consumer plastics, J. Mol. Struct., 348, 143–146, https://doi.org/10.1016/0022-2860(95)08609-Y, 1995.
Knaeps, E., Ruddick, K. G., Doxaran, D., Dogliotti, A. I., Nechad, B., Raymaekers, D., and Sterckx, S.: A SWIR based algorithm to retrieve total suspended matter in extremely turbid waters, Remote Sens. Environ., 168, 66–79, https://doi.org/10.1016/j.rse.2015.06.022, 2015.
Knaeps, E., Strackx, G., Meire, D., Sterckx, S., Mijnendonckx, J., and Moshtaghi, M.: Hyperspectral reflectance of marine plastics in the VIS to SWIR, 4TU.Centre for Research Data, https://doi.org/10.4121/12896312.v2, 2020.
Masoumi, H., Safavi, S. M., and Khani, Z.: Identification and classification of plastic resins using near infrared reflectance spectroscopy, Int. J. Mech. Ind. Eng., 6, 213–220, 2012.
The requested paper has a corresponding corrigendum published. Please read the corrigendum first before downloading the article.
- Article
(12479 KB) - Full-text XML